Article

Nanocrystallized Surface Effect on the Tribocorrosion Behavior of AISI 420

1
Laboratoire de Génie des Matériaux et Environnement, LGME, Ecole Nationale d’Ingénieurs de Sfax, ENIS, Université de Sfax, B.P., Sfax 1173-3038, Tunisia
2
Laboratoire de Génie des Procédés et Matériaux, LGPM, Ecole Centrale Paris, F-92290 Chatenay-Malabry, France
*
Author to whom correspondence should be addressed.
Lubricants 2022, 10(11), 304; https://doi.org/10.3390/lubricants10110304
Submission received: 6 October 2022 / Revised: 6 November 2022 / Accepted: 8 November 2022 / Published: 12 November 2022
(This article belongs to the Special Issue Assessment of Abrasive Wear)

Abstract

:
Nanopeening treatment was applied to the AISI 420 steel to decrease its sensitivity to tribocorrosion damage. The microstructural investigation highlighted that the nanopeening treatment led to high plastic deformation and a nanostructured surface layer with a 110 µm depth. In order to study the combined effect of corrosion and mechanical wear, tribocorrosion tests were performed on non-treated and nanopeened samples in boric acid and lithium hydroxide solutions, considering both continuous and intermittent sliding. It was found that the AISI 420 steel is sensitive to the synergy between mechanical friction and electrochemical corrosion with the dominance of abrasive wear. Adhesive wear was also detected in the wear track. Indeed, the mechanical wear was pronounced under intermittent sliding because of hard wear debris generation from the repassivated layer during rotating time. The nanopeening treatment led to enhanced mechanical performance and corrosion properties. Such improvement could be explained by the high plastic deformation resulting in the nano-structuration of grains and the increasing hardness of AISI 420 steel.

1. Introduction

Over the past seventy years, much research has been conducted in order to develop advanced materials and improve the system performance of the nuclear reactor. In the reactor pressure vessel, some components are sensitive to wear damage and degradation, which affect the efficient operation and safety of nuclear power plants. Materials degradation in fuel assemblies results from a complex process that is affected by various factors such as contacting materials, environmental conditions, and wear phenomena [1,2]. Heat is generated by the energy released by the fission products, which takes place in the fuel held and transferred to the primary coolant. The heat generation needs adjustment during the operational process, which is performed by the relative motions of the Rod Cluster Control Assemblies (RCCA) [3,4,5,6,7]. RCCA translation is conducted by control rod guidance assemblies and monitored by the control rod drive mechanism. In fact, stellite-covered latch arms allow the displacement of control rod drive shafts in latch housings [6,7]. The gripper latch arms (AISI 304L stainless steel) interact with the drive rod (AISI 410 martensitic stainless steel) in the reactor during each step of the process. The contact area between the gripper latch arms is protected by a cobalt-based hard-facing alloy (stellite grade 6). The repeated interactions between components are subject to the particular environment of a reactor containing boric acid and lithium hydroxide at high temperature and pressure [3,6]. Those operational conditions lead to a singular wear phenomenon that is critical for the lifetime of martensitic stainless steel. Four basic mechanisms of wear are identified in the contact between solids: abrasive [8,9,10,11], fatigue [12,13,14], adhesive [15,16], and corrosion [17,18]. Previous studies were mostly focused on the wear and corrosion behaviors acting separately on martensitic stainless steels [13,14,15,16,17,18,19,20,21,22,23,24,25,26]. The corrosion resistance of martensitic stainless steels depends on the oxide film. The oxide film was composed of iron (Fe), chromium (Cr), and nickel (Ni) oxides [13,27,28,29]. It spontaneously covered the stainless, and the presence of carbides promoted the generation of hard debris and abrasive wear [13].
Despite numerous studies, tribocorrosion was not well studied, although it had a pronounced effect on stainless steel alteration. It is a form of solid surface degradation that involves both corrosion and mechanical wear. The resulting material degradation process was completely different from that obtained when the corrosion and the mechanical wear mechanisms acted separately [30,31,32]. Stachowiak and Zwierycki [33] studied the tribocorrosion behavior of the AISI 420 martensitic stainless steel in sulfuric acid using a pin-on-plate tribometer. They found that the tribocorrosion response and the wear behavior depended on the steel properties, such as the hardness and the pace of repassivation. Esfandiari and Dong [34] studied the tribocorrosion response of plasma-nitrided 17-4PH stainless steel in a 3.5 wt% NaCl solution under sliding conditions. This treatment improved the tribocorrosion behavior by increasing corrosion–wear resistance and surface hardness. Lin et al. [35] investigated that the chromizing coating on the P110 steel had lower mass losses due to the higher surface hardness than the bulk steel under tribocorrosion conditions. However, the tribocorrosion behavior of martensitic stainless steel, which is used for nuclear reactor components, was not studied in previous research.
This work aims at studying the tribocorrosion of AISI 420 and the effect of the nanopeening surface treatment on the corrosion–wear behavior. An Electron Backscatter Diffraction (EBSD) was used to characterize the microstructure of the nanopeened layer and bulk material. Tribocorrosion experiments were performed in boric acid and lithium hydroxide solutions with a pin-on-disc tribometer. In situ techniques such as open circuit potential measurements and electrochemical impedance spectroscopy were performed. Tribocorrosion wear was qualitatively studied by means of a Scanning Electron Microscope (SEM) and a white light interferometer in order to characterize the wear track. Quantitative analysis was also carried out to determine the material loss.

2. Experimental Procedures

2.1. Nanopeening Treatment

Cylindrical samples of 10 mm in height and 30 mm in diameter were prepared from AISI 420 stainless steel bars. Samples were then mechanically polished to obtain a suitable surface for the nanopeening treatment performed by Winoa Company [36].
The nanopeening treatment is a severe plastic deformation technique. It leads to mechanically-induced nanometric grains in the surface layer by a blasting shot peening. It consists of a shot projection for a few minutes under carefully selected operating conditions (shot diameter [0.1 mm–2 mm], projected speed [40 m.s−1–100 m.s−1], incidence angle [10–45°], and recovery rate [1000–2000%] [37]).
The surface chemical composition of AISI 420 steel was obtained by optical emission spectroscopy and is summarized in Table 1. Two measurements on the non-treated and nanopeened samples were performed. Thereafter, the non-treated sample and the nanopeened sample are named, respectively, NT sample and NP sample. Table 1 shows a change in the element content of the NP sample, such as the decrease in C and the increase in Mn, Ni, and Mo.

2.2. Samples Characterization

For microstructure characterization, a longitudinal cut was achieved in the central part of the NP sample. To obtain a suitable surface quality for SEM examinations and EBSD measurements, the cross-section was prepared using the JEOL cross-section polisher with an argon ion beam (the voltage and the current of the ion beam were, respectively, of 4 kV and 60 µA). The cross-section polisher preparation can accentuate the channeling contrast among the different grains. It facilitates easy and straightforward EBSD pattern acquisition due to the minimal surface strain and distortion [38].
Figure 1 presents an SEM micrograph of the cross-section microstructure of the NP sample. It highlights the martensitic laths within the prior austenite grain (PAG) boundaries in the core of the sample (see Figure 1b). A deformation layer with a thickness of about 56 µm is distinguished on the top surface, which can be attributed to severe plastic deformation under those tool tips. In the deformation zone, the grain boundaries cannot be identified. Thus, the surface layer grains had been refined by nanopeening treatment. The perpendicular lines that transverse all the sections, as indicated by black arrows in Figure 1a, correspond to the rolling and forming process of the initial bars (cf. the rolling direction).
An EBSD map was also performed on the cross-section of the NP sample in order to characterize in detail the microstructural changes under the nanopeening treatment, from the top treated surface to the untreated core of the same sample. The EBSD map was carried out with an accelerating voltage of 15 kV at a working distance of 15 mm in a JEOL SEM equipped with an AZTEC EBSD system from Oxford Instruments. The acquisition step size was 0.3 µm, and the map size was 550 × 850 µm. The mean martensite grain size was quantified from the EBSD maps. The grain detection procedure proceeds in two steps and defines an upper and lower threshold angle [39]. The upper value was set here to 5° to identify the first network of grain boundaries. The lower angle was set to 1° in order to close the open lines by tracking the path between neighboring pixels, considering disorientation angles down to the lower bound. The average grain size measured by this method is given in Equivalent Circular Diameter (ECD) (The Equivalent Circular Diameter (ECD) of an object represents the diameter of a disc that occupies the same area as that object).
For tribocorrosion and micro-hardness tests, NT and NP samples were mechanically polished until obtaining a final surface roughness of about 0.11 µm. After sliding, the wear was quantified by profilometry measurements in four areas regularly spaced along the sliding track [36]. The wear track volume was determined by multiplying the area of the profiles by the wear track perimeter. SEM micrographs were also acquired in four areas of each sample to describe the mechanism of wear tracks.
Vickers micro-hardness tests were performed on the NT and NP samples using the LEICA M400-H1 micro-hardness instrument. The tests were conducted by applying 50 g for 10 s with a square-based pyramid indenter on the surface of the polished samples. For each sample, about 15 measurements were performed. For microstructure characterization, a longitudinal cut was achieved in the central part of the NP sample. To obtain a suitable surface quality for SEM examinations and EBSD measurements, the cross-section was prepared using the JEOL cross-section polisher with an argon ion beam (the voltage and the current of the ion beam were, respectively, of 4 kV and 60 µA). The cross-section polisher preparation can accentuate the channeling contrast among the different grains. It facilitates easy and straightforward EBSD pattern acquisition due to the minimal surface strain and distortion [38].

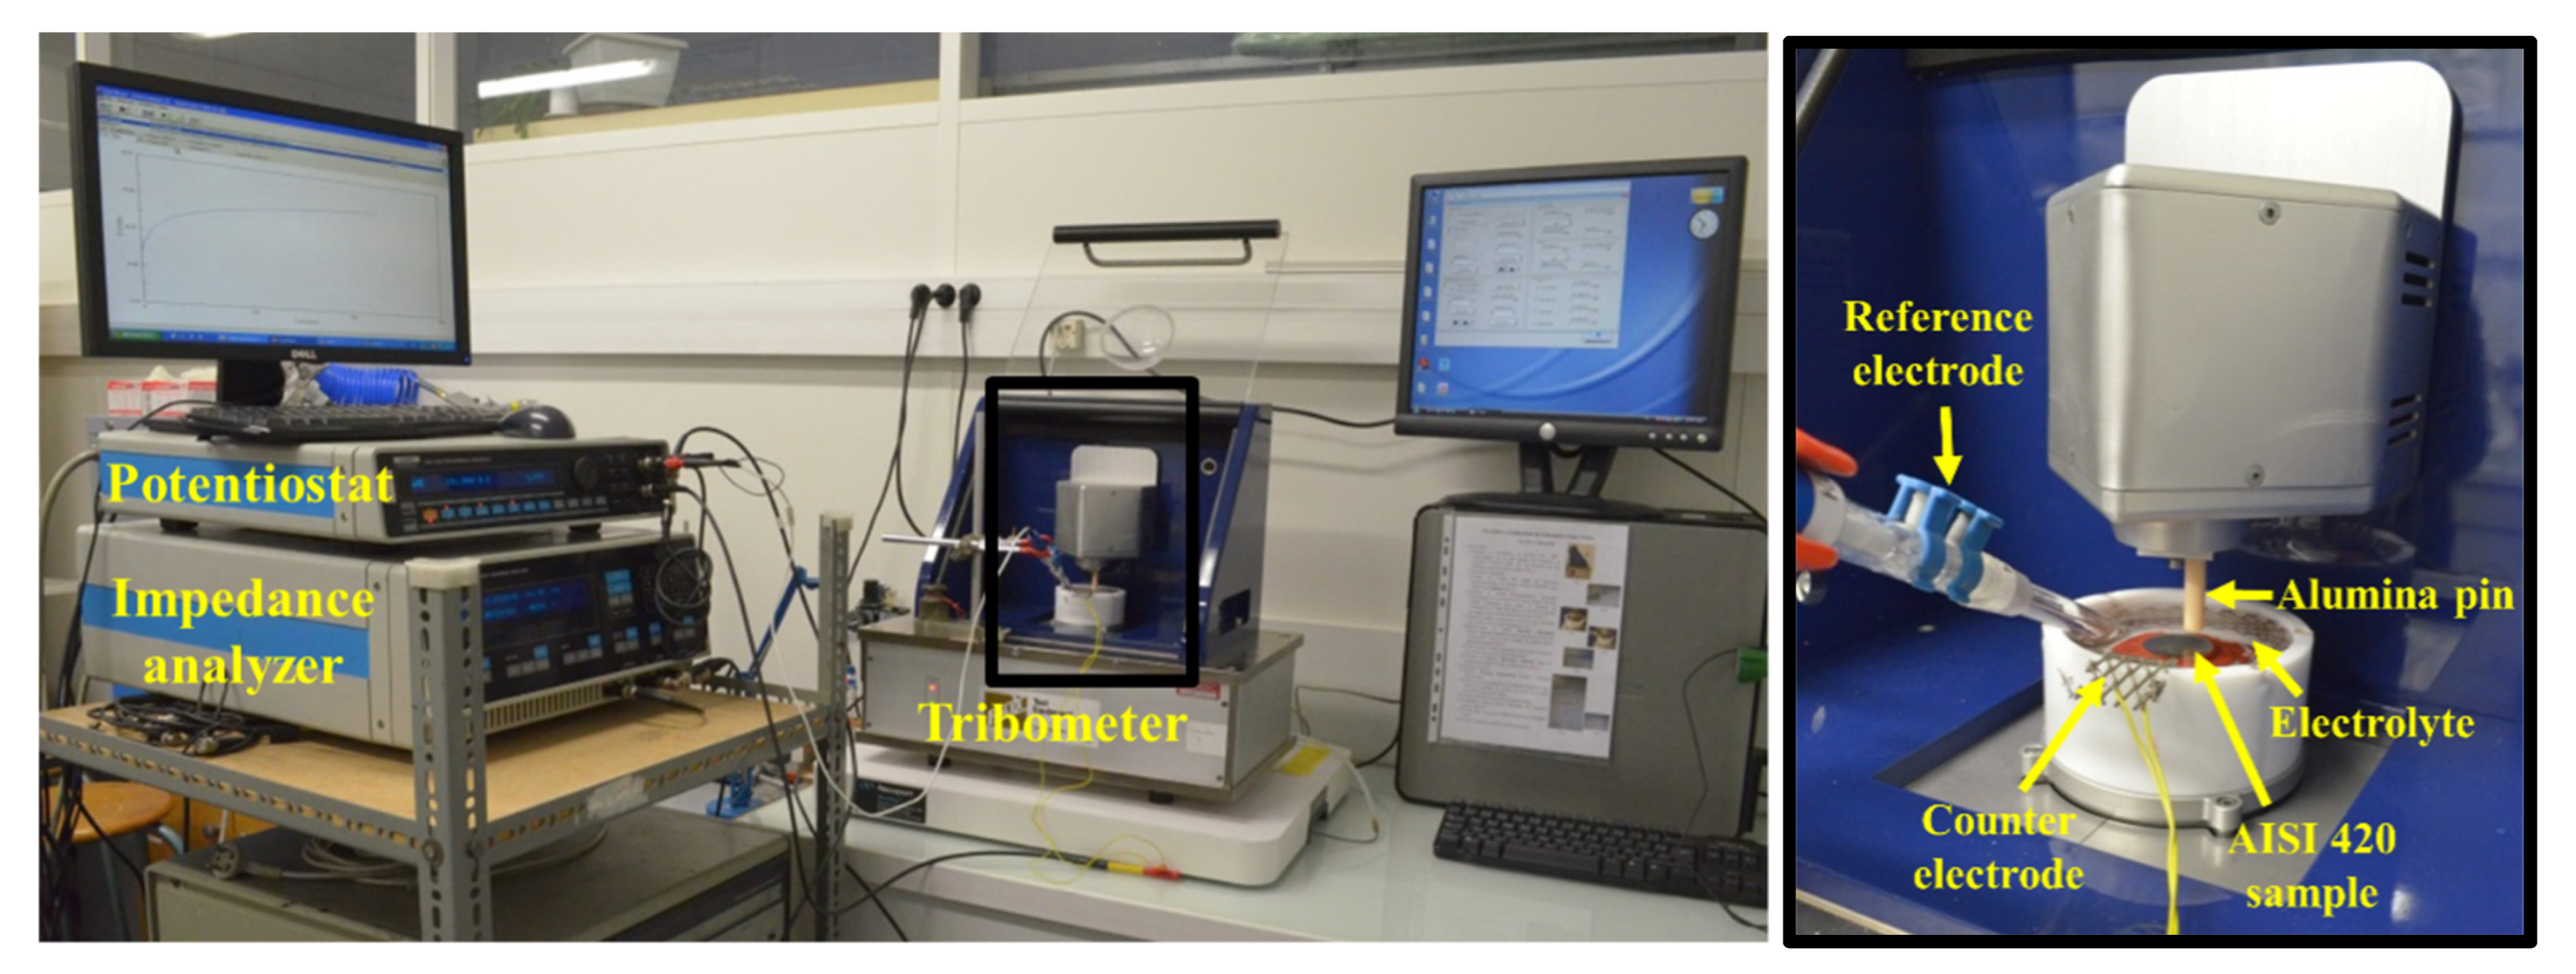
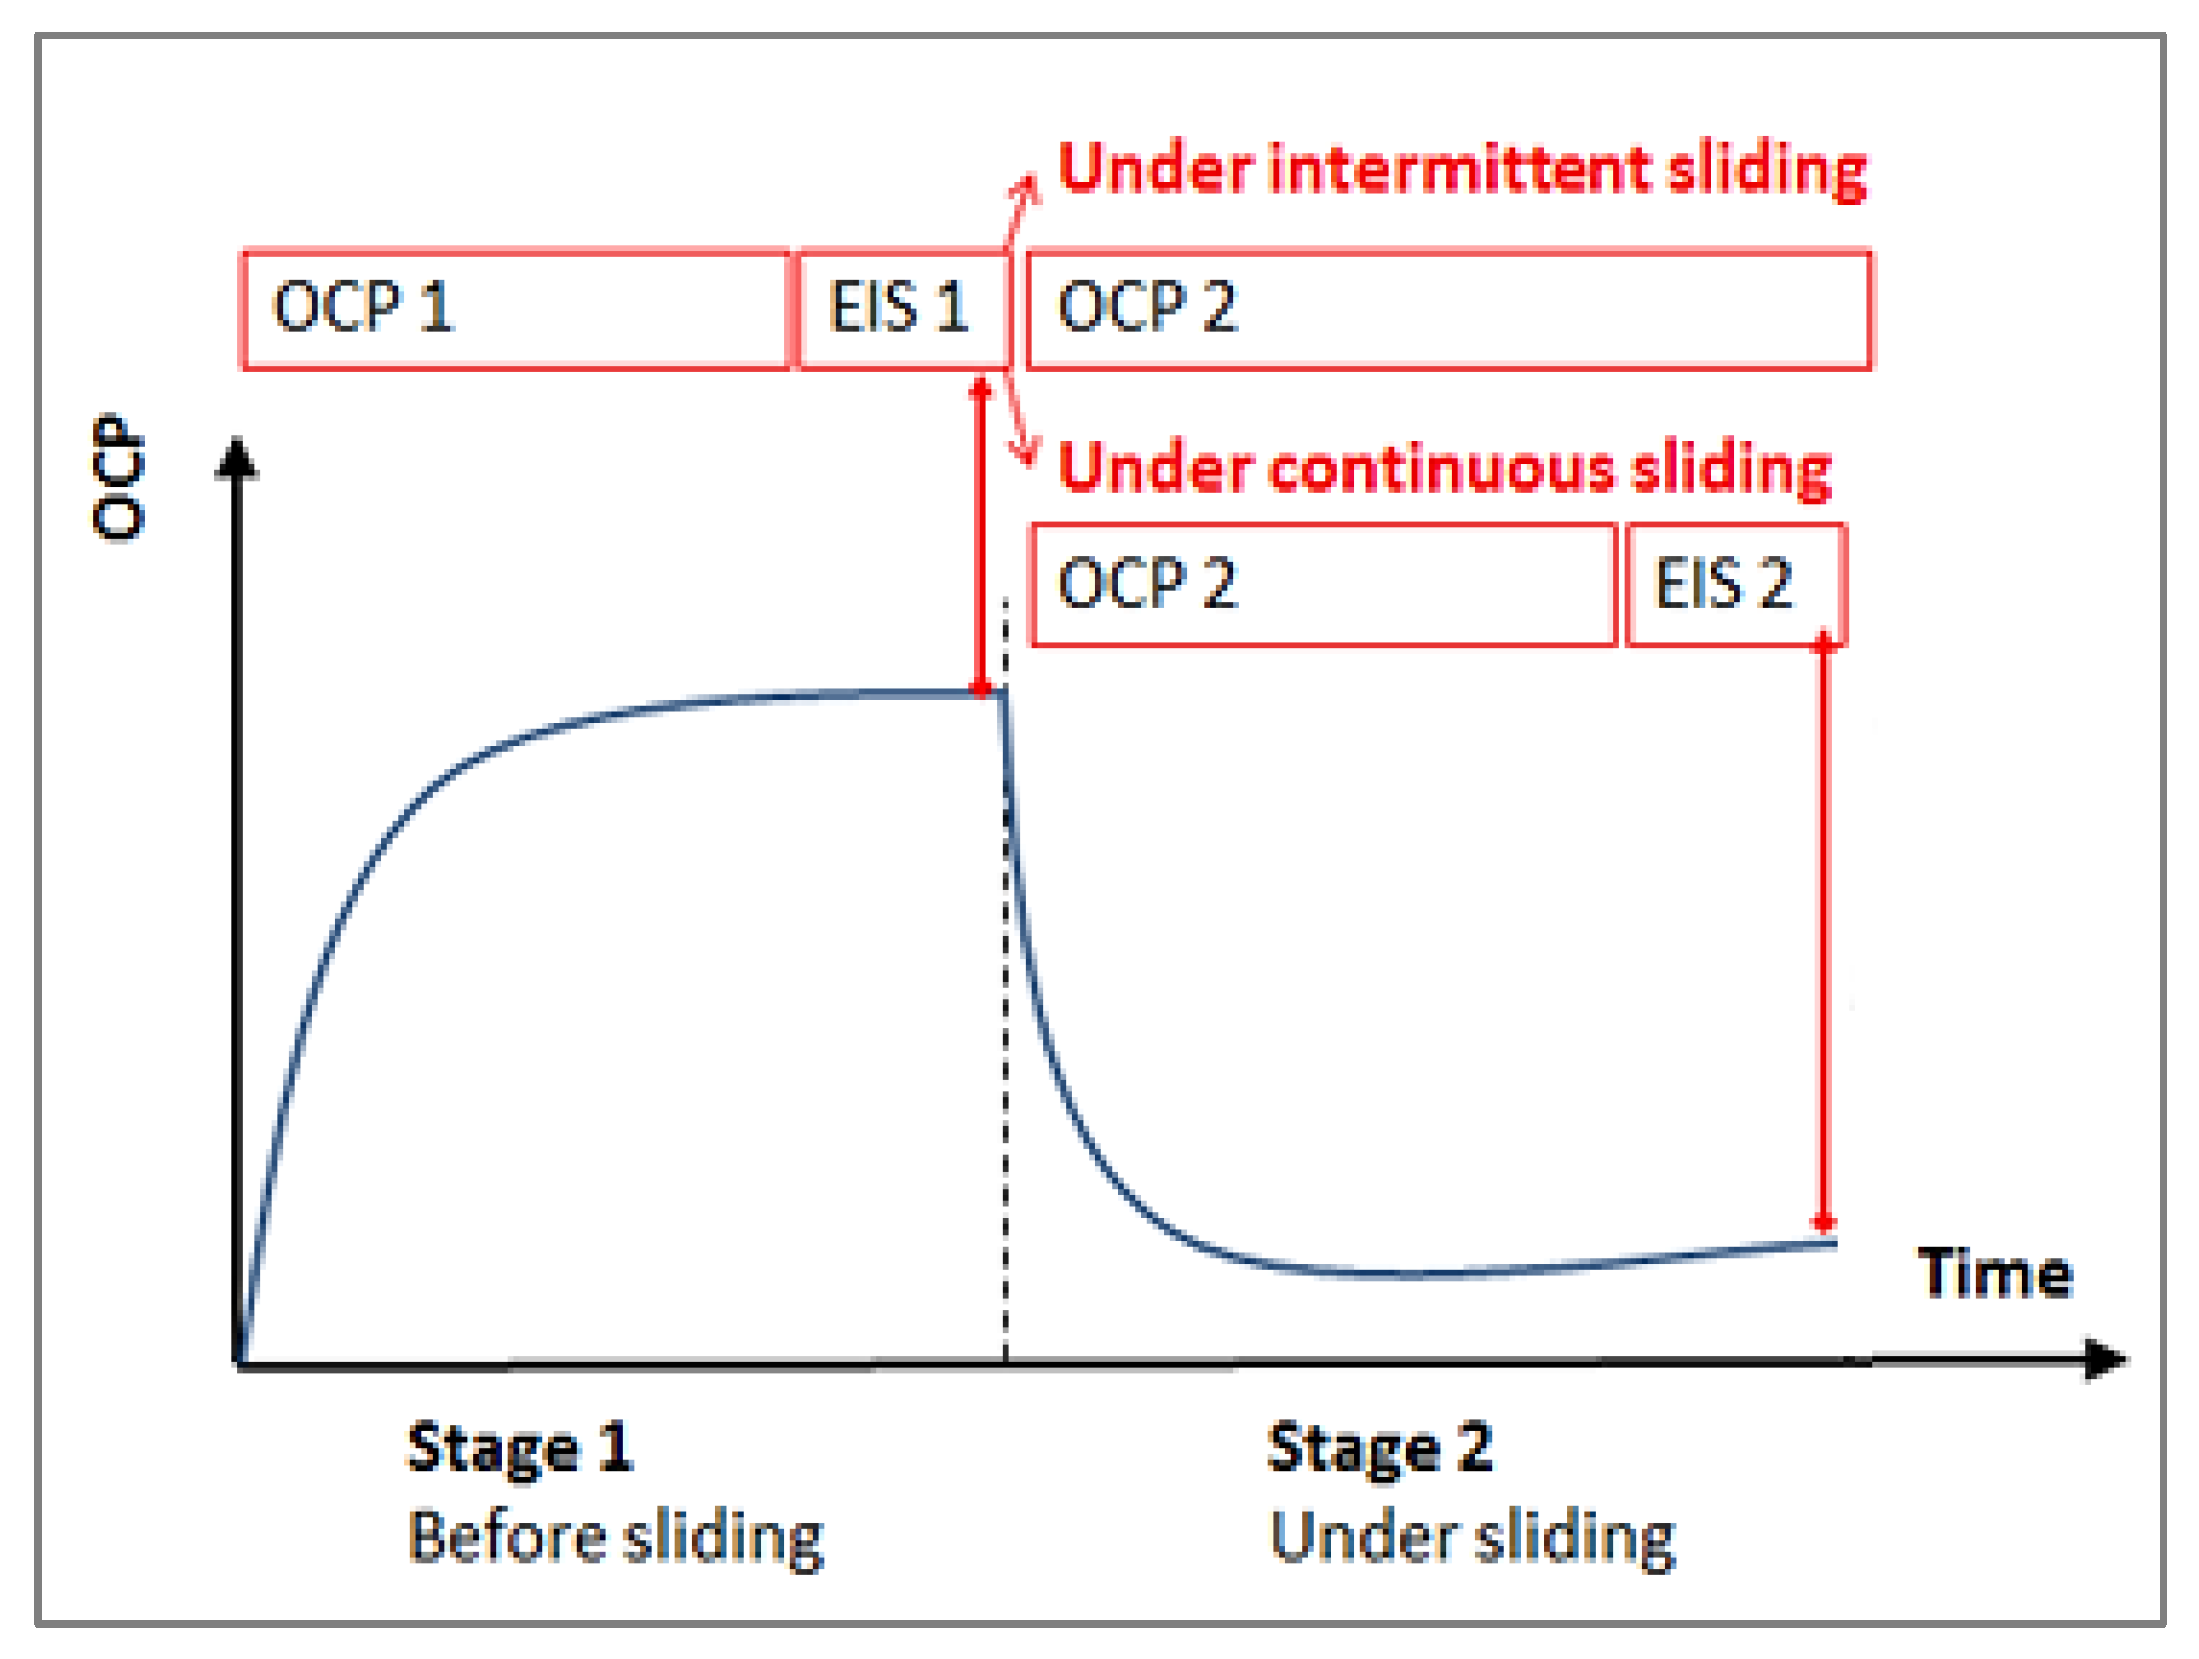
2.3. Tribocorrosion Test

The samples were subjected to tribocorrosion experiments, which were carried out using a pin-on-disc tribometer (FALEX TRIBOLOGY) equipped with an electrochemical cell (Figure 2). For the electrochemical and tribocorrosion experiments, the electrolyte was an aqueous solution of boric acid and lithium hydroxide containing 1000 ppm of boron and 130 ppm of lithium with a pH of 8.3. The average pH value of the prepared solution was about 8.3. This solution composition was similar to that of the primary environment of a nuclear power plant. All experimental tests were carried out at ambient pressure and temperature.
For the corrosion test, three-electrode cells were used in this study. The cell was connected to a potentiostat (solartron 1287) and a frequency response analyzer (solartron 1250). The working electrode corresponded to NT or NP AISI 420 samples, which were coated with resin to obtain a working area of 4.52 cm2. A platinum–titanium grid electrode was used as the counter electrode and placed against the internal side wall of the cell. The reference electrode was silver/silver chloride in a 3 M KCl solution (Ag/AgCl/KCl3M), which was characterized by EAg-AgCl = +0.200 V/Standard Hydrogen Electrode. The corrosion test corresponded to stage 1 (i.e., before sliding) of the tribocorrosion protocol, as shown in Figure 3. During this stage, the samples were immersed in the solution, and the Open Circuit Potential (OCP1) as a time function was measured for 3 h in order to reach a stable potential. Next, the Electrochemical Impedance Measurements (EIS1) were performed to characterize the corrosion behavior without sliding. The EIS1 was measured with a frequency range of 1 mHz to 10 KHz and an amplitude of 20 mV.
The tribocorrosion test was performed during stage 2 (i.e., under sliding; cf. Figure 3) of the experimental protocol. An alumina pin with a diameter of 7 mm and a spherical tip with a radius of 100 mm was selected to be the counter body for tribological tests. A normal force and rotation speed of respectively 5 N and 120 rpm were applied on the pin to have a wear track diameter of about 10 mm. The normal force corresponded to an average Hertzien pressure of 84 MPa. Sliding tests were performed either continuously or intermittently for the tribocorrosion tests. The sliding tests were conducted for 5000 cycles with a sliding distance of 157 m. In the continuous sliding, the pin was animated by a permanent rotation (i.e., the stop time tstop = 0 s). In the intermittent sliding, the pin rotated for 0.5 s first and then was kept immobile for another 20 s in order to evaluate the combined effect of corrosion and mechanical wear. The latency of one cycle is the delay separating two successive contacts, so that tlat = trot + tstop. During stage 2, the alumina pin was loaded on the sample surface, and the sliding test was monitored by the OCP2 and EIS2 measurements. EIS2 measurements were acquired over a frequency range of 10 mHz and 10 KHz, applied with a sinusoidal voltage signal of 20 mV. For both corrosion and tribocorrosion experiments, tests are repeated three times and averaged in order to obtain statistically valid results.
The wear was quantified using white light interferometer measurements in three areas regularly positioned along the wear track. The total wear volume was determined by multiplying the area of the profiles by the sliding track perimeter. Finally, an optical microscope and SEM were used to analyze the wear tracks.

3. Results and Discussions

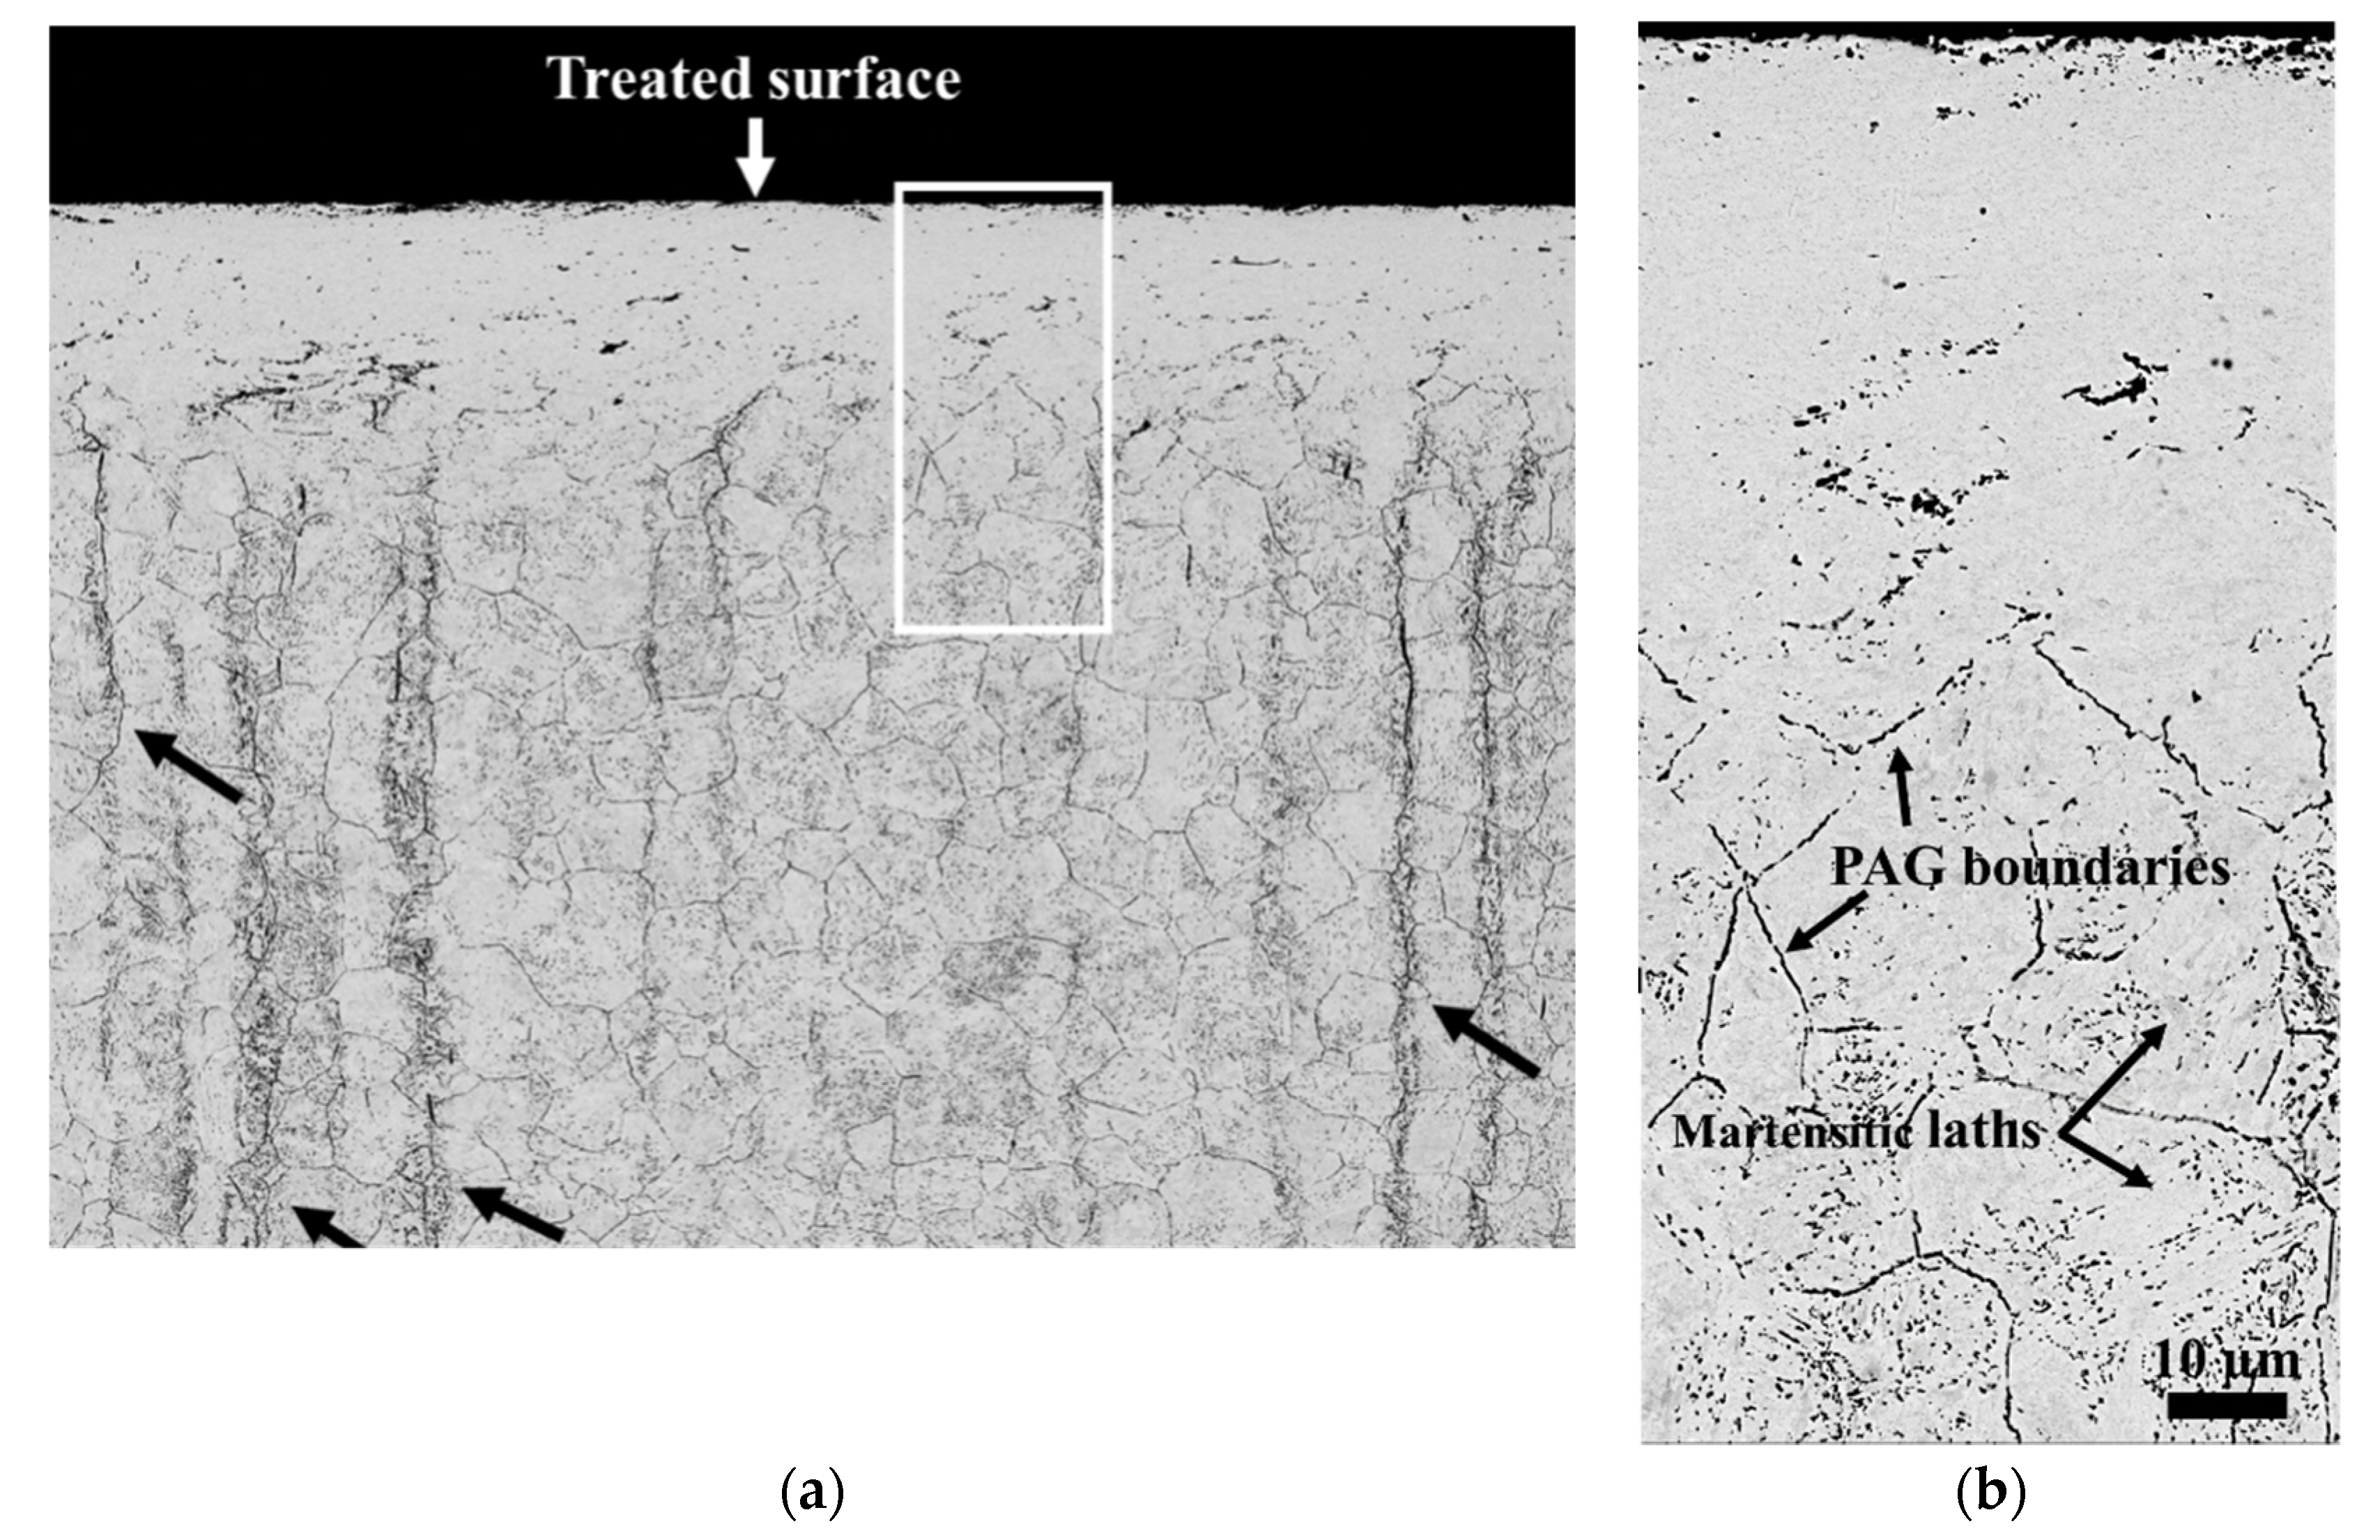
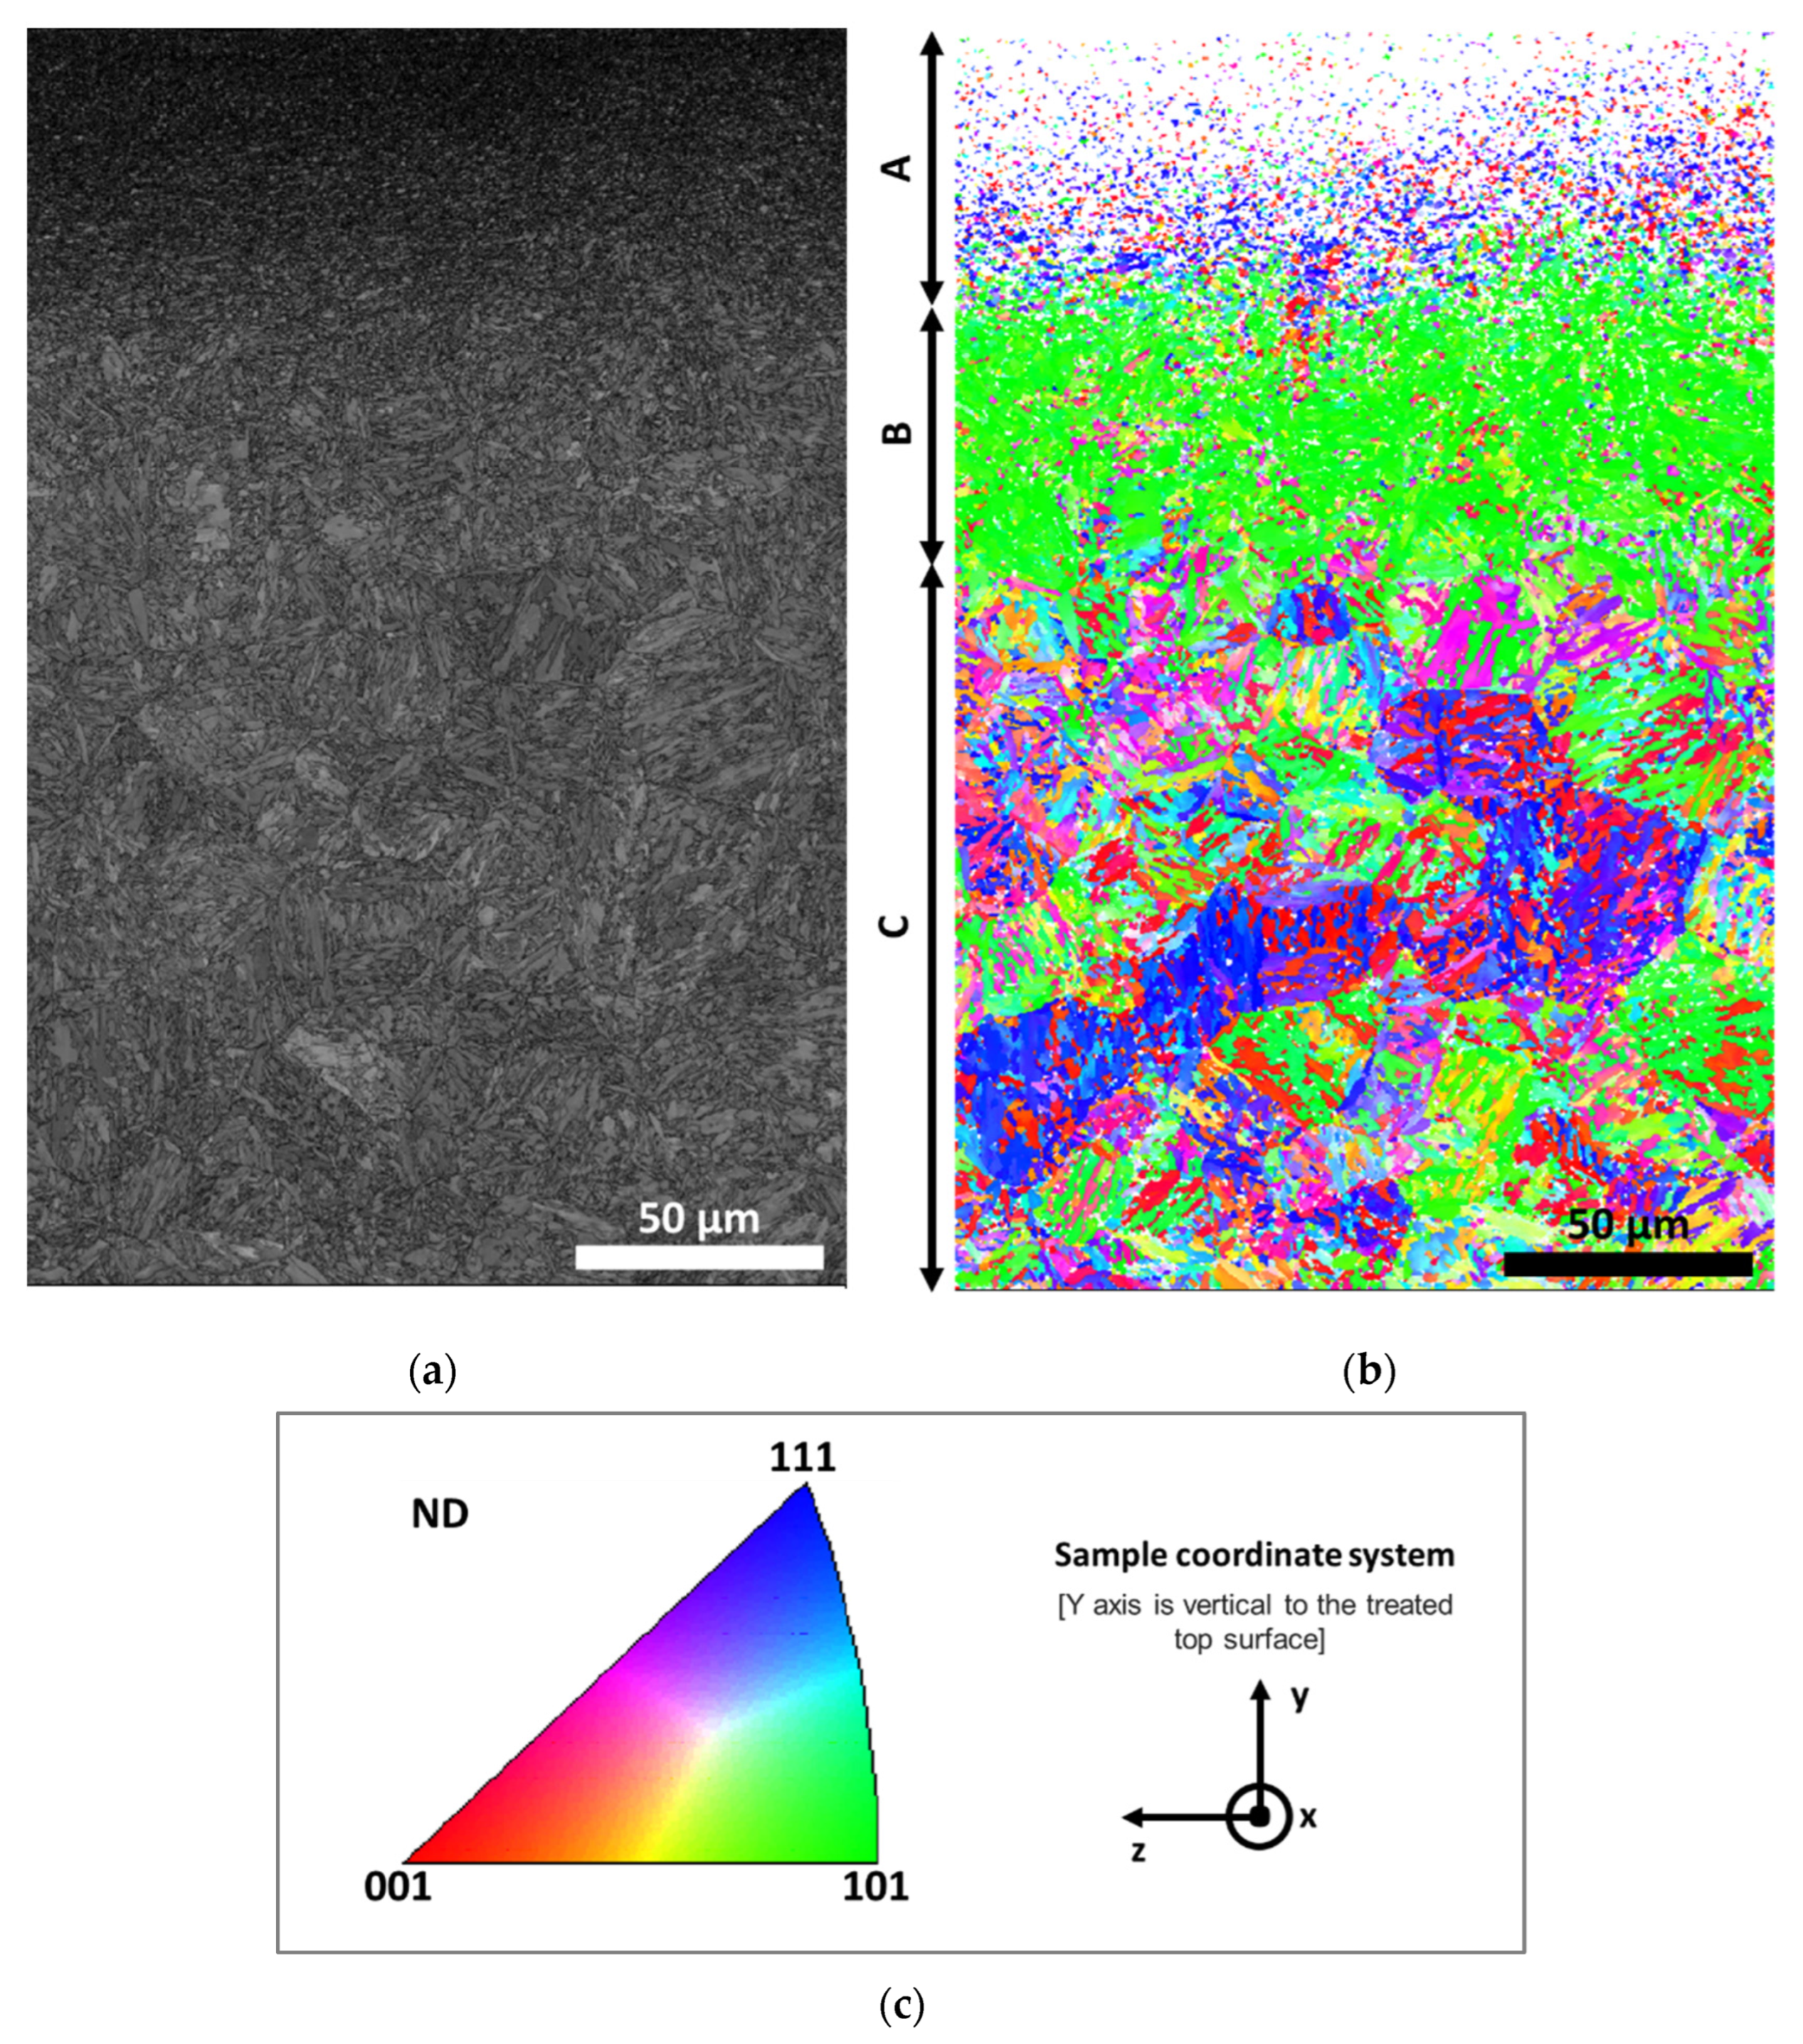
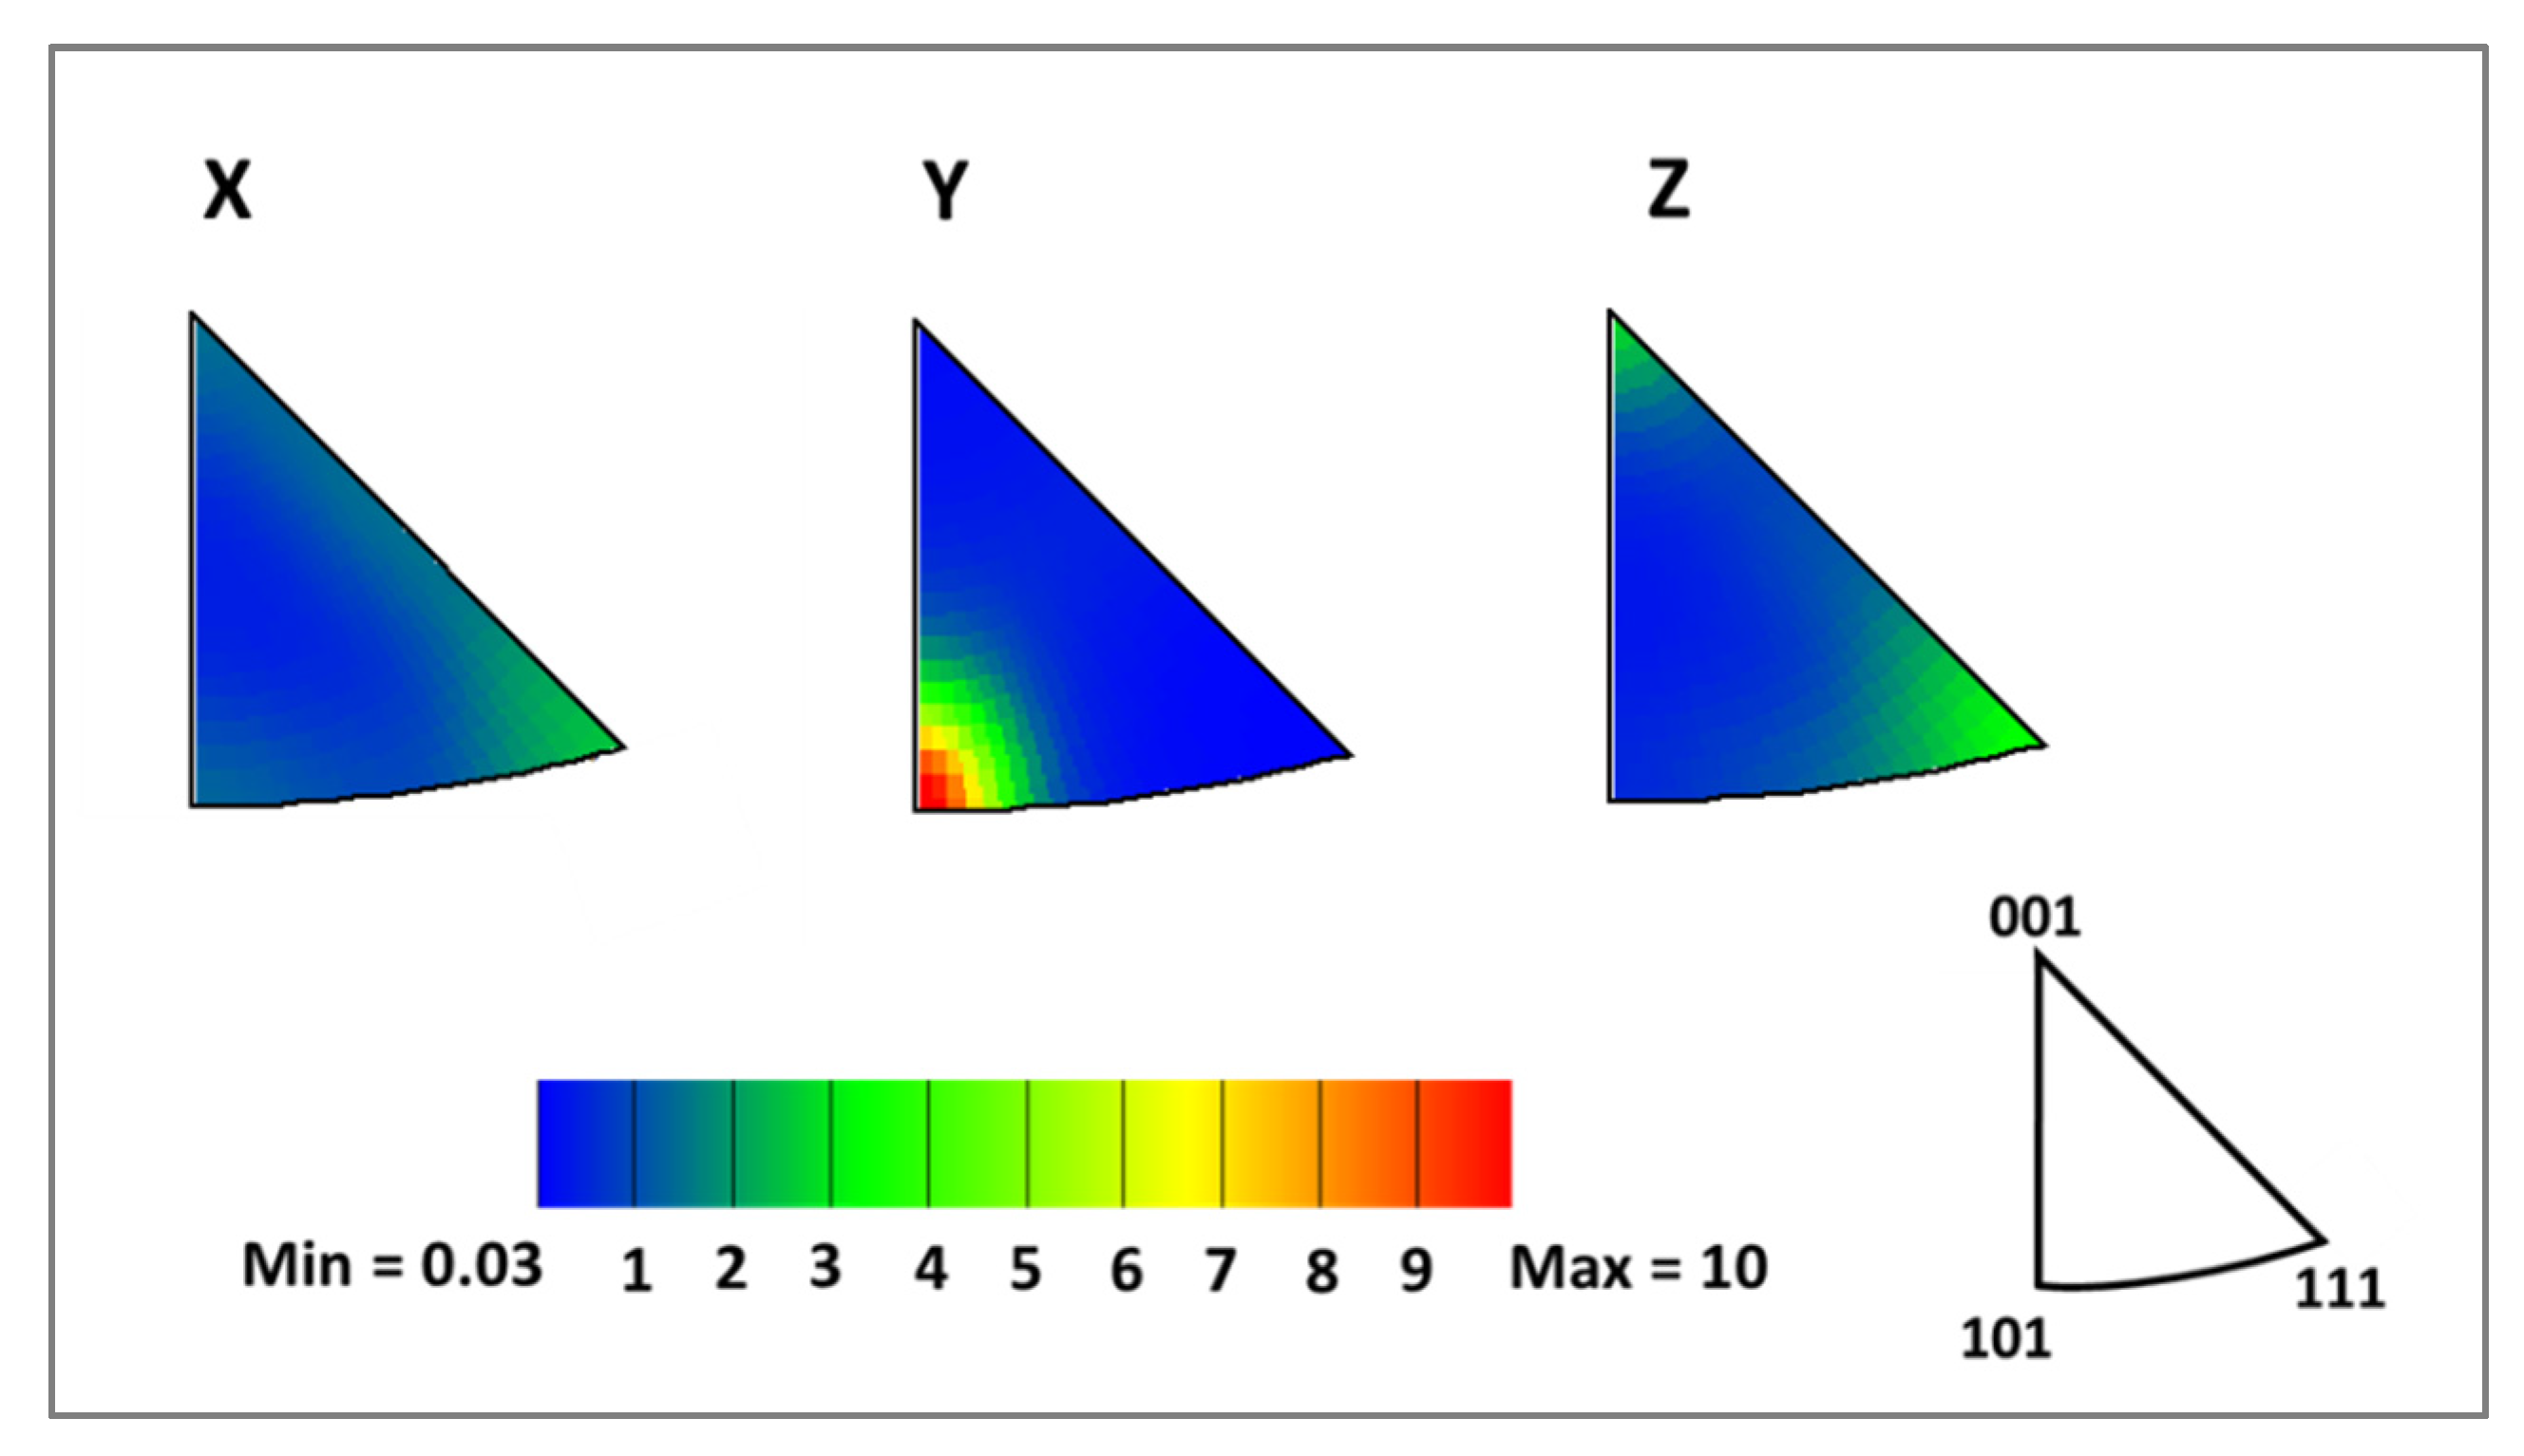
3.1. Microstructure Analyses

The EBSD examination on the cross-section, as shown in Figure 4, reveals the depth-dependent gradient microstructures of the deformed layers on the NP sample. The features of plastic deformation can be traced to a depth of about 110 µm, in which two different zones can be clearly identified: Zones A and B. Zone A extends over 56 μm from the top surface. The detailed microstructure of this zone, such as the grain boundaries, could not be distinguished in either the SEM micrographs (Figure 1) or the EBSD map (Figure 4). This may be related to severe plastic deformation and, consequently, to work hardening at the surface induced by the nanostructuration treatment. The average micro-hardness values obtained on NT and NP samples were 260 HV0.05 and 550 HV0.05, respectively. Thus, the surface hardness of the martensitic stainless steel was improved by 1.3 times more than that of the untreated steel, which can be attributed to grain refinement, deformation-induced α-martensite transformation, and work-hardening in the surface. Similar microstructure results have also been reported in the literature for AISI 316L and AISI 304 stainless steels undergoing similar nanostructuring treatments [40,41].
Zone B is extended from 56 µm to 110 µm below the surface. Numerous small martensitic laths become visible (see Figure 4a). The prior austenite grain boundaries are still embedded in the distorted martensite grains but can be hardly identified. In this transitional zone, the martensitic laths have a mean size of 1.09 µm, an aspect ratio of 1.9, and a width of about 573 nm. In Figure 4b, the colors represent the crystallographic orientation normal to the observed planes in the cross-section of the NP sample, which is indicated in the stereographic triangle shown in Figure 4c. As Figure 4b suggests, most of the martensite grains in zone B have their crystallographic axes <101> parallel to the Y direction. A clear crystallographic texture in zone B is recognizable, as shown by the Inverse Pole Figure (IPF) charts in Figure 5. These IPFs were obtained from the EBSD map presented in Figure 4.
Zone C corresponds to the bulk material. Its microstructure remains close to that of the non-treated material and reveals equiaxed PAG with a mean size of about 25 µm, and an aspect ratio of 3. Inside the PAG, the martensitic laths are oriented at a combination of different crystallographic planes such as {001}, {101}, and {111}. No preferred grain orientations were identified in this zone. The martensitic laths are larger compared to those identified in zone B, the width of which is about 710 nm, and the average grain size is 1.53 µm with an aspect ratio of 1.9.
The average micro-hardness values obtained from the NT and NP samples were 260 HV0.05 and 550 HV0.05, respectively. Thus, the surface hardness of the martensitic stainless steel improved by 1.3 times more than that of the untreated steel, which can be ascribed to high plastic deformation resulting in the nanostructuration of grains.

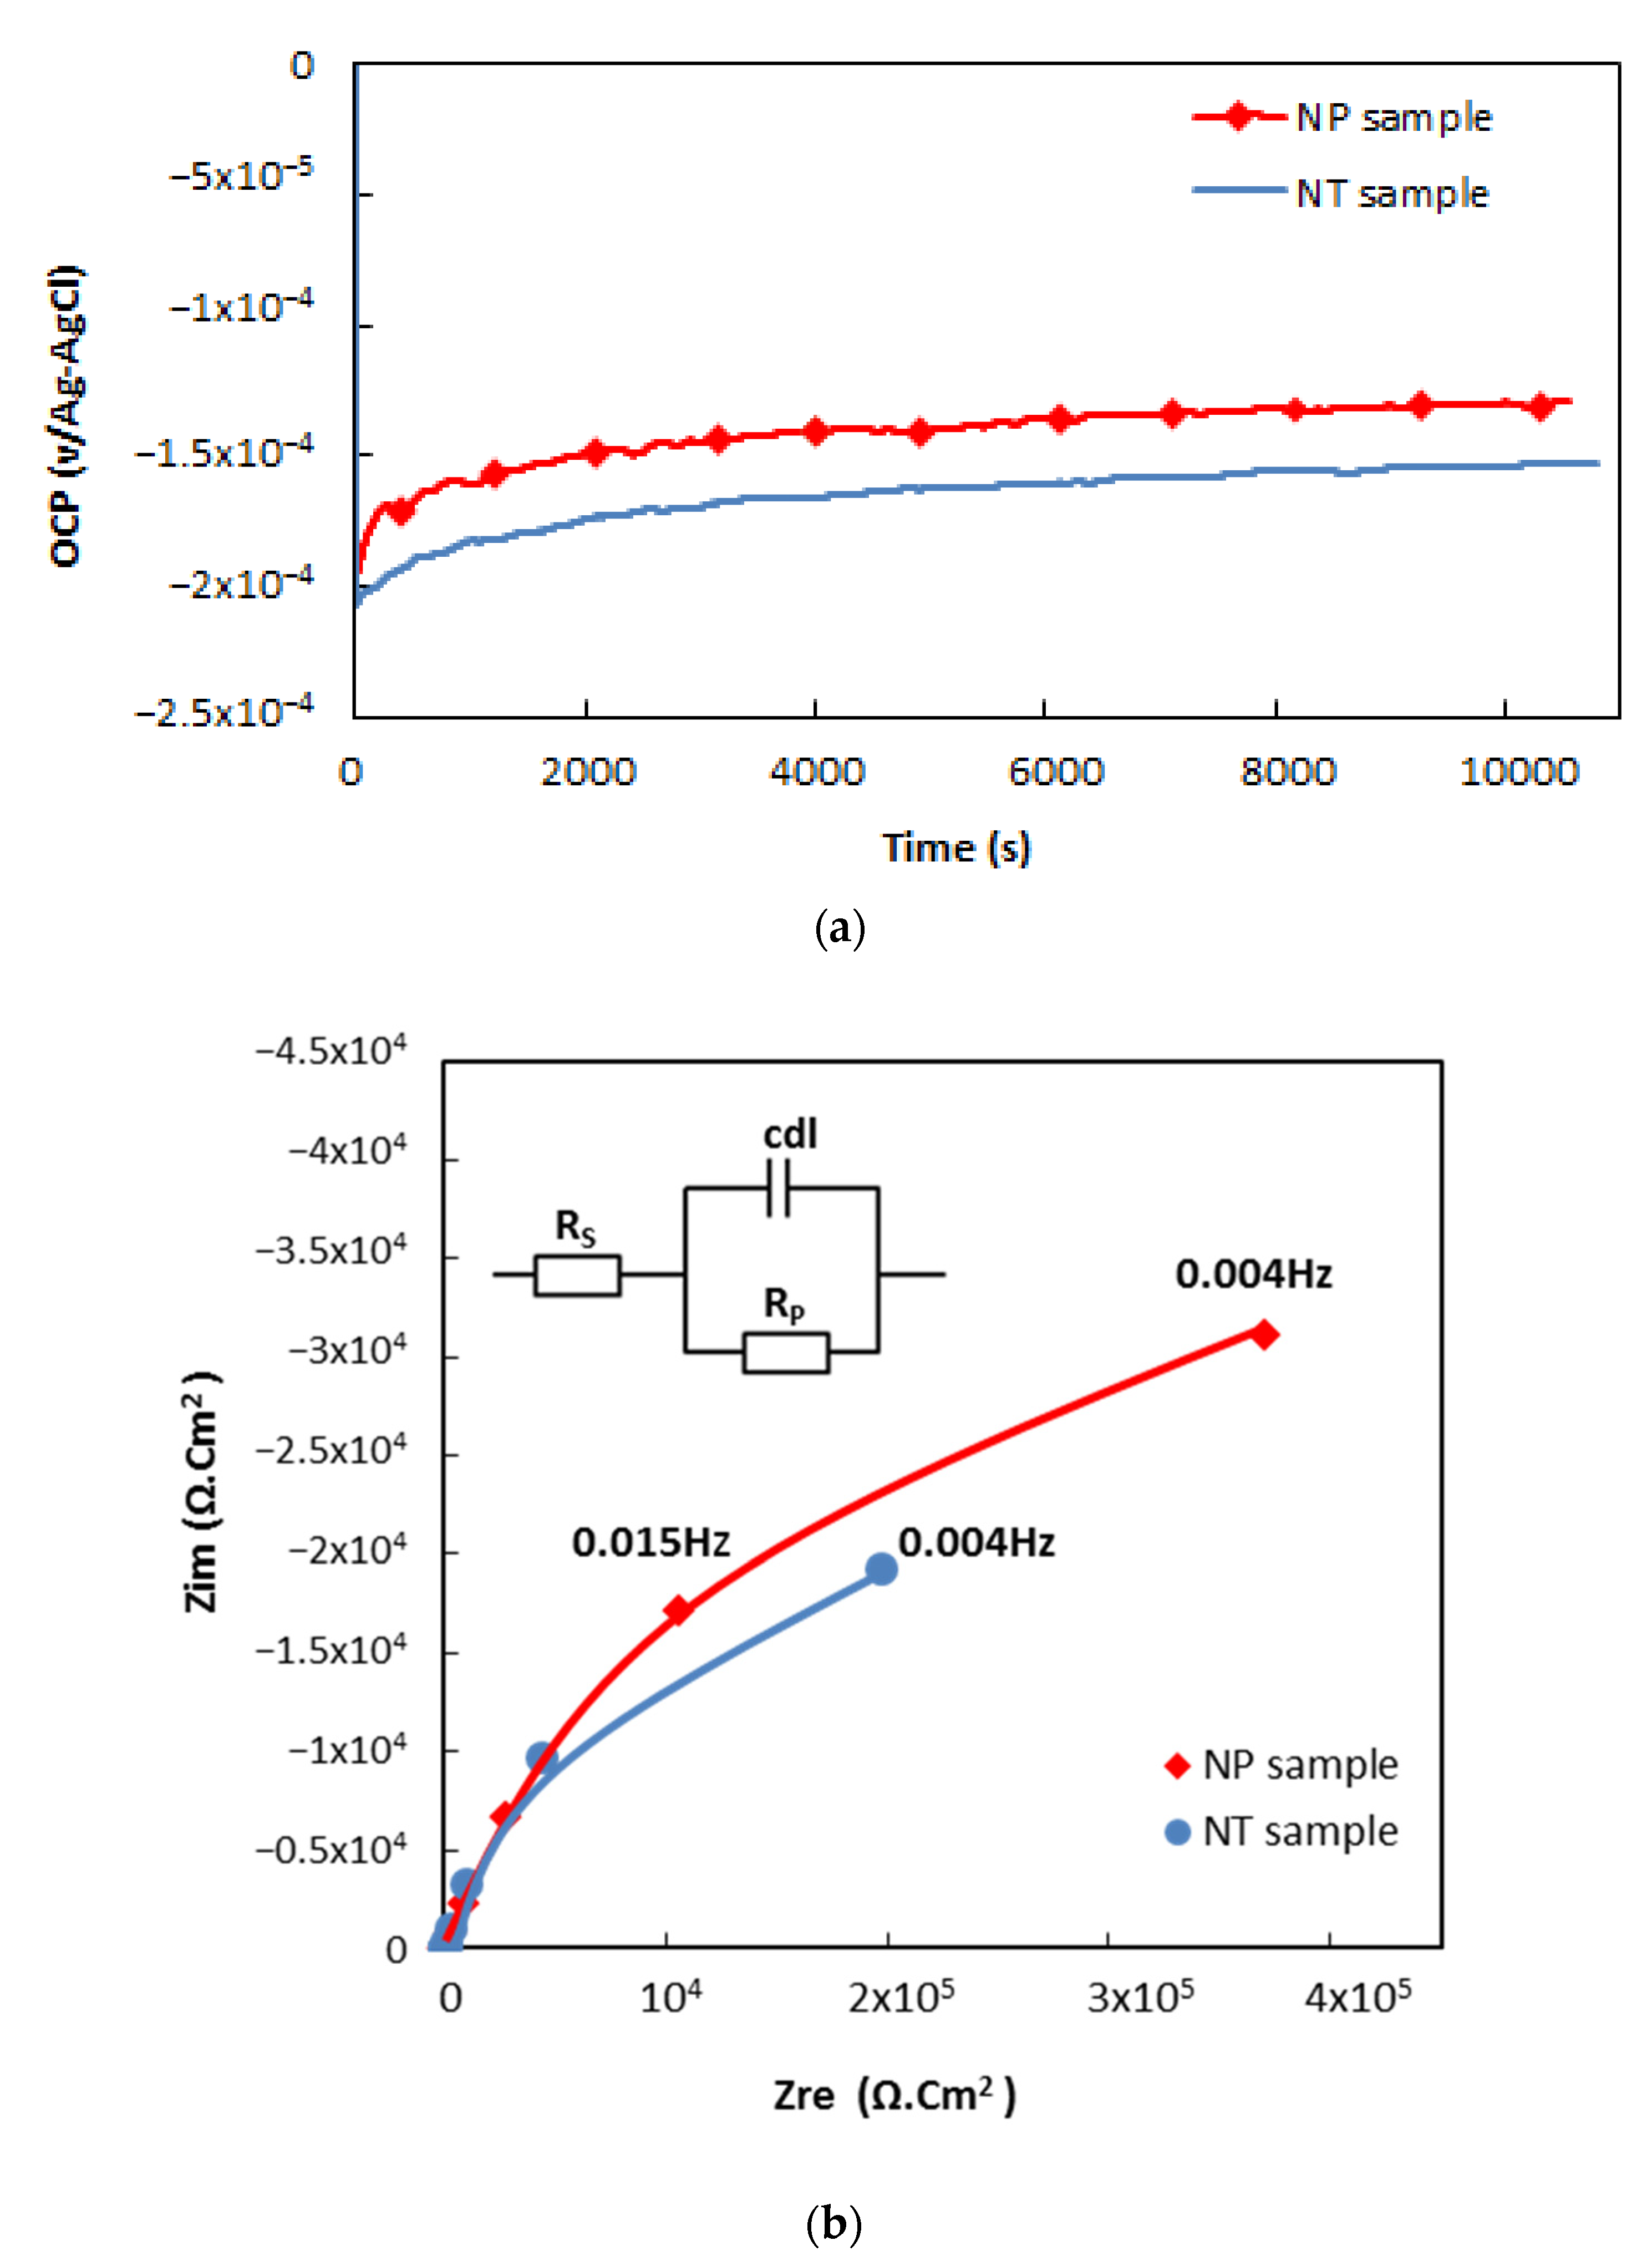
3.2. Corrosion Tests

The corrosion behavior was investigated using the open circuit potential measurement (OCP1). The OCP1 evolution as a function of time during the first hour of immersion of NT and NP samples in boric acid and lithium hydroxide solutions is presented in Figure 6a. For all samples, the OCP1 increases and then stabilizes, suggesting a stable electrochemical state at the surface due to the formation of natural passive films. This figure shows that the NP sample exhibits better behavior than the NT one. In fact, the OCP1 of the NP sample is stabilized at a higher potential (−0.13 v/Ag-AgCl) compared to the NT sample (−0.15 v/Ag-AgCl). In addition, the necessary time to form an initial passive layer is 2000 s and 1400 s for NT and NP samples, respectively. These values indicate that the recovery rate of the surface by the protective film on the NP sample is 1.4 times faster than on the NT one. This is related to the significant increase in Cr, Mo, and Ni contents of the NP martensitic stainless steel (Table 1). They increased by 20%, 97%, and 98%, respectively, due to the nanopeening treatment. Indeed, the increase in Cr, Ni, and Mo contents increases the repassivation rate of the oxide film and corrosion resistance [42,43]. In fact, Mo incorporated into the surface layer may accelerate the formation of the passive film. It may improve depassivation resistance due to the different oxidation states: Mo+4 and M6+. The oxides of Mo+6 in the passive film reduce Cl ion penetration. The presence of Ni stabilizes the passive film because it may decrease the dissolution rates of Fe and Cr.
The corrosion resistances of NT and NP samples were further evaluated through electrochemical impedance spectra measurements (EIS1) when a stable potential (OCP1) was reached. Figure 6b shows that NT and NP samples had similar Nyquist impedance plots and the same equivalent electrical circuit when performed with ZView2 software. The equivalent circuit (EC) is made up of the solution resistance (Rs) in series with a parallel association of the double-layer capacitance (Cdl) and the polarization resistance (Rp). Rp is proportional to the corrosion resistance of the surface. The Rp obtained on the NP sample was 915.68 KΩ.cm2, clearly greater than that of the NT sample (527.78 KΩ.cm2). This means that both samples resisted corrosion, and the nanopeened layer improved the corrosion resistance of AISI 420 steels. The resistance enhancement obtained in the case of the NP sample is mainly due to the superior Cr, Mo, and Ni contents.

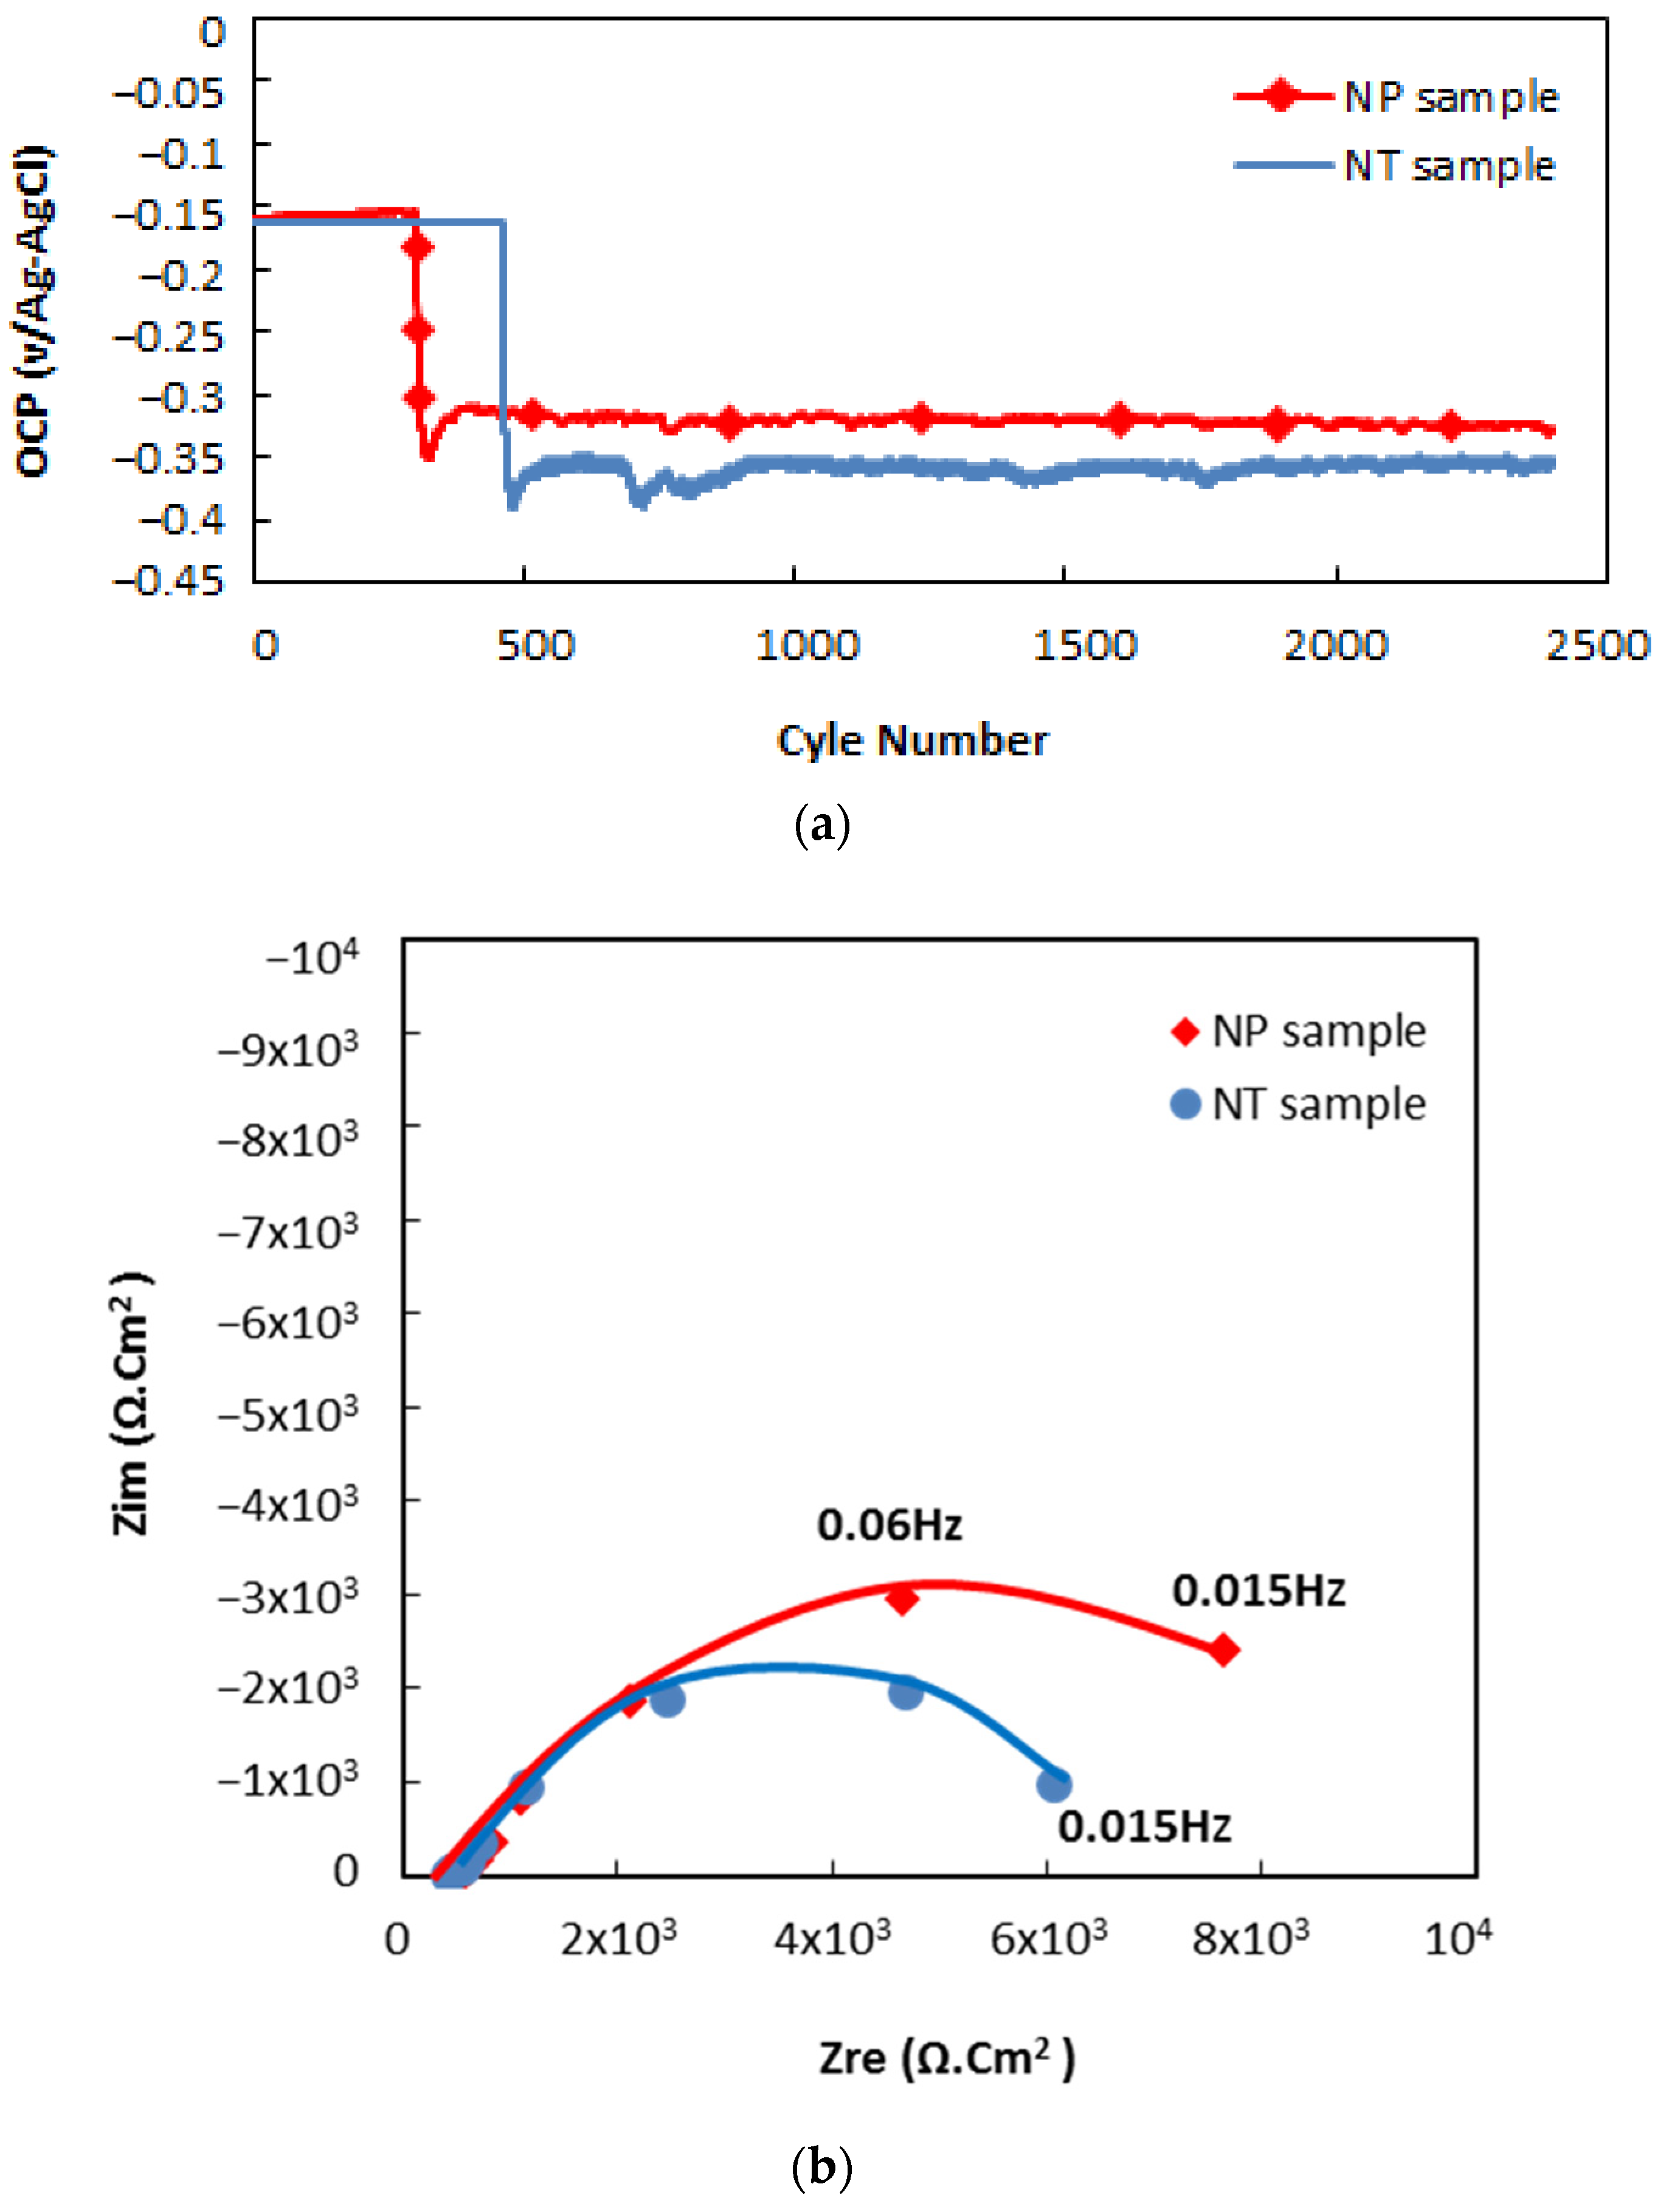
3.3. Tribocorrosion Tests under Continuous Sliding

During the tribocorrosion tests under continuous sliding at 5 N and 120 rpm, the evolution of OCP2 potential is monitored as a function of cycle numbers, as shown in Figure 7a.
When the sliding starts, the OCP2 decreases to reach its lowest value of −0.37 and −0.32 V/Ag-AgCl for NT and NP samples, respectively, which corresponds to the increase in corrosion rate. In fact, the passive film was destroyed by sliding. The wear track became uncovered by the protective layer, and the bare metal was attacked by the aggressive environment of boric acid and lithium hydroxide solutions. After 72 cycles, the OCP2 stabilizes at −0.35 and −0.32 V/Ag-AgCl for NT and NP samples, respectively. The EIS2 measures the impedance of the metal/solution interface in order to identify the surface state and determine the corrosion resistance of samples under continuous sliding, as shown in Figure 7b. The experimental data were simulated by the equivalent circuit EC. The resistance Rp for both NT and NP samples was about 6700 and 10036 Ω.cm2, respectively, proposing an active surface state [35]. The Rp of the NP sample was slightly higher than the NT sample, which suggested an improvement in corrosion resistance under continuous friction. This improvement was attributed to the difference in the oxide layer composition (cf. Table 1). In fact, the passive layer on NP samples was more stable due to the higher Cr, Ni, and Mo contents compared to the NT one. That may also be ascribed to the oxide debris remaining in the wear track to form a barrier layer instead of being injected.

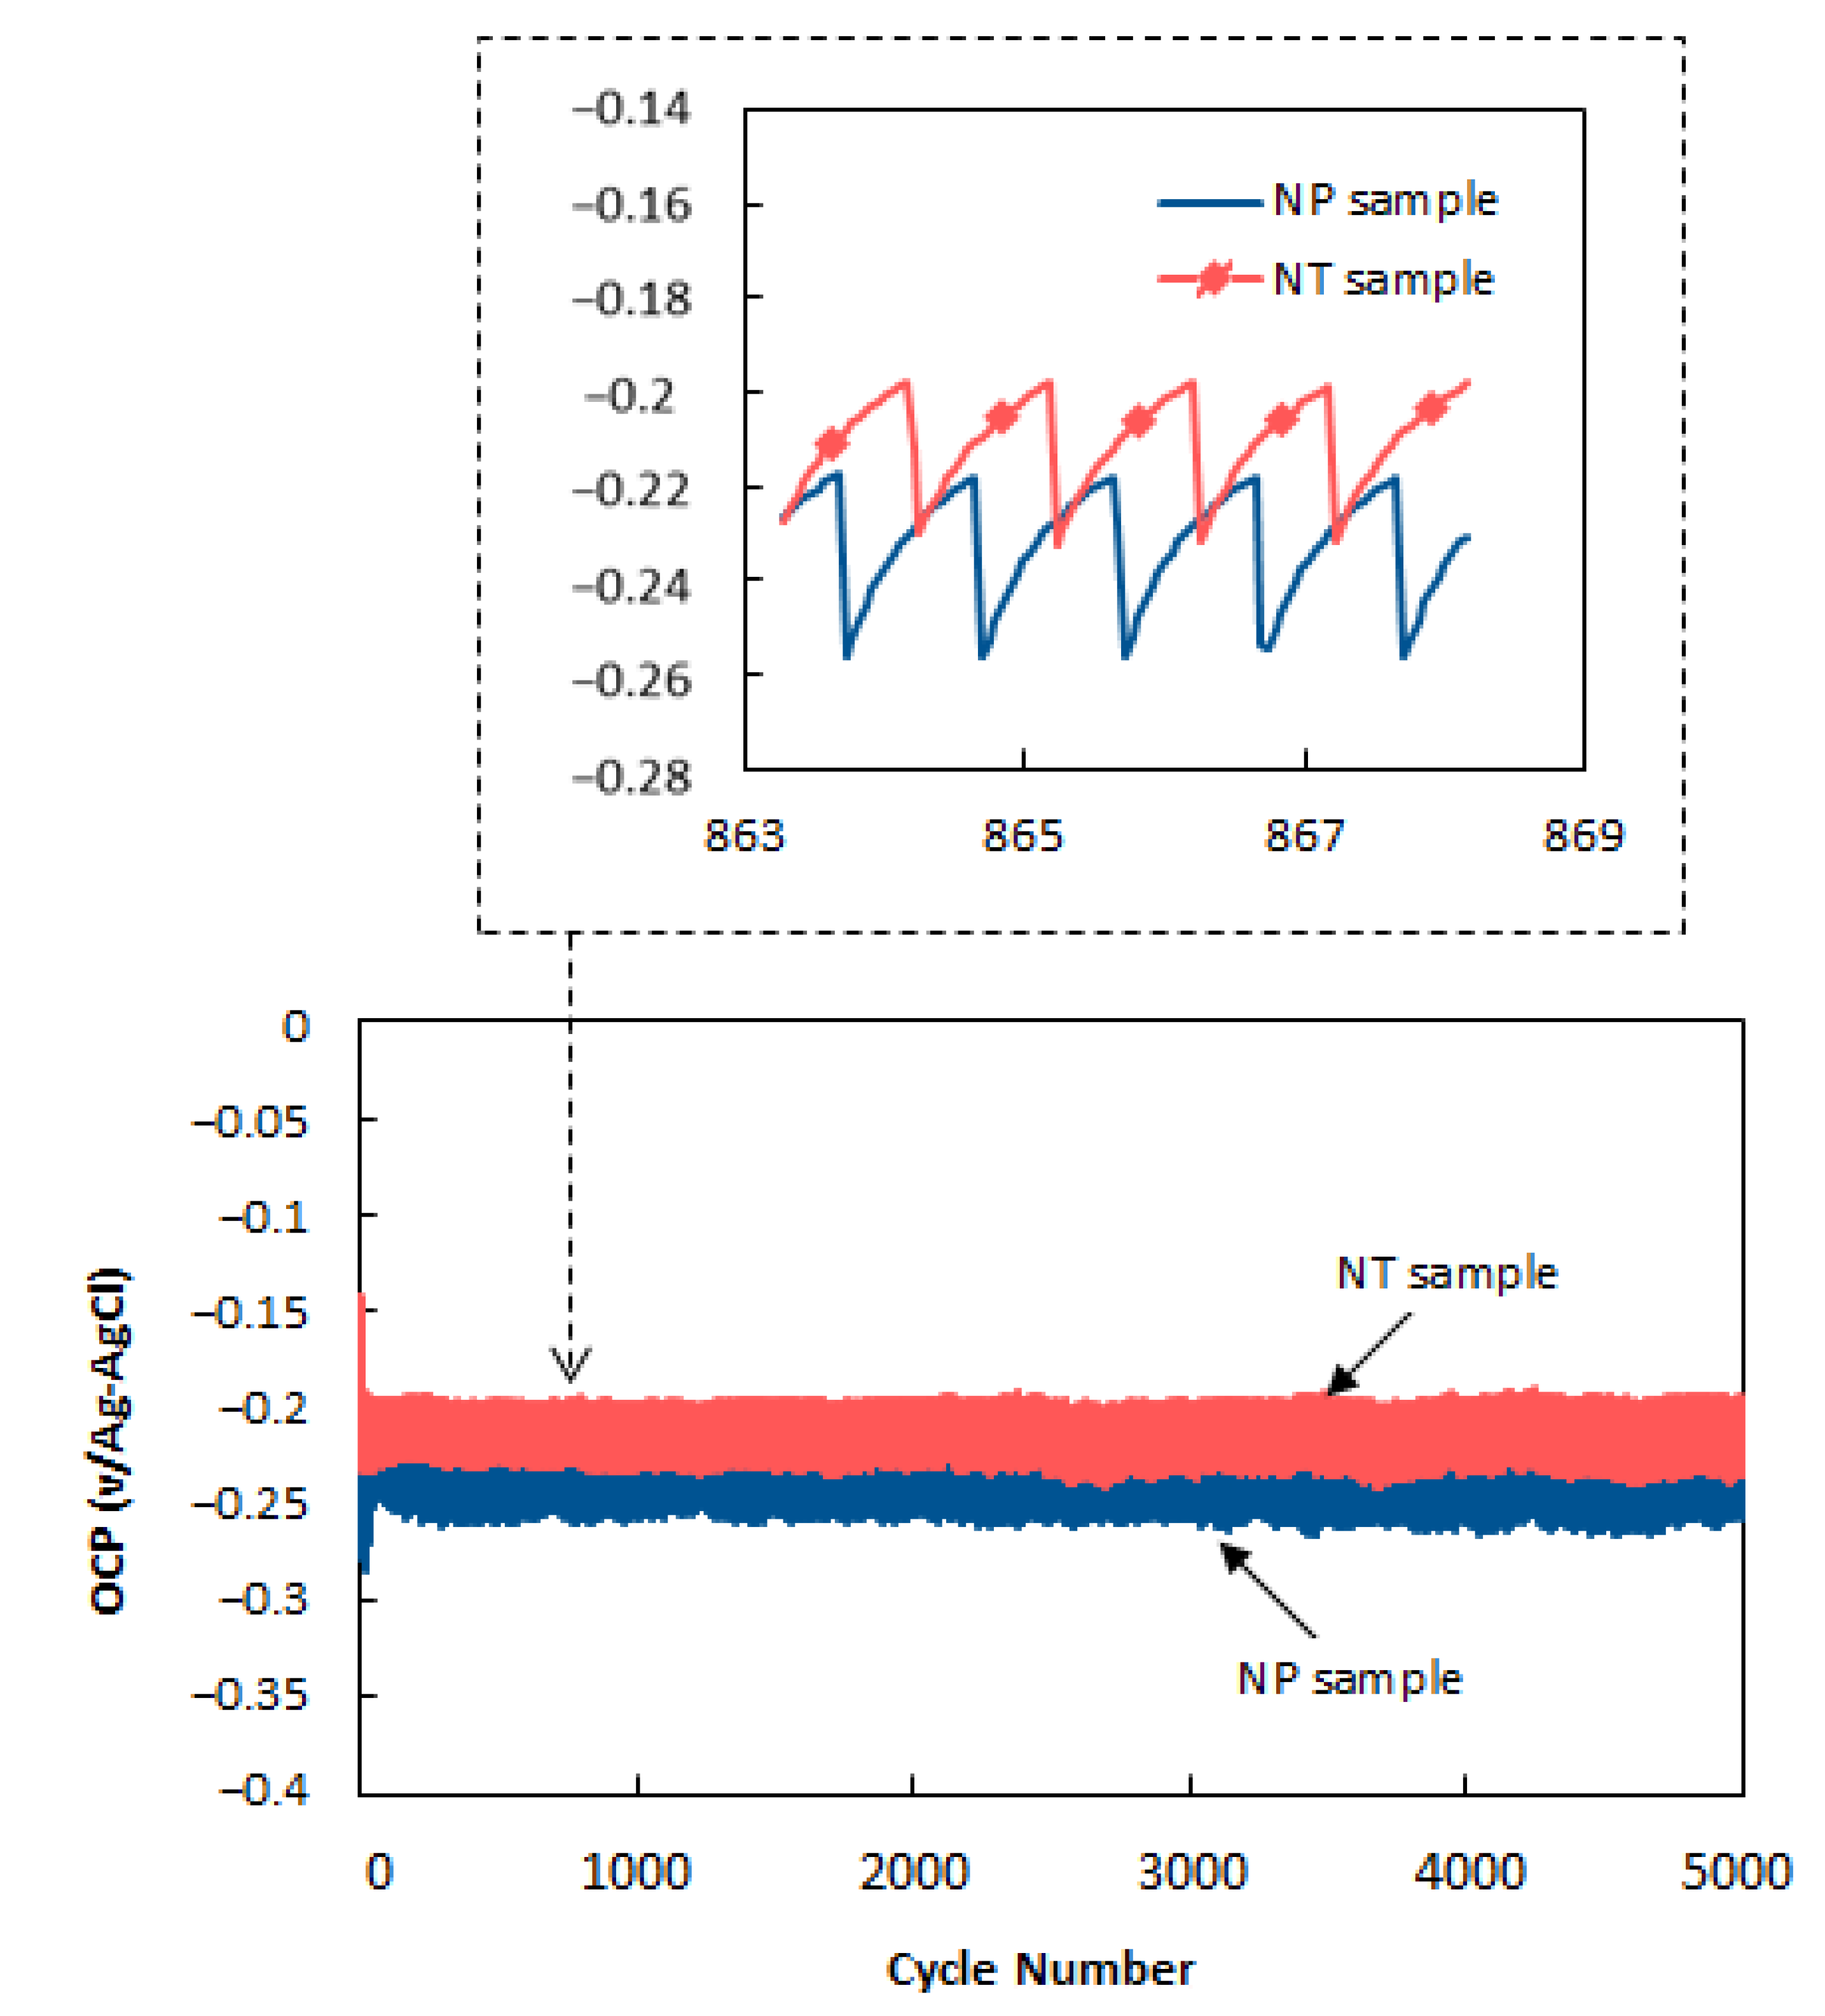
3.4. Tribocorrosion Tests under Intermittent Sliding

The OCP2 evolutions versus the time of both NT and NP samples under intermittent sliding at 5 N and 120 rpm are presented in Figure 8. For both NT and NP samples, a sudden decrease in the OCP2 is observed when sliding starts. The OCP2 dropped to −0.28 and −0.23 V/Ag-AgCl for NT and NP samples, respectively. Then, it fluctuates in phase with the alumina pin rotation (tr) and stop (tstop). The fluctuations were attributed to the passivation-activation transitions of the wear track in a tribocorrosion system. Indeed, the passive film was removed by mechanical wear during tr, indicating an active state of wear track. Then the dissolution of the material was produced inside the wear track, confirming the OCP2 drop. During tstop, OCP2 increased, which indicated that the wear track was repassivated. In such intermittent sliding tests, EIS measurements could not be performed because of the fluctuations and non-stationary OCP2 in a single cycle.

3.5. Surface and Morphological Characterization

In order to understand the surface wear mechanisms, the wear tracks on NT and NP samples were analyzed by SEM micrographs. They are presented in Figure 9 and Figure 10 under continuous and intermittent sliding, respectively.
Under both continuous and intermittent sliding, the wear tracks have scratches parallel to the sliding direction, which proved an abrasive wear mechanism in both NT and NP samples.
The abrasive wear seems to be more pronounced for NP samples due to the major scratches and the presence of local grooves into the scratches in the wear track under both continuous and intermittent sliding, as shown in Figure 9b and Figure 10b, respectively.
It seems that, first, two-body abrasive wear was created from direct contact of the alumina pin with the sample surface. It is worth noting that debris generated from the passive film was Cr-rich oxides. After the removal of the local passive film, the wear debris was generated from bare metal. Probably a mixed debris third body was created and was continuously present at the interface contact bodies.
For NT samples, the adhesive wear was proven under continuous and intermittent sliding, as shown in Figure 9a and Figure 10a, respectively. The debris was oxidized and then delaminated by the adhesive sliding to form the oxide layer. Plastic deformation of the oxide debris was accompanied by the cracking and delamination phenomena.
However, for NP samples with high hardness, abrasive scratches are observed with some debris adhesion. Furthermore, local grooves were detected in these scratches under both continuous and intermittent sliding, as shown in Figure 9b and Figure 10b, respectively. The local grooving process could be the result of the cracking phenomenon locally developing into a scratch. Such a phenomenon could be explained by the brittle behavior of the hardened material created in the wear tracks of the nanopeened surface.

3.6. Wear Analyses

A typical tribocorrosion protocol was used to calculate the contribution of wear [36]. The total wear loss (Wtr) is the sum of the amounts of four components according to Equation (1):
W t r = W a c t c + W r e p a s s c + W a c t m + W r e p a s s m
where W a c t c is the mass loss of active material by corrosion, W r e p a s s c is the mass loss of repassivated material by corrosion,   W a c t m is mass loss of active material by mechanical wear, and W r e p a s s m is the mass loss of repassivated material by mechanical wear.
Figure 11 and Figure 12 show the 3D wear track profile obtained under continuous and intermittent sliding in NT and NP samples, respectively. Three 3D profiles were revealed from each wear track, which allowed determining the total volume of the wear track Wtr.
The total wear determined from topographical measurements is summarized in Figure 13 and Table 2. From these results, one can conclude that the nanopeening treatment can greatly improve the tribocorrosion of AISI 420 steel. Indeed, it enables a decrease of about 20% in the total wear under both continuous and intermittent sliding.
Under continuous sliding, both ( W a c t c and W a c t m ) contributions decreased with treatment (cf. Table 2). However, the W a c t c / W t r and W a c t m / W t r ratios for both NT and NP samples were almost identical at about 0.04 and 0.9, respectively. Under intermittent sliding, the improvement of resistance wear was marked by the decrease in all contributions, especially mechanical ones W a c t m and W r e p a s s m . The mechanical resistance improvement led to a work-hardened and nano-grained surface layer. In fact, the impact of high-energy balls led to severe plastic deformation [44]. This mechanism contributed to the formation of nano-sized grains and hardness rise. In addition, the propagation of high-density dislocations promoted the diffusion of Cr, Mo, and Ni to form protective mixed oxides on the treated surface, which explains the higher content of those elements and, consequently, the corrosion-resistant improvement [27,45].

4. Conclusions

The effect of nanopeening treatment on the tribocorrosion behavior of martensitic AISI 420 steel was studied in this work. The EBSD examinations showed that the nanopeening treatment produced microstructural changes in the surface layer with a depth of about 110 μm. Severe plastic deformation was obtained in the zone extending to 55 µm from the top surface of samples in which the martensitic grains could not be identified. Therefore, the micro-hardness values in the nanopeened sample (550 HV0.05) were higher than those obtained in the non-treated one (260 HV0.05).
The tribocorrosion tests were conducted in a pin-on-disc tribometer at room temperature in boric acid and lithium hydroxide solutions. The tests were carried out under continuous and intermittent sliding at a constant load of 5 N and a rotating speed of 120 rpm. The results showed that:
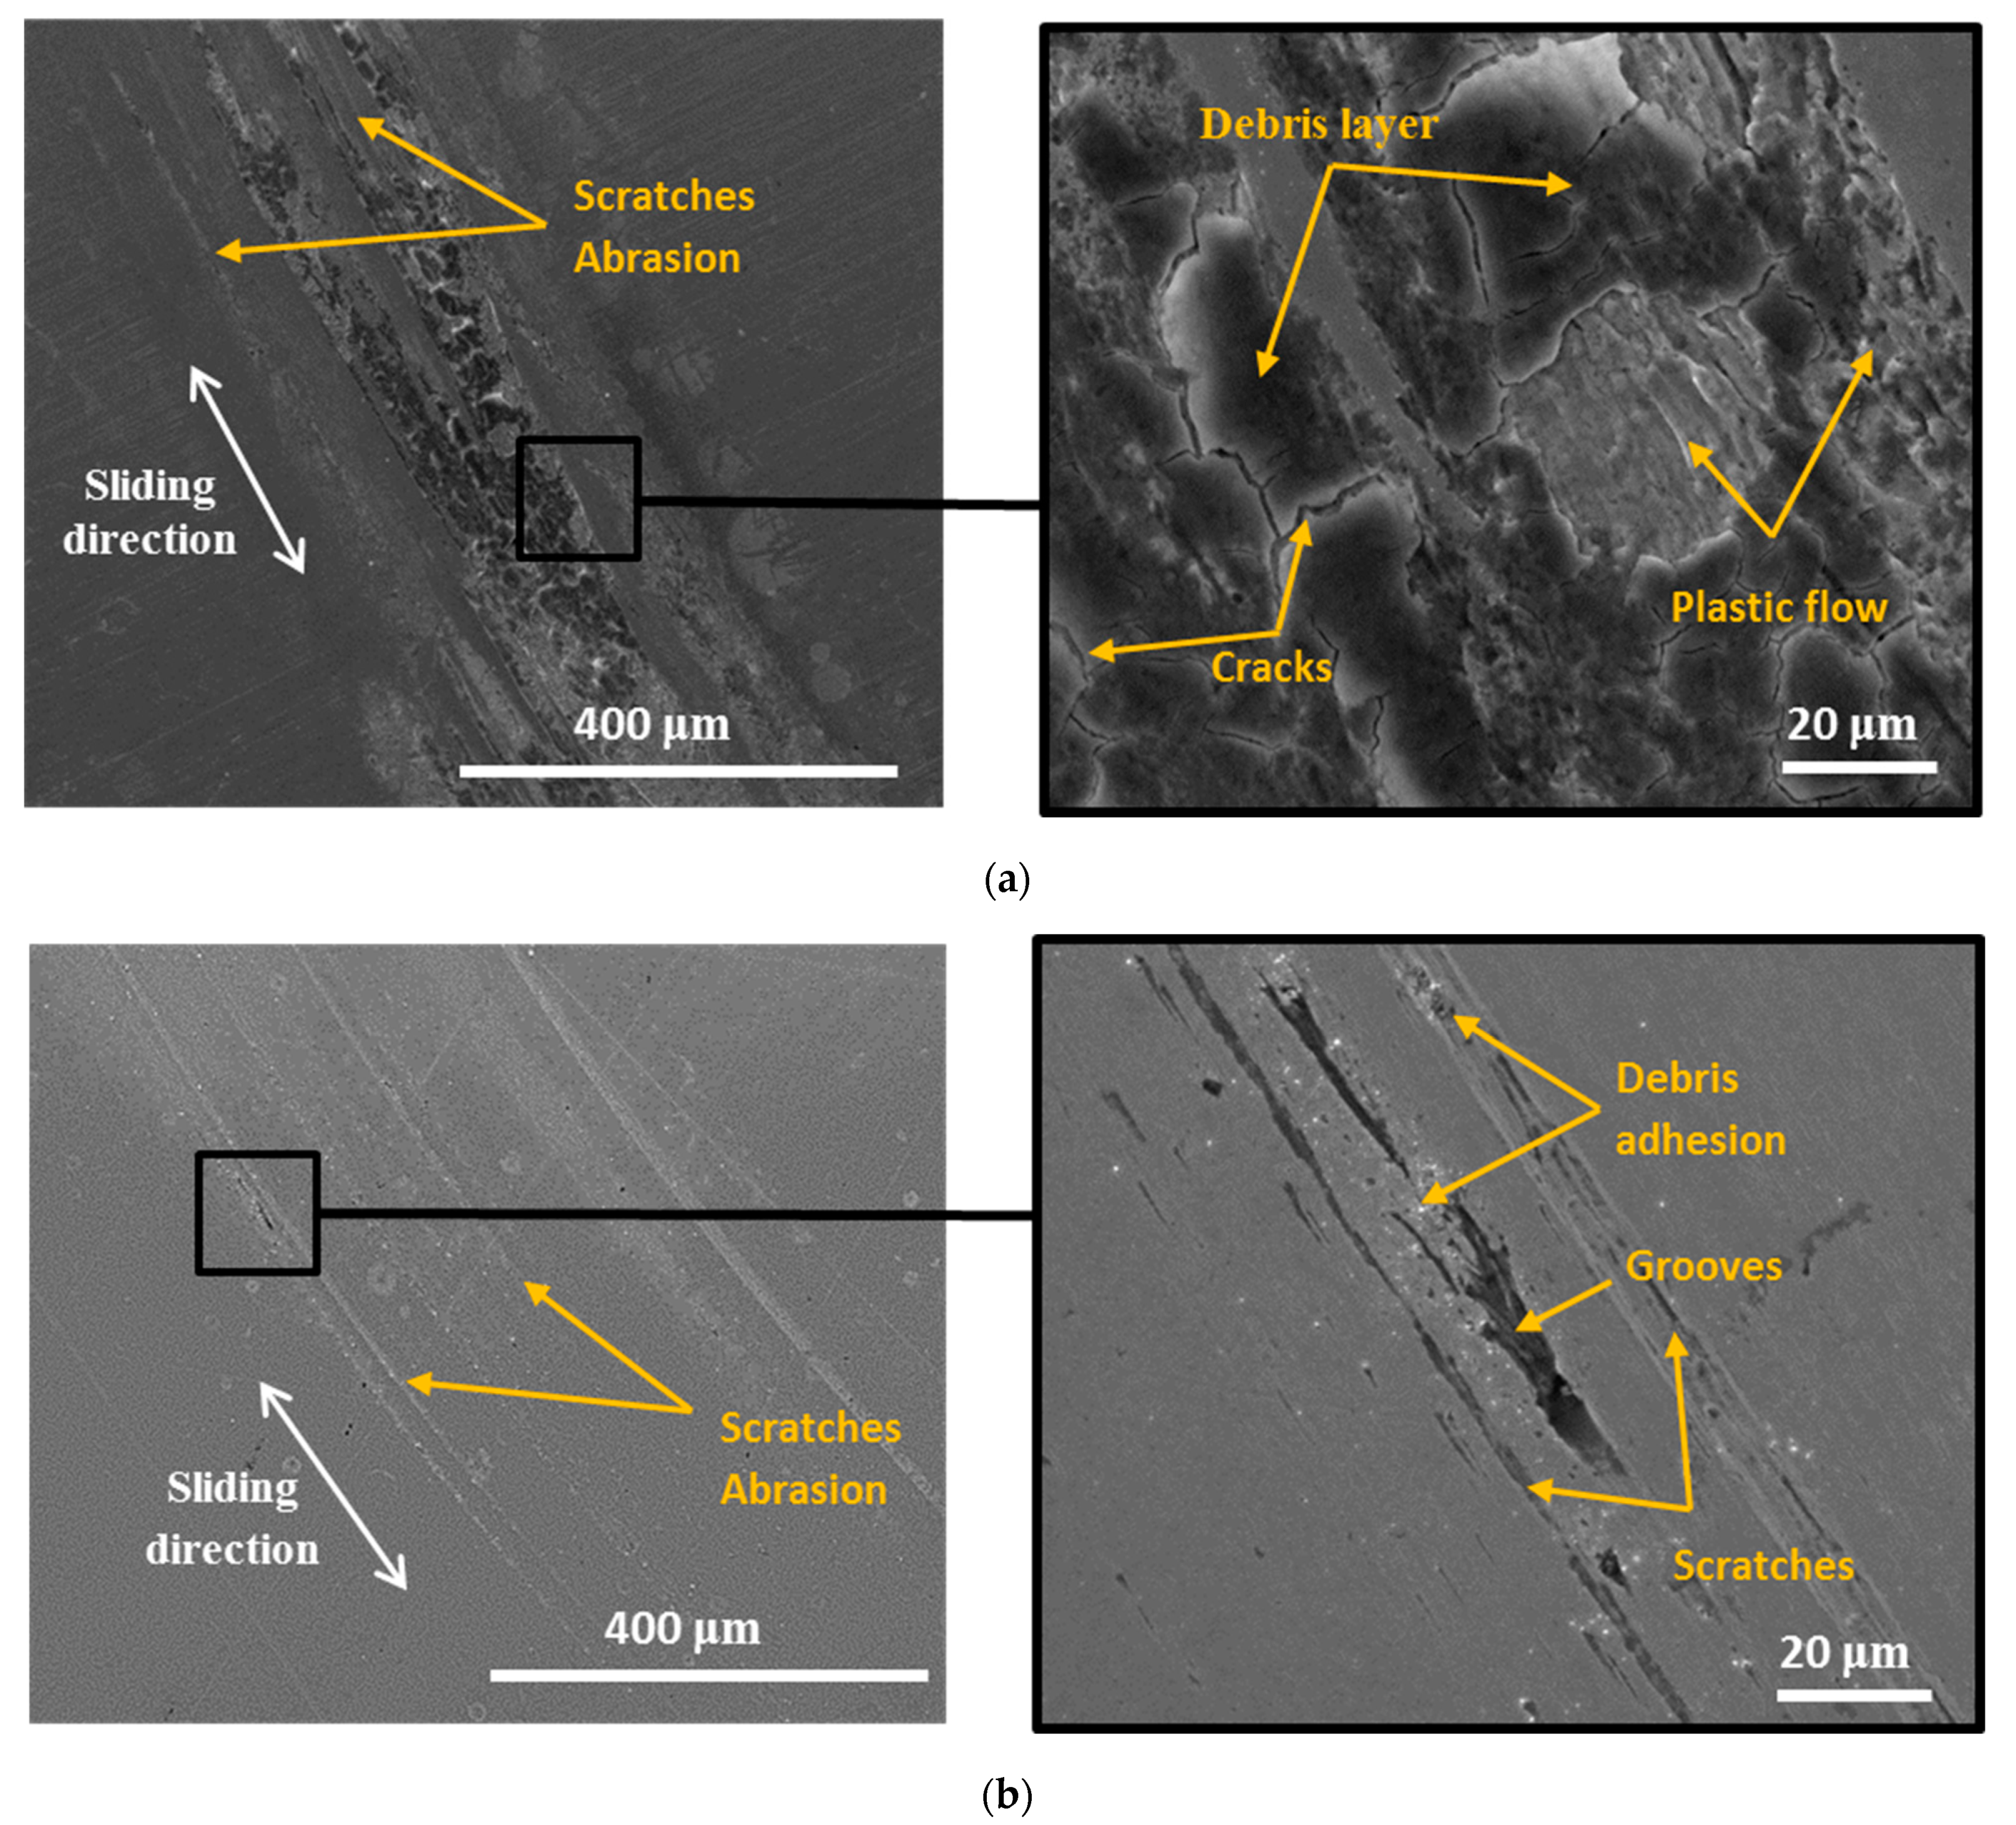
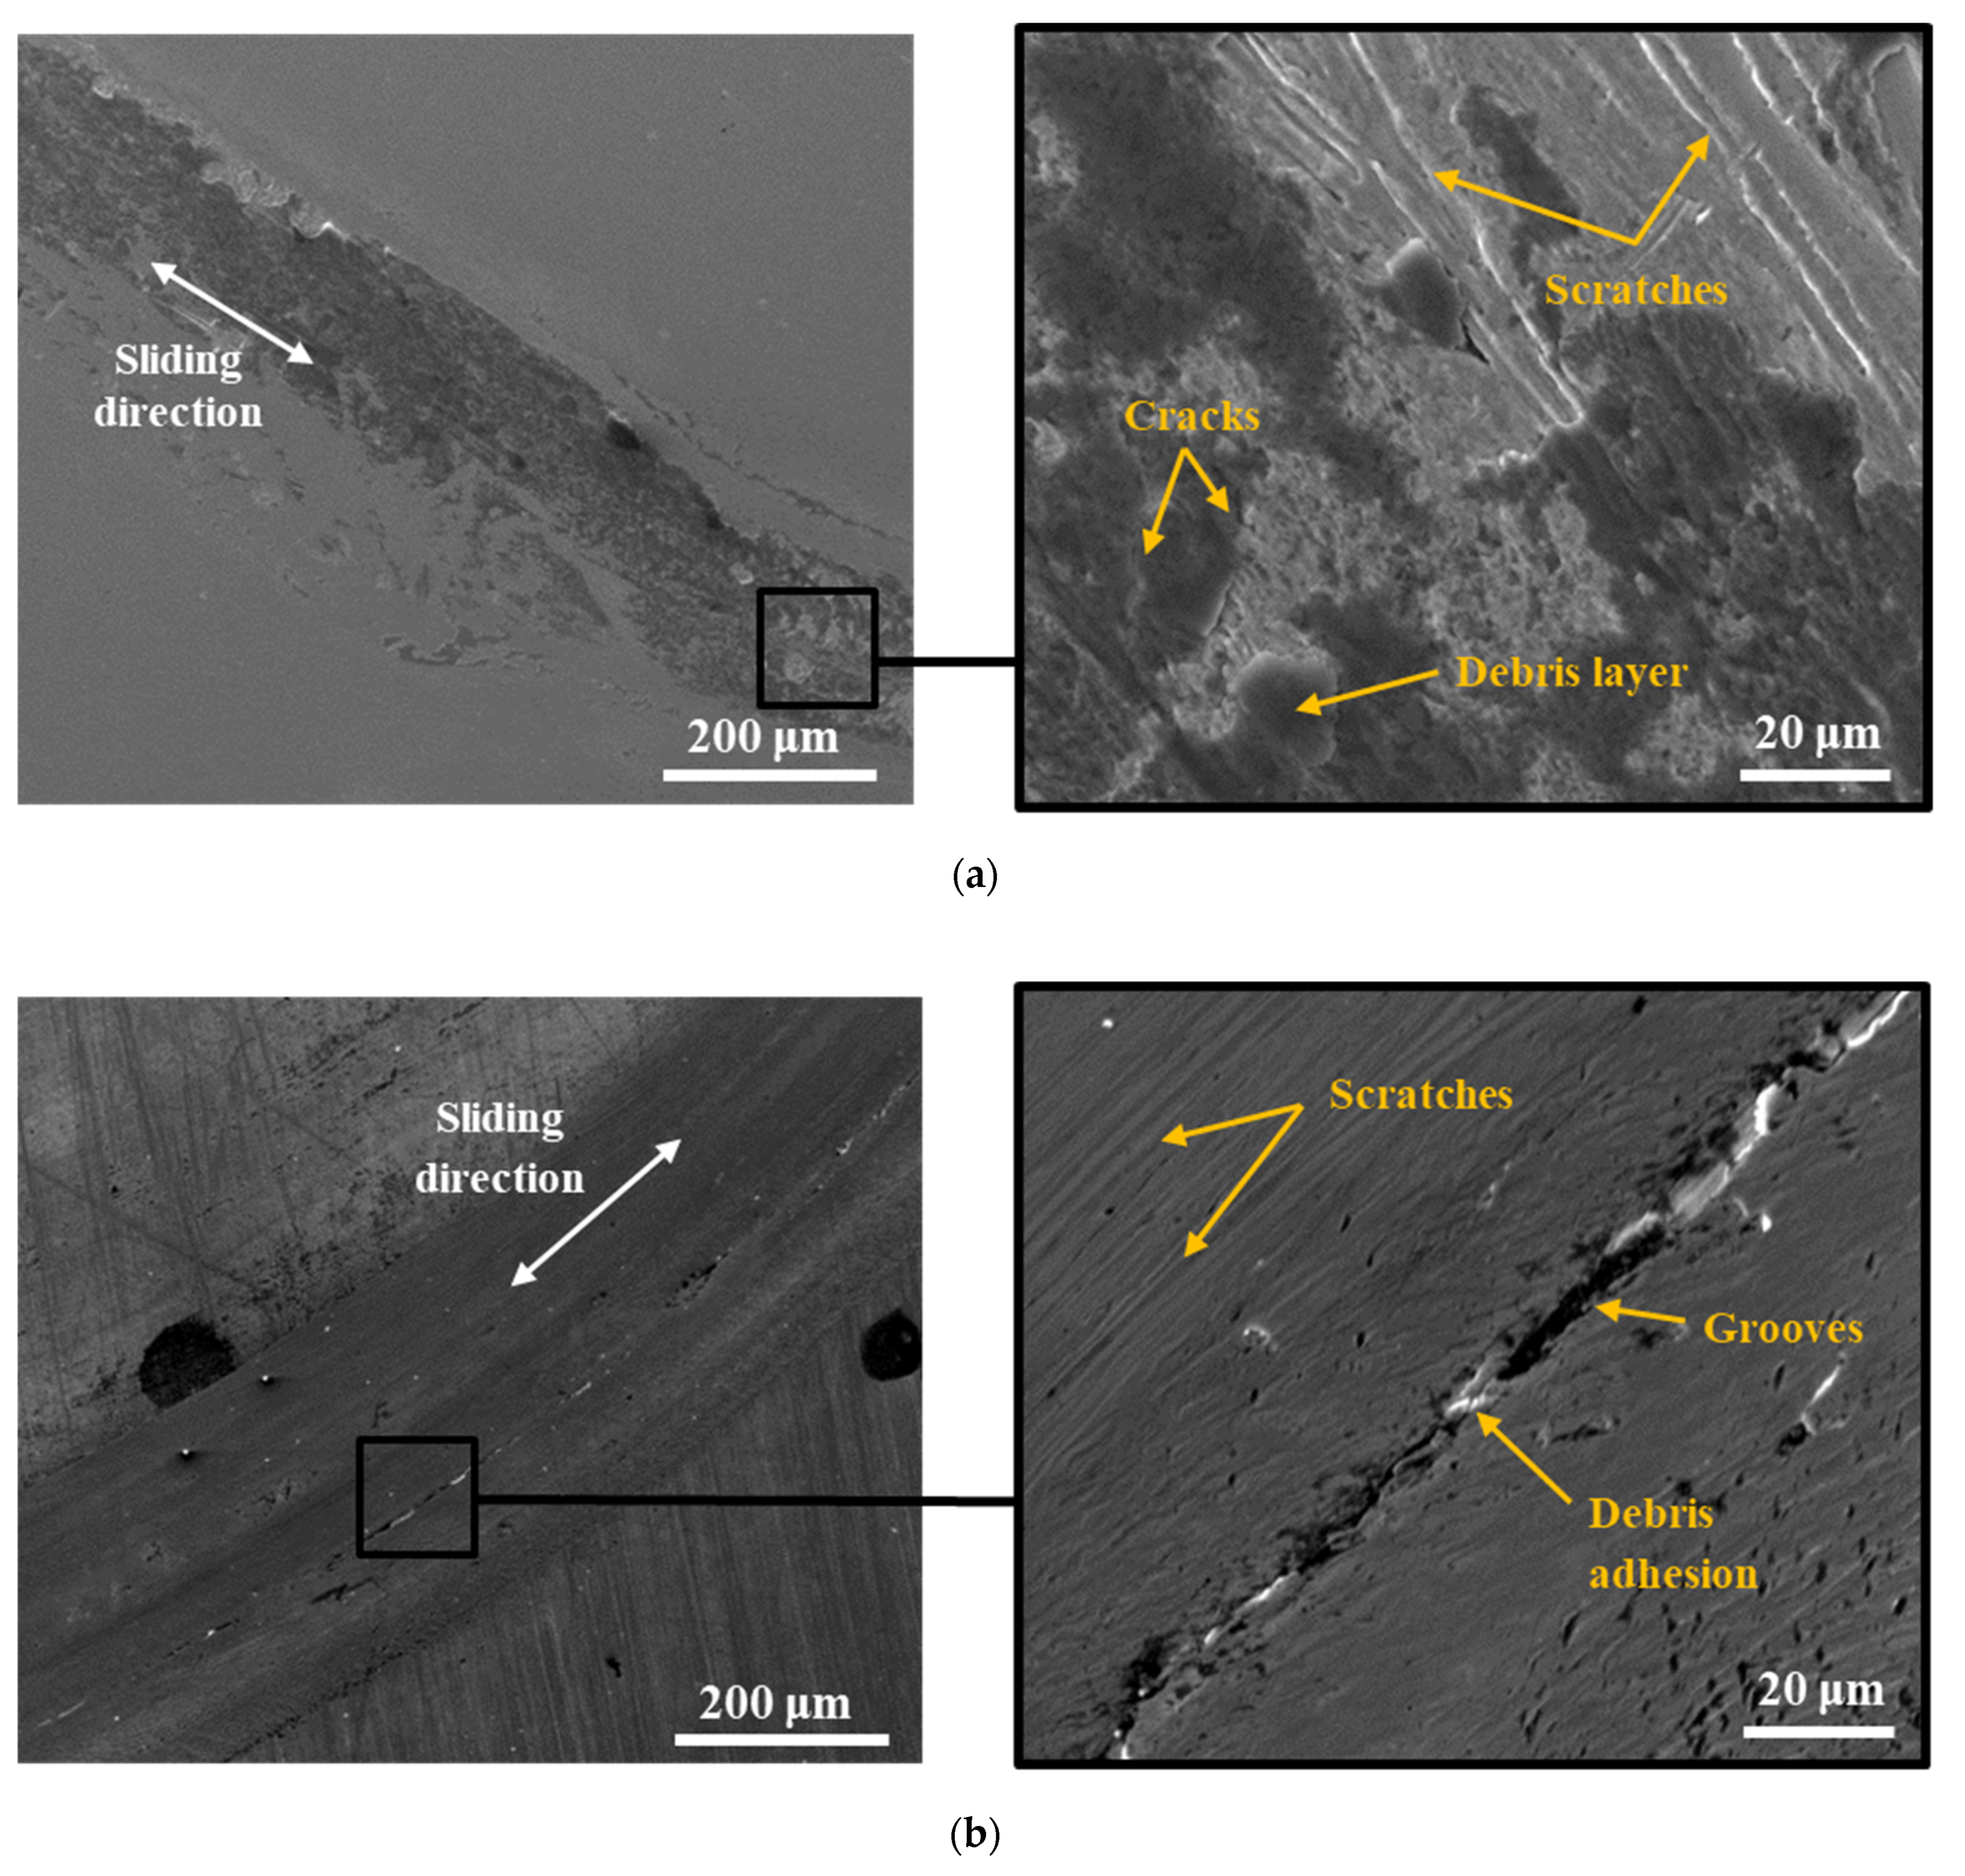
  • Under both continuous and intermittent sliding, the wear mechanism was dominated by abrasion and adhesion mechanisms. However, the wear of the nanopeened sample was dominated by abrasion, which may give rise to the effect of hard oxide debris.
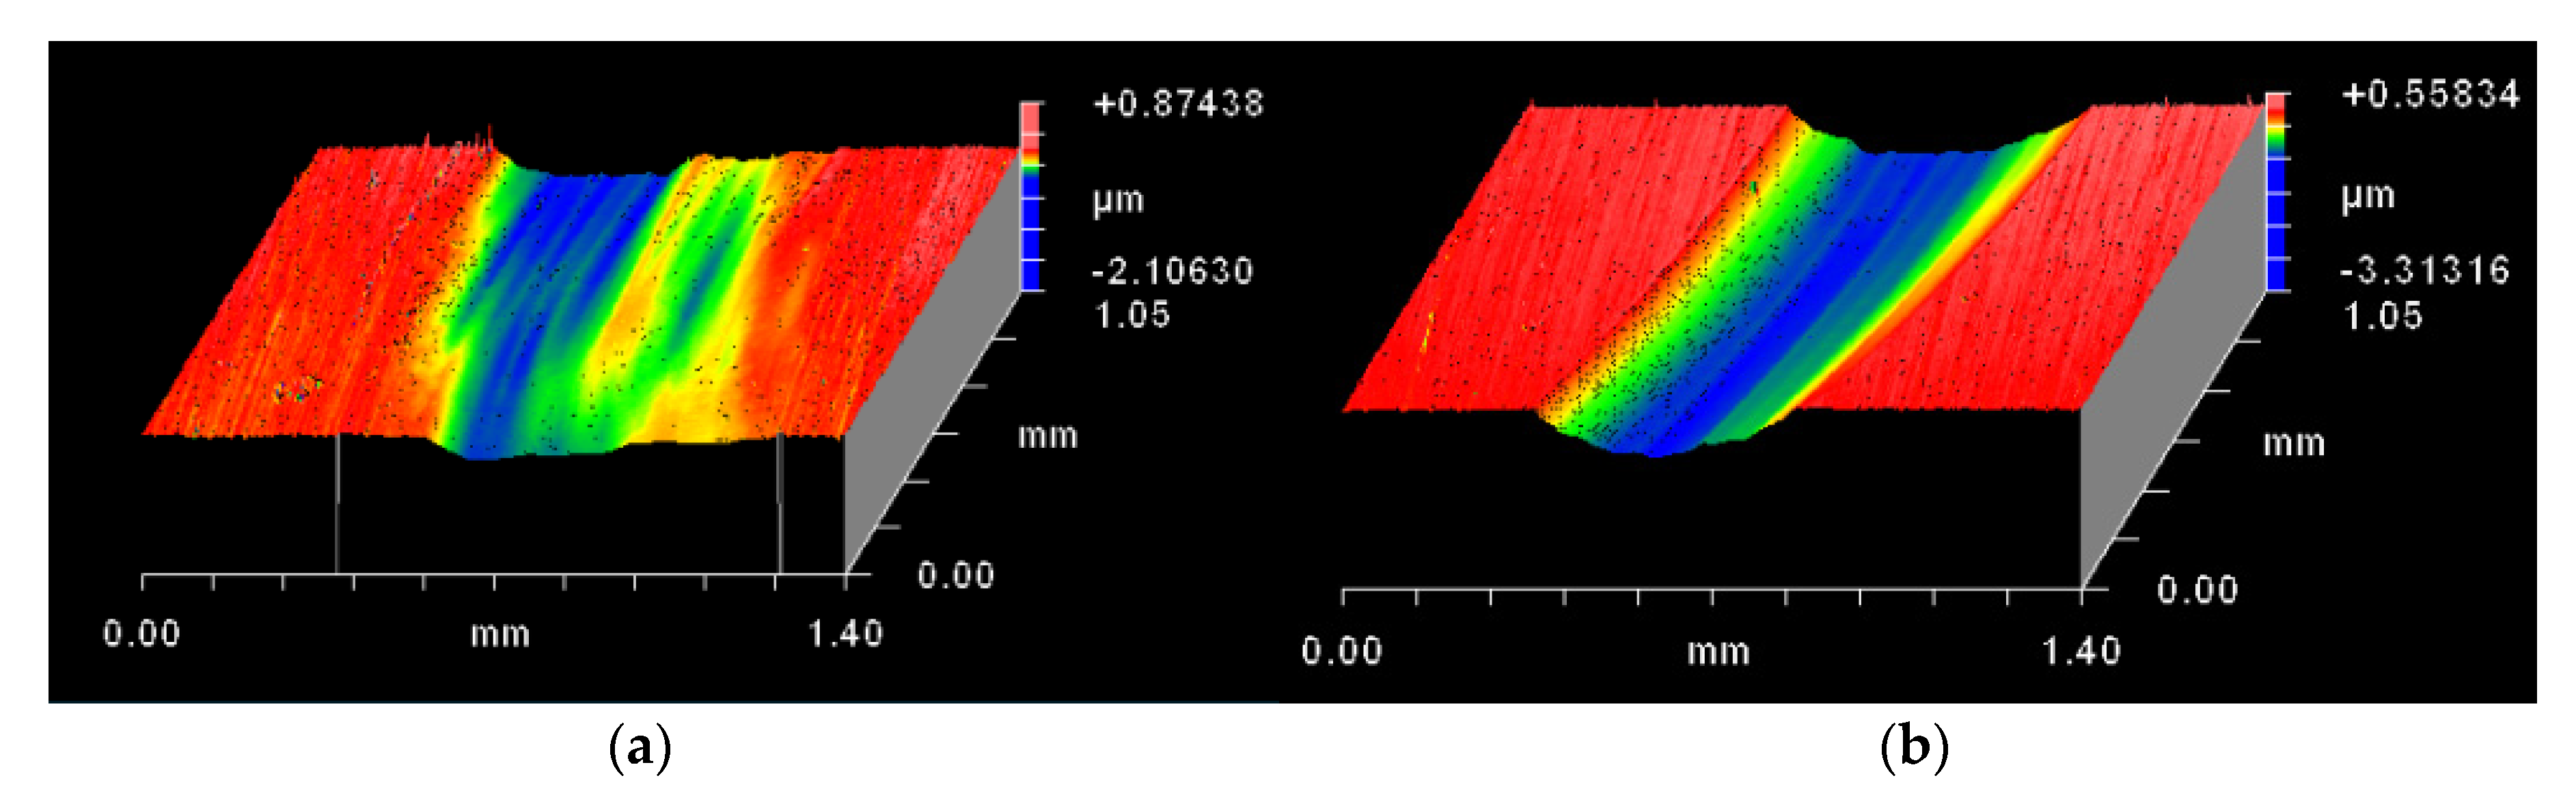
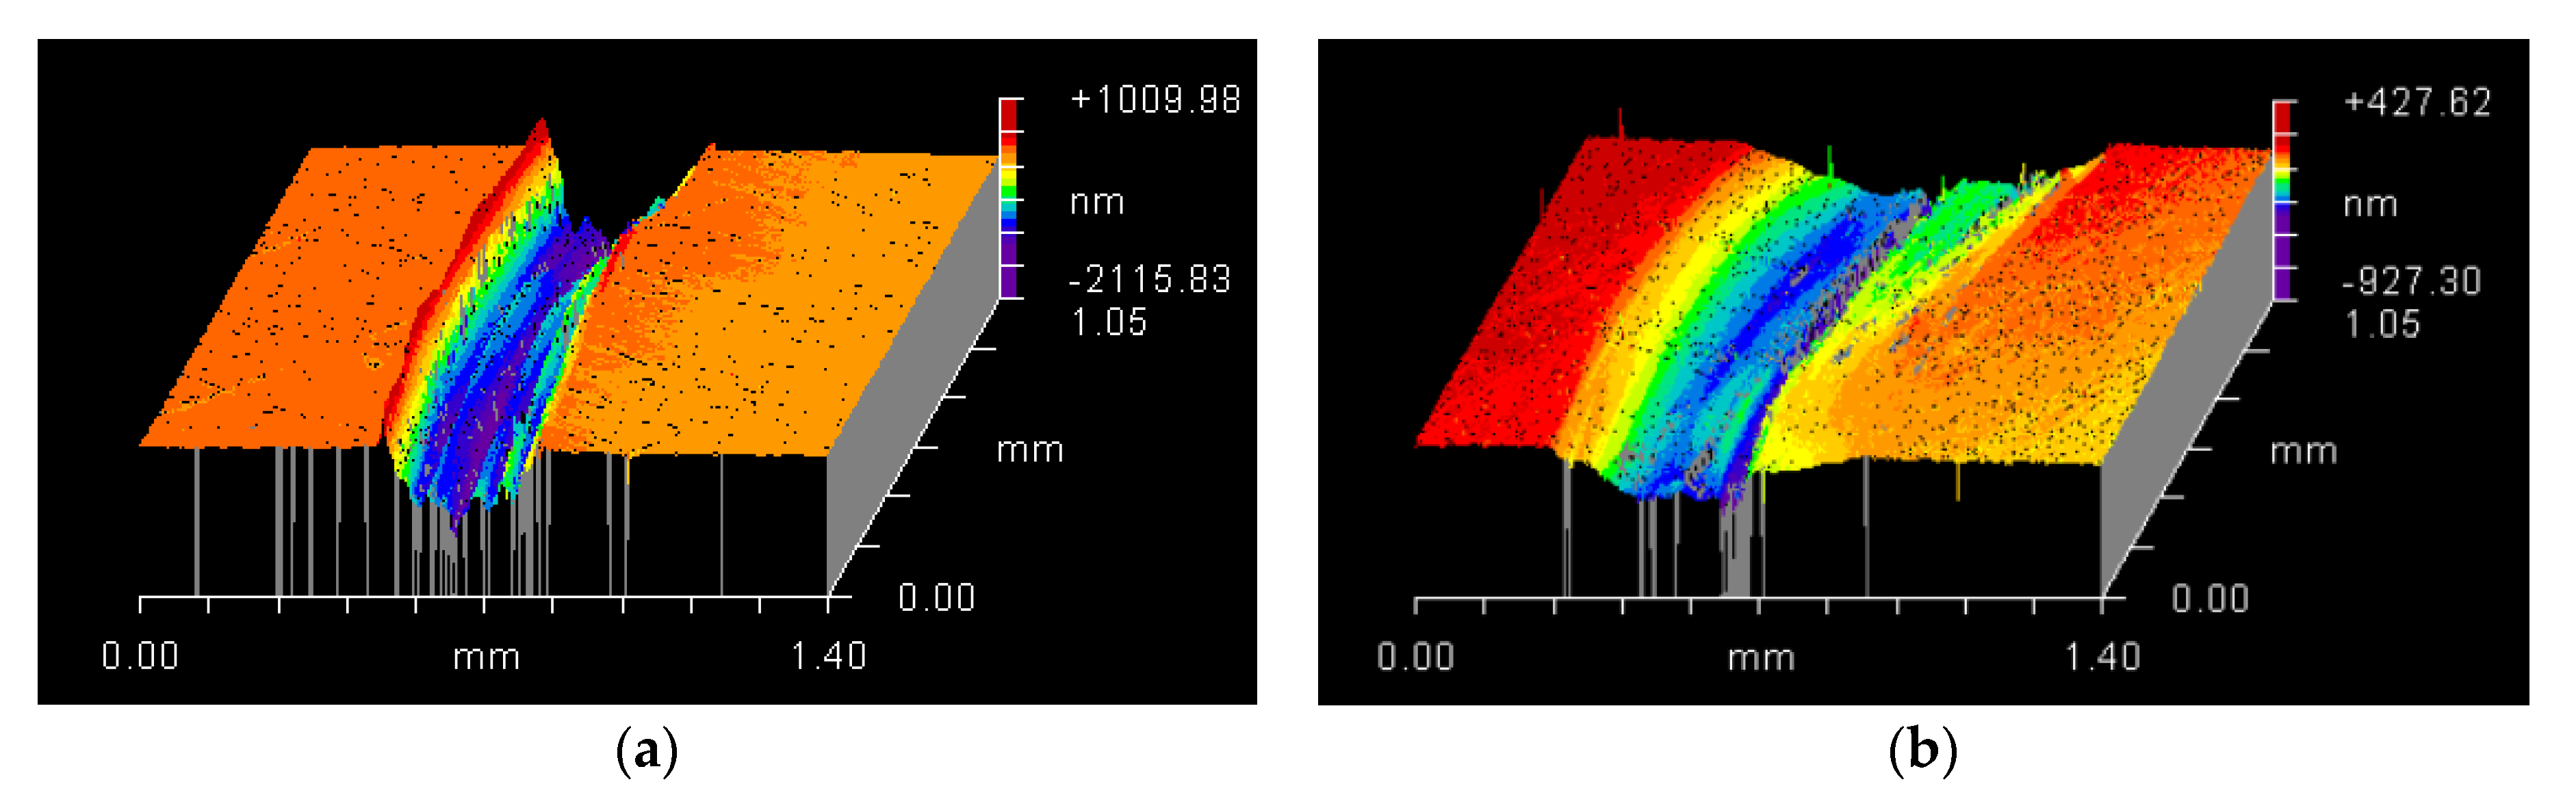
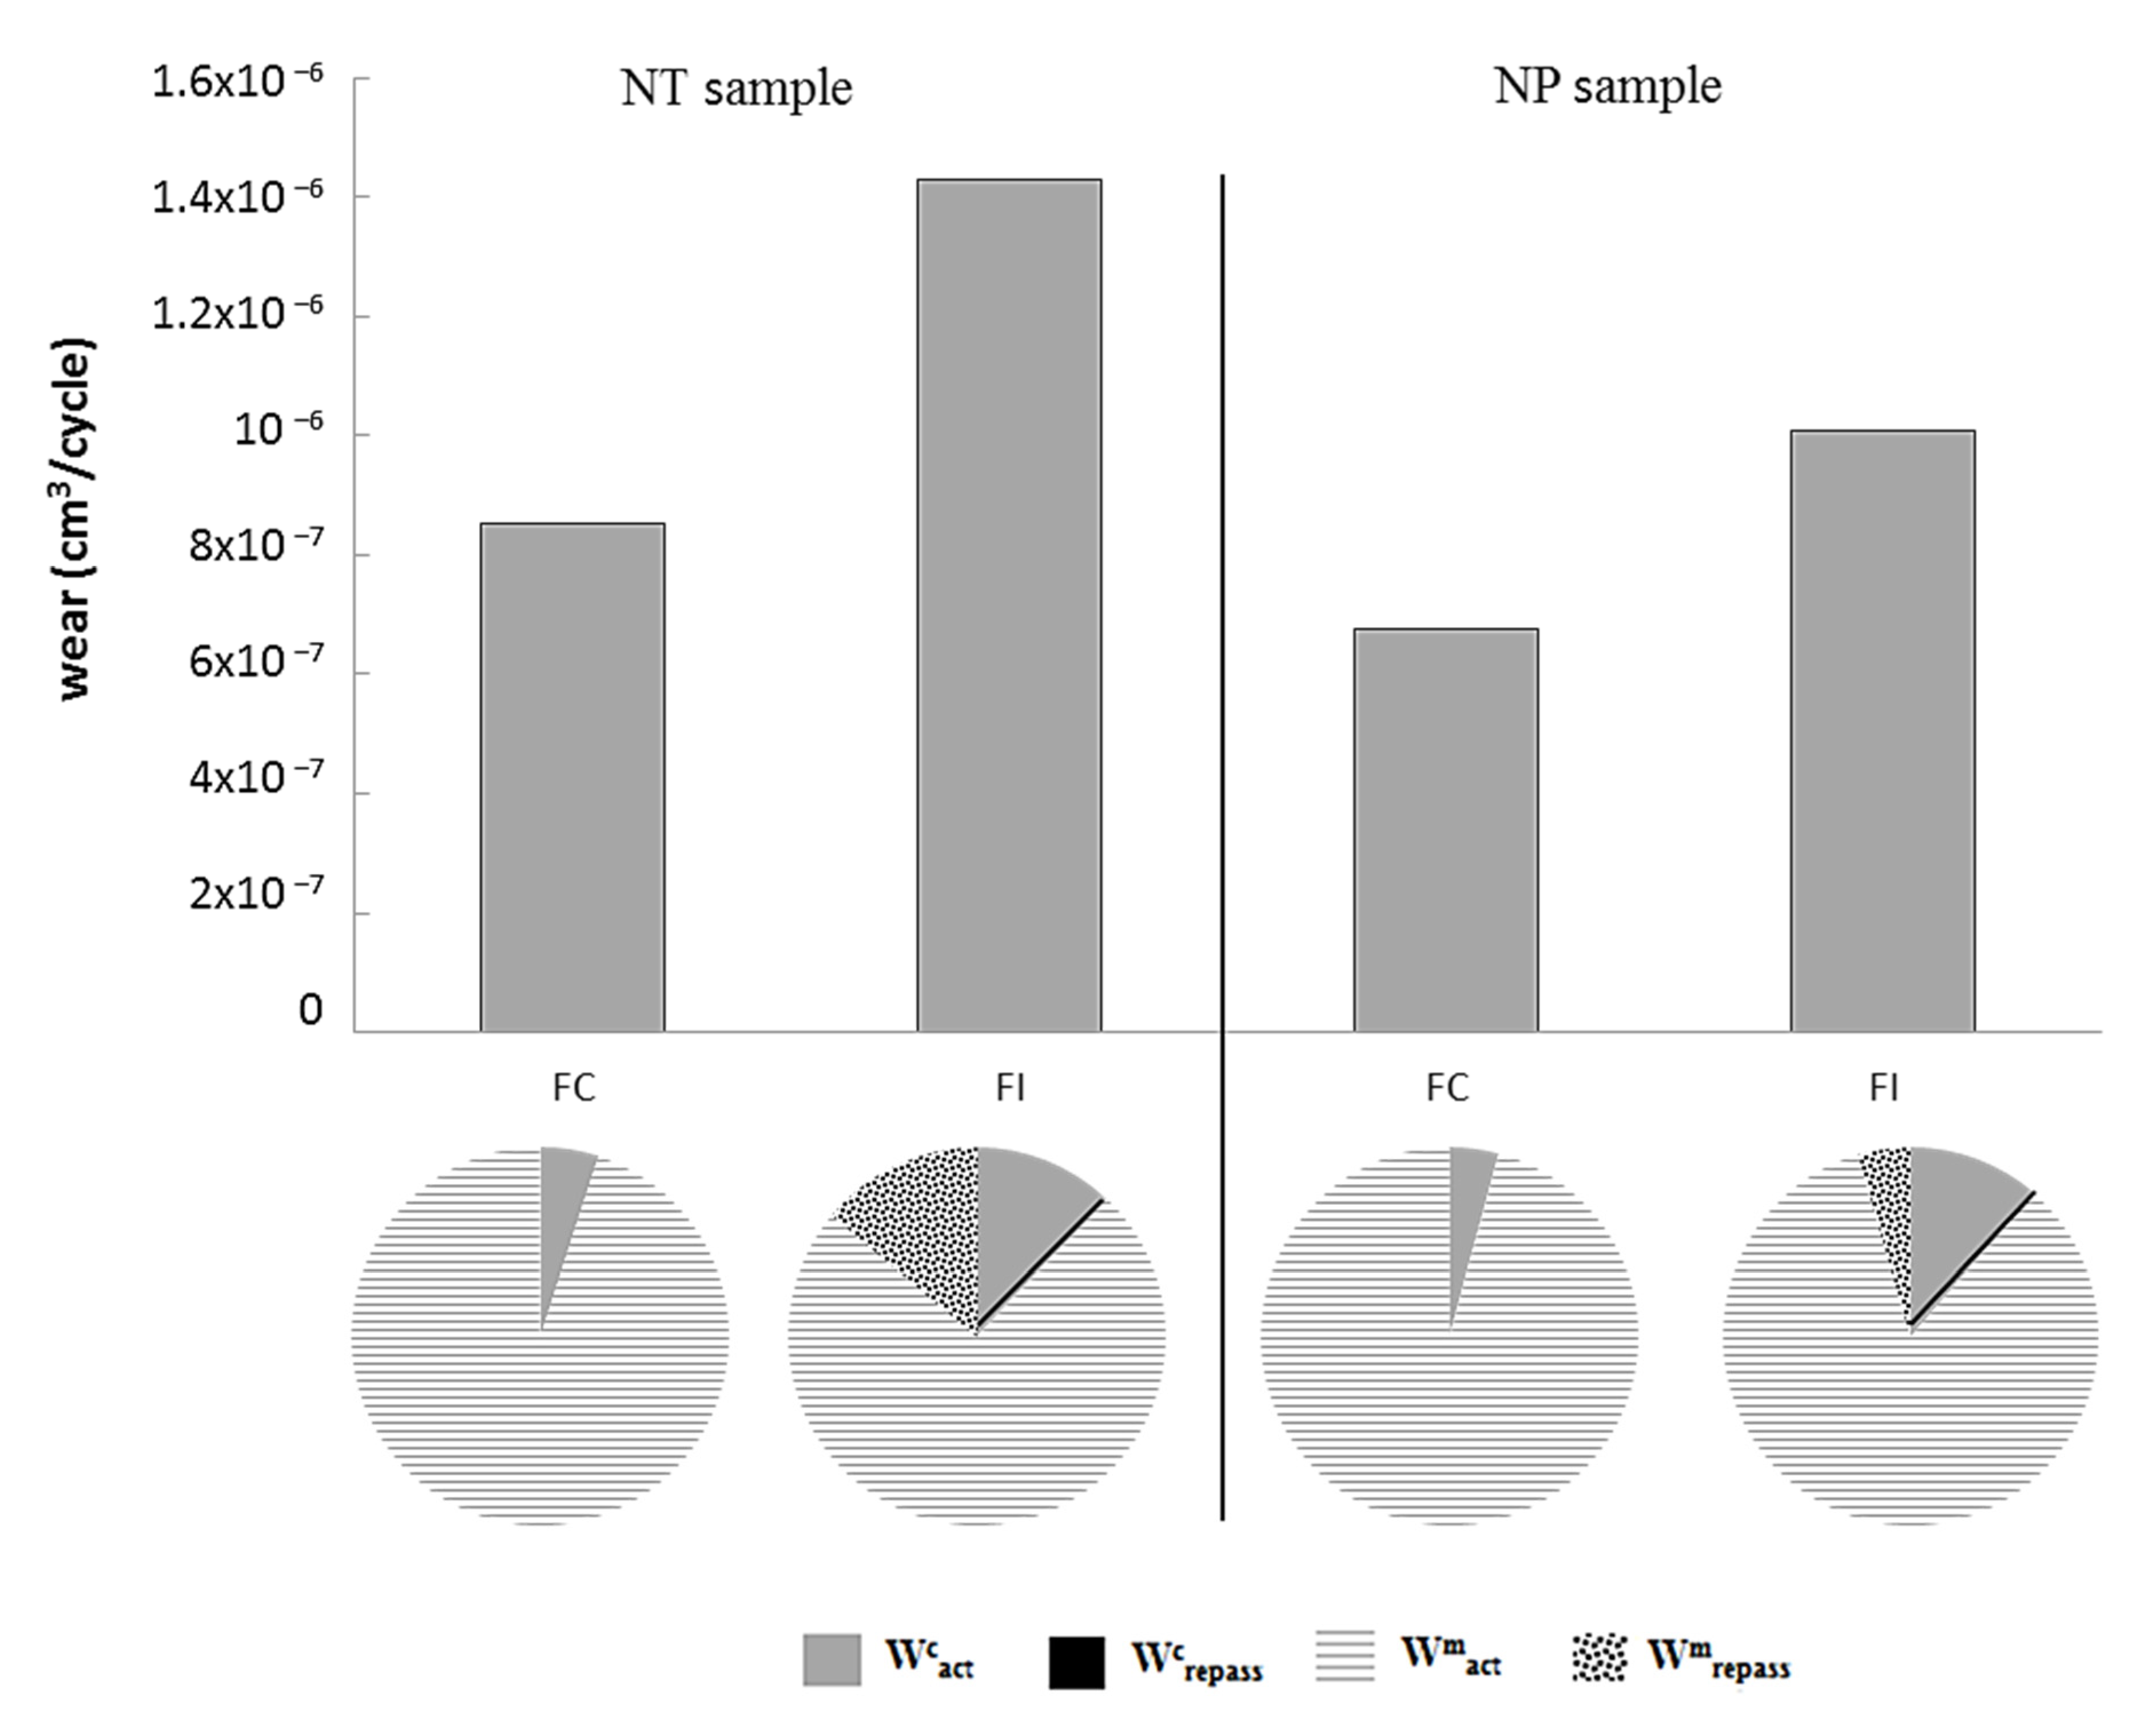
  • The three-dimensional surface profiles of the wear tracks were performed to determine the total wear loss. The tribocorrosion protocol was applied to calculate the different contributions of wear. The tribocorrosion behavior of AISI 420 was improved by applying the nanopeening treatment. Under continuous sliding, both mechanical and corrosion contributions to wear decreased with a similar contribution/total wear ratio. Under intermittent sliding, all wear contributions decreased after the treatment, which greatly ameliorated the mechanical resistance of the repassivated surface.

Author Contributions

Conceptualization, F.B.S., M.B.S. and K.E.; methodology, M.B.S.; software, F.B.S.; validation, F.B.S., M.B.S. and K.E.; formal analysis, F.B.S., M.B.S. and K.E.; investigation, F.B.S. and M.B.S.; resources, P.P.; data curation, M.B.S.; writing—original draft preparation, F.B.S. and M.B.S.; writing—review and editing, F.B.S., M.B.S. and K.E.; visualization, F.B.S.; supervision, K.E.; project administration, K.E. and P.P.; funding acquisition, K.E. and P.P. All authors have read and agreed to the published version of the manuscript.

Funding

This research received no external funding.

Acknowledgments

The authors thank the Winoa Company, which kindly provided nanopeened samples.

Conflicts of Interest

The authors declare no conflict of interest.

List of Symbols

CdlDouble layer capacitance
CrChromium
EBSDElectron Back Scattered Diffraction
EISElectrochemical Impedance Measurements
ECDEquivalent Circular Diameter
FeIron
IPFInverse Pole Figure
MoMolybdenum
NiNickel
NTNon-Treated
NPNanoPeened
OCPOpen Circuit Potential
PAGPrior Austenite Grain
RCCARod Cluster Control Assemblies
ECEquivalent circuit
RpPolarization Resistance (Ω)
RsSolution Resistance (Ω)
SEMScanning Electronic Microscopy
tlatLatency time (s)
trotRotation time (s)
tstopStop time (s)
WtrTotal wear (cm3/cycle)
WcactMaterial loss due to corrosion of active material in the wear track (cm3/cycle)
WmactMaterial loss due to mechanical wear of the active material in the wear track (cm3/cycle)
WcrepassMaterial loss due to corrosion of repassivated material in the wear track (cm3/cycle)
WmrepassMaterial loss due to the mechanical wear of repassivated material in the wear track (cm3/cycle)
ZimImaginary part of the impedance (Ω.cm2)
ZreReal part of the impedance (Ω.cm2)

References

  1. Lina, A.; Moinereau, D.; Delaune, X.; Phalippou, C.; Reynier, B.; Riberty, P. The influence of water flow on the impact/sliding wear and oxidation of PWR control rods specimens. Wear 2001, 251, 839–852. [Google Scholar] [CrossRef]
  2. Allen, T.; Busby, J.; Meyer, M.; Petti, D. Materials challenges for nuclear systems. Mater. Today 2010, 13, 14–23. [Google Scholar] [CrossRef]
  3. Lemaire, E.; Le Calvar, M. Evidence of tribocorrosion wear in pressurized water reactors. Wear 2001, 249, 338–344. [Google Scholar] [CrossRef]
  4. Benea, L.; Ponthiaux, P.; Wenger, F.; Galland, J.; Hertz, D.; Malo, J. Tribocorrosion of stellite 6 in sulphuric acid medium: Electrochemical behaviour and wear. Wear 2004, 256, 948–953. [Google Scholar] [CrossRef]
  5. Landolt, D.; Mischler, S. Tribocorrosion of Passive Metals and Coatings, 1st ed.; Elsevier: Amsterdam, The Netherlands; EPFL: Écublens, Switzerland, 2011. [Google Scholar]
  6. Atamert, S.; Bhadeshia, H.K.D.H. Comparison of the microstructures and abrasive wear properties of stellite hardfacing alloys deposited by arc welding and laser cladding. Met. Mater. Trans. A 1989, 20, 1037–1054. [Google Scholar] [CrossRef]
  7. Atamert, S.; Stekly, J. Microstructure, wear resistance, and stability of cobalt based and alternative iron based hardfacing alloys. Surf. Eng. 1993, 9, 231–240. [Google Scholar] [CrossRef]
  8. Dalmau, A.; Rmili, W.; Joly, D.; Richard, C.; Igual-Muñoz, A. Tribological behavior of new martensitic stainless steels using scratch and dry wear test. Tribol. Lett. 2014, 56, 517–529. [Google Scholar] [CrossRef]
  9. Cozza, R.C.; Schön, C.G. Evidence of superposition between grooving abrasion and rolling abrasion. Tribol. Trans. 2015, 58, 875–881. [Google Scholar] [CrossRef]
  10. Frenk, A.; Kurtz, W. Microstructural effects on the sliding wear resistance of a cobalt-based alloy. Wear 1994, 174, 81–91. [Google Scholar] [CrossRef]
  11. Antony, K.C. Wear-resistant cobalt-base alloys. J. Miner. Met. Mater. Soc. TMS 1983, 35, 52–60. [Google Scholar] [CrossRef]
  12. Agrawal, S.C.; Ocken, H. The microstructure and galling wear of a laser-melted cobalt-base hard facing alloy. Wear 1990, 140, 223–233. [Google Scholar] [CrossRef]
  13. Shaha, M.; Bakshi, S.D. Three-body abrasive wear of carbide-free bainite, martensite and bainite martensite structure of similar hardness. Wear 2018, 402–403, 207–215. [Google Scholar] [CrossRef]
  14. Dodds, S.; Jones, A.; Cater, S. Tribological enhancement of AISI 420 martensitic stainless steel through friction-stir processing. Wear 2013, 302, 863–877. [Google Scholar] [CrossRef]
  15. Trivedi, H.K.; Wedeven, V.; Black, W. Effect of Silicon Nitride Ball on Adhesive Wear of Martensitic Stainless Steel Pyrowear 675 and AISI M-50 Races with Type II Ester Oil. Tribol. Trans. 2016, 59, 363–374. [Google Scholar] [CrossRef]
  16. Rozing, G.; Alar, V.; Marušić, V. Study of stainless steel resistance in conditions of tribocorrosion wear. Interdiscip. Descr. Complex Syst. 2015, 13, 461–471. [Google Scholar] [CrossRef]
  17. Scheuer, C.; Possoli, F.; Borges, P.; Cardoso, R.; Brunatto, S. AISI 420 martensitic stainless steel corrosion resistance enhancement by low-temperature plasma carburizing. Electrochim. Acta 2019, 317, 70–82. [Google Scholar] [CrossRef]
  18. Dalmau, A.; Richard, C.; Igual–Muñoz, A. Degradation mechanisms in martensitic stainless steels: Wear, corrosion and tribocorrosion appraisal. Tribol. Int. 2018, 121, 167–179. [Google Scholar] [CrossRef]
  19. Prieto, G.; Tuckart, W.R. Influence of cryogenic treatments on the wear behavior of AISI 420 martensitic stainless steel. J. Mater. Eng. Perform. 2017, 26, 5262–5271. [Google Scholar] [CrossRef]
  20. Li, Y.; He, Y.; Xiu, J.; Wang, W.; Zhu, Y.; Hu, B. Wear and corrosion properties of AISI 420 martensitic stainless steel treated by active screen plasma nitriding. Surf. Coat. Technol. 2017, 329, 184–192. [Google Scholar] [CrossRef]
  21. Isfahany, A.N.; Saghafian, H.; Borhani, G. The effect of heat treatment on mechanical properties and corrosion behavior of AISI420 martensitic stainless steel. J. Alloys Compd. 2011, 509, 3931–3936. [Google Scholar] [CrossRef]
  22. Pan, L.; Kwok, C.; Lo, K. Enhancement in hardness and corrosion resistance of AISI 420 martensitic stainless steel via friction stir processing. Surf. Coat. Technol. 2018, 357, 339–347. [Google Scholar] [CrossRef]
  23. Samih, Y.; Marcos, G.; Stein, N.; Allain, N.; Fleury, E.; Dong, C.; Grosdidier, T. Microstructure modifications and associated hardness and corrosion improvements in the AISI 420 martensitic stainless steel treated by High Current Pulsed Electron Beam (HCPEB). Surf. Coat. Technol. 2014, 259, 737–745. [Google Scholar] [CrossRef]
  24. Toro, A.; Sinatora, A.; Tanaka, D.; Tschiptschin, A. Corrosion–erosion of nitrogen bearing martensitic stainless steels in seawater–quartz slurry. Wear 2001, 251, 1257–1264. [Google Scholar] [CrossRef]
  25. López, D.; Congote, J.; Cano, J.; Toro, A.; Tschiptschin, A. Effect of particle velocity and impact angle on the corrosion–erosion of AISI 304 and AISI 420 stainless steels. Wear 2005, 259, 118–124. [Google Scholar] [CrossRef]
  26. Venske, A.F.; de Castro, V.V.; da Costa, E.M.; dos Santos, C.A. Sliding wear behavior of an AISI 440b martensitic stainless steel lubricated with biodiesel and diesel–biodiesel blends. J. Mater. Eng. Perform. 2018, 27, 5427–5437. [Google Scholar] [CrossRef]
  27. Mischler, S.; Spiegel, A.; Landolt, D. The role of passive oxide films on the degradation of steel in tribocorrosion systems. Wear 1999, 225–229, 1078–1087. [Google Scholar] [CrossRef]
  28. Rodríguez-Bravo, G.; Vite-Torres, M.; Godínez-Salcedo, J. Corrosion rate and wear mechanisms comparison for AISI 410 stainles steel exposed to pure corrosion and abrasion-corrosion in a simulated marine environment. Tribol. Ind. 2019, 41, 394–400. [Google Scholar] [CrossRef]
  29. Aquino, J.M.; Della Rovere, C.A.; Kuri, S.E. Localized corrosion susceptibility of supermartensitic stainless steel in welded joints, Corrosion. Corrosion 2008, 64, 35–39. [Google Scholar] [CrossRef]
  30. Dalmau, A.; Rmili, W.; Richard, C.; Igual–Muñoz, A. Tribocorrosion behavior of new martensitic stainless steels in sodium chloride solution. Wear 2016, 368–369, 146–155. [Google Scholar] [CrossRef] [Green Version]
  31. Ben Saada, F.; Elleuch, K.; Ponthiaux, P. On the Tribocorrosion responses of two stainless steels. Tribol. Trans. 2017, 61, 53–60. [Google Scholar] [CrossRef]
  32. Wu, H.; Li, Y.; Lu, Y.; Li, Z.; Cheng, X.; Hasan, M.; Zhang, H.; Jiang, Z. Influences of load and microstructure on tribocorrosion behaviour of high strength hull steel in saline solution. Tribol. Lett. 2019, 67, 124. [Google Scholar] [CrossRef]
  33. Stachowiak, A.; Zwierzycki, W. Tribocorrosion modeling of stainless steel in a sliding pair of pin-on-plate type. Tribol. Int. 2011, 44, 1216–1224. [Google Scholar] [CrossRef]
  34. Esfandiari, M.; Dong, H. The corrosion and corrosion–wear behaviour of plasma nitrided 17-4PH precipitation hardening stainless steel. Surf. Coat. Technol. 2007, 202, 466–478. [Google Scholar] [CrossRef]
  35. Lin, N.; Xie, F.; Yang, H.; Tian, W.; Wang, H.; Tang, B. Assessments on friction and wear behaviors of P110 steel and chromizing coating sliding against two counterparts under dry and wet conditions. Appl. Surf. Sci. 2012, 258, 4960–4970. [Google Scholar] [CrossRef]
  36. Ben Saada, F.; Antar, Z.; Elleuch, K.; Ponthiaux, P.; Gey, N. The effect of nanocrystallized surface on the tribocorrosion behavior of 304L stainless steel. Wear 2018, 394–395, 71–79. [Google Scholar] [CrossRef] [Green Version]
  37. Prezeau, T.; Muller, T.; Dransart, E.; Giraud, Y. Amélioration par un prétraitement mécanique de NanoPeening® des performances des traitements thermochimiques (Improvement by a mechanical pretreatment of NanoPeening® of the performance of thermochemical treatments). Traitements Matér. 2011, 412, 37–43. (In French) [Google Scholar]
  38. Erdman, N.; Campbell, R.; Asahina, S. Precise SEM cross section polishing via argon beam milling. Microsc. Today 2006, 14, 22–25. [Google Scholar] [CrossRef] [Green Version]
  39. Ben Saada, M.; Gey, N.; Beausir, B.; Iltis, X.; Mansour, H.; Maloufi, N. Sub-boundaries induced by dislocational creep in uranium dioxide analyzed by advanced diffraction and channeling electron microscopy. Mater. Charact. 2017, 133, 112–121. [Google Scholar] [CrossRef]
  40. Chui, P.; Sun, K.; Sun, C.; Yang, X.; Shan, T. Effect of surface nanocrystallization induced by fast multiple rotation rolling on hardness and corrosion behavior of 316L stainless steel. Appl. Surf. Sci. 2011, 257, 6787–6791. [Google Scholar] [CrossRef]
  41. Wang, R.; Zheng, Z.; Zhou, Q.; Gao, Y. Effect of surface nanocrystallization on the sensitization and desensitization behavior of Super304H stainless steel. Corros. Sci. 2016, 111, 728–741. [Google Scholar] [CrossRef]
  42. Lee, J.B. Effects of alloying elements, Cr, Mo and N on repassivation characteristics of stainless steels using the abrading electrode technique. Mater. Chem. Phys. 2006, 99, 224–234. [Google Scholar] [CrossRef]
  43. Bastidas, J.M.; Torres, C.L.; Cano, E.; Polo, J.L. Influence of molybdenum on passivation of polarized stainless steels in a chloride environment. Corros. Sci. 2002, 44, 625–633. [Google Scholar] [CrossRef] [Green Version]
  44. Bagherifard, S.; Fernandez-Pariente, I.; Ghelichi, R.; Guagliano, M. Effect of severe shot peening on microstructure and fatigue strength of cast iron. Int. J. Fatigue 2014, 65, 64–70. [Google Scholar] [CrossRef]
  45. Wang, T.; Yu, J.; Dong, B. Surface nanocrystallization induced by shot peening and its effect on corrosion resistance of 1Cr18Ni9Ti stainless steel. Surf. Coat. Technol. 2006, 200, 4777–4781. [Google Scholar] [CrossRef]
Figure 1. (a) SEM micrograph in secondary electron mode of cross-sectional microstructure of NP sample at large scale. (b) Zoom in on the square region in (a).
Lubricants 10 00304 g001
Figure 2. Tribocorrosion set-up.
Lubricants 10 00304 g002
Figure 3. Tribocorrosion test protocol.
Lubricants 10 00304 g003
Figure 4. EBSD map acquired in the cross-section of NP sample: (a) Kikuchi pattern quality map, (b) IPF map shows martensite grains orientation, and (c) stereographic triangle of IPF color map. Notice that the indexing rate was only 82%.
Lubricants 10 00304 g004
Figure 5. Texture developed in zone B, represented by IPF, showing strong <101>//Y texture formation.
Lubricants 10 00304 g005
Figure 6. Corrosion tests without mechanical loading: (a) open circuit potential as a time function, (b) electrochemical impedance spectra (Nyquist plot) of NT and NP AISI 420 samples, immersed in boric acid and lithium hydroxide solution. Zim and Zre are, respectively, the imaginary and the real part of the impedance.
Lubricants 10 00304 g006
Figure 7. Tribocorrosion tests under continuous sliding: (a) open circuit potential evolution and (b) electrochemical impedance spectra (Nyquist plot) of NT and NP samples, immersed in boric acid and lithium hydroxide solutions.
Lubricants 10 00304 g007
Figure 8. Tribocorrosion tests under intermittent sliding: open circuit potential evolution of NT and NP samples immersed in boric acid and lithium hydroxide solutions.
Lubricants 10 00304 g008
Figure 9. SEM micrographs of the wear tracks observed in (a) NT and (b) NP samples under continuous sliding.
Lubricants 10 00304 g009
Figure 10. SEM micrographs of the wear tracks observed on (a) NT and (b) NP samples under intermittent sliding.
Lubricants 10 00304 g010
Figure 11. 3D plot wear track profile obtained on NT samples (a) under continuous and (b) intermittent sliding.
Lubricants 10 00304 g011
Figure 12. 3D plot wear track profile obtained on NP samples (a) under continuous and (b) intermittent sliding.
Lubricants 10 00304 g012
Figure 13. Contribution of wear obtained on NT and NP samples under continuous and intermittent sliding against an alumina pin (5 N, 120 rpm) in boric acid and lithium hydroxide solutions.
Lubricants 10 00304 g013
Table 1. Surface chemical composition (wt. %) of the AISI 420 NT and NP samples.
ElementsCSiMnPSCrNiMo
NT sample0.30.360.640.020.02130.220.04
NP sample0.020.371.60.030.0416.510.142.2
Table 2. Tribocorrosion components obtained on NT and NP samples under continuous and intermittent sliding.
NT SamplesNP Samples
SlidingContinuous IntermittentContinuousIntermittent
Wcact (cm3/cycle)4.24 × 10−81.73 × 10−72.86 × 10−81.14 × 10−7
Wcrepass (cm3/cycle)-1.65 × 10−11-6.89 × 10⁻¹²
Wmact (cm3/cycle)8.1 × 10−81.06 × 10−66.48 × 10−78.49 × 10−7
Wmrepass (cm3/cycle)-1.99 × 10−7-4.51 × 10⁻⁸
Publisher’s Note: MDPI stays neutral with regard to jurisdictional claims in published maps and institutional affiliations.

