Author Contributions
Conceptualization, A.M., F.B., and J.S.; conduct of study, A.M., F.B., Y.L., Y.-P.Z., and J.S.; formal analysis, A.M., F.B., and J.S.; resources, A.M., F.B., Y.L., T.A., Y.-P.Z., Y.Z., and S.M.; writing—original draft preparation, A.M. and J.S.; writing—review and editing, A.M., F.B., Y.L., T.A., Y.-P.Z., F.A., Y.Z., S.M., and J.S. All authors have read and agreed to the published version of the manuscript.
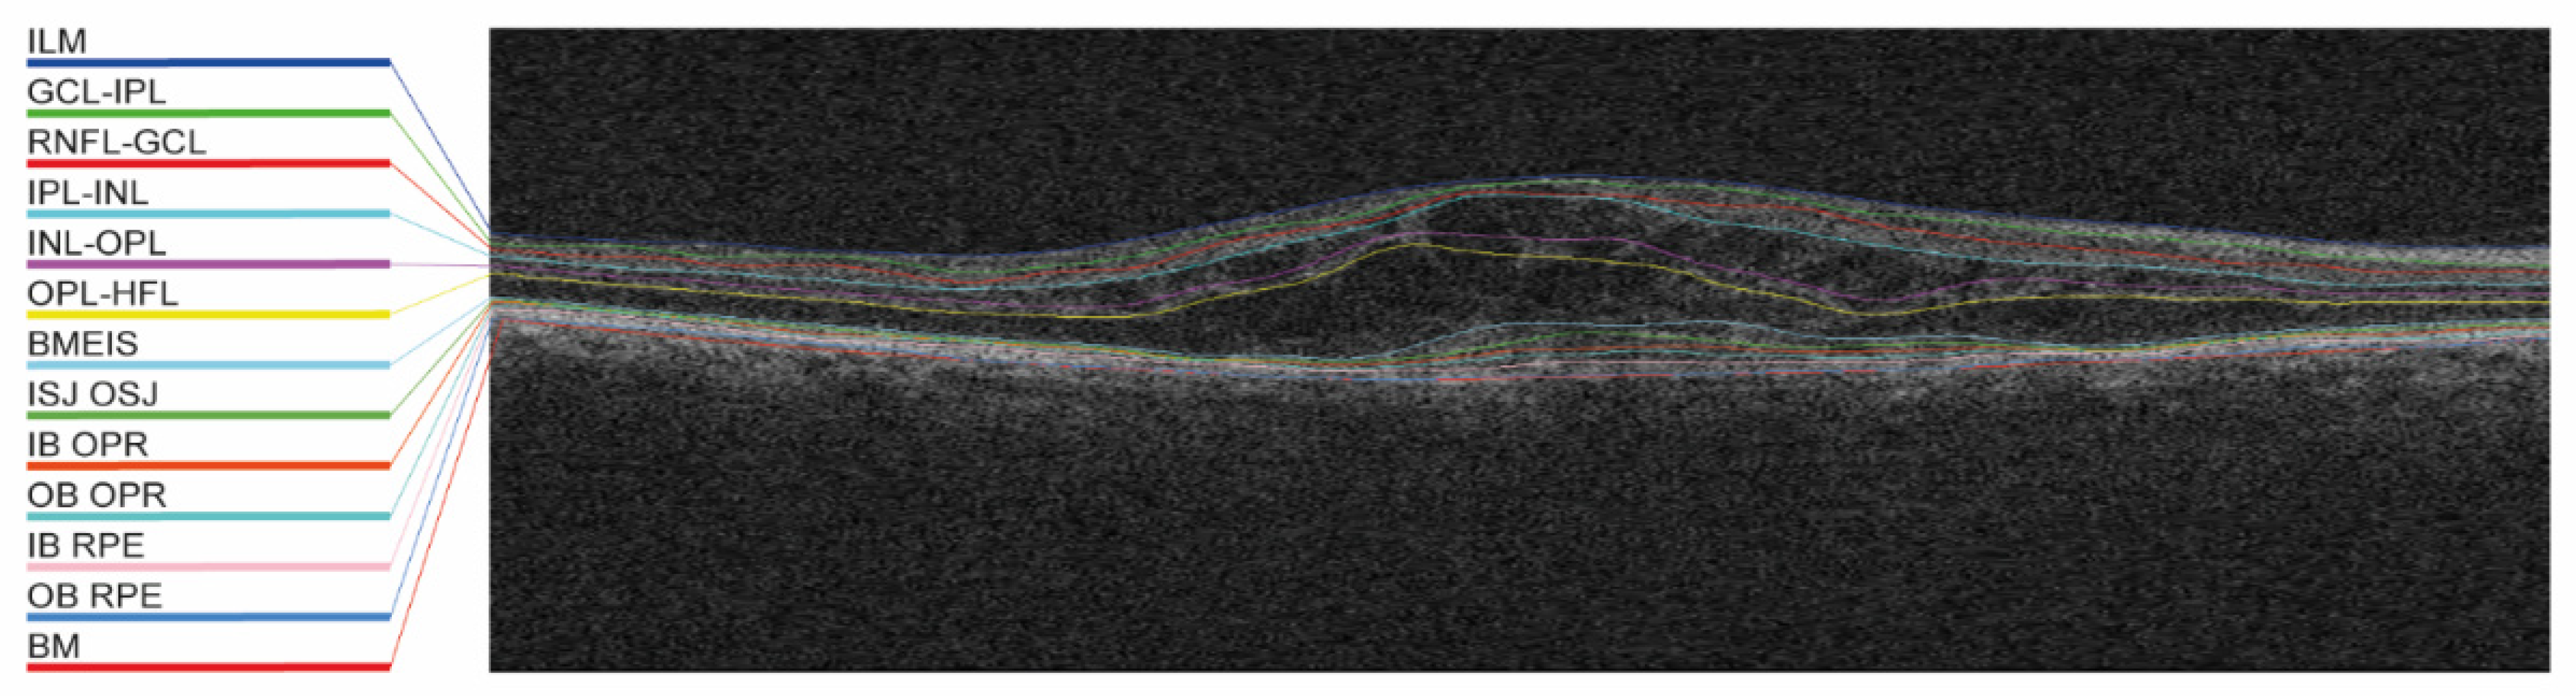
Figure 1.
Example of the automated layer segmentation of 13 retinal layers. BM, Bruch’s membrane; BMEIS, boundary of myoid and ellipsoid inner segments; GCL-IPL, ganglion cell layer-inner plexiform layer; IB OPR, inner boundary outer photoreceptor; IB RPE, inner boundary retinal pigment epithelium; ILM, internal limiting membrane; INL-OPL, inner nuclear layer-outer plexiform layer; IPL-INL, inner plexiform layer-inner nuclear layer; ISJ OSJ, inner segment/outer segment junction; OB OPR, outer boundary outer photoreceptor; OB RPE, outer boundary retinal pigment epithelium; OPL-HFL, outer plexiform layer-Henle’s fiber layer; and RNFL-GCL, retinal nerve fiber layer-ganglion cell layer.
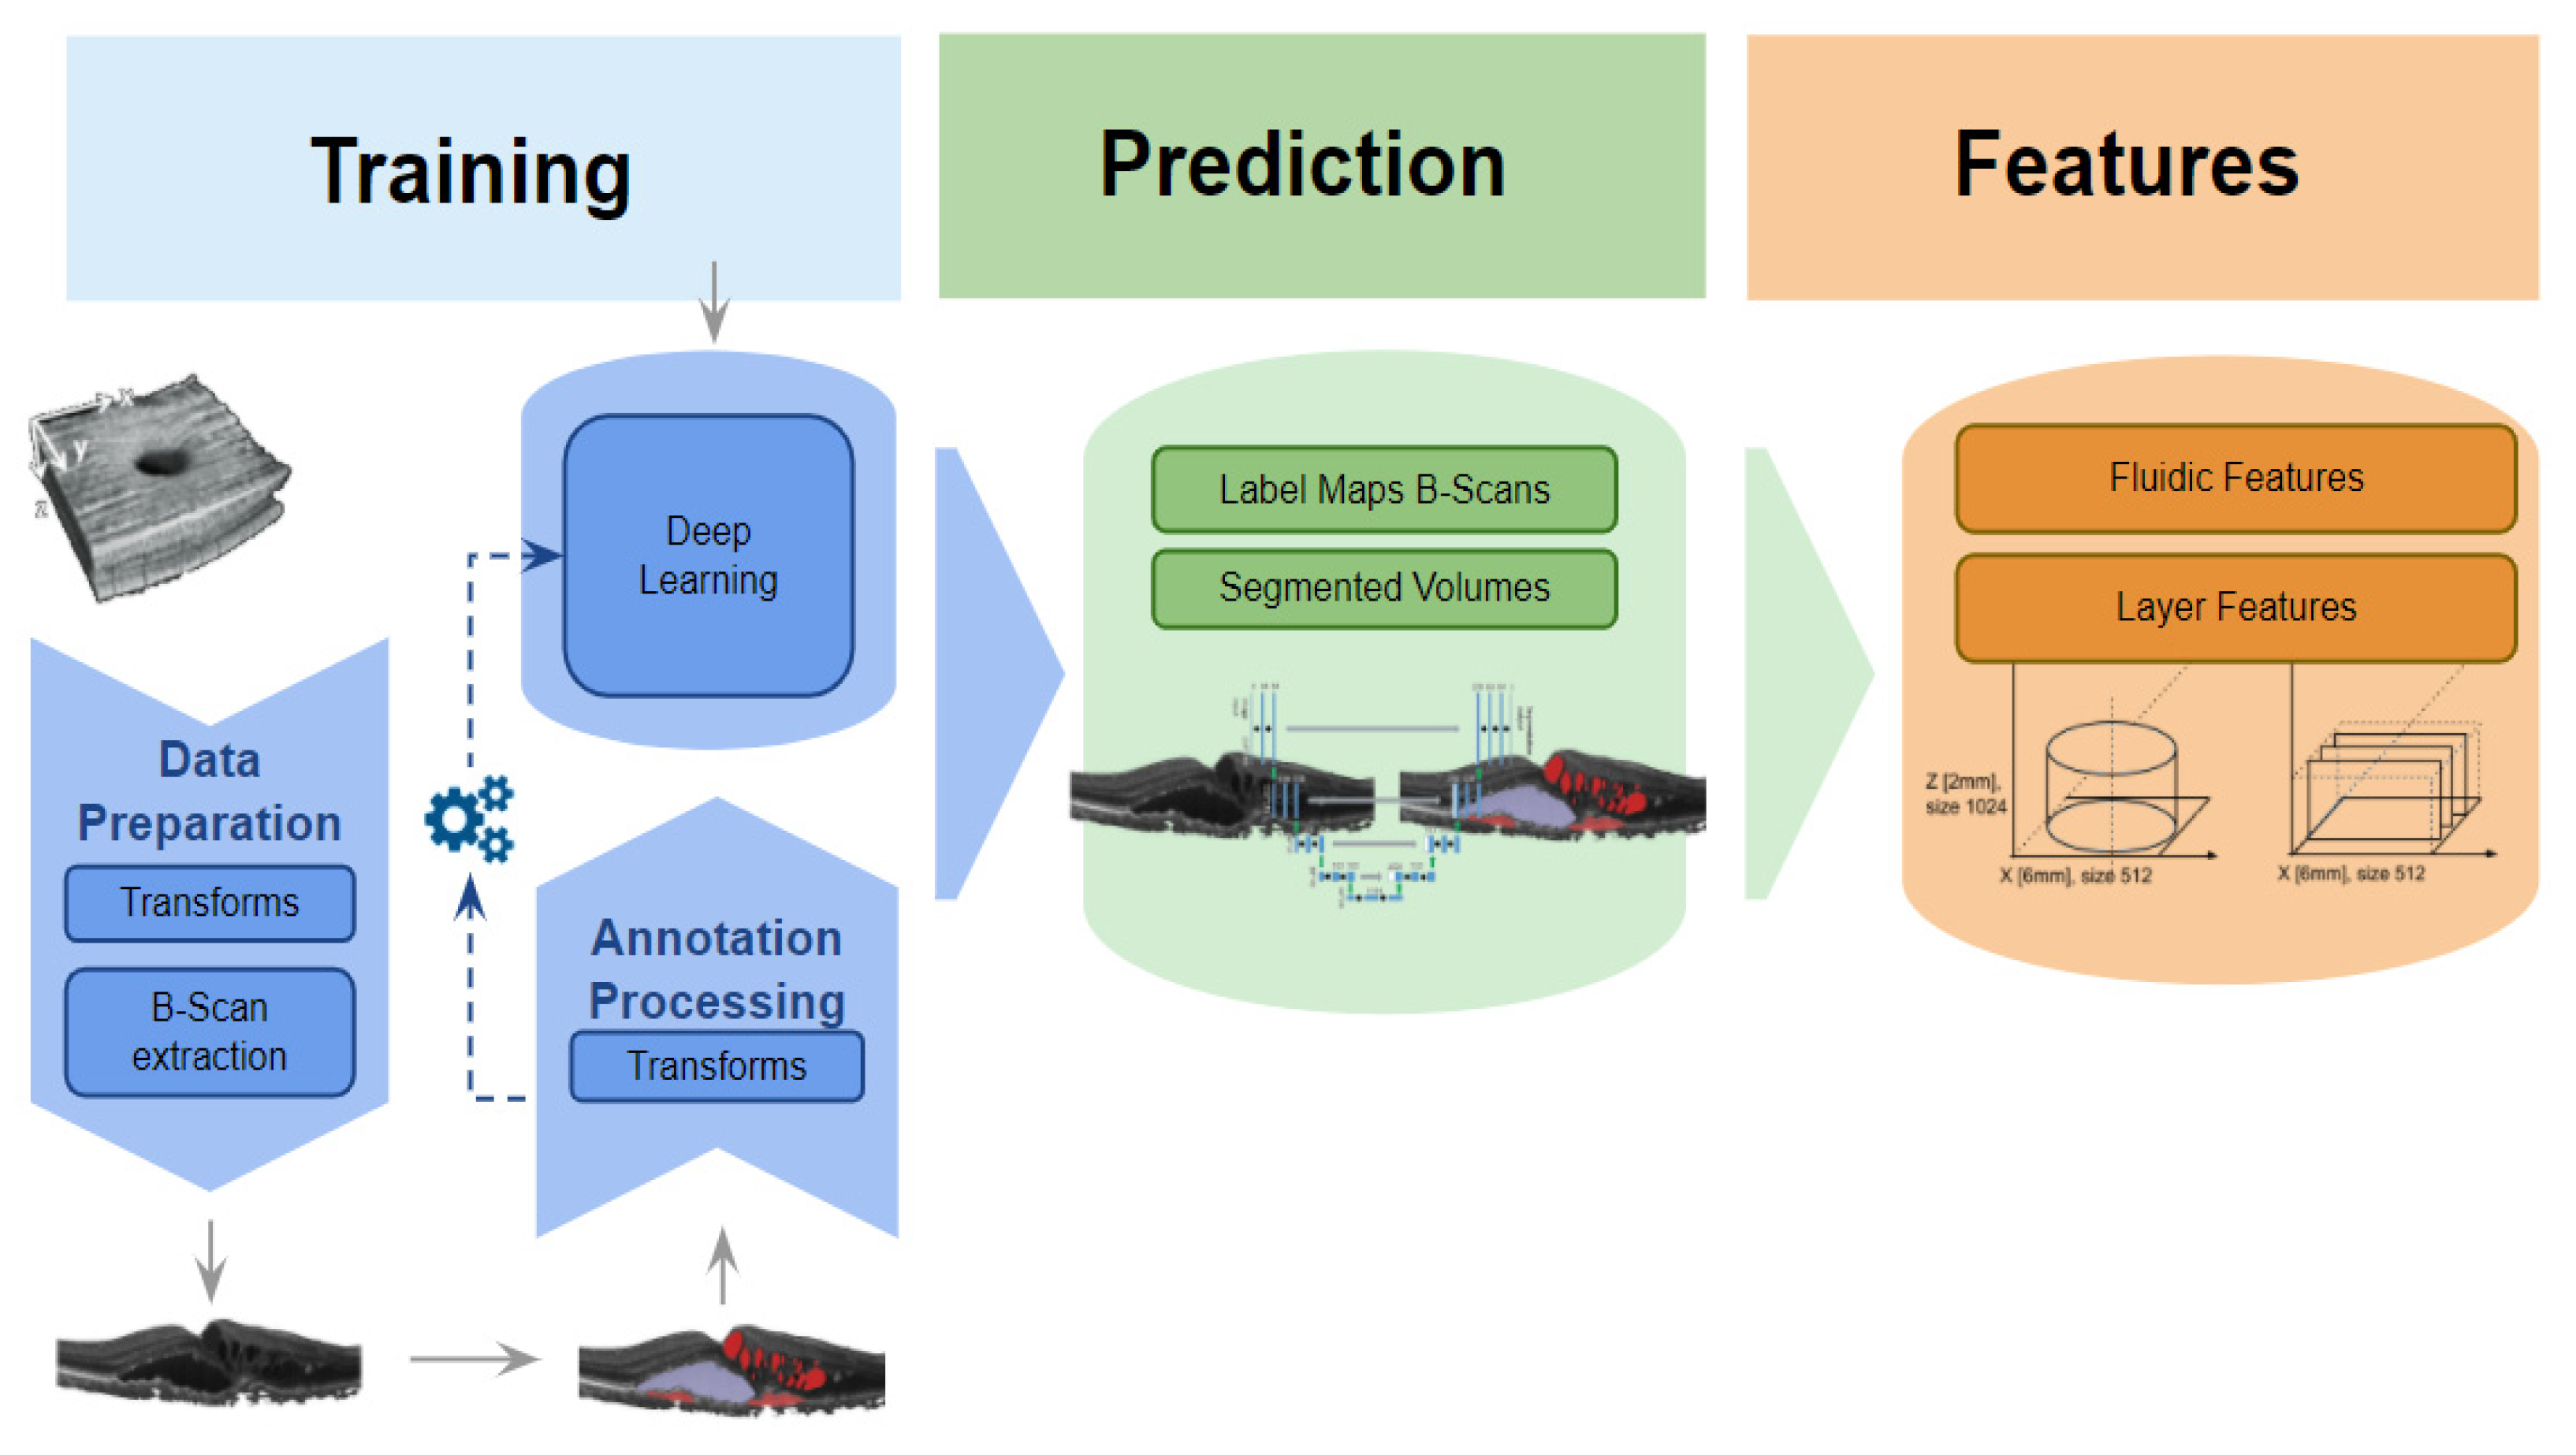
Figure 2.
Segmentation pipeline. Sketch of the segmentation pipeline, involving training, prediction, and feature calculation for both fluidic and layer features. See
Supplementary Table S2 for a detailed feature list.
Figure 2.
Segmentation pipeline. Sketch of the segmentation pipeline, involving training, prediction, and feature calculation for both fluidic and layer features. See
Supplementary Table S2 for a detailed feature list.
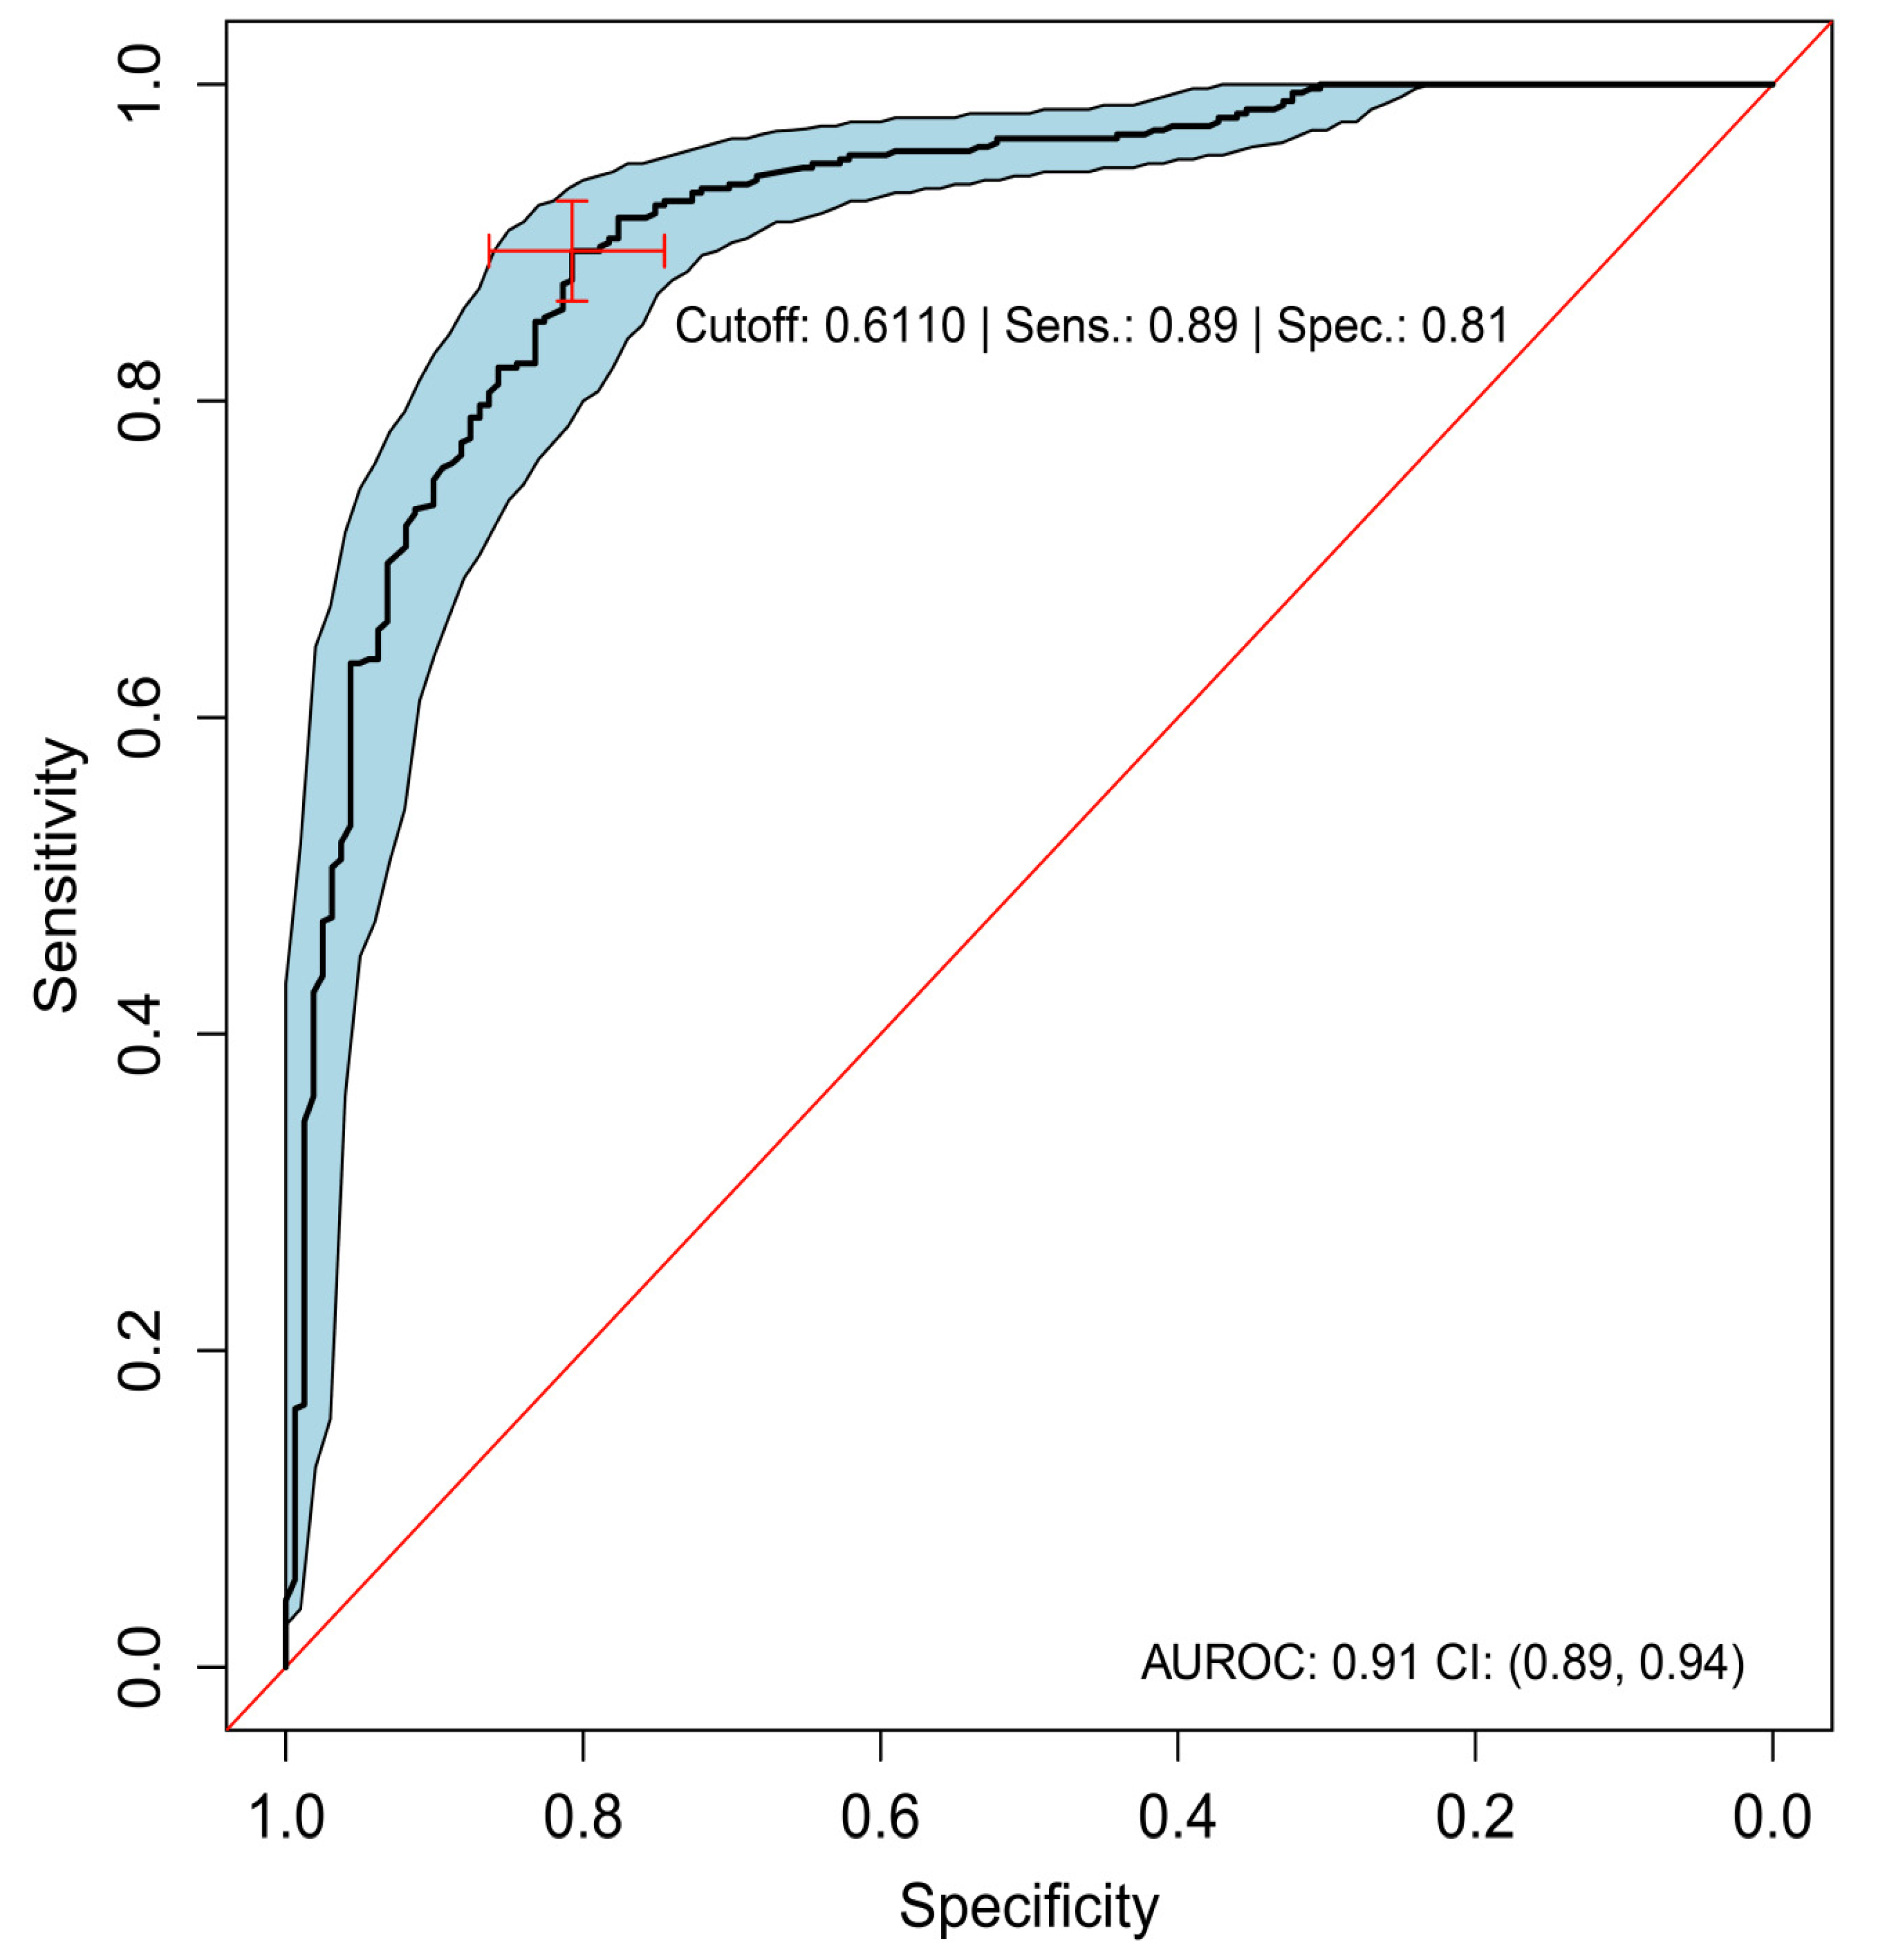
Figure 3.
ROC analysis of predominantly classic versus occult (best-tuned performance). Sensitivity versus specificity for all possible ROC cutoff points with respect to the predicted occult scores in HARBOR, including 95% CIs (bootstrapped). The location of the red crosshair indicates the operating point of the model. AUROC, area under the receiver operating characteristic; FA, fluorescein angiography; NEG, negative; POS, positive; ROC, receiver operating characteristic; Sens, sensitivity; and Spec, specificity.
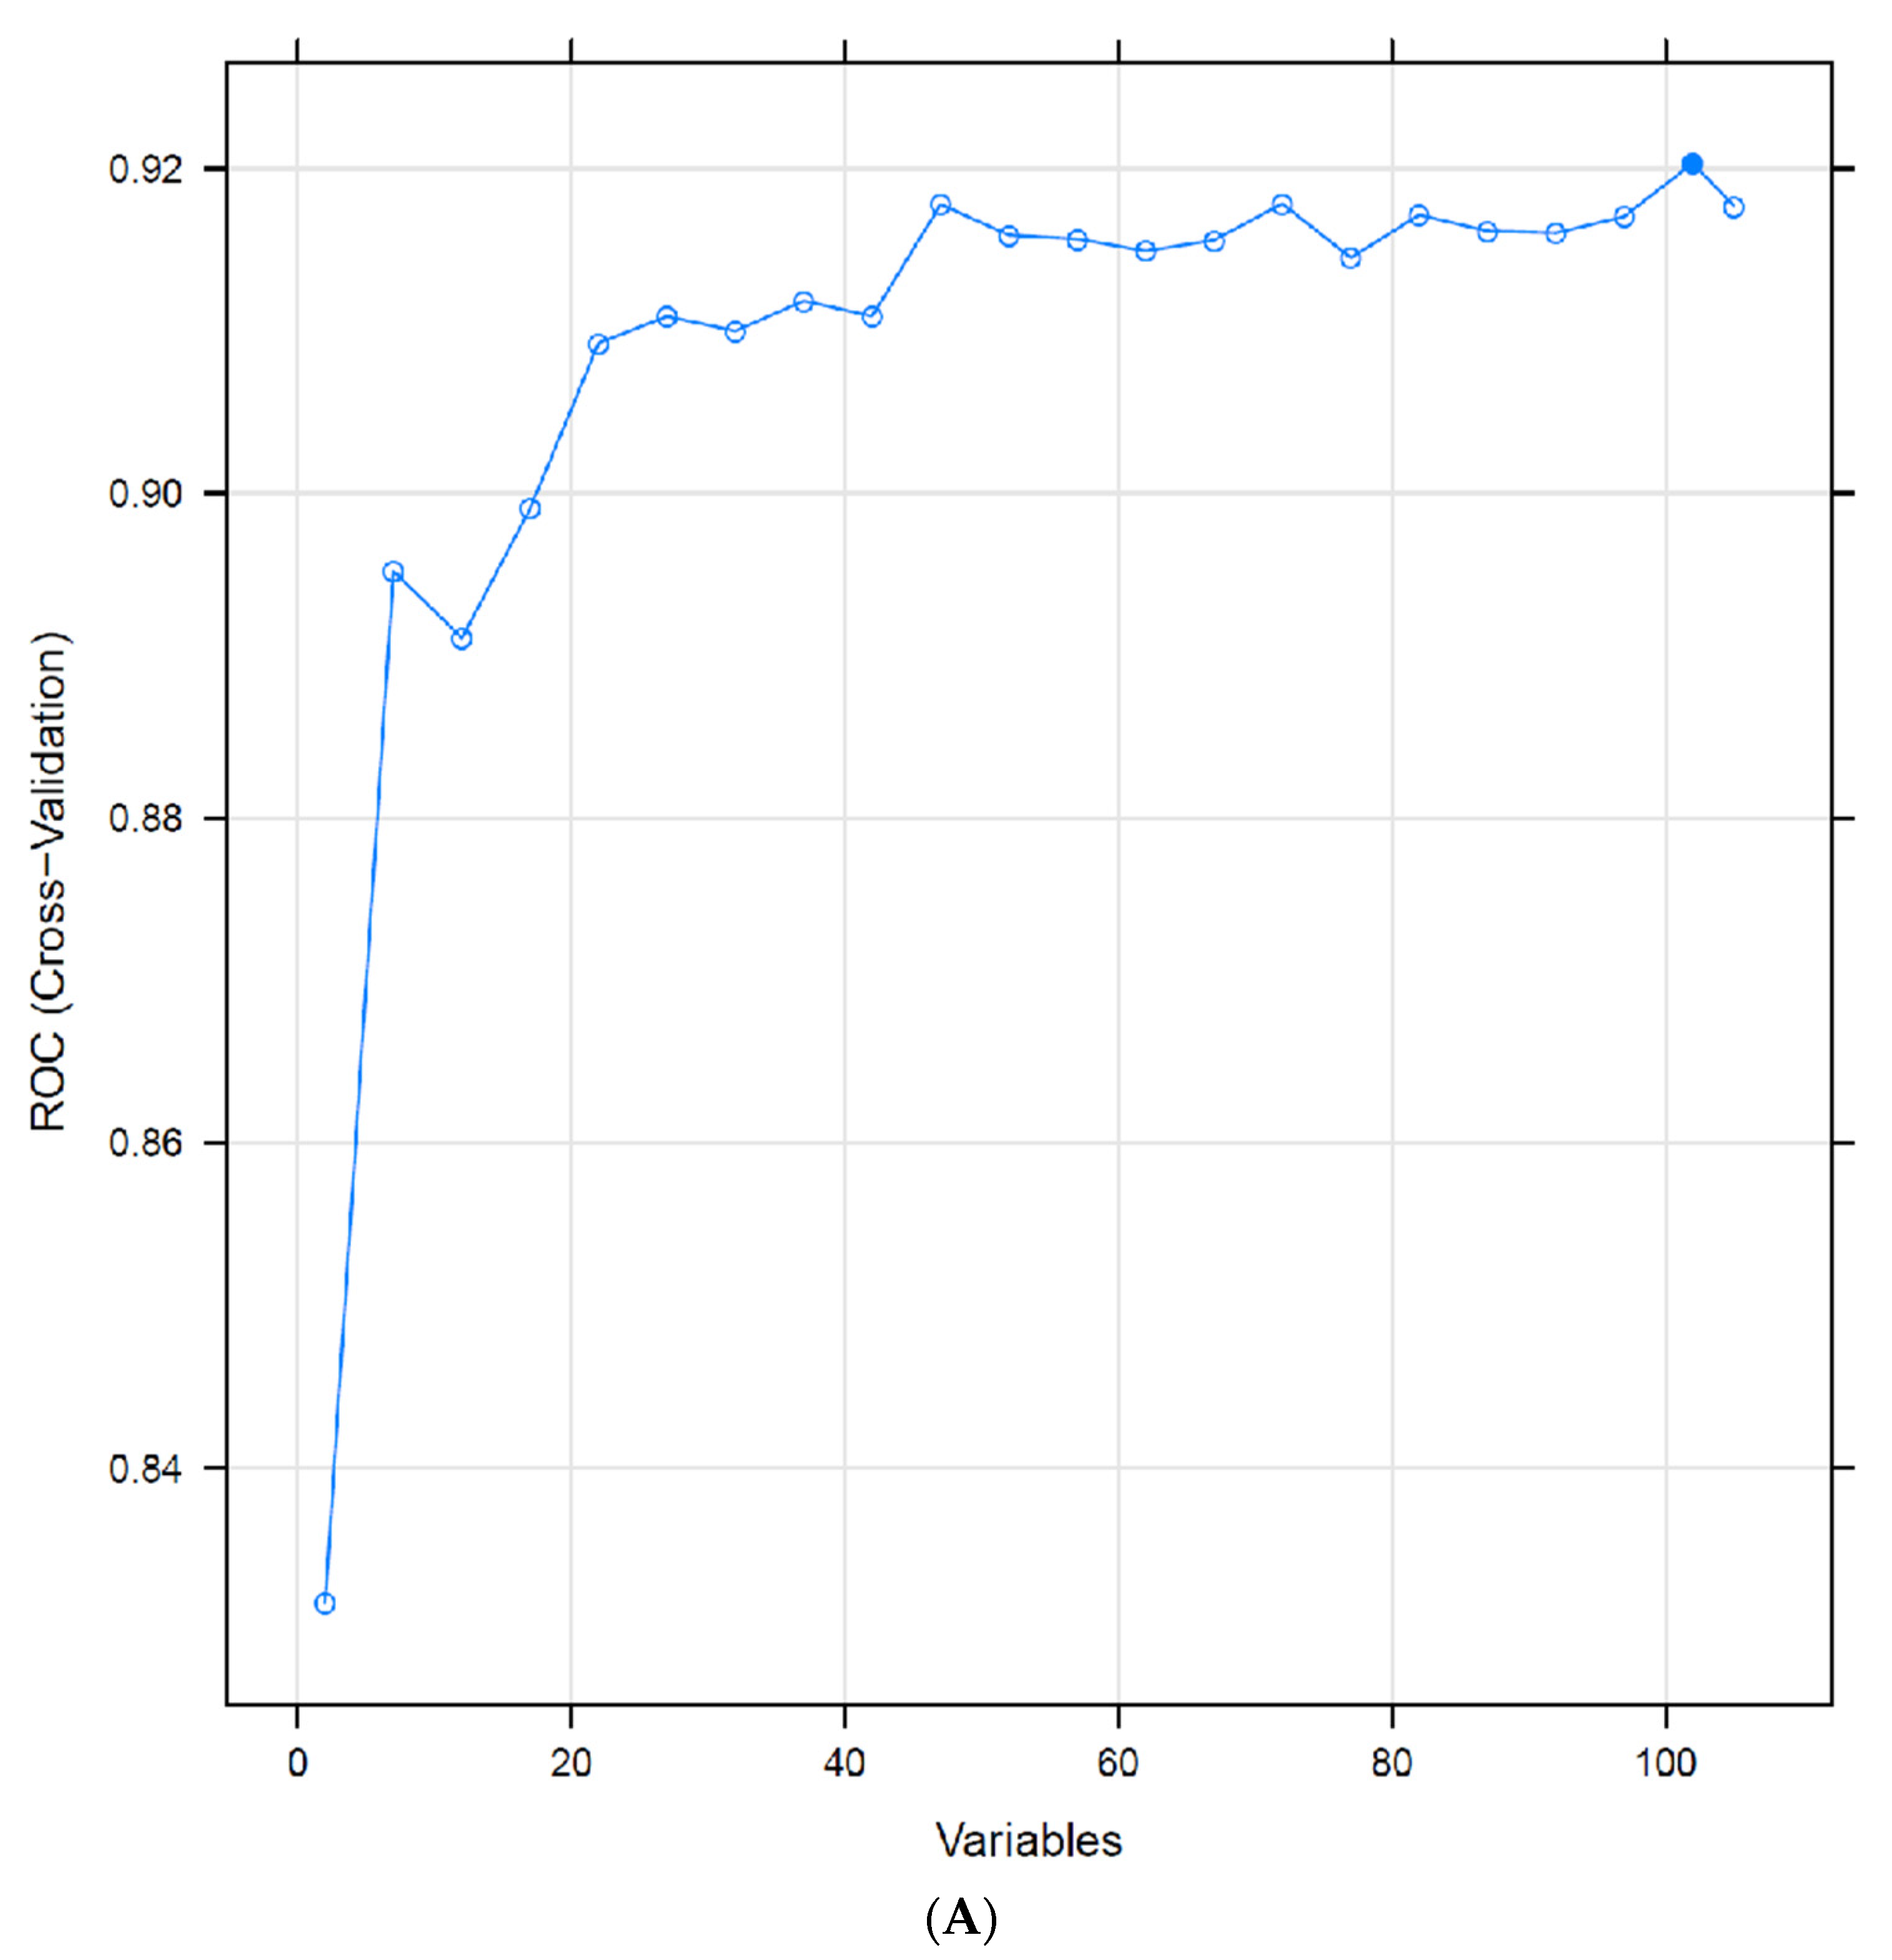
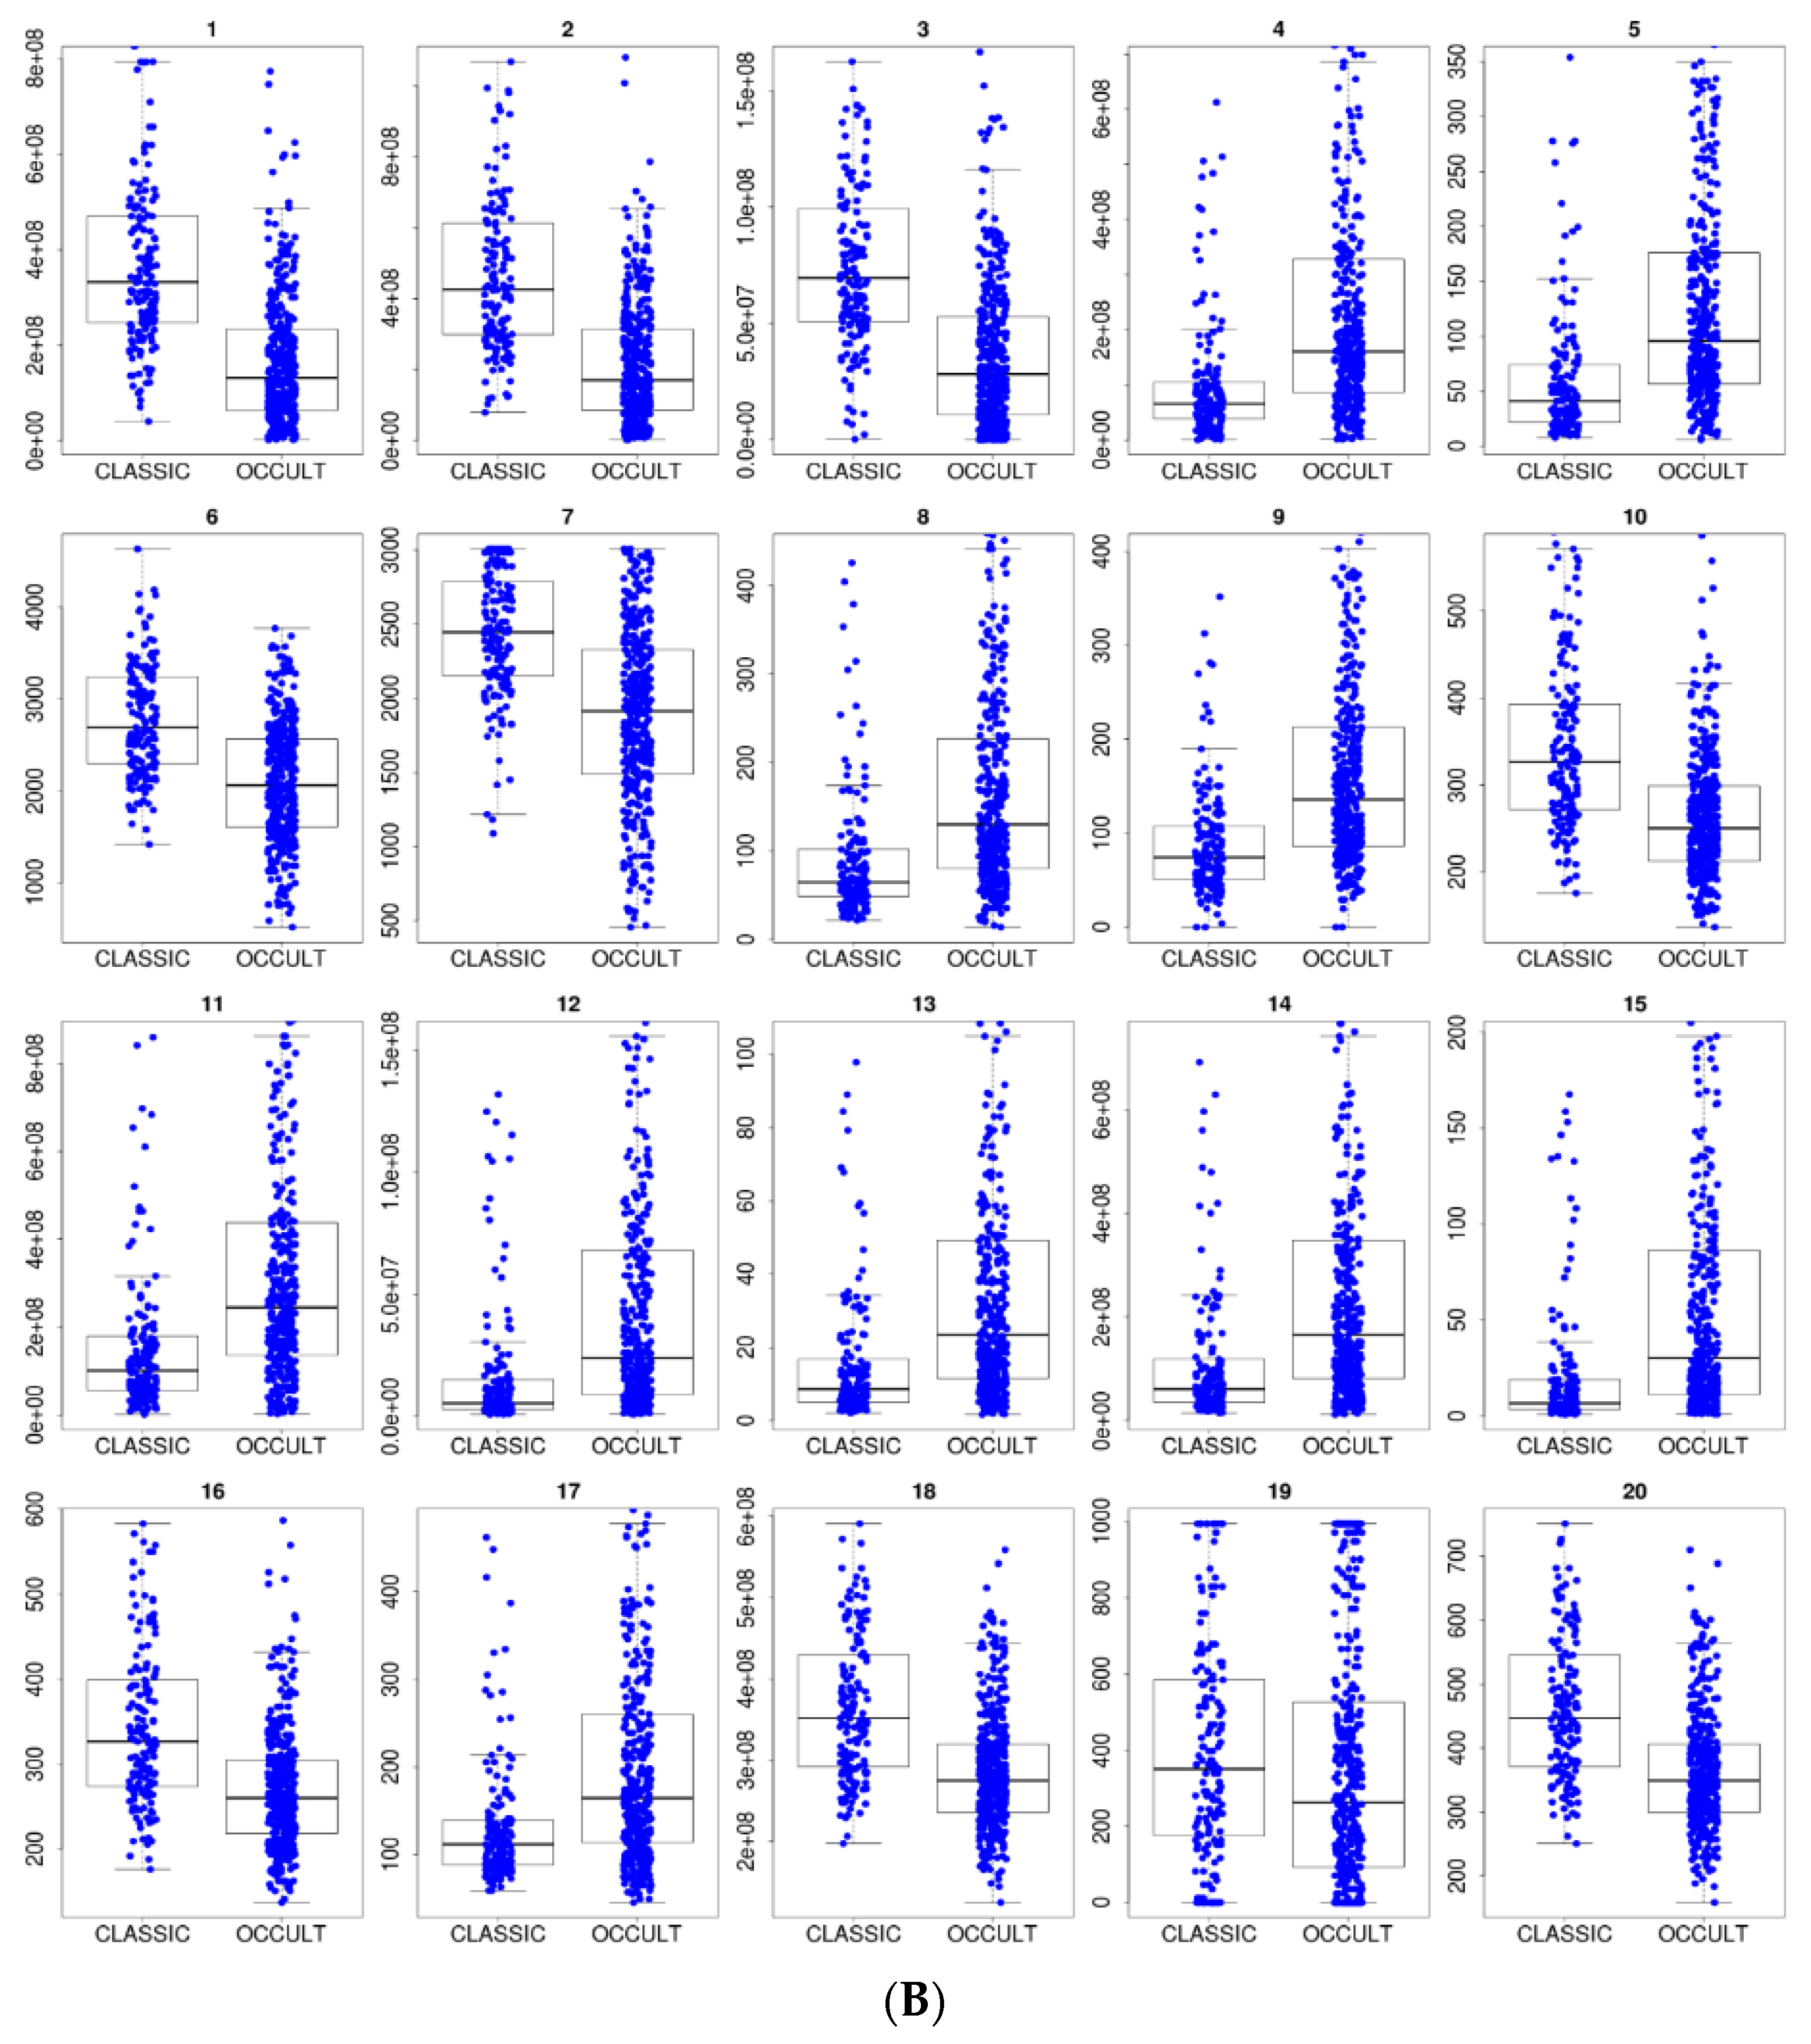
Figure 4.
(A) Recursive feature elimination cross-validation. Optimal performance for predominantly classic versus occult was reached with 101 features out of 106, and only 21 features were necessary to sustain the average model performance of 91% AUROC. (B) Distribution of the top 20 feature values in the training data (predominantly classic vs. occult classes).
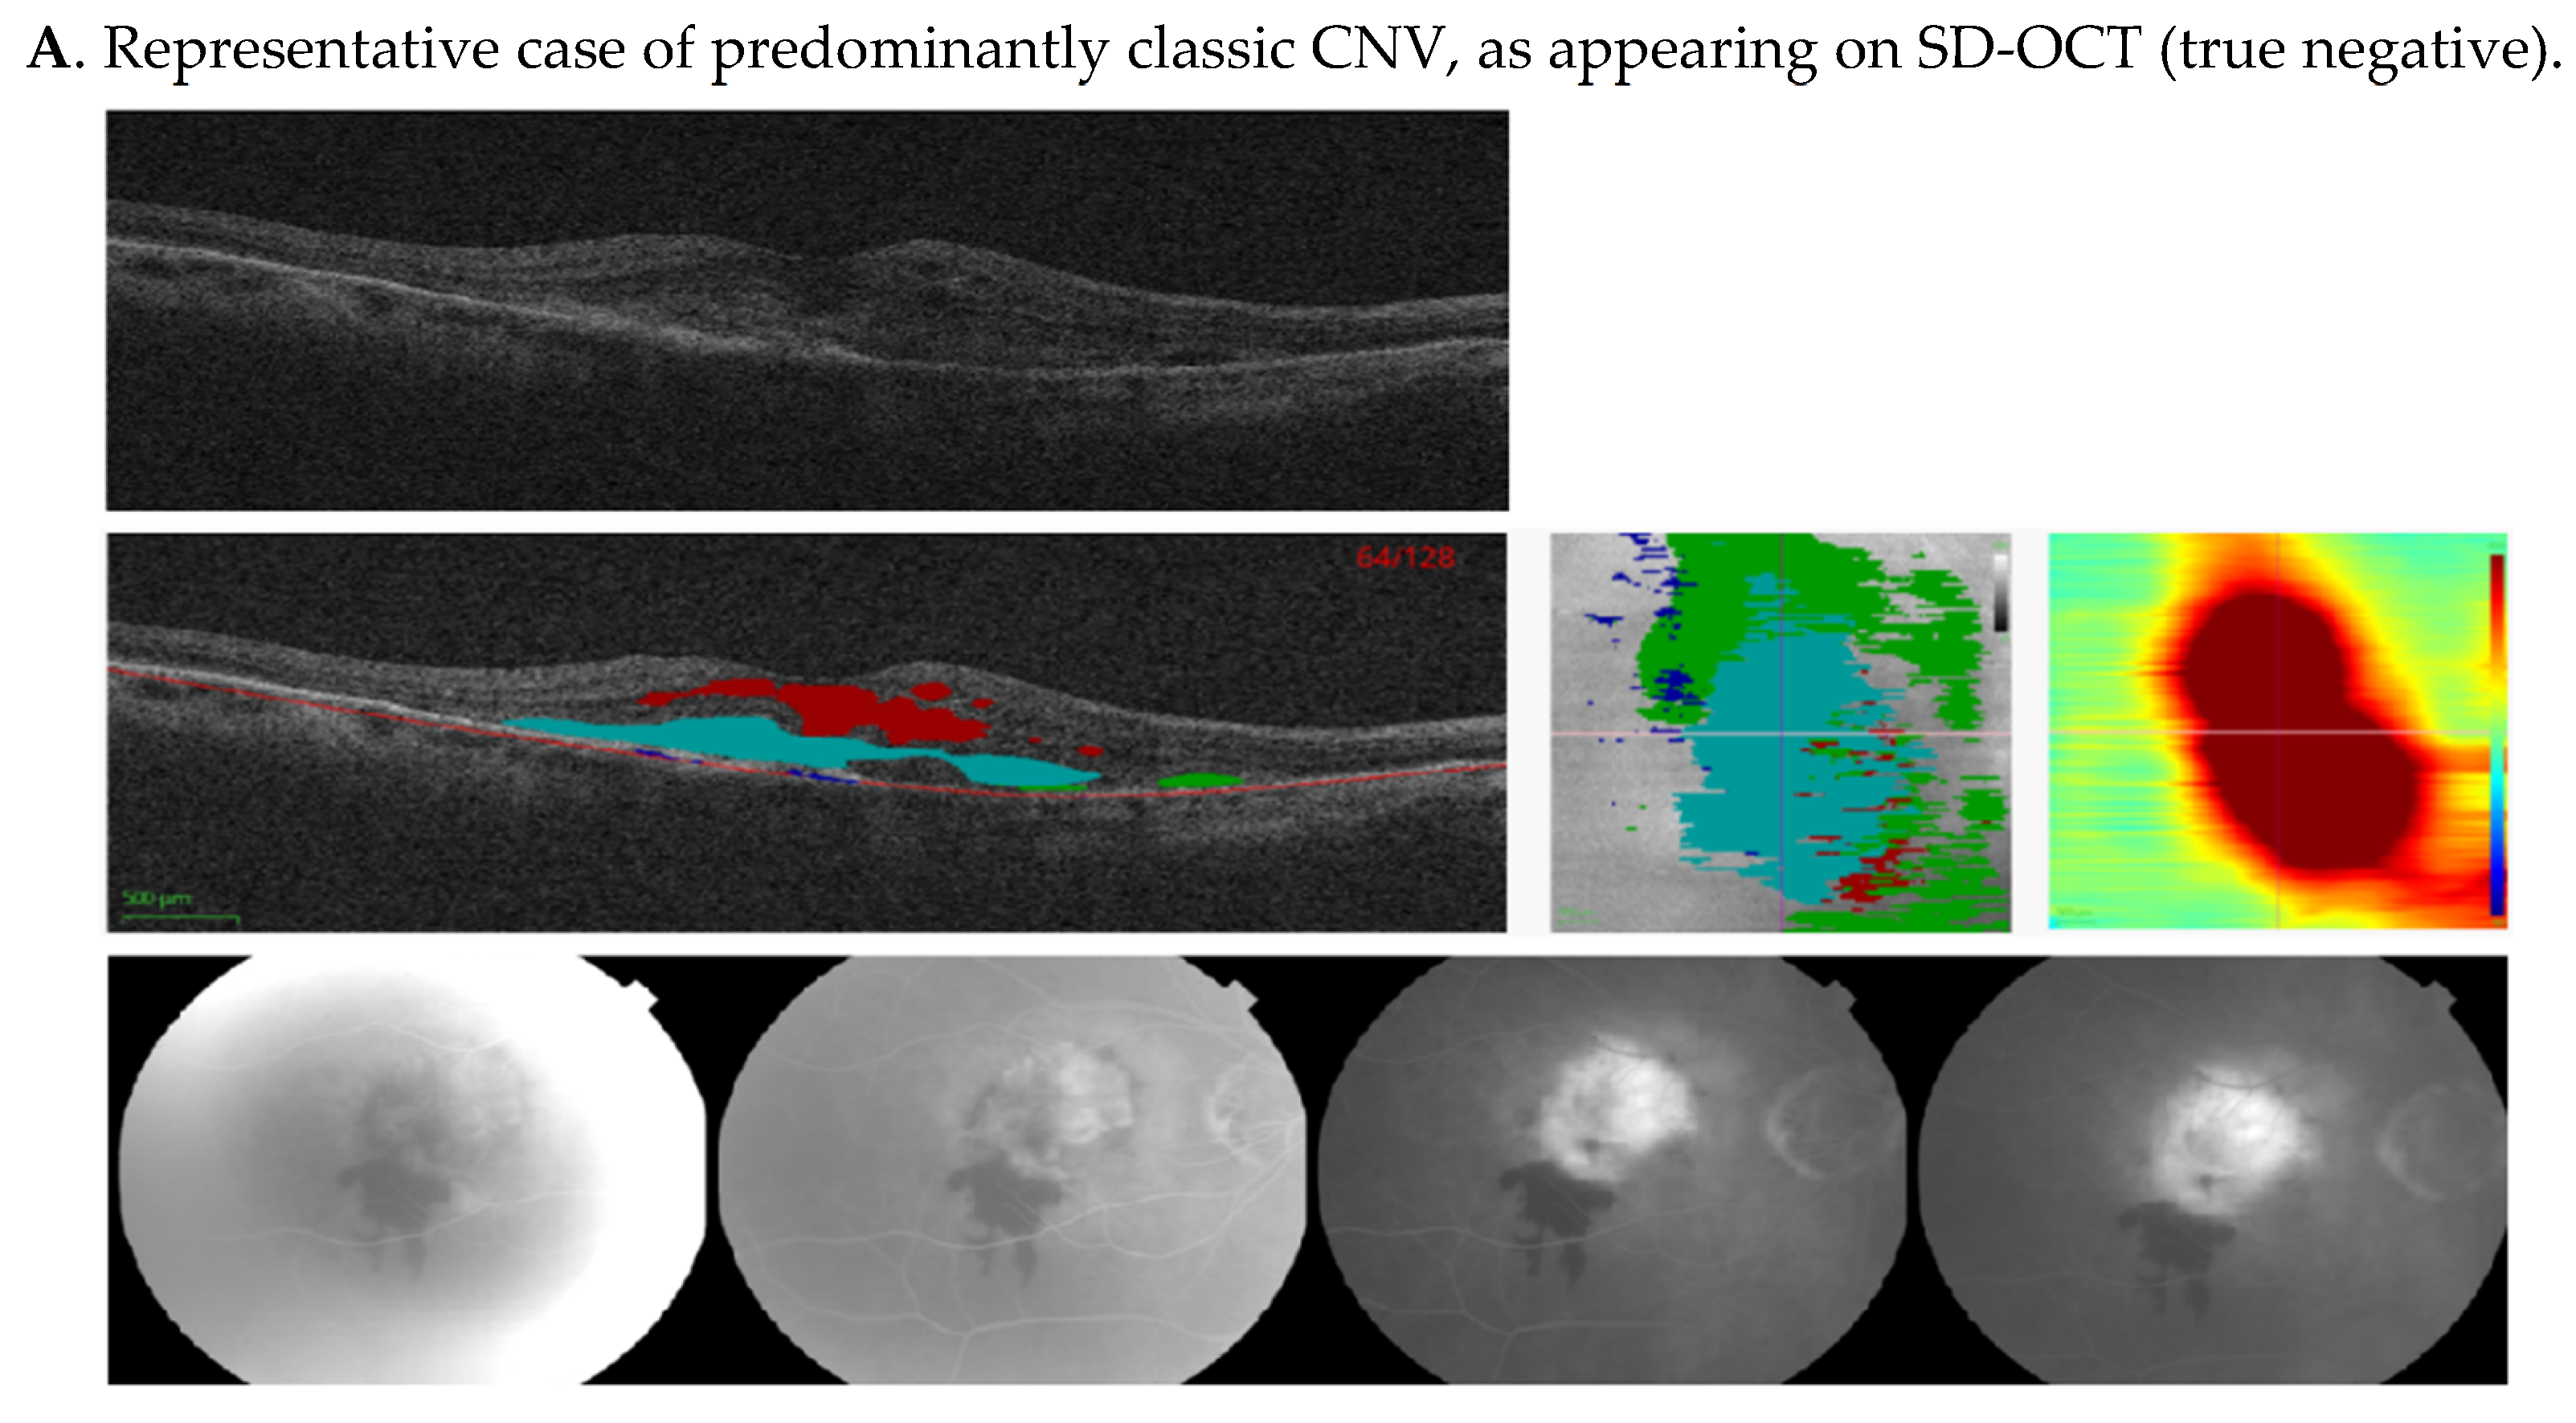
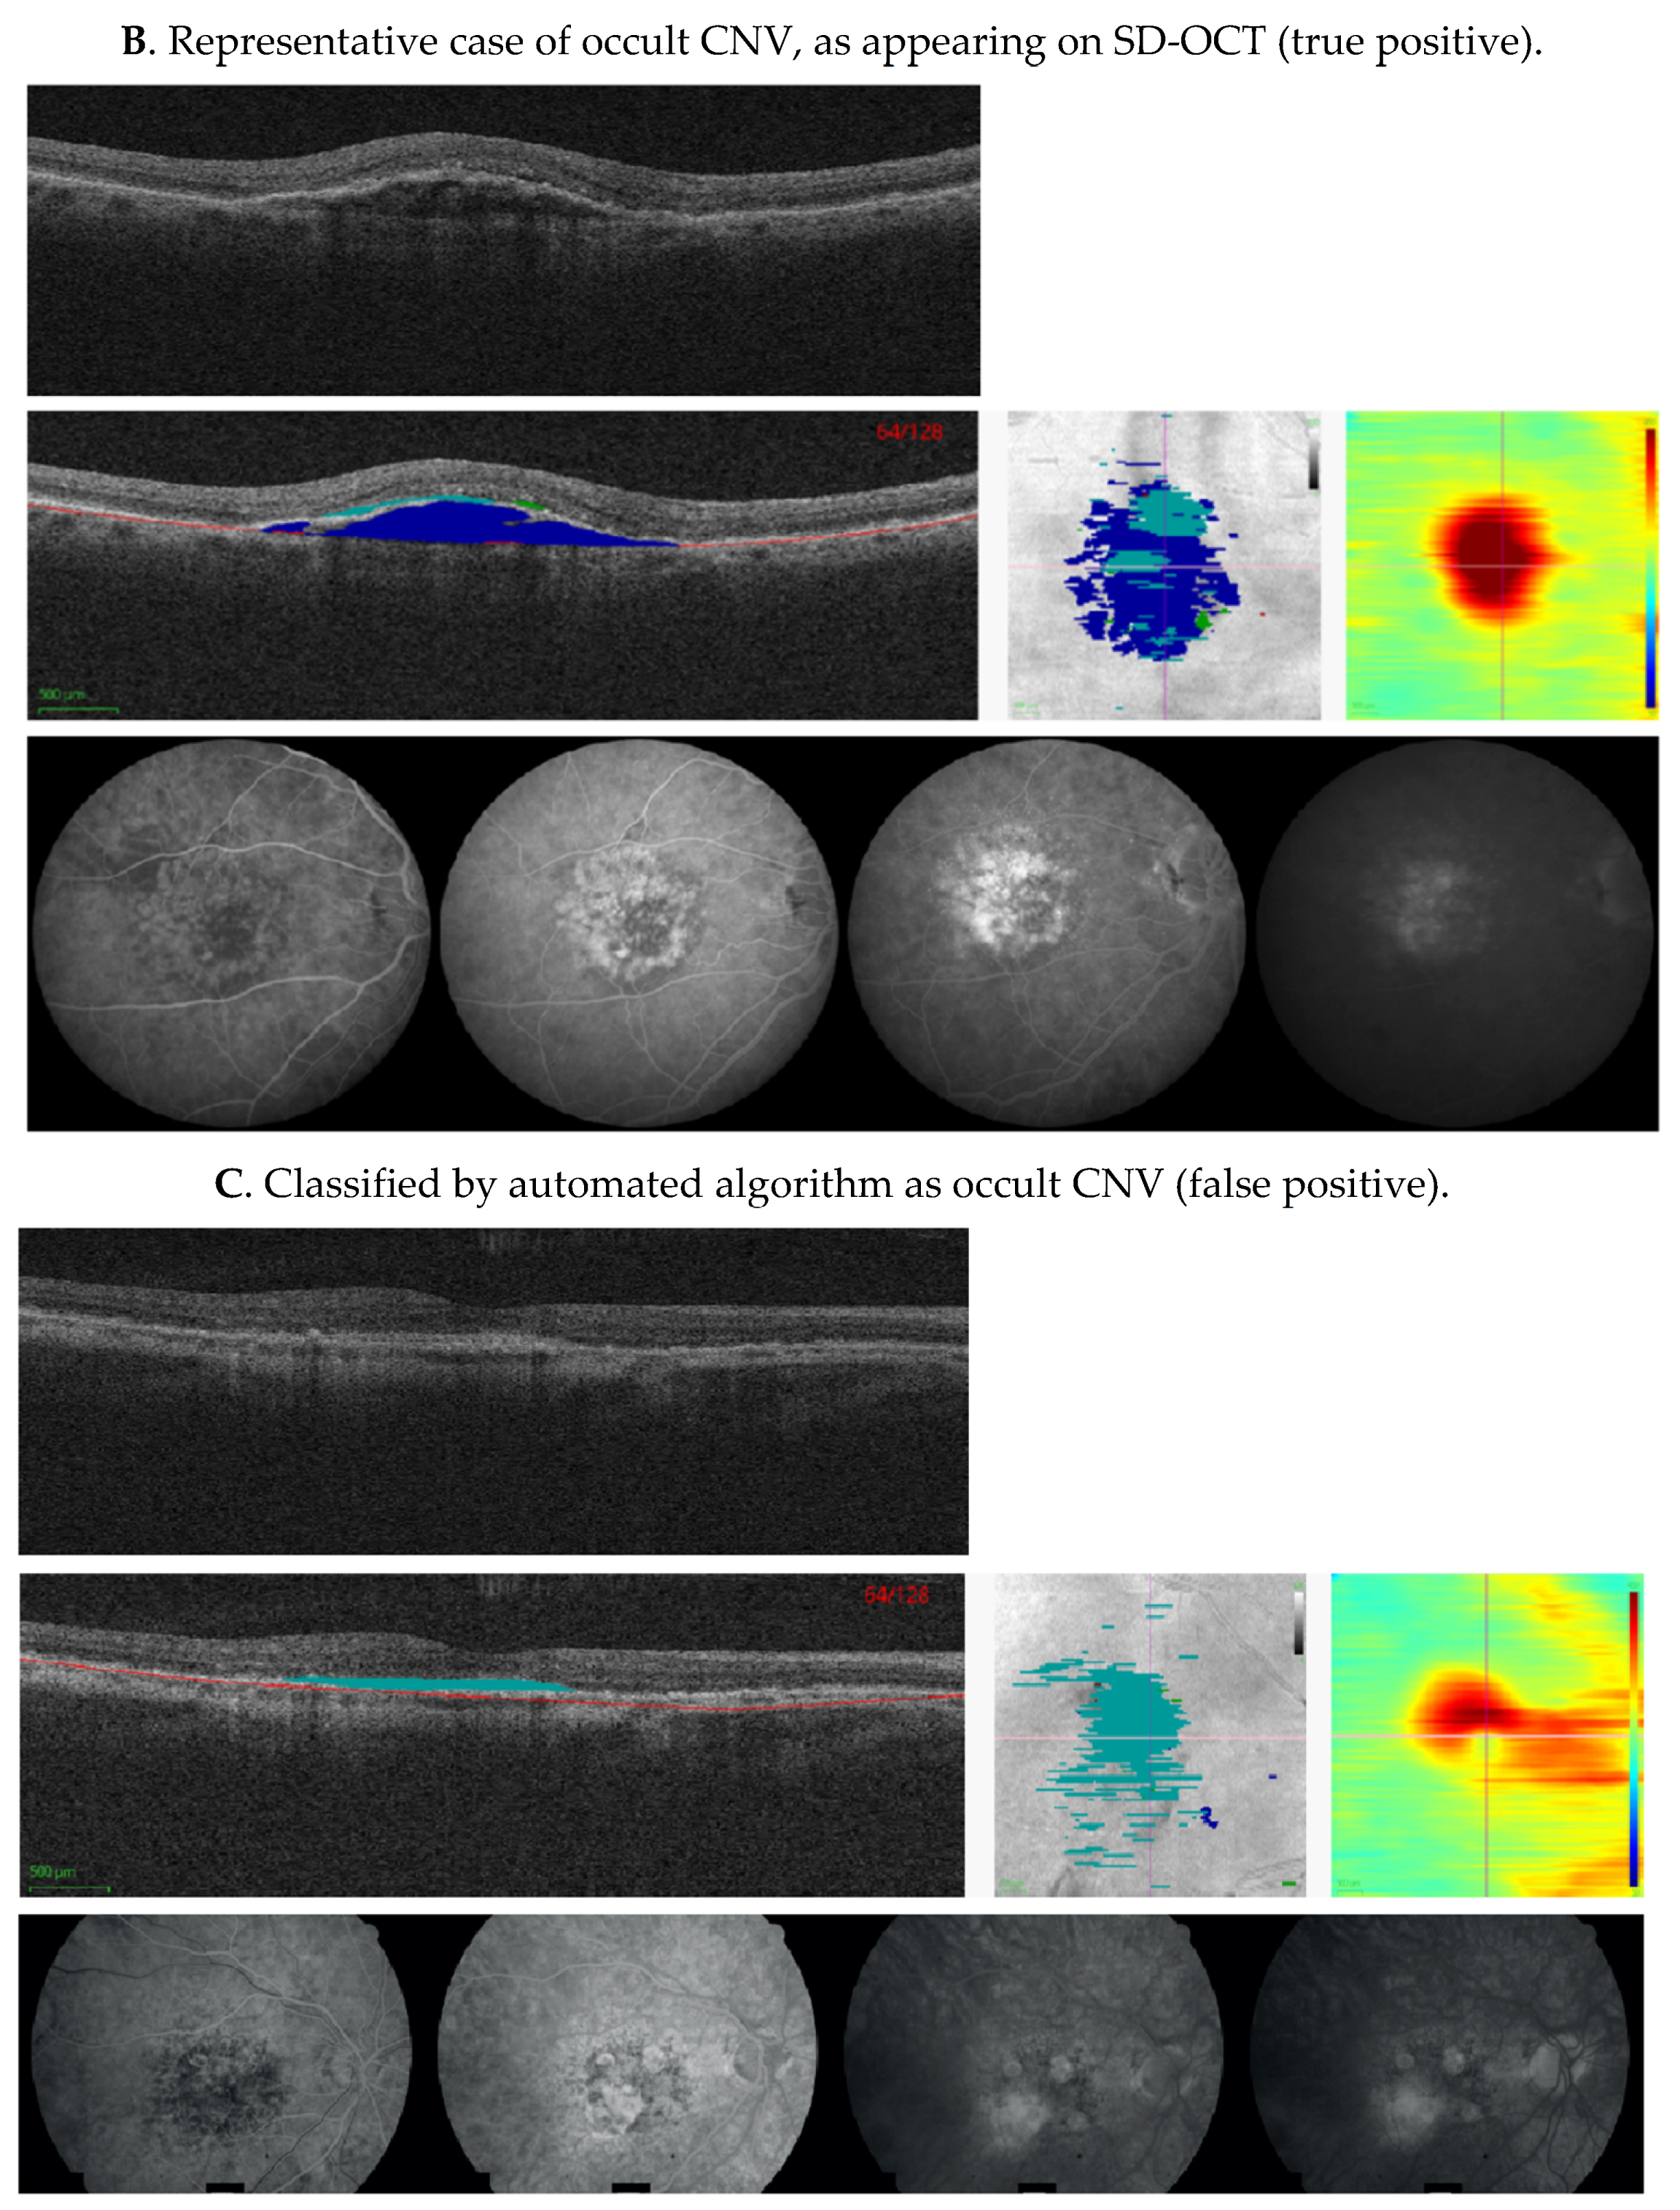
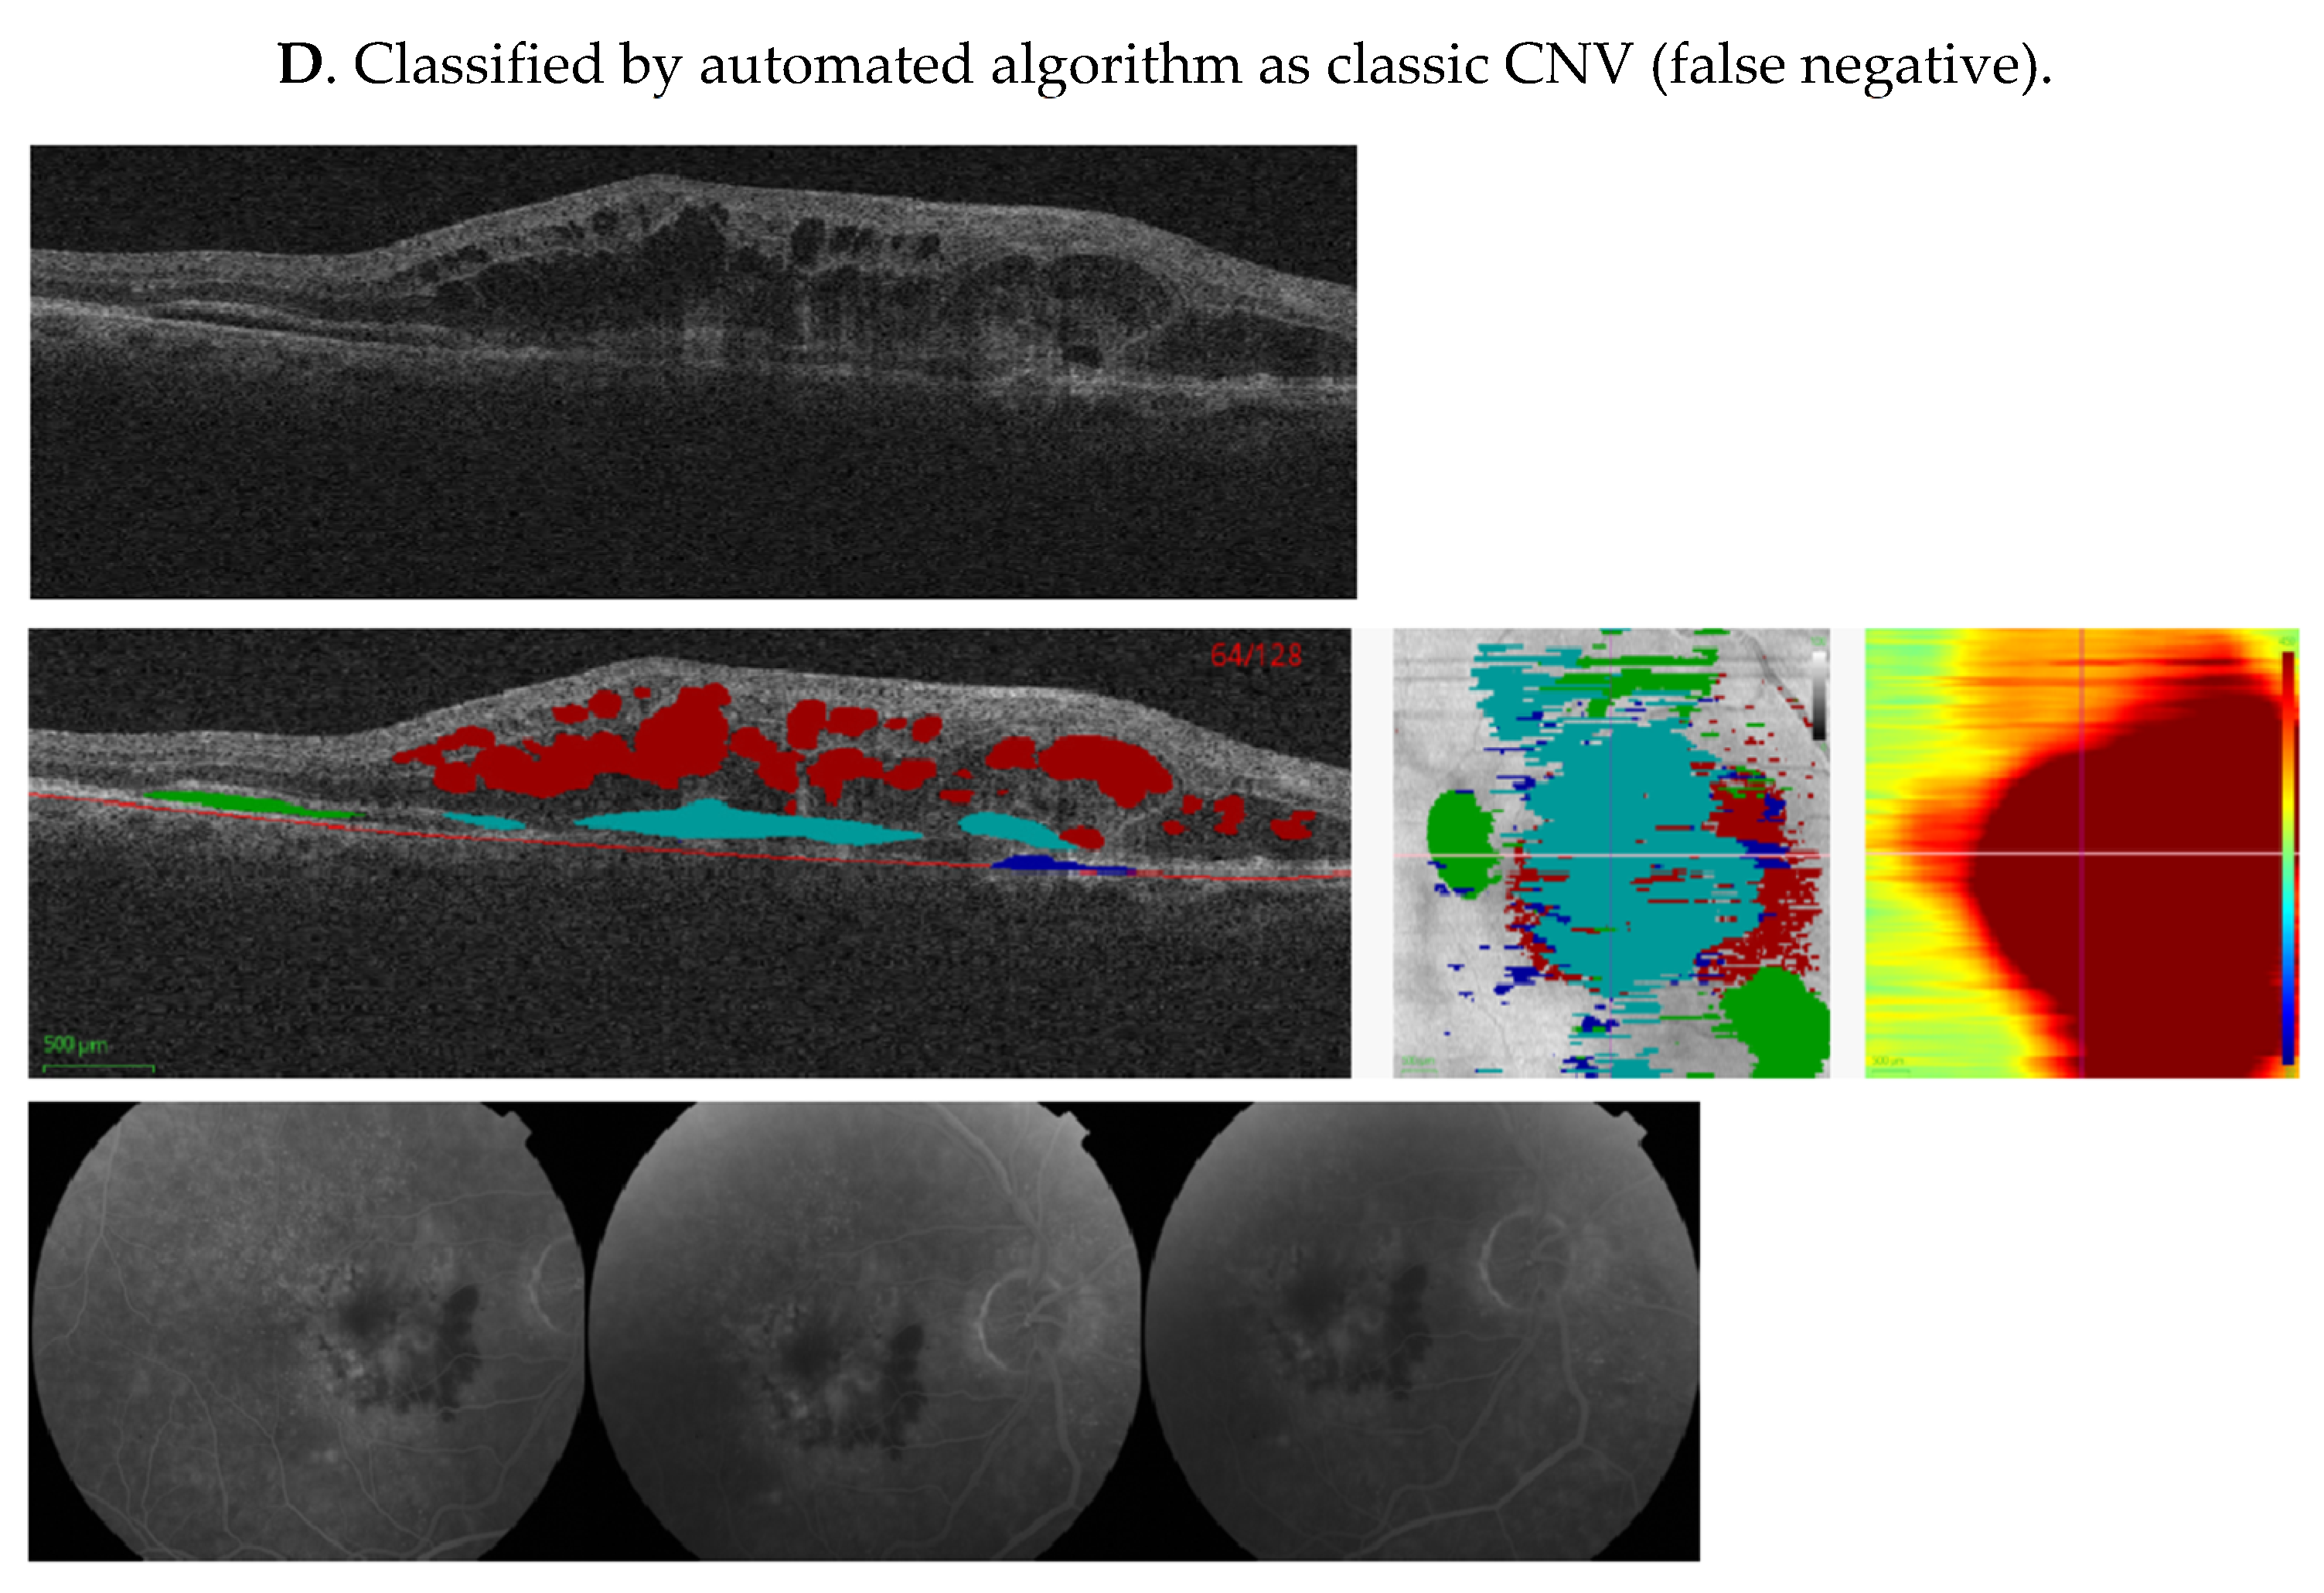
Figure 5.
Representative cases showing comparison of machine algorithm with angiography. (A–D) Central SD-OCT B-scans (top), with segmented pixel masks of volumetric measures and Bruch’s membrane (middle left), en-face projections (middle center), and thickness maps (middle right), as well as corresponding FAs (bottom). Colors on the SD-OCT images indicate volumetric measures as follows—intraretinal fluid (red), subretinal fluid (green), PED (blue), and SHRM (cyan). Bruch’s membrane is shown as a red line. In (A), FA shows an area of hypofluorescence due to hemorrhage, and a well-demarcated area of hyperfluorescence due to a predominantly classic CNV that leaks in later frames. This was also identified as classic CNV by our ML algorithm, due to increased SHRM height and volume. In (B), FA demonstrates an ill-defined area of stippled hyperfluorescence, due to an occult CNV that leaks diffusely in mid and late frames, and was also identified as occult CNV by the ML algorithm, due to the presence of the PED. In (C), FA shows an area of well-defined hyperfluorescence in mid frames that stains and leaks in late frames due to fibrosis. The image was classified as classic CNV by the reading center, but was identified as occult CNV by the ML algorithm due to low SHRM height and volume. In (D), FA shows an area of hypofluorescence due to hemorrhage and a poorly demarcated area of hyperfluorescence due to the CNV. This lesion was defined as minimally classic by the reading center, but was identified as classic CNV by the ML algorithm due to the SHRM created by the hemorrhage. CNV, choroidal neovascularization; FA, fluorescein angiogram; ML, machine learning; PED, pigment epithelium detachment; SD-OCT, spectral-domain optical coherence tomography; and SHRM, subretinal hyperreflective material.
Figure 6.
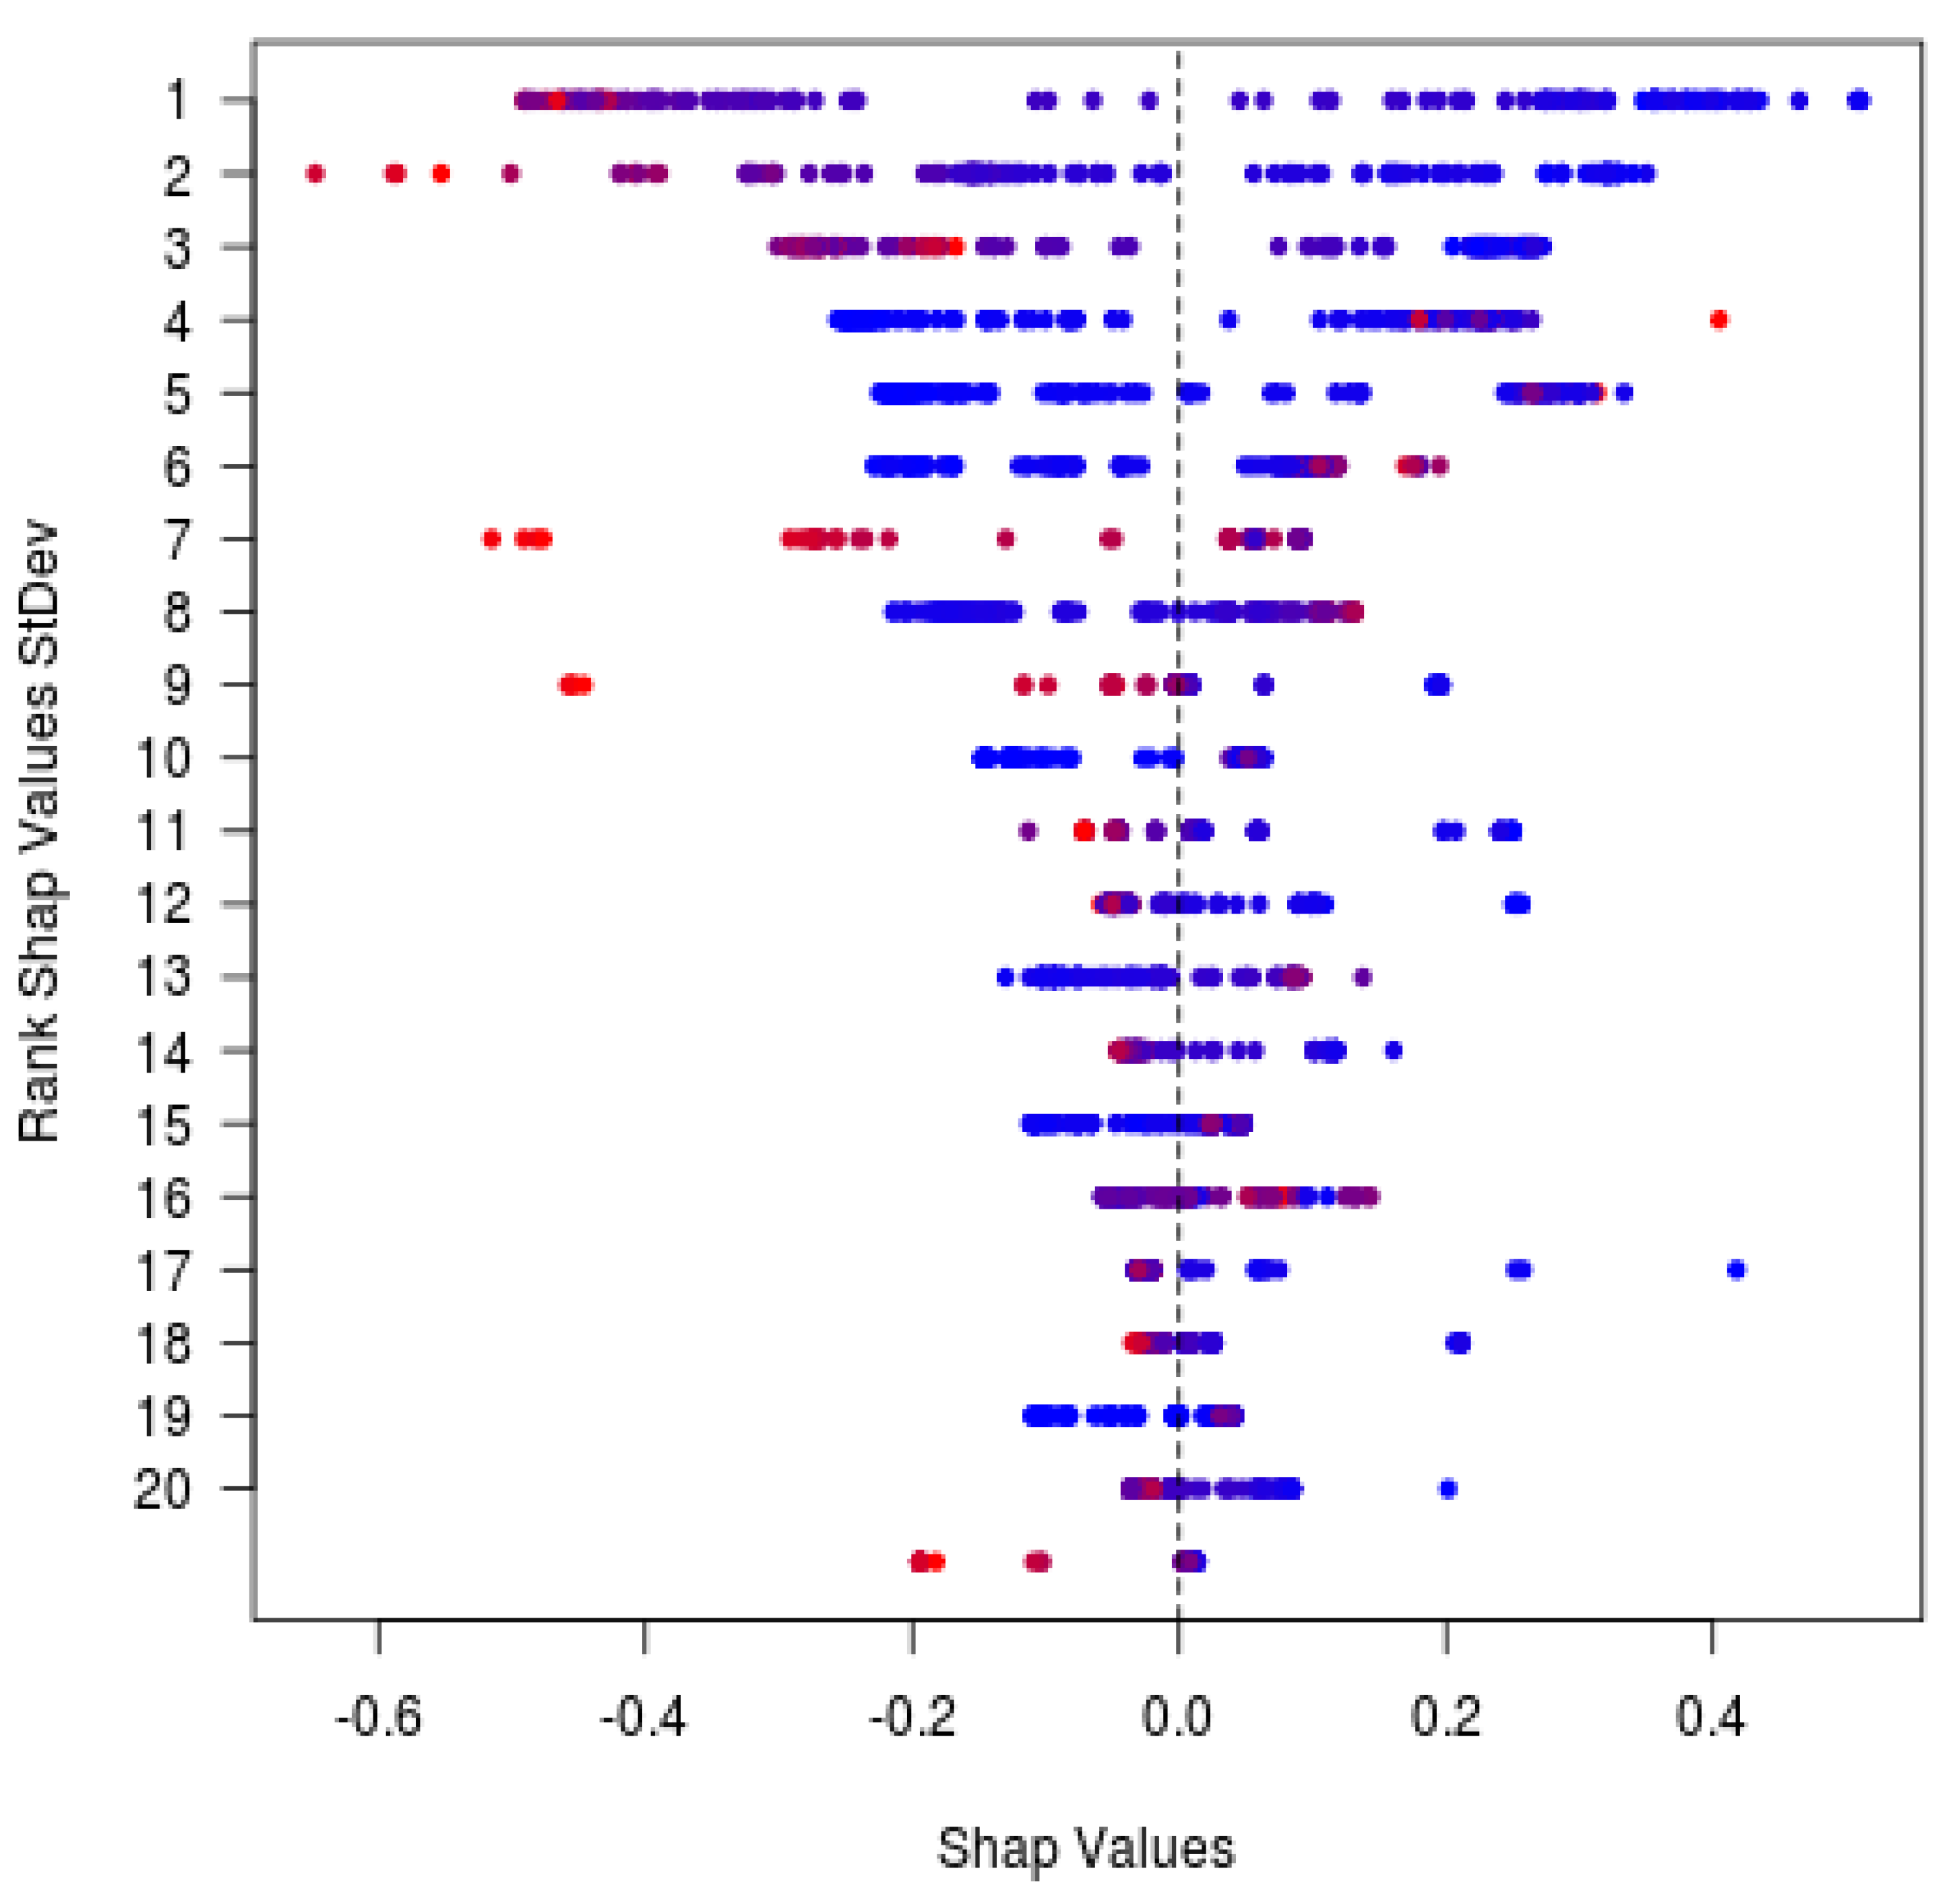
SHAP analysis external validation. SHAP analysis for the CNV type predictions in AVENUE. Every prediction contributes exactly one dot to each row. Blue and red colors indicate lower and higher feature values, respectively. SHAP values (x-axis) add up to the predicted probability for occult (only 20 features with highest SHAP variance shown here). BM, Bruch’s membrane; CNV, choroidal neovascularization; HFL, Henle’s fiber layer; IB, inner boundary; ILM, inner limiting membrane; IRF, intraretinal fluid; max, maximum; OB, outer boundary; OPL, outer plexiform layer; PED, pigment epithelial detachment; RPE, retinal pigment epithelium; SHAP, SHapley Additive exPlanations; and SHRM, subretinal hyperreflective material.
Figure 6.
SHAP analysis external validation. SHAP analysis for the CNV type predictions in AVENUE. Every prediction contributes exactly one dot to each row. Blue and red colors indicate lower and higher feature values, respectively. SHAP values (x-axis) add up to the predicted probability for occult (only 20 features with highest SHAP variance shown here). BM, Bruch’s membrane; CNV, choroidal neovascularization; HFL, Henle’s fiber layer; IB, inner boundary; ILM, inner limiting membrane; IRF, intraretinal fluid; max, maximum; OB, outer boundary; OPL, outer plexiform layer; PED, pigment epithelial detachment; RPE, retinal pigment epithelium; SHAP, SHapley Additive exPlanations; and SHRM, subretinal hyperreflective material.
Figure 7.
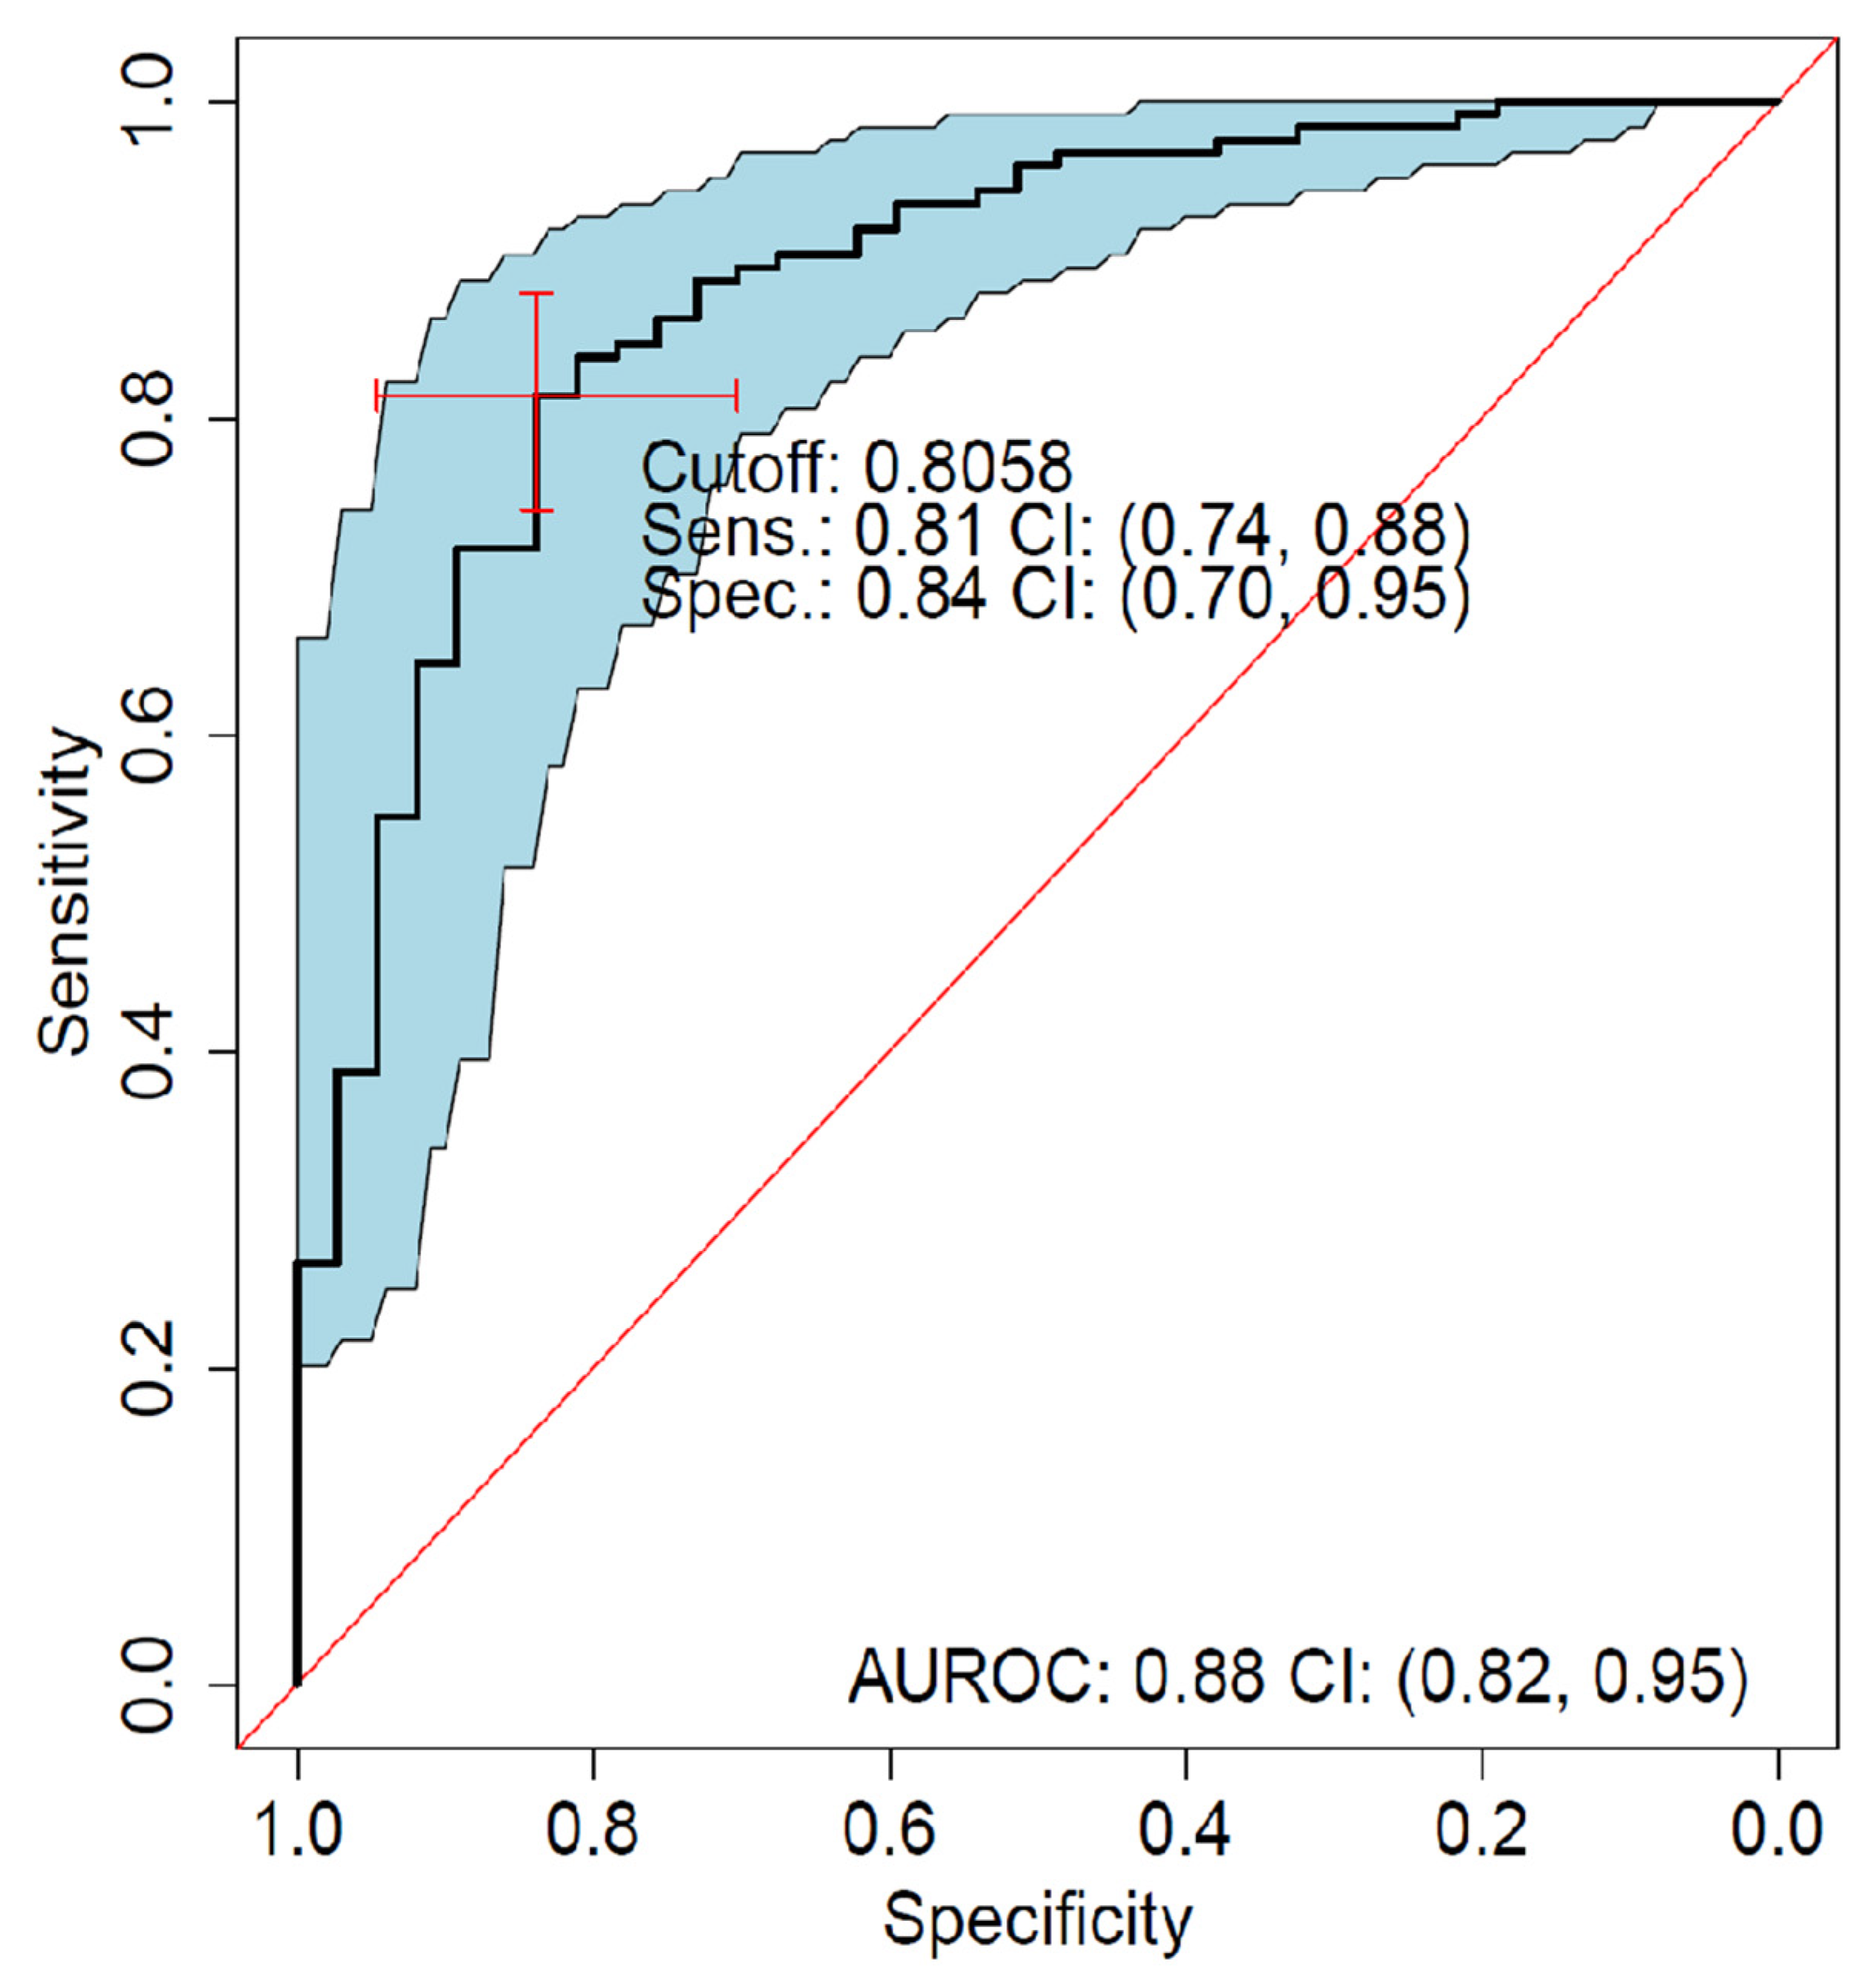
ROC analysis of predominantly classic versus occult external validation. Sensitivity versus specificity for all possible cutoff points with respect to predicted occult scores in AVENUE, including 95% CIs (bootstrapped). The location of the red crosshair indicates the operating point of the model. AUROC, area under the receiver operating characteristic; FA, fluorescein angiography; NEG, negative; POS, positive; ROC, receiver operating characteristic; Sens, sensitivity; and Spec, specificity.
Figure 7.
ROC analysis of predominantly classic versus occult external validation. Sensitivity versus specificity for all possible cutoff points with respect to predicted occult scores in AVENUE, including 95% CIs (bootstrapped). The location of the red crosshair indicates the operating point of the model. AUROC, area under the receiver operating characteristic; FA, fluorescein angiography; NEG, negative; POS, positive; ROC, receiver operating characteristic; Sens, sensitivity; and Spec, specificity.
Table 1.
Segmentation Performance—DICE Scores for the three fluids (IRF, SRF, PED), and SHRM.
Table 1.
Segmentation Performance—DICE Scores for the three fluids (IRF, SRF, PED), and SHRM.
| Type | N (Total) | N (Train/Valid) | Validation DICE
Mean (SD) |
|---|
| SRF | 700 | 557/143 | 0.67 (0.05) |
| IRF | 935 | 694/241 | 0.46 (0.12) |
| PED | 622 | 508/114 | 0.63 (0.07) |
| SHRM | 760 | 312/65 | 0.71 (0.06) |
Table 2.
Human Readouts vs. Automated Readouts for AVENUE. Many automated readouts were generated. This table demonstrates that there was a high correlation between manual readouts that most clearly correspond to the automated [MA1] readouts.
Table 2.
Human Readouts vs. Automated Readouts for AVENUE. Many automated readouts were generated. This table demonstrates that there was a high correlation between manual readouts that most clearly correspond to the automated [MA1] readouts.
| Reading Center Feature | Automated Feature | Spearman r |
|---|
| CENT RET THICK µm | Central subfield thickness IB RPE-to-ILM 0.5 mm min | 0.84 |
| CENT RET/LESION THICK µm | Central subfield thickness BM-to-ILM 0.5 mm min | 0.79 |
| CENT SUBFIELD THICK ILM-RPE µm | Central subfield thickness IB RPE-to-ILM 0.5 mm mean | 0.93 |
| CUBE VOL ILM-RPE mm 3.0 mm | Central subfield volume IB RPE-to-ILM 3.0 mm | 0.90 |
| LESION THICK µm | Central subfield thickness BM-to-ILM 3.0 mm max | 0.83 |
| PED THICK µm | C-scan height PED 3.0 mm | 0.71 |
| SUBRET FLUID THICK µm | C-scan height SRF 3.0 mm | 0.61 |
Table 3.
Diagnostic Accuracy of the Algorithm in Detecting FA-Defined CNV Phenotype on SD-OCT; Cross-validation results report best-tuned performance across the parameter grid. External validation reports unbiased performance against hold-out data.
Table 3.
Diagnostic Accuracy of the Algorithm in Detecting FA-Defined CNV Phenotype on SD-OCT; Cross-validation results report best-tuned performance across the parameter grid. External validation reports unbiased performance against hold-out data.
| Outcome | Balance | FP/FN | Cutoff | Sensitivity | Specificity | AUROC (95% CI) |
|---|
| Cross-Validated Performance for CNV vs. No CNV on HARBOR (No Parameter Tuning) |
| Any CNV vs. none | 1037/531 | 23/15 | 0.3815 | 0.99 | 0.98 | 1.00 (0.99–1.00) |
| Predominantly classic vs. none | 163/531 | 1/7 | 0.9996 | 0.99 | 1.00 | 1.00 (1.00–1.00) |
| Minimally classic vs. none | 492/531 | 10/10 | 0.6227 | 0.98 | 0.98 | 1.00 (0.99–1.00) |
| Minimally classic + predominantly classic vs. none | 653/531 | 14/6 | 0.1831 | 0.99 | 0.98 | 0.99 (0.99–1.00) |
| Occult vs. none | 382/531 | 17/24 | 0.9785 | 0.96 | 0.96 | 0.99 (0.99–1.00) |
| Holdout Performance as Measured on 15% of HARBOR |
| Minimally classic + predominantly classic vs. occult | 104/56 | 20/19 | 0.4036 | 0.67 | 0.81 | 0.81 (0.73–0.88) |
| Predominantly classic vs. minimally classic | 22/82 | 22/8 | 0.7051 | 0.74 | 0.65 | 0.73 (0.61–0.85) |
| Occult vs. minimally classic | 55/81 | 25/16 | 0.5390 | 0.72 | 0.70 | 0.70 (0.60–0.79) |
| Best-Tuned Performance on HARBOR for Predominantly Classic vs. Occult |
| Predominantly classic vs. occult | 163/382 | 32/41 | 0.6110 | 0.89 | 0.81 | 0.91 (0.89–0.94) |
| External Performance on AVENUE for Predominantly Classic vs. Occult |
| Predominantly classic vs. occult | 126/39 | 7/24 | 0.8058 | 0.81 | 0.84 | 0.88 (0.82–0.95) |
Table 4.
Resampling performance.
Table 4.
Resampling performance.
| ROC | Sens | Spec | Resample |
|---|
| 0.953 | 0.750 | 0.948 | Fold 1 |
| 0.930 | 0.641 | 0.957 | Fold 2 |
| 0.901 | 0.840 | 0.880 | Fold 3 |
| 0.900 | 0.568 | 0.960 | Fold 4 |
| 0.921 | 0.786 | 0.950 | Fold 5 |
Table 5.
Contingency table, counting all combinations of the predicted versus observed.
Table 5.
Contingency table, counting all combinations of the predicted versus observed.
| Predicted | Observed | n |
|---|
| POS (OCCULT) | POS (OCCULT) | 341 |
| NEG | NEG | 131 |
| POS (OCCULT) | NEG | 32 |
| NEG | POS (OCCULT) | 41 |
Table 6.
The features from
Figure 4B in descending order of importance. BM, Bruch’s membrane; HFL, Henle’s fiber layer; IB, inner boundary; ILM, inner limiting membrane; max, maximum; OB, outer boundary; OPL, outer plexiform layer; PED, pigment epithelial detachment; ROC, receiver operating characteristic; RPE, retinal pigment epithelium; SHRM, subretinal hyperreflective material; and SRF, subretinal fluid.
| Rank | Feature Name |
|---|
| 1 | C-scan volume SHRM 1.5 mm |
| 2 | C-scan volume SHRM 3 mm |
| 3 | C-scan volume SHRM 0.5 mm |
| 4 | C-scan volume PED 1.5 mm |
| 5 | Central subfield thickness BM-to-OB_RPE 0.5 mm max |
| 6 | C-scan width SHRM 3 mm |
| 7 | C-scan width SHRM 1.5 mm |
| 8 | Central subfield thickness BM-to-OB_RPE 1.5 mm max |
| 9 | C-scan height PED 0.5 mm |
| 10 | Central subfield thickness IB_RPE-to-OPL-HFL 1.5 mm max |
| 11 | C-scan volume PED 3 mm |
| 12 | Central subfield volume BM-to-OB_RPE 0.5 mm |
| 13 | Central subfield thickness BM-to-OB_RPE 1.5 mm mean |
| 14 | Central subfield volume BM-to-OB_RPE 1.5 mm |
| 15 | Central subfield thickness BM-to-OB_RPE 0.5 mm mean |
| 16 | Central subfield thickness IB_RPE-to-OPL-HFL 3.0 mm max |
| 17 | Central subfield thickness BM-to-IB_RPE 1.5 mm max |
| 18 | Central subfield volume IB_RPE-to-ILM 0.5 mm |
| 19 | C-scan width SRF 0.5 mm |
| 20 | Central subfield thickness IB_RPE-to-ILM 0.5 mm mean |
Table 7.
The top 20 features from
Figure 6 in descending order of importance.
Table 7.
The top 20 features from
Figure 6 in descending order of importance.
| Rank | Feature Name |
|---|
| 1 | C-scan volume SHRM 1.5 mm |
| 2 | C-scan volume SHRM 3.0 mm |
| 3 | C-scan volume SHRM 0.5 mm |
| 4 | C-scan volume PED 1.5 mm |
| 5 | C-scan volume PED 3.0 mm |
| 6 | Central subfield thickness BM-to-OB_RPE 0.5 mm max |
| 7 | C-scan width SHRM 3.0 mm |
| 8 | C-scan height PED 1.5 mm |
| 9 | Central subfield thickness IB_RPE-to-ILM 1.5 mm max |
| 10 | Central subfield volume BM-to-OB_RPE 1.5 mm |
| 11 | Central subfield thickness IB_RPE-to-ILM 0.5 mm max |
| 12 | C-scan height IRF 3.0 mm |
| 13 | C-scan height PED 3.0 mm |
| 14 | Central subfield thickness BM-to-ILM 1.5 mm max |
| 15 | Central subfield thickness BM-to-OB_RPE 1.5 mm max |
| 16 | Central subfield thickness BM-to-ILM 3.0 mm min |
| 17 | Central subfield thickness OPL-HFL-to-ILM 0.5 mean |
| 18 | Central subfield thickness BM-to-ILM 0.5 mm max |
| 19 | Central subfield thickness BM-to-OB_RPE 0.5 mm mean |
| 20 | Central subfield thickness BM-to-ILM 3.0 mm max |
Table 8.
Contingency table, counting all combinations of the predicted versus observed. Predicted indicates class predicted by the model; observed indicates class as graded on FA; and n indicates the number of samples.
Table 8.
Contingency table, counting all combinations of the predicted versus observed. Predicted indicates class predicted by the model; observed indicates class as graded on FA; and n indicates the number of samples.
| Predicted | Observed | n |
|---|
| POS (OCCULT) | POS (OCCULT) | 102 |
| NEG | NEG | 32 |
| POS (OCCULT) | NEG | 7 |
| NEG | POS (OCCULT) | 24 |


 ,
, 


