
Error Propagation in the Simulation of Atherosclerotic Plaque Growth and the Prediction of Atherosclerotic Disease Progression


 , ,
, , 
Abstract
:1. Introduction
2. Materials and Methods
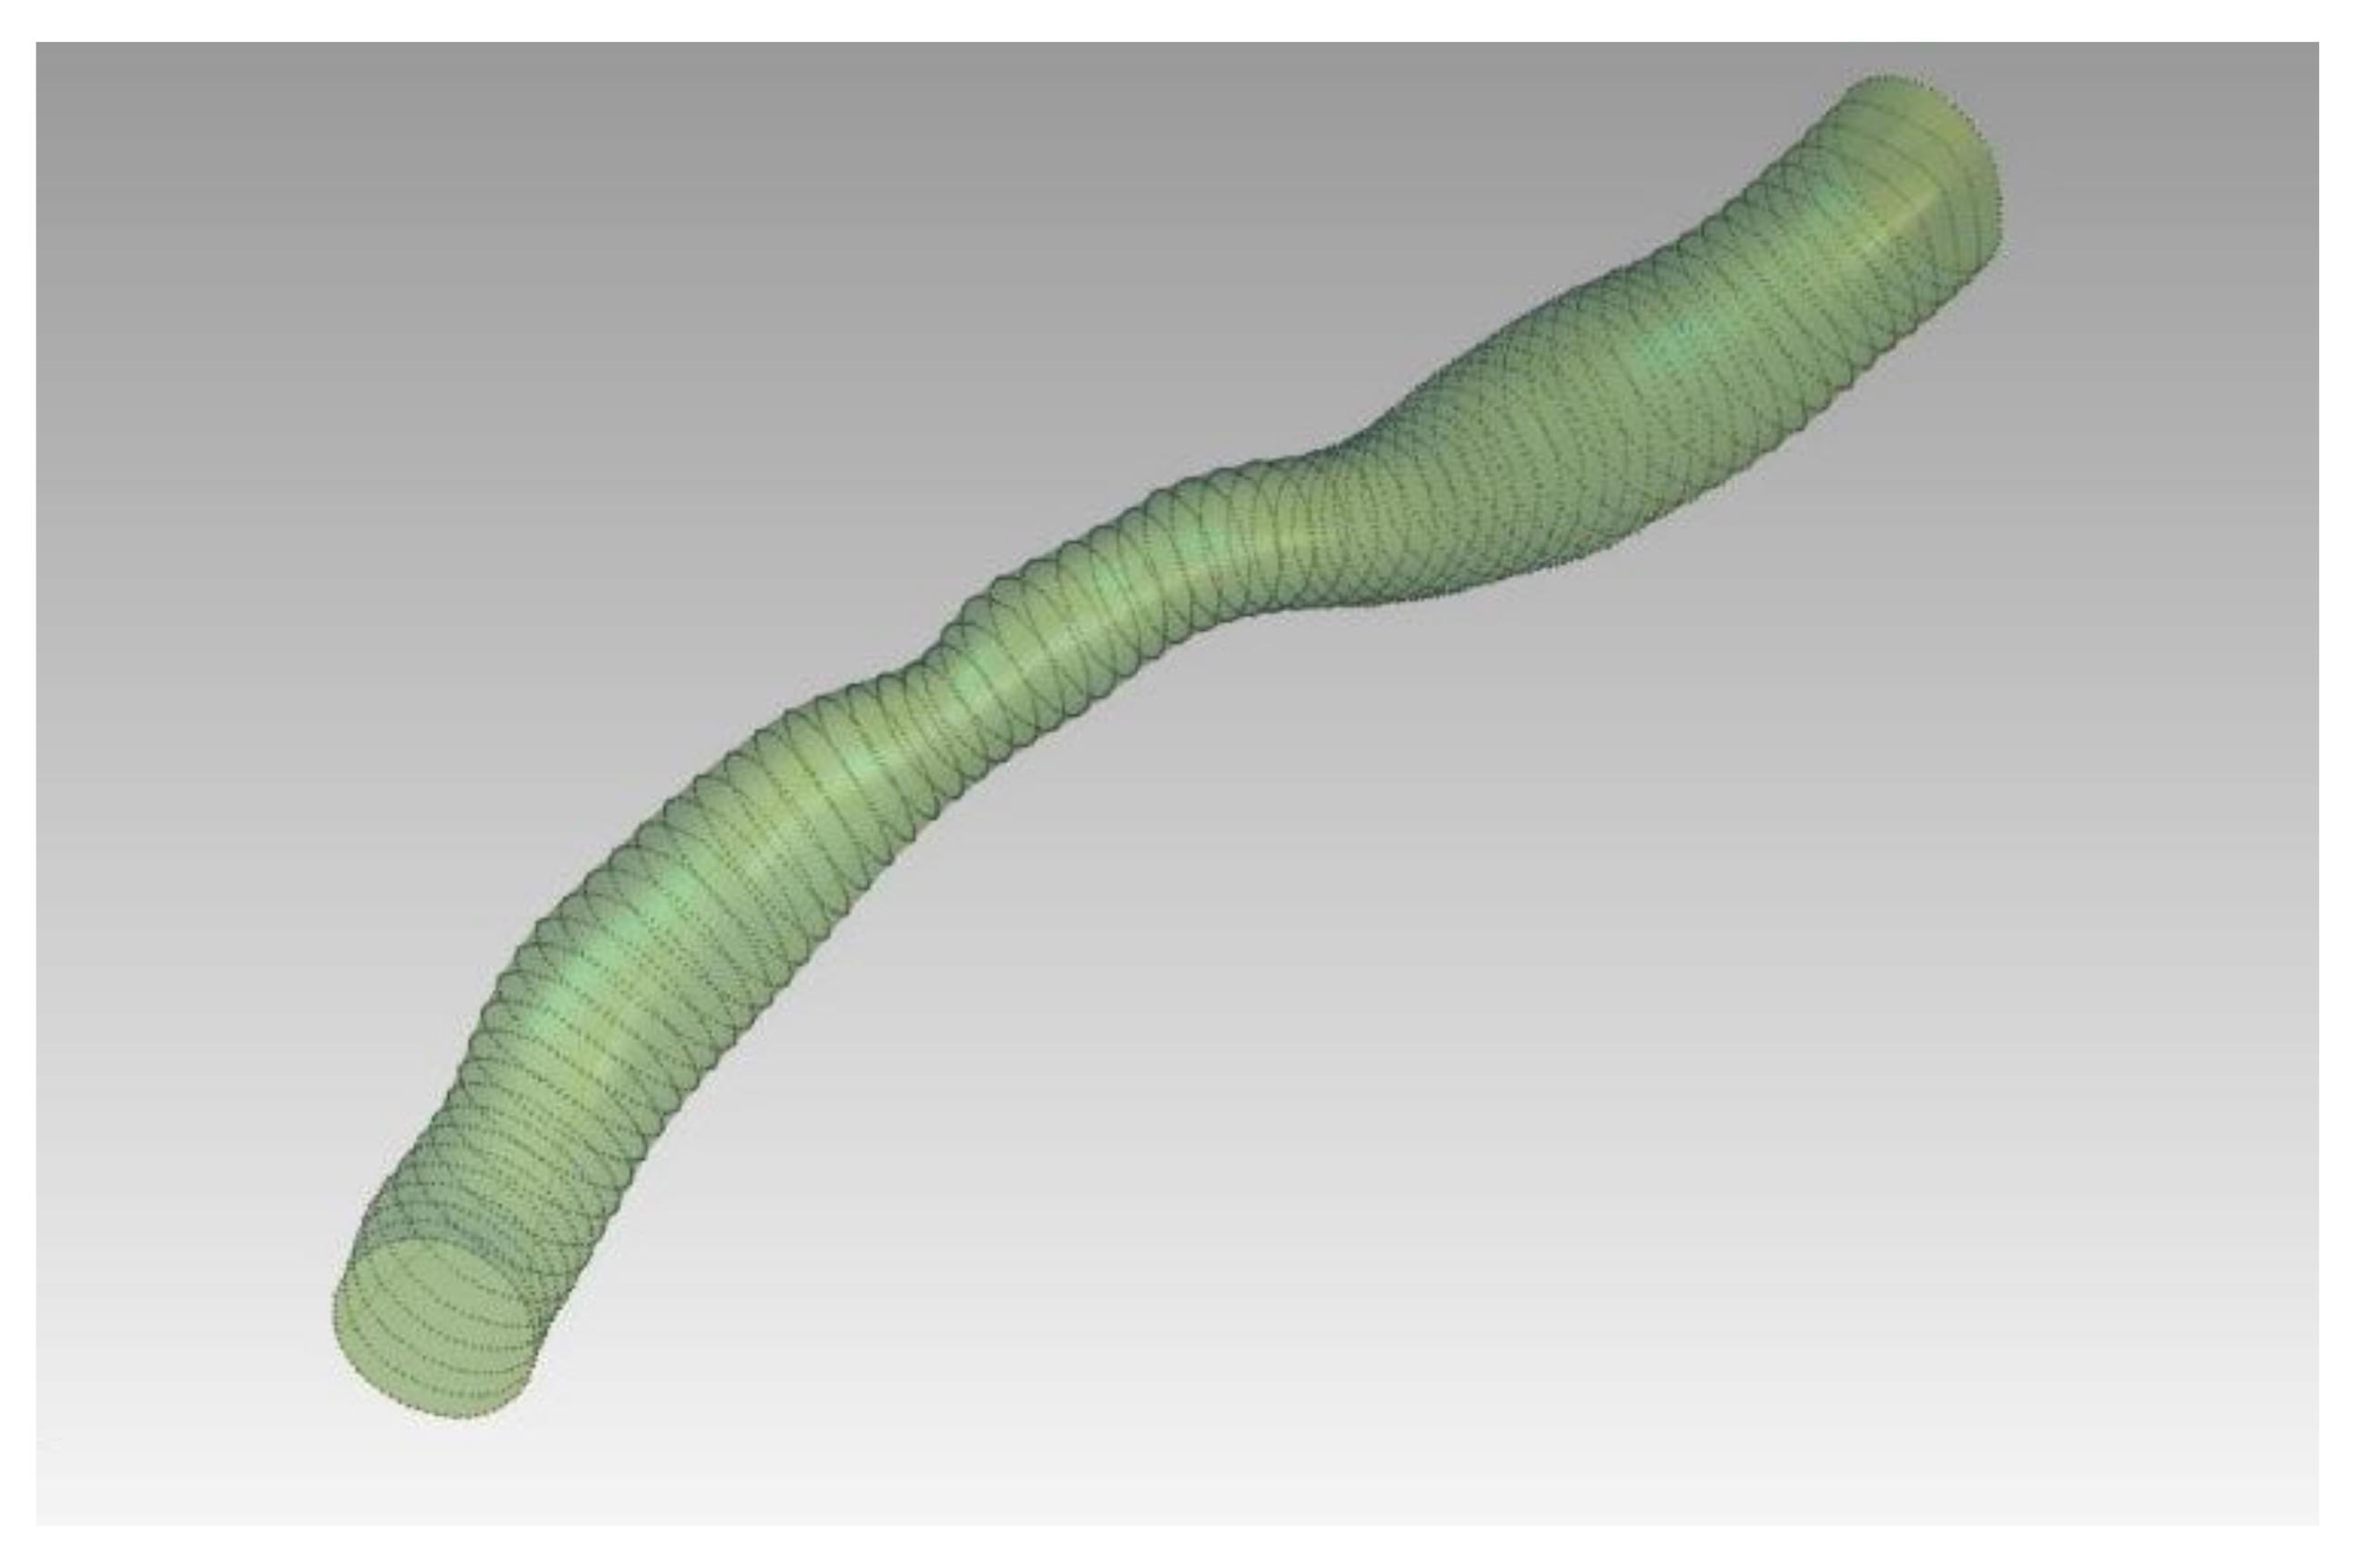
2.1. Study Population and 3D Reconstruction
2.2. Error Generation
- In order to increase or decrease the lumen area for each contour, the centroid of the contour was calculated.
- The original points of the contour were then scaled according to the desired area reduction factor. In our case we determined an error of 5% in each contour area.
- The centroid of the scaled contour was then determined.
- The translation vector was then calculated by finding the difference of the two centroids.
- The translation vector was used to find the translation between the original points and the scaled ones.
- The translation was applied to the scaled points, thus creating the scaled contour.
- The overestimated and the underestimated models were then created by converting the point clouds to 3D volumes.
2.3. Blood Flow Modelling and SmartFFR Calculation
2.4. Plaque Growth Modelling
2.5. Error Propagation to the Prognostic Model
3. Results
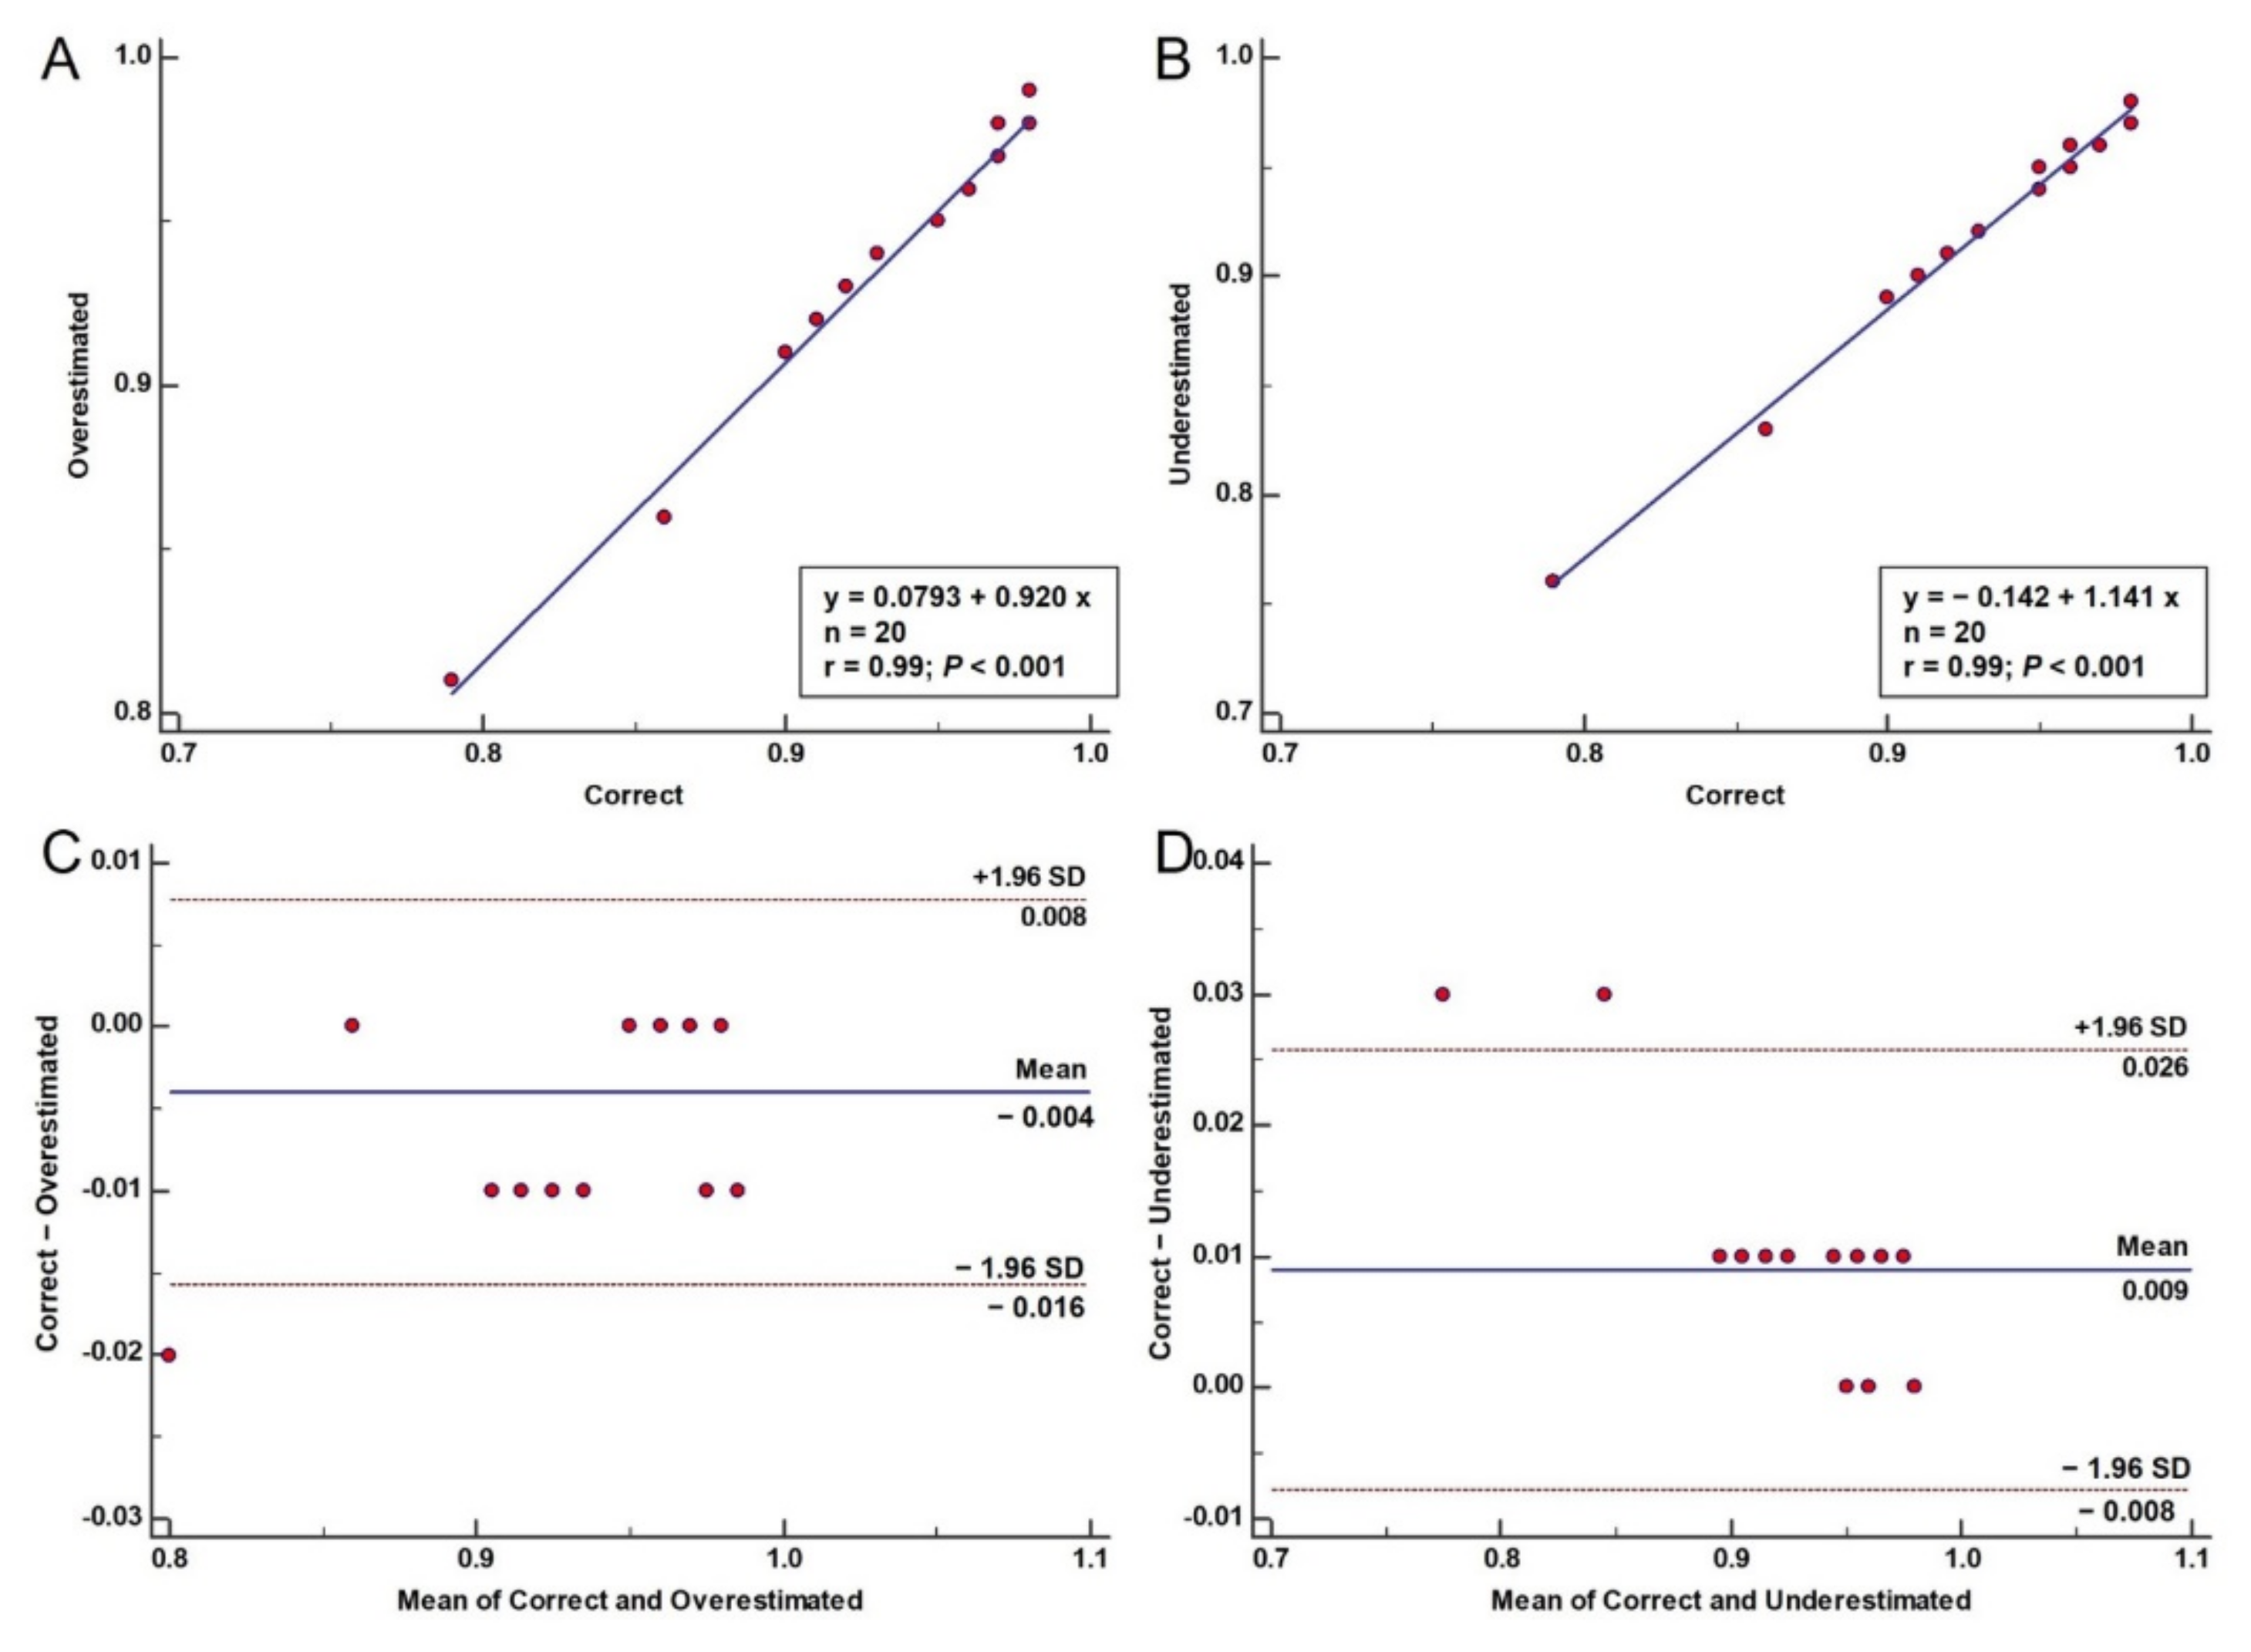
3.1. Error Propagation to ESS
3.2. Error Propagation to SmartFFR
3.3. Error Propagation to Plaque Growth Prediction
4. Discussion
5. Conclusions
Author Contributions
Funding
Institutional Review Board Statement
Informed Consent Statement
Data Availability Statement
Conflicts of Interest
References
- WHO. The Atlas of Heart Disease and Stroke. Available online: http://www.who.int/cardiovascular_diseases/en/cvd_atlas_16_death_from_stroke.pdf (accessed on 14 April 2019).
- World Health Organization. Prevention of Cardiovascular Disease: Guidelines for Assessment and Management of Cardiovascular Risk; World Health Organization, Ed.; World Health Organization: Geneva, Switzerland, 2007; ISBN 978-92-4-154717-8. [Google Scholar]
- Knuuti, J.; Wijns, W.; Saraste, A.; Capodanno, D.; Barbato, E.; Funck-Brentano, C.; Prescott, E.; Storey, R.F.; Deaton, C.; Cuisset, T.; et al. 2019 ESC Guidelines for the diagnosis and management of chronic coronary syndromes: The Task Force for the diagnosis and management of chronic coronary syndromes of the European Society of Cardiology (ESC). Eur. Heart J. 2020, 41, 407–477. [Google Scholar] [CrossRef]
- Sakellarios, A.; Bourantas, C.V.; Papadopoulou, S.L.; Kitslaar, P.H.; Girasis, C.; Stone, G.W.; Reiber, J.H.C.; Michalis, L.K.; Serruys, P.W.; de Feyter, P.J.; et al. The effect of coronary bifurcation and haemodynamics in prediction of atherosclerotic plaque development: A serial computed tomographic coronary angiographic study. EuroIntervention 2017, 13, e1084–e1091. [Google Scholar] [CrossRef] [PubMed]
- Sakellarios, A.I.; Tsompou, P.; Kigka, V.; Siogkas, P.; Kyriakidis, S.; Tachos, N.; Karanasiou, G.; Scholte, A.; Clemente, A.; Neglia, D.; et al. Non-Invasive Prediction of Site-Specific Coronary Atherosclerotic Plaque Progression using Lipidomics, Blood Flow, and LDL Transport Modeling. Appl. Sci. 2021, 11, 1976. [Google Scholar] [CrossRef]
- Stone, P.H.; Maehara, A.; Coskun, A.U.; Maynard, C.C.; Zaromytidou, M.; Siasos, G.; Andreou, I.; Fotiadis, D.; Stefanou, K.; Papafaklis, M.; et al. Role of Low Endothelial Shear Stress and Plaque Characteristics in the Prediction of Nonculprit Major Adverse Cardiac Events: The PROSPECT Study. JACC Cardiovasc. Imaging 2018, 11, 462–471. [Google Scholar] [CrossRef] [PubMed]
- Cilla, M.; Pena, E.; Martinez, M.A. Mathematical modelling of atheroma plaque formation and development in coronary arteries. J. R. Soc. Interface 2014, 11. [Google Scholar] [CrossRef] [PubMed] [Green Version]
- Pleouras, D.S.; Sakellarios, A.I.; Tsompou, P.; Kigka, V.; Kyriakidis, S.; Rocchiccioli, S.; Neglia, D.; Knuuti, J.; Pelosi, G.; Michalis, L.K.; et al. Simulation of atherosclerotic plaque growth using computational biomechanics and patient-specific data. Sci. Rep. 2020, 10, 17409. [Google Scholar] [CrossRef]
- Athanasiou, L.S.; Rigas, G.; Sakellarios, A.; Bourantas, C.V.; Stefanou, K.; Fotiou, E.; Exarchos, T.P.; Siogkas, P.; Naka, K.K.; Parodi, O.; et al. Error propagation in the characterization of atheromatic plaque types based on imaging. Comput. Methods Programs Biomed. 2015, 121, 161–174. [Google Scholar] [CrossRef] [PubMed]
- Smit, J.M.; van Rosendael, A.R.; El Mahdiui, M.; Neglia, D.; Knuuti, J.; Saraste, A.; Buechel, R.R.; Anna, T.; Pizzi, M.N.; Roque, A.; et al. Impact of Clinical Characteristics and Statins on Coronary Plaque Progression by Serial Computed Tomography Angiography. Circ. Cardiovasc. Imaging 2020, 13, e009750. [Google Scholar] [CrossRef] [PubMed]
- Kigka, V.I.; Sakellarios, A.; Kyriakidis, S.; Rigas, G.; Athanasiou, L.; Siogkas, P.; Tsompou, P.; Loggitsi, D.; Benz, D.C.; Buechel, R.; et al. A three-dimensional quantification of calcified and non-calcified plaques in coronary arteries based on computed tomography coronary angiography images: Comparison with expert’s annotations and virtual histology intravascular ultrasound. Comput. Biol. Med. 2019, 113, 103409. [Google Scholar] [CrossRef] [PubMed]
- Kigka, V.I.; Rigas, G.; Sakellarios, A.; Siogkas, P.; Andrikos, I.O.; Exarchos, T.P.; Loggitsi, D.; Anagnostopoulos, C.D.; Michalis, L.K.; Neglia, D.; et al. 3D reconstruction of coronary arteries and atherosclerotic plaques based on computed tomography angiography images. Biomed. Signal Process. Control 2018, 40, 286–294. [Google Scholar] [CrossRef] [Green Version]
- Siogkas, P.; Sakellarios, A.; Michalis, L.; Fotiadis, D. Non-invasive Quantification of Coronary Artery Disease in Arterial Bifurcations Using CCTA and CFD: Comparison to Fractional Flow Reserve Measurements. In World Congress on Medical Physics and Biomedical Engineering 2018; Springer: Singapore, 2019; pp. 639–643. ISBN 978-981-10-9034-9. [Google Scholar]
- Siogkas, P.K.; Lakkas, L.; Sakellarios, A.I.; Rigas, G.; Kyriakidis, S.; Stefanou, K.A.; Anagnostopoulos, C.D.; Clemente, A.; Rocchiccioli, S.; Pelosi, G.; et al. SmartFFR, a New Functional Index of Coronary Stenosis: Comparison With Invasive FFR Data. Front. Cardiovasc. Med. 2021, 8, 714471. [Google Scholar] [CrossRef]
- Siogkas, P.K.; Sakellarios, A.I.; Kyriakidis, S.K.; Anagnostopoulos, C.D.; Pelosi, G.; Rocchiccioli, S.; Michalis, L.K.; Fotiadis, D.I. The effect of error propagation in the 3D reconstruction of coronary segments using CTCA images on crucial hemodynamic parameters. In Proceedings of the 2019 41st Annual International Conference of the IEEE Engineering in Medicine and Biology Society (EMBC), Berlin, Germany, 23–27 July 2019; pp. 5006–5009. [Google Scholar]
- Hammerling, J.A. A Review of Medical Errors in Laboratory Diagnostics and Where We Are Today. Lab. Med. 2012, 43, 41–44. [Google Scholar] [CrossRef] [Green Version]
- Schultze, A.E.; Irizarry, A.R. Recognizing and Reducing Analytical Errors and Sources of Variation in Clinical Pathology Data in Safety Assessment Studies. Toxicol. Pathol. 2017, 45, 281–287. [Google Scholar] [CrossRef] [Green Version]
- Kedem, O.; Katchalsky, A. Thermodynamic analysis of the permeability of biological membranes to non-electrolytes. Biochim. Biophys. Acta 1958, 27, 229–246. [Google Scholar] [CrossRef]


| Case | Original | −5% | 5% |
|---|---|---|---|
| Case 1 | 0.96 | 0.96 | 0.96 |
| Case 2 | 0.95 | 0.94 | 0.95 |
| Case 3 | 0.97 | 0.96 | 0.97 |
| Case 4 | 0.9 | 0.89 | 0.91 |
| Case 5 | 0.91 | 0.9 | 0.92 |
| Case 6 | 0.95 | 0.95 | 0.95 |
| Case 7 | 0.95 | 0.94 | 0.95 |
| Case 8 | 0.92 | 0.91 | 0.93 |
| Case 9 | 0.97 | 0.96 | 0.97 |
| Case 10 | 0.96 | 0.96 | 0.96 |
| Case 11 | 0.93 | 0.92 | 0.94 |
| Case 12 | 0.98 | 0.97 | 0.98 |
| Case 13 | 0.79 | 0.76 | 0.81 |
| Case 14 | 0.96 | 0.96 | 0.96 |
| Case 15 | 0.86 | 0.83 | 0.86 |
| Case 16 | 0.98 | 0.98 | 0.99 |
| Case 17 | 0.96 | 0.96 | 0.96 |
| Case 18 | 0.96 | 0.95 | 0.96 |
| Case 19 | 0.97 | 0.96 | 0.98 |
| Case 20 | 0.98 | 0.97 | 0.98 |
| Minimum | Maximum | Mean | Std. Deviation | Relative Error Minimum | Relative Error Maximum | Relative Error Mean | Uncertainty | |
|---|---|---|---|---|---|---|---|---|
| Shear stress | 0.577 | 24.1 | 2.5663 | 1.8863 | ||||
| Overestimated | 0.495 | 23 | 2.3938 | 1.7576 | −14.2 | −4.56 | −6.72 | 1.7599 |
| Underestimated | 0.63 | 25.7 | 2.7163 | 1.9902 | 9.19 | 6.64 | 5.84 | 1.9922 |
| Thickened Wall | 2.55 × 10⁻⁶ | 2.70 × 10⁻⁵ | 1.23 × 10⁻⁵ | 5.38 × 10⁻⁶ | ||||
| Overestimated | 2.68 × 10⁻⁶ | 2.84 × 10⁻⁵ | 1.27 × 10⁻⁵ | 5.49 × 10⁻⁶ | 5.10 | 5.19 | 2.74 | 1.7599 |
| Underestimated | 2.44 × 10⁻⁶ | 2.84 × 10⁻⁵ | 1.20 × 10⁻⁵ | 5.35 × 10⁻⁶ | −4.31 | 5.19 | −2.81 | 1.9922 |
| LDL concentration | 5.54 × 10⁻⁵ | 6.64 × 10⁻⁴ | 2.27 × 10⁻⁴ | 1.35 × 10⁻⁴ | ||||
| Overestimated | 5.54 × 10⁻⁵ | 6.54 × 10⁻⁴ | 2.22 × 10⁻⁴ | 1.33 × 10⁻⁴ | 0.00 | −1.51 | −1.85 | 1.7599 |
| Underestimated | 3.62 × 10⁻⁵ | 6.70 × 10⁻⁴ | 1.80 × 10⁻⁴ | 1.55 × 10⁻⁴ | −34.7 | 0.90 | −20.5 | 1.9922 |
| HDL concentration | 6.69 × 10⁻⁴ | 8.06 × 10⁻⁴ | 7.45 × 10⁻⁴ | 3.68 × 10⁻⁵ | ||||
| Overestimated | 6.69 × 10⁻⁴ | 8.08 × 10⁻⁴ | 7.45 × 10⁻⁴ | 3.70 × 10⁻⁵ | 0.00 | 0.25 | 5.02 × 10⁻² | 1.7599 |
| Underestimated | 2.41 × 10⁻⁴ | 1.79 × 10⁻³ | 1.02 × 10⁻³ | 4.84 × 10⁻⁴ | −64.0 | 1.22 × 10² | 38.3 | 1.9922 |
| Oxidized LDL concentration | 8.20 × 10⁻⁴ | 1.41 × 10⁻³ | 1.16 × 10⁻³ | 1.81 × 10⁻⁴ | ||||
| Overestimated | 8.30 × 10⁻⁴ | 1.41 × 10⁻³ | 1.17 × 10⁻³ | 1.81 × 10⁻⁴ | 1.22 | 0.00 | 0.36 | 1.7599 |
| Underestimated | 7.68 × 10⁻⁴ | 1.45 × 10⁻³ | 1.16 × 10⁻³ | 2.38 × 10⁻⁴ | −6.34 | 2.84 | −0.73 | 1.9922 |
| Monocyte cells concentration | 1.32 × 10⁻⁷ | 1.40 × 10⁹ | 4.13 × 10⁸ | 2.59 × 10⁸ | ||||
| Overestimated | 1.32 × 10⁻⁷ | 1.41 × 10⁹ | 4.09 × 10⁸ | 2.57 × 10⁸ | 0.00 | 0.71 | −0.93 | 2.57 × 10⁸ |
| Underestimated | 1.47 × 10⁻⁷ | 1.37 × 10⁹ | 4.13 × 10⁸ | 2.74 × 10⁸ | 11.4 | −2.14 | −9.77 × 10⁻² | 2.74 × 10⁸ |
| Macrophage cells concentration | 3.40 × 10⁹ | 2.65 × 10¹¹ | 8.85 × 10¹⁰ | 5.59 × 10¹⁰ | ||||
| Overestimated | 3.40 × 10⁹ | 2.62 × 10¹¹ | 8.76 × 10¹⁰ | 5.53 × 10¹⁰ | 0.00 | −1.13 | −0.98 | 5.53 × 10¹⁰ |
| Underestimated | 3.55 × 10⁹ | 3.02 × 10¹¹ | 8.81 × 10¹⁰ | 5.91 × 10¹⁰ | 4.41 | 14.0 | −0.36 | 5.91 × 10¹⁰ |
| Synthetic SMC concentration | 1.00 × 10⁻¹⁸ | 4.83 × 10⁵ | 5.79 × 10⁴ | 9.01 × 10⁴ | ||||
| Overestimated | 1.00 × 10⁻¹⁸ | 4.80 × 10⁵ | 5.76 × 10⁴ | 8.90 × 10⁴ | 0.00 | −0.62 | −0.65 | 89073.87 |
| Underestimated | 1.01 × 10⁻¹⁸ | 8.19 × 10⁵ | 1.74 × 10⁵ | 1.56 × 10⁵ | 1.00 | 69.6 | 2.01 × 10² | 155950.1 |
| Collagen concentration | 5.60 × 10⁻²⁶ | 2.67 × 10⁻² | 3.20 × 10⁻³ | 4.98 × 10⁻³ | ||||
| Overestimated | 5.60 × 10⁻²⁶ | 2.65 × 10⁻² | 3.18 × 10⁻³ | 4.92 × 10⁻³ | 0.00 | −0.75 | −0.69 | 1.7599 |
| Underestimated | 5.65 × 10⁻²⁶ | 4.53 × 10⁻² | 9.64 × 10⁻³ | 8.62 × 10⁻³ | 0.89 | 0.69 | 2.01 × 10² | 1.9922 |
| Cytokine concentration | 6.00 × 10⁻² | 1.00 × 101 | 2.79 | 1.92 | ||||
| Overestimated | 5.99 × 10⁻² | 1.01 × 101 | 2.77 | 1.89 | −0.17 | 1.00 | −0.99 | 2.5852 |
| Underestimated | 6.70 × 10⁻² | 1.49 × 101 | 3.48 | 2.84 | 11.7 | 0.49 | 24.5 | 3.4721 |
| Foam cells concentration | 2.61 × 10⁶ | 4.88 × 10⁸ | 1.44 × 10⁸ | 1.02 × 10⁸ | ||||
| Overestimated | 2.61 × 10⁶ | 4.93 × 10⁸ | 1.42 × 10⁸ | 1.00 × 10⁸ | 0.00 | 1.02 | −1.03 | 1.01 × 10⁸ |
| Underestimated | 2.92 × 10⁶ | 8.12 × 10⁸ | 1.79 × 10⁸ | 1.53 × 10⁸ | 11.9 | 66.4 | 25.1 | 1.53 × 10⁸ |
| Plaque volume | 4.54 × 10¹⁷ | 8.46 × 10¹⁹ | 2.49 × 10¹⁹ | 1.77 × 10¹⁹ | ||||
| Overestimated | 4.53 × 10¹⁷ | 8.55 × 10¹⁹ | 2.47 × 10¹⁹ | 1.75 × 10¹⁹ | −0.17 | 1.01 | −1.03 | 1.75 × 10¹⁹ |
| Underestimated | 5.07 × 10¹⁷ | 1.41 × 10²⁰ | 3.12 × 10¹⁹ | 2.66 × 10¹⁹ | 11.7 | 66.6 | 25.1 | 2.66 × 10¹⁹ |
| Original Values | Maximum Error | Random Error (7–13%) | ||||
|---|---|---|---|---|---|---|
| Effect | Estimated Regression Coefficient (95% CI) | p-Value | Estimated Regression Coefficient (95% CI) | p-Value | Estimated Regression Coefficient (95% CI) | p-Value |
| Alanine | 0.001 (−0.005 to 0.007) | 0.6657 | 0.001 (−0.004 to 0.006) | 0.6837 | −0.002 (−0.005 to 0.002) | 0.3209 |
| Alkaline | 0.004 (0.001 to 0.007) | 0.0089 | 0.003 (0.001 to 0.006) | 0.0114 | 0.001 (−0.001 to 0.002) | 0.4390 |
| Aspartate | 0.002 (−0.004 to 0.009) | 0.4557 | 0.002 (−0.004 to 0.007) | 0.5079 | 0.000 (−0.003 to 0.003) | 0.9561 |
| Gamma-GT | 0.000 (−0.003 to 0.003) | 0.8390 | 0.000 (−0.002 to 0.003) | 0.7756 | 0.000 (−0.002 to 0.002) | 0.9581 |
| Creatinine | 0.174 (−0.111 to 0.459) | 0.2302 | 0.108 (−0.119 to 0.335) | 0.3479 | −0.010 (−0.106 to 0.085) | 0.8340 |
| Uric acid | −0.015 (−0.059 to 0.028) | 0.4893 | −0.014 (−0.051 to 0.023) | 0.4471 | −0.003 (−0.018 to 0.012) | 0.6832 |
| Glucose | 0.001 (−0.002 to 0.004) | 0.5752 | 0.001 (−0.002 to 0.003) | 0.7143 | −0.000 (−0.001 to 0.001) | 0.7337 |
| Triglycerides | 0.001 (0.000 to 0.002) | 0.0417 | 0.001 (0.000 to 0.002) | 0.0485 | 0.000 (−0.000 to 0.001) | 0.5595 |
| Cholesterol | 0.000 (−0.001 to 0.001) | 0.8951 | 0.000 (−0.001 to 0.001) | 0.9709 | −0.000 (−0.001 to 0.000) | 0.4114 |
| LDL | −0.000 (−0.002 to 0.001) | 0.7338 | −0.000 (−0.001 to 0.001) | 0.6909 | −0.000 (−0.001 to 0.000) | 0.3698 |
| HDL | −0.000 (−0.003 to 0.003) | 0.9506 | −0.000 (−0.003 to 0.002) | 0.8915 | −0.000 (−0.002 to 0.001) | 0.5006 |
| Reactive Protein | 0.077 (−0.001 to 0.155) | 0.0528 | 0.068 (−0.001 to 0.137) | 0.0543 | 0.056 (−0.013 to 0.124) | 0.1133 |
| Interleukin-6 | 0.006 (−0.036 to 0.049) | 0.7645 | 0.005 (−0.032 to 0.042) | 0.7818 | 0.000 (−0.035 to 0.035) | 0.9904 |
| Leptin | −0.004 (−0.010 to 0.002) | 0.2241 | −0.003 (−0.009 to 0.002) | 0.2127 | −0.006 (−0.011 to −0.001) | 0.0186 |
| ICAM1 | 0.000 (−0.000 to 0.001) | 0.5538 | 0.000 (−0.000 to 0.001) | 0.5972 | 0.000 (−0.000 to 0.000) | 0.6356 |
| VCAM1 | −0.000 (−0.001 to 0.000) | 0.4961 | −0.000 (−0.000 to 0.000) | 0.4612 | −0.000 (−0.000 to 0.000) | 0.5804 |
| Case | Effect | Estimated Regression Coefficient (95% CI) | p-Value |
|---|---|---|---|
| Original values | Age | 0.010 (0.002 to 0.019) | 0.0137 |
| Alkaline | 0.002 (−0.001 to 0.005) | 0.2627 | |
| Triglycerides | 0.001 (−0.001 to 0.002) | 0.3456 | |
| CE_18_3 | 0.001 (−0.003 to 0.004) | 0.6840 | |
| CE_20_3 | 0.004 (−0.009 to 0.017) | 0.5224 | |
| CE_20_4 | 0.000 (−0.003 to 0.004) | 0.7970 | |
| PS_38_6 | −0.110 (−0.360 to 0.140) | 0.3865 | |
| Baseline plaque burden | −0.011 (−0.012 to −0.009) | <0.0001 | |
| Min ESS | 0.003 (−0.004 to 0.011) | 0.3676 | |
| Max LDL concentration | −57.466 (−726.391 to 611.460) | 0.8656 | |
| SmartFFR | −0.018 (−0.372 to 0.336) | 0.9202 | |
| Maximum error | Age | 0.011 (0.003 to 0.019) | 0.0107 |
| Alkaline | 0.002 (−0.001 to 0.005) | 0.2372 | |
| Triglycerides | 0.000 (−0.001 to 0.002) | 0.3528 | |
| CE_18_3 | 0.001 (−0.003 to 0.004) | 0.6368 | |
| CE_20_3 | 0.005 (−0.008 to 0.018) | 0.4598 | |
| CE_20_4 | 0.000 (−0.003 to 0.004) | 0.9221 | |
| PS_38_6 | −0.131 (−0.382 to 0.121) | 0.3059 | |
| Baseline plaque burden | −0.011 (−0.012 to −0.009) | <0.0001 | |
| Min ESS | 0.003 (−0.004 to 0.011) | 0.3930 | |
| Max LDL concentration | −99.142 (−770.228 to 571.943) | 0.7709 | |
| SmartFFR | −0.014 (−0.367 to 0.339) | 0.9376 | |
| Random error (7–13%) | Age | 0.012 (0.005 to 0.020) | 0.0023 |
| Leptin | −0.005 (−0.010 to 0.001) | 0.0902 | |
| CE_18_3 | 0.001 (−0.003 to 0.004) | 0.6437 | |
| CE_20_3 | 0.008 (−0.004 to 0.020) | 0.1809 | |
| CE_20_4 | −0.000 (−0.004 to 0.003) | 0.9308 | |
| PS_38_6 | −0.156 (−0.399 to 0.087) | 0.2069 | |
| Baseline plaque burden | −0.011 (−0.013 to −0.010) | <0.0001 | |
| Min ESS | 0.004 (−0.003 to 0.011) | 0.2923 | |
| Max LDL concentration | −33.879 (−693.428 to 625.670) | 0.9194 | |
| SmartFFR | −0.021 (−0.372 to 0.329) | 0.9039 |
Publisher’s Note: MDPI stays neutral with regard to jurisdictional claims in published maps and institutional affiliations. |
© 2021 by the authors. Licensee MDPI, Basel, Switzerland. This article is an open access article distributed under the terms and conditions of the Creative Commons Attribution (CC BY) license (https://creativecommons.org/licenses/by/4.0/).
Share and Cite
Sakellarios, A.I.; Siogkas, P.; Kigka, V.; Tsompou, P.; Pleouras, D.; Kyriakidis, S.; Karanasiou, G.; Pelosi, G.; Nikopoulos, S.; Naka, K.K.; et al. Error Propagation in the Simulation of Atherosclerotic Plaque Growth and the Prediction of Atherosclerotic Disease Progression. Diagnostics 2021, 11, 2306. https://doi.org/10.3390/diagnostics11122306
Sakellarios AI, Siogkas P, Kigka V, Tsompou P, Pleouras D, Kyriakidis S, Karanasiou G, Pelosi G, Nikopoulos S, Naka KK, et al. Error Propagation in the Simulation of Atherosclerotic Plaque Growth and the Prediction of Atherosclerotic Disease Progression. Diagnostics. 2021; 11(12):2306. https://doi.org/10.3390/diagnostics11122306
Chicago/Turabian StyleSakellarios, Antonis I., Panagiotis Siogkas, Vassiliki Kigka, Panagiota Tsompou, Dimitrios Pleouras, Savvas Kyriakidis, Georgia Karanasiou, Gualtiero Pelosi, Sotirios Nikopoulos, Katerina K. Naka, and et al. 2021. "Error Propagation in the Simulation of Atherosclerotic Plaque Growth and the Prediction of Atherosclerotic Disease Progression" Diagnostics 11, no. 12: 2306. https://doi.org/10.3390/diagnostics11122306
APA StyleSakellarios, A. I., Siogkas, P., Kigka, V., Tsompou, P., Pleouras, D., Kyriakidis, S., Karanasiou, G., Pelosi, G., Nikopoulos, S., Naka, K. K., Rocchiccioli, S., Michalis, L. K., & Fotiadis, D. I. (2021). Error Propagation in the Simulation of Atherosclerotic Plaque Growth and the Prediction of Atherosclerotic Disease Progression. Diagnostics, 11(12), 2306. https://doi.org/10.3390/diagnostics11122306