Having summarized the most relevant results on the investigations of macromolecular entrapment inside lipid vesicles, let us illustrate the motivations behind the approach presented here, and show new results.
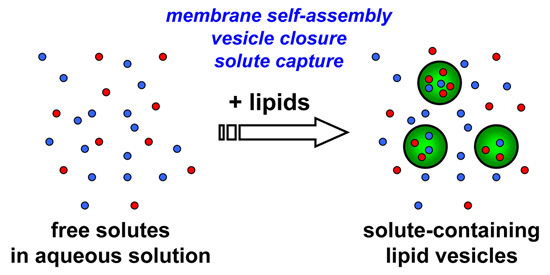
We decided to extend our investigations by using confocal fluorescence microscopy. Fluorescence microscopy is particularly suitable for large vesicles (diameter > 0.4–0.5 μm), and can be used to assess the presence of solutes whose concentration can be measured, in direct or indirect way by a fluorescence signal. Fluorescently-labeled macromolecules or fluorescence-based enzymatic reactions are suitable for these purposes. We aim at studying the encapsulation of macromolecules like proteins, polysaccharides, and nucleic acids (D’Aguanno, manuscript in preparation). Both non-reacting and reacting systems will be presented here. These experiments will ultimately show that the formation of lipid vesicles might act as a sort of “attractors” for molecules present at low concentration in the environment. Such molecules, once encapsulated (and concentrated) inside vesicles, might overcome a concentration threshold that might trigger chemical reactions.
3.1. Liposome Preparation
In order to study the entrapment (encapsulation) of solutes in spontaneously formed vesicles we have chosen vesicle preparation methods that model as better as possible self-organization pathways, with minimal guidance by the operator. As lipids, we have employed the well-known 1-palmitoyl-2-oleoyl-sn-glycero-3-phosphatidylcholine (POPC), alone or in the presence of sodium oleate (20–50 mol%). Note that a similar study based on pure fatty acid vesicles—which are more realistic models of primitive cells—is currently in progress in our laboratory, and it will be published in a dedicated article (D’Aguanno, manuscript in preparation). We are aware of the fact that pure POPC vesicles probably do not represent the best primitive compartments model—although it has been, and is, used frequently, either because POPC is a phospholipid (whereas primitive lipids were simpler molecules, like fatty acids or isoprenoids), either because a mixture of simpler lipids, heterogeneous in terms of chain length and head group, are more plausible as components of early membranes. We will come back to this point in the concluding remarks.
We have optimized the preparation methods in order to obtain vesicles in the micrometer range (95% of vesicle diameters lies in the 0.83–2.5 μm range), so that their visualization by a common confocal microscope is non-ambiguous. The present study therefore differs from previous ones based on cryo-TEM (vesicle diameter < 0.4 μm) because it assays the encapsulation within larger vesicles. It also differs from a published study based on confocal microscopy [
35] because the latter was focused on encapsulation in larger (giant) vesicles (vesicle diameter: 10–20 μm).
Method 1 (M1):
hydration of lipid film [
36]. This traditional vesicle preparation method simply consists in hydrating, with an aqueous solution, a previously dried lipid film. Generally the film is obtained starting from a solution of lipids in chloroform or similar solvent. In this study, for the matter of convenience (hydration with small volumes), we have deposited the lipid film over 2 mm glass beads, similarly to a previous report [
37].
Method 2 (M2):
hydration of freeze-dried lipid vesicles [
38,
39]. This method is similar to the simple film hydration, but instead of using a lipid film, 400 nm (or 800 nm) extruded and then freeze-dried lipid vesicles are used.
Method 3 (M3):
ethanol injection method [
40]. Lipid vesicles can be prepared by injecting a concentrated lipid solution in ethanol (or other water-soluble alcohols) into an aqueous solution. The size and morphology of resulting vesicles depend mainly from the type of lipids and from the concentration of lipids in the stock alcoholic solution [
41,
42]. In particular, large vesicles can be obtained when stock solutions of high concentration (100 mM) are used.
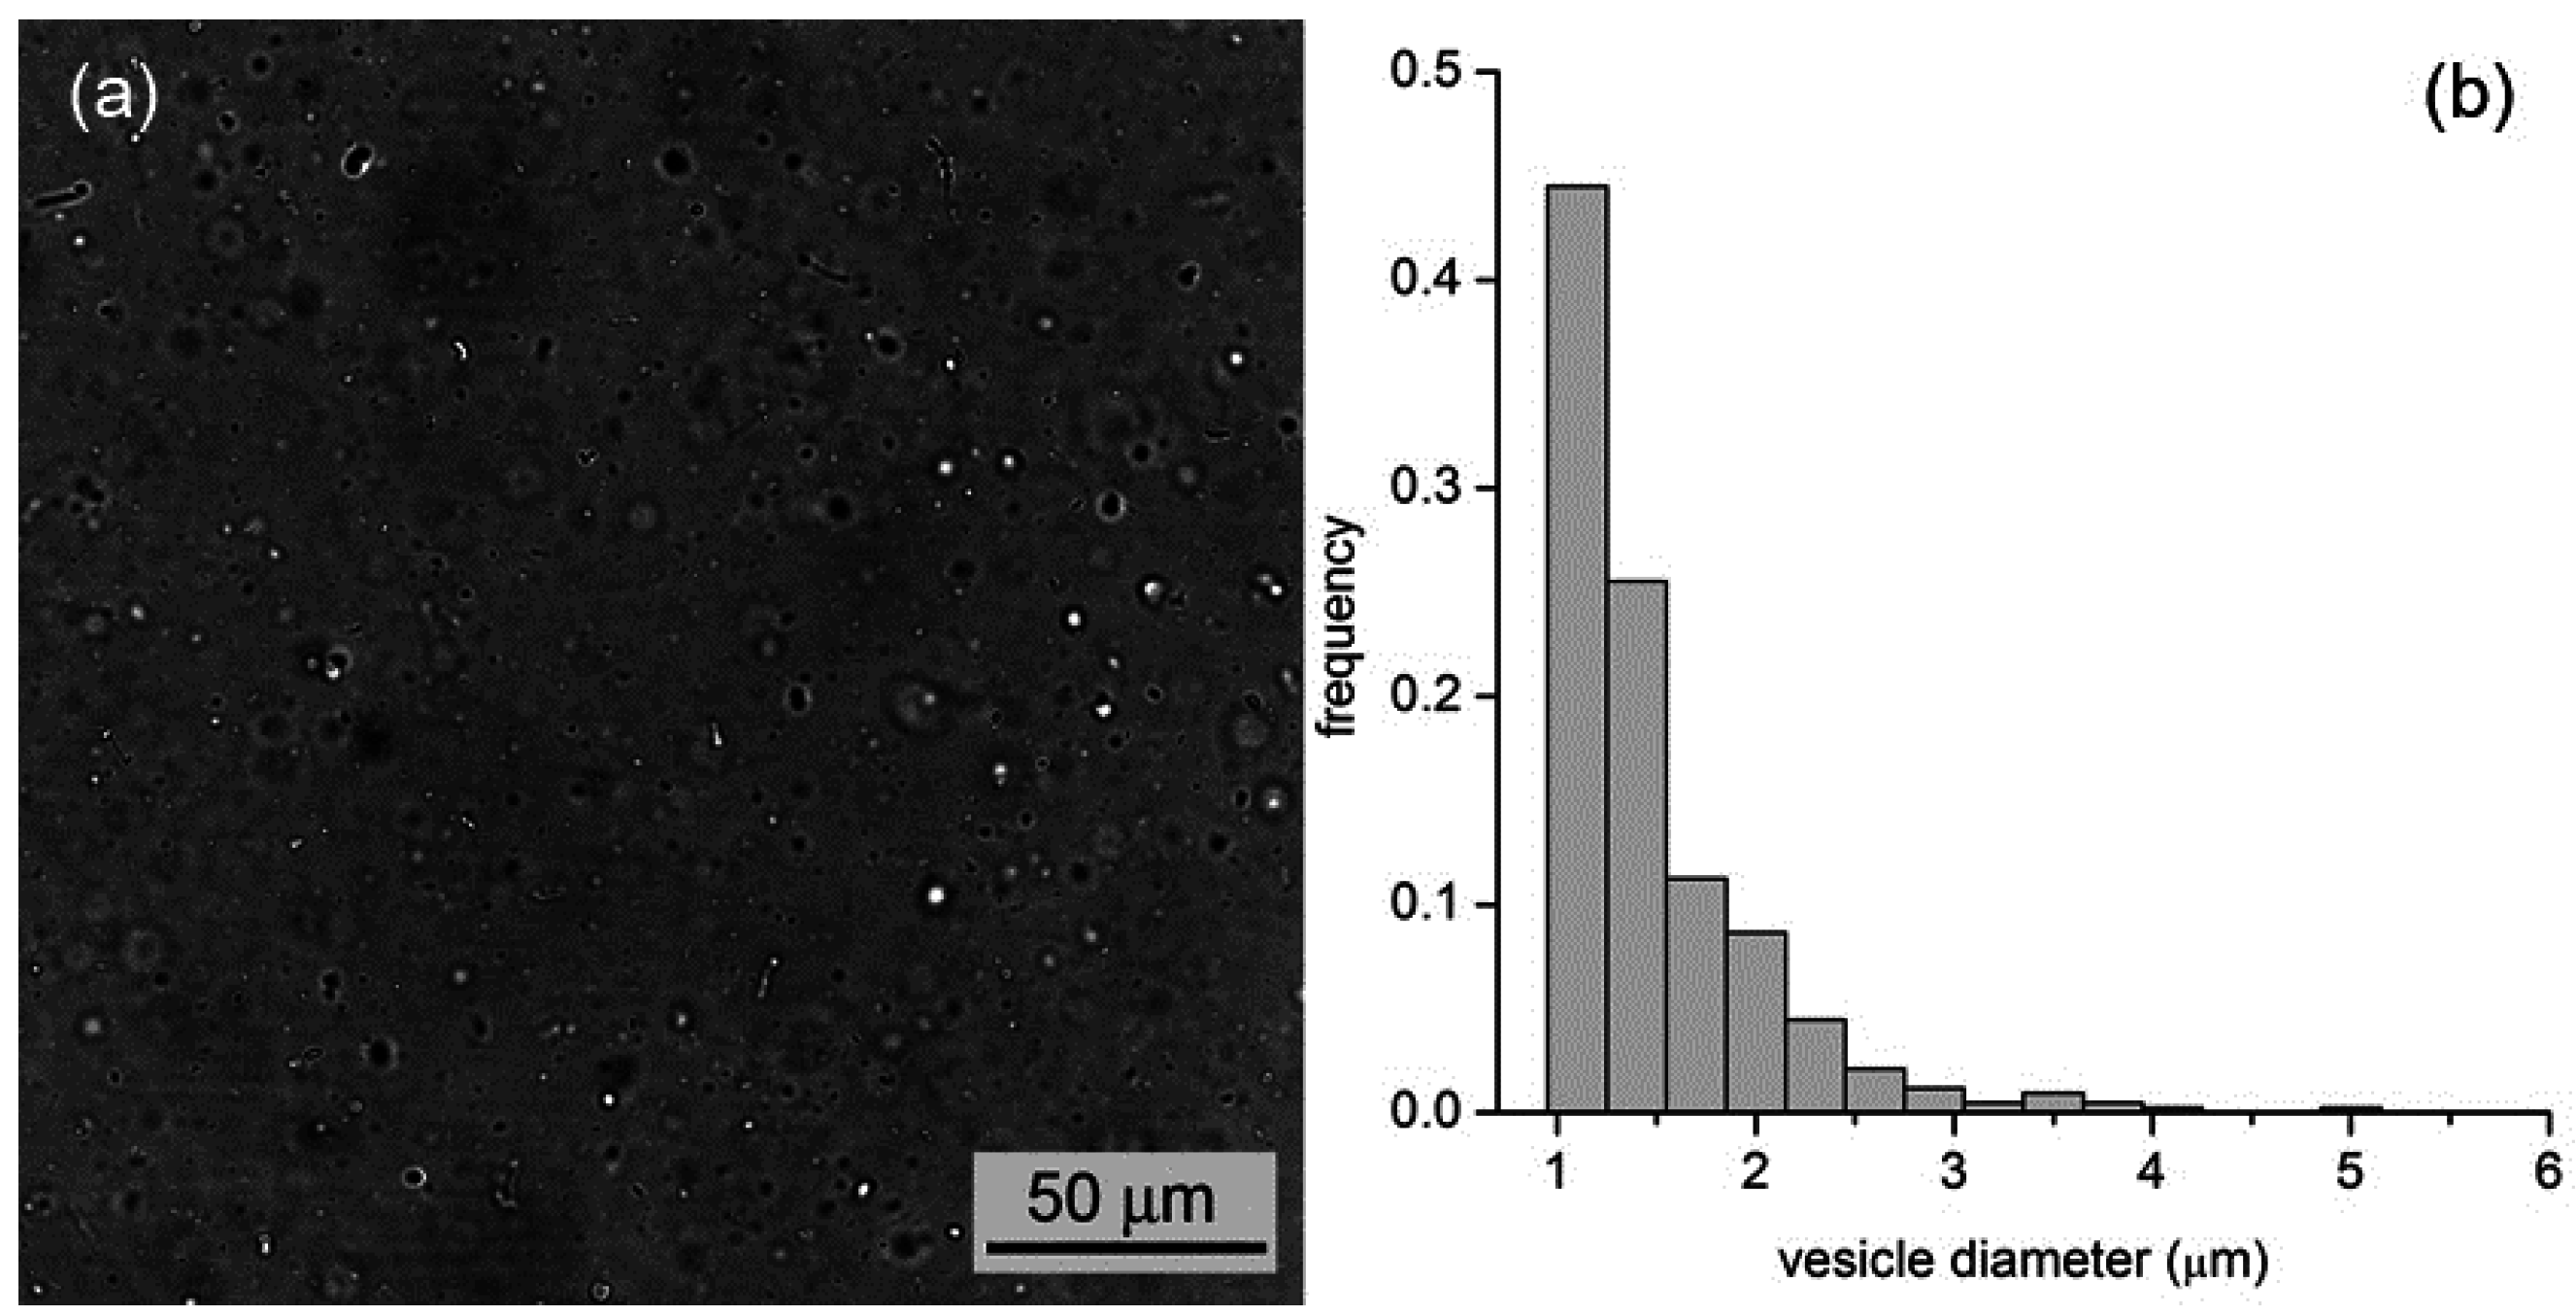
By all methods, we obtained vesicles in the micrometer range. In the case of M1, for example, vesicles with an average diameter of 1.3 μm (standard deviation ±0.6 μm,
n = 427) and a wide size distribution (up to 5–6 μm) have been observed (
Figure 5). In the case of M2 and M3, we obtained, respectively, fluorescent vesicles with diameters of 1.2 ± 0.3 μm (
n = 48) and 1.4 ± 0.5 μm (
n = 55).
Figure 5.
(a) Bright-field microscopy image of a vesicle sample as obtained by the film hydration method (M1); (b) Vesicle size distribution with an average diameter of 1.3 μm.
Figure 5.
(a) Bright-field microscopy image of a vesicle sample as obtained by the film hydration method (M1); (b) Vesicle size distribution with an average diameter of 1.3 μm.
3.2. Entrapment of Proteins and Dextrans
Next, we have investigated the entrapment of solutes inside micrometer-sized vesicles prepared by the abovementioned three methods. We have followed a simple and straightforward procedure, namely preparing a population of lipid vesicles in an aqueous solution that contain a solute of interest at a certain concentration (typically between 0.1 and 5 μM). Then we simply analyzed the so-obtained samples by confocal microscopy (all tested solutes were fluorescent). If the solute molecules, once entrapped, have the same concentration as the bulk solution, liposomes will not be distinguished from the background. If, on the other hand, more solute molecules are entrapped inside liposomes, these will appear more fluorescent than the background.
Preliminary calibration experiment served (i) to build a calibration line for converting fluorescence to concentration (this was done for different instrumental settings, including gain and offset); and (ii) to ensure that the fluorescence values in the accessible range scaled linearly with fluorochrome concentrations, meaning that the assayed concentration range did not suffer of self-quenching and/or inner filter effects.
We have employed common commercially available fluorescent proteins and dextrans with different molecular weights, in particular: dextran conjugated with rhodamine (dextran-RITC, ca. 10 kDa), phycoehrytrhin (PE, ca. 240 kDa), bovine serum albumine conjugated with fluorescein (BSA-FITC, ca. 66 kDa), allophycocyanin (APC, ca. 104 kDa), and dextran conjugated with fluorescein (dextran-FITC, ca. 150 kDa).
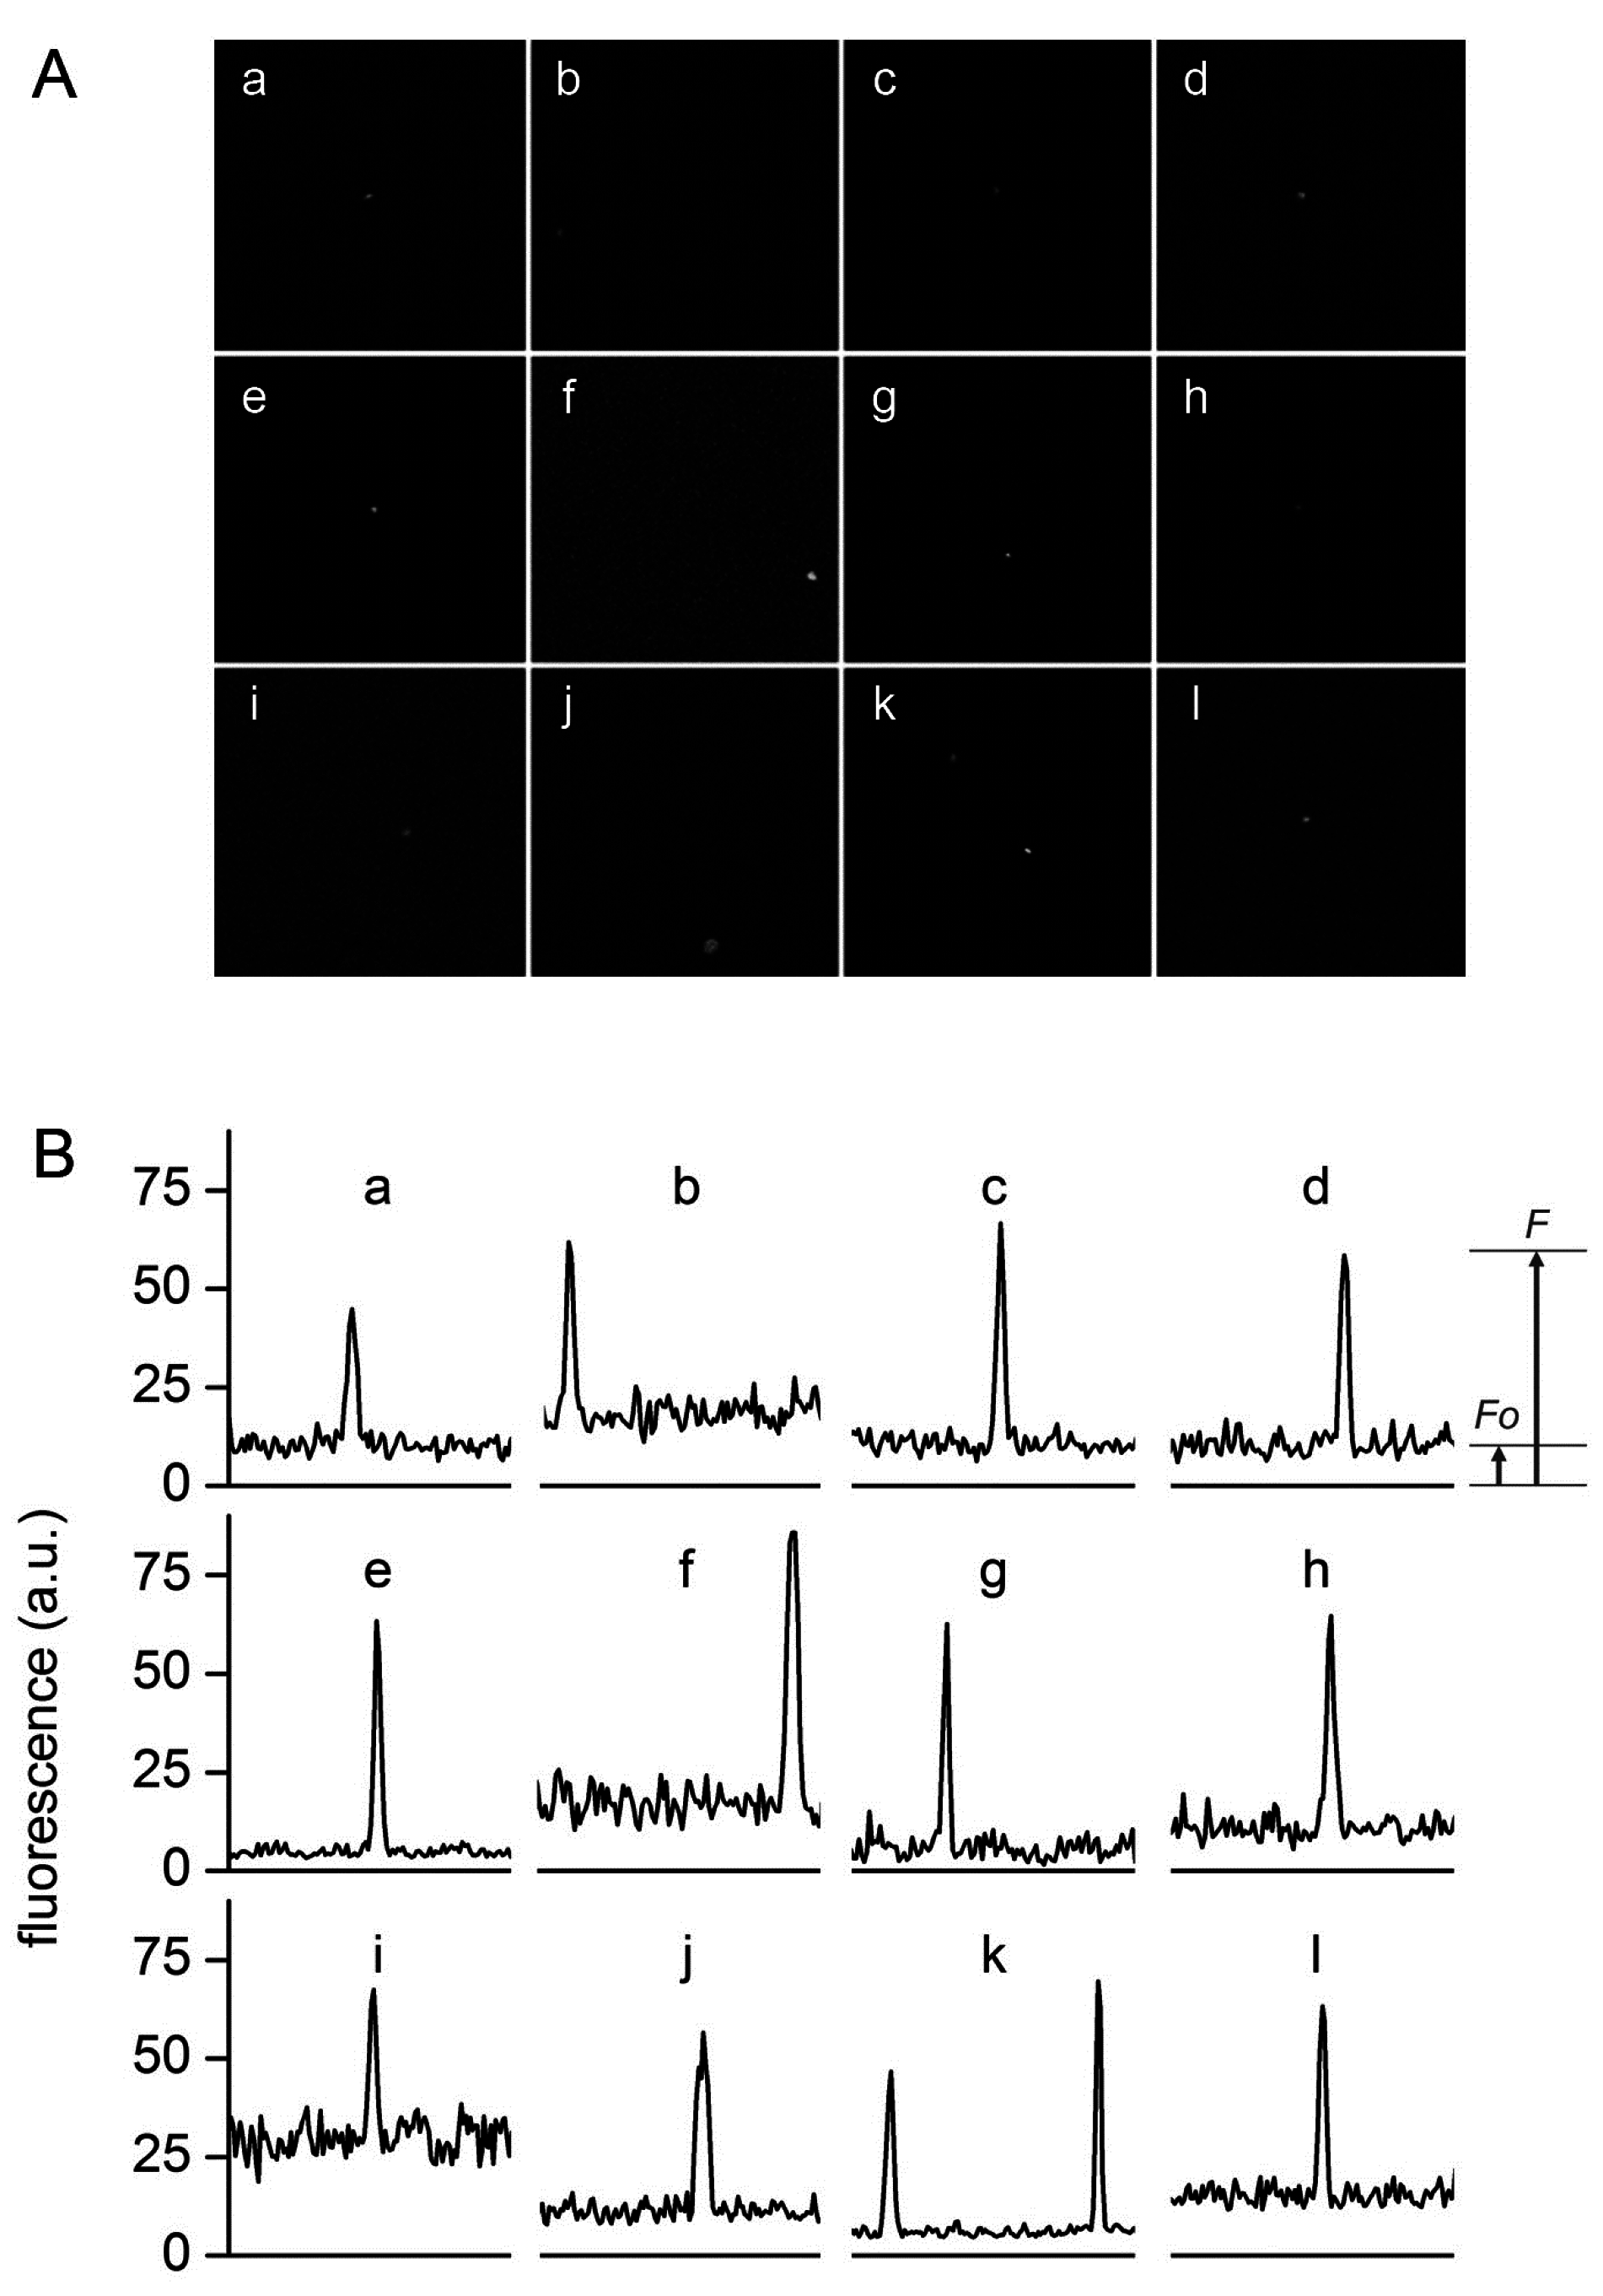
Figure 6.
Typical confocal images (A) and fluorescence profiles; (B) of lipid vesicles whose fluorescence exceeds the fluorescence of the external solution. Solutes: Dextran-FITC (a, b, i), BSA-FITC (c, d, f, g, j, k), dextran-RITC (e), APC (l), PE (h). Methods: M1 (b, e, g, h, i-l), M2 (c, d), M3 (a). The diameters (μm) and the rF values of the vesicles are, respectively: (a) 1.3, 4.3; (b) 1.2, 3.4; (c) 1.8, 6.1, (d) 1.5, 6.4; (e) 1.4, 13; (f) 1.3, 6.1; (g) 1.2, 10.6; (h) 1.3, 6.3; (i) 2.7, 2.3; (j) 1.0, 5.5; (k) 1.5, 7.3 and 1.2, 10.8; (l) 1.4, 4.2.
Figure 6 shows a set of typical images obtained by confocal microscopy. Similar images have been obtained for all macromolecular solutes investigated in this work. The results can be summarized as follows. When solutes alone were imaged, a homogeneous fluorescence was always observed. Aggregates were observed only in very rare cases. When vesicles were prepared in the presence of solutes, in all methods and for all lipid concentrations, and for all solutes, we have always observed a small but significant number of vesicles (somehow visible also in bright field) whose fluorescence was higher than the background. If we call
F0 the background fluorescence, and
F the vesicle fluorescence, it is possible to define, for each visible vesicle, an in/out fluorescence ratio
rF =
F/
F0 that indicates how many times intra-vesicle fluorescence is higher than background fluorescence, and therefore how many times solutes have been concentrated inside a certain vesicle. As evidenced by carrying out control experiments with fluorescent-labeled lipids (
Figure 7), the great majority of vesicles are not visible because their internal fluorescence is very near
F0 (indicating that they have encapsulated the expected number of solutes). On average, less than 1%–2% of vesicles were more fluorescent than the background.
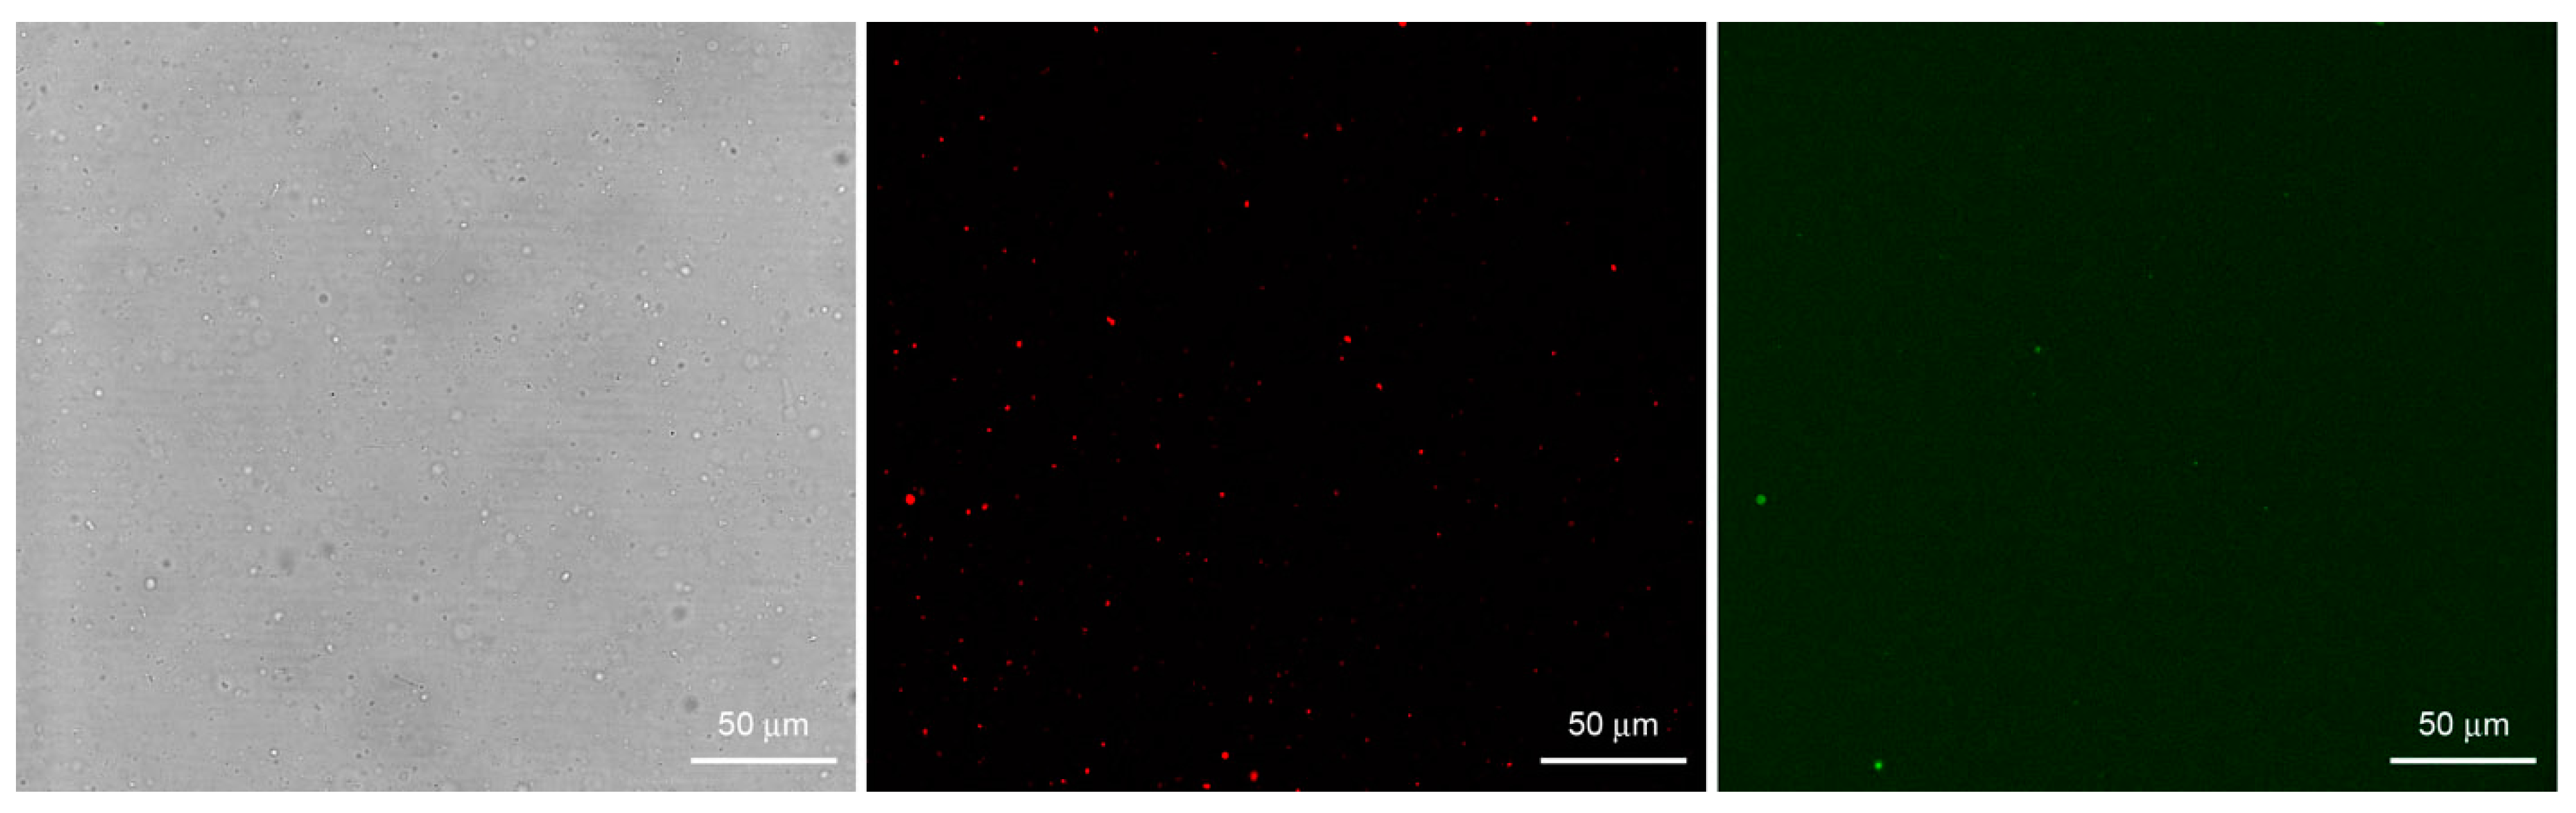
Figure 7.
Bright field (left) and fluorescence confocal images (center, right) of lipid vesicles prepared by the film hydration method (M1) starting from a FITC-dextran solution. Vesicles were made of POPC and 0.05 mol% DOPE-lissamine-rhodamine in order to be red-fluorescent (central image). Note that despite the abundant presence of vesicles, only few of them have encapsulated a high amount of green-fluorescent solute (right image) so to appear more fluorescent than the background.
The diameter d (μm) of the fluorescent vesicles can be estimated by simply considering that the circular (or quasi-circular) area imaged by confocal scanning is a proxy for the vesicle great circle. Being the optical thickness ca. 0.9 μm in our experimental setup, and comparing the vesicle size as appears in bright field images, this approximation appears a viable one.
We have summarized the entrapment results in
Table 1. Actually, each experiment was run several times by changing details of the experimental method (for example: lipid concentration, solute concentration, buffer). However, data have been pooled together because despite the variations of the experimental conditions, the differences between the
rF values of each dataset were not statistically significant (
p > 0.05).
A detailed analysis of the experimental data clearly reveals that there is no correlation between the factors rF and the vesicle size, whereas a conclusion on the possible correlation between rF and bulk solute concentration remains elusive in this study (statistical analysis provides inconsistent results).
On average, the ˂
rF˃ values lie around 3–4, with some exceptions (5.7, 6.1, 12). This was not unexpected because of the very stochastic nature characterizing the process under study. This behavior (occasional occurrence of high in/out ratios) has also been found in kinetic experiments (see below) as well as in previous studies [
9,
10,
11].
In all cases, the fluorescence distribution is asymmetric (with positive skewness values up to about 2.8), as summarized in
Figure 8. This means that there are, on the right-hand side of these distributions,
rF values that are higher than the average. These maxima (
rF,max) are also reported in
Table 1, along with the mean
rF values. These values refer to rare vesicles whose fluorescence is rather high when compared not only to the fluorescence background, but also to the other vesicles. In other words, these vesicles lie at the extreme of the vesicle fluorescence distribution. Note that these very bright vesicles (with
rF > ˂
rF˃) represent a fraction of 0.01%–0.02% of the entire vesicle population.
Table 1.
Average and maximal rF values for different solutes and vesicle preparation methods.
Table 1.
Average and maximal rF values for different solutes and vesicle preparation methods.
| Solute | MW (kDa) | Lipids | Method c | ˂rF˃ ± SD (n) d | rF,max | Note |
|---|
| Calcein | 0.67 | POPC | M1 | n.a. | n.a. | – e |
| Dextran-RITC | 10 | POPC | M1 | 12 ± 3.8 (11) | 19.8 | – f |
| BSA-FITC | 66 | POPC | M1 | 5.7 ± 4.5 (69) | 29 | – f |
| BSA-FITC | 66 | PB33PEO29 a | M1 | 2.9 ± 0.2 (19) | 3.2 | – g |
| BSA-FITC | 66 | POPC | M2 | 3.7 ± 1.4 (48) | 7.7 | – g |
| BSA-FITC | 66 | POPC ± oleate b | M3 | 3.5 ± 1.1 (13) | 8.6 | – f |
| APC | 104 | POPC | M1 | 3.9 ± 1.6 (19) | 7.3 | – h |
| Dextran-FITC | 150 | POPC | M1 | 2.7 ± 1.0 (15) | 5.1 | – f |
| Dextran-FITC | 150 | POPC ± oleate b | M3 | 3.8 ± 1.1 (55) | 6.4 | – f |
| PE | 240 | POPC | M1 | 6.1 ± 2.3 (11) | 9.9 | – i |
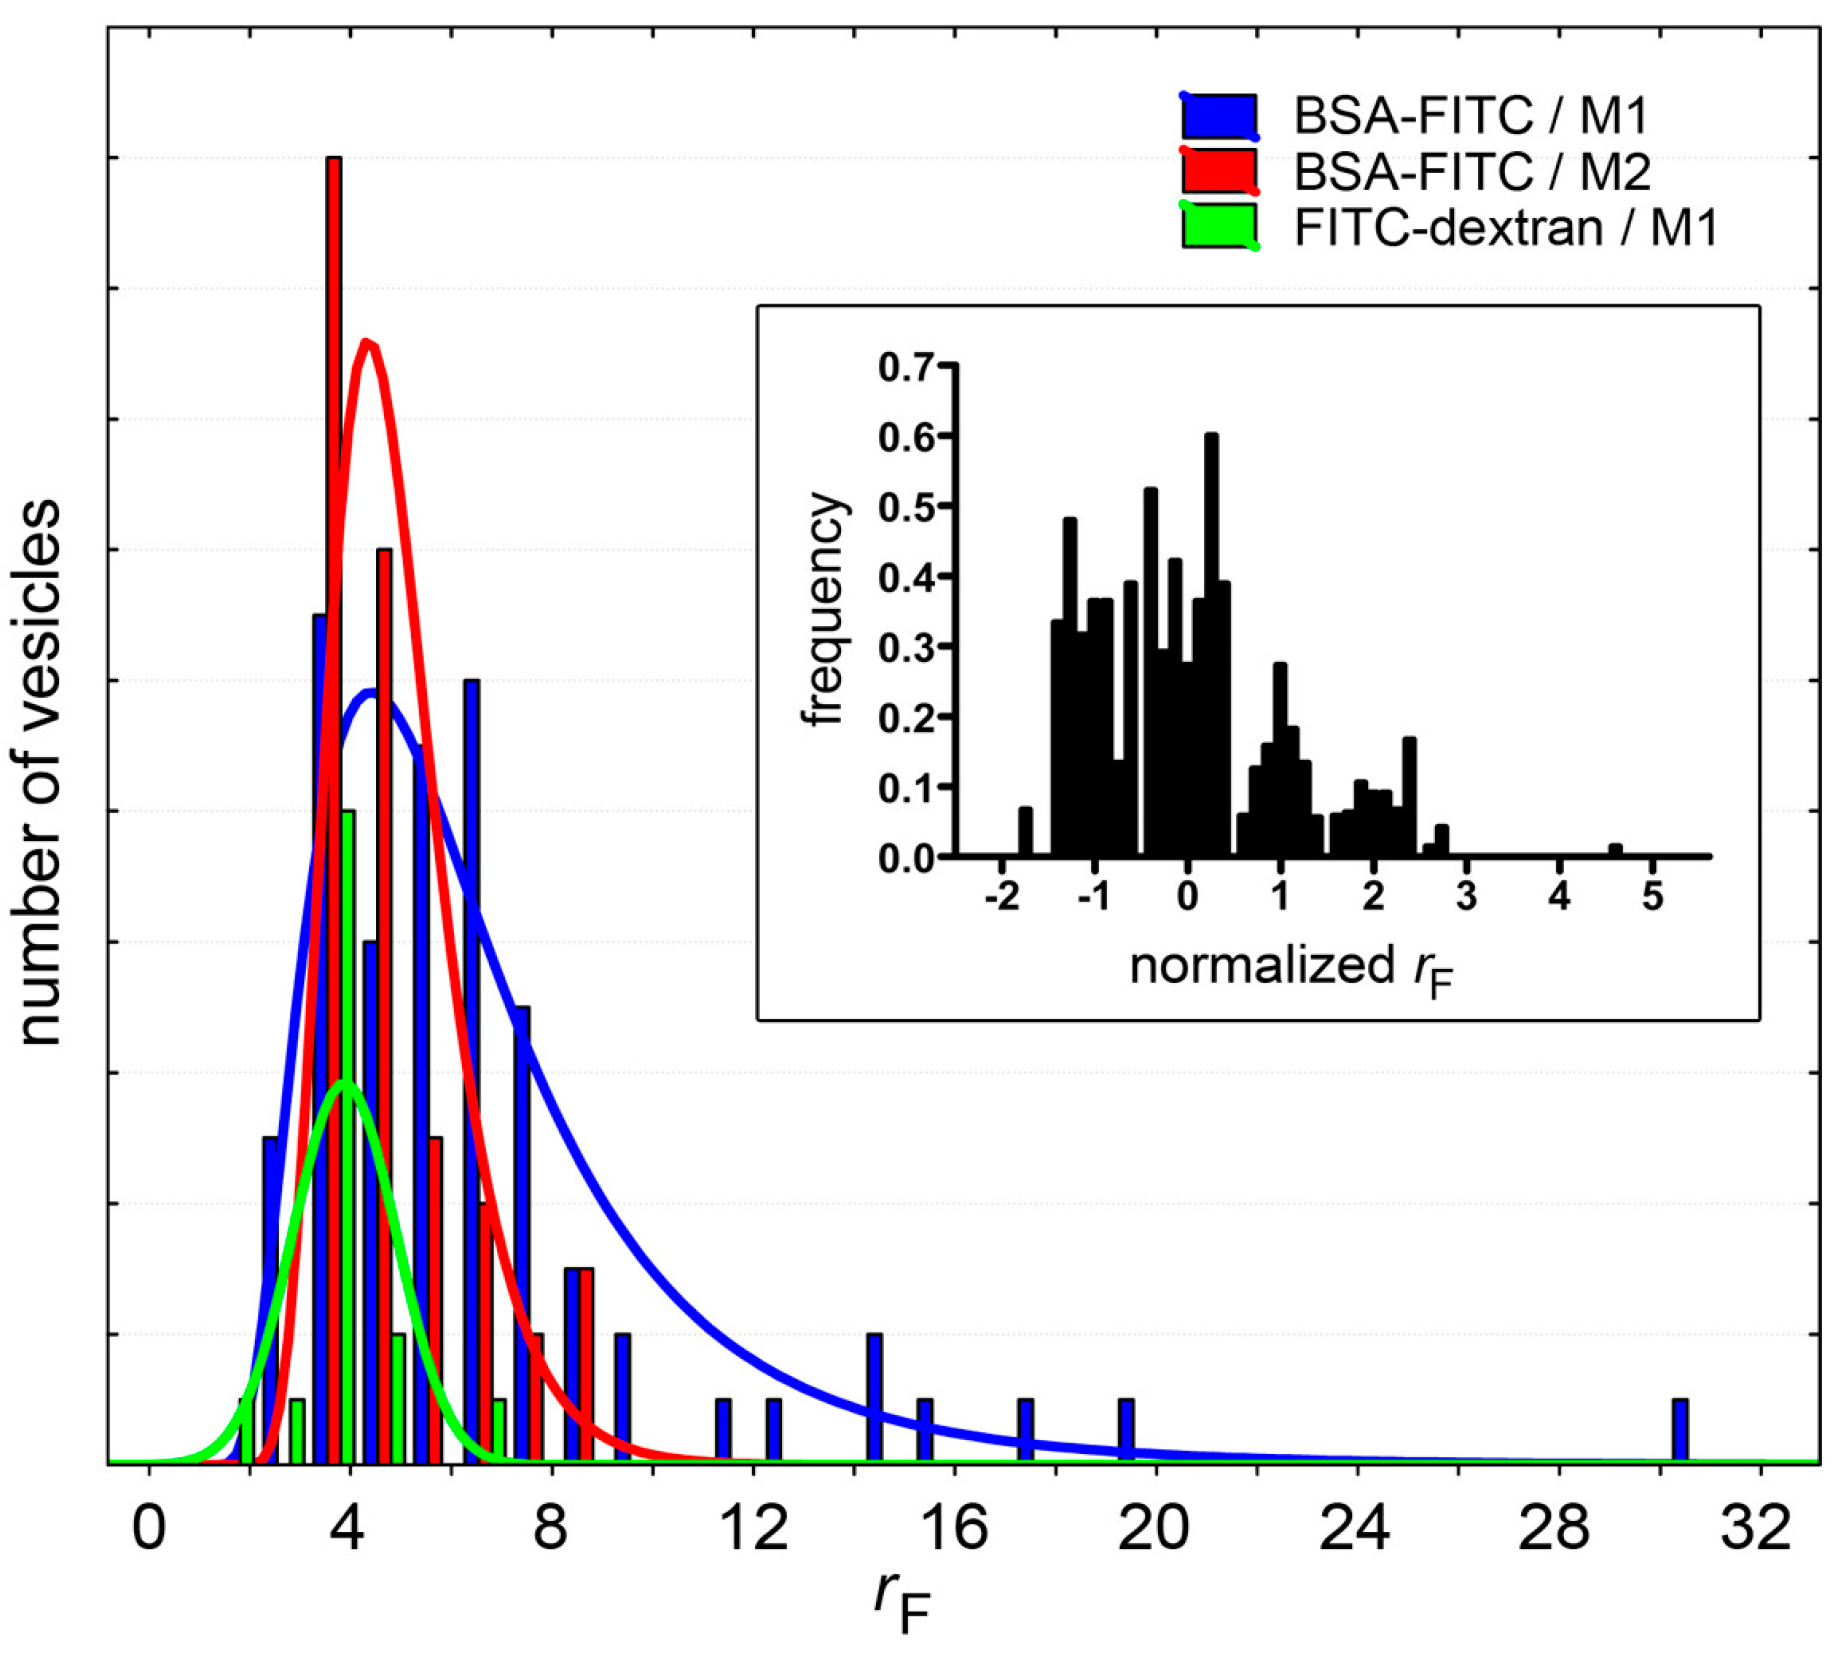
Figure 8.
Fluorescence distributions of solute-containing vesicles (only cases with
n > 48 have been shown, see
Table 1). Note that whereas for BSA-FITC the distributions can be fitted with a log-normal curve (red and blue sets), FITC-dextran-containing vesicles have an approximately normal
rF distribution (green). Inset: To compare different populations (all solutes in
Table 1), the distributions of normalized
rF values are shown; where
rF,normalized = (
rF − ˂
rF˃)/SD. It should be noted, however, that since these distributions have been built with a small number of events, their interpretation should be done with caution.
Importantly, in analogous experiments with the low molecular weight solute calcein (0.67 kDa, used at a concentration of 1.25–10 μM) it was not possible to detect vesicles with fluorescence higher than the background.
3.3. Entrapment of Enzymes—Rate Enhancement
Having shown that the concentration of macromolecules spontaneously entrapped inside some liposomes can be higher than the external concentration by a factor rF, the next step is to show how this phenomenon impacts on chemical reactions inside liposomes.
Clearly, in those liposomes where the concentrations of chemicals are higher than in the environment, a faster reaction rate is expected. This scenario can be experimentally tested with simple enzyme reactions (we have already seen that in the case of complex, multi-step reactions, such as the protein synthesis, the spontaneous concentration of the macromolecular TX-TL machinery can even trigger the otherwise undetectable or not-occurring protein synthesis).
Here we have developed two simple scenarios: (i) an enzyme is encapsulated within vesicles, and a permeable, low-MW substrate is added afterward; (ii) an enzyme and a macromolecular substrate are co-encapsulated within vesicles, and reaction occurs immediately.
The data shown in
Section 3.2 suggest that the super-concentration effect described in this paper is evident especially for macromolecules. Enzymes are macromolecules and therefore it is expected that when a population of vesicles is formed in an enzyme solution, some of them (usually <1%) will contain a number of enzyme molecules higher than expected. For vesicles of 1–2 μm in diameter, concentration factors around 2.7–6.1 are typically obtained for a variety of solutes (proteins, dextrans). Such values can be used as an educated guess for estimating the behavior of a generic protein that does not establish strong and specific interaction with lipids.
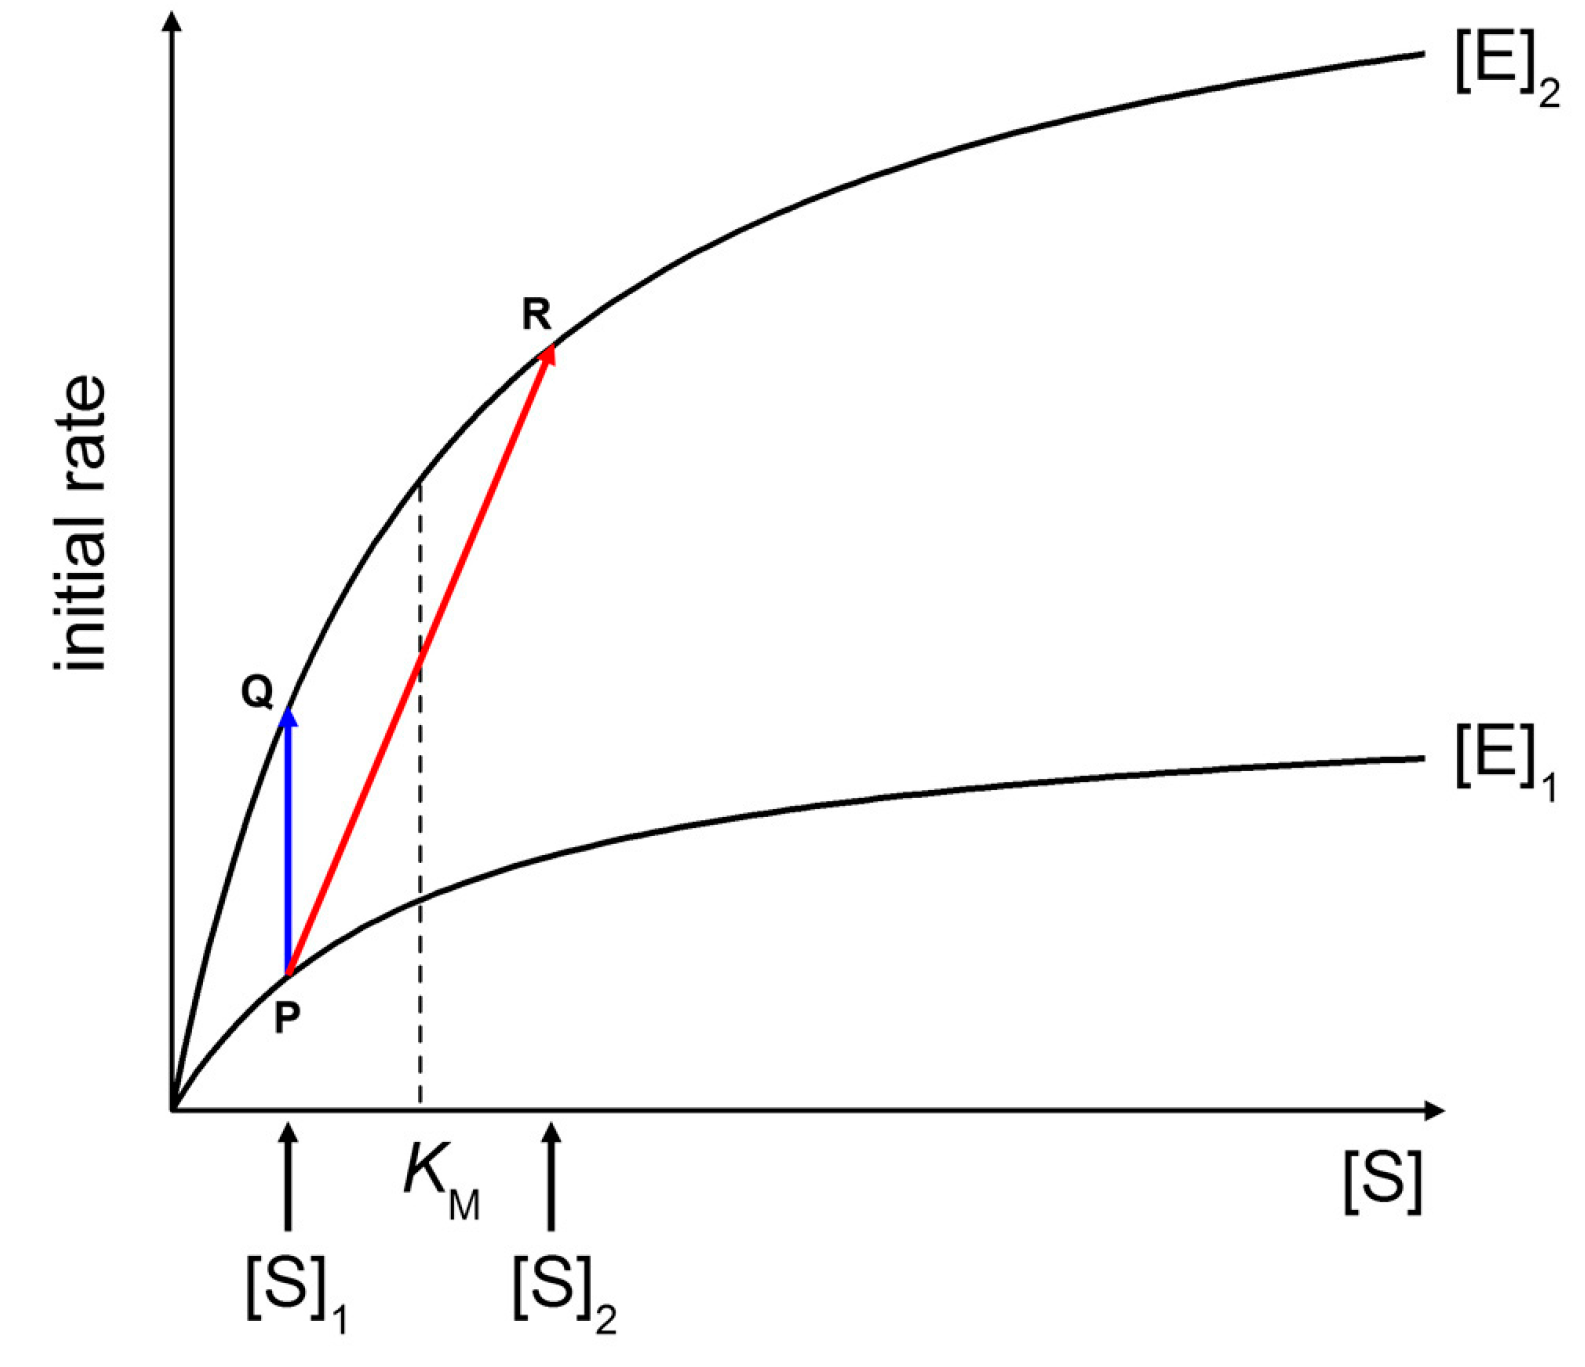
Figure 9 shows two Michaelis-Menten plots referring to a hypothetical case of an enzyme that is concentrated three times when encapsulated within vesicles ([E]
2/[E]
1 = 3). At a fixed substrate concentration [S]
1 (in this example, [S]
1 =
KM/2), an initial rate enhancement of a factor 3 is expected (
Figure 9, blue line from P to Q). Note that such a factor is actually independent from the choice of [S]
1). This example represents the case of macromolecular enzyme and low MW solute, discarding for the moment the problems of substrate permeability rate across the membrane (for a treatment, see below).
If the substrate is also a macromolecule, its encapsulation occurs simultaneously with the enzyme. It can happen that both macromolecules (the enzyme and the substrate) are simultaneously concentrated each by a factor three inside some liposomes ([E]
2/[E]
1 = 3, [S]
2/[S]
1 = 3). As shown in
Figure 9 (red line from P to R), the initial rate enhancement would be of a factor 5.4. Note that in this example [S]
1 =
KM/2 and [S]
2 = 3
KM/2,
i.e., the substrate concentration moves from below to above
KM. The effect here is not so dramatic because we have supposed a low concentration factor (3×), but if a similar mechanism would increase the substrate concentration by a factor 10 or so—as it happens in conventional sub-micrometer vesicles [
9]—one could observe a quite significant rate enhancement inside (few) vesicles.
Figure 9.
Effects of increasing enzyme and substrate concentration on initial rates of Michaelis-Menten kinetics. See text for details.
Figure 9.
Effects of increasing enzyme and substrate concentration on initial rates of Michaelis-Menten kinetics. See text for details.
Here we have studied two experimental systems that recapitulate the two cases illustrated above. In particular, case (i) has been modeled with the reaction between carbonic anhydrase and carboxyfluorescein diacetate, whereas for case (ii) proteinase K and BSA-FITC have been employed.
3.3.1. Carbonic Anhydrase (CA) and Carboxyfluorescein Diacetate (CFDA)
It is well known that carbonic anhydrase (CA) catalyzes other reactions besides the reversible hydration of CO
2, in particular, the hydrolysis of esters has been reported [
43], as the case of
p-nitrophenyl acetate [
44]. We have employed the membrane-permeable substrate 6-carboxyfluorescein diacetate (CFDA) to carry out an enzymatic reaction inside CA-containing liposomes. Notably, the product of the reaction (6-carboxyfluorescein, CF) is membrane impermeable.
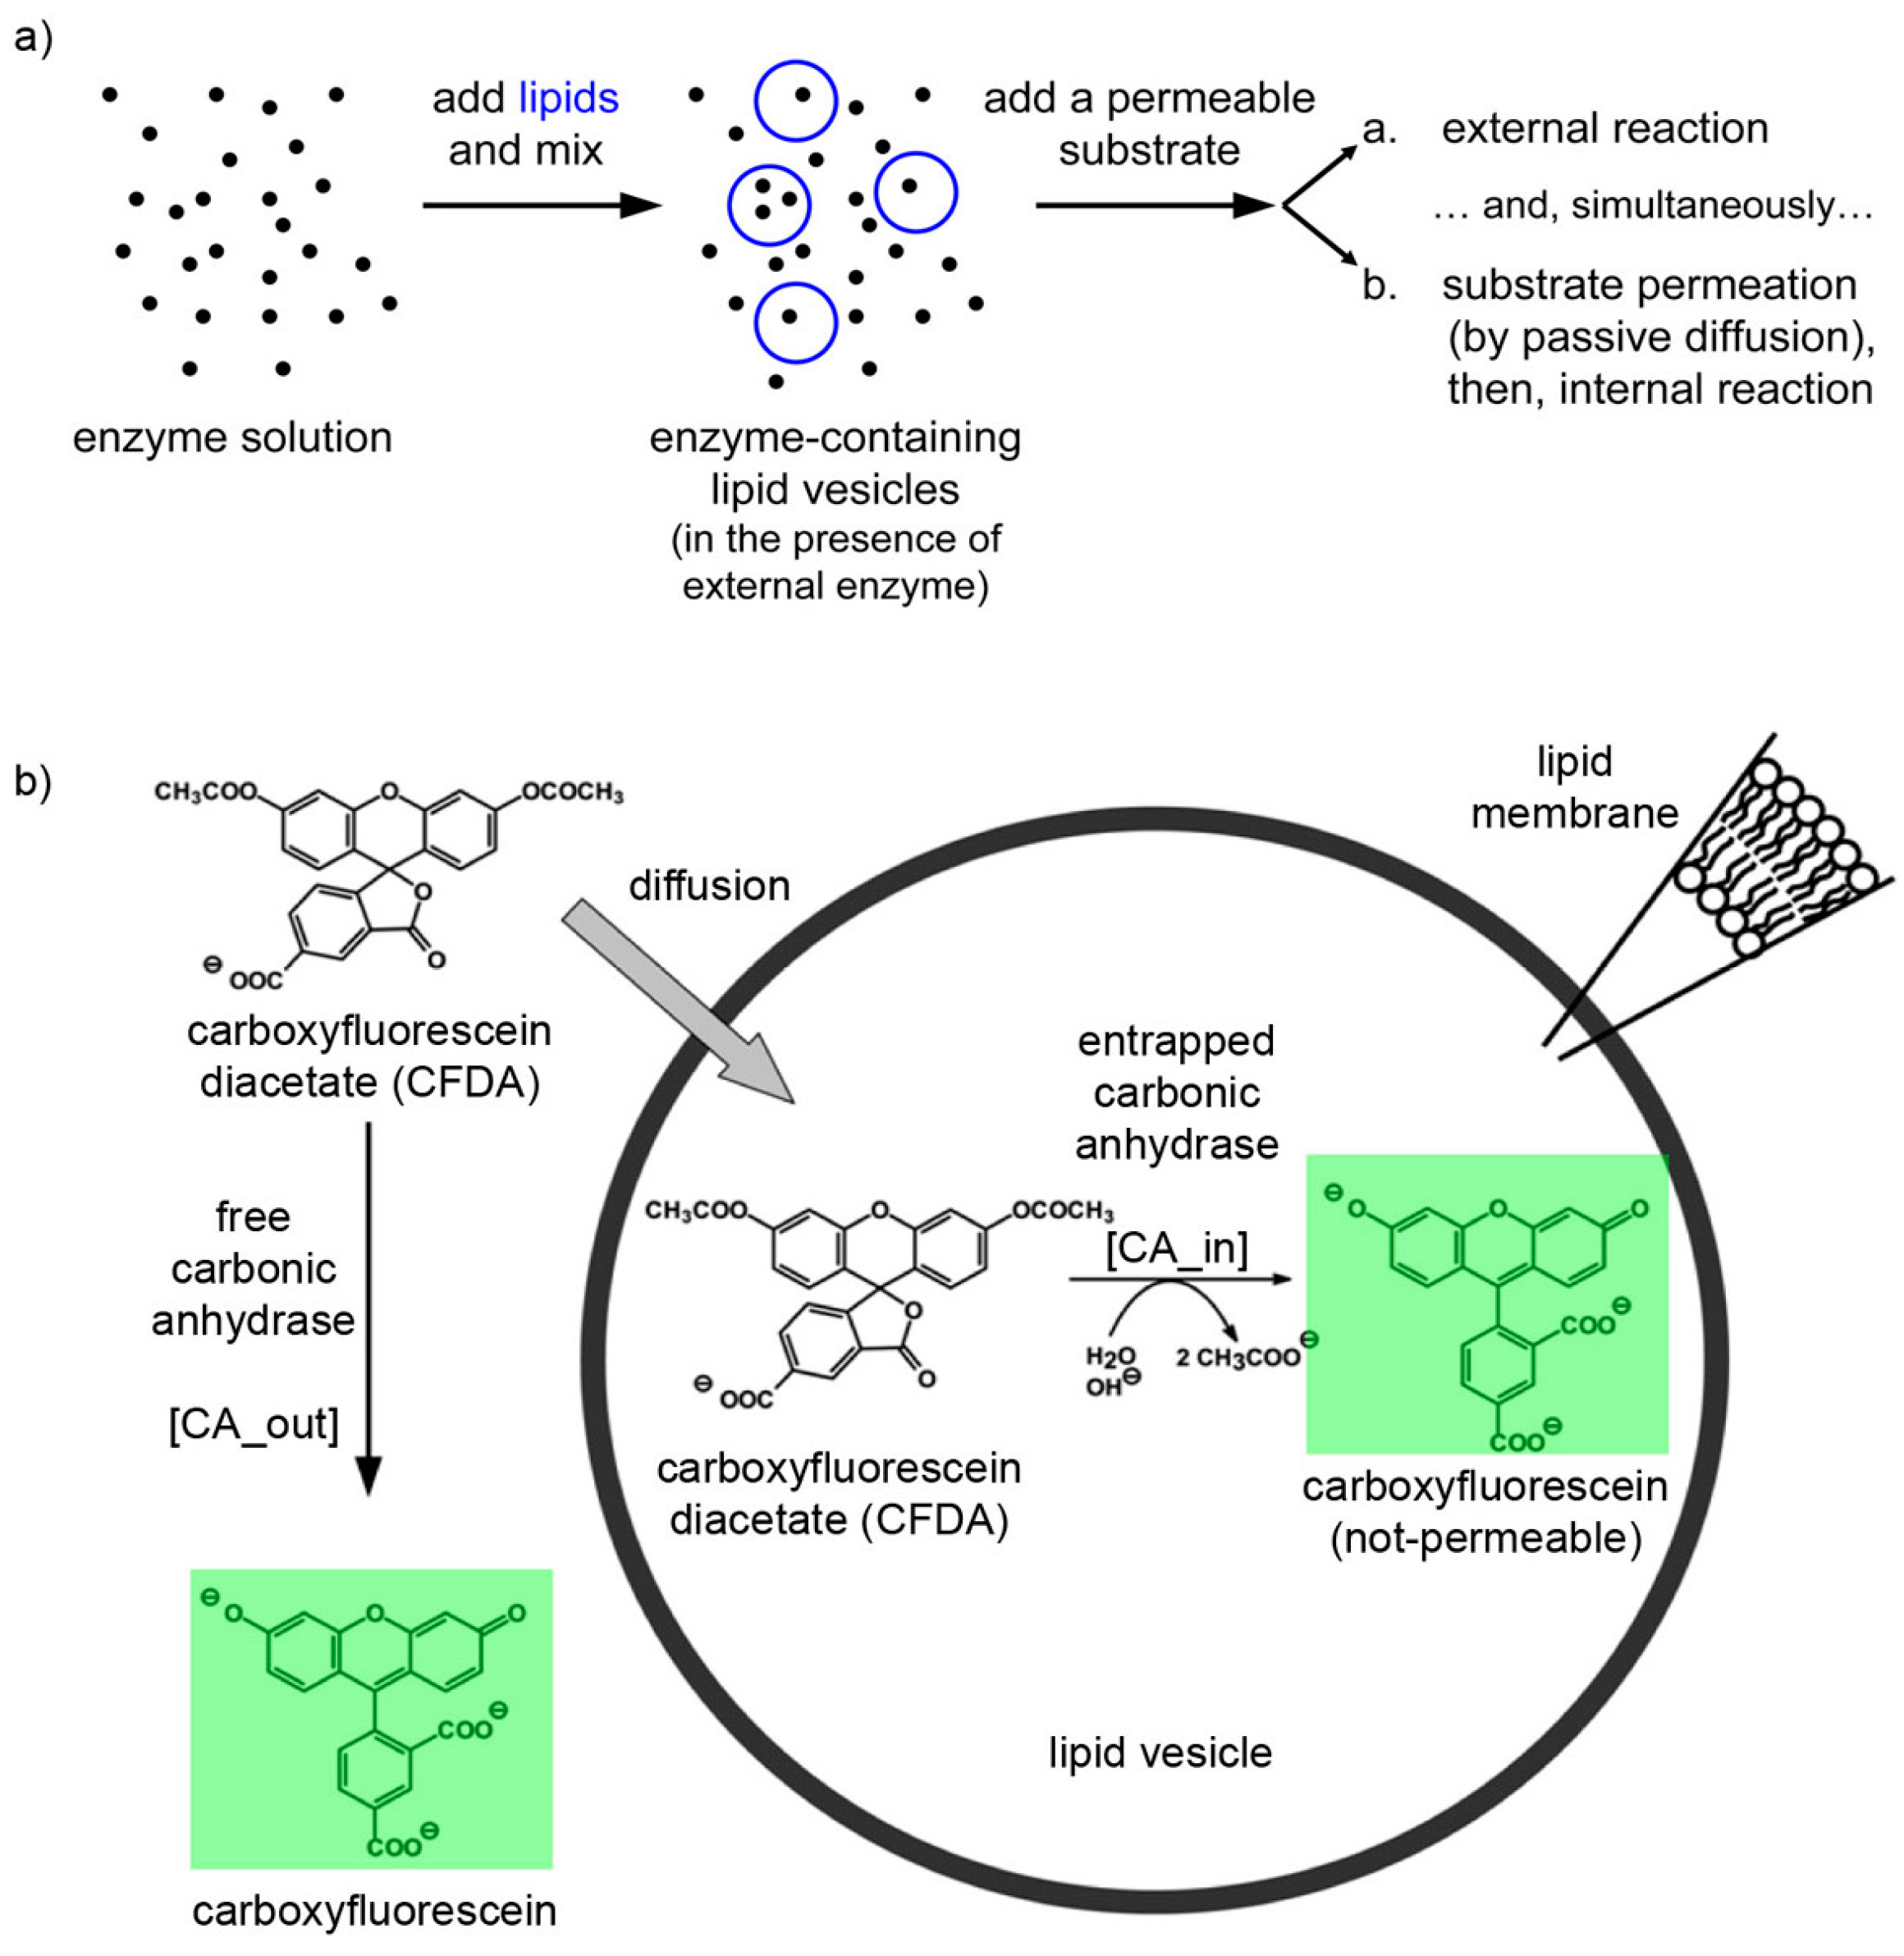
The experimental plan is as it follows. Liposomes are formed in a solution containing CA, so that some of them will presumably contain an excess number of CA molecules due to spontaneous super-concentration of this macromolecule (29 kDa) in the liposome lumen. Next, CFDA is added and it will react both with free (external) and encapsulated CA, with the caveats that in the latter case CFDA shall first permeate the liposome membrane (
Figure 10). Consequently, a comparison between the rates of bulk and liposomal reaction will reveal whether and what extent super-filled CA-containing liposomes form spontaneously.
Experimental results are shown in
Figure 11. It is possible to follow the time course of CFDA hydrolysis by confocal microscopy, recording the fluorescence increase at different times, both in bulk than inside liposomes.
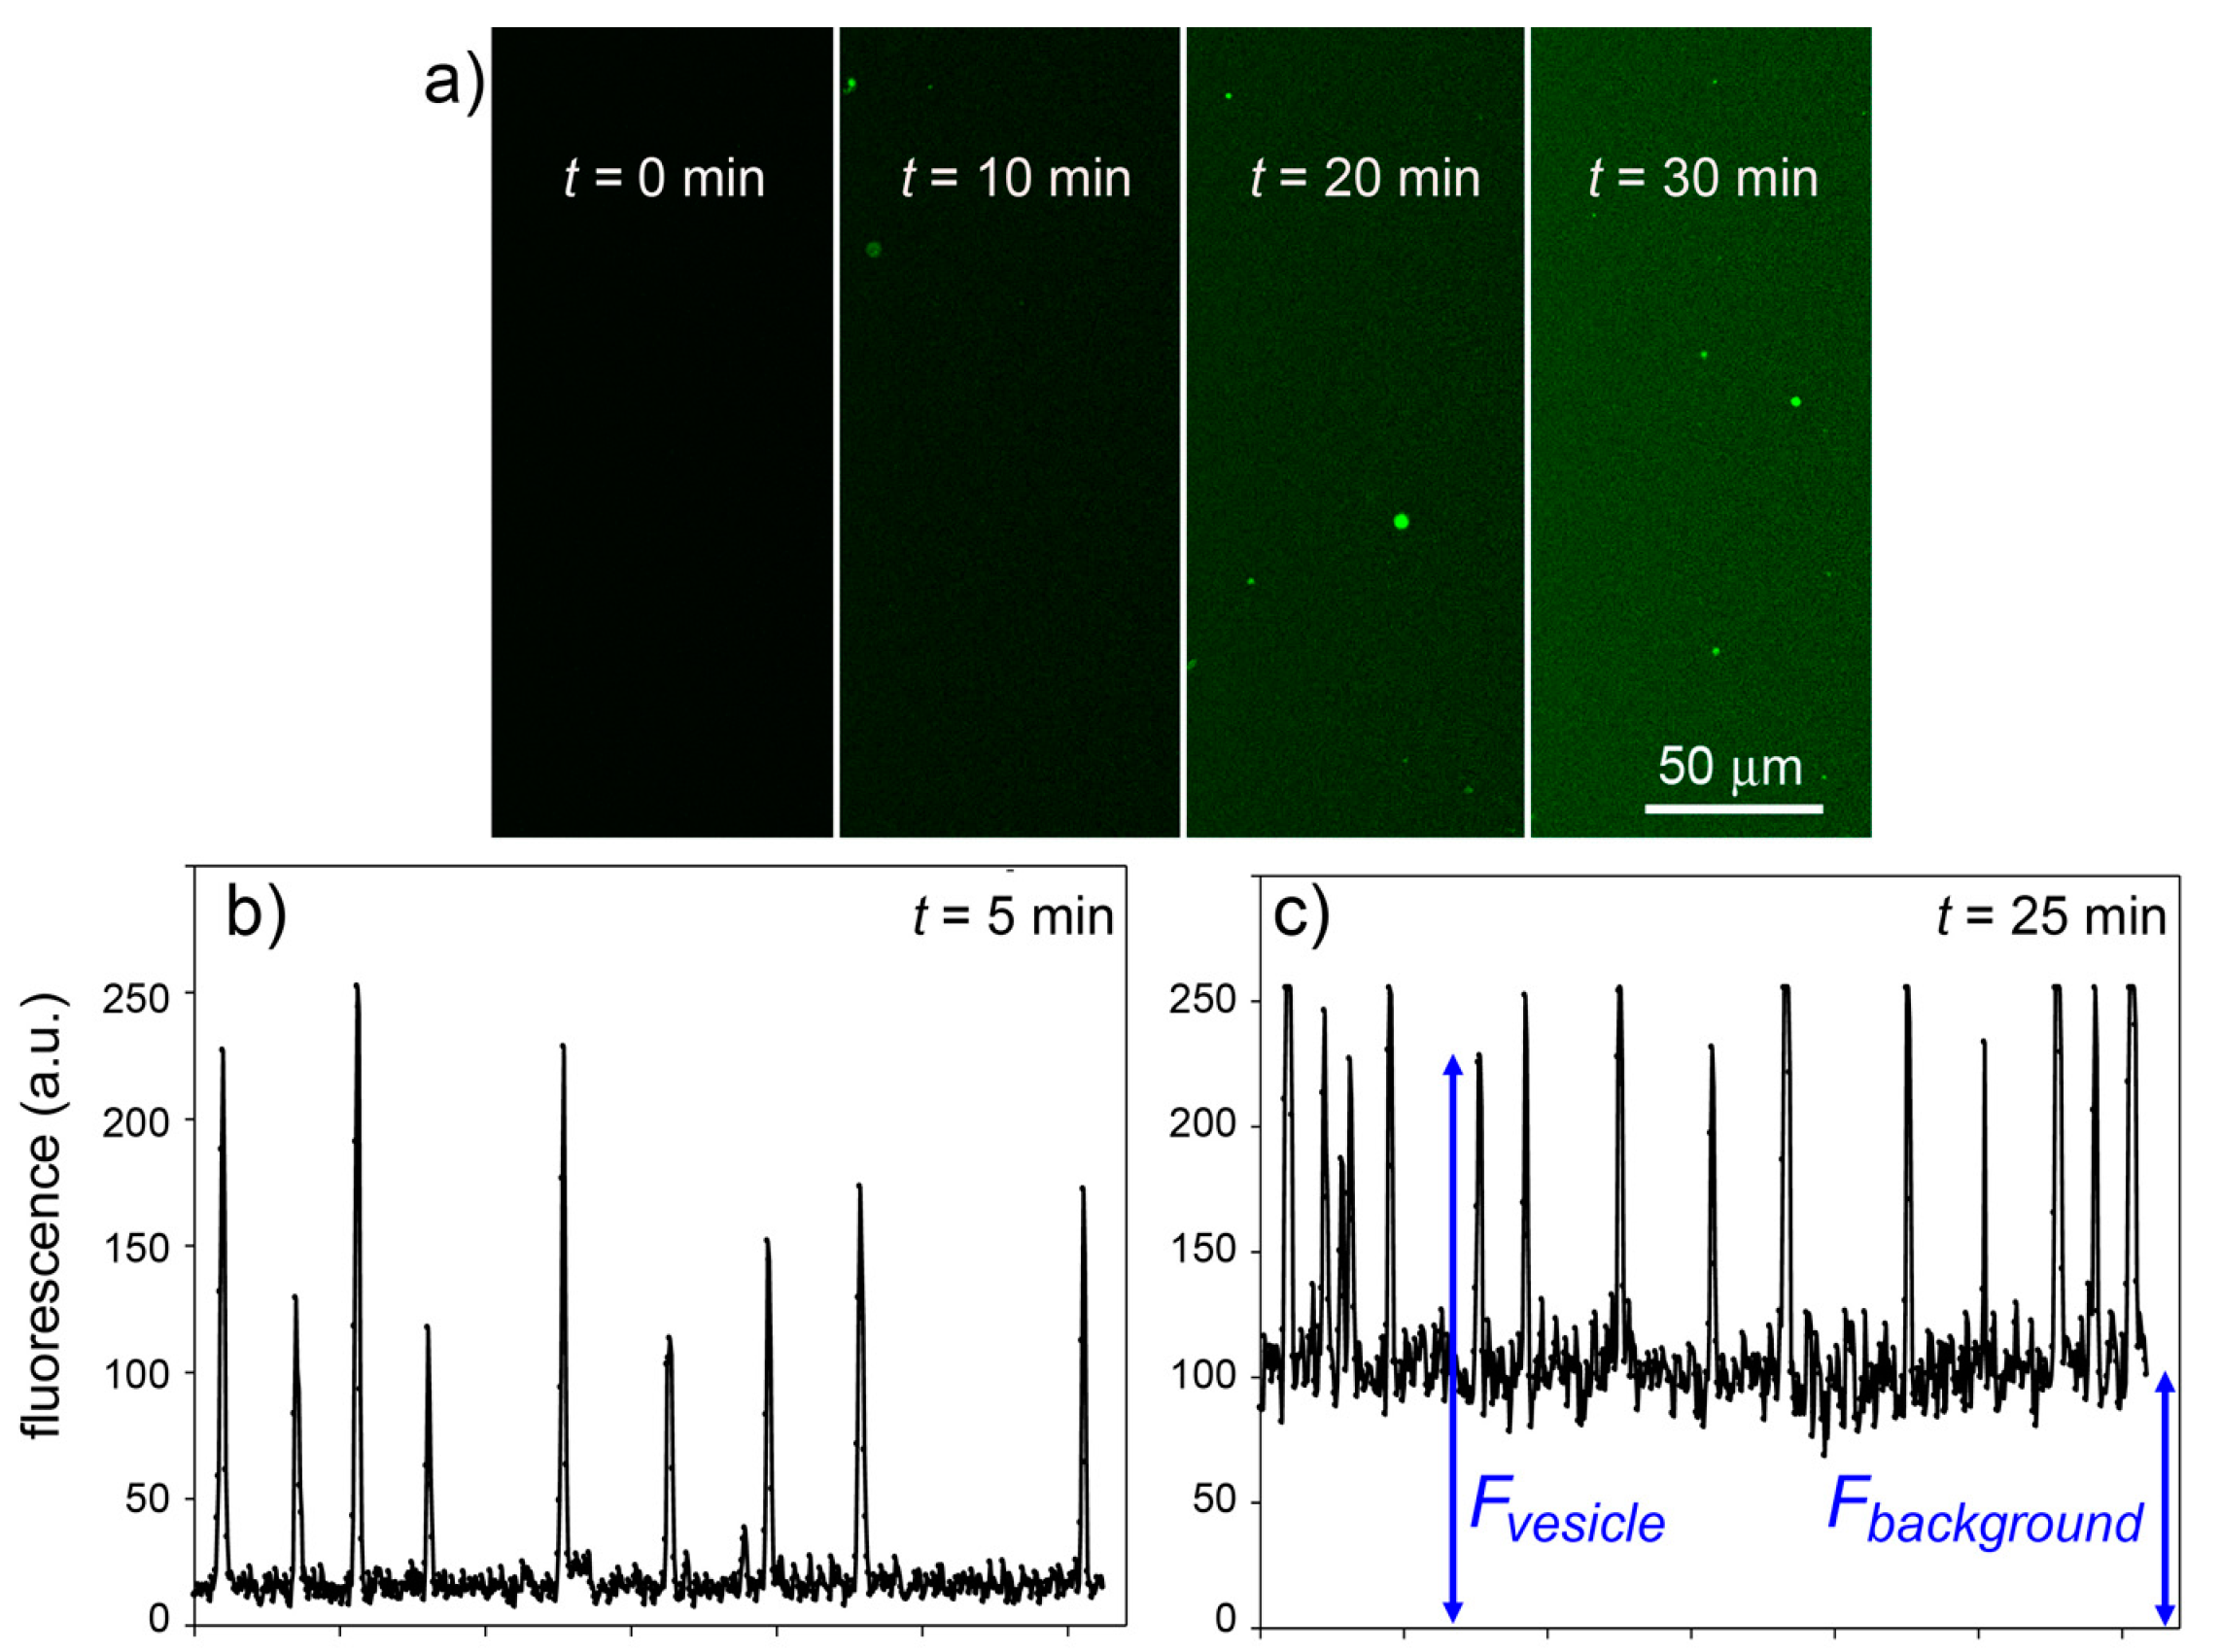
Figure 11a shows typical microscopic images referring to 0, 10, 20 and 30 min after CFDA addition to CA-containing liposomes (note that free, non-entrapped CA was not removed, so that the fluorescence background also increases in time). By measuring the fluorescence of the liposomes and of the background (
Figure 11b,c), at each sampled time, it is possible to plot the rate of enzyme reaction in bulk and inside liposomes. Note that because the liposomes freely float in the solution, it was not possible to follow their individual behavior (namely, the fluorescence increase inside a certain liposome). We therefore captured images containing a number of liposomes and average their fluorescence (the average value, however, is affected by a bias because it is difficult to spot out liposomes that are only slightly more fluorescent than the background; this means that most of the pictures generally contain the brightest liposomes of the population). The fluorescence-
versus-time profiles (inside liposomes and in bulk) are shown in
Figure 12a.
All experiments gave qualitatively similar results, although the numerical reproducibility is hindered by the stochastic nature of the events we are focusing on. Summarizing:
free (non-encapsulated) CA catalyses the hydrolysis of CFDA, and therefore the background fluorescence increases with a specific rate (Vbulk, in fluorescence units/second) corresponding to the bulk reaction; and
few liposomes randomly appeared in the illuminated field as bright spots indicating that inside those liposomes CFDA permeated inside the aqueous lumen and reacted with encapsulated CA. Being brighter than the background, the amount of CF produced per unit of volume (inside liposomes) is higher than the corresponding quantity in bulk. This intraliposome reaction rate is indicated as Vliposome (fluorescence units/second).
The ratio r between these rates (rV = Vliposomes/Vbulk) mirrors, at first approximation, the ratio between the CA concentration inside liposomes and in bulk ([CA]liposome/[CA]bulk), (but see below for a more detailed treatment). It is then possible to estimate the overconcentration of CA inside liposomes in the moment of their formation by measuring the ratio rV.
Figure 10.
(a) Experimental strategy for co-encapsulating an enzyme (carbonic anhydrase, CA, black spots) inside lipid vesicles, followed by adding a membrane-permeable substrate (6-carboxyfluorescein diacetate, CFDA). Note that the external enzyme molecules have not been removed and can react outside vesicles. (b) Details of the system under study, showing that CFDA can either react outside vesicles with free CA either permeate through the lipid membrane, reach the vesicle lumen, and then react with the encapsulated CA. The green-fluorescent product, 6-carboxyfluorescein, has been marked by a green box.
Figure 11.
Experimental results for the CA + CFDA system. (
a) Confocal micrographs showing green fluorescent vesicles that appear in the progress of reaction (
t = 0, 10, 20, 30 min). The vesicles appear more fluorescent than the background although the same reaction is also occurring outside vesicles. (
b,
c) The vesicle fluorescence can be estimated by image analysis (by ImageJ software [
45])—here shown as the pixel luminosity of samples taken at 5 and 25 min after mixing. Note that the fluorescence values of each vesicle greatly differ from each other (giving a fluorescence distribution,
cf. Figure 8) and are well above the background. Note also that the background fluorescence increases with time, as expected.
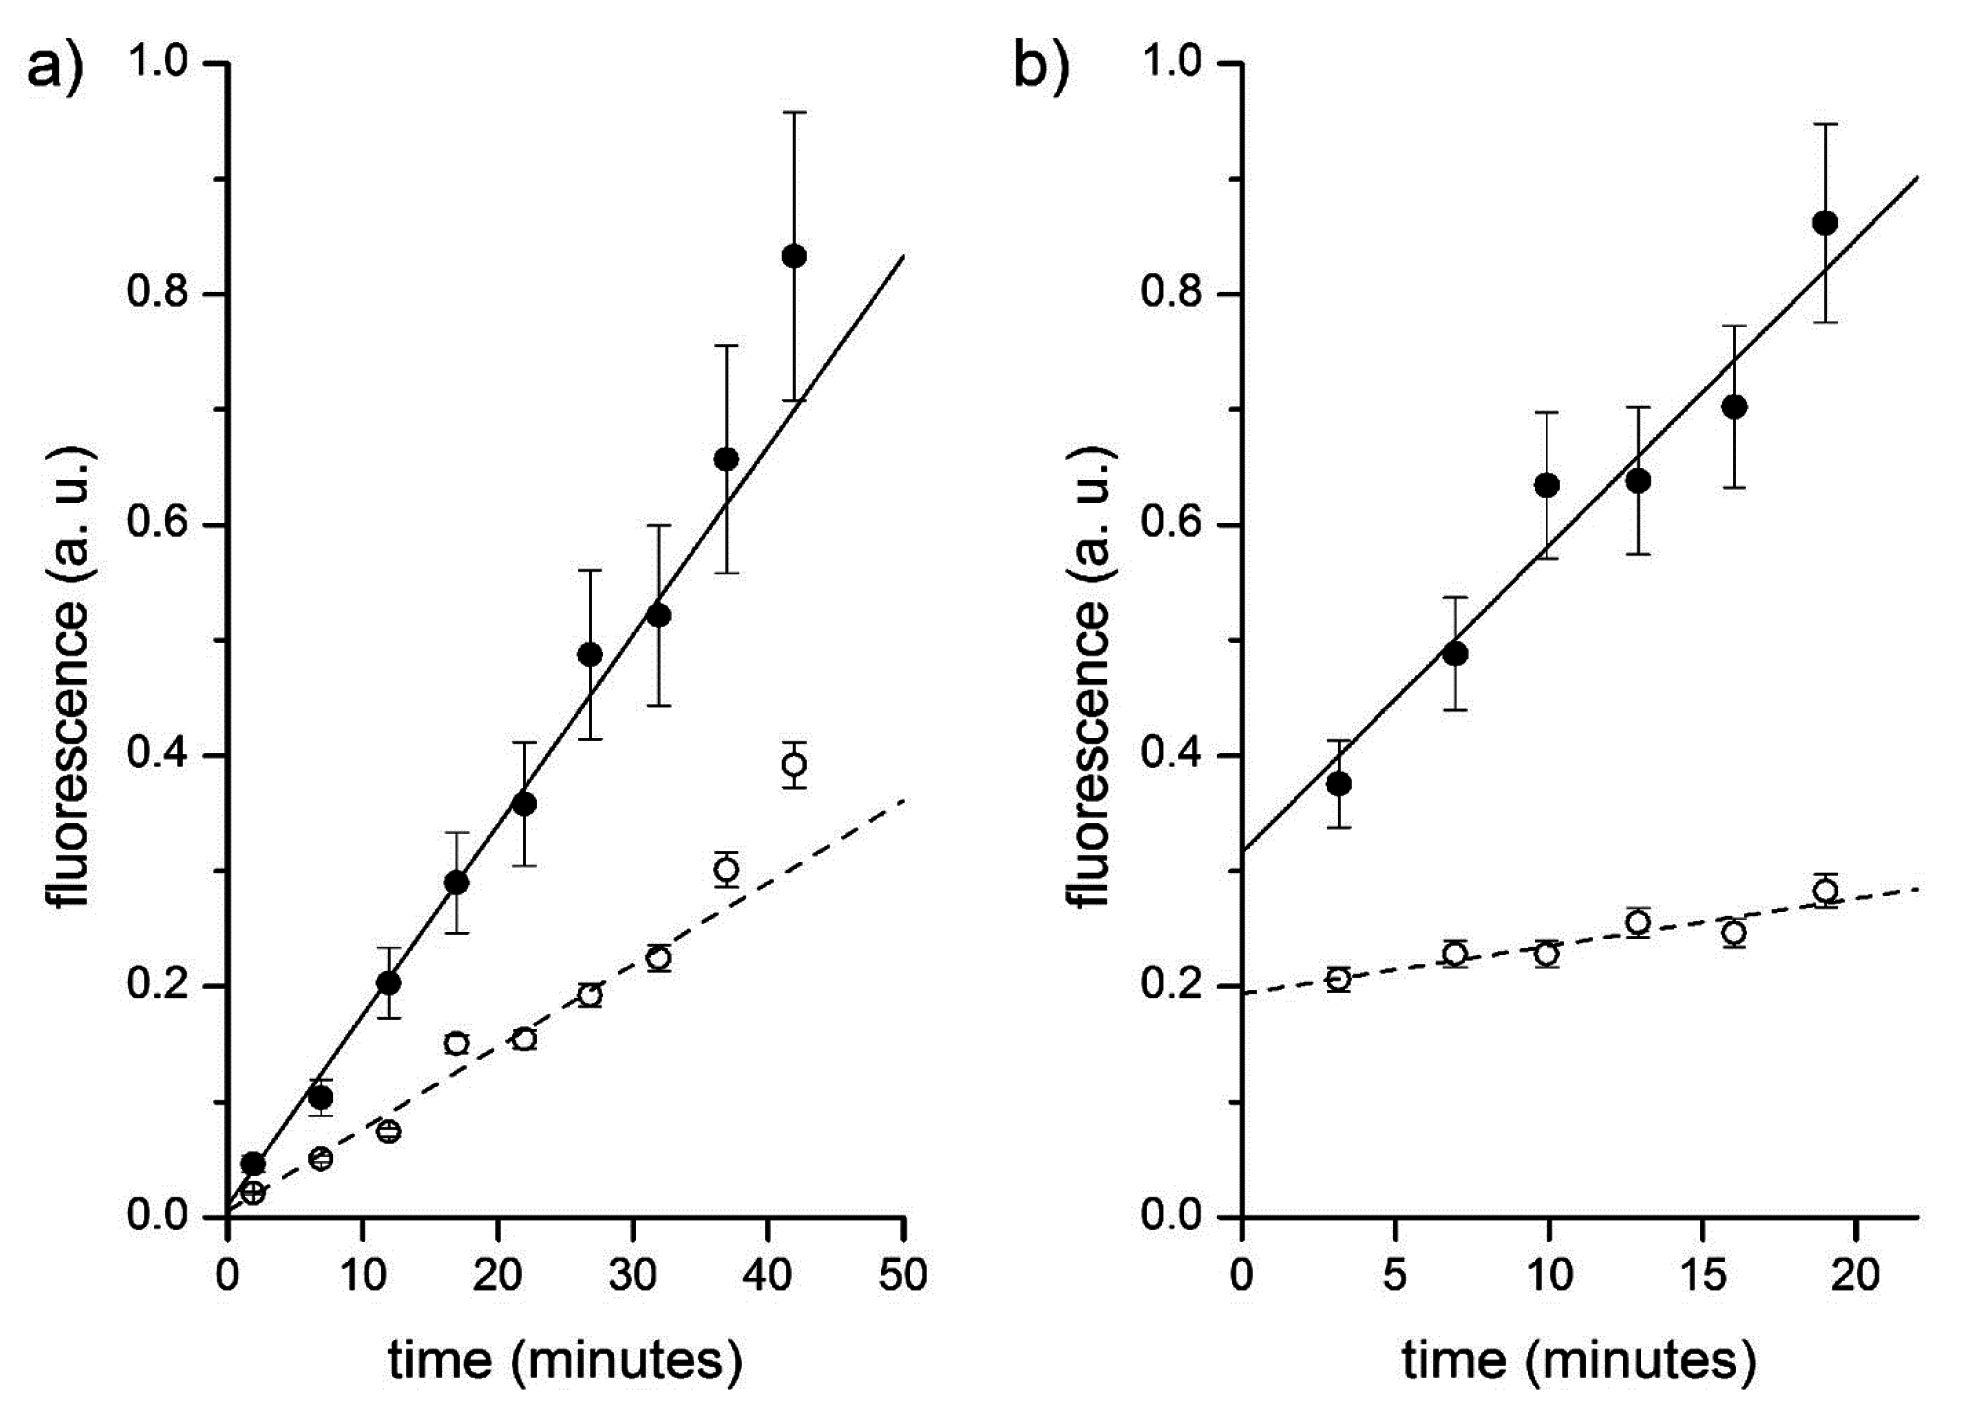
Figure 12.
Fluorescence versus time profiles of enzymatic reactions inside vesicles (filled circles) and in bulk (empty circles). (a) CA-containing vesicles plus externally added CFDA. Data have been fitted by straight lines; the ratio between slopes being 2.3. (b) Proteinase K and BSA-FITC containing vesicles. Data have been fitted by straight lines; the ratio between slopes being 6.5.
As reported in a previous study [
14], it is possible to estimate the fraction of liposomes that appear brighter than the background by doping the liposome membrane with fluorescent lipids (this is necessary because the micrometer-sized liposomes used in this study are not well visible in bright field, phase contrast, or Nomarski acquisition modes).
Table 2 summarizes the experimental outcomes from a set of runs carried out by using different CA and CFDA concentration as well as different liposome preparation methods.
Table 2 reveals a certain variability among the
rV values of different samples, but the pattern is similar to that recorded in the case of single fluorescent solutes (
Table 1). In most cases, the ratio
rV between internal and external reaction rate, which is a measure of the ratio between the internal and external CA concentrations, lies in the 2–4 range. In particular cases, higher values are obtained (e.g., 8.7, 9.1, 11.4). This is due to the very stochastic nature of the phenomenon under study. The difficulty of controlling all microscopic variables affecting the encapsulation process (as well as the sampling procedure) results in a great variability among the experimental outcomes, which had, strictly speaking, a poor reproducibility (in rigorous quantitative sense). Qualitatively, however, all experiments clearly show a common pattern.
Table 2.
Reaction between encapsulated CA and externally added CFDA.
Table 2.
Reaction between encapsulated CA and externally added CFDA.
| [CA], μM | [CFDA], μM | Lipids | Method | rV | Note |
|---|
| 0.5 | 40 | POPC | M1 | 11.4 | – a |
| 1.0 | 40 | POPC | M2 | 2.0 | – b |
| 1.0 | 80 | POPC | M2 | 3.6 | – c |
| 0.5 | 40 | POPC/POPG 4/1 | M1 | 2.1 | – d |
| 0.5 | 80 | POPC/POPG 4/1 | M1 | 2.3 | – d |
| 0.5 | 160 | POPC/POPG 4/1 | M1 | 1.9 | – d |
| 0.25 | 80 | POPC/POPG 4/1 | M1 | 8.7 | – d |
| 1.0 | 80 | POPC/POPG 4/1 | M1 | 1.3 | – d |
| 1.0 | 40 | POPC/oleate 95/5 | M3 | 2.9 | – e |
| 0.25 | 40 | POPC/oleate 4/1 | M3 | 9.1 | – f |
| 0.5 | 40 | POPC/oleate 4/1 | M1 | 2.5 | – d |
3.3.2. Numerical Simulations of the CA/CFDA System
In preliminary experiments, we have determined the apparent
KM and
kcat values for the reaction, being, respectively, 4.0 ± 0.3 mM and 3.0 ± 0.2 s
−1. The permeability coefficient of CFDA across the phosphatidylcholine liposomal membrane, namely 10
−7 cm/s, has been taken from the literature [
46]. It is therefore possible to simulate numerically the outcome of experiments as described in
Section 3.3.1, namely, the addition of CFDA to CA-containing vesicles, in the presence of non-encapsulated CA.
The system was modeled by dividing the macroscopic sample volume in small “unitary” volumes of
ca. 50 fL, each containing one liposome (
d = 1.3 μm; liposome volume = 1.15 fL). These values have been estimated on the basis of the real experimental system. The starting point is a population of CA-containing liposomes suspended in a medium that still contains non-entrapped CA (0.5 μM). Since the enzyme CA is present both inside and outside the liposomes, it is convenient to analyze the system by using the ratio
rCA = [CA]
in/[CA]
out, which can be easily varied, in order to explore three regimes: (
i)
rCA < 1 when CA encapsulation is poor; (
ii)
rCA = 1 when CA is equally present inside and outside vesicles; (
iii) and
rCA > 1 when CA is over-concentrated inside liposomes. CFDA (80 μM), present externally, can react with the external CA according to Michaelis-Menten kinetics, so that the fluorescent carboxyfluorescein (CF) is produced in bulk. In a competitive process, CFDA penetrate inside liposomes through the membrane, and then react with internalized CA. We assume that CF cannot escape from the liposome (the permeability of carboxyfluorescein is negligible for the purposes of this model [
47]).
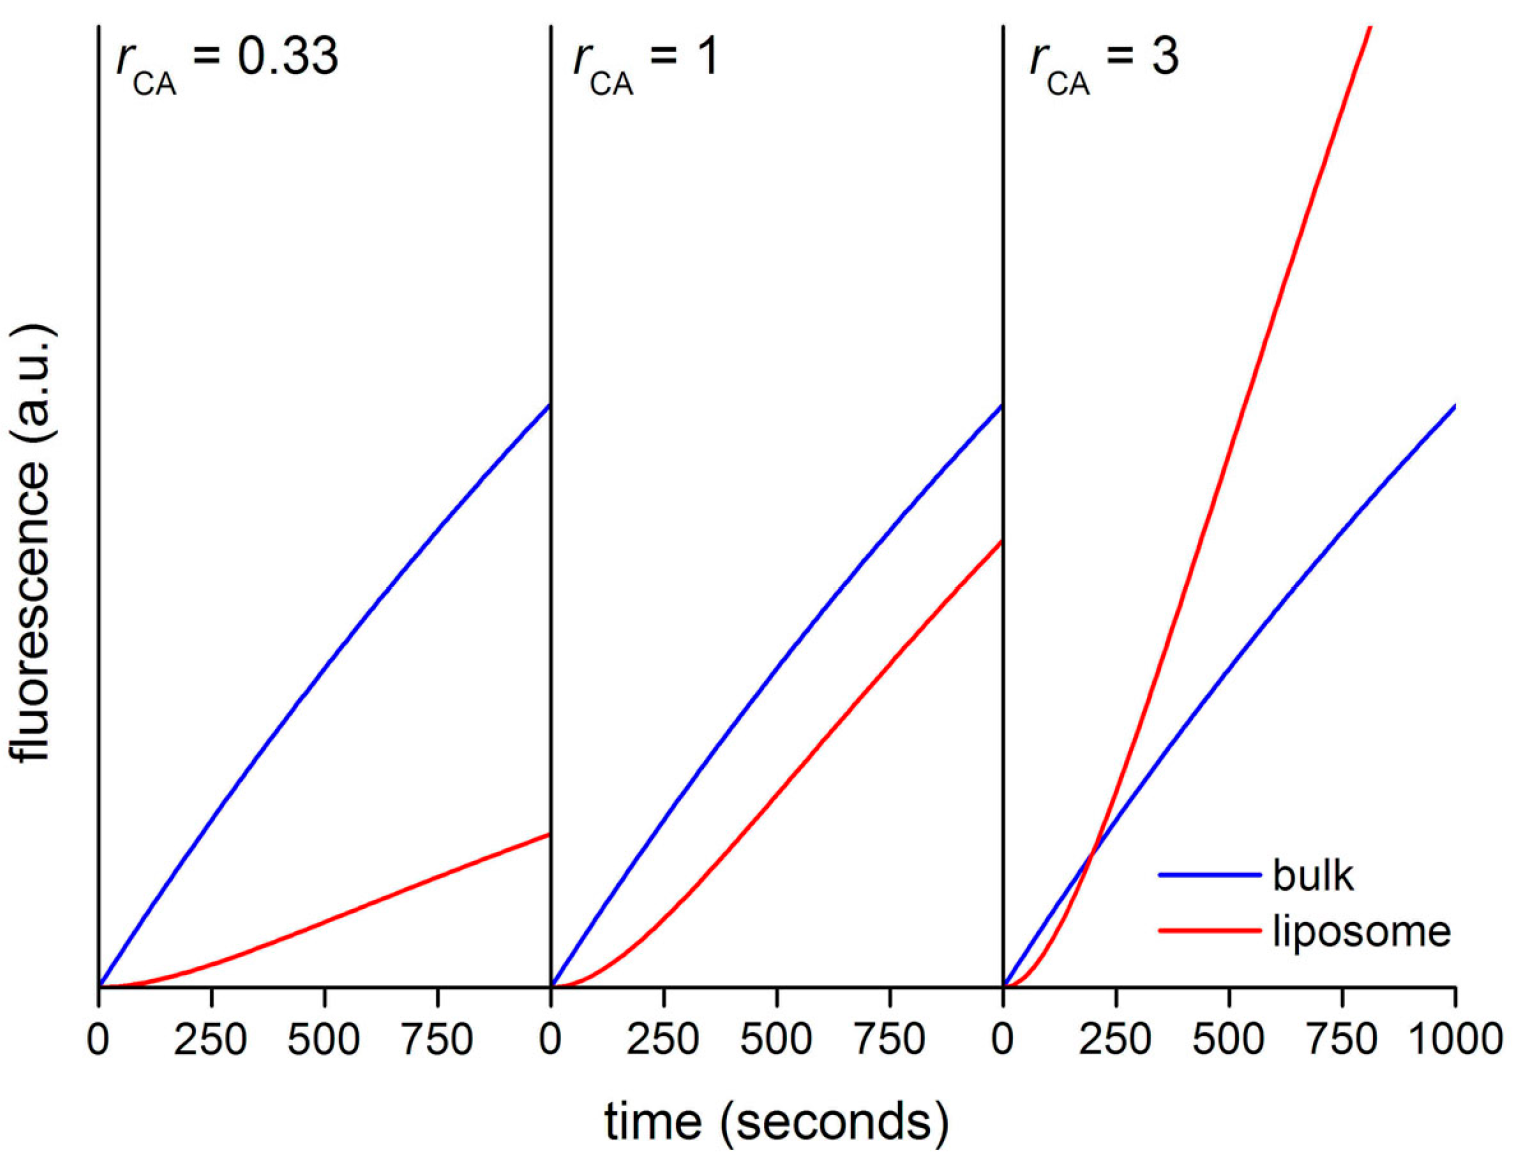
Figure 13 shows the calculated kinetic profiles (30 min) for the production of CF in liposomes having
rCA = 0.33, 1, or 3. When
rCA = 0.33, the increment of CF concentration, and therefore of its fluorescence is faster in bulk than inside liposomes. The calculated ratio
rV between the slopes (
Vin/
Vout) in the quasi-linear region is ~0.28, mirroring in good way the model’s
rCA value (0.33). When
rCA = 1 the CF concentration profiles differ only for the presence of a lag phase, due to the retardation effect exerted by the membrane. After the lag phase, in the quasi-linear region, the calculated ratio
rV ~ 0.82. Finally, when
rCA = 3 the increase of CF concentration is faster inside liposomes (after a lag phase). According to the model, CA-rich liposomes should soon appear more fluorescent than the background because of a faster accumulation of CF, despite the retardation effect due to the fact that CFDA must cross the membrane before reacting with encapsulated CA. In this case, the calculated
rV value is ~2.1, which is a proxy value for the true
rCA value (
rCA = 3) [
48].
Figure 13.
Calculated kinetic profiles for the enzymatic production of carboxyfluorescein from CFDA, under CA catalysis, inside and outside in silico vesicle with diameter of 1.3 μm.
Figure 13.
Calculated kinetic profiles for the enzymatic production of carboxyfluorescein from CFDA, under CA catalysis, inside and outside in silico vesicle with diameter of 1.3 μm.
3.3.3. Proteinase K and Bovine Serum Albumine-FITC (BSA-FITC)
Fluorescein isothiocyanate-labeled proteins have been used as substrates for proteases [
49]; for instance BSA-FITC can be used for this purpose [
50]. The commercial BSA-FITC used in this study carries an average of 9.5 FITC moieties, and has relatively low background fluorescence due to autoquenching. Proteolytic digestion alleviates auto-quenching and therefore brings about a concomitant fluorescence increase. This phenomenon provides the basis for a proteolytic assay (with proteinase K) whereby the increase in fluorescence is proportional to the degree of BSA-FITC degradation.
Firstly, we characterized and validated the reaction between proteinase K and BSA-FITC. By comparing the emission spectra of BSA-FITC before and after proteinase K treatment (18 h, 25 °C, pH 7), a fluorescence increase of about 13 times is observed, roughly corresponding to the dequenching of about 3 out of the 7–12 FITC moieties bound to BSA-FITC. It is therefore possible to follow the course of the reaction quite accurately by confocal fluorescence microscopy. On the basis of kinetic analysis, and by using an apparent
Km ~ 2.3 mM (calculated by us from [
50], and further confirmed by other studies based on synthetic peptides as substrates, see [
51,
52]), we then estimated an apparent
kcat value of about 1 s
−1.
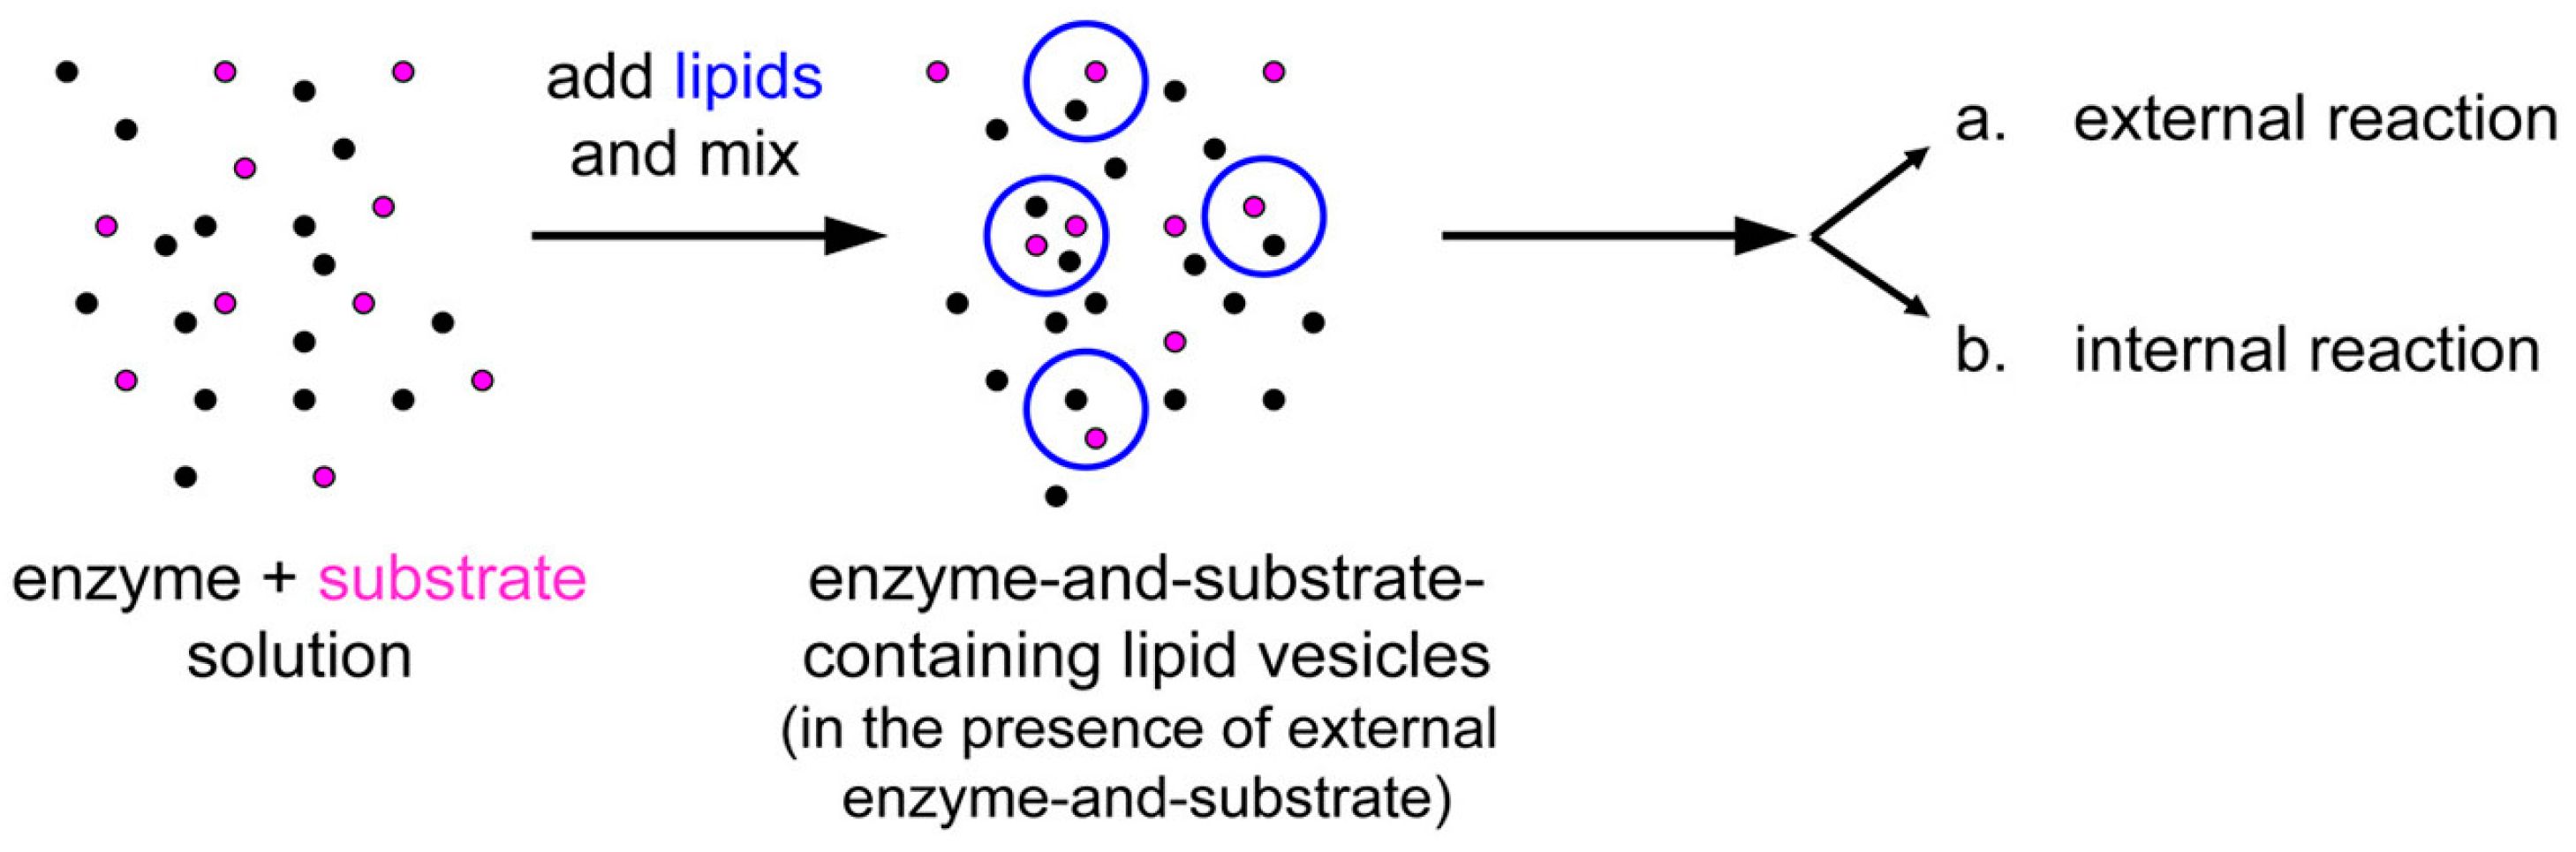
Next, we carried out the co-encapsulation experiment, consisting in preparing a mixture of proteinase K (1 μM) and BSA-FITC (2.5–5.0 μM), and forming liposomes
in situ (
Figure 14). The idea is that because both reactants are macromolecules, both can spontaneously concentrate inside liposomes during the membrane closure. For practical reasons (limit of detection), the concentration of BSA-FITC (the substrate) cannot be reduced too much, so that the actual experimental setup does not strictly correspond to the example illustrated in
Figure 9 (self-concentration of the substrate from a value below to one above
KM), but it just follows the same principles.
Figure 14.
Experimental strategy for co-encapsulating an enzyme (proteinase K, black spots) and a macromolecular substrate (BSA-FITC, pink spots) inside lipid vesicles. Note that the external solutes have not been removed and can react outside vesicles.
Figure 14.
Experimental strategy for co-encapsulating an enzyme (proteinase K, black spots) and a macromolecular substrate (BSA-FITC, pink spots) inside lipid vesicles. Note that the external solutes have not been removed and can react outside vesicles.
Figure 12b and
Table 3 summarize the typical results of the BSA-FITC/proteinase K system. Note that only few vesicles could be detected. Their mean fluorescence
versus time profile has been reported and fitted with a straight line. The background fluorescence increase has also been recorded. The ratio between these two trends is around 6.5 (first entry of
Table 3). Note that the intercepts of these two lines, in this and in other experiments, not always converge to the same value. This could be due to the fact that the sampled vesicles actually contain a higher internal BSA-FITC concentration, which further accelerates the internal reaction. Accordingly, the ratio between the intercepts (in
Figure 12b, such ratio is 1.6) is a measure of the ratio between the internal and external BSA-FITC concentration in those vesicles that have been sampled.
Table 3.
Reaction between co-encapsulated proteinase K and BSA-FITC.
Table 3.
Reaction between co-encapsulated proteinase K and BSA-FITC.
| [proteinase K], μM | [BSA-FITC], μM | Lipids | Method | rV | Note |
|---|
| 1 | 2.5 | POPC | M1 | 6.5 | – a |
| 1 | 5 | POPC | M1 | 2.2 | – a |
| 1 | 2.5 | POPC | M2 | 11.6 | – b |
| 1 | 5 | POPC | M2 | 7.3 | – b |
3.3.4. Statistical Considerations
Our data show that macromolecular solutes can be spontaneously encapsulated inside lipid vesicles at a concentration higher than the expected one. The ratio between the actual and the expected concentration (as measured by the
rF and
rV values, see
Table 1,
Table 2 and
Table 3) typically lies in the 2–4 range, although
r values higher than 10 have been also occasionally recorded.
The question is whether such “small” concentration factors (from 2 to 4) can be explained by invoking the natural stochastic fluctuations of the number of solute molecules that can be encapsulated within a vesicle. At this aim we recall our null hypothesis
H0 (see
Section 2.2) saying that the fluctuations around the average number
N0 of solute molecules that are encapsulated within a vesicle of volume
V are ruled by a Poisson distribution. Can stochastic fluctuations account for having an actual number
N of encapsulated molecules so that
N >
N0?
Firstly, we calculate
N0 as usual (
N0 =
NA C0 V), focusing on the experimental conditions giving the lower
N0 value—and stochastic factors are amplified. If natural fluctuations cannot explain data in these conditions, then even more so they do not in all other cases. When 1 μm (diameter) vesicle forms in a
C0 = 0.1 μM solution (the smallest concentration used in this study),
N0 ~ 32. This value (32) means that the Poisson distribution can be approximated by a Gaussian distribution. Fluctuations theory predicts that the magnitude of the fluctuations (Δ
N) goes as √
N0,
i.e., Δ
N ~ √32 = 5.6. We can then consider a Gaussian distribution of the number of entrapped solute molecules
N, having average
N0 = 32 and standard deviation Δ
N = 5.6, and ask what is the probability
p to find vesicles with
N >
r N0, for
r ≥ 1. Results are shown in
Table 4.
Table 4.
Entrapment: Gaussian probabilities.
Table 4.
Entrapment: Gaussian probabilities.
| r | r N0 | p(N > r N0) |
|---|
| 1 | 32 | 50% |
| 1.41 | 44.6 | 1% |
| 2 | 64 | 10−6% |
| 2.4 | 76.8 | 10−13% |
The Gaussian distribution foresees that the entire vesicle population (99%) should have r ≤ 1.41; in other words, local intravesicle concentration factors r higher than 1.41 should occur in 1% of cases. The probability of finding vesicles with an internal concentration that is more than two times the expected one (r > 2) is instead vanishingly small (ca. 10−6%), and for the case r > 2.4 the value becomes essentially nil (10−13%). On the contrary, we have observed vesicles having r = 2–4 much more often, i.e., with a frequency of about 0.1%–1%. Even if our estimations of super-filled vesicle abundance were wrong by one, two, or even three orders of magnitude, the difference between the statistical expectations and the observations would be still significant. If this is true in the worst case (C0 = 0.1 μM), then we can be sure that it is certainly true for higher solutes concentrations (C0 = 1–10 μM).
In conclusion, this simple statistical analysis confirms that the experimental data presented in this work again represent a conundrum for the physics of solute entrapment, because these “special” vesicles are far more abundant than what is predicted by a random encapsulation. As we suggest in previous work [
9,
10,
11,
12,
13,
14,
15], a special mechanism should play a role in generating such intriguing structures.


