The following considerations focus on cassiterite and its distribution in the feed and the three products of magnetic separation. Special attention is paid to the association of cassiterite with iron oxides due to the fact that the iron oxide content is a crucial factor for magnetic separation.
3.4.1. Liberation of Cassiterite
In this section, the feed represents the results of the MLA of the real feed material. For the analysis of MLA data, the number of particles
N always has to be considered.
Table 6 represents the total and cassiterite-bearing number of particles in the feed and the three products. In
Table 6, the total number of particles,
Ntotal, for the analysis and the number of cassiterite bearing particles,
Ncas, are indicated.
In
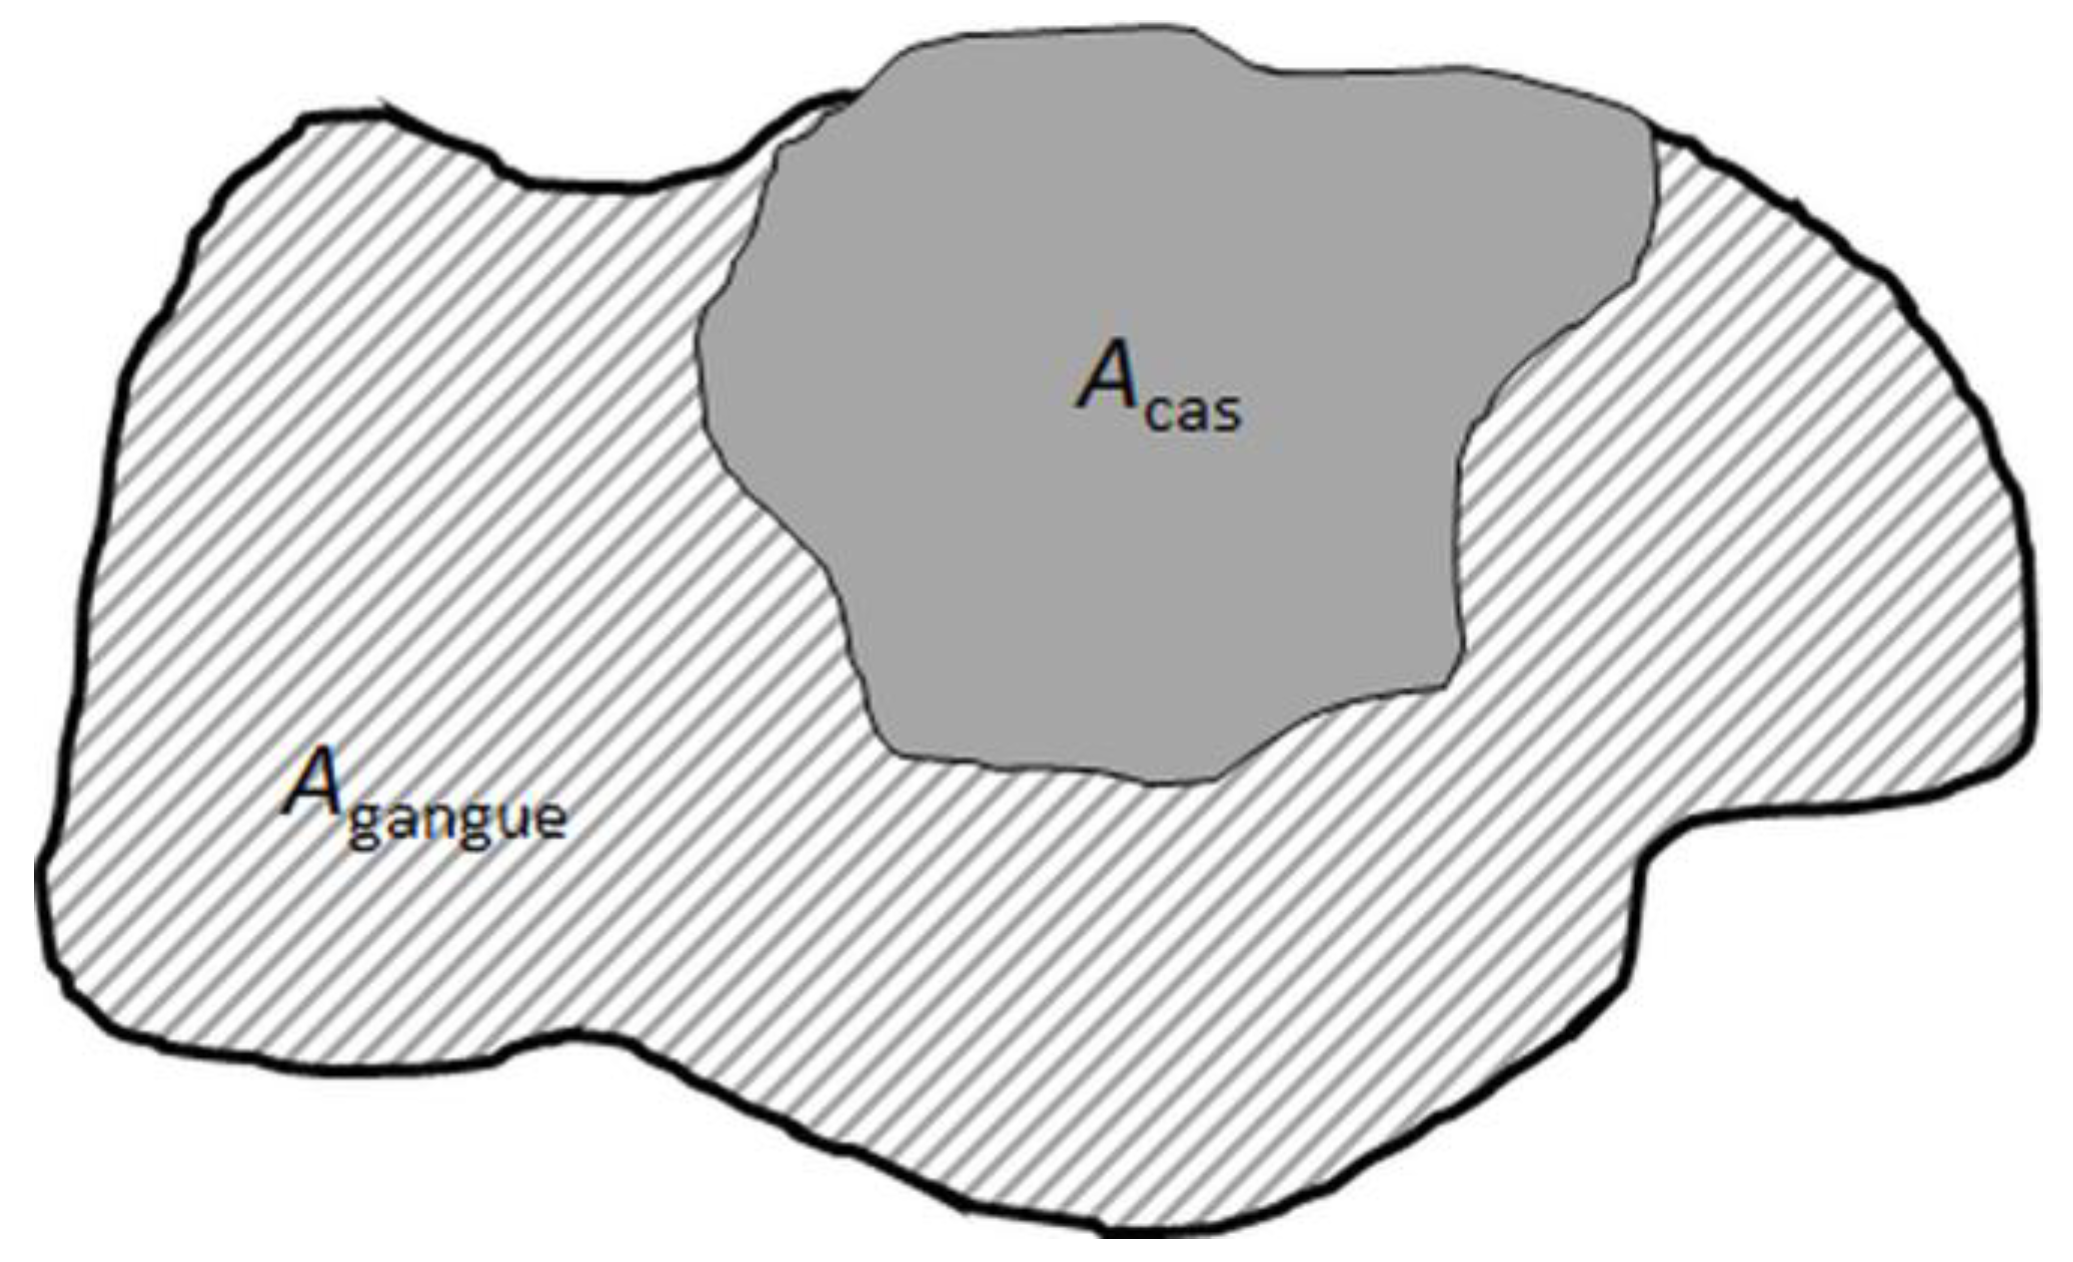
Figure 7 a typical particle image from SEM-based image analysis is shown, which is binarized in cassiterite and the gangue area.
The cassiterite volume liberation is calculated for each particle according to Equation (7):
where
and
denote the proportion of the area of cassiterite and other gangue minerals, respectively. As the data given in the MLA is 2D, the volume liberation for cassiterite is calculated based on obtained area information, considering that the bias for this transformation is in an acceptable range. This is a reasonable assumption given the near isometric shape of most cassiterite grains and the lack of any preferred orientation of mineral grains in the fine-grained skarn ore.
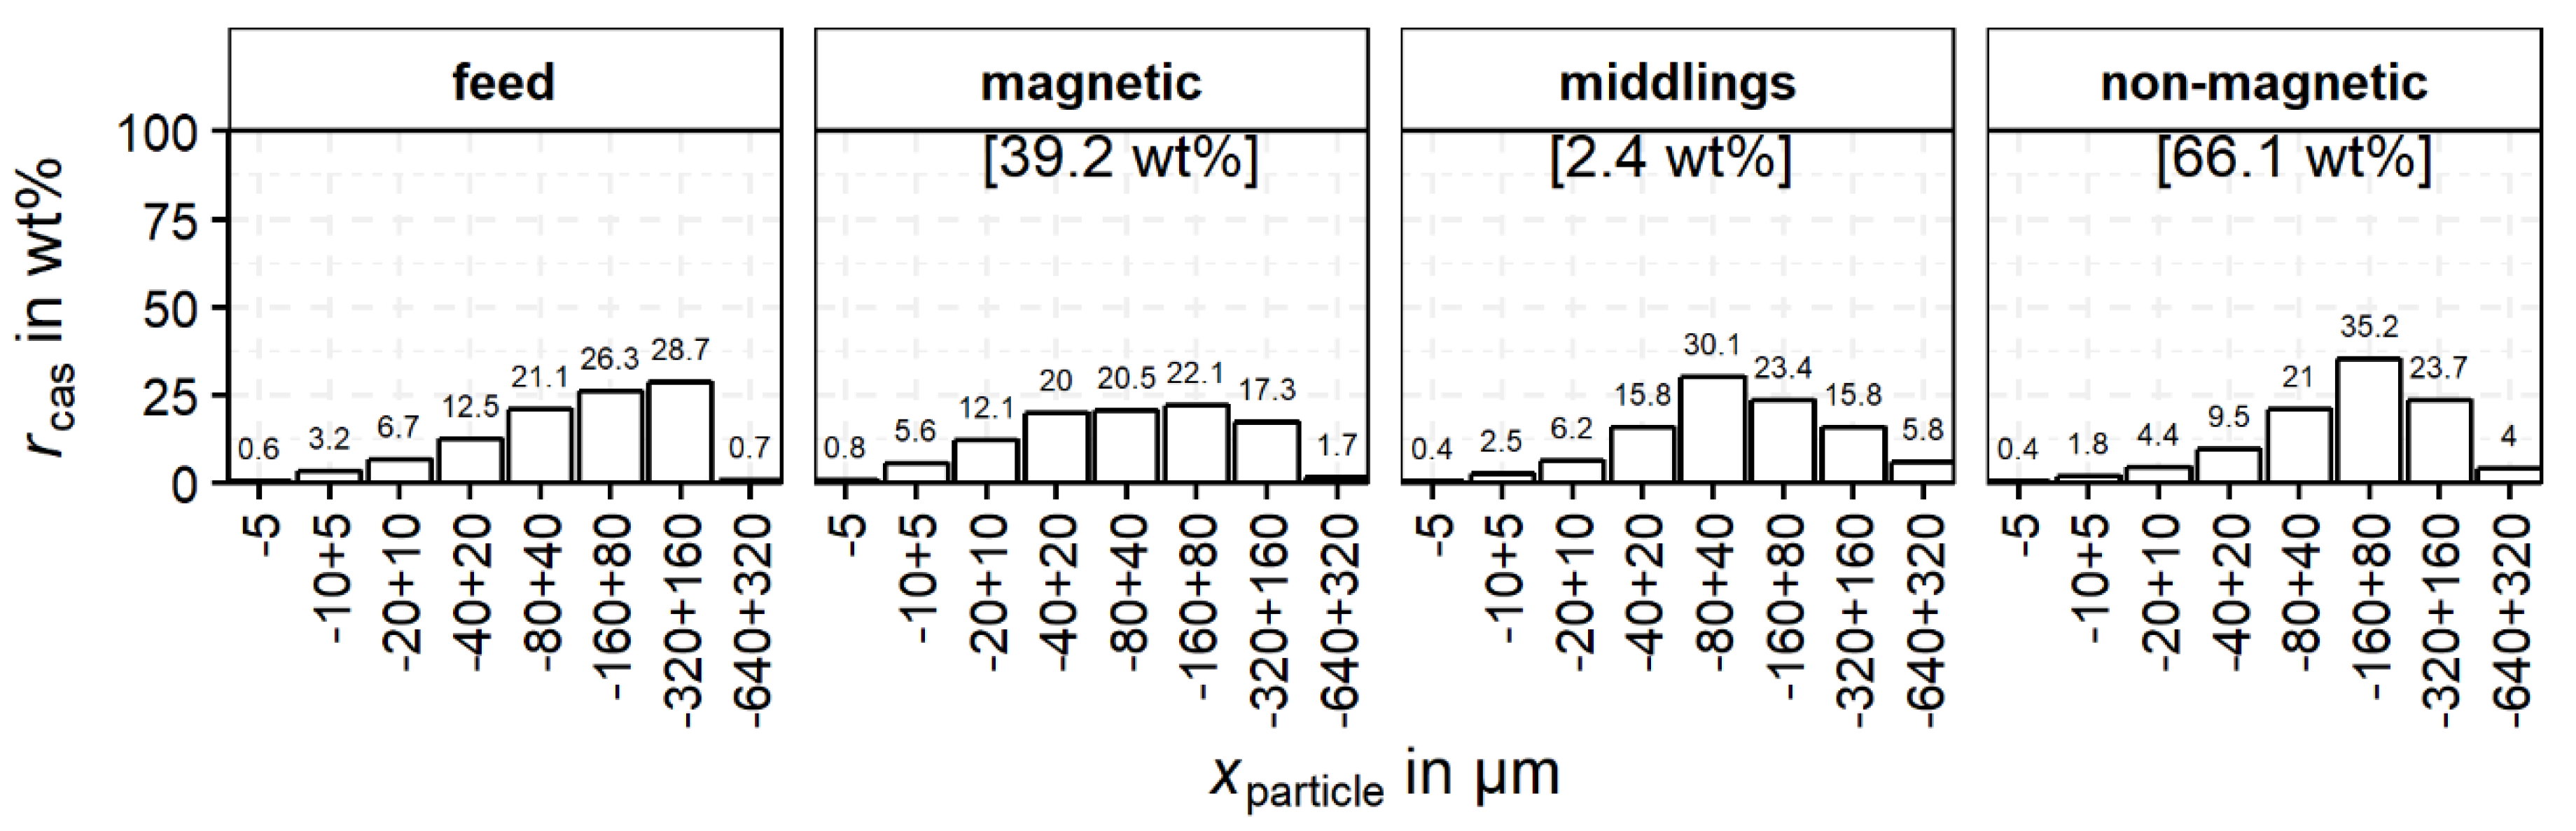
The grouping of the cassiterite-containing particles as a function of particle size is shown in
Figure 8. In this diagram, only the particles
Ncas (
Table 6) are utilized. For the feed and each product
p (magnetic, middlings and non-magnetic),
rcas,p,i sums up to 100 wt% and
i represents the particle size and liberation classes for which
rcas is calculated. Therefore, the colors give an indication of the cassiterite distribution within the product with regard to the particle size and cassiterite liberation. For the feed and the three products of magnetic separation, the distribution of cassiterite over the particle size classes is shown in
Figure 8.
The distribution of cassiterite in the non-magnetic product shows a clear maximum in the −160 + 80 µm class. However, the maximum for the middlings is in a lower class at −80 + 40 µm. In contrast, the magnetic product shows no clear maximum and a more uniform distribution of the cassiterite between 20–320 µm. The feed material is added for comparison and indicates left skewed distribution with a maximum at −320 + 160 µm.
The distribution of cassiterite in the feed is similar to the cassiterite distribution in the non-magnetic product, also showing a left skewed distribution. The recovery of cassiterite into the middlings and the magnetic product is caused by intergrown iron oxides, especially magnetite which reports completely to these products. Finely, disseminated cassiterite is intergrown with magnetite, which also explains the greater amounts of cassiterite in the finer-grained fractions compared to the non-magnetic and middlings fraction. For a better understanding of this behavior, the liberation of cassiterite in the different size fractions has to be investigated. For this purpose,
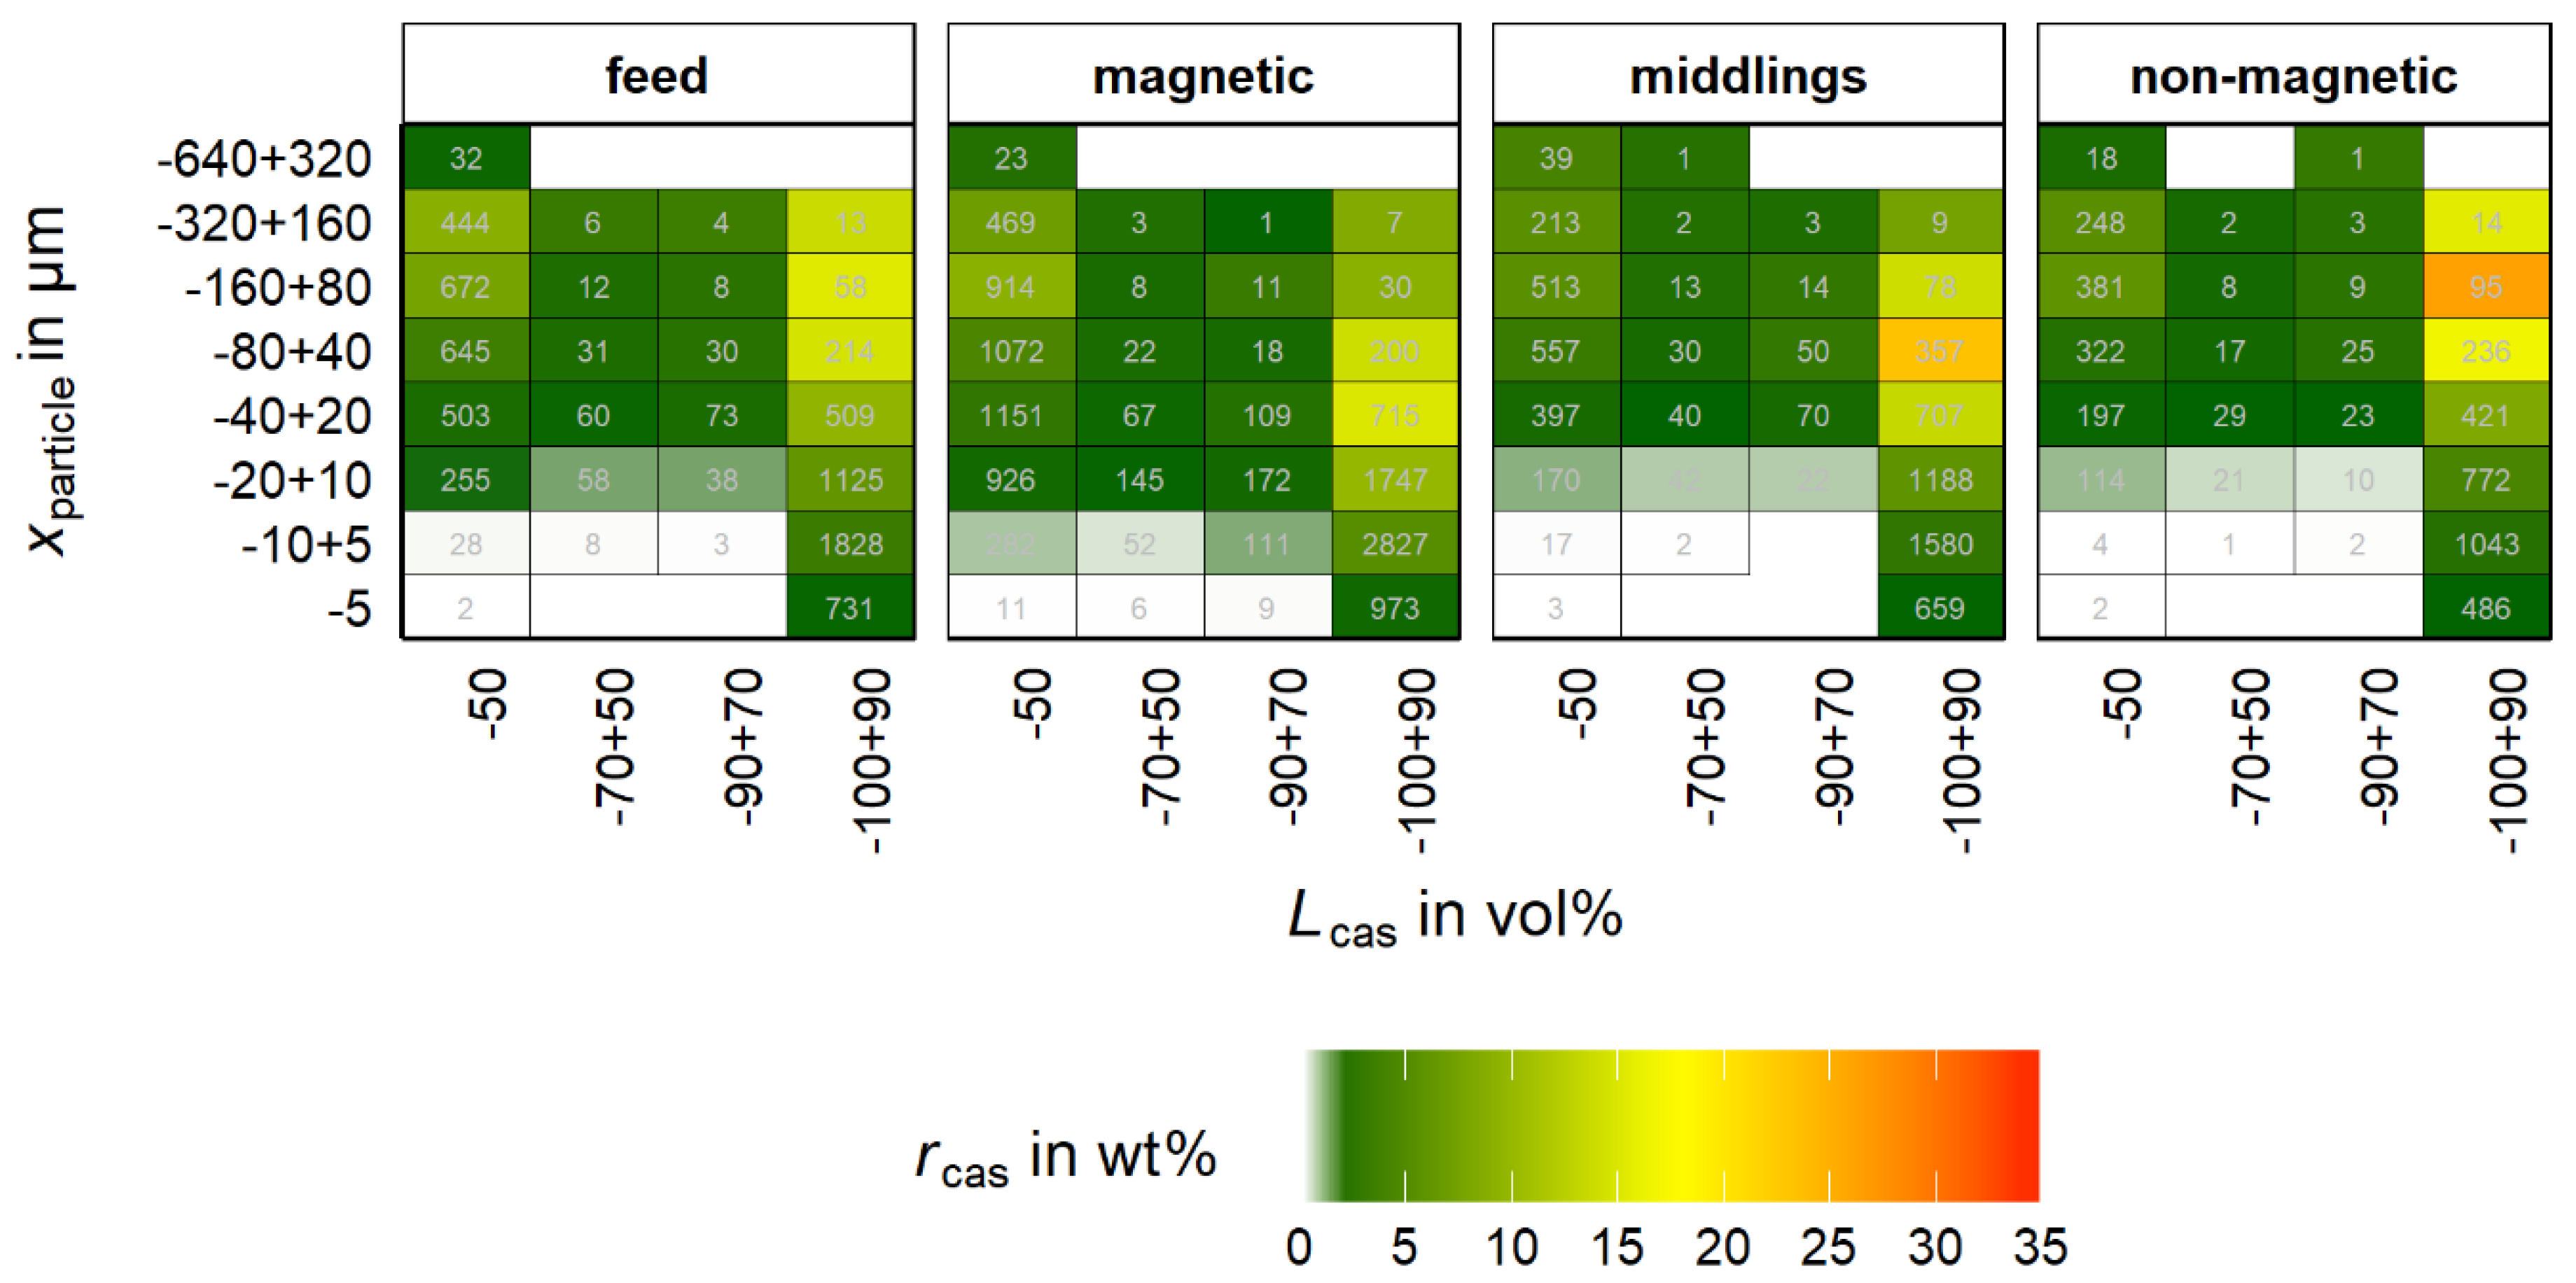
rcas is studied as a function of liberation together with the particle size classes in
Figure 9. The
rcas for every product sums up to 100% for a better visualization. Further, the color scale displays the cassiterite recovery into the property classes (
rcas) for each product individually calculated by Equation (8).
The number of particles is added for each property class. These values are added for review of the statistical representative status of the data, where a high value of rcas together with a low number of particles is problematic and must be noted.
For all four samples, the cassiterite accumulates in the liberation class −100 + 90%. Further, there is a significant amount of cassiterite in the −50% class. It is worth noting that the depicted class is comprised of a much higher range than the other classes, which influences the optical perception in this diagram. Nevertheless, there is a significant number of particles in all three products with low cassiterite liberation.
Regarding the particle size, the maximum cassiterite recovery is found in the non-magnetic product in the range of −160 + 80 µm, followed by −80 + 40 µm. In comparison, for the magnetic product the maximum cassiterite recovery is in the range of −40 + 20 µm. The maximum is less pronounced than in the non-magnetic product and the cassiterite recovery shows a broader distribution over the −100 + 90% class. Cassiterite with a high degree of liberation predominantly accumulates in the non-magnetic product due to its paramagnetic nature. A discharge into the middlings or magnetic product either must be of statistical nature or caused by additional particle properties beside the content of iron oxides, e.g., mineral association, particle size, shape or density. The influence of these properties cannot be assessed in
Figure 9.
Summarizing
Figure 9, the cassiterite containing particles are divided into three main liberation groups including low (−50%), intermediate (50%–90%) and high (90%–100%) liberated cassiterite. Another important group represents the fully (100%) liberated cassiterite. This particle section shows no other interconnected mineral in the particle and is therefore of high significance. This group is not visible in
Figure 9 as it is included in the −100 + 90% group.
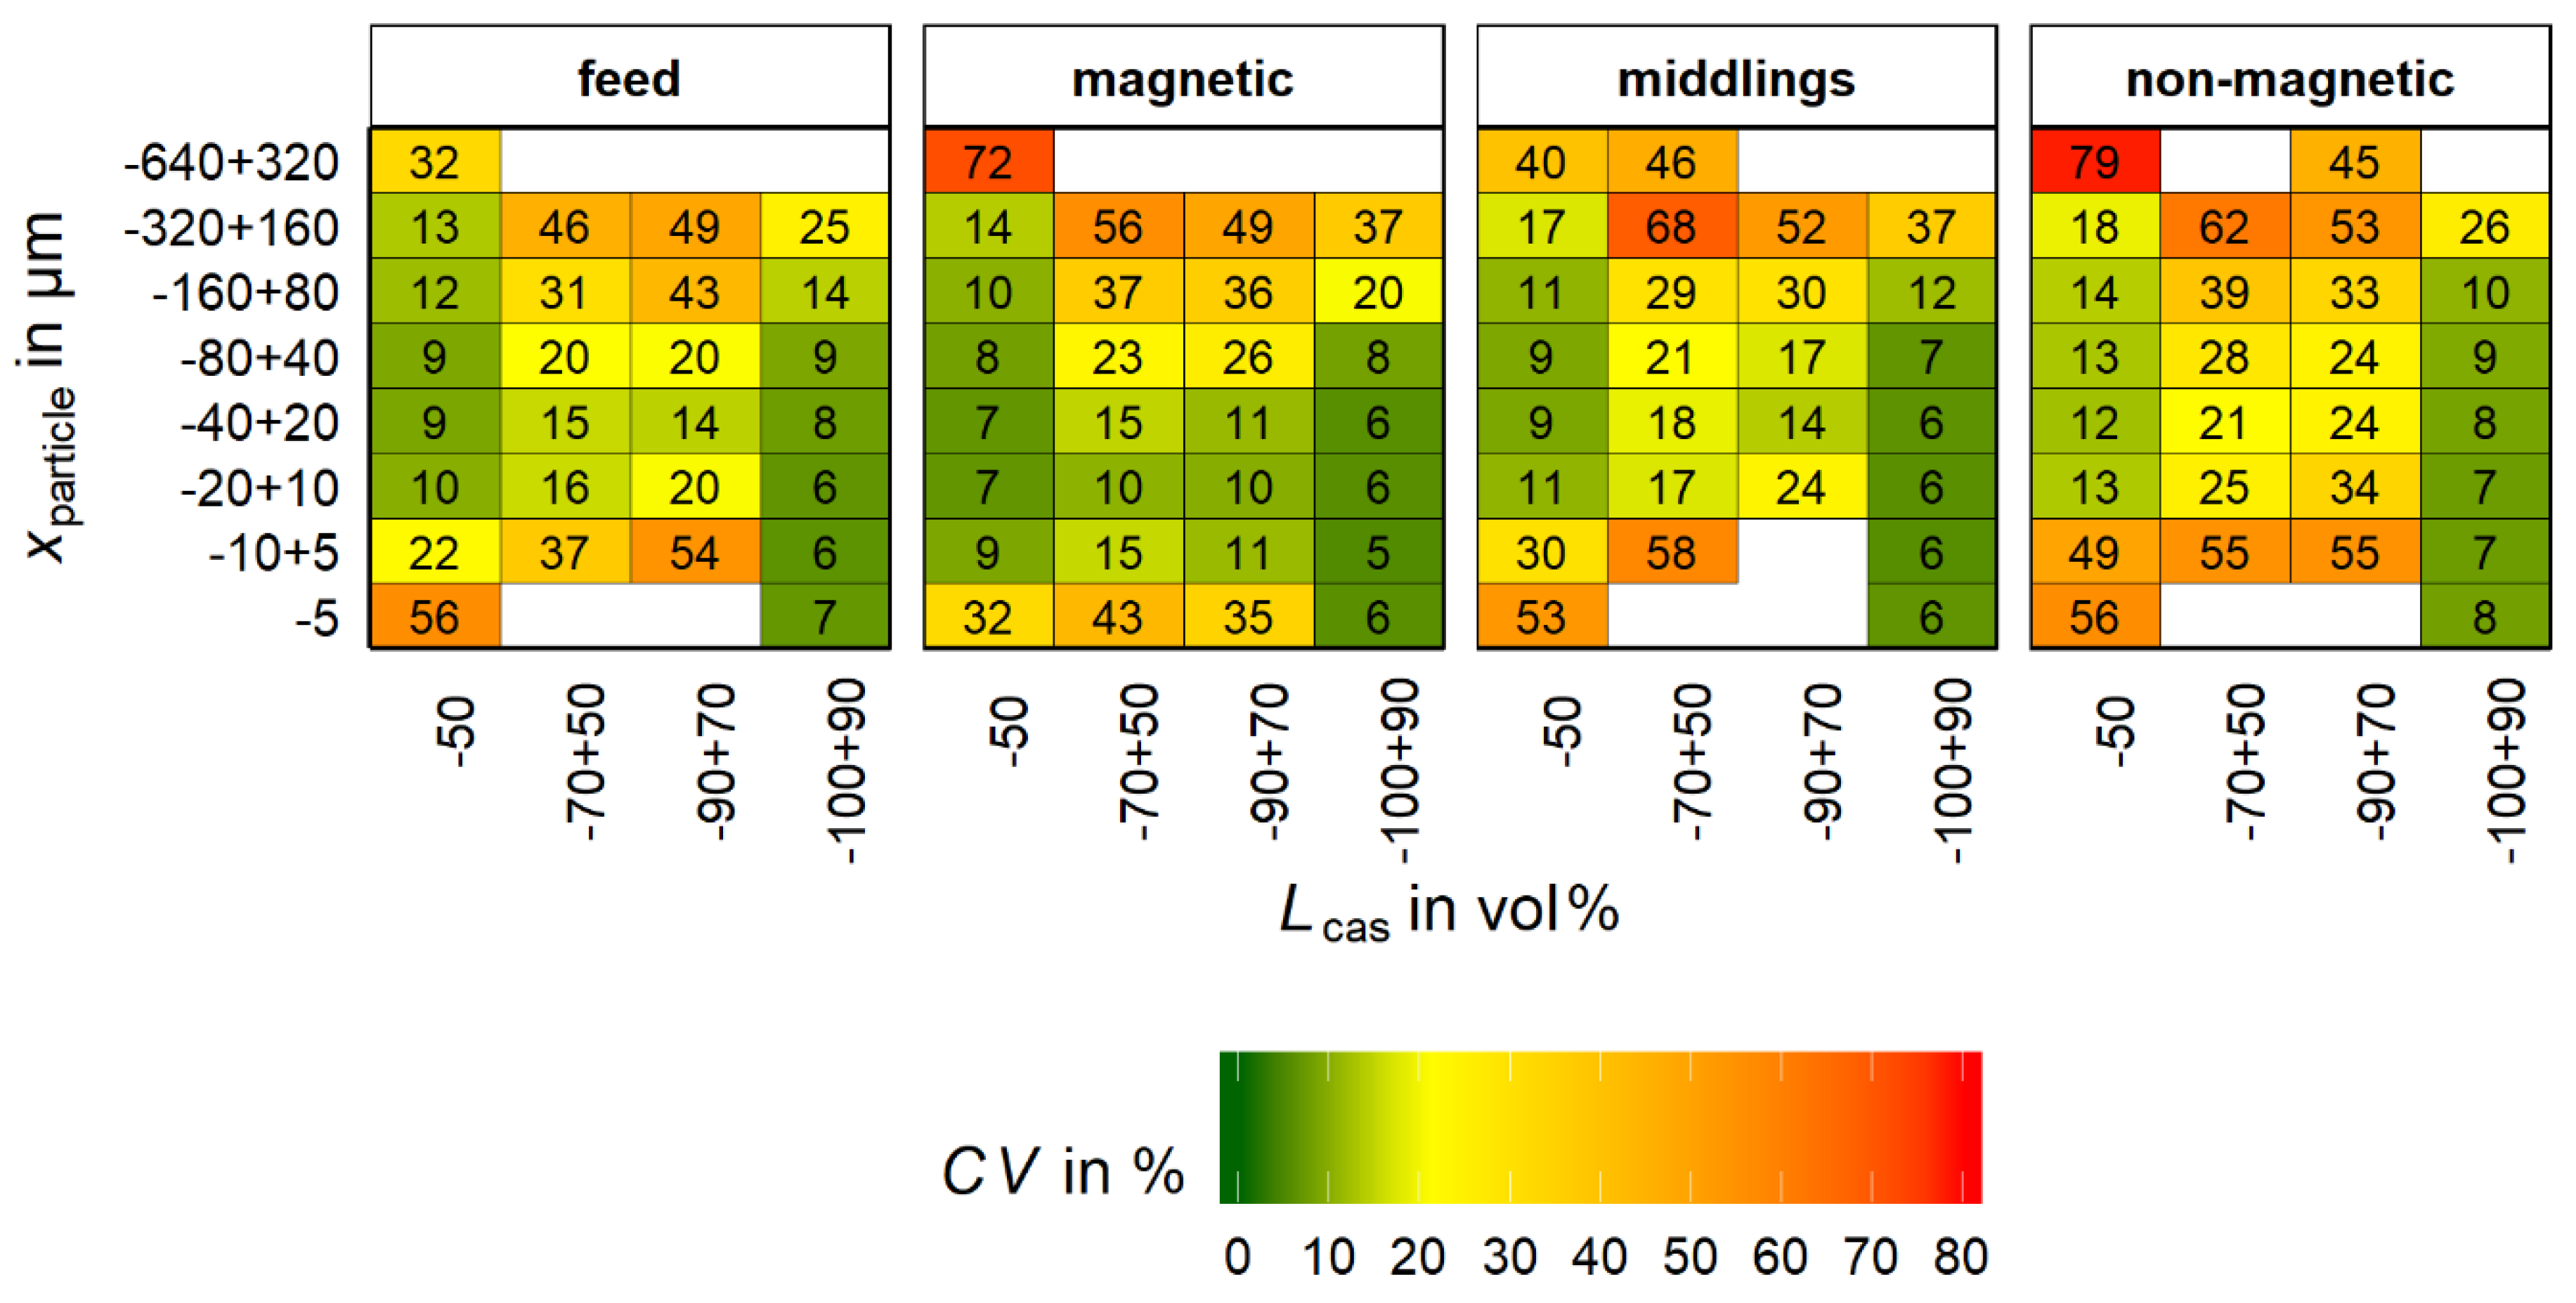
Based on bootstrap resampling (refer to chapter 2.5,
N = particle number of MLA sample;
M = 1000) the coefficient of variation (
CV) was calculated for the bins of
Figure 9. The
CV for each bin is shown in
Figure 10.
From
Figure 10 in combination with
Figure 9 it is seen that for bins with a low number of particles in the original sample for MLA the value for
CV is high. According to Lamberg et al. [
22] the maximum acceptable value of
CV is in the range of 20%. If the value is higher, bins will be merged. This approach reduces the mean error for the following calculation methods. However, it does not allow a tracking of the bias along the analysis process.
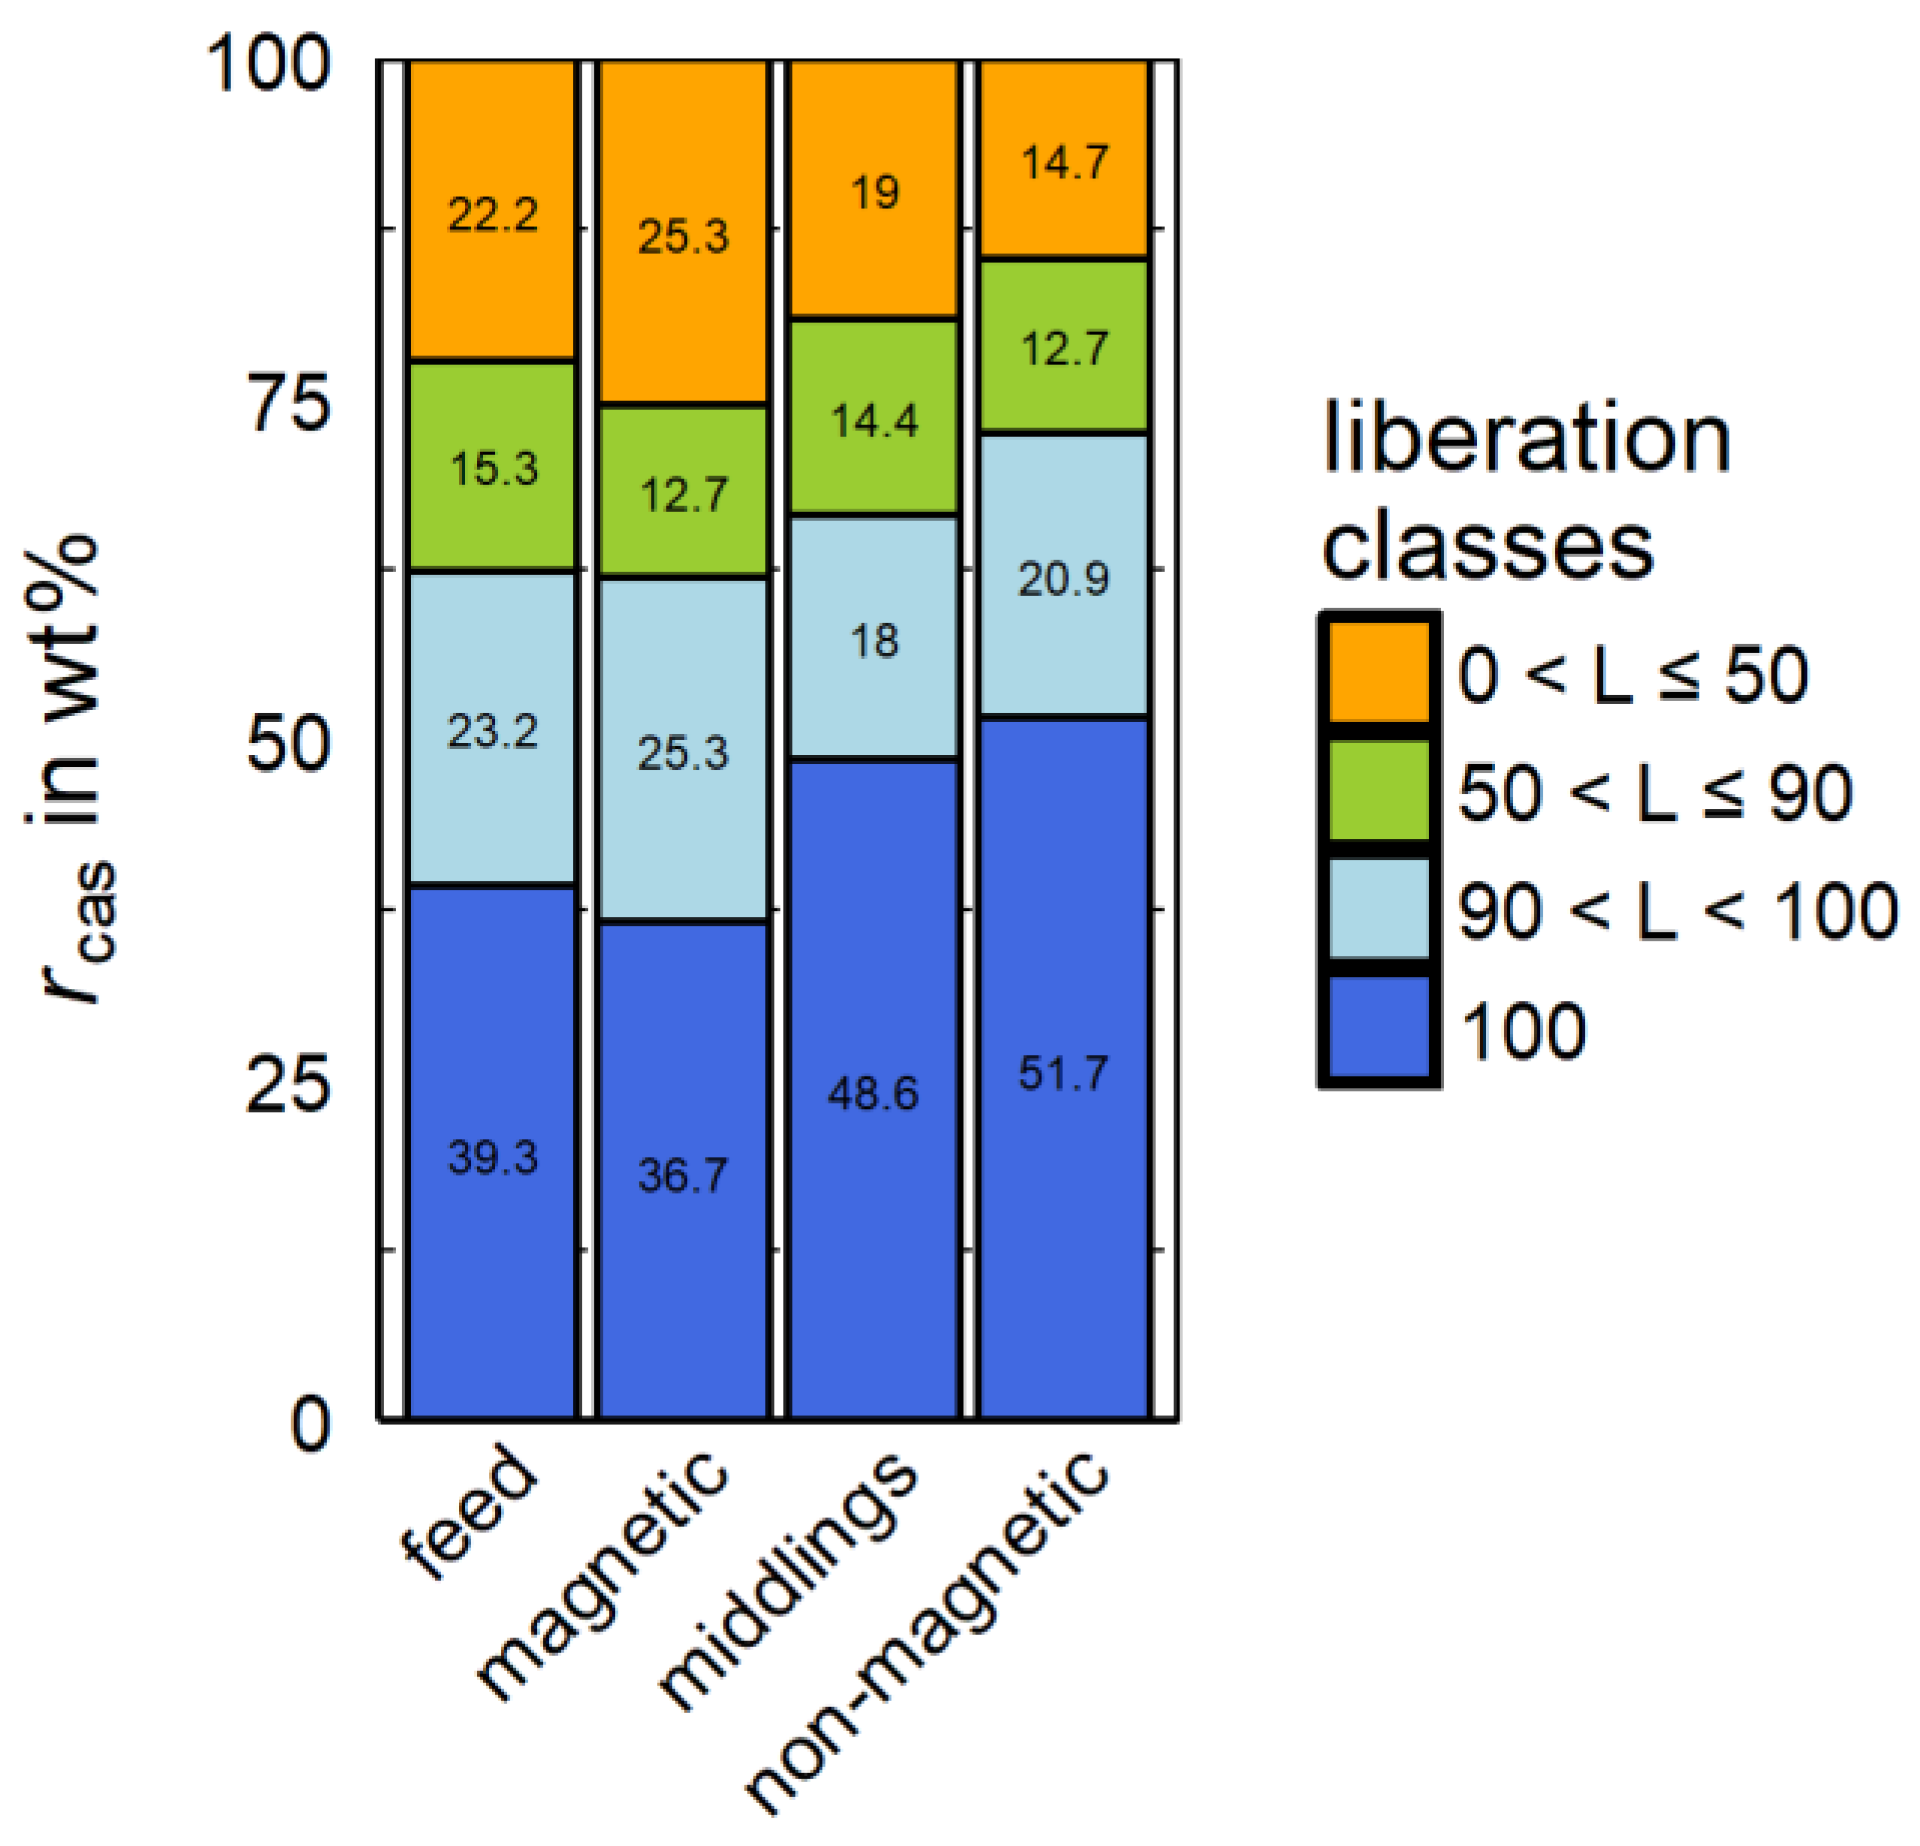
For a better overview of the distribution of cassiterite regarding these described liberation classes,
rcas is shown for these groups in
Figure 11 for the three products and the feed.
In
Figure 11, the 100% liberated cassiterite is the predominant proportion of all products. It should be mentioned that MLA slightly overestimates the liberation degree by only cutting the particles in the cutting plane of the grain mounts and the related 2D character of the data. The described stereological effect leads to the fact that 100% liberated cassiterite can be intergrown with other minerals, which are not visible in MLA as these minerals are not positioned in the cutting plane of the grain mount. Nevertheless, the non-magnetic product shows the highest amount of fully liberated cassiterite compared to all other products and the feed.
3.4.2. Association with Iron Oxides
The association of cassiterite with iron oxides is of high importance. The content of cassiterite together with iron oxides in one particle is relevant for its recovery into the magnetic product.
Table 7 shows the particle population that is utilized for the analysis of cassiterite in connection with iron oxides.
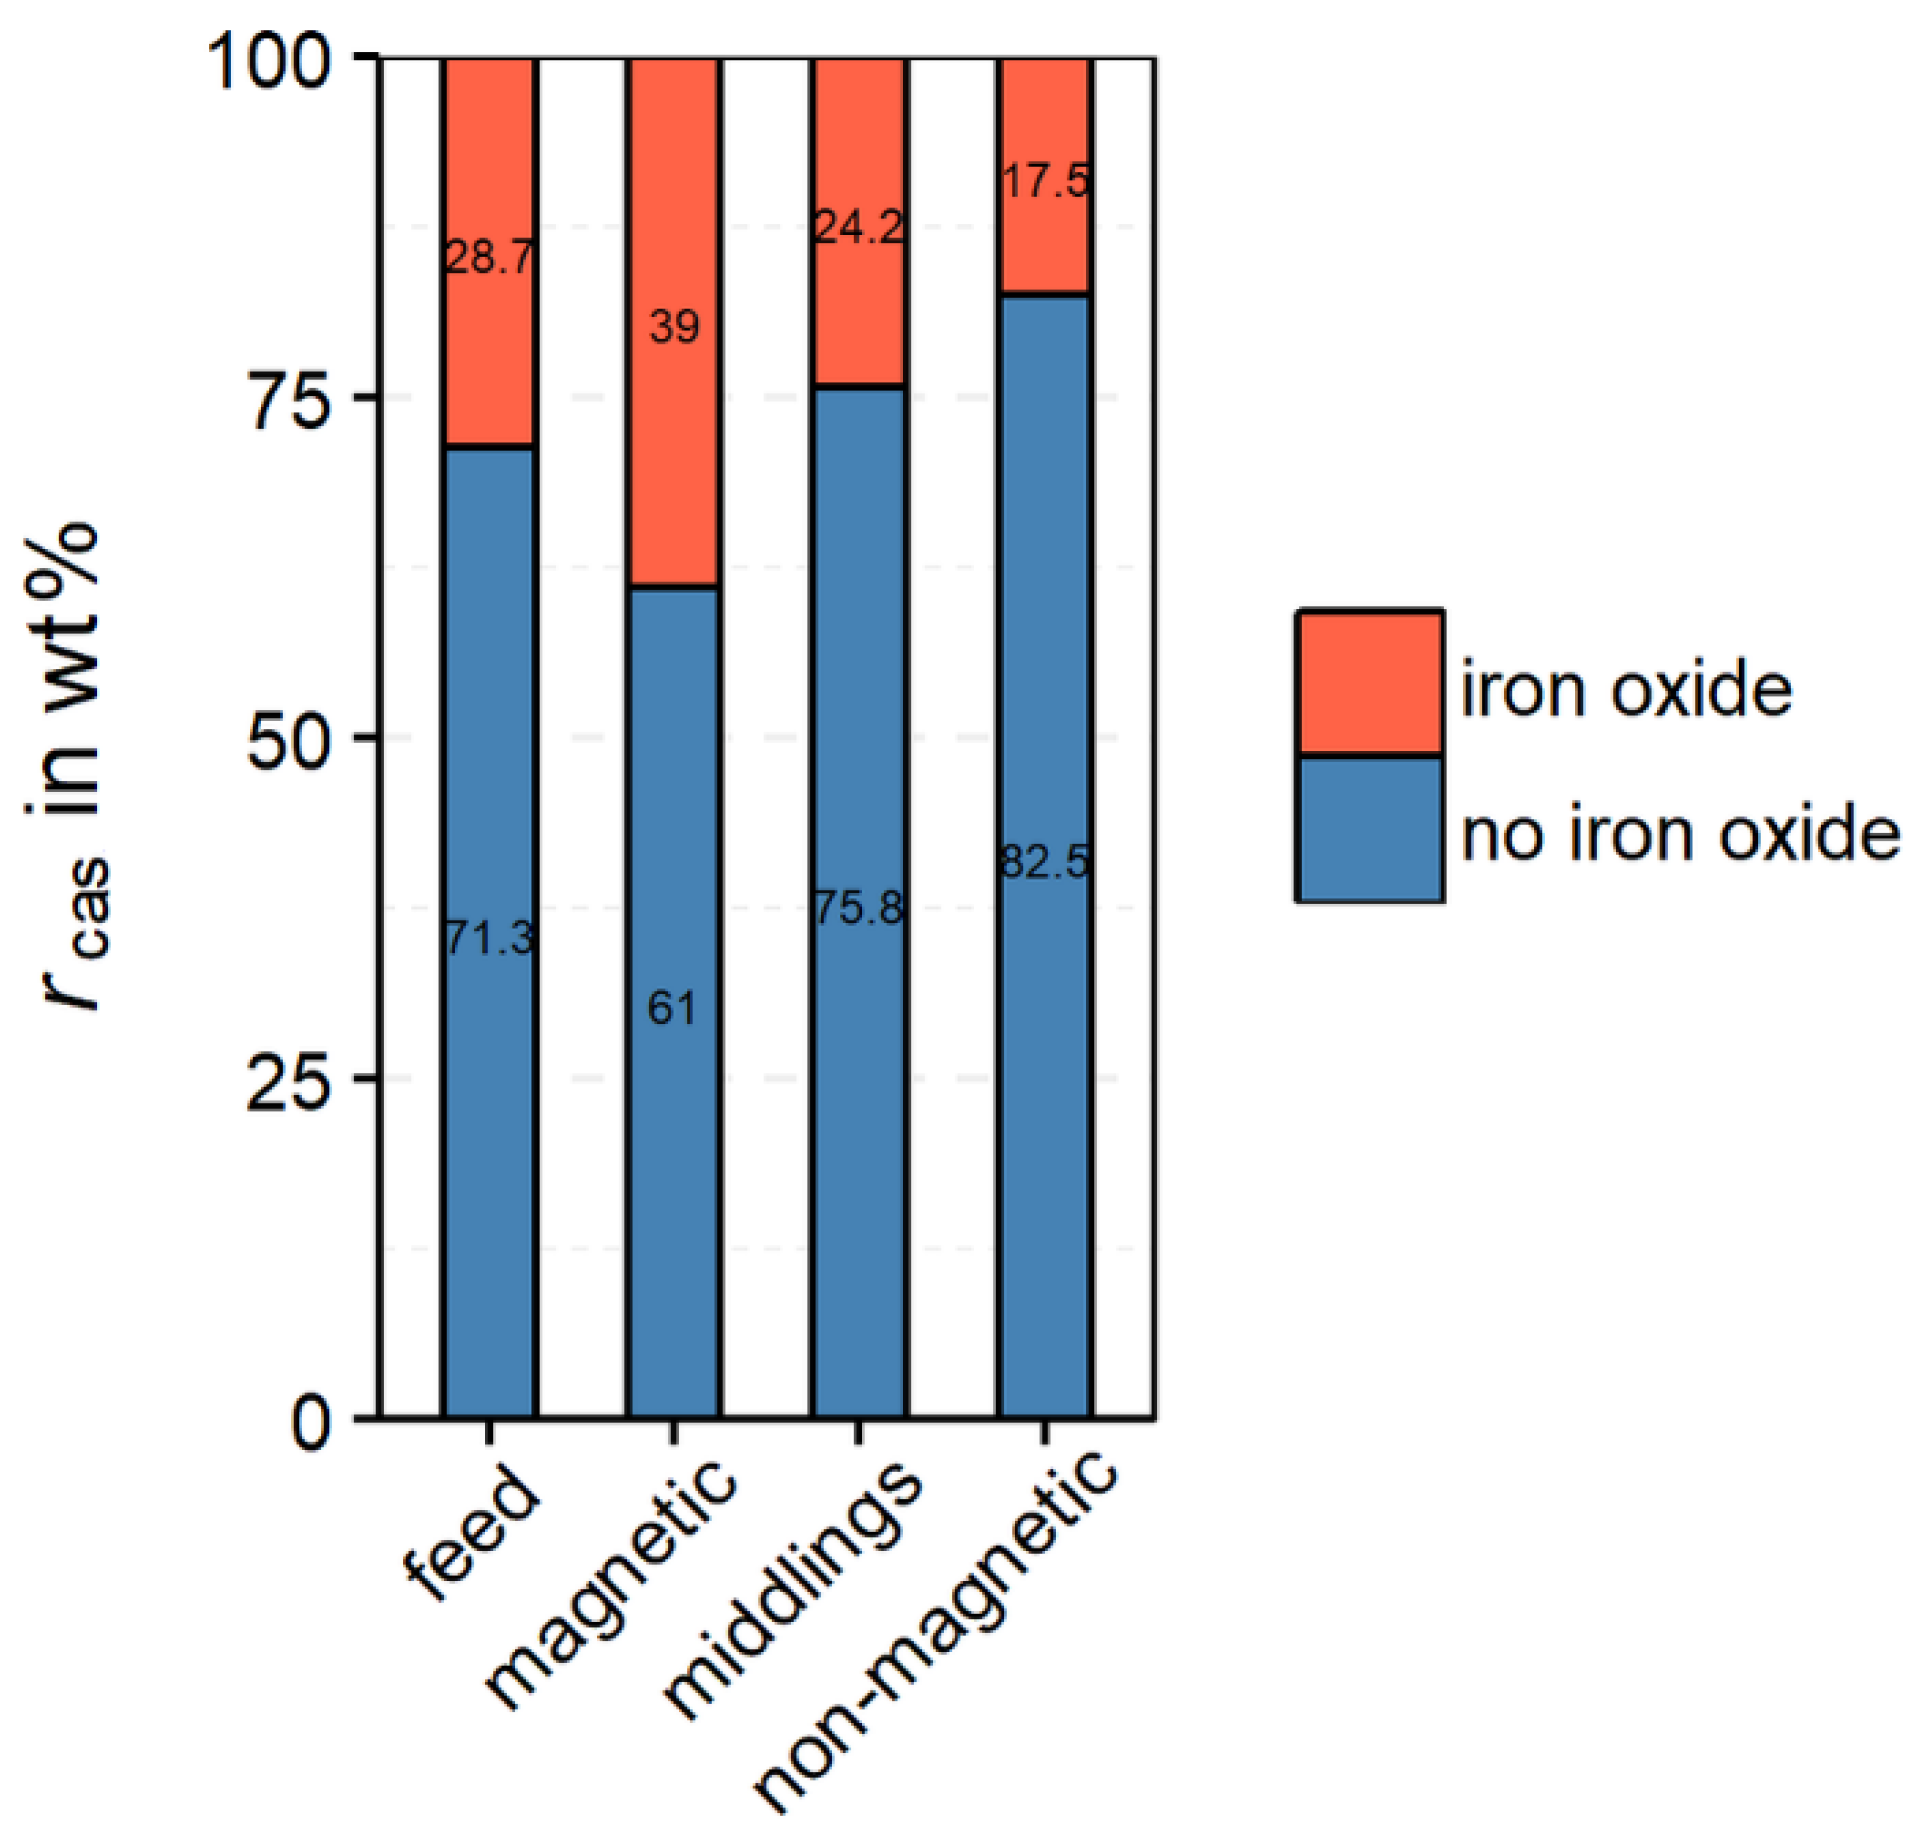
From
Figure 12 it follows, that the highest portion of cassiterite intergrown with iron oxides can be found in the magnetic product. Nevertheless, a significant amount of cassiterite (17.5 wt%) is also associated with iron oxides in the non-magnetic product. As no magnetite is present in the non-magnetic product, the cassiterite is only intergrown with hematite. For these particles, a more detailed analysis is necessary.
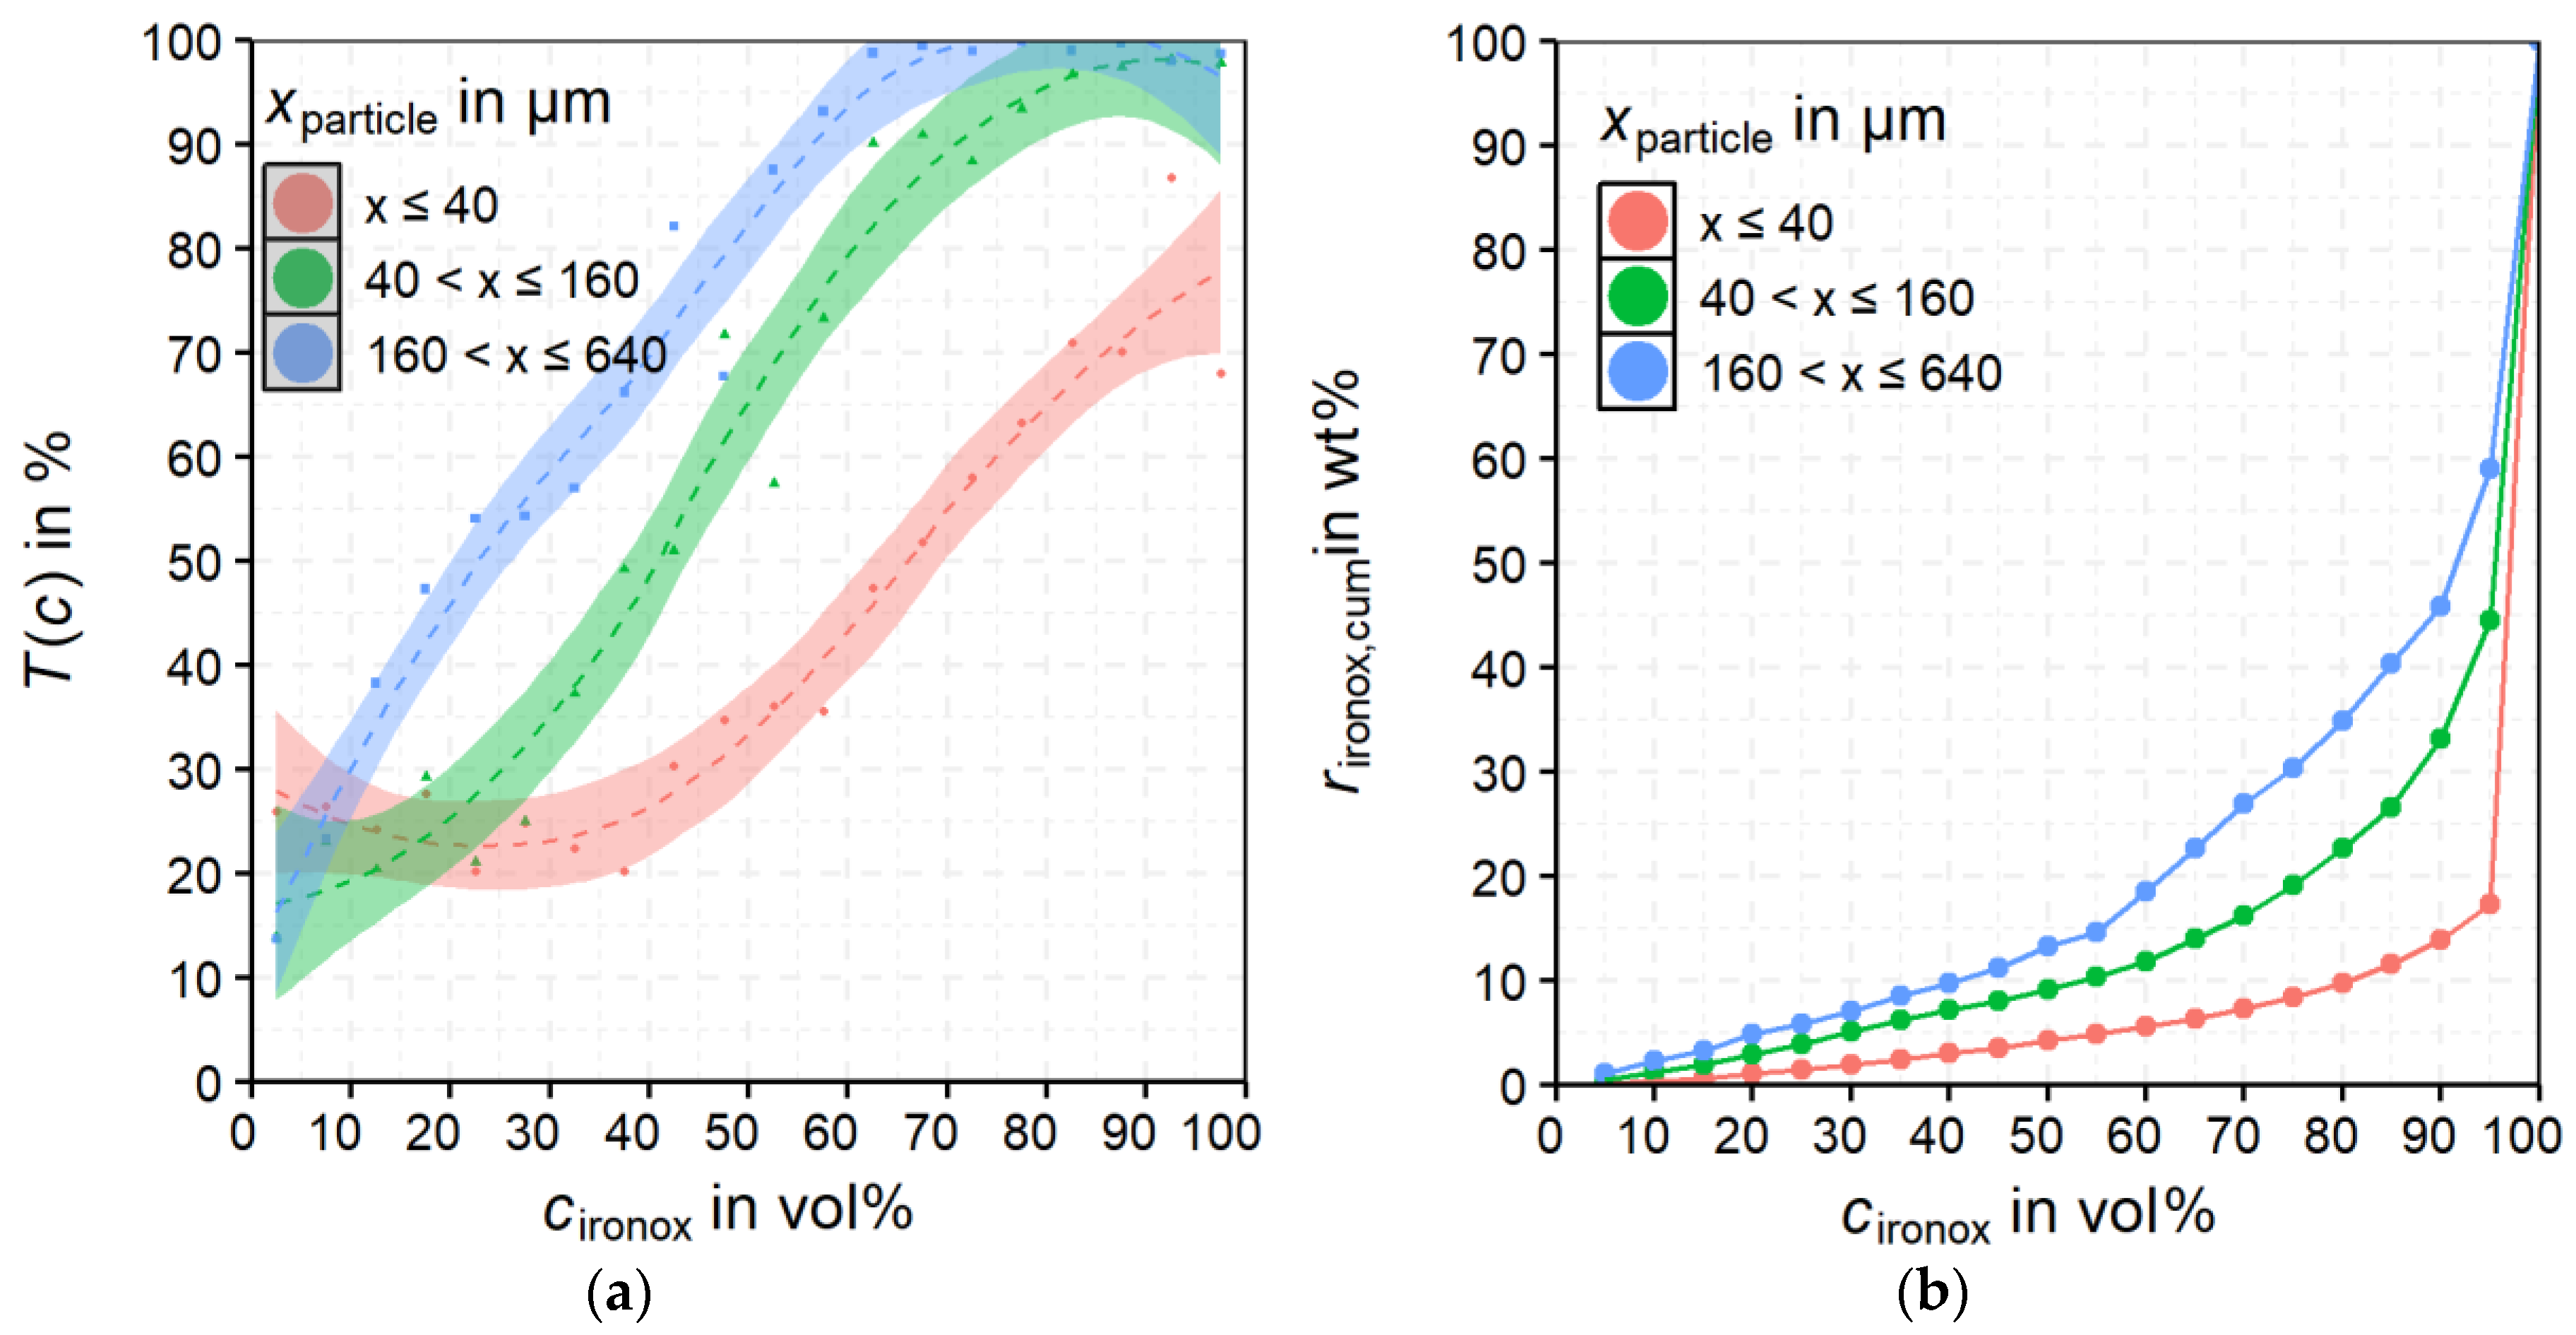
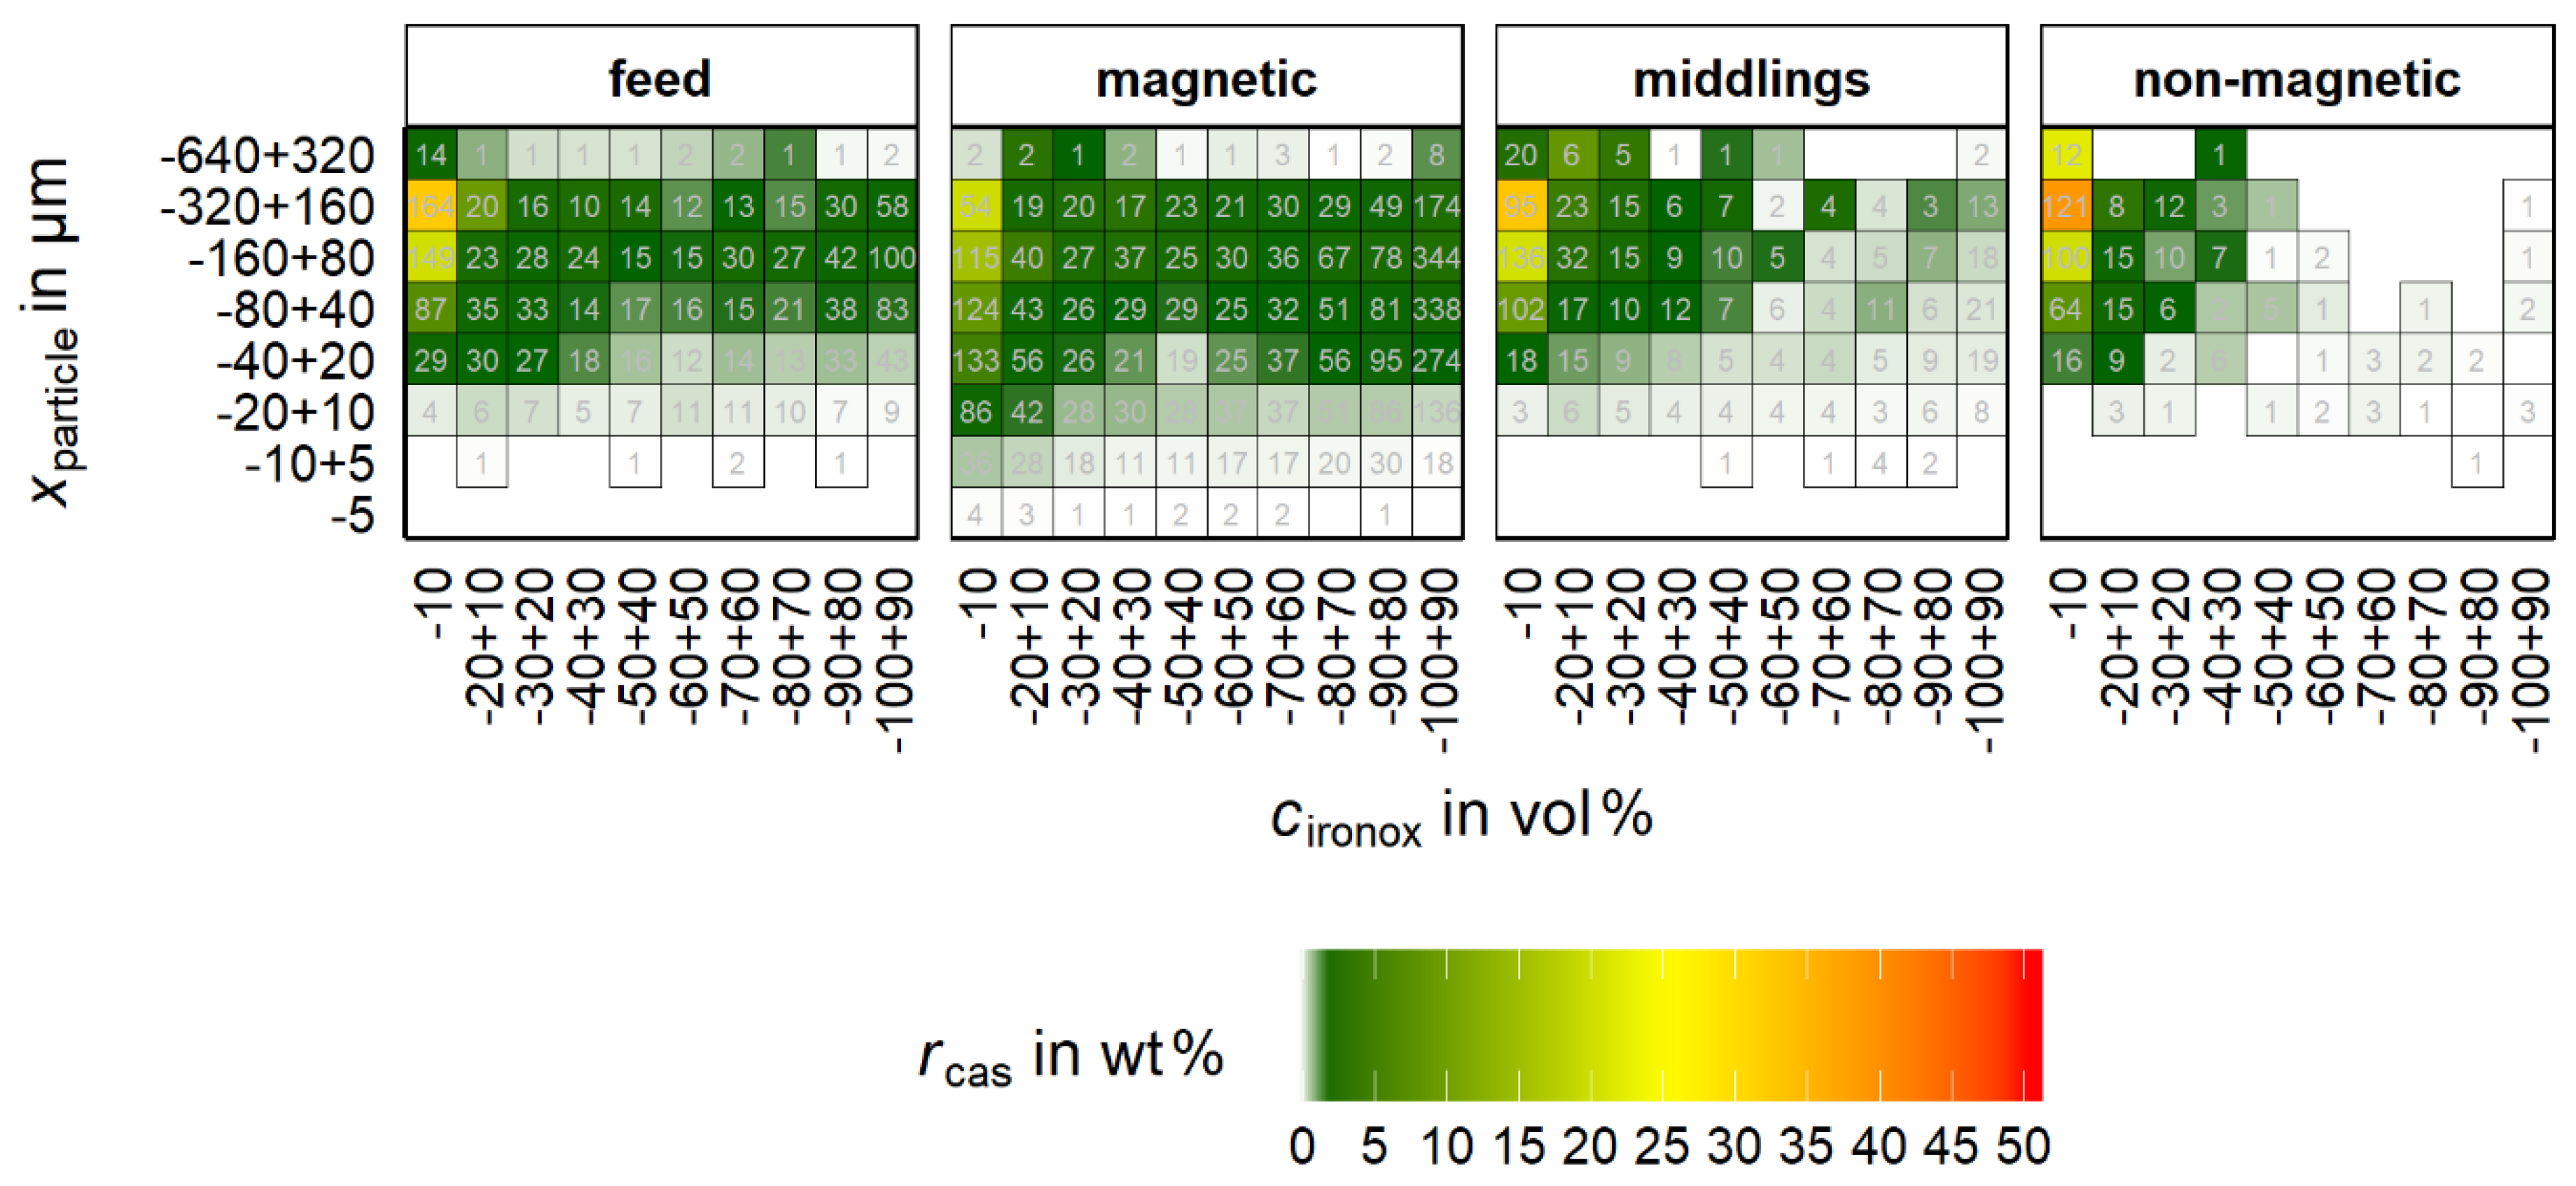
Figure 12 implies the necessity of a more detailed analysis of the particles that are comprised of cassiterite and iron oxides. In
Figure 13, the distribution of these particles is shown as a function of particle size and
cironox classes.
For
rcas, the non-magnetic product shows a clear accumulation at low
cironox. The maximum
rcas is for
cironox at −10 wt % and
xparticle at −320 + 160 µm. For the non-magnetic product, the majority of the cassiterite shows
cironox below 30 vol%. The magnetic product shows an obviously broader distribution of cassiterite over the
cironox classes. Despite that, the maximum is also in the class −10 vol% but significantly less pronounced than in the non-magnetic product. Furthermore, the optical impression in
Figure 13 implies a slight shift of
rcas to lower particle size classes for the magnetic product compared to the non-magnetic product. The behavior of the middlings shows a clear maximum in the fraction
cironox −10 vol% but also a broader distribution of
rcas over
cironox than in the non-magnetic product. It can be concluded that already small proportions of iron oxides (most probably magnetite) in the particle suffice to recover it in the magnetic product or the middlings.
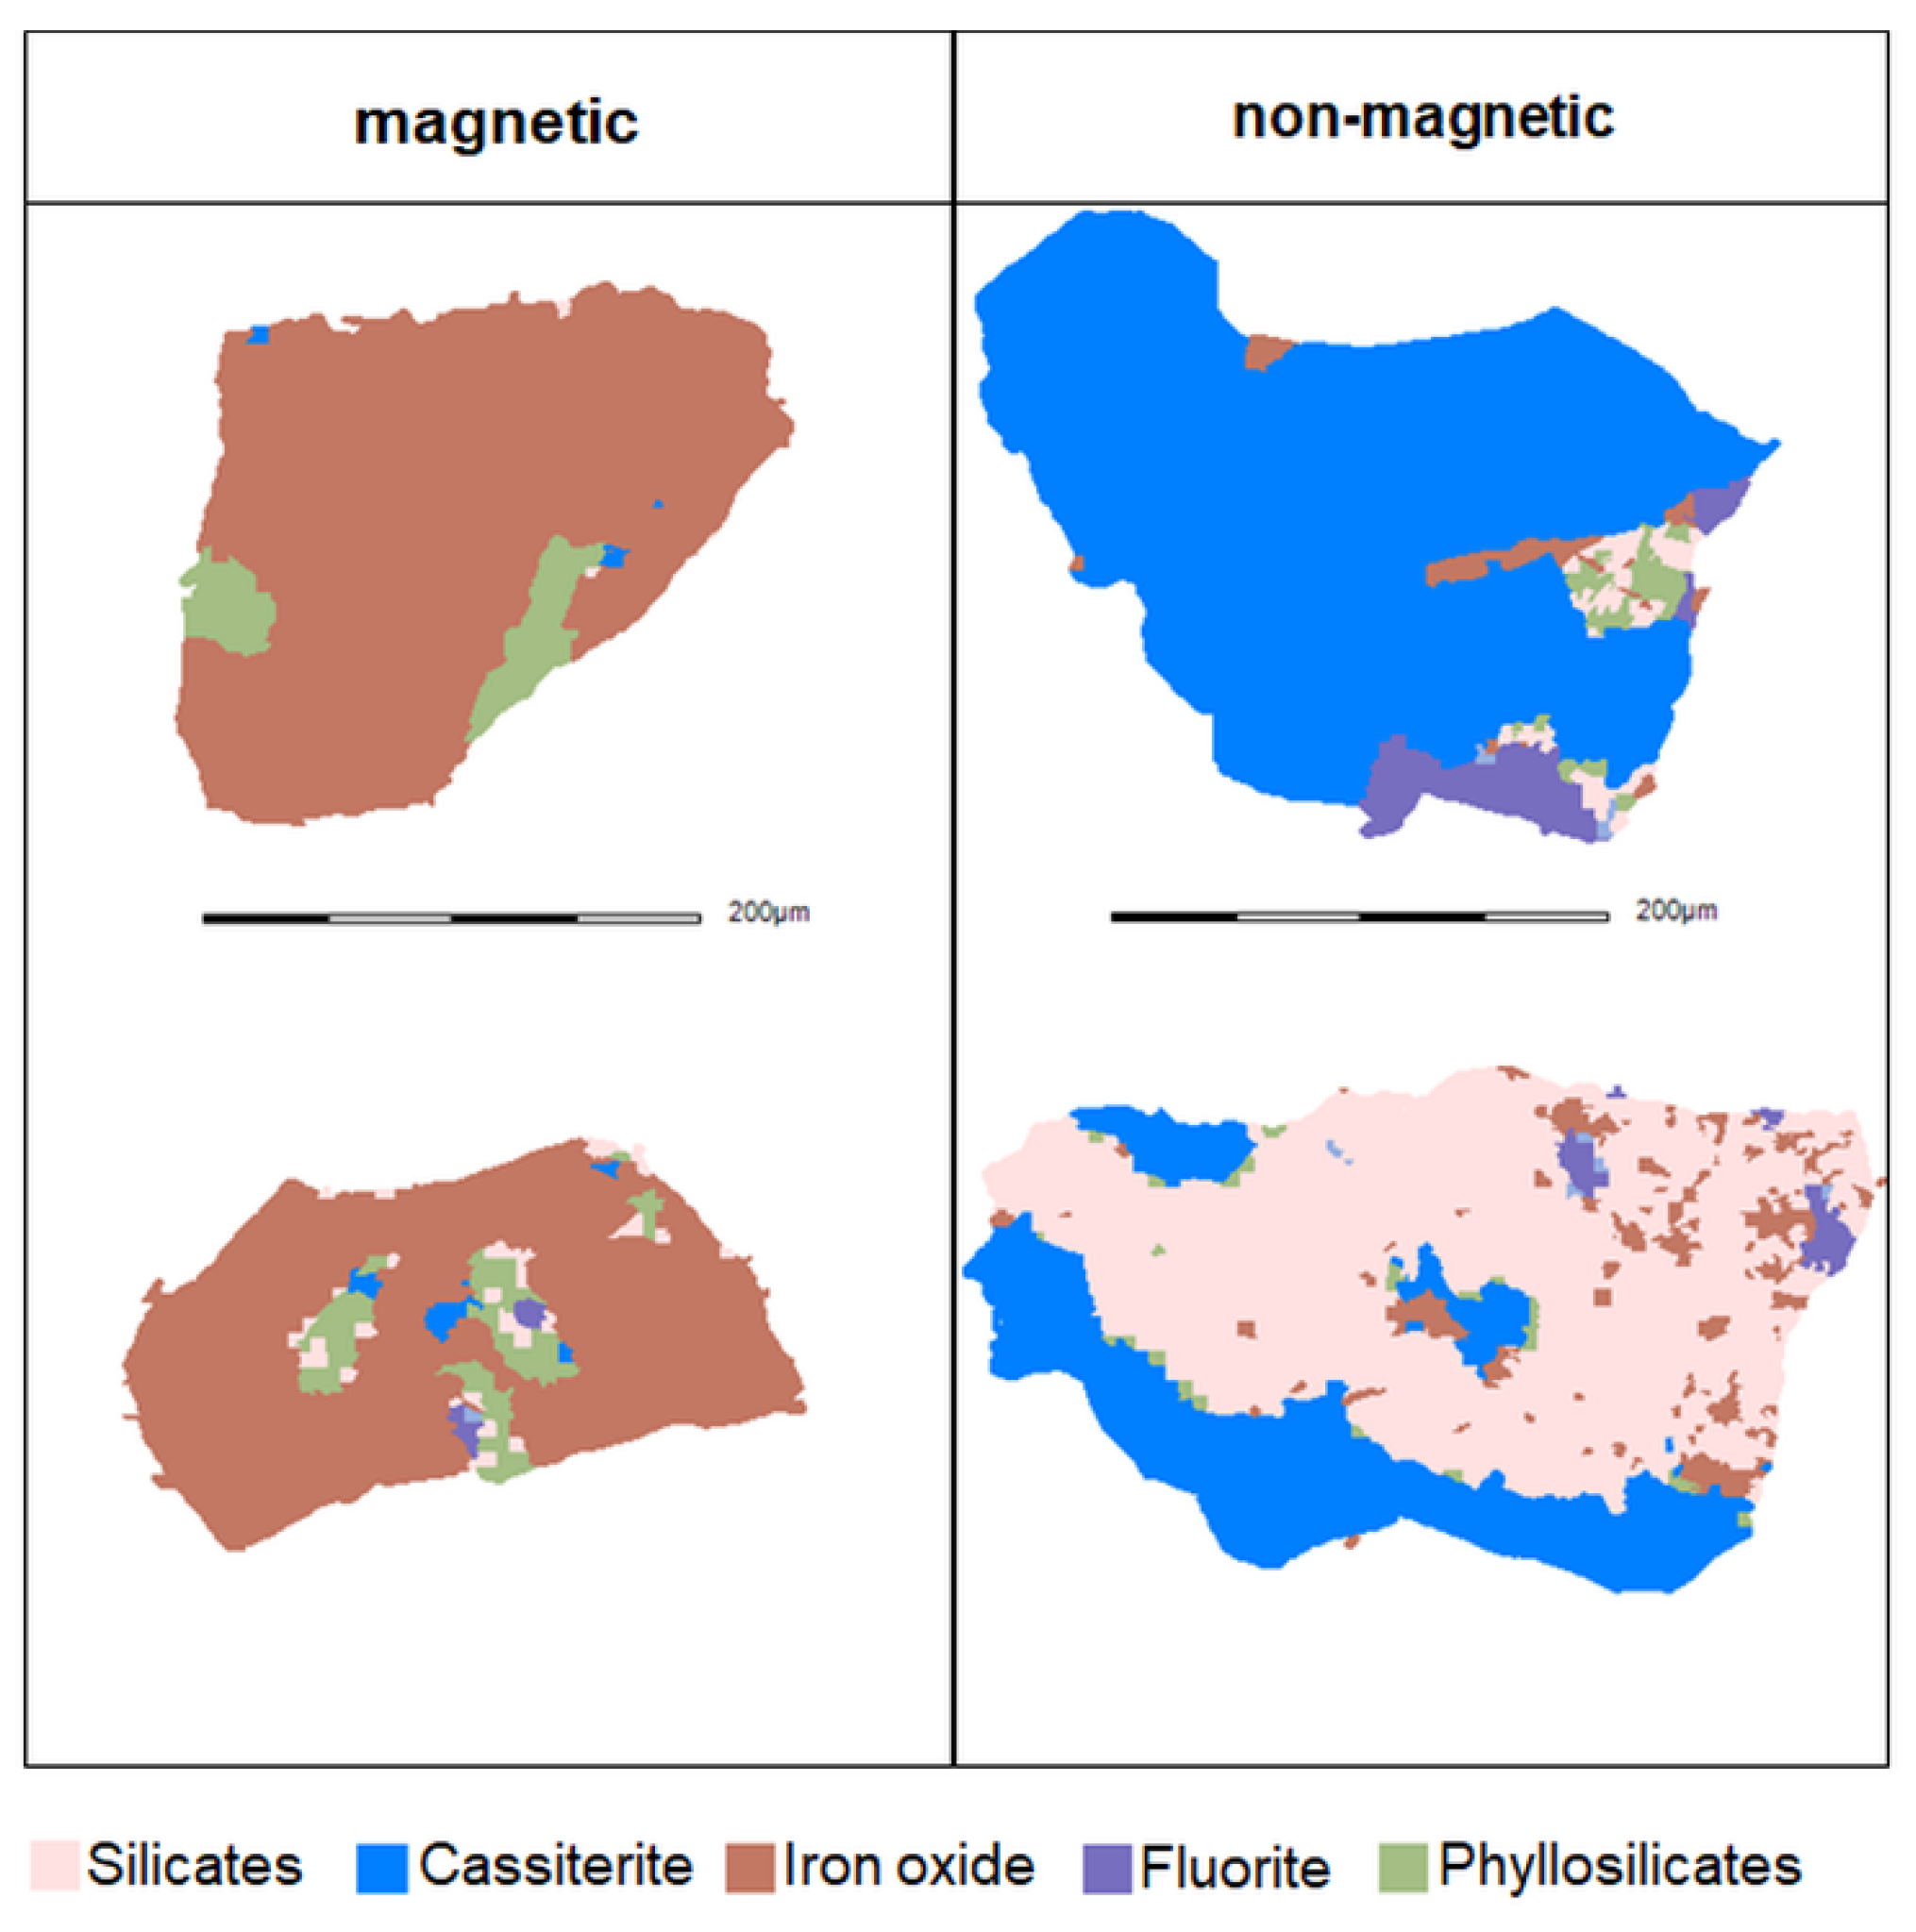
For the magnetic and the non-magnetic products, respectively two typical particle images that contain cassiterite and iron oxides are shown in
Figure 14.
As seen in
Figure 14, the magnetic product exhibits the finely disseminated cassiterite grains within the matrix of iron oxides. Conversely, in the case of the non-magnetic product, the iron oxides are finely disseminated within matrices of other minerals. These characteristics of the ore material represent one reason for discharge of minerals with iron oxides into the non-magnetic product and the loss of finely intergrown cassiterite into the magnetic product.
3.4.3. Fully Liberated Cassiterite
For an ideal magnetic separation, the assumption is that a particle, solely consisting of cassiterite, can be recovered in the non-magnetic fraction.
Table 8 shows, however, that a considerable number of particles that show an apparent (2D) fully liberation of cassiterite are recovered in the magnetic product.
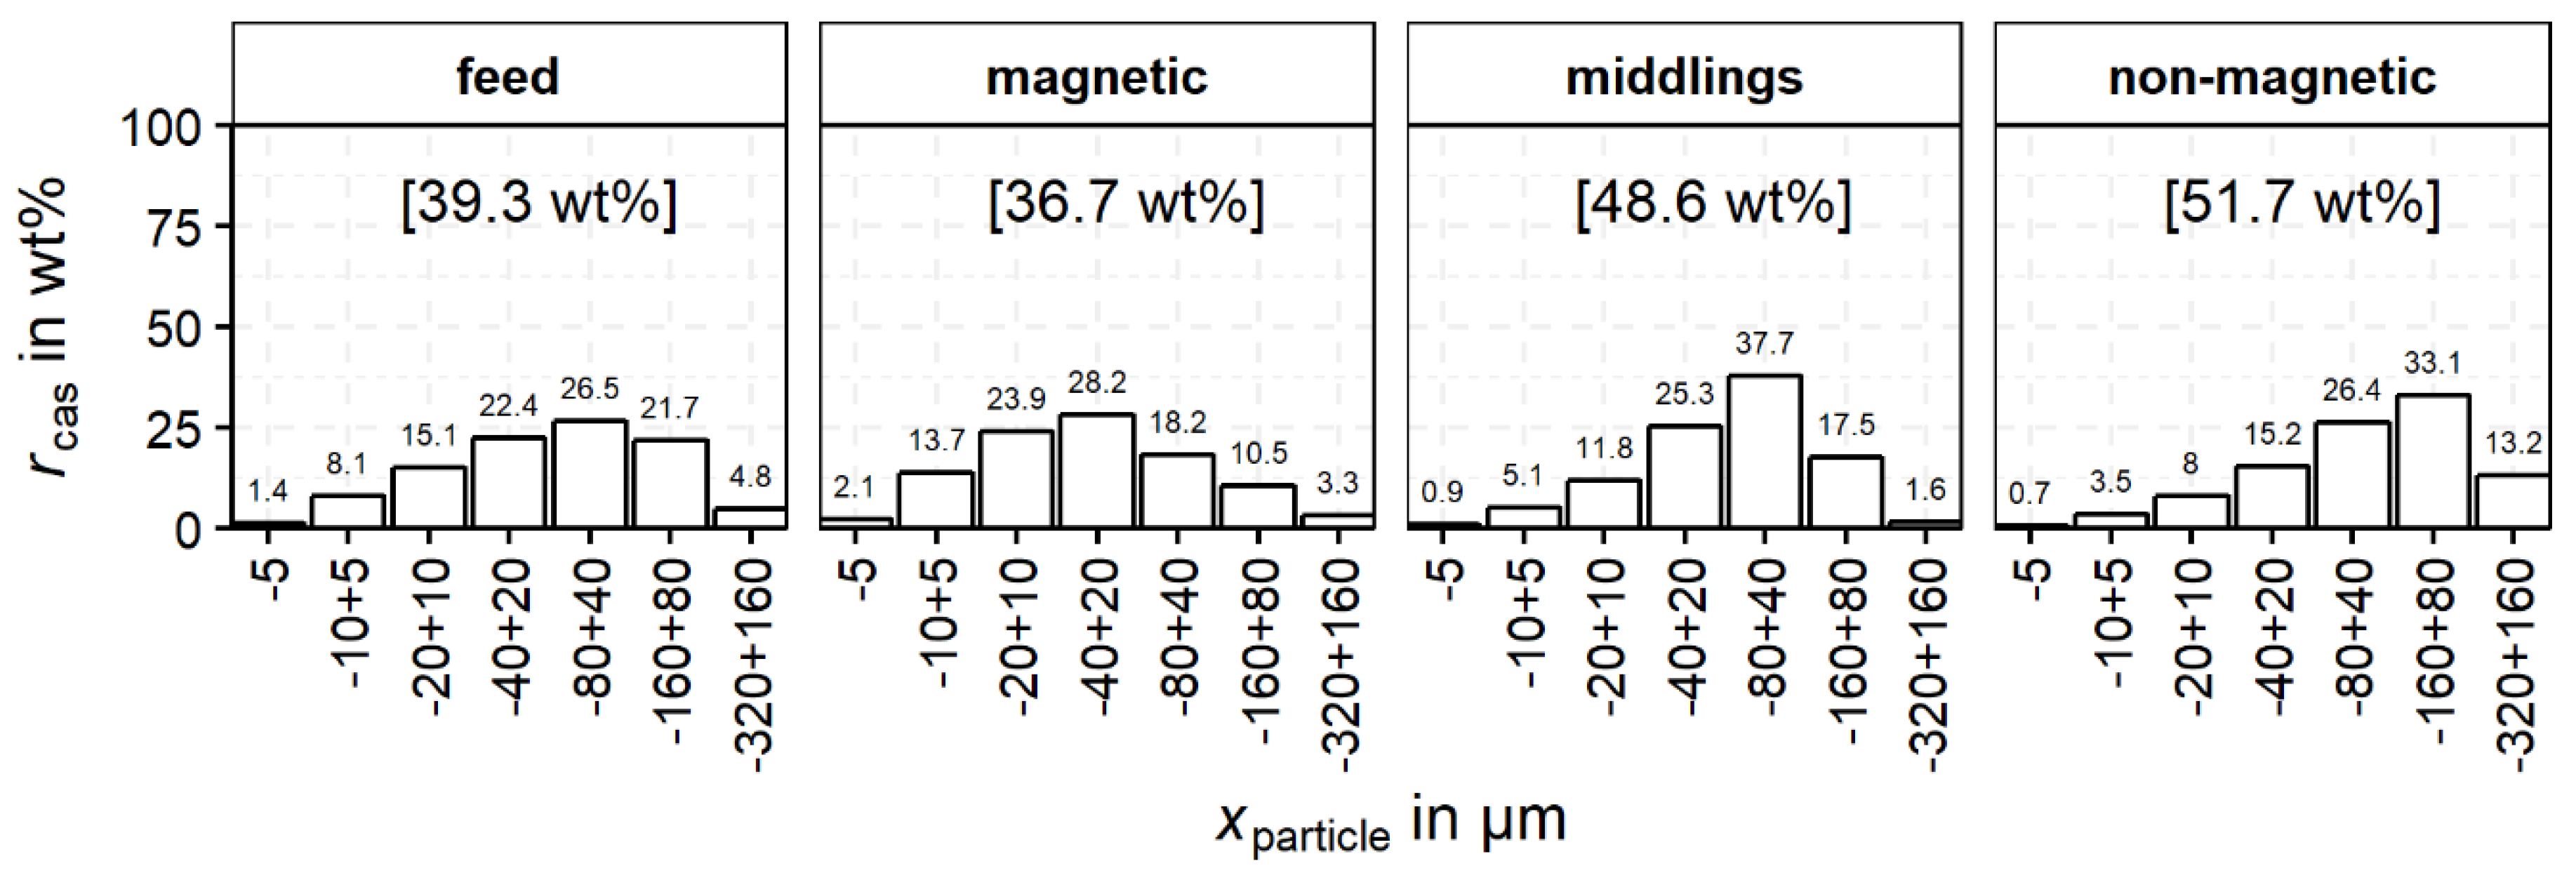
To compare the particle size range of fully-liberated cassiterite,
rcas is shown as a function of the particle size classes for the feed and the products of magnetic separation in
Figure 15. The distribution for
rcas of the magnetic product is shifted to a lower particle size range compared to the non-magnetic product. For the non-magnetic product, the maximum of
rcas can be found for the particle size class −160 + 80 µm, whereas for the magnetic product,
rcas shows a maximum value in the class −40 + 20 µm.
The described observations lead to the conclusion that one reason for the relatively high recovery of 100% (apparently) liberated cassiterite in the magnetic product is agglomeration of fine particles and their attachment to coarse and high magnetic particles. Nevertheless, as already stated, due to stereological effects the liberation based on MLA data is overestimated. Associated minerals might not be visible in the cutting plane and a proportion of the 100% liberated cassiterite can still be intergrown with some other minerals regarding the three dimensional structure.

 ,
, 


