Optimizing Flotation Circuit Recovery by Effective Stage Arrangements: A Case Study


Abstract
1. Introduction
2. Methodology
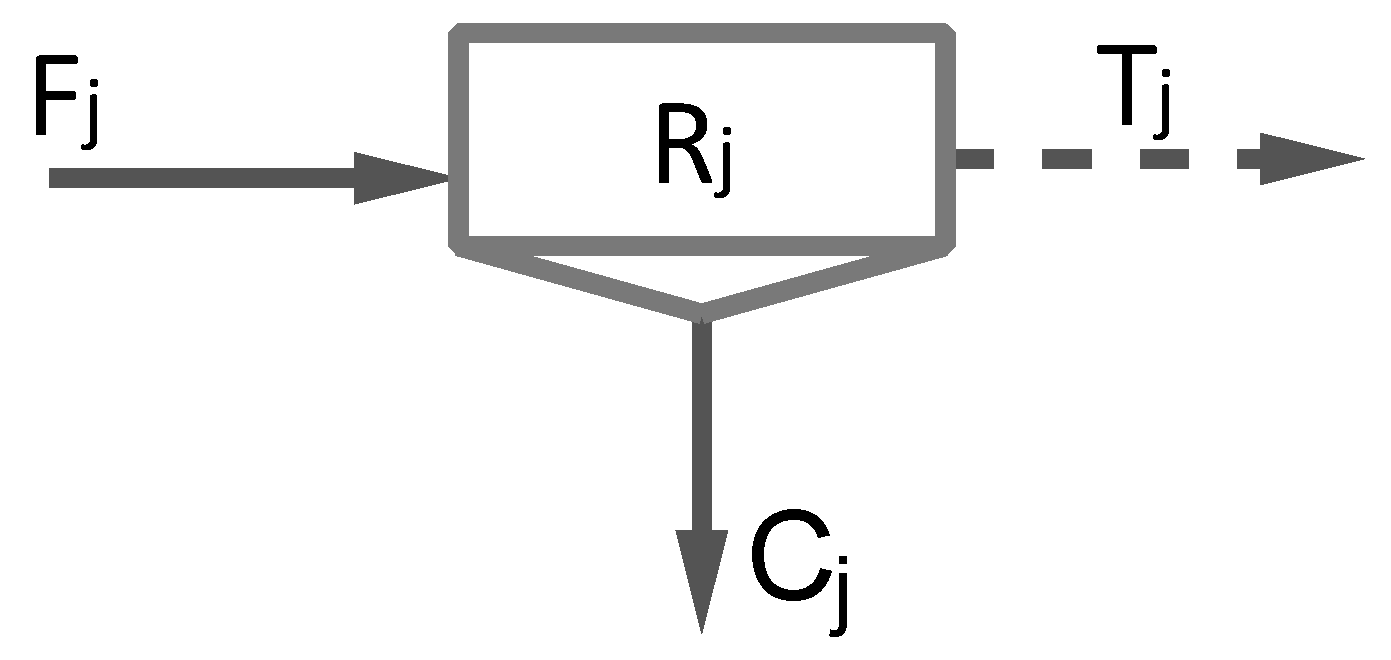
2.1. Transfer Function
- Rj = Recovery of the component j
- Cj = mass flowrate of the component j into the concentrate
- Tj = mass flowrate of component j into the tail
- Pc = probability of collision
- Pa = probability of attachment
- F = froth stability factor
- Rj = the steady state transfer function of the mineral species j
- kj = constant flotation rate of the mineral species j, min−1
- τj = residence time for species j in the flotation cell, min
- n = number of flotation cells in the bank
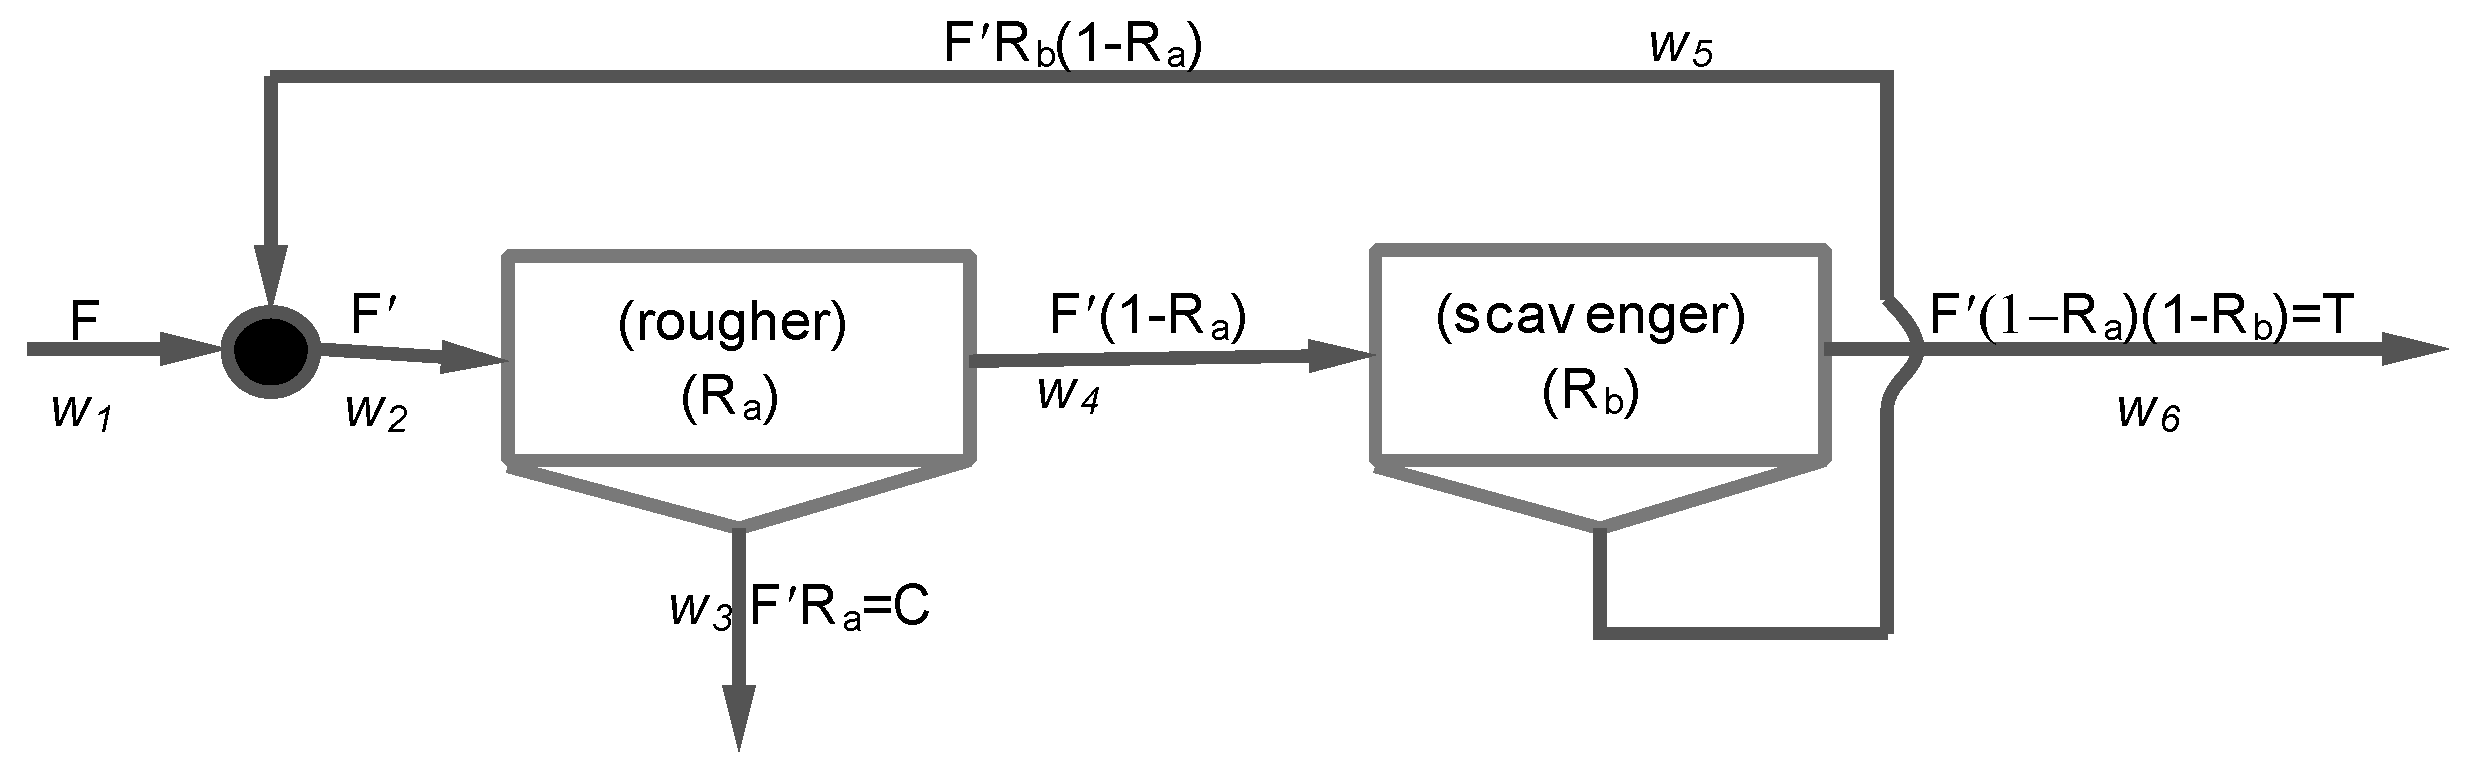
2.2. Circuit Function Calculation
- w2/w1 = 1/k,
- w3/w1 = Ra/k,
- w4/w1 = −(Ra − 1)/k,
- w5/w1 = −(Rb × (Ra − 1))/k,
- w6/w1 = ((Ra − 1) × (Rb − 1))/k,
3. Results and Discussion
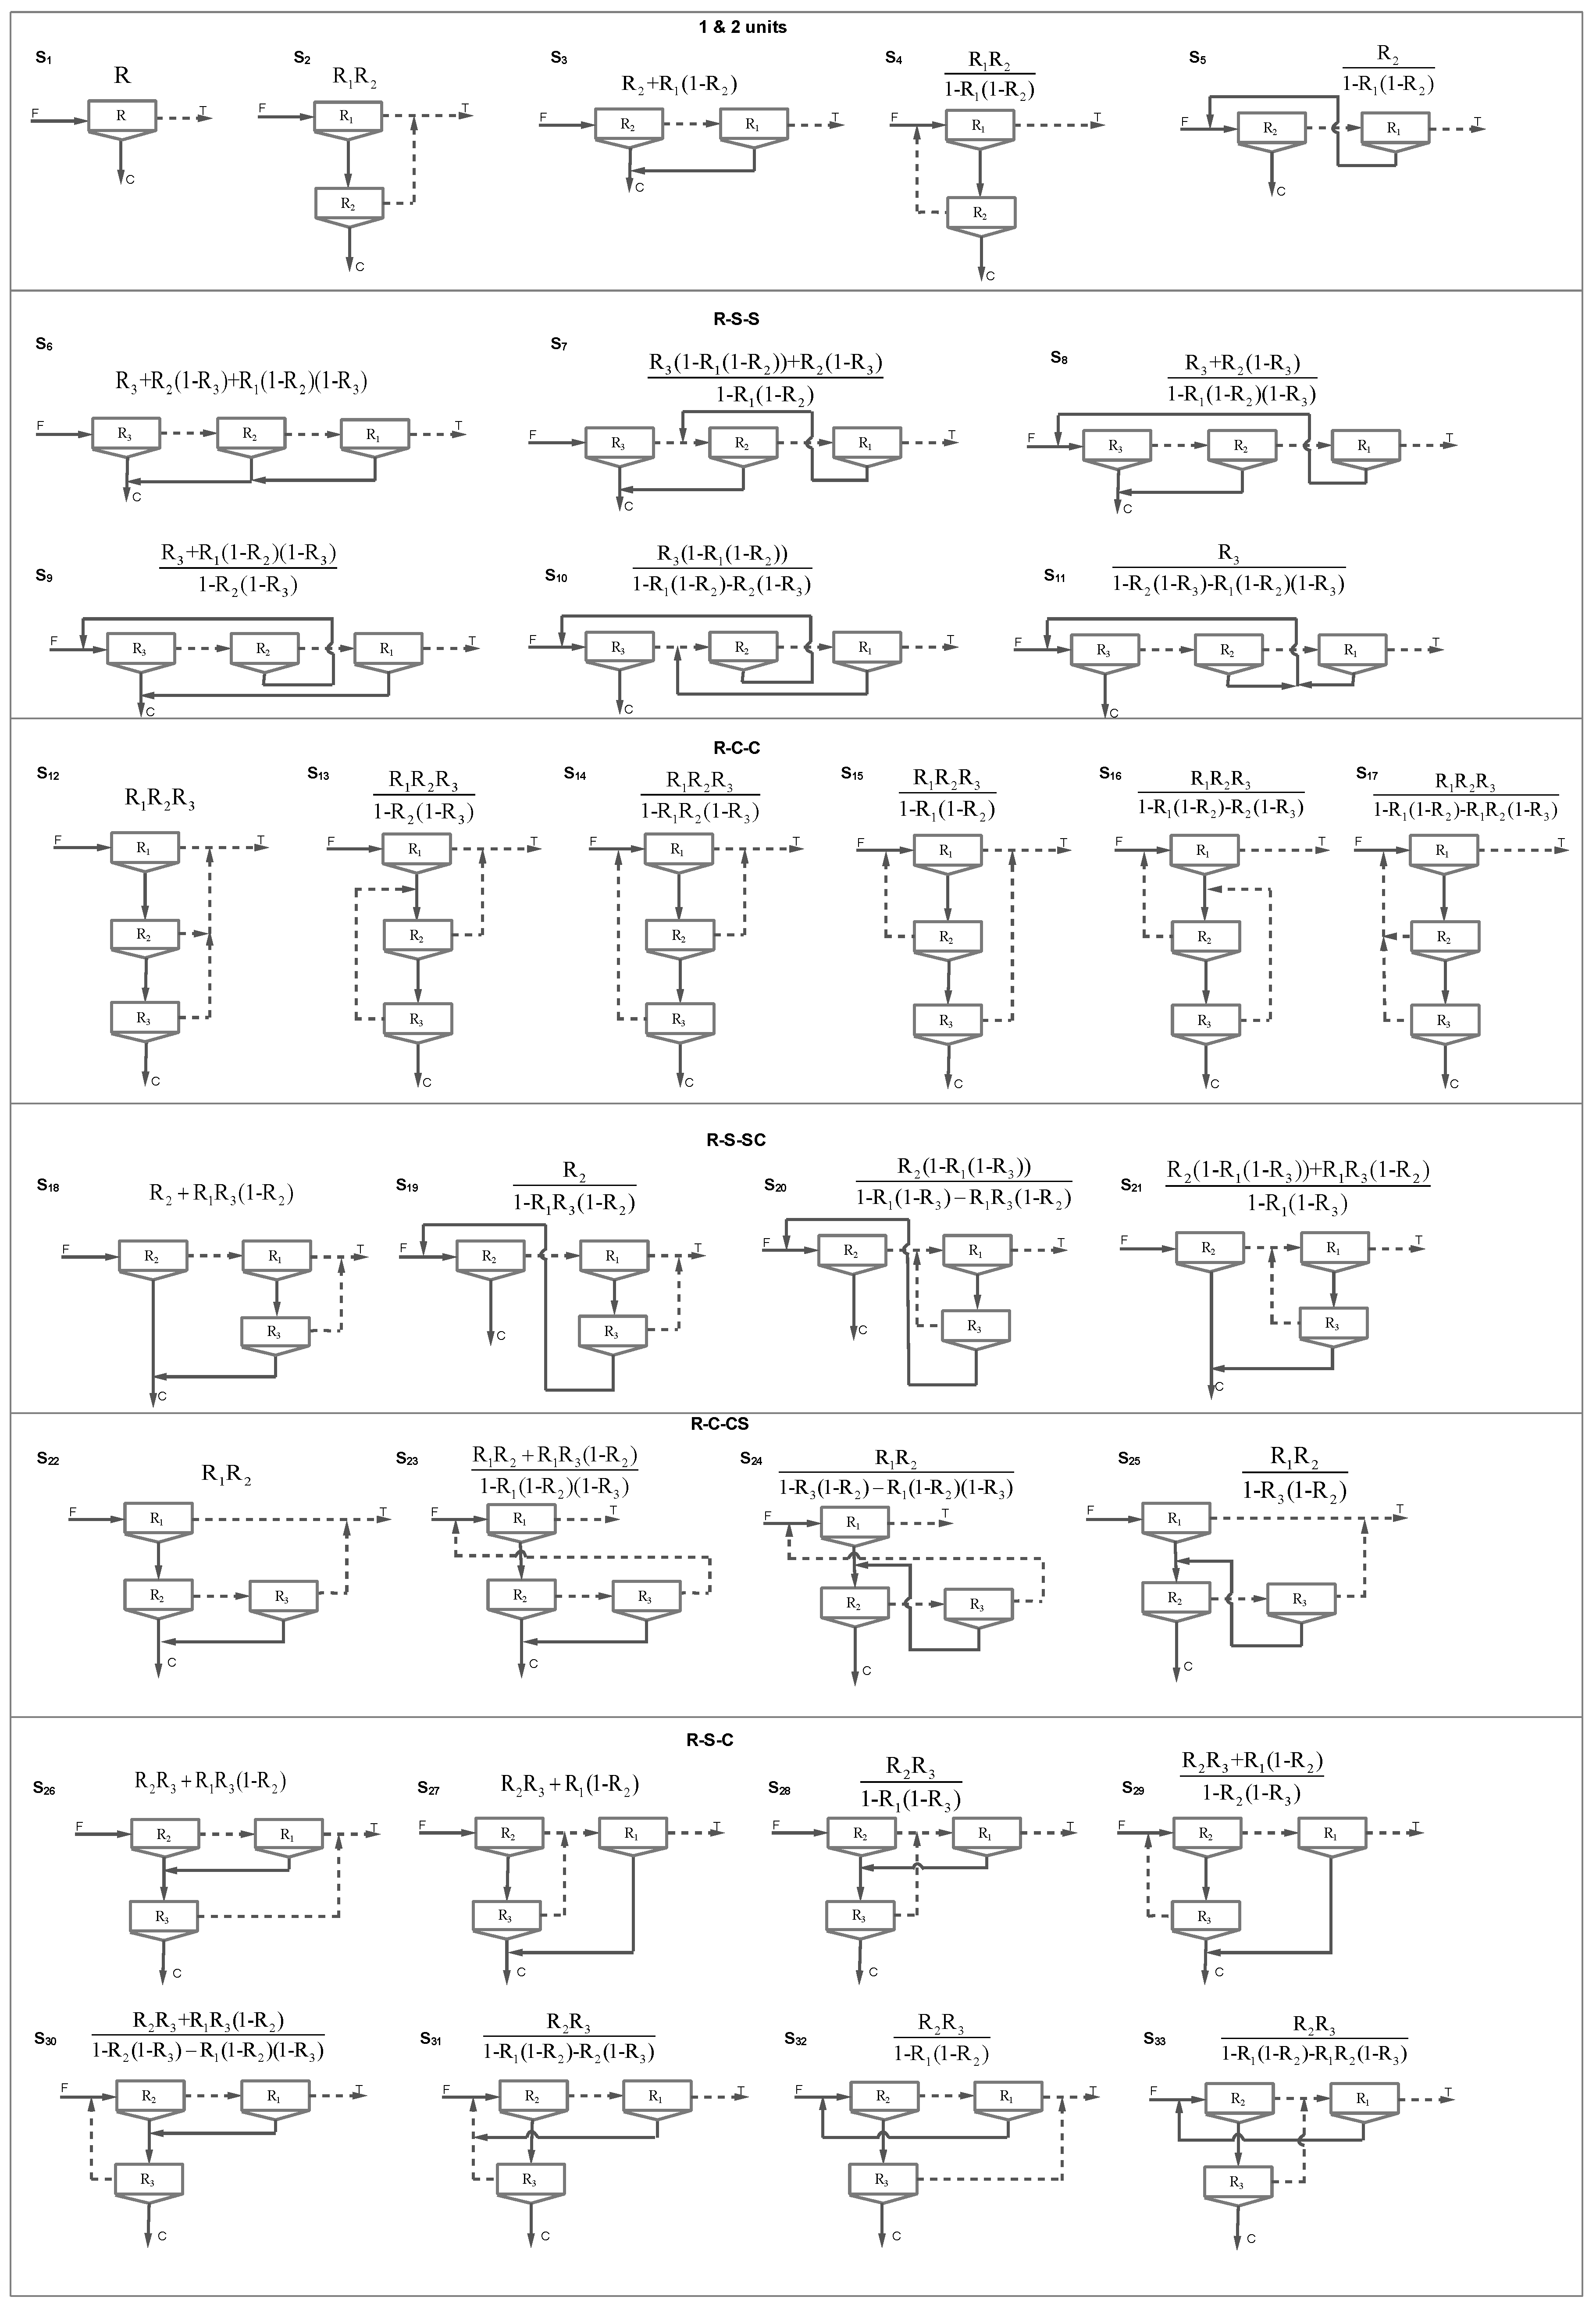
Recovery in Simple Circuits
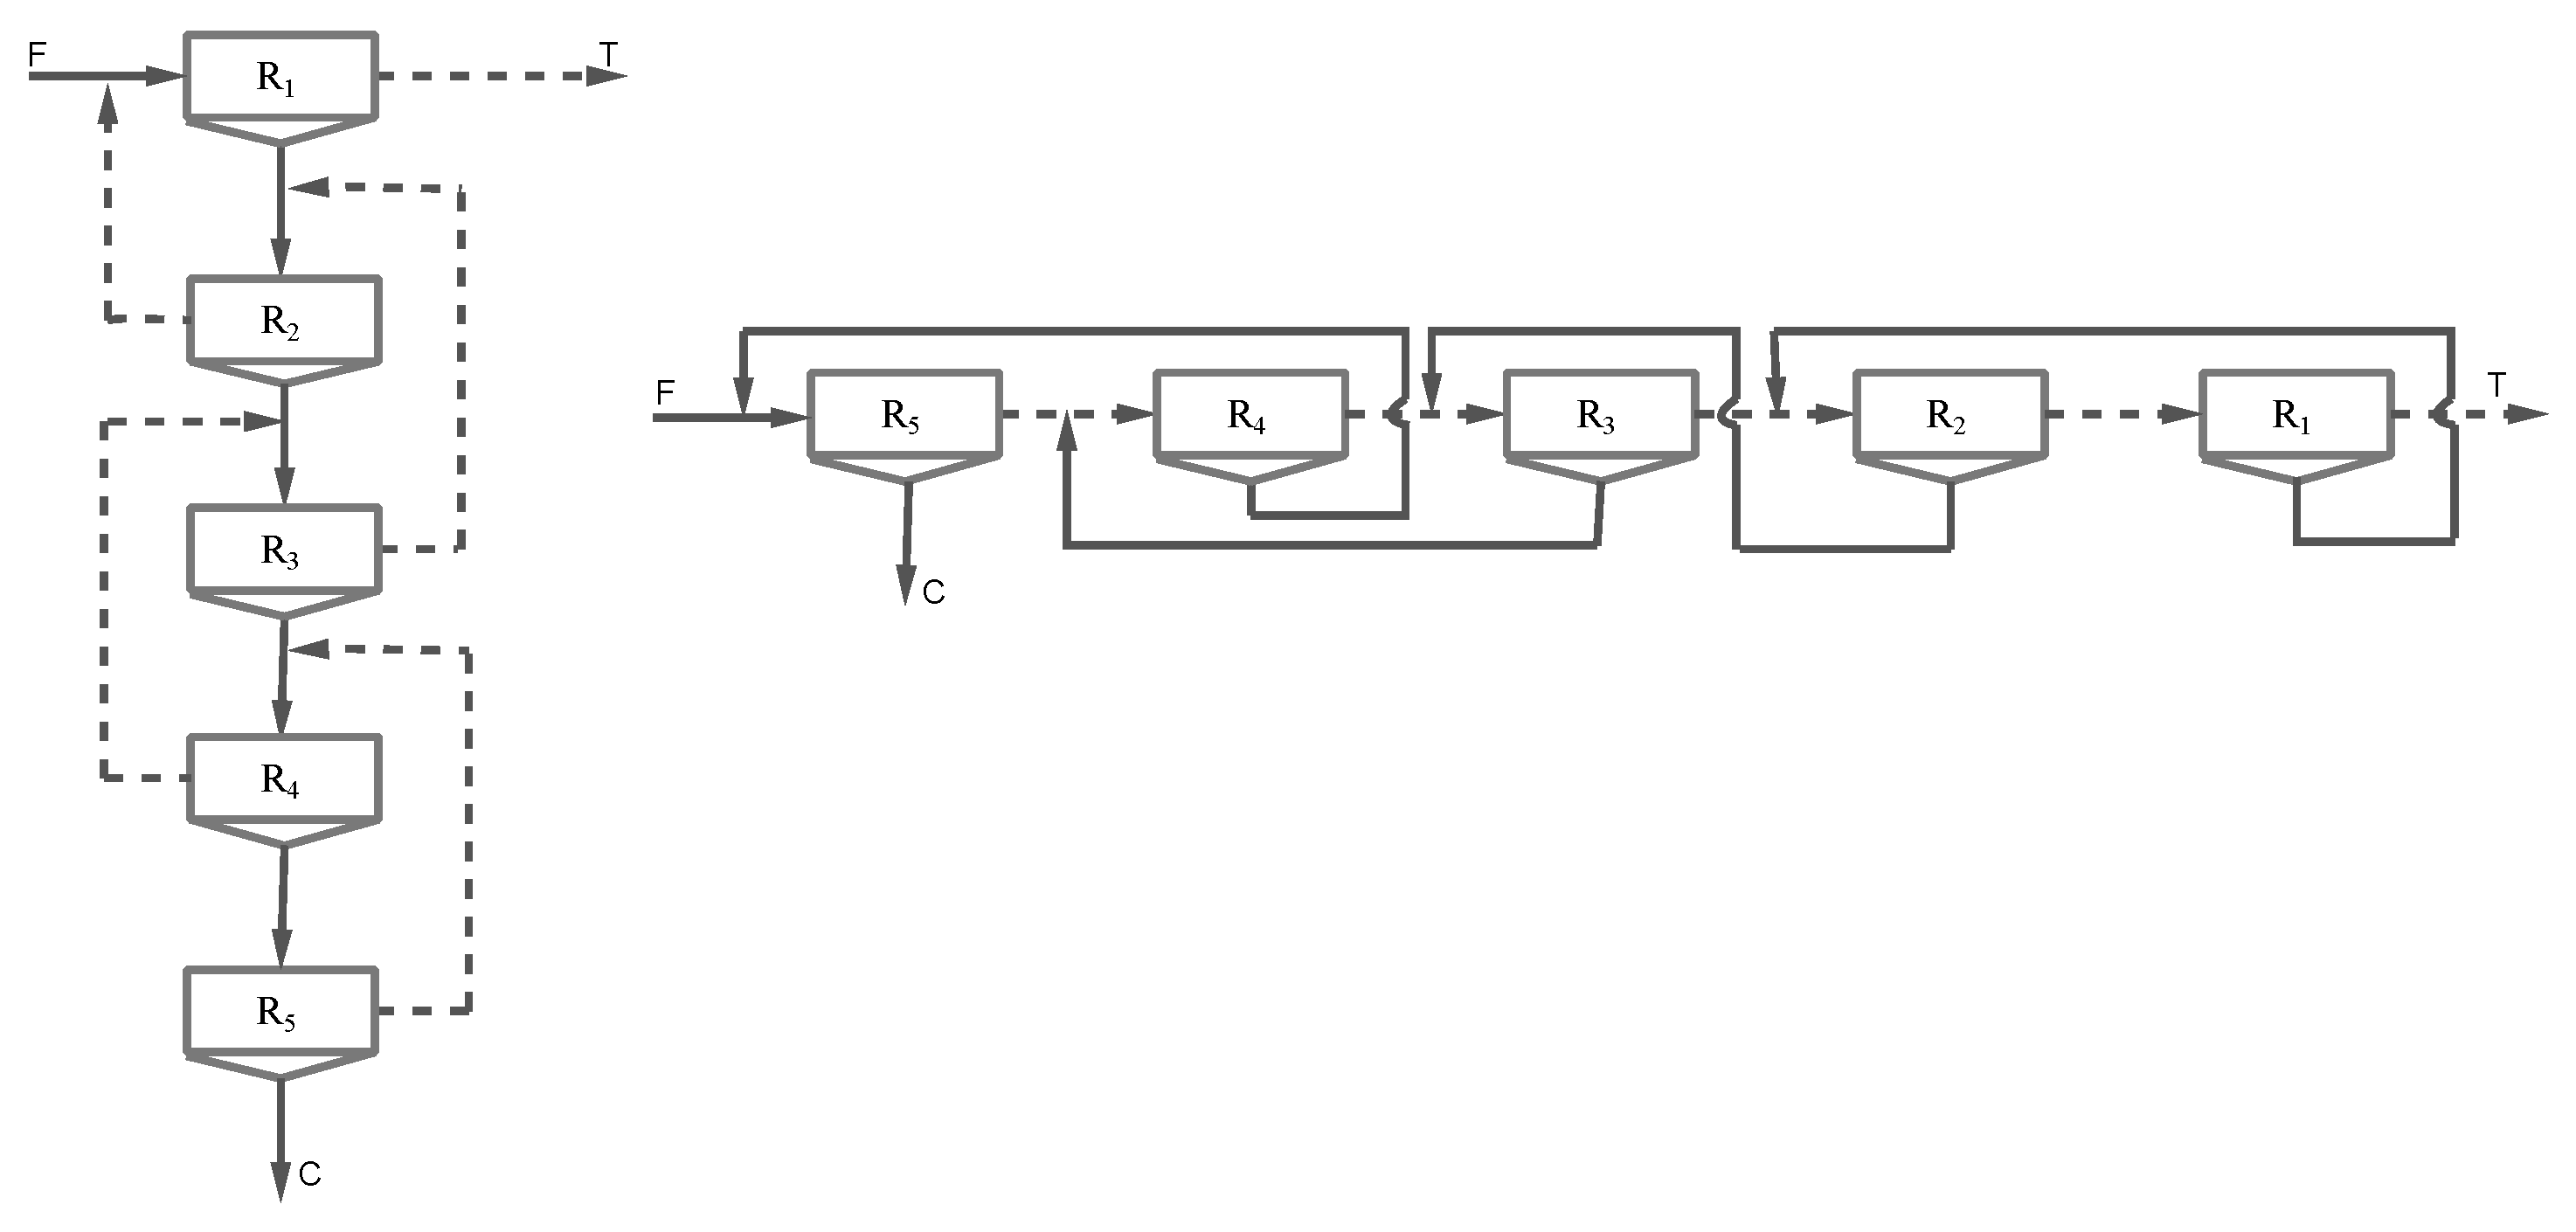
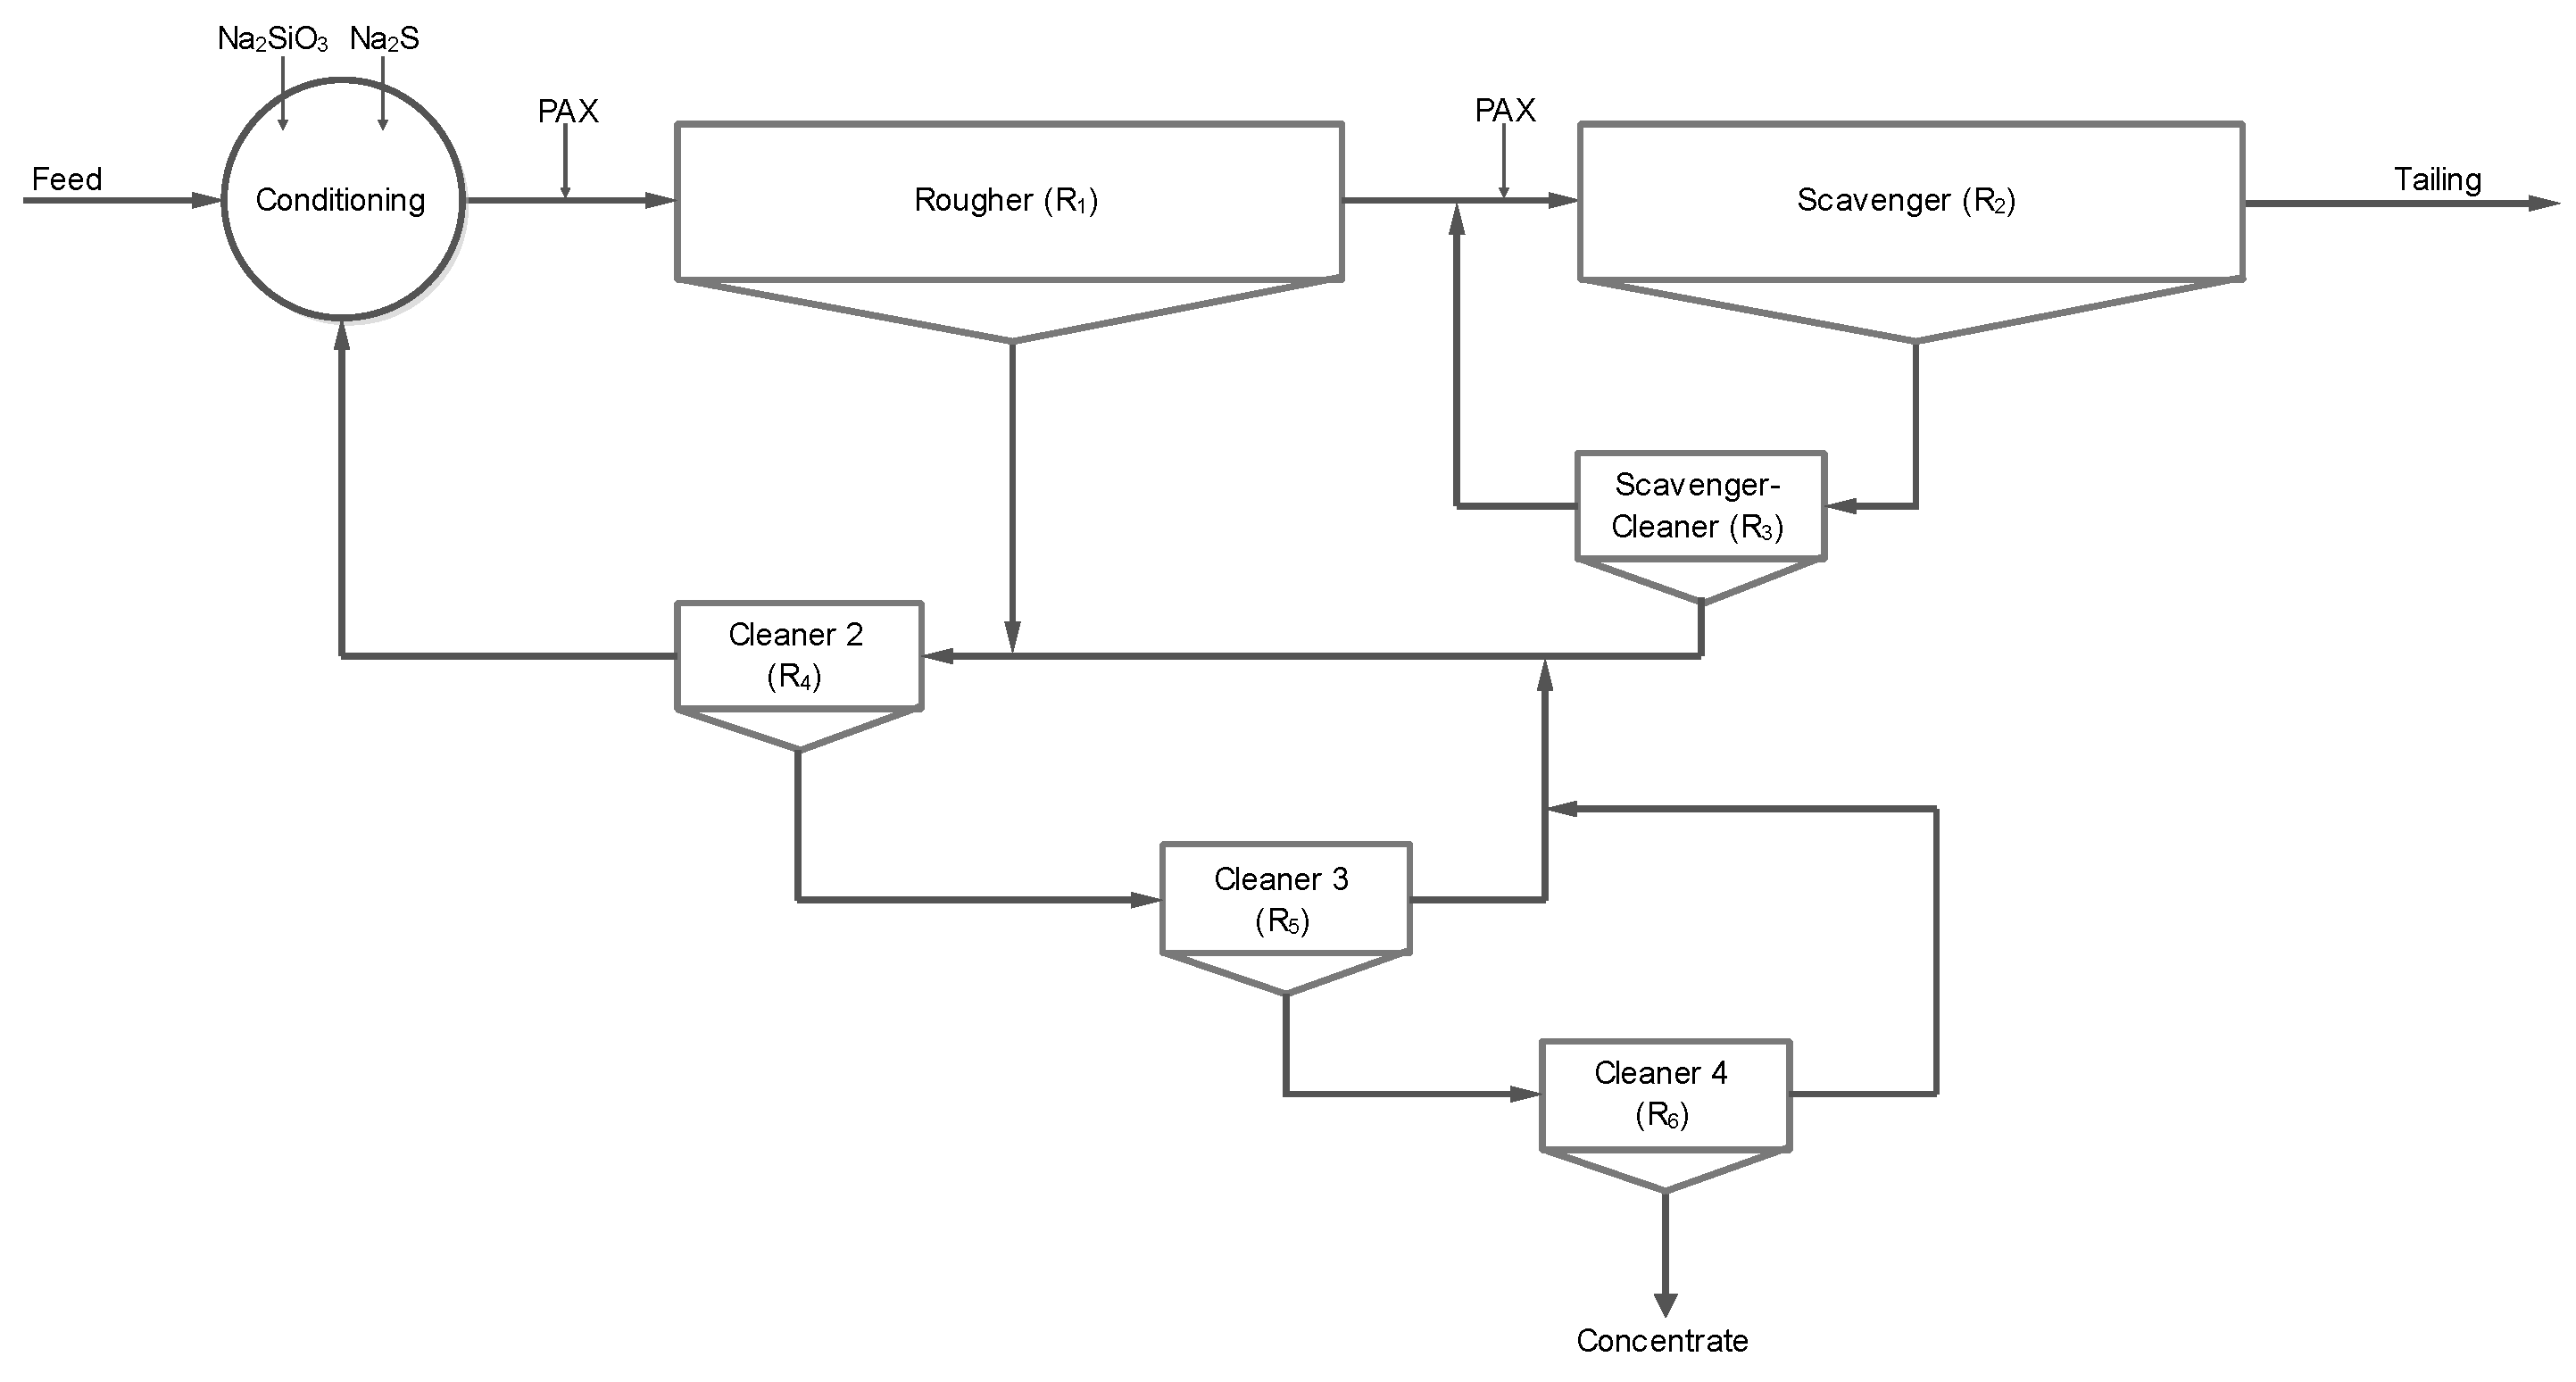
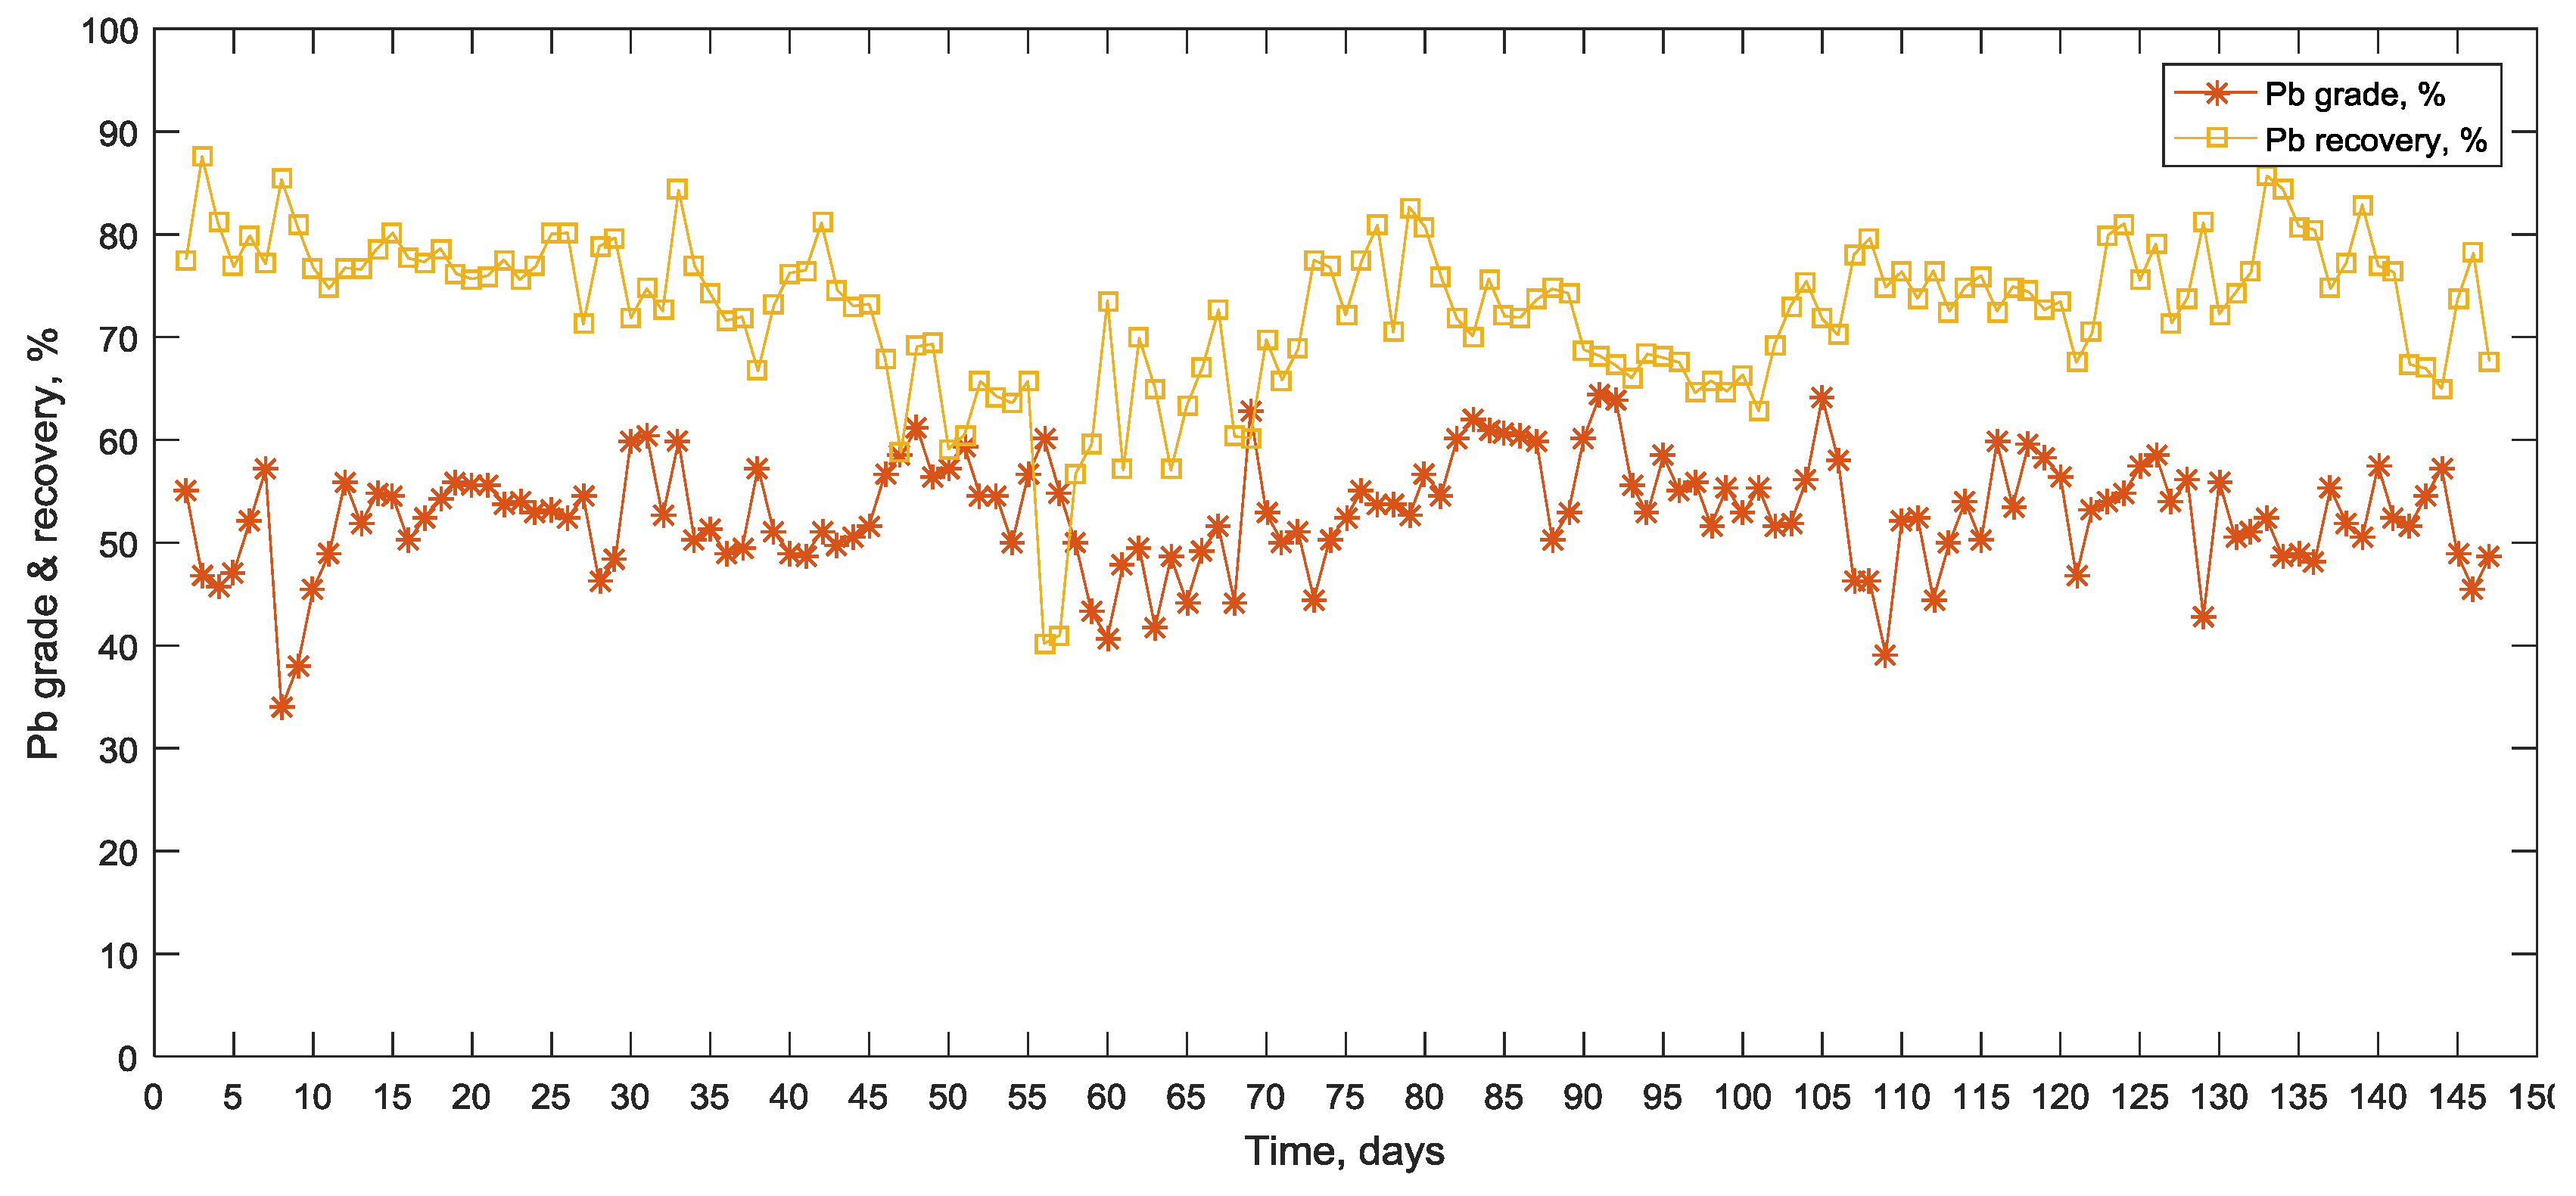
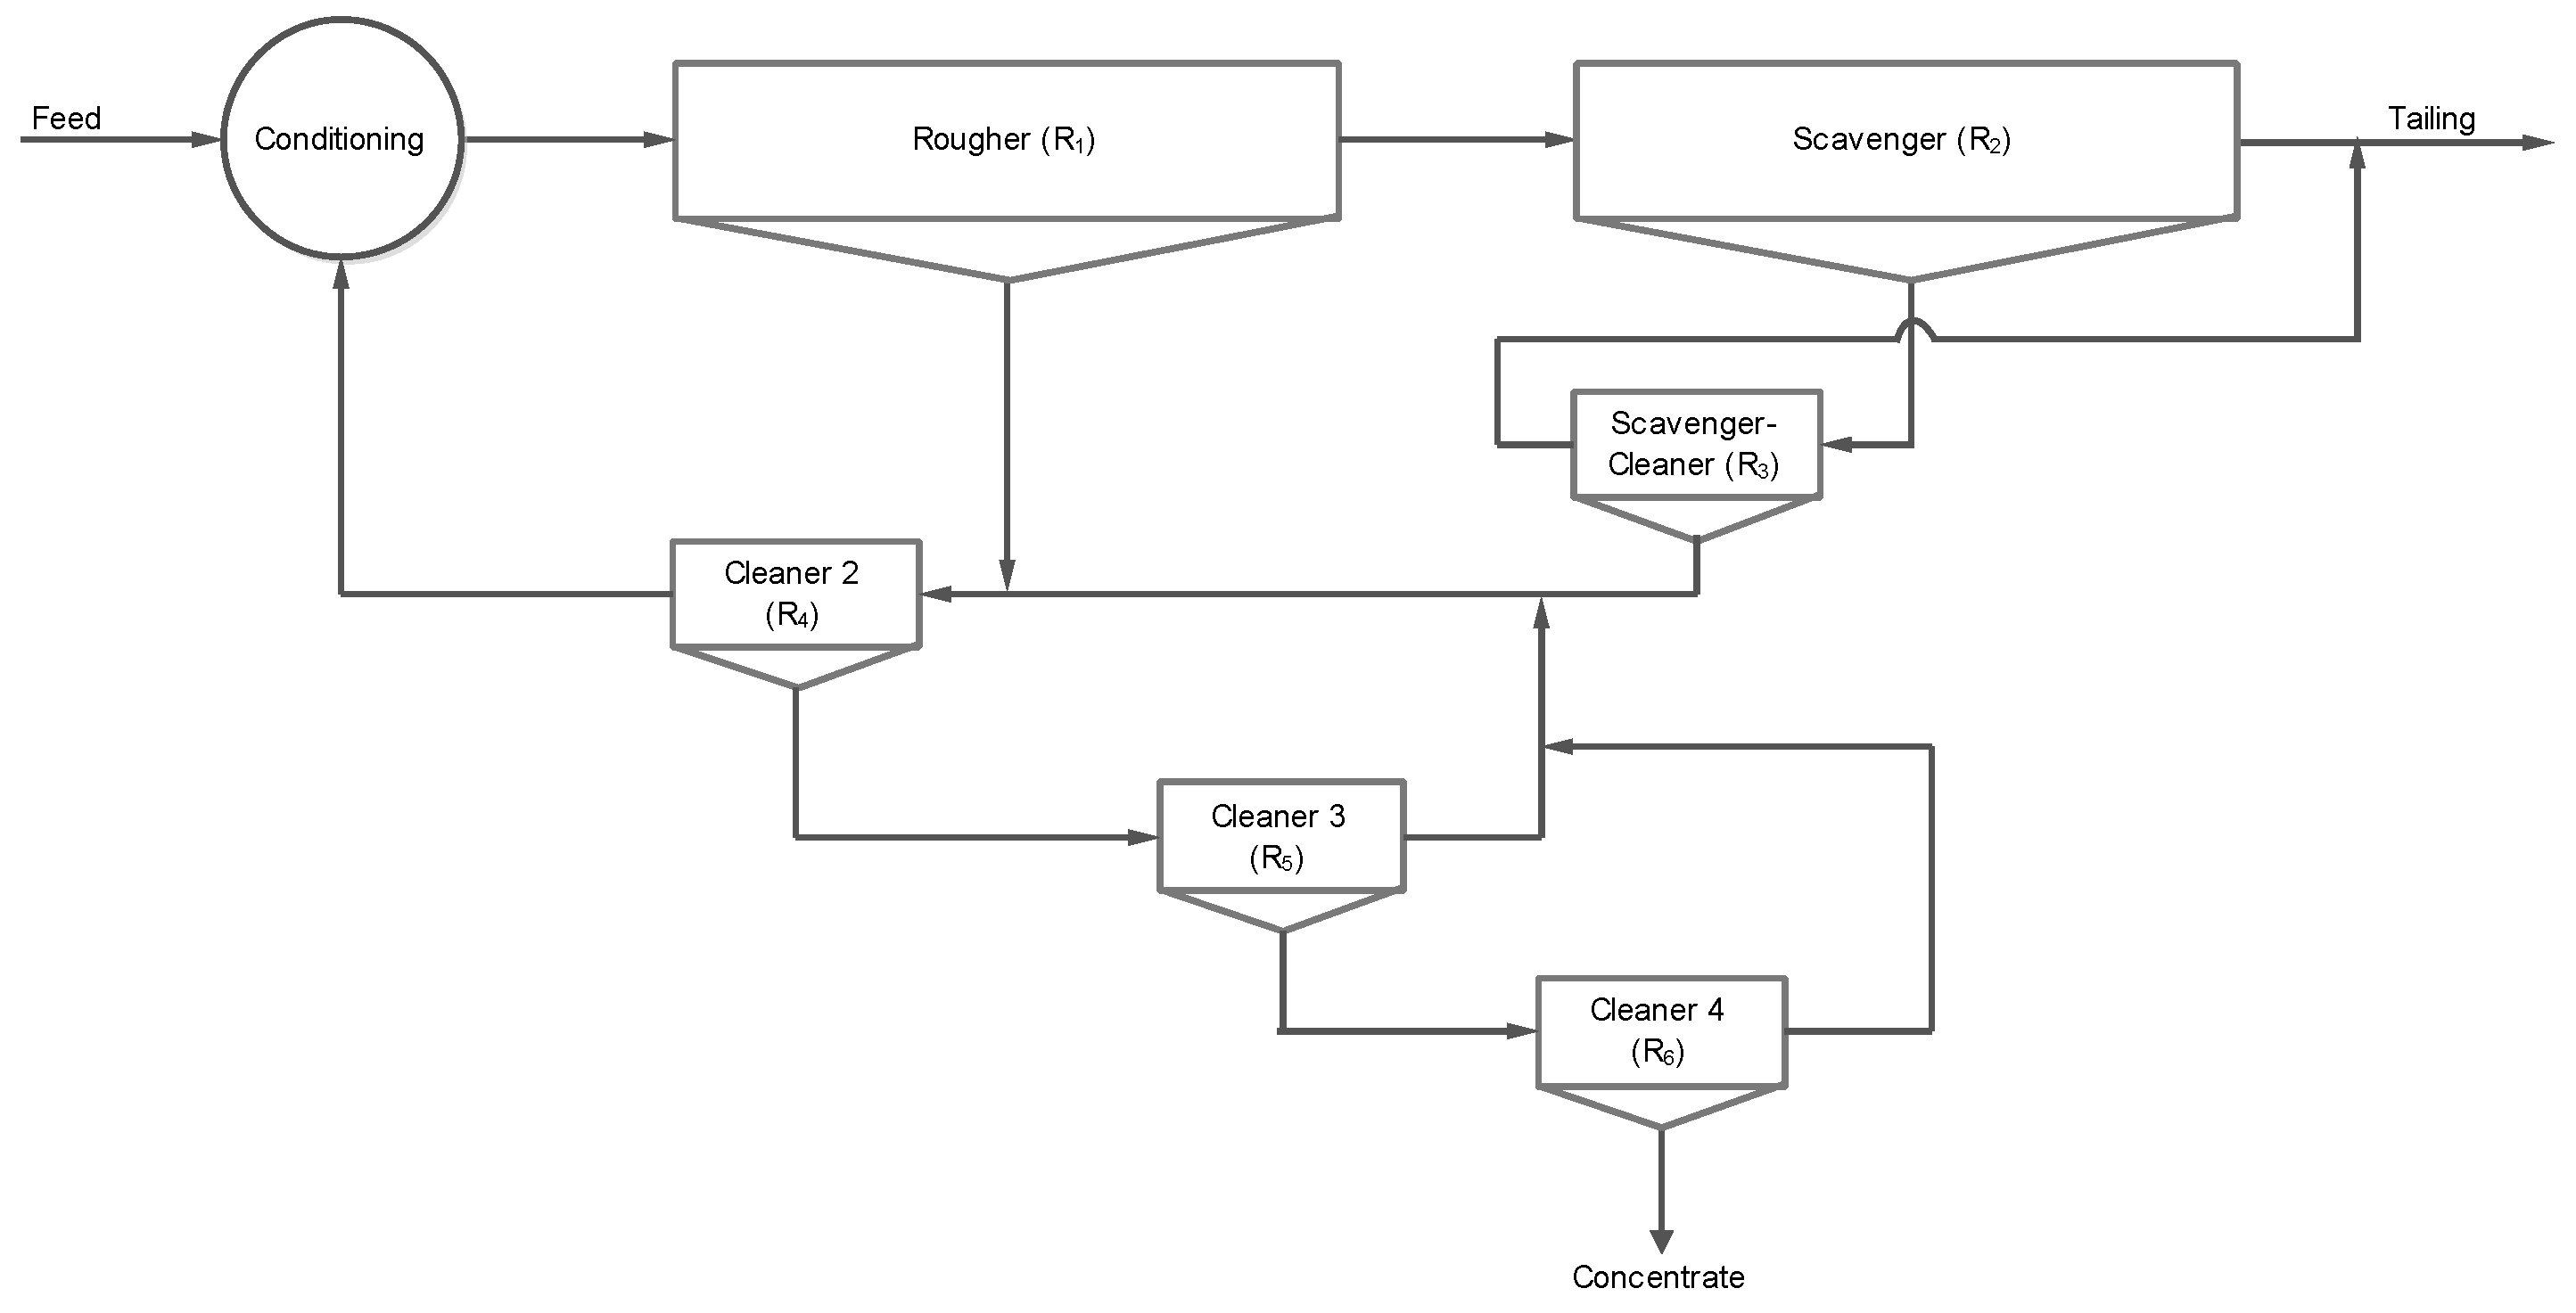
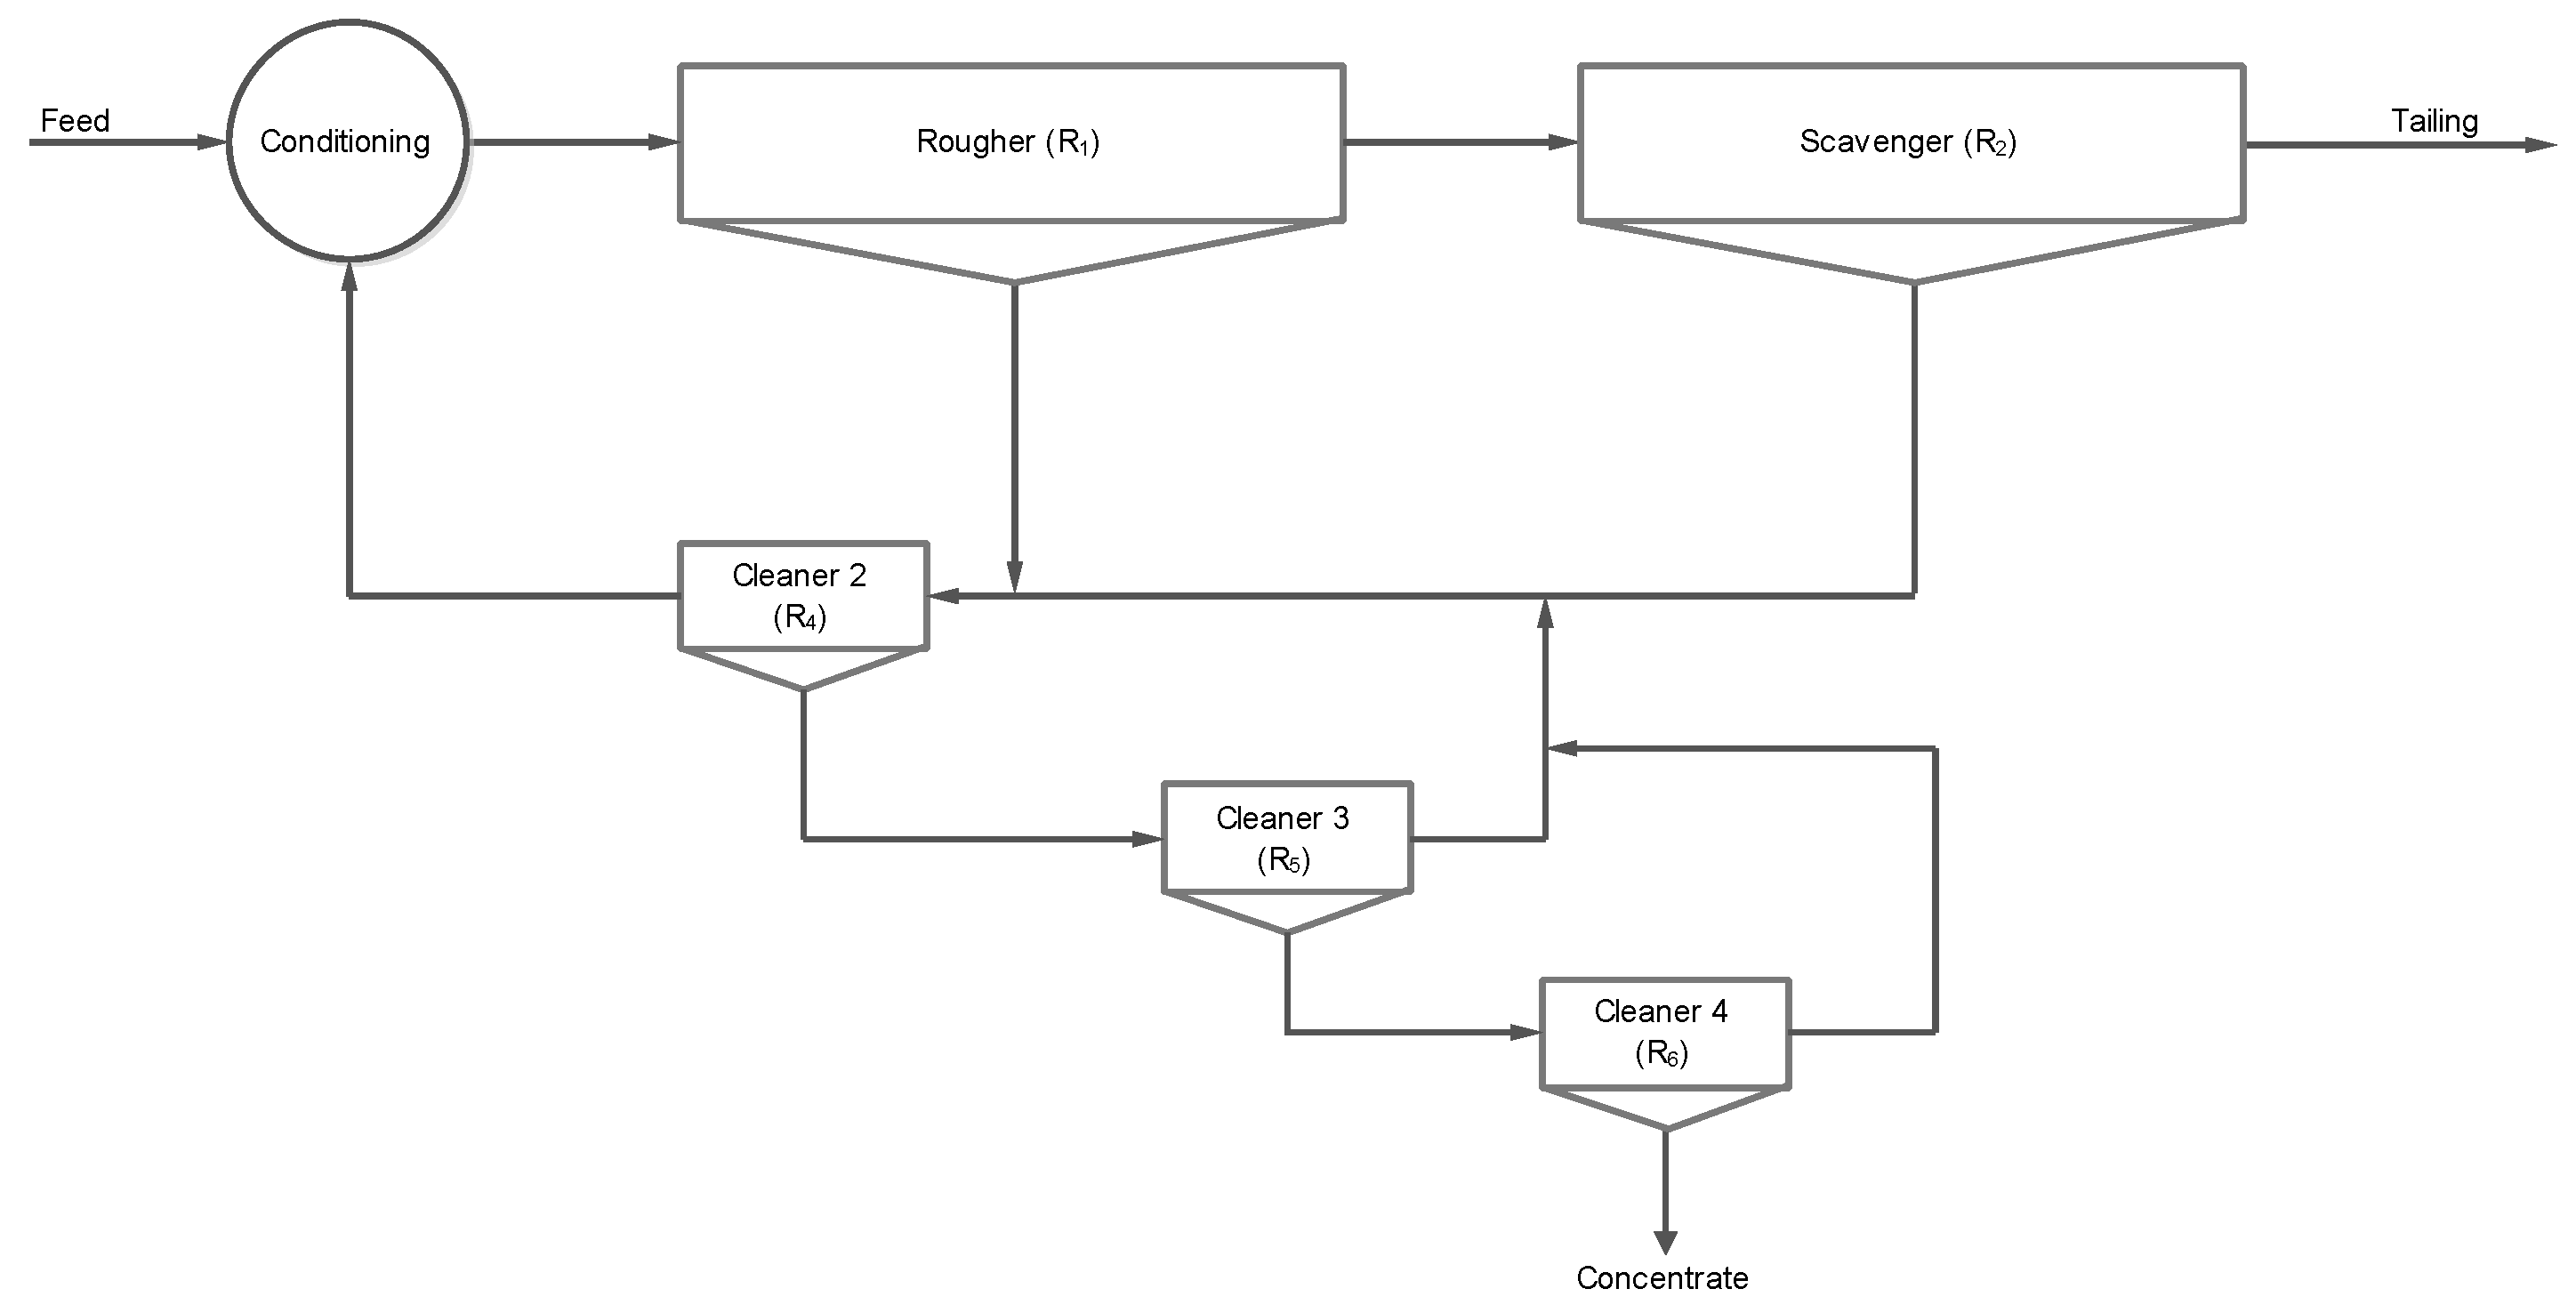
4. Industrial Example
5. Conclusions
- (1)
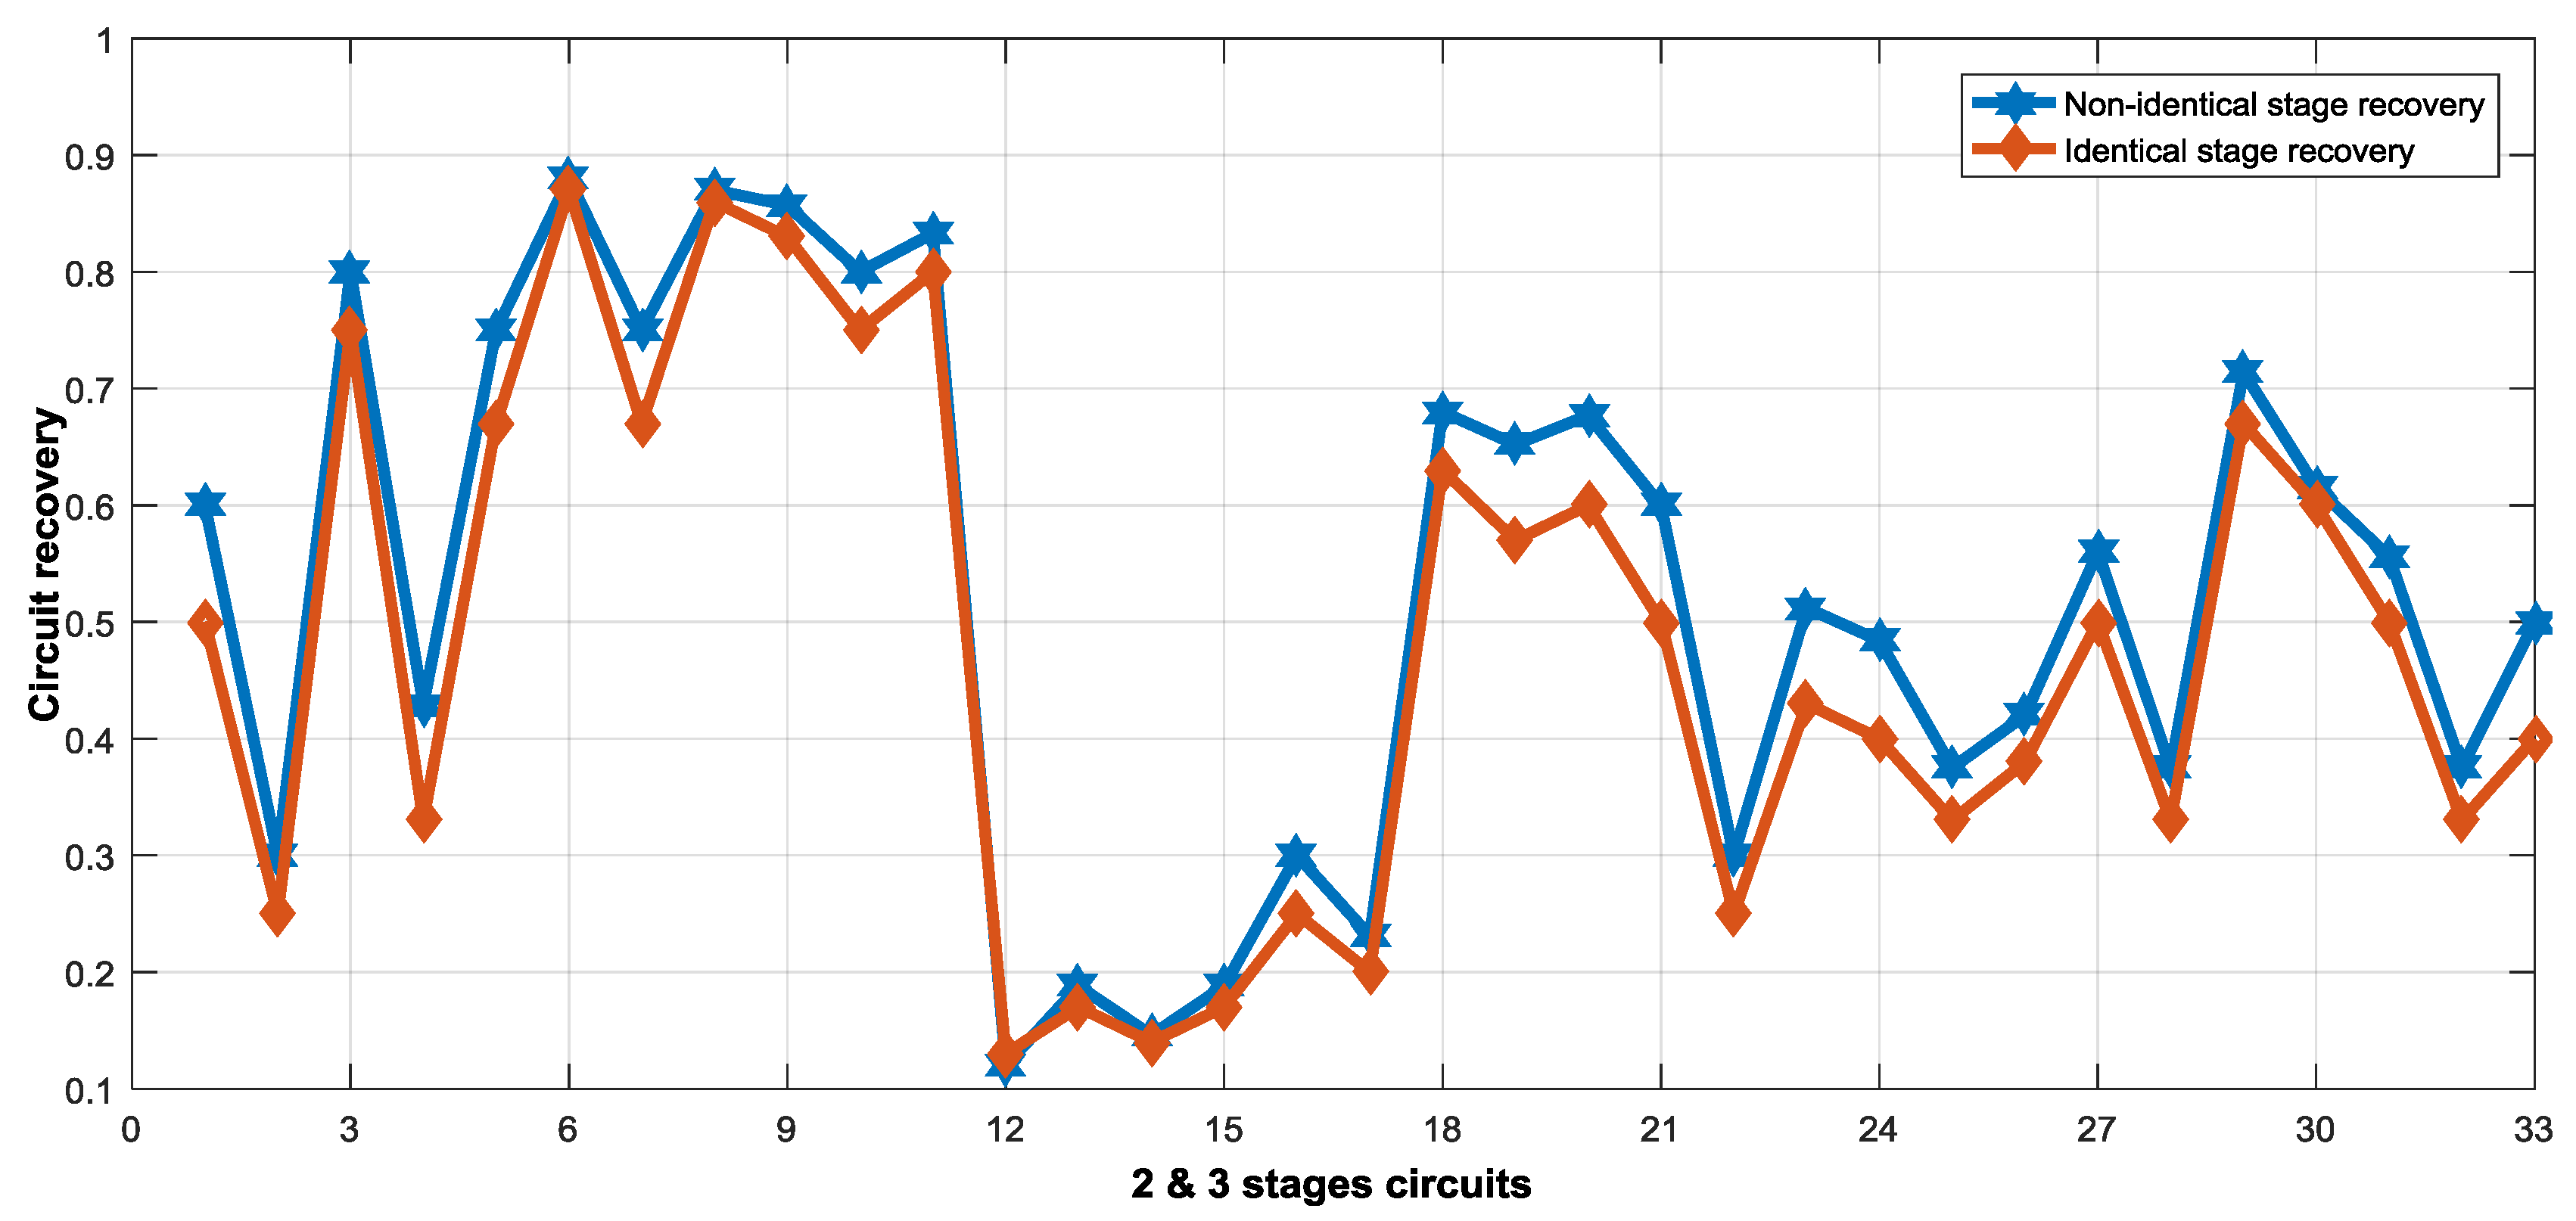
- Stage recovery in some cases is strongly influenced by the structure of the circuit.
- (2)
- In the countercurrent rougher-cleaner and rougher-scavenger circuits, the arrangement of recovery in stages always follows a particular rule.
- (3)
- The assumption of the identical recovery in the stages is acceptable for the comparison and ranking of the circuit configurations to find the circuit with maximum recovery.
- (4)
- Using many numbers of stages does not necessarily increase the circuit performance, and, in some cases, it may impose additional costs and cause the circuit inefficiencies.
- (5)
- Based on the optimal recovery allocation for flotation stages, the design and operational parameters in the flotation circuit would be determined.
Author Contributions
Funding
Acknowledgments
Conflicts of Interest
References
- Mendez, D.A.; Gálvez, E.D.; Cisternas, L.A. State of the art in the conceptual design of flotation circuits. Int. J. Miner. Process. 2009, 90, 1–15. [Google Scholar] [CrossRef]
- Sutherland, D.N. A study on the optimization of the arrangement of flotation circuits. Int. J. Miner. Process. 1981, 7, 319–346. [Google Scholar] [CrossRef]
- Pirouzan, D.; Yahyaei, M.; Banisi, S. Pareto based optimization of flotation cells configuration using an oriented genetic algorithm. Int. J. Miner. Process. 2014, 126, 107–116. [Google Scholar] [CrossRef]
- Guria, C.; Verma, M.; Mehrotra, S.P.; Gupta, S.K. Multi-objective optimal synthesis and design of froth flotation circuits for mineral processing, using the jumping gene adaptation of genetic algorithm. Ind. Eng. Chem. Res. 2005, 44, 2621–2633. [Google Scholar] [CrossRef]
- Gharai, M.; Venugopal, R. Modeling of flotation process—An overview of different approaches. Miner. Process. Extr. Metall. Rev. 2016, 37, 120–133. [Google Scholar] [CrossRef]
- Montenegro, M.R.; Gálvez, E.D.; Cisternas, L.A. The effects of stage recovery uncertainty in the performance of concentration circuits. Int. J. Miner. Process. 2015, 143, 12–17. [Google Scholar] [CrossRef]
- Amini, S.H.; Noble, A. Application of linear circuit analysis in evaluation of mineral processing circuit design under uncertainty. Miner. Eng. 2017, 102, 18–29. [Google Scholar] [CrossRef]
- Maldonado, M.; Araya, R.; Finch, J. Optimizing flotation bank performance by recovery profiling. Miner. Eng. 2011, 24, 939–943. [Google Scholar] [CrossRef]
- Jamett, N.; Cisternas, L.A.; Vielma, J.P. Solution strategies to the stochastic design of mineral flotation plants. Chem. Eng. Sci. 2015, 134, 850–860. [Google Scholar] [CrossRef]
- Montenegro, M.R.; Sepúlveda, F.D.; Gálvez, E.D.; Cisternas, L.A. Methodology for process analysis and design with multiple objectives under uncertainty: Application to flotation circuits. Int. J. Miner. Process. 2013, 118, 15–27. [Google Scholar] [CrossRef]
- Noble, A.; Luttrell, G.H. The matrix reduction algorithm for solving separation circuits. Miner. Eng. 2014, 64, 97–108. [Google Scholar] [CrossRef]
- Williams, M.C.; Meloy, T.P. On the definition and separation of fundamental process functions. Int. J. Miner. Process. 1989, 26, 65–72. [Google Scholar] [CrossRef]
- McKeon, T.J.; Luttrell, G.H. Optimization of multistage circuits for gravity concentration of heavy mineral sands. Miner. Metall. Process. 2012, 29, 1–5. [Google Scholar]
- Luttrell, G.H.; Kohmuench, J.N.; Stanley, F.L.; Trump, G.D. An evaluation of multi-stage spiral circuits. In Proceedings of the 16th International Coal Preparation Conference, Lexington, KY, USA, 27–29 April 1999; pp. 79–88. [Google Scholar]
- Luttrell, G.H.; Kohmuench, J.N.; Mankosa, M.J. Optimization of magnetic separator circuit configurations. Trans. Min. Metall. Explor. Inc. 2004, 316, 153. [Google Scholar]
- Gálvez, E.D. A shortcut procedure for the design of mineral separation circuits. Miner. Eng. 1998, 11, 113–123. [Google Scholar] [CrossRef]
- Sepúlveda, F.D.; Cisternas, L.A.; Gálvez, E.D. The use of global sensitivity analysis for improving processes: Applications to mineral processing. Comput. Chem. Eng. 2014, 66, 221–232. [Google Scholar] [CrossRef]
- Lucay, F.; Mellado, M.E.; Cisternas, L.A.; Gálvez, E.D. Sensitivity analysis of separation circuits. Int. J. Miner. Process. 2012, 110, 30–45. [Google Scholar] [CrossRef]
- Calisaya, D.A.; López-Valdivieso, A.; Marcos, H.; Gálvez, E.E.; Cisternas, L.A. A strategy for the identification of optimal flotation circuits. Miner. Eng. 2016, 96, 157–167. [Google Scholar] [CrossRef]
- Cisternas, L.A.; Jamett, N.; Gálvez, E.D. Approximate recovery values for each stage are sufficient to select the concentration circuit structures. Miner. Eng. 2015, 83, 175–184. [Google Scholar] [CrossRef]
- Williams, M.; Meloy, T. Feasible designs for separation networks: A selection technique. Int. J. Miner. Process. 1991, 32, 161–174. [Google Scholar] [CrossRef]
- Lynch, A.J.; Johnson, N.W.; Manlapig, E.V.; Thorne, C.G. Mineral and Coal Flotation Circuits-Their Simulation and Control; Developments in Mineral Processing No. 3; Elsevier Science Ltd.: New York, NY, USA, 1981. [Google Scholar]
- Savassi, O.N.; Alexander, D.J.; Franzidis, J.P.; Manlapig, E.V. An empirical model for entrainment in industrial flotation plants. Miner. Eng. 1998, 11, 243–256. [Google Scholar] [CrossRef]
- Kelsall, D.F. Application of probability in the assessment of flotation systems. Trans. Inst. Mining Metall. 1961, 70, 191–204. [Google Scholar]
- Davis, W.J.N. The development of a mathematical model of the lead flotation circuit at the Zinc Corporation Ltd. AIMM Trans. 1964, 212, 61–89. [Google Scholar]
- Meloy, T. Analysis and optimization of mineral processing and coal-cleaning circuits—Circuit analysis. Int. J. Miner. Process. 1983, 10, 61–80. [Google Scholar] [CrossRef]
- Hu, W.; Hadler, K.; Neethling, S.J.; Cilliers, J.J. Determining flotation circuit layout using genetic algorithms with pulp and froth models. Chem. Eng. Sci. 2013, 102, 32–41. [Google Scholar] [CrossRef]


| Circuit | Circuit Recovery | |||||
|---|---|---|---|---|---|---|
| Recovery in Each Stage (R1, R2, R3) | ||||||
| (0.40, 0.50, 0.60) | (0.40, 0.60, 0.50) | (0.50, 0.40, 0.60) | (0.50, 0.60, 0.40) | (0.60, 0.40, 0.50) | (0.60, 0.50, 0.40) | |
| S1 | 0.40 | 0.40 | 0.50 | 0.50 | 0.60 | 0.60 |
| S2 | 0.20 | 0.24 | 0.20 | 0.30 | 0.24 | 0.30 |
| S3 | 0.70 | 0.76 | 0.70 | 0.80 | 0.76 | 0.80 |
| S4 | 0.25 | 0.29 | 0.29 | 0.38 | 0.38 | 0.43 |
| S5 | 0.63 | 0.71 | 0.57 | 0.75 | 0.63 | 0.71 |
| S6 | 0.88 | 0.88 | 0.88 | 0.88 | 0.88 | 0.88 |
| S7 | 0.75 | 0.68 | 0.74 | 0.58 | 0.66 | 0.57 |
| S8 | 0.87 | 0.87 | 0.86 | 0.86 | 0.85 | 0.85 |
| S9 | 0.85 | 0.83 | 0.86 | 0.81 | 0.85 | 0.83 |
| S10 | 0.80 | 0.78 | 0.78 | 0.73 | 0.73 | 0.70 |
| S11 | 0.83 | 0.81 | 0.83 | 0.77 | 0.81 | 0.77 |
| S12 | 0.12 | 0.12 | 0.12 | 0.12 | 0.12 | 0.12 |
| S13 | 0.15 | 0.17 | 0.14 | 0.19 | 0.15 | 0.17 |
| S14 | 0.13 | 0.14 | 0.13 | 0.15 | 0.14 | 0.15 |
| S15 | 0.15 | 0.14 | 0.17 | 0.15 | 0.19 | 0.17 |
| S16 | 0.20 | 0.22 | 0.22 | 0.27 | 0.27 | 0.30 |
| S17 | 0.16 | 0.17 | 0.19 | 0.19 | 0.23 | 0.23 |
| S18 | 0.620 | 0.68 | 0.58 | 0.68 | 0.58 | 0.62 |
| S19 | 0.59 | 0.65 | 0.49 | 0.65 | 0.49 | 0.57 |
| S20 | 0.58 | 0.67 | 0.52 | 0.68 | 0.54 | 0.62 |
| S21 | 0.64 | 0.70 | 0.63 | 0.71 | 0.66 | 0.69 |
| S22 | 0.20 | 0.24 | 0.20 | 0.30 | 0.24 | 0.30 |
| S23 | 0.35 | 0.35 | 0.43 | 0.43 | 0.51 | 0.51 |
| S24 | 0.32 | 0.33 | 0.39 | 0.42 | 0.46 | 0.48 |
| S25 | 0.29 | 0.30 | 0.31 | 0.36 | 0.34 | 0.38 |
| S26 | 0.42 | 0.38 | 0.42 | 0.32 | 0.38 | 0.32 |
| S27 | 0.50 | 0.46 | 0.54 | 0.44 | 0.56 | 0.50 |
| S28 | 0.36 | 0.38 | 0.30 | 0.34 | 0.29 | 0.31 |
| S29 | 0.63 | 0.66 | 0.64 | 0.69 | 0.70 | 0.71 |
| S30 | 0.58 | 0.61 | 0.58 | 0.62 | 0.61 | 0.62 |
| S31 | 0.50 | 0.57 | 0.44 | 0.55 | 0.46 | 0.50 |
| S32 | 0.38 | 0.36 | 0.34 | 0.30 | 0.31 | 0.29 |
| S33 | 0.42 | 0.42 | 0.39 | 0.48 | 0.50 | 0.50 |
| Stage Recovery | R1 | R2 | R3 | R4 | R5 | Overall Recovery |
|---|---|---|---|---|---|---|
| Rougher-cleaner | 0.70 | 0.60 | 0.50 | 0.40 | 0.30 | 0.29 |
| Rougher-scavenger | 0.30 | 0.40 | 0.50 | 0.60 | 0.70 | 0.93 |
| Reagent | Addition Point | Dosage (gr/ton) |
|---|---|---|
| Sodium sulfide | Conditioning | 760 |
| Rougher | 300 | |
| Scavenger | 200 | |
| Cleaner 1 | 40 | |
| potassium amyl xanthate | Pump | 100 |
| Rougher | 80 | |
| Scavenger | 40 | |
| sodium silicate | Ball mill | 500 |
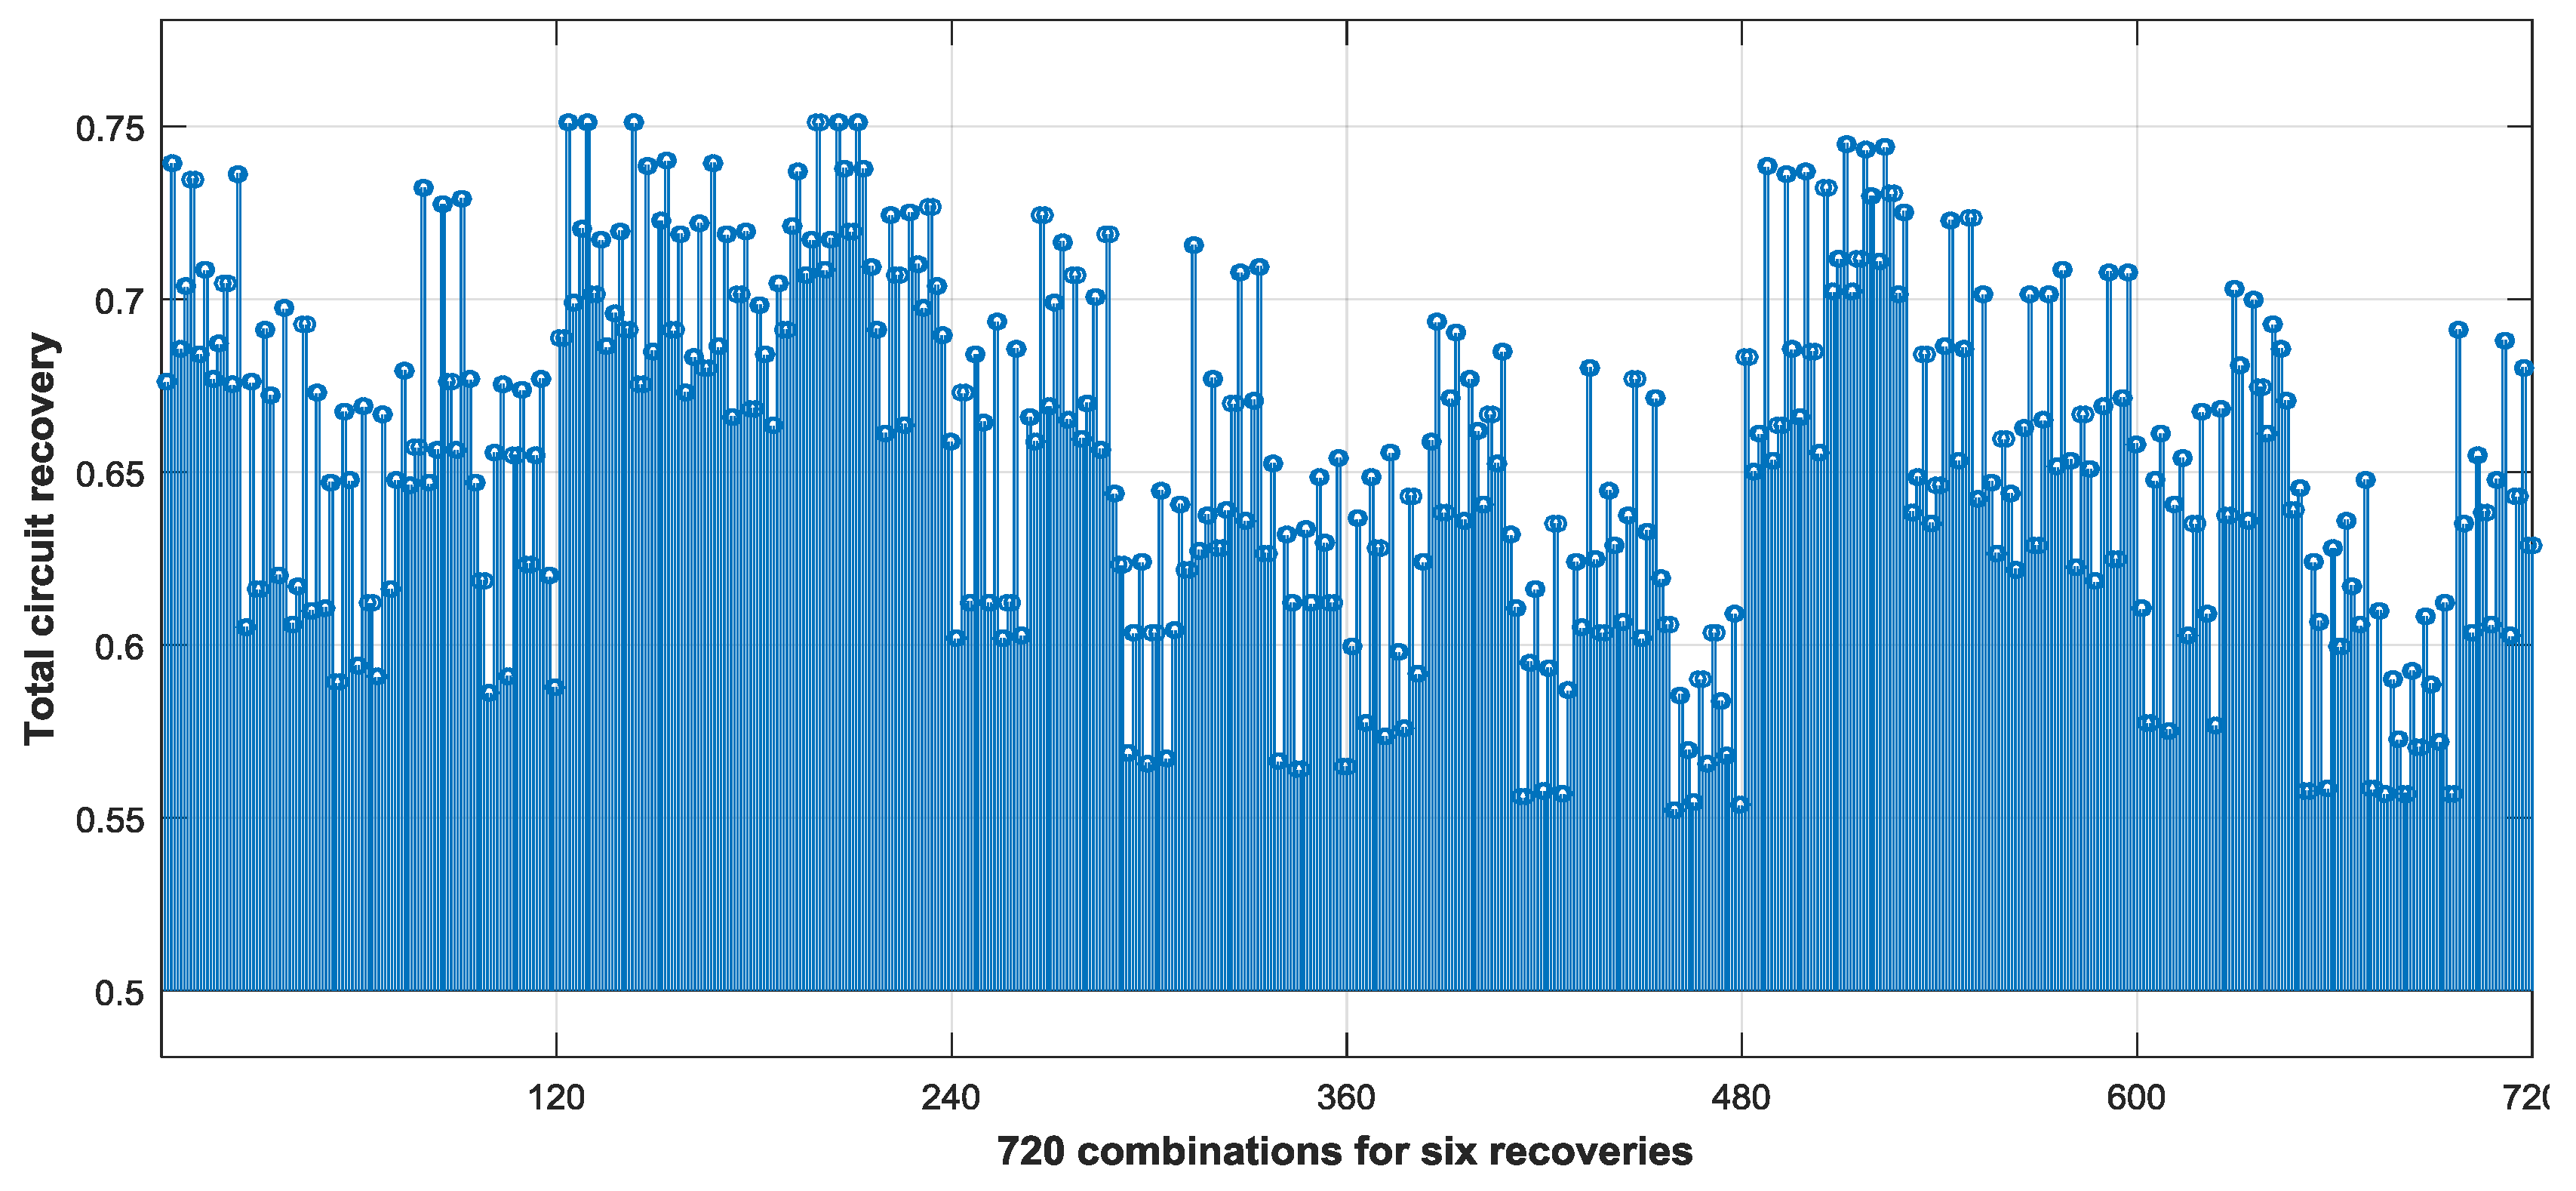
| Rougher | Scavenger | Scavenger-Cleaner | Cleaner 1 | Cleaner 2 | Cleaner 3 | Circuit Recovery |
|---|---|---|---|---|---|---|
| 0.75 | 0.70 | 0.61 | 0.65 | 0.52 | 0.55 | 0.75 |
| 0.75 | 0.70 | 0.61 | 0.65 | 0.55 | 0.52 | 0.75 |
| 0.75 | 0.70 | 0.55 | 0.65 | 0.61 | 0.52 | 0.75 |
| 0.75 | 0.70 | 0.55 | 0.65 | 0.52 | 0.61 | 0.75 |
| 0.75 | 0.70 | 0.52 | 0.65 | 0.61 | 0.55 | 0.75 |
| 0.75 | 0.70 | 0.52 | 0.65 | 0.55 | 0.61 | 0.75 |
| 0.75 | 0.65 | 0.61 | 0.70 | 0.52 | 0.55 | 0.75 |
| 0.75 | 0.65 | 0.61 | 0.70 | 0.55 | 0.52 | 0.75 |
| 0.75 | 0.65 | 0.55 | 0.70 | 0.61 | 0.52 | 0.75 |
| 0.75 | 0.65 | 0.55 | 0.70 | 0.52 | 0.61 | 0.75 |
| 0.75 | 0.65 | 0.52 | 0.70 | 0.61 | 0.55 | 0.75 |
| 0.75 | 0.65 | 0.52 | 0.70 | 0.55 | 0.61 | 0.75 |
© 2018 by the authors. Licensee MDPI, Basel, Switzerland. This article is an open access article distributed under the terms and conditions of the Creative Commons Attribution (CC BY) license (http://creativecommons.org/licenses/by/4.0/).
Share and Cite
Radmehr, V.; Shafaei, S.Z.; Noaparast, M.; Abdollahi, H. Optimizing Flotation Circuit Recovery by Effective Stage Arrangements: A Case Study. Minerals 2018, 8, 417. https://doi.org/10.3390/min8100417
Radmehr V, Shafaei SZ, Noaparast M, Abdollahi H. Optimizing Flotation Circuit Recovery by Effective Stage Arrangements: A Case Study. Minerals. 2018; 8(10):417. https://doi.org/10.3390/min8100417
Chicago/Turabian StyleRadmehr, Vahid, Sied Ziaedin Shafaei, Mohammad Noaparast, and Hadi Abdollahi. 2018. "Optimizing Flotation Circuit Recovery by Effective Stage Arrangements: A Case Study" Minerals 8, no. 10: 417. https://doi.org/10.3390/min8100417
APA StyleRadmehr, V., Shafaei, S. Z., Noaparast, M., & Abdollahi, H. (2018). Optimizing Flotation Circuit Recovery by Effective Stage Arrangements: A Case Study. Minerals, 8(10), 417. https://doi.org/10.3390/min8100417