1. Introduction
In mineral processing, all ores will have an optimum particle size which maximizes the economic benefits from the net smelter return while minimizing the cost of crushing and grinding. If the particle size is too coarse there will be inadequate liberation, limiting recovery (and thus revenue) in the separation stage. If the grind is too fine, the grinding costs will exceed any increment in recovery (and may even reduce recovery depending on the separation process). A standard crushing and grinding circuit is shown in
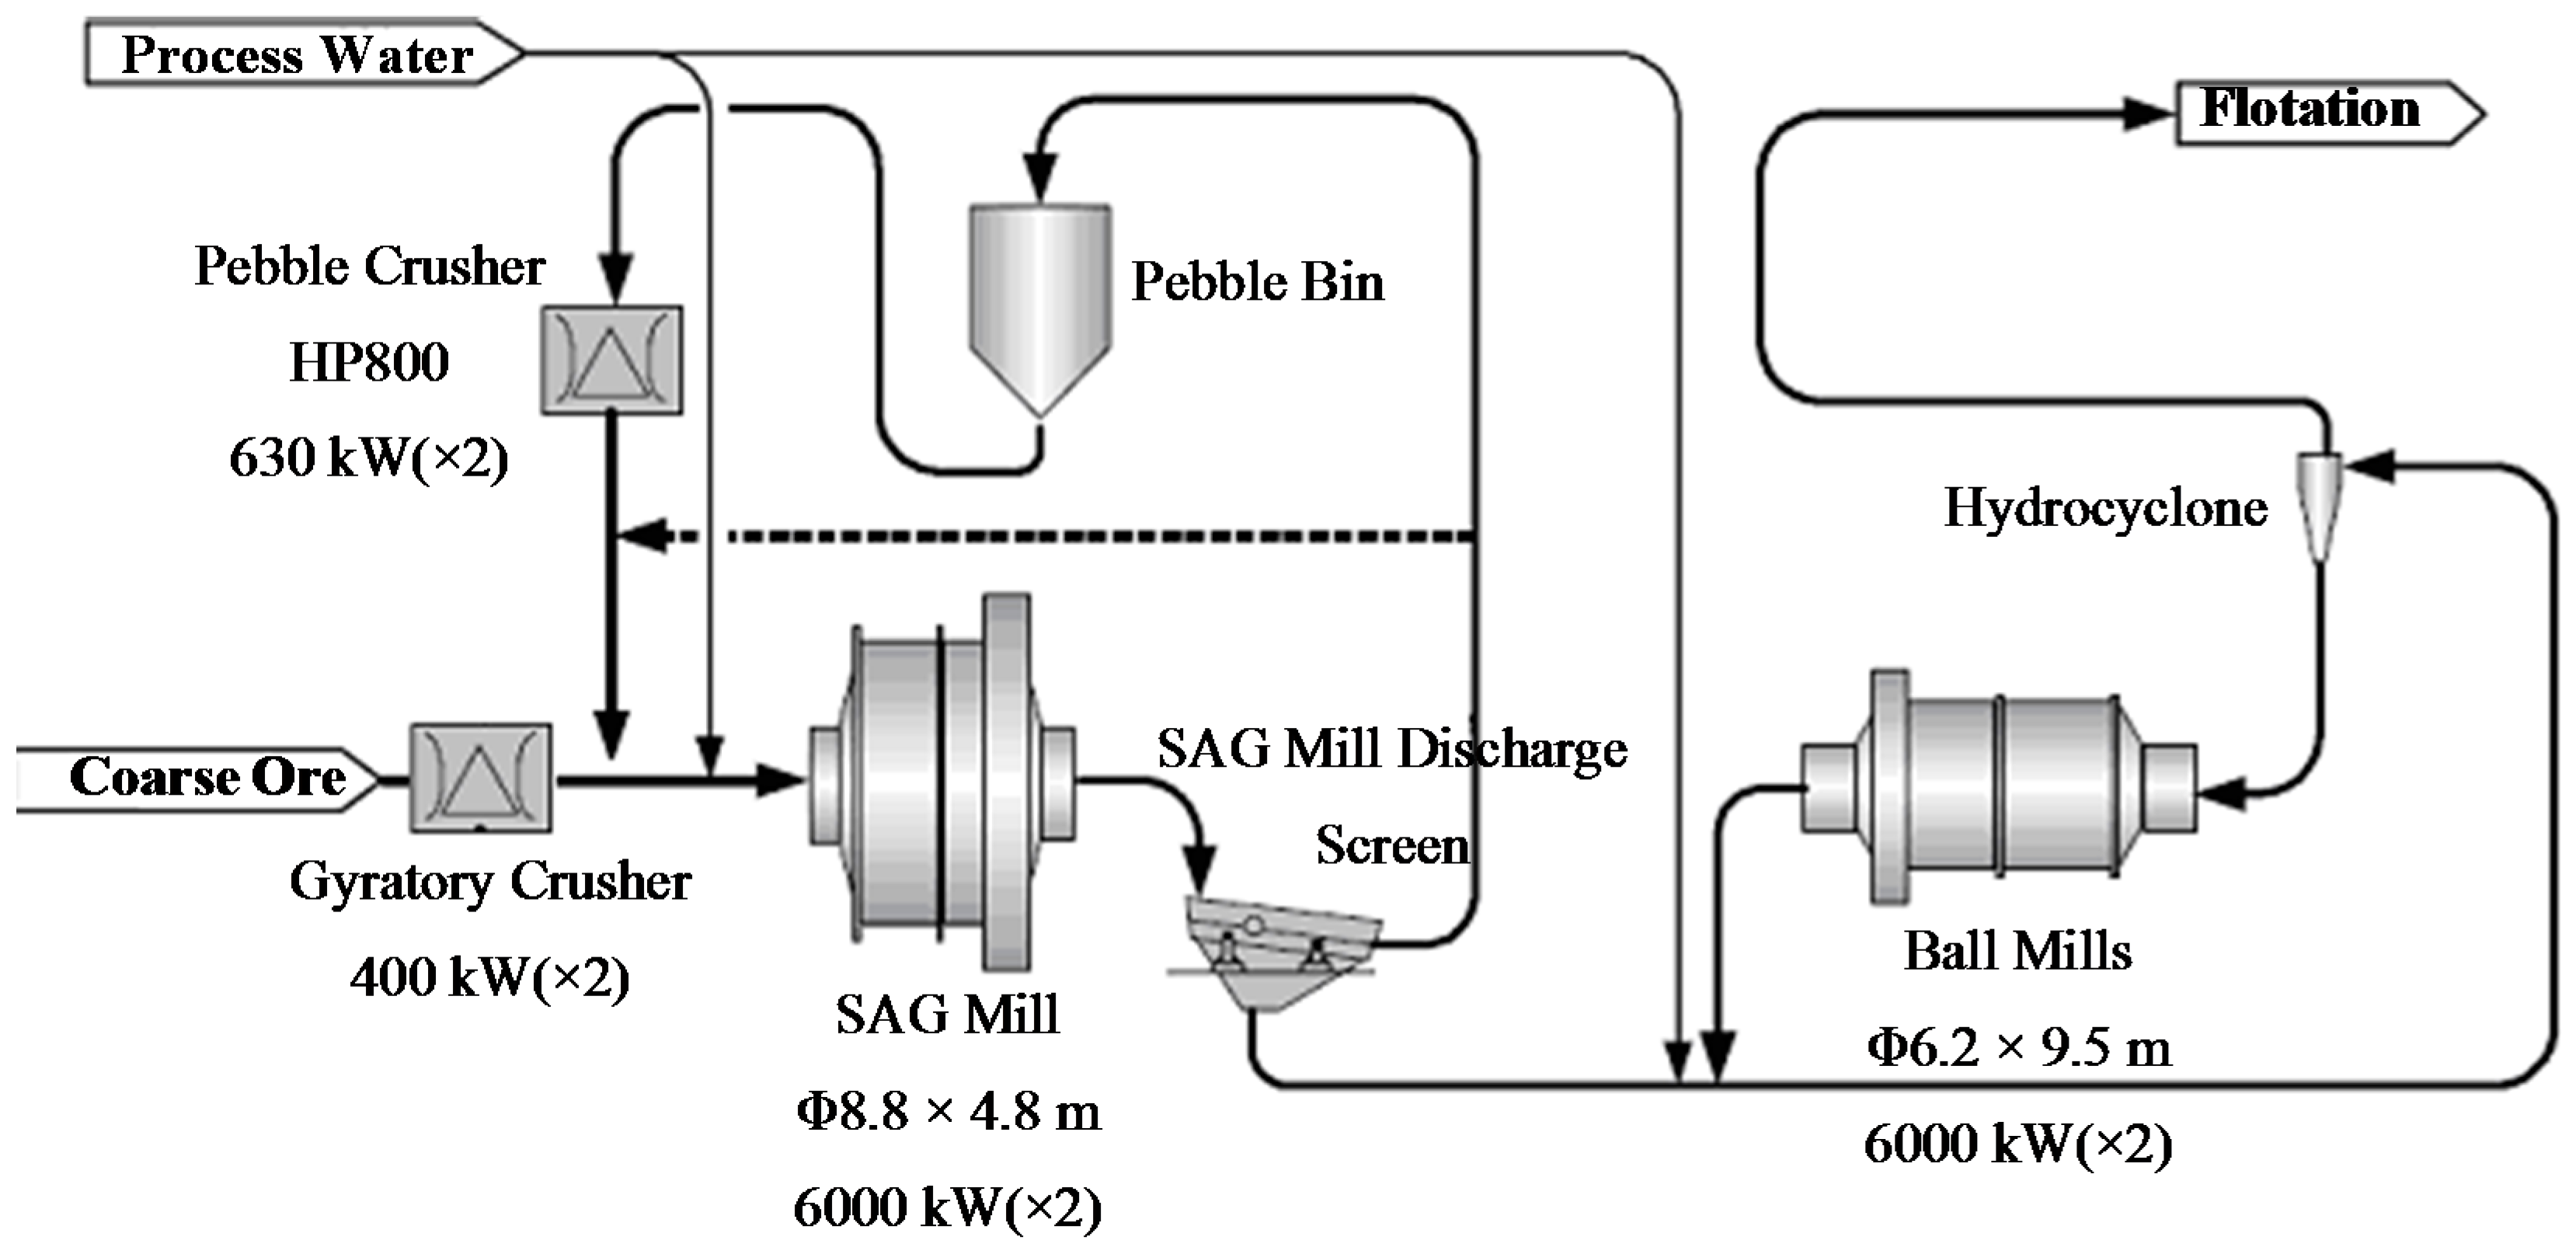
Figure 1. It is commonly referred to as a SABC circuit, for Semi-Autogenous Ball mill Crusher (SABC). This circuit shows a semi-autogenous grinding (SAG)/ball mill circuit where both grinding mills are in closed circuit, with the SAG mill closed with a crusher to control the amount of ‘critical size’ material in the circuit. ‘Critical size’ material, also referred to as pebbles, represents material that does not self-break as readily as other sizes of fractions and therefore would build up in the SAG mill circuit if no crusher was present. The ball mill, the final grind stage, is closed with a hydrocyclone classifier that removes undersized material and sends it to the separation stage.
At the beginning of 1980s, the De Xing copper mine was the first to employ a SABC circuit in China. However, equipment failure during operation was frequent due to the lack of technical specialists in China to assist in circuit design and performance. This led to the shutdown of the SABC circuit in 1987, and subsequently, the application and study of SABC circuits in China was ignored for the following 20 years [
1].
In 2009, a pilot-scale test of a SABC circuit was successfully carried out at the Wushan porphyry copper mine. This meant Wushan was the first large-scale non-ferrous mine that successfully made use of a SABC circuit in China. The SABC circuit has been shown to have many advantages including: having a simpler flow sheet; requiring a smaller footprint; allowing easier expansion; and being more environmental friendly and energy efficient. Numerous Chinese mining companies have since followed this trend and installed a SABC circuit [
2].
In 1990s, during the design of the Wushan SABC circuit comminution stage, the only information available was the Bond work index, which was calculated with insufficient ore comminution characteristics testing and semi-industrial testing [
3,
4,
5]. This was due to the lack of research in this field in China and the lack of knowledge in SABC circuit design. The sizing of the processing equipment inside of the SABC circuit is typically based on calculations from similar circuits in both domestic and overseas plants. This can lead to problems in equipment selection and operation, which, if left unoptimized, leaves significant space for improvement in both energy consumption and production capacity. Hence, optimization of the energy consumption in the Wushan SABC milling circuit should improve its energy efficiency and production capacity.
1.1. The Wushan Mine’s SABC Circuit Flowsheet and Operating Problems
The mineral processing plant of the Wushan copper mine has a production capacity of 30,000 t/d, which is divided into two parallel streams that each treat 15,000 t/d. The plant has the largest grinding capacity in China and has been in production for the last three years. The processing plant operates with a standard SABC comminution circuit (
Figure 1), and was the first to use the largest domestic Φ8.8 × 4.8 m SAG mill (‘diameter’ represents nominal diameter, and ‘length’ of the mill represents the effective grinding length inside the end liners and discharge grates), Φ6.2 × 9.5 m overflow ball mill and closed stockpile (maximum storage capacity at 120,000 t, effective storage capacity at 39,000 t).
After three years of operation, continued analysis of the circuit products showed there were considerable performance issues present. Firstly, there was a serious flaw in the power configuration of the SAG mill and ball mill (both rated at 6000 kW with a single pinion drive). The capacity of the SAG mill was not fully utilized, as the actual operating power draw was only 3358 kW. This meant it was only operating at 56% of its maximum power, providing large room for improvement. The load on the ball mill was on the high side, with an actual operating power draw of 5300 kW, meaning it was operating at 90% of its maximum power. The combined power draw of the SAG mill and ball mill was 8658 kW, which caused partial over-grinding. From experience in processing plants outside of China, the power rating of the ball mill should be higher than that of the SAG mill [
5].
The pebble crusher had an over-powered configuration. The installed power draw of 630 kW (actual power draw of 213.5 kW) is over-sized and therefore had a low operation efficiency. The crusher remains operational intermittently, which means it is not possible to continuously re-circulate pebbles back to the SAG mill. This causes a higher variation in the feed rate and particle size distribution in the feed to the SAG mill, which results in a greater variation in the SAG mill power draw in the transition period when the pebble crusher is in operation or not.
Overall, the major flaws are caused by the lack of power in the circuit design and this is therefore the main issue to be solved. Improvement to the efficiency of the SABC circuit can be achieved by adjusting and optimizing equipment and process parameters related to the SABC comminution circuit to maintain a more even distribution of equipment capacity.
1.2. Requirement for Circuit Simulation
Over the past decade, methodologies for optimizing grinding and flotation plants using plant data together with semi-empirical sub-process models have been developed by research groups at the Julius Krutschnitt Minerals Research Centre (JKMRC) (Brisbane, Australia), University of Cape Town (Cape Town, South Africa), and McGill University (Montreal, QC, Canada) [
6,
7,
8,
9,
10,
11,
12,
13]. The culmination of the work done by JKMRC was the JKSimMet simulation model developed by JKTech (the technology transfer company of JKMRC). This program, based upon data collected from numerous mills operating at a range of conditions, contains sub-models for a range of processing equipment including grinding mills, crushers, screens and hydrocyclones. It allows for the user to fully simulate the behavior of a particular comminution circuit, to find improvements in circuit design and operating conditions. This process has been carried out at a number of industrial sites that utilize a SABC circuit [
1,
14,
15].
1.3. Paper Objectives
The primary aim of this work was to perform a diagnostic evaluation of the SABC comminution circuit performance using the JKSimMet simulation model. This included the bench-marking and optimization of the SABC comminution circuit, focusing on the primary (SAG mill) and secondary (ball mill) grinding mills, and estimating the outcomes of changes to circuit operating parameters (e.g., feed rate, mill load, ball charge, etc.).
2. Problem Validation and Analysis
To fully understand the extent of the flaws within the Wushan Phase I SABC comminution circuit design, the process must be assessed by developing a representative computational model of the SAG mill and ball mill in the SABC circuit. After validating the model with circuit survey data and measured parameters of the ore, the model will allow for optimization of the comminution process. The surveys were mass balanced and resultant values formed the basis of the JKSimMet model development. The ore characterization data (for instance, A and b from
Table 1 are the ore impact breakage parameters determined by the drop weight test) and the measured equipment data were also used in the model-fitting process (
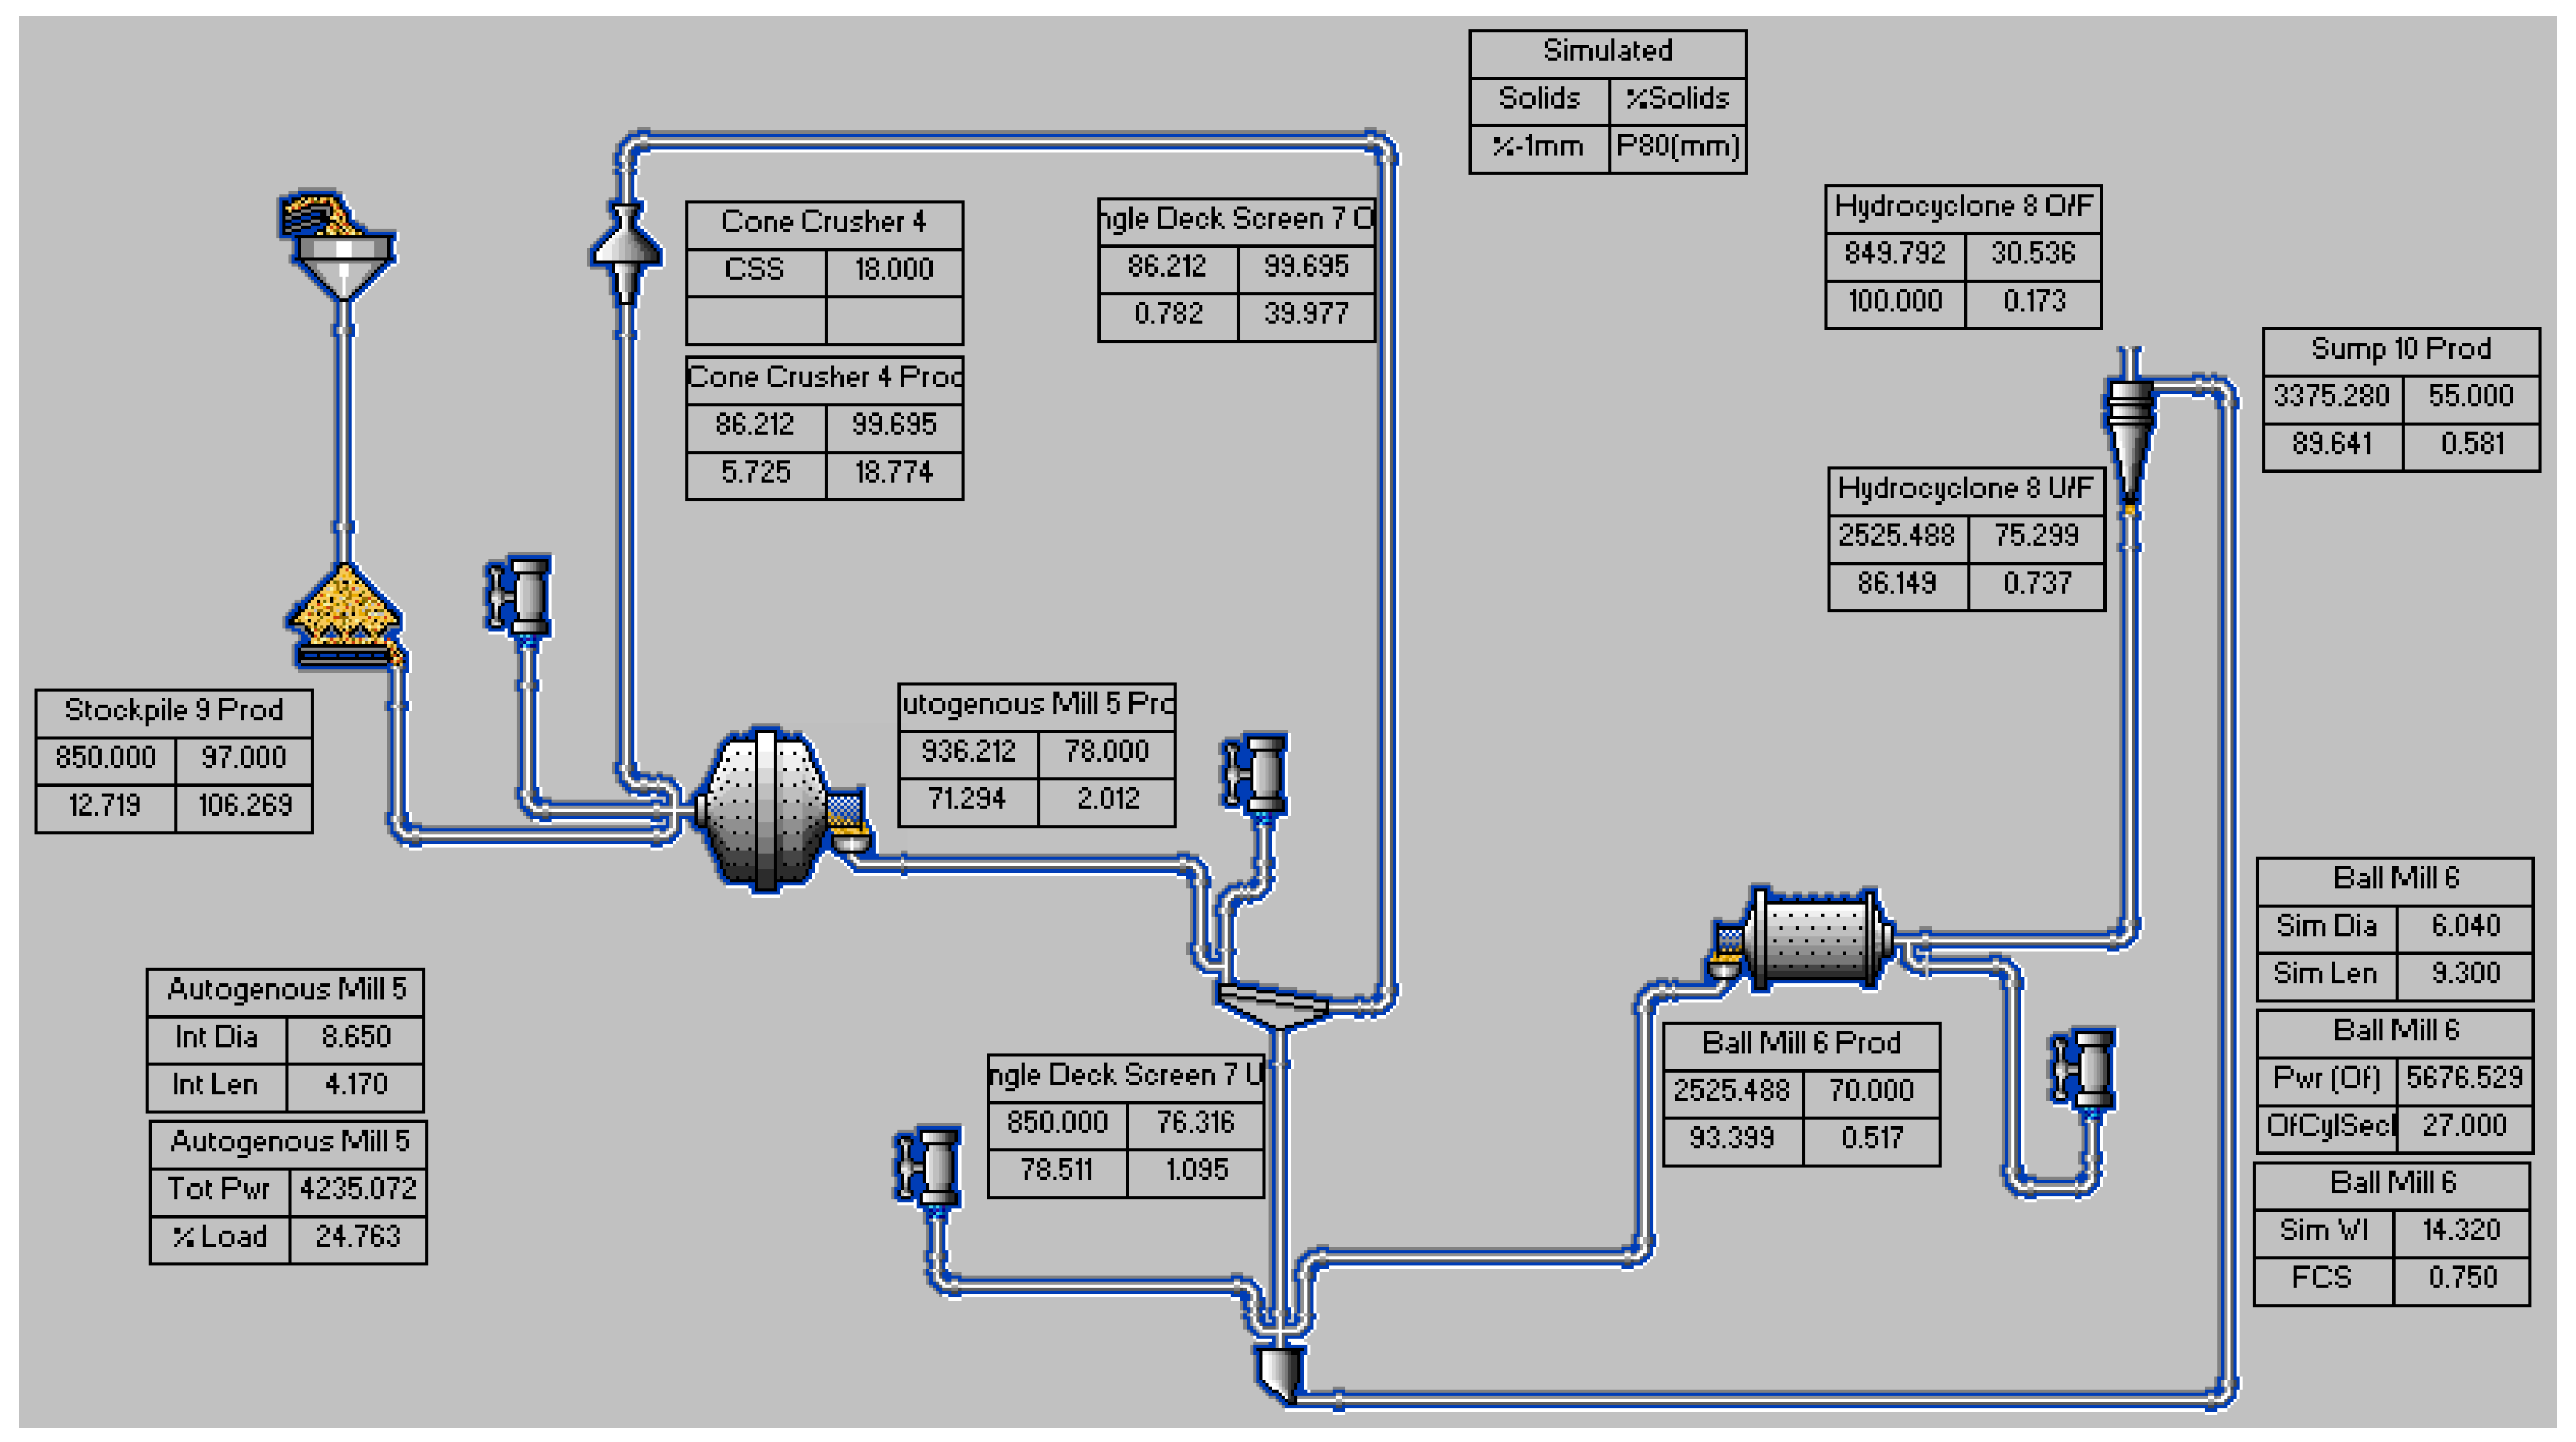
Table 1). The fitted parameters included grinding rates in the SAG and ball mills and operating parameters from the cyclones, screens and pebble crusher. The model fit parameters were determined using the non-linear fitting module in JKSimMet. The calibrated JKSimMet model was then used as the base for the simulations. An example of the simulation results is shown in
Figure 2.
Table 2 displays a comparison between the existing SABC comminution equipment size and the optimal sizes determined by the model.
According to
Table 2, differences between the actual equipment specifications of the comminution process and equipment specification from the JKSimMet simulation were aligned with previous thinking. The installed power draw in the SAG mill is higher than the model suggests is required, and for the ball mill the installed power is slightly lower. Taking into account the combined installed power draw of the SAG mill and ball mill, the difference in installed power draw between the two circuits was 1000 kW with the existing circuit of Wushan having a slightly higher power (by approximately 9%).
This suggests that the SAG mill is oversized for the original circuit design, and therefore is overgrinding. This means it does not produce enough pebble flow to ensure that the pebble crusher is consistently loaded. Under these circumstances, the feed ore is essentially fully ground within the SAG mill. This causes a lower production rate of pebbles (pebble production is 66 t/h), which in turn means the pebble crusher is oversized. This means that in operation, the pebble crusher remains in an intermittent operating state. The size of the ball mill is slightly undersized, which could explain why the circuit is unable to reach the designed product size (115 µm). Furthermore, the operating capacity of the ball mill has reached 90% capacity, running at near full load.
The model produced a coarser P80 (170 µm) with a smaller SAG mill, less power draw (compared to that of the actual circuit) and a coarser transfer size to the ball mill. These results demonstrate that the Wushan comminution circuit has unreasonable design specifications and operating conditions.
3. The Energy Distribution of the SABC Comminution Process
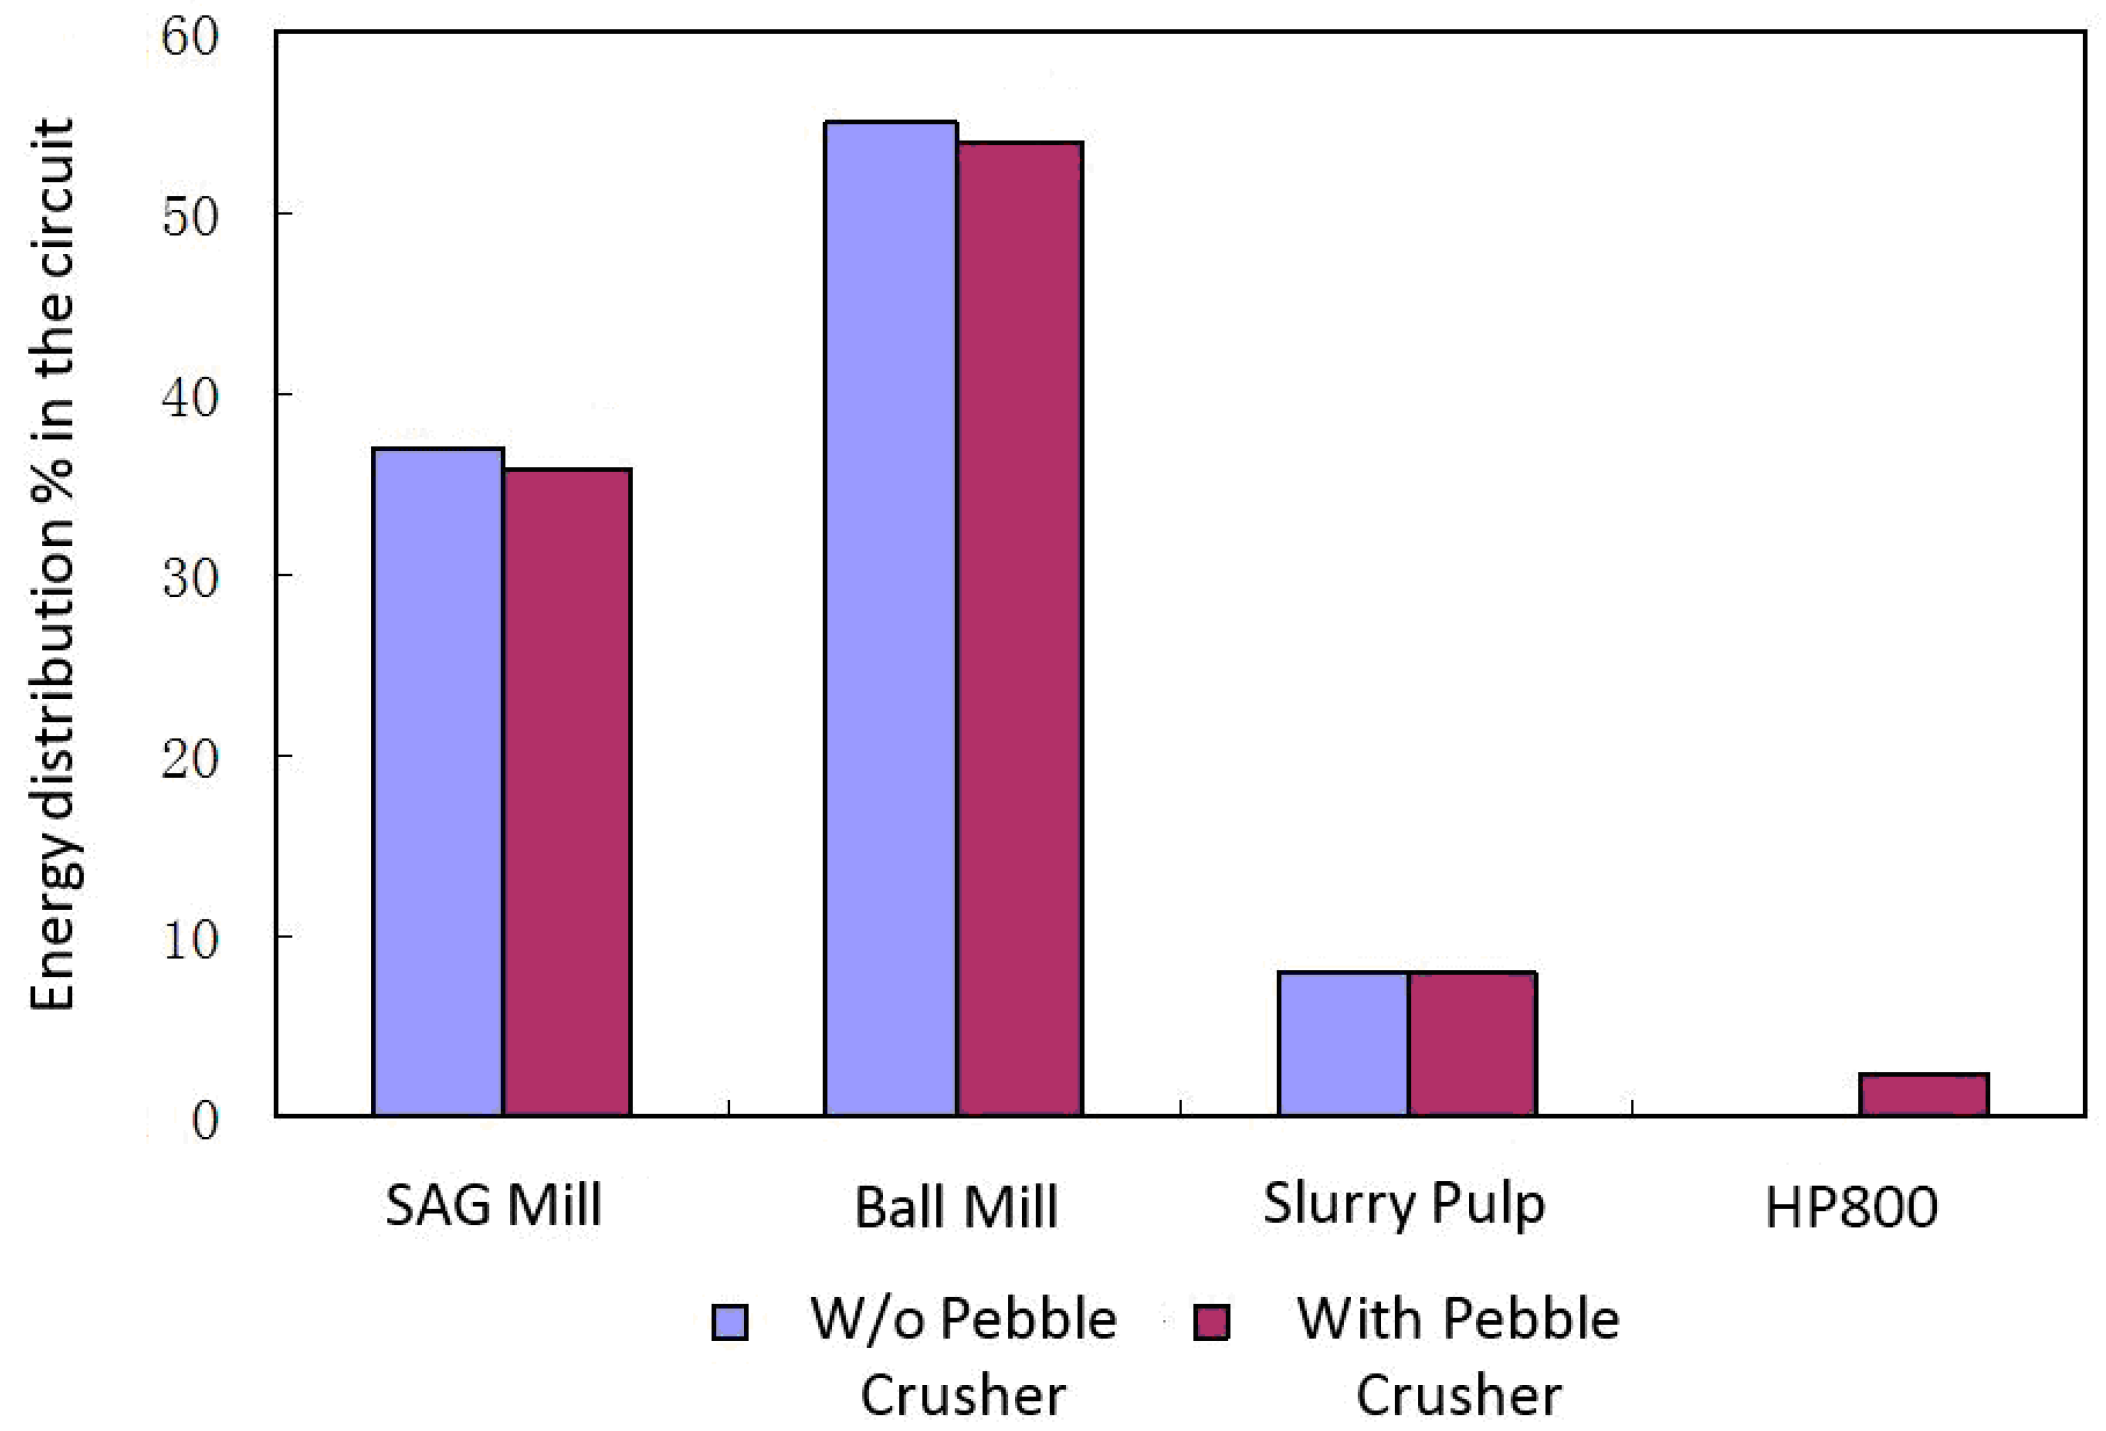
To determine the energy distribution of the SABC comminution circuit, operational data from January 2011 to August 2011 was used. This time period was chosen because the pebble crusher was operating intermittently and therefore the comminution circuit could be analyzed with and without pebble crushing. A statistical analysis was performed on each piece of equipment in the circuit to determine the ratio of energy distribution for each case. The energy distribution for each component of the comminution circuit with and without pebble crushing is shown in
Figure 3.
Table 3 shows a comparison of the actual operating power consumption of the SAG and ball mill to the reworked and originally designed SABC circuit model, with the pebble crusher in operation. From
Table 3, it can be seen that the reworked model, obtained from the JKSimMet simulation, and the actual operating circuit have a similar SAG-to-ball mill power draw ratio; however, significant discrepancies were observed with the original circuit design. This suggests that the design of the SABC circuit is not appropriate as the SAG mill appears to be oversized.
4. Simulation of Comminution Circuit Based on the Maximum Capacity
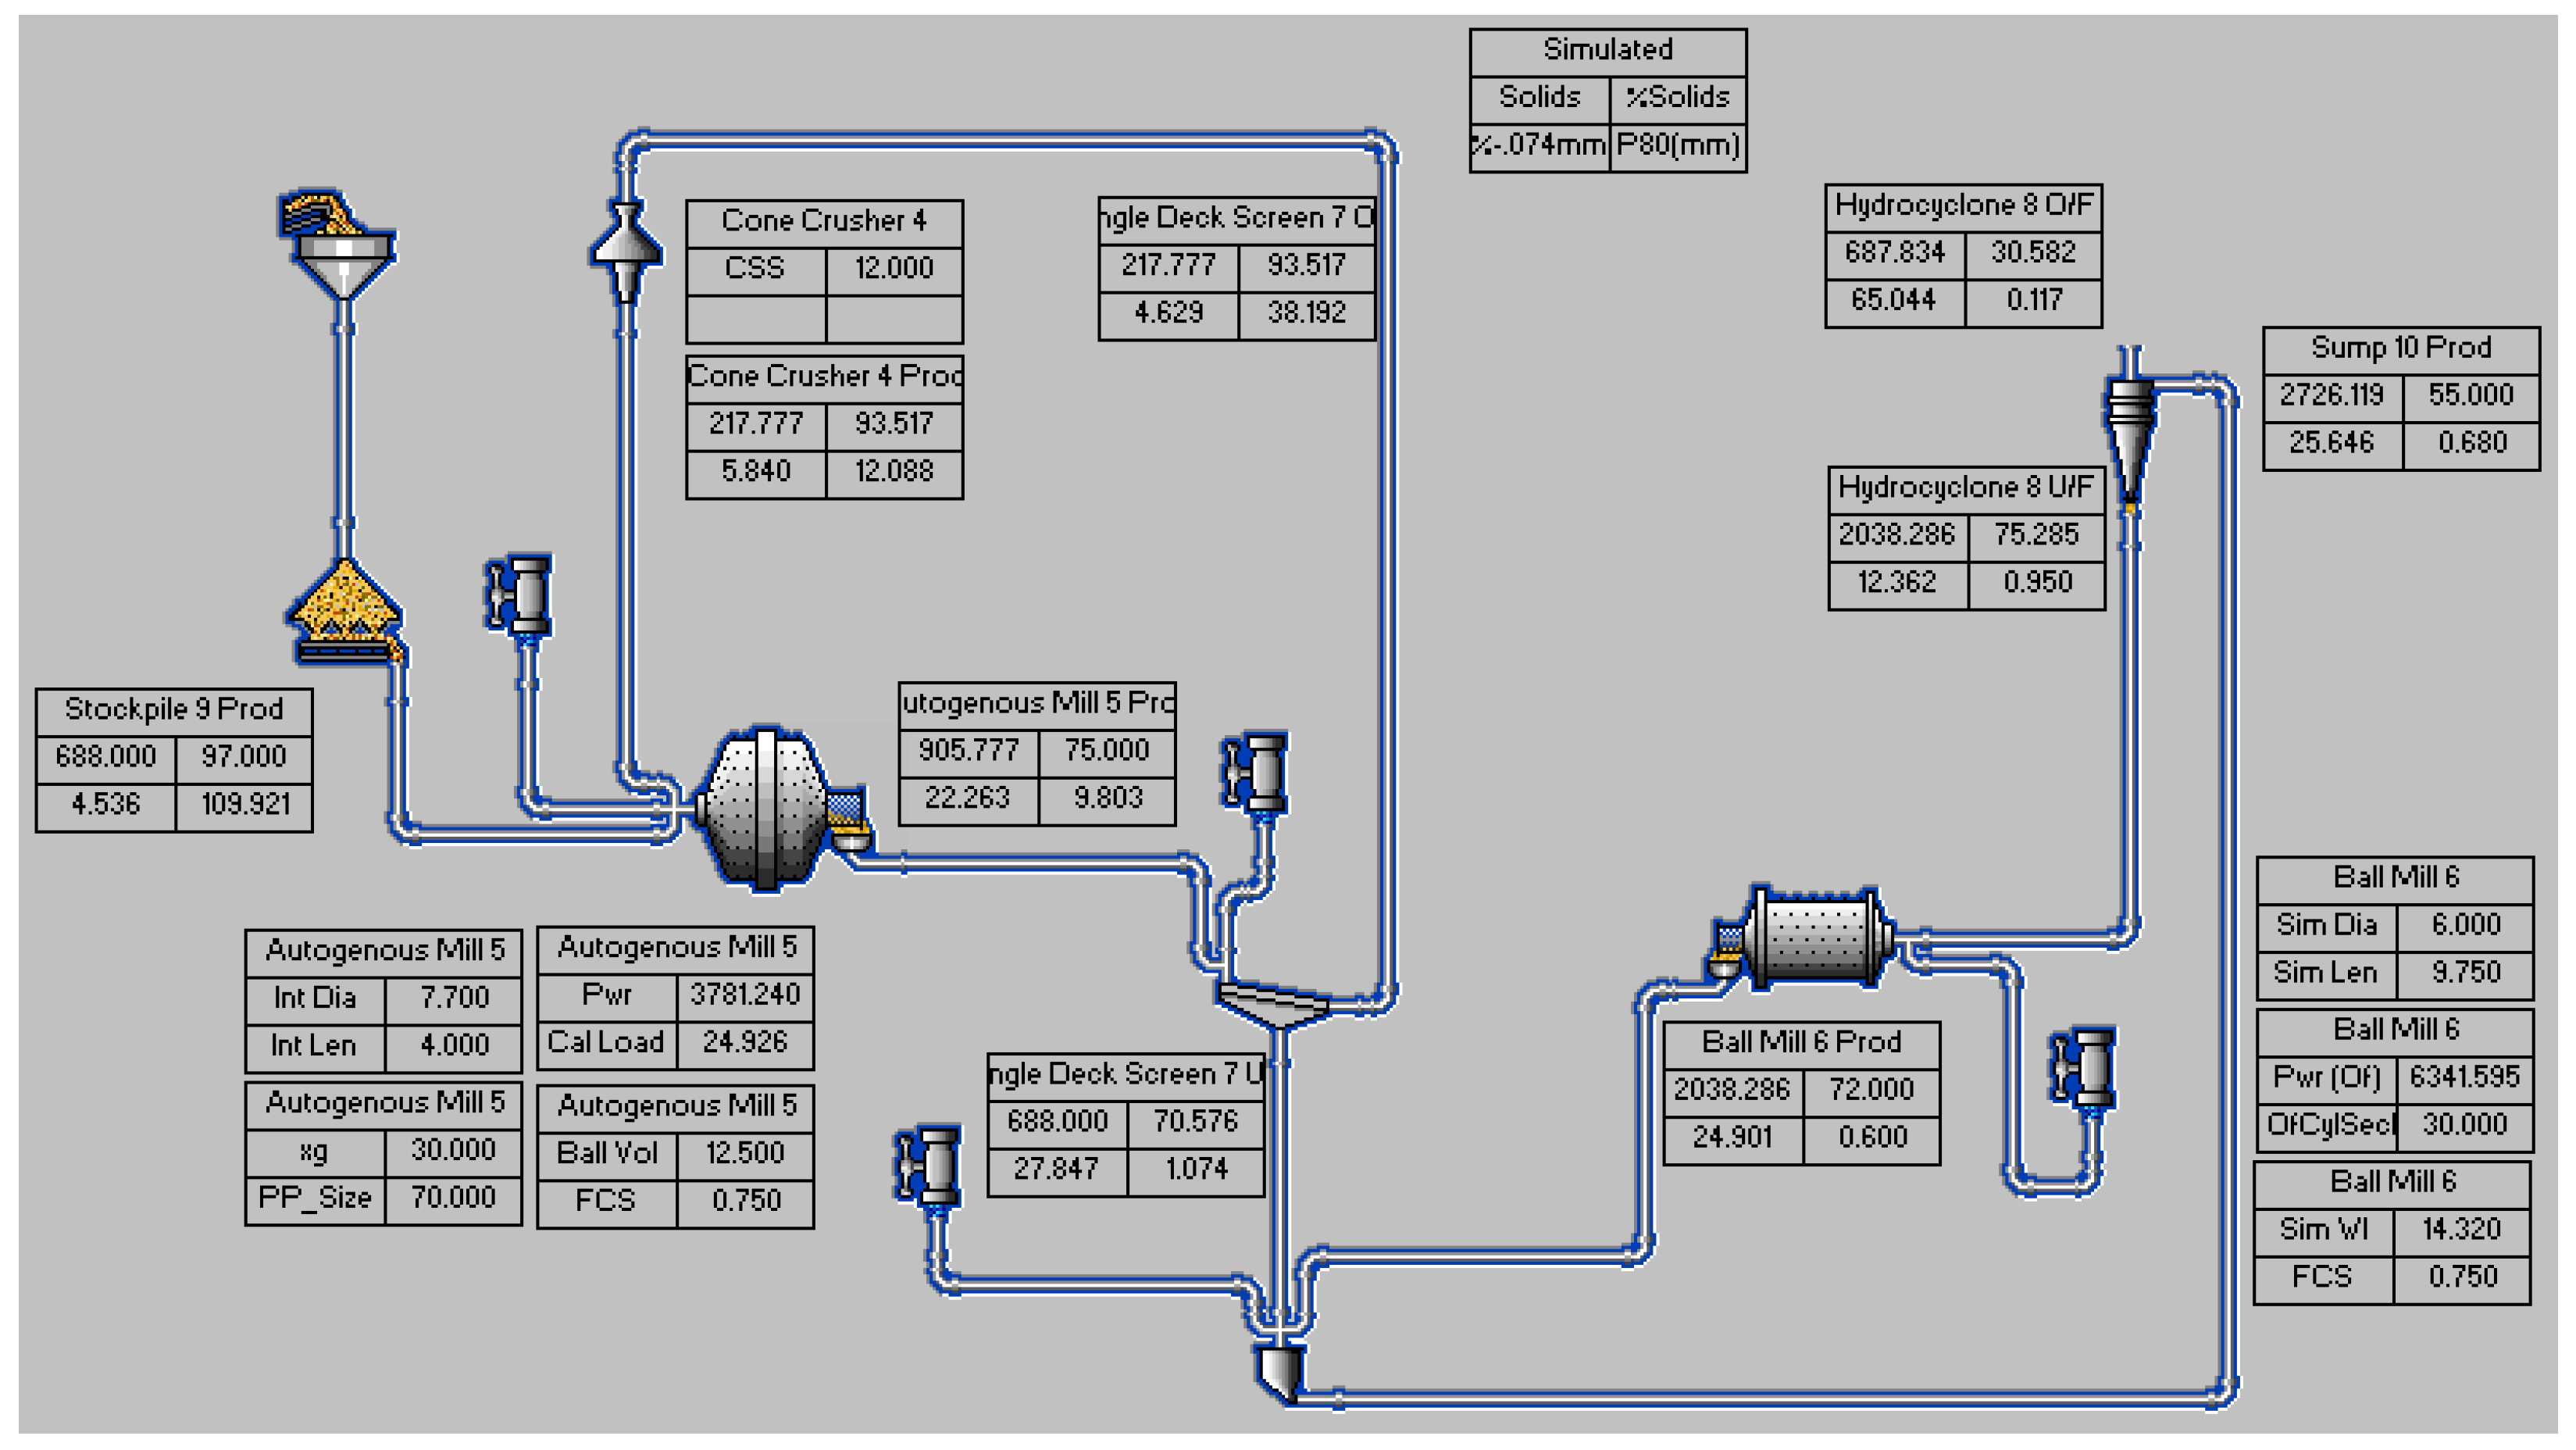
The maximum theoretical processing capacity is shown in
Figure 4. To simulate the maximum capacity of each grinding mill, the ball charge volume in both the SAG and ball mill were optimized and the actual product size and operating conditions were used. Although the final designed product size of the SABC circuit was 115 µm (P
80), a product size of 170 µm (P
80) was used for the simulation as this was the actual product size in operation. From
Figure 4 it can be seen that the maximum theoretical processing capacity is 20,400 t/d (850 t/h), a 36% increase from the current processing tonnage of 15,000 t/d (625 t/h).
The operating conditions of the SAG and ball mill are shown in
Table 4. The power draw of the SAG mill has room for significant improvement. As ball filling in the SAG mill is quite low, additional grinding media would likely increase the processing capacity of the SAG mill; however, the capacity of the ball mill, with installed power for the required product size of 170 µm, has reached its limit. The power draw for the simulated ball mill (5700 kW) is close to its rated motor power (6000 kW), however, greater than the power draw for the actual mill (5268 kW). The increase in power draw is due to an increase in ball volume from 24%
v/
v (actual) to 27%
v/
v (simulated). This increase in ball volume results in an increase in productivity, although this occurs at a product size (170 µm) coarser then originally designed (115 µm).
5. Circuit Modification and Performance
To improve the energy efficiency of the circuit, various operating conditions were modified, with the goal of increasing the processing capacity from 15,000 to 20,000 t/d, in weekly increments of 1000 t/d. The ball filling rate of the SAG mill was increased from 8% to 10% v/v and monitoring settings in the central control room were temporally set to have no upper limit. The pebble crusher was reduced in size and the pebble bin capacity was increased to allow for a more consistent flow into the pebble crusher. Uncrushed pebbles were returned directly to the SAG mill, bypassing the pebble crusher, to further improve circuit efficiency. The ball filling rate of the ball mill was set at 27% v/v and the mill’s efficiency was set to automatic monitoring, with the upper limit set to 5800 kW (the maximum efficiency (obtained from consultation with the manufacturer)).
If the SABC circuit could operate normally and the capacity of each piece of equipment in the circuit could exceed its design requirements, the 20,000 t/d target could have been reached without any impediment arising from major issues. However, a number of different problems emerged during production which required attention.
One major issue was the operation of the SAG mill caused vibration at an amplitude of up to 11 mm (on the mill foundation) and therefore it could not be operated at a production rate above 15,000 t/d. To eliminate this issue the mill foundation base was reinforced, effectively eliminating the vibrations and allowing for stable production at about 18,000 t/d (a 20% increase in processing capacity) to 19,000 t/d (a 27% increase in processing capacity).
A second issue was that domestic-made grinding media and wear-resistant materials are of much lower quality compared to foreign-made products. The ideal ball charge volume for a SAG mill is 12%
v/
v [
16], according to the design objective, and the maximum ball size has a diameter of 150 mm. During operation, however, breakage rates of the shell liners and lifters become extremely high, with a lifespan of only one month when a ball charge volume of 12%
v/
v was used. Increasing the ball charge volume or ball size caused more damage to the shell liners and lifters. After further test work, it was determined that a ball diameter of 120 mm could be used, but the ball charge volume could not exceed 10%
v/
v. Following these adjustments, the lifespan of the liners and lifters could be expected to increase to three months.
The initial problem with pebble crushing was the over-sized HP800 crusher which resulted in the intermittent recirculation of pebbles on a frequency of 2 h of operation per shift, or 4.5 h per shift with a replacement HP400 crusher. Both crushers operated with their load controller activated to maintain a constant feed rate at maximum current, which becomes intermittent in the absence of sufficient pebble flow and a feed bin. To solve this issue, the HP Series crusher was replaced with a smaller TRIO TC84 crusher (450 kW, without a load controller, Shanghai TRIO Engineered Products Inc., Shanghai, China), and a reduced feed rate and a 100 m3 capacity feed bin were used to ensured continuous operation on a 24 h basis. In addition, some plant test work was performed without the pebble crusher in the circuit. While stable operation was achieved initially, after one month, the load of uncrushed pebbles inside the SAG mill accumulated to an extent which caused over-loading of the mill power draw. Accordingly, it was decided that elimination of the pebble crusher in the circuit was not viable.
The discharge grates of the SAG mill were identified as a key component in the SABC circuit, and their design is a crucial factor in the mill’s performance [
17,
18,
19,
20,
21]. The initial design of the grate section caused a serious accumulation of pebbles within the SAG mill which contributed to a decreased grinding efficiency. The grates were designed with 18 inner sections, with a 25 mm grate slot width, and 18 outer sections, with only four sections having pebble ports (slot width of 60 mm). The rate of pebble production was 5% of the mill’s feed rate, compared to the design objective of 17%. This resulted in operational variability in the entire SABC process (i.e., cyclic variability of mill load with peaks and frequent grind-outs). Based on plant test work, the open area of the 36 grate sections was increased by changing all 18 outer sections to have pebble ports (60 mm), while retaining a 25 mm slot width in the 18 inner sections. These changes contributed to an increase in the discharge rate of pebbles, the efficiency of the SAG mill, and the processing capacity of fresh ore.
6. Plant Performance after Improvements
The final plan was to increase the ball charge in the SAG and ball mill to 10% v/v and 27% v/v, respectively; set the upper limit of the operating power in the ball mill to 5800 kW; use a TRIO TC Series crusher (without a power-/feed rate–controlling device, but with a feed bin) to crush pebbles for recirculation back to the SAG mill feed; and change the number of pebble ports in the SAG mill grate sections. As a result of these changes, a 20% improvement (an increase from 15,000 to 19,000 t/d) in the productivity of the Wushan comminution circuit was achieved. The potential for achieving a processing capacity of 20,000 t/d was also demonstrated, but was only obtainable after optimization of the SAG mill grate sections, ball size, and volumetric loading of balls. In addition, the benefits of this study have given strategic directions for the construction of Phase II, which is likely to decrease the amount of capital investment required.
7. Conclusions
The simulated results produced in this work, using the JKSimMet program, allowed for the investigation into the performance of the Wushan Phase I SABC comminution circuit. The main conclusions are as follows:
- (1)
SABC circuits are well suited to Chinese nonferrous mines, especially large-scale deposits. Their implementation will be important for the development of China’s large-scale deposits in the future.
- (2)
At the Wushan mine, increased productivity was achieved at a decreased specific power consumption, without any significant changes to the existing SABC circuit.
- (3)
The production experience gained from this work indicates that the successful design and operation of grinding circuits can be accomplished by coupling scientific theories with known ore characteristics.
- (4)
China still lacks experience in the research and operation of SABC circuit technology and requires continued research in this field.


