Article

Multisystem (S–Pb–He–Ar–H–O) Isotopic and Fluid Inclusion Constraints on the Genesis of the Chaijiagou Porphyry Mo Deposit, North China Craton

1
School of Earth Science and Engineering, Hebei University of Engineering, Handan 056038, China
2
Key Laboratory of Metallogenic Prediction of Nonferrous Metals and Geological Environment Monitoring (Ministry of Education), School of Geosciences and Info-Physics, Central South University, Changsha 410083, China
3
Key Laboratory of Resource Exploration Research of Hebei Province, Handan 056038, China
4
State Key Laboratory of Lithospheric and Environmental Coevolution, Institute of Geology and Geophysics, Chinese Academy of Sciences, Beijing 100029, China
5
Department of Earth Sciences, VU Amsterdam, De Boelelaan 1105, 1081 HV Amsterdam, The Netherlands
*
Author to whom correspondence should be addressed.
Minerals 2026, 16(1), 71; https://doi.org/10.3390/min16010071
Submission received: 30 November 2025 / Revised: 6 January 2026 / Accepted: 10 January 2026 / Published: 12 January 2026
(This article belongs to the Special Issue Selected Papers from the 7th National Youth Geological Congress)

Abstract

The Chaijiagou Mo deposit (0.11 Mt Mo @ 0.07%) is located along the northern margin of the North China Craton. This study integrates ore geology, S–Pb–He–Ar–H–O isotopes, and fluid inclusion (FI) analyses to constrain the sources of ore-forming fluids and metals, as well as mineralization mechanisms. Three principal inclusion types were identified: liquid-rich, vapor-rich, and saline FIs. Microthermometry documents a progressive decline in homogenization temperatures and salinities from early to late mineralization stages: Stage 1 (360–450 °C; 5.3–11.3 and 35.4–51.5 wt.% NaCl equation), Stages 2.1–2.2 (320–380 °C and 260–340 °C; 5.4–11.8 and 33.8–44.5 wt.% NaCl equation), and Stage 4 (140–200 °C; 0.4–3.9 wt.% NaCl equation). Noble gas and stable isotope data reveal that the ore-forming fluids were initially dominated by crustally derived magmatic–hydrothermal components with a minor mantle contribution, subsequently experiencing significant meteoric water input. S–Pb isotopic compositions demonstrate a genetic relationship between mineralization and the ore-bearing granite porphyry, indicating a magmatic origin for both sulfur and lead. Fluid–rock interactions and fluid boiling were the dominant controls on molybdenite and chalcopyrite deposition during Stage 2, whereas mixing with meteoric waters triggered galena and sphalerite precipitation in Stage 3.

1. Introduction

Porphyry deposits, characterized by their spatial and genetic association with intermediate acid–acid hypabyssal porphyritic intrusions, represent the world’s principal source of copper, molybdenum, and a significant source of gold [1]. Their formation involves complex magmatic–hydrothermal processes, where the origin, evolution, and metal precipitation mechanisms of ore-forming fluids remain central topics of research [2,3]. China hosts vast molybdenum resources, predominantly within several major metallogenic belts, among which the Yanliao Mo Belt along the northern margin of the North China Craton (NCC) is a crucial Mo province with reserves exceeding 4 Mt [4]. The metallogeny of this belt is episodic, with major mineralization events identified in the Triassic, Jurassic, and Early Cretaceous [5]. Notably, the Jurassic Mo mineralization (189–145 Ma) has been widely documented and is generally linked to the subduction and subsequent rollback of the Paleo-Pacific Plate beneath the Eurasian continent, which induced extensive magmatism and related fluid activity [6,7,8]. However, debates persist regarding the precise source of metals and fluids (e.g., mantle-derived, crustal remelting, or mixed sources), the tectonic triggers for individual deposits, and the detailed physico-chemical pathways leading to metal deposition.
The Chaijiagou porphyry Mo deposit, located in the eastern segment of the Yanliao Mo Belt with estimated reserves of 0.11 Mt Mo, is a typical product of the Jurassic metallogenic episode [9,10]. Previous studies have established its fundamental geology [11,12], constrained the mineralization age (~163 Ma) via molybdenite Re-Os and zircon U-Pb geochronology [10], and proposed a back-arc extensional setting related to Paleo-Pacific Plate rollback based on whole-rock geochemistry [13]. Preliminary fluid inclusion (FI) studies have provided initial insights into the temperature and salinity characteristics of the ore-forming fluids [14,15]. Despite these valuable contributions, critical knowledge gaps severely limit our understanding of the deposit’s genesis. Specifically, the origin of the ore-forming metals and fluids remains highly ambiguous. Furthermore, the detailed evolution history of the hydrothermal system—including fluid sources, phase separation, water–rock interaction, and the specific mechanisms that ultimately triggered molybdenum precipitation—is poorly constrained. Resolving these issues is essential not only for constructing a robust genetic model for Chaijiagou but also for deciphering the broader fluid and metal endowment patterns within the Yanliao Belt.
To address these unresolved questions, this study presents an integrated investigation combining detailed paragenetic analysis, systematic microthermometry and petrography of FIs, and multiple isotopic systems (S, Pb, H, O, He, Ar). The objectives are threefold: (1) to precisely trace the origins of sulfur, metals, and fluids; (2) to reconstruct the evolution path of the ore-forming hydrothermal fluids; and (3) to identify the key processes responsible for Mo mineralization at Chaijiagou. By applying this multi-proxy isotopic approach, our results will provide definitive constraints on the formation of the deposit, offer a case study for Jurassic Mo metallogeny in the Yanliao Belt, and contribute to criteria for future regional exploration.

2. Geological Setting

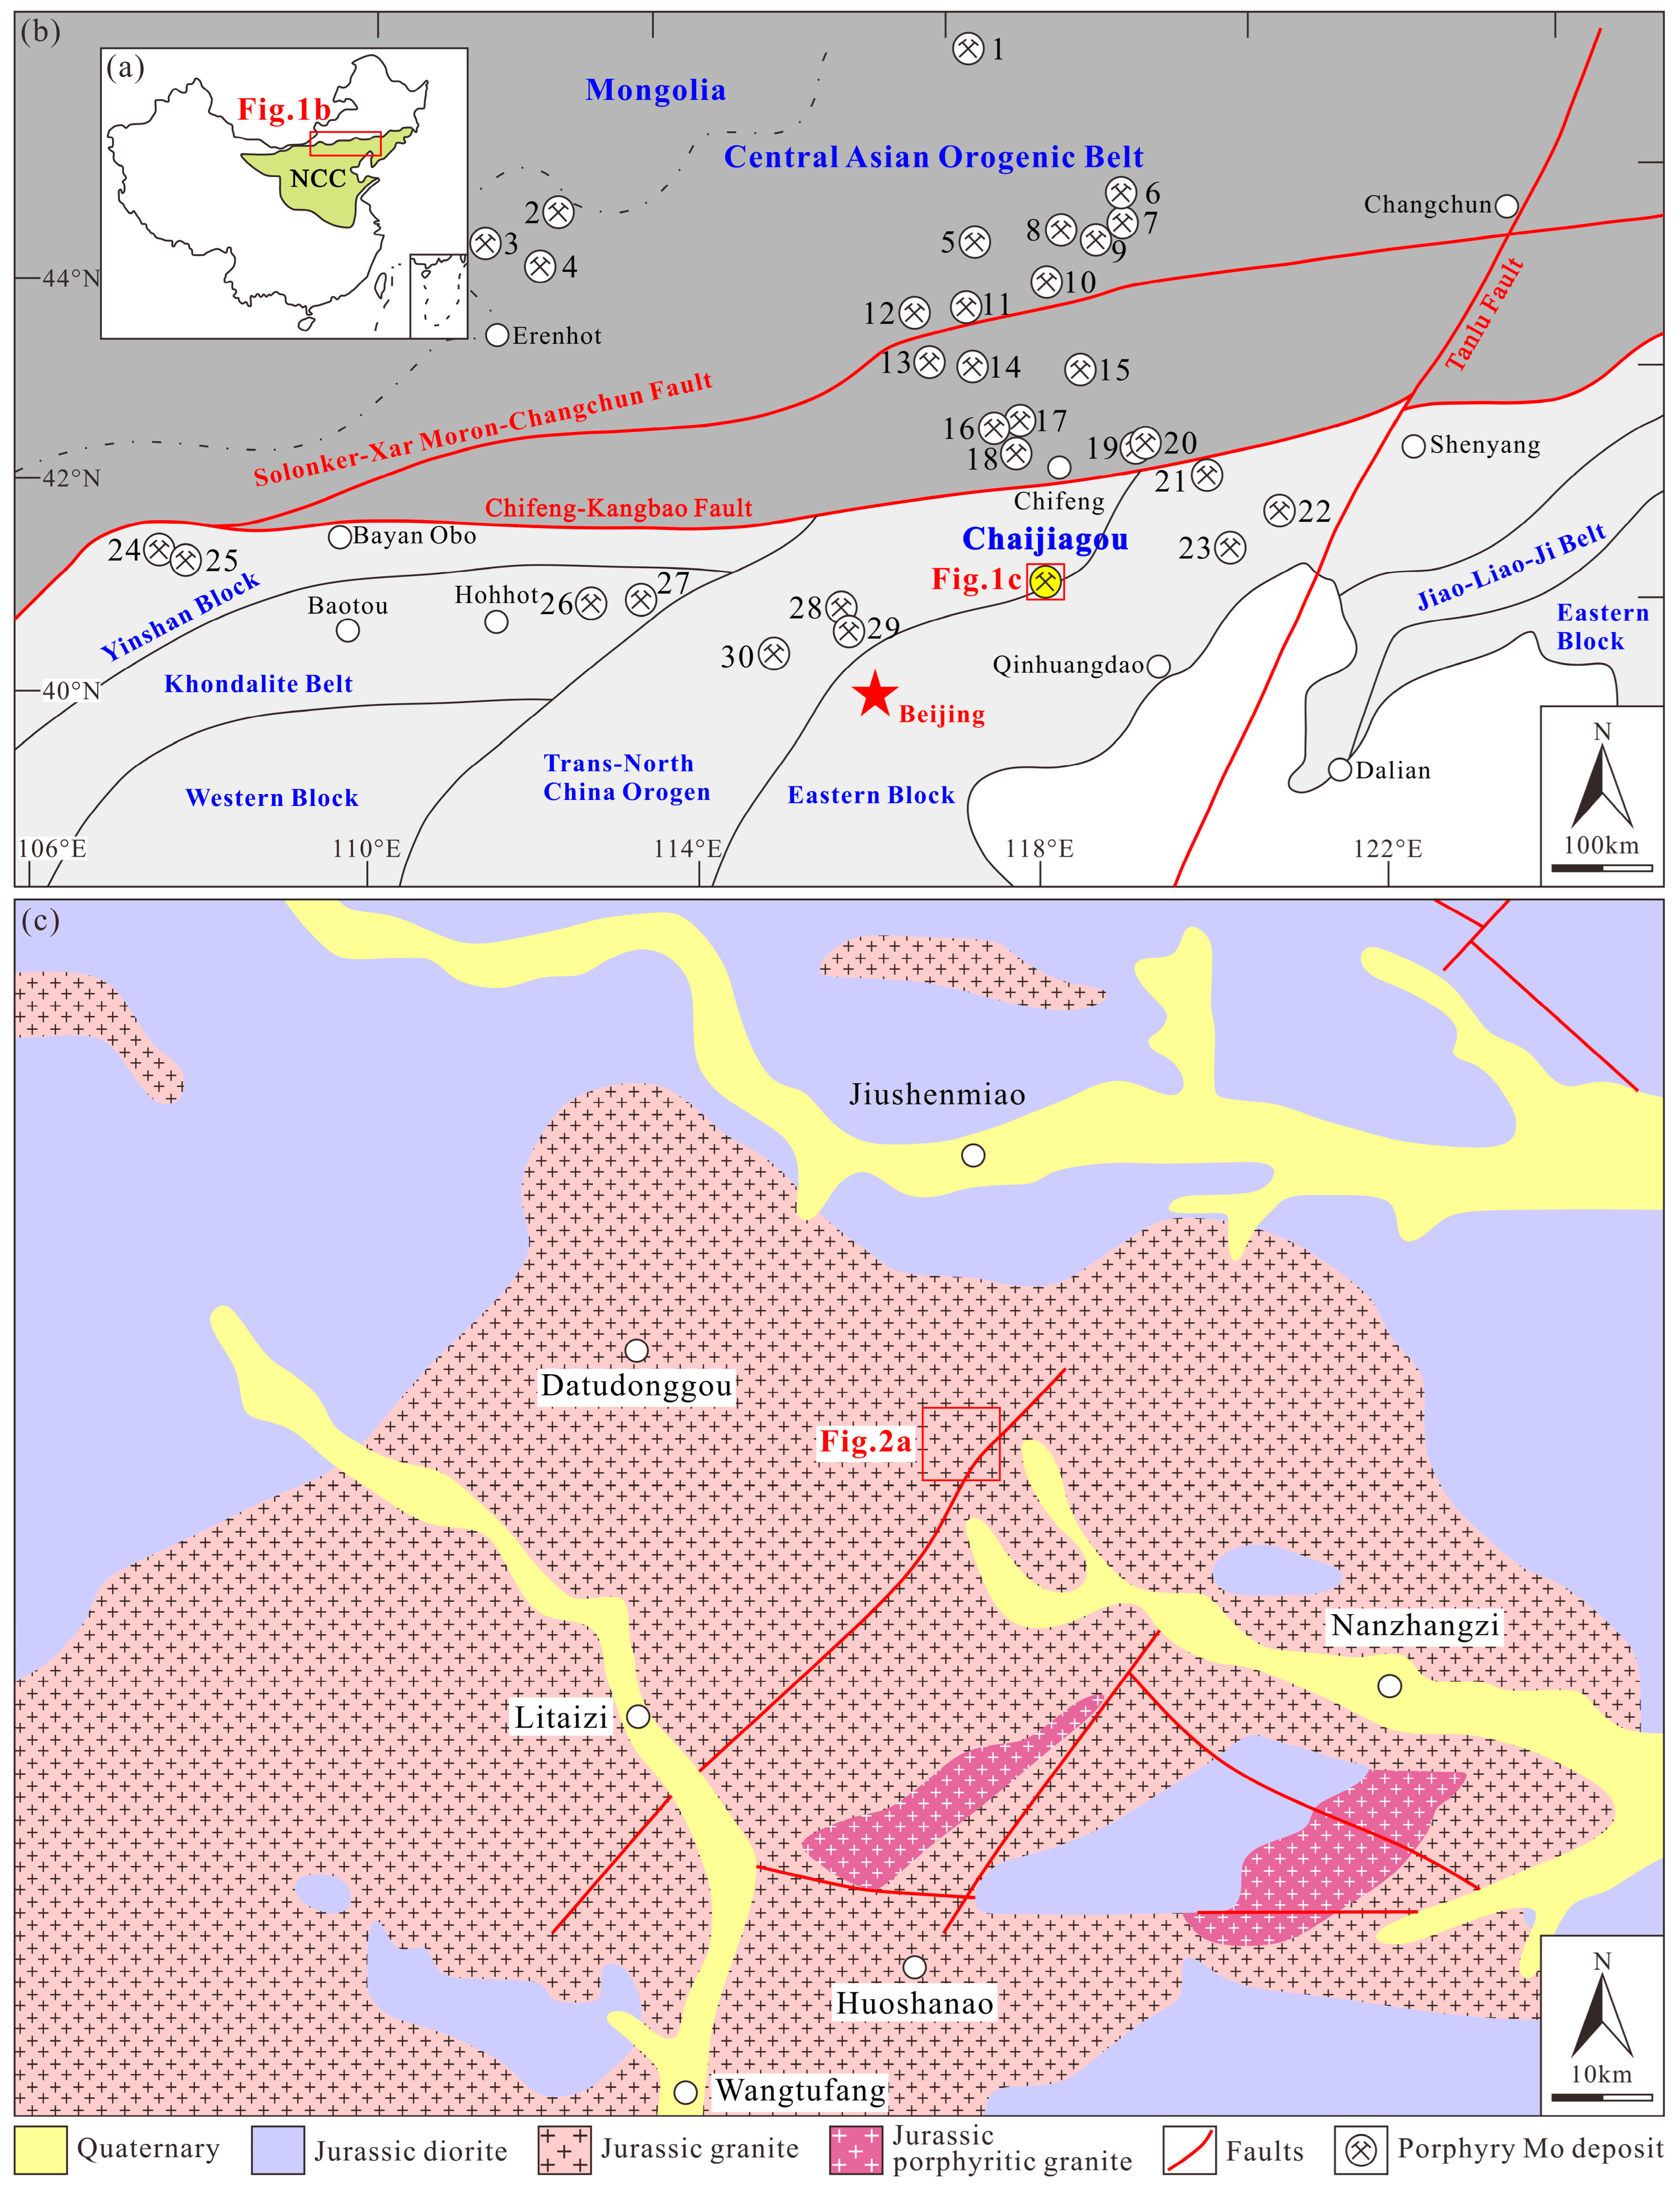
The North China Craton (NCC) occupies the northern part of China (Figure 1a). To its north, separated by the Chifeng–Kangbao Fault, lies the Central Asian Orogenic Belt [16] (Figure 1b). The Precambrian basement of the NCC consists of several Archean to Paleoproterozoic tectonic units: the Western and Eastern blocks, Jiao–Liao–Ji Belt, Trans-North China Orogen, Khondalite Belt, and Yinshan Block [17,18] (Figure 1b). High-grade Archean metamorphic rocks are extensively exposed along the northern margin of the craton. The east–west-trending Yanliao Mo Belt, located in northern China, is bounded to the north by the Chifeng–Kangbao Fault [16] (Figure 1b). This belt comprises an Archean crystalline basement overlain by Proterozoic to Mesozoic cover sequences. The Archean basement is composed of magnetite quartzite, garnet gneiss, biotite granulite, plagioclase hornblendite, and biotite plagioclase gneiss, whereas the Proterozoic–Mesozoic strata are dominated by carbonate and clastic rocks [5,19].
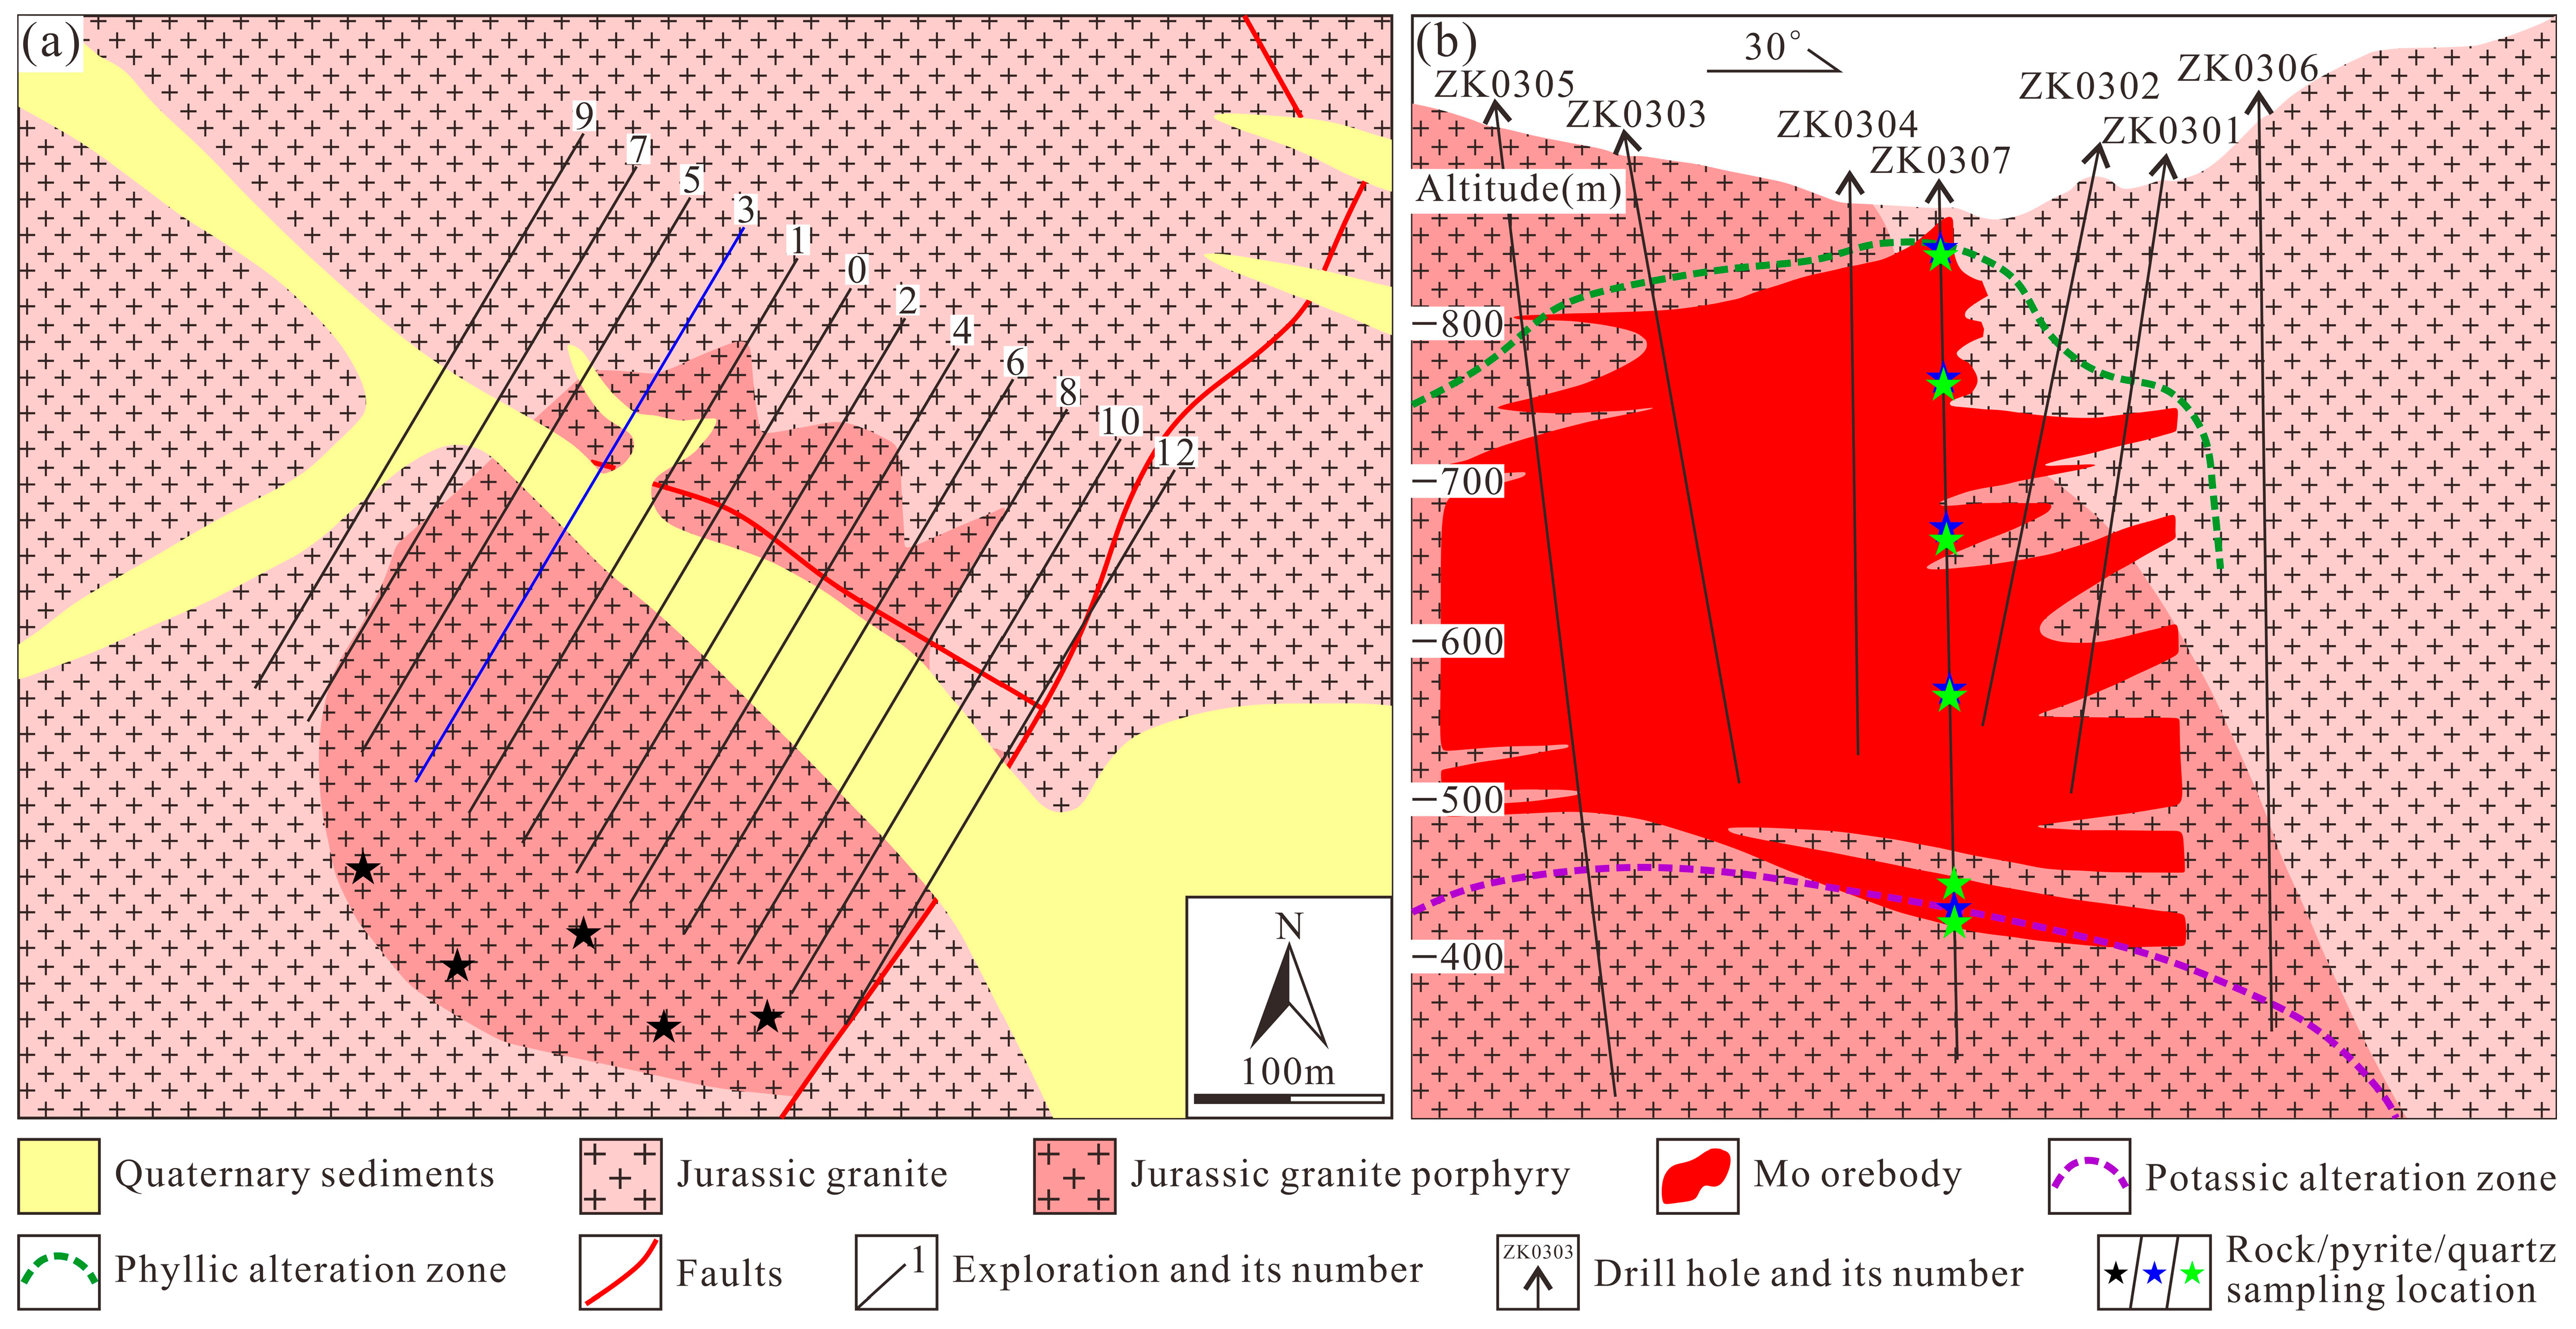
The Chaijiagou Mo deposit lies within the central segment of the Yanliao Mo Belt (Figure 1b). Quaternary sediments are the dominant surficial deposit in the area. Intrusive rocks are widely exposed, including Jurassic diorite and the Wangtufang Complex, the latter comprising monzogranite, syenogranite, and porphyritic granite. Regional structures are mainly fault-controlled, with prominent NW-, NE-, and approximately E-W-trending faults [9] (Figure 1c). At the Chaijiagou deposit, which is hosted within the Wangtufang Complex, stratigraphic units are limited. Quaternary sediments appear dominantly in the Chaijiagou valley to the southwest and the Tietougou valley to the northeast of the mining area. The area is transected by the regional E–W-striking Hongshilazi–Famiao–Niangniangmiao deep fault and the NE-trending Pingfang–Sangyuan fault. Jurassic granitic rocks and granite porphyry are well developed. Mineralization is featured with concealed veinlet-disseminated quartz–sulfide orebodies, predominantly localized in the cupola of the Middle Jurassic granite porphyry (Figure 2). The principal ore minerals are molybdenite and pyrite, with subordinate chalcopyrite, galena, sphalerite, magnetite, and minor covellite (Figure 3 and Figure 4). Gangue minerals are mainly K-feldspar, quartz, sericite, and chlorite, with lesser amounts of fluorite and calcite.
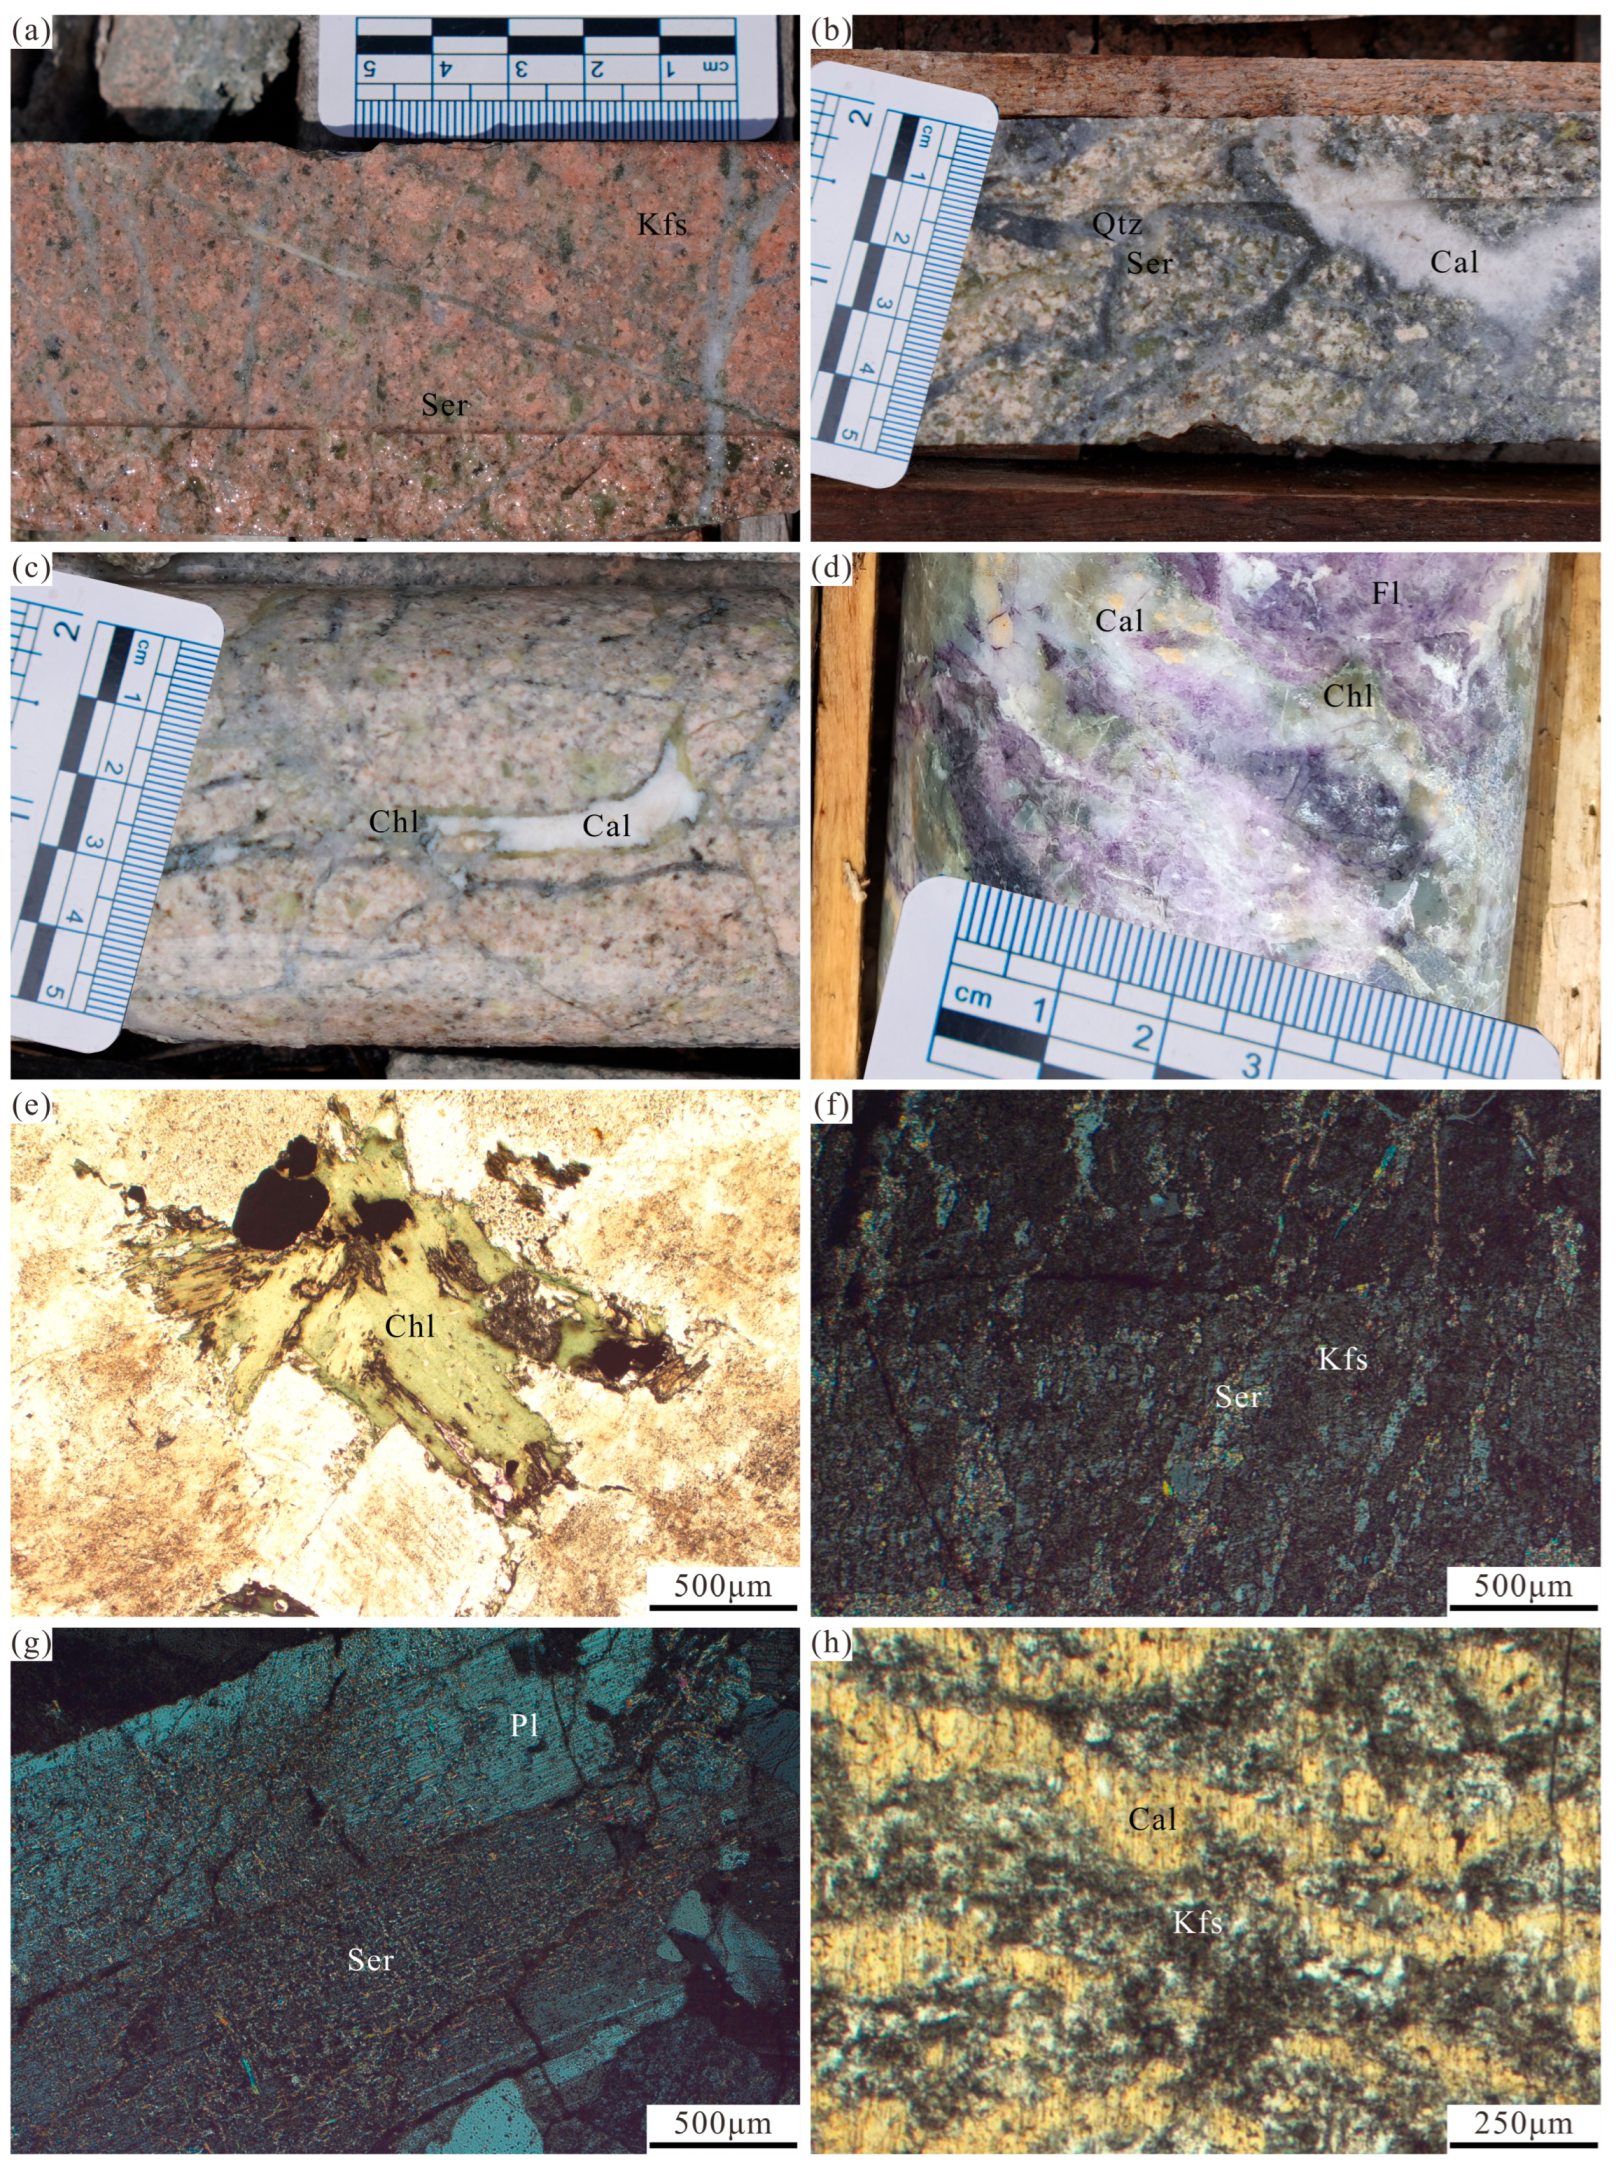
Hydrothermal alteration is intense and widespread. Two main alteration zones have been identified based on field and petrographic observations: a deep potassic alteration zone and a mid- to shallow-level phyllic alteration zone, both developed within the granite porphyry (Figure 2b). The potassic alteration zone is characterized by K-feldspathization. At the boundary between the potassic alteration zone and phyllic alteration zone, the granite porphyry exhibits both K-feldspathization and sericitization (Figure 5a). The phyllic alteration zone is characterized by sericitization and silicification, with the orebodies of the Chaijiagou Mo deposit mainly distributed within this zone. Calcite veins are observed in the granite porphyry with sericitization, representing late-stage low-temperature carbonatization (Figure 5b). On the periphery of the phyllic alteration zone, carbonatization, chloritization, and fluoritization are commonly observed (Figure 5c,d). Chloritization is characterized by the replacement of biotite by chlorite (Figure 5e). Sericitization manifests as the replacement of K-feldspar and plagioclase phenocrysts by sericite (Figure 5f,g). The phenomenon of K-feldspar phenocrysts being replaced by calcite is also observed (Figure 5h).
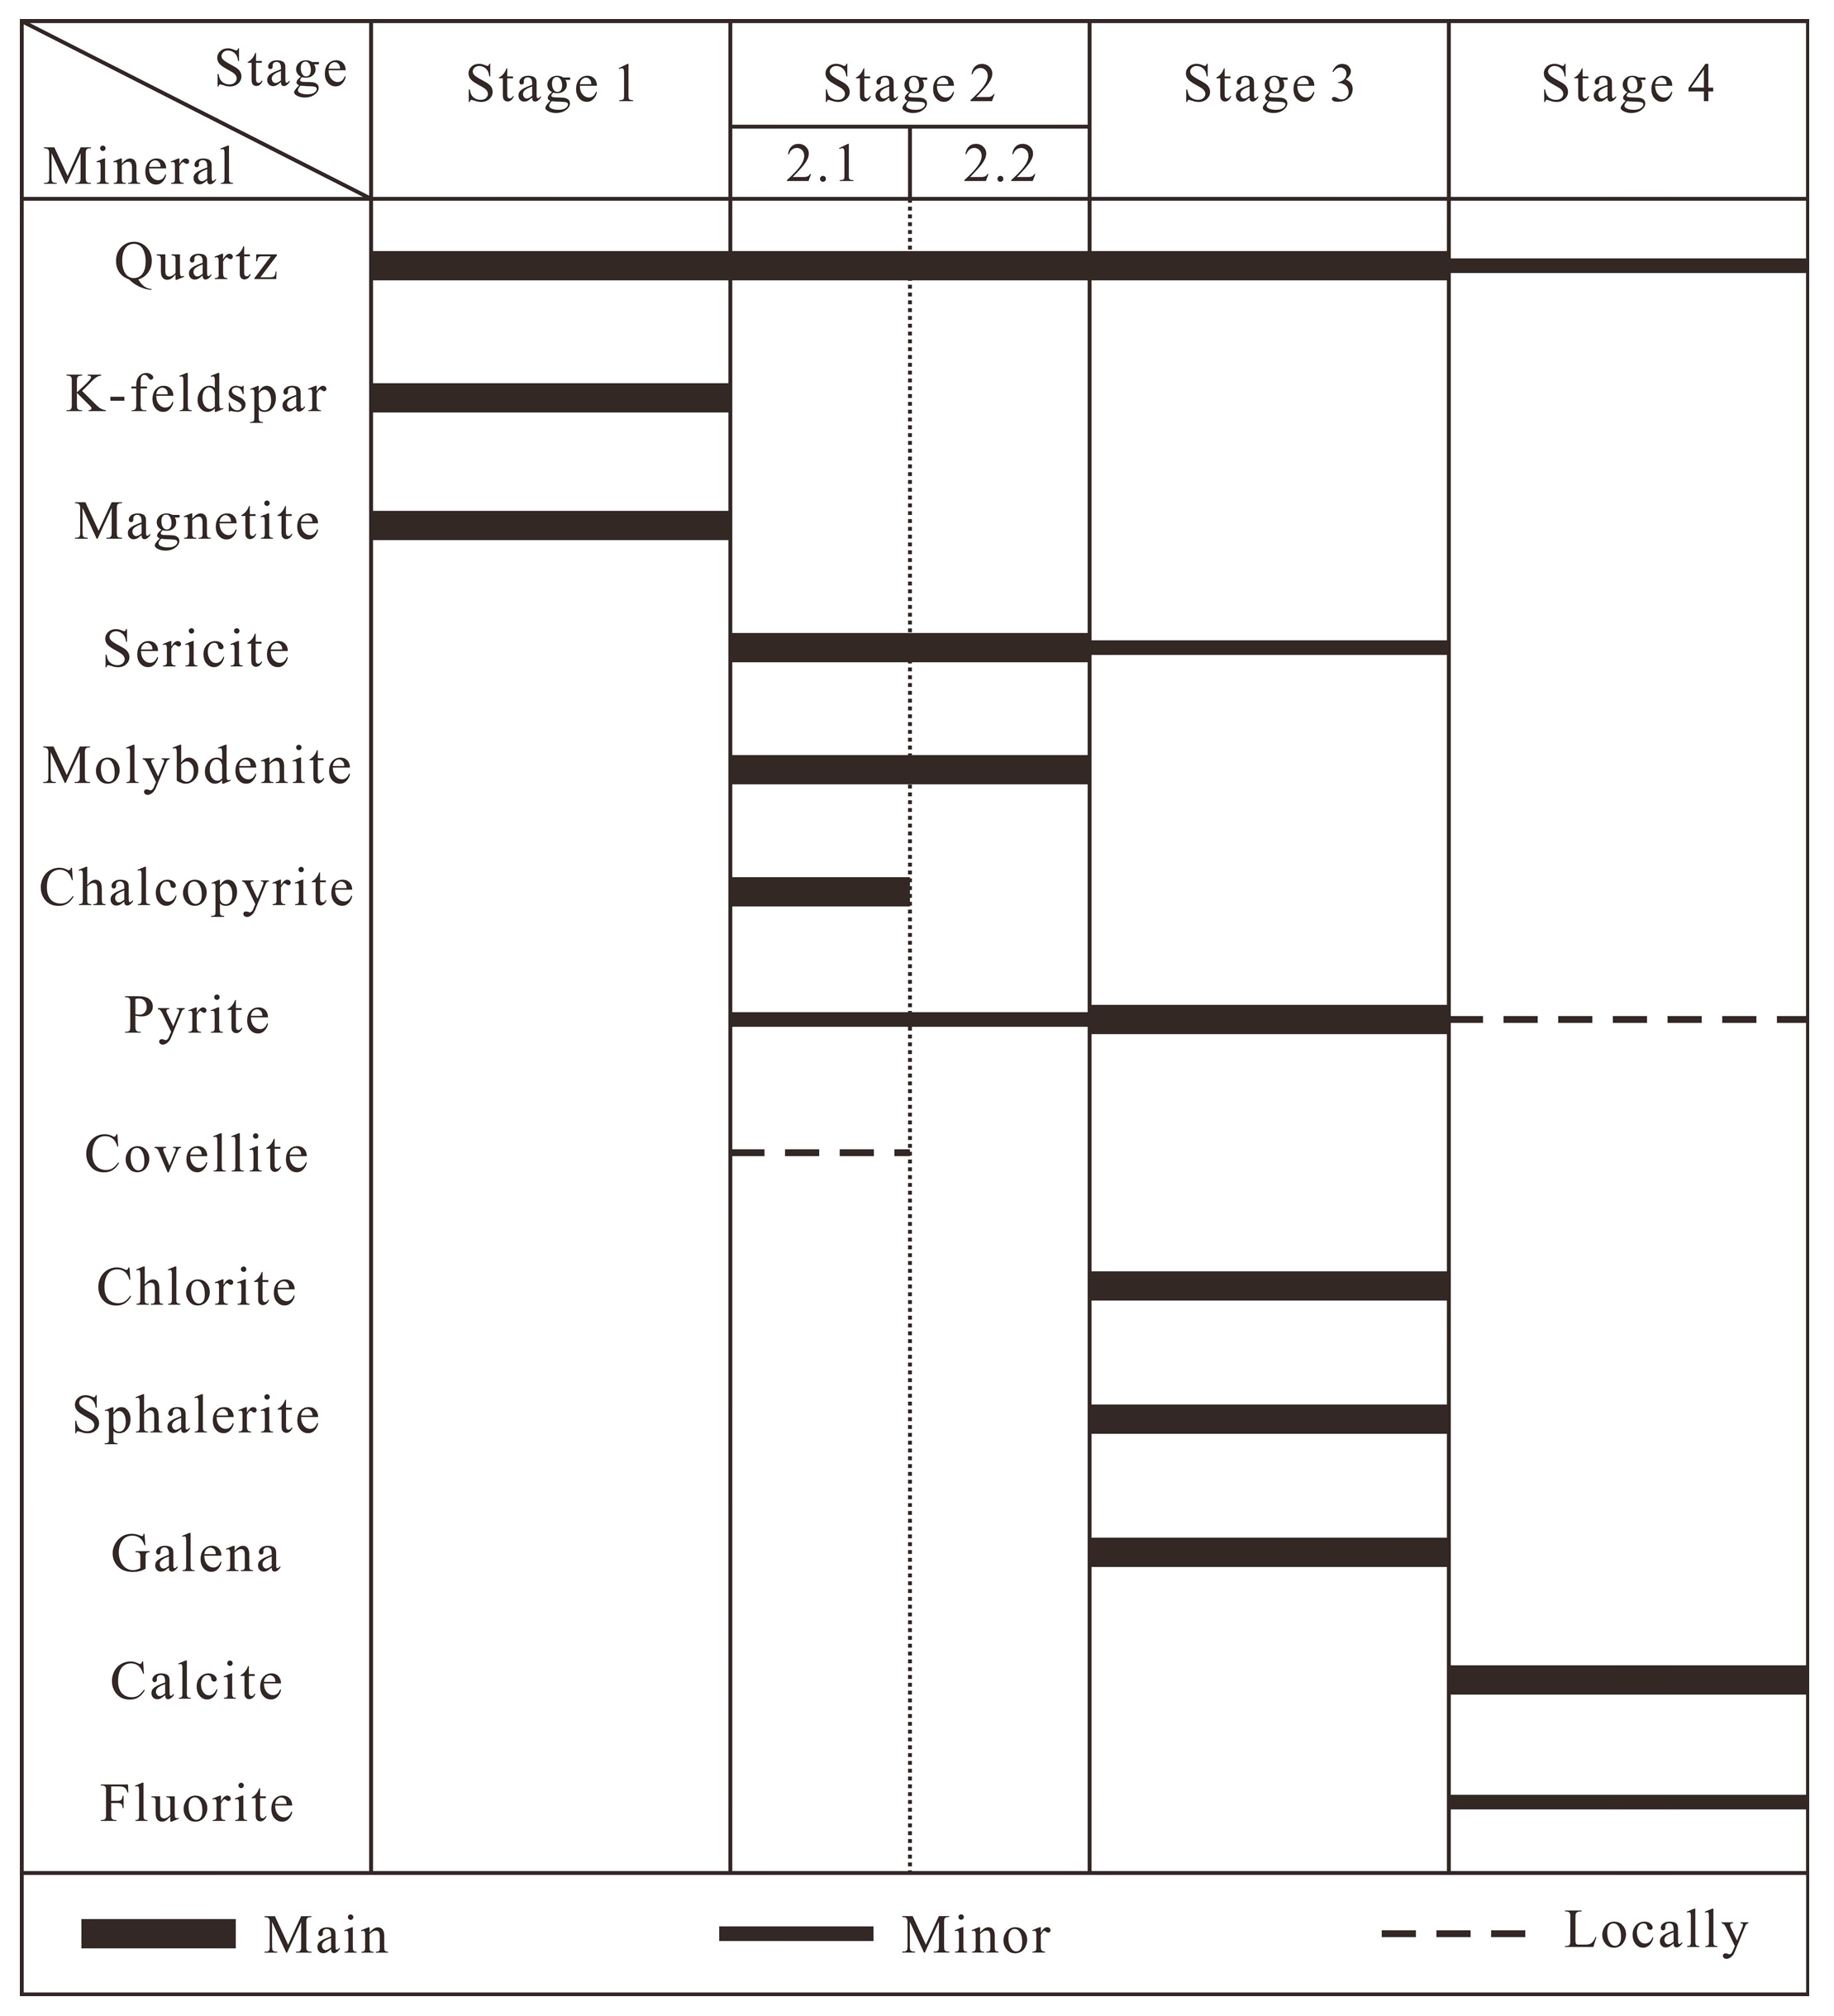
Based on vein morphology, internal structure, cross-cutting relationships, and mineral assemblages [2], four paragenetic stages of vein formation are determined in the Chaijiagou deposit, each with distinct mineral assemblages (Figure 6).
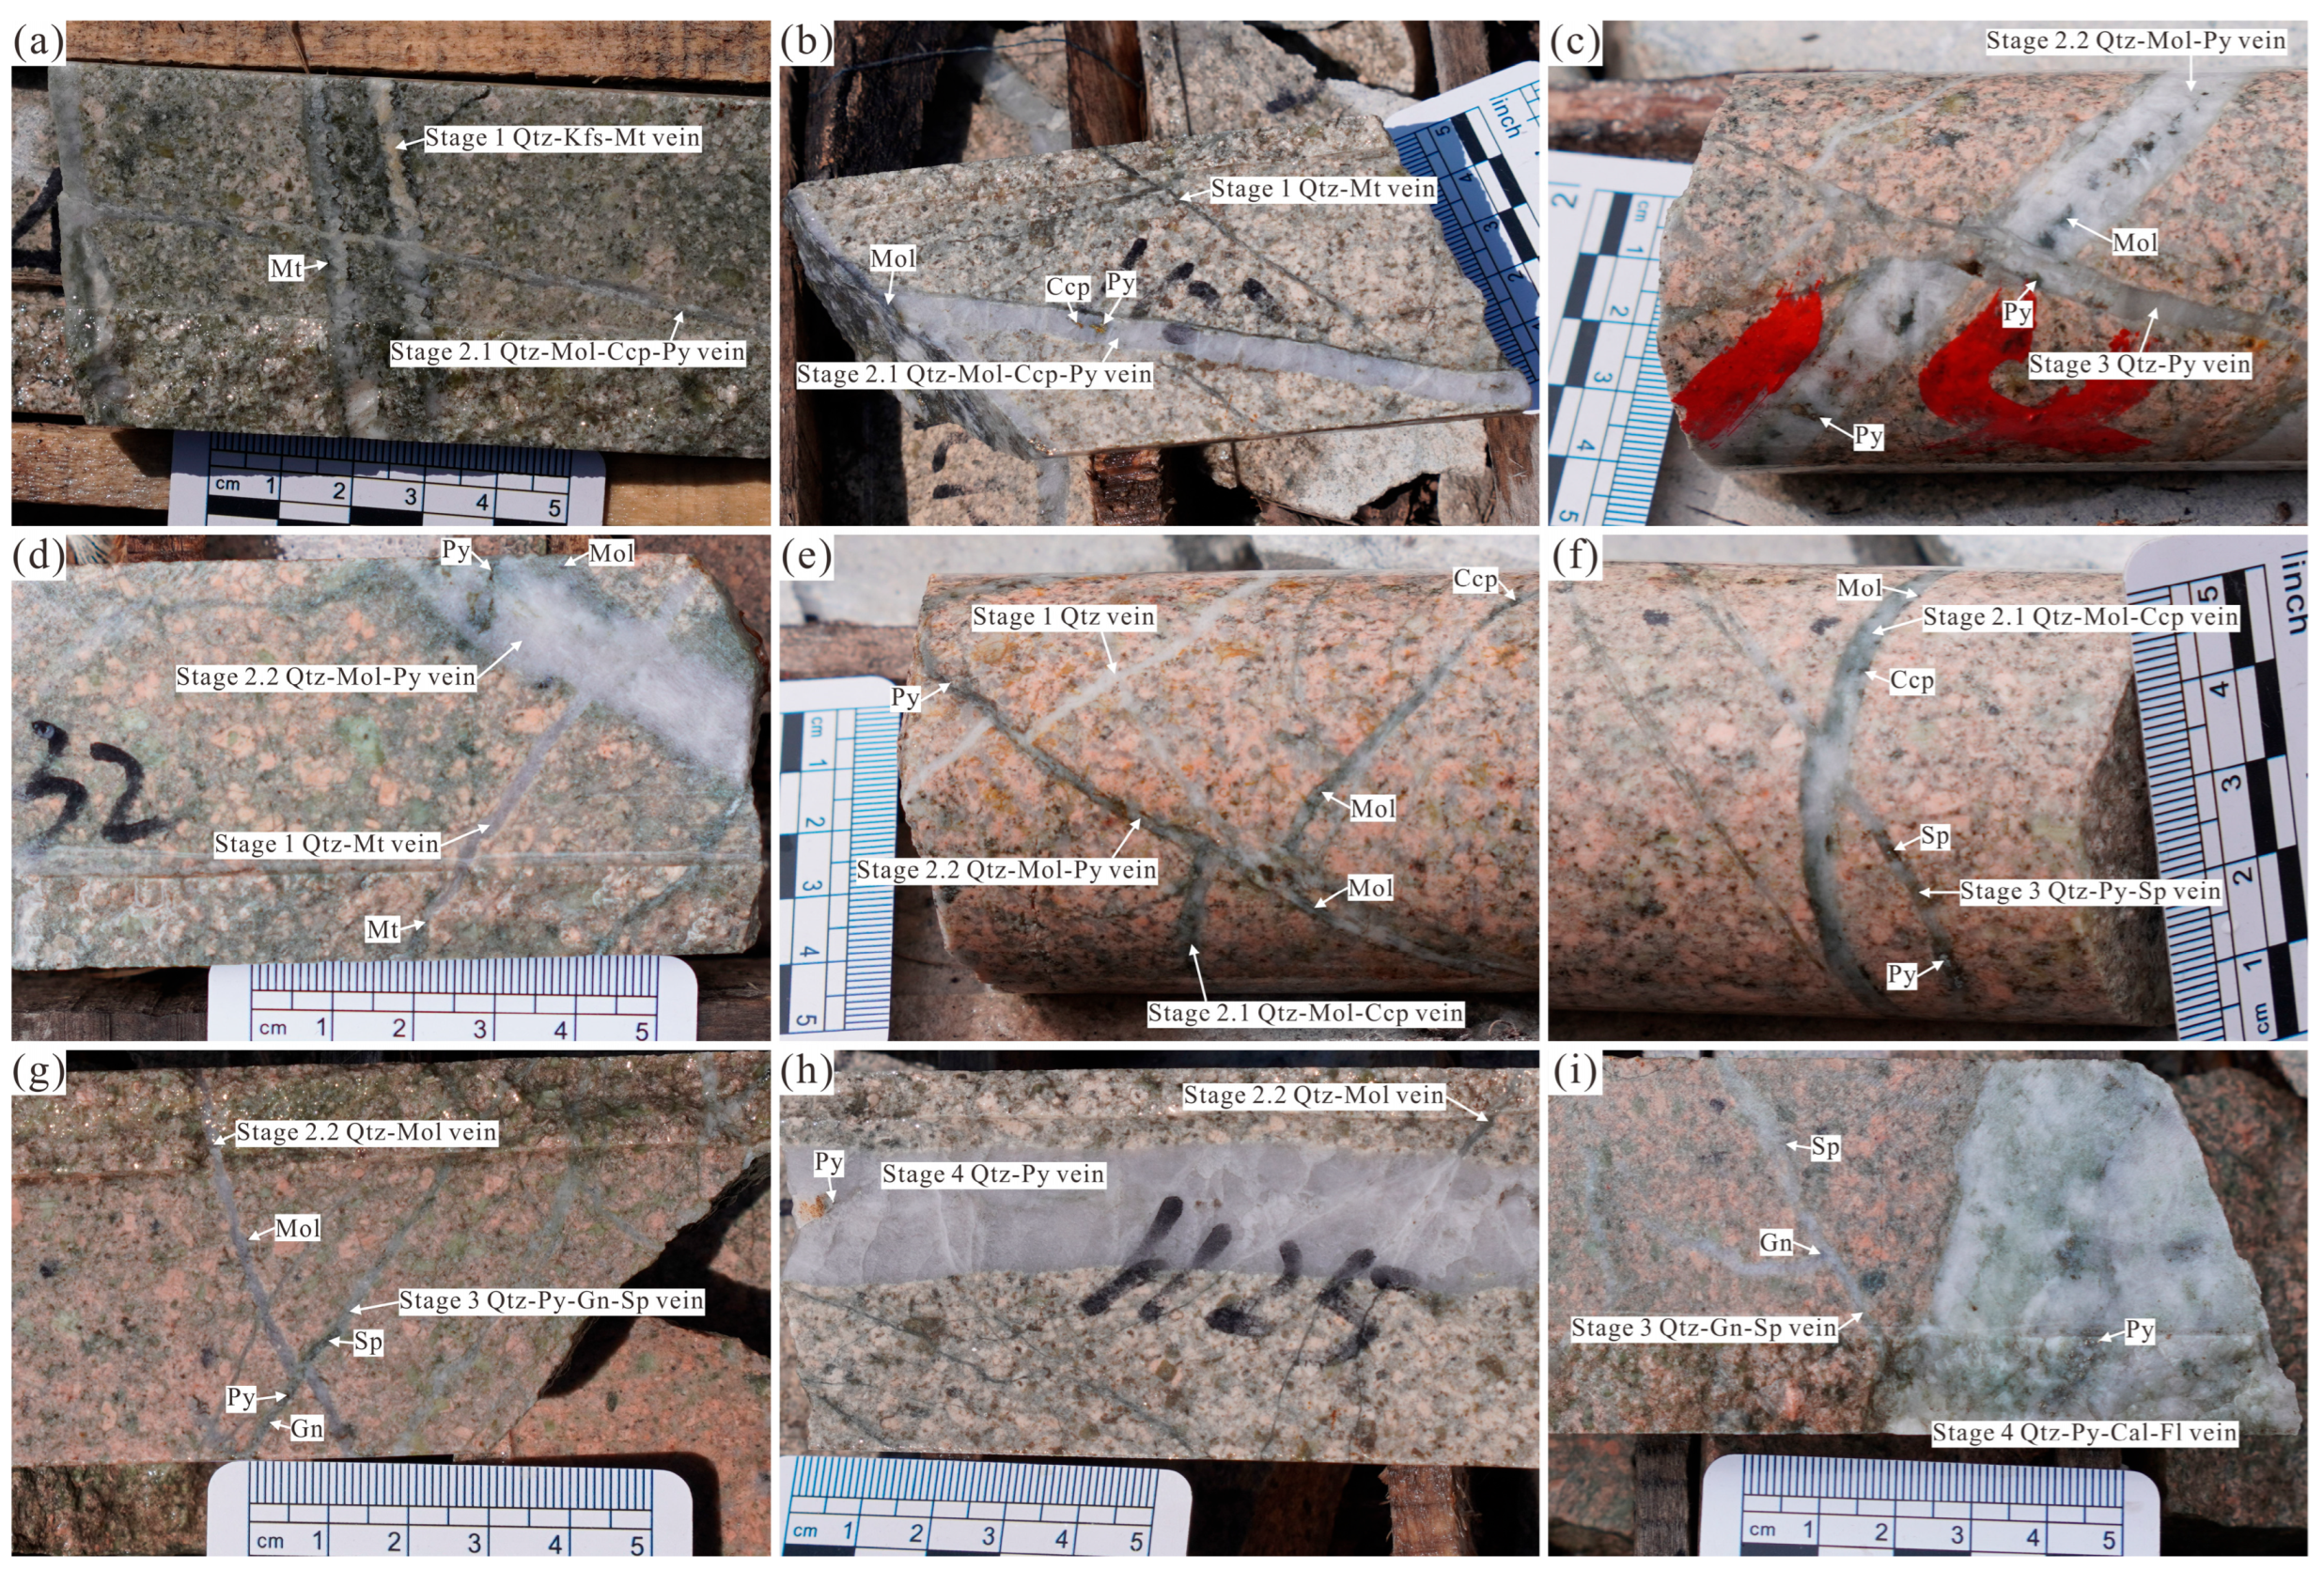
Stage 1 represents the magmatic–hydrothermal transition and is marked by veins composed of quartz, K-feldspar, and magnetite. No sulfides are present in this stage. Vein types include quartz–K-feldspar–magnetite (Figure 3a), quartz–magnetite (Figure 3b,d), and barren quartz veins (Figure 3e), typically occurring at depth and enveloped by potassic alteration.
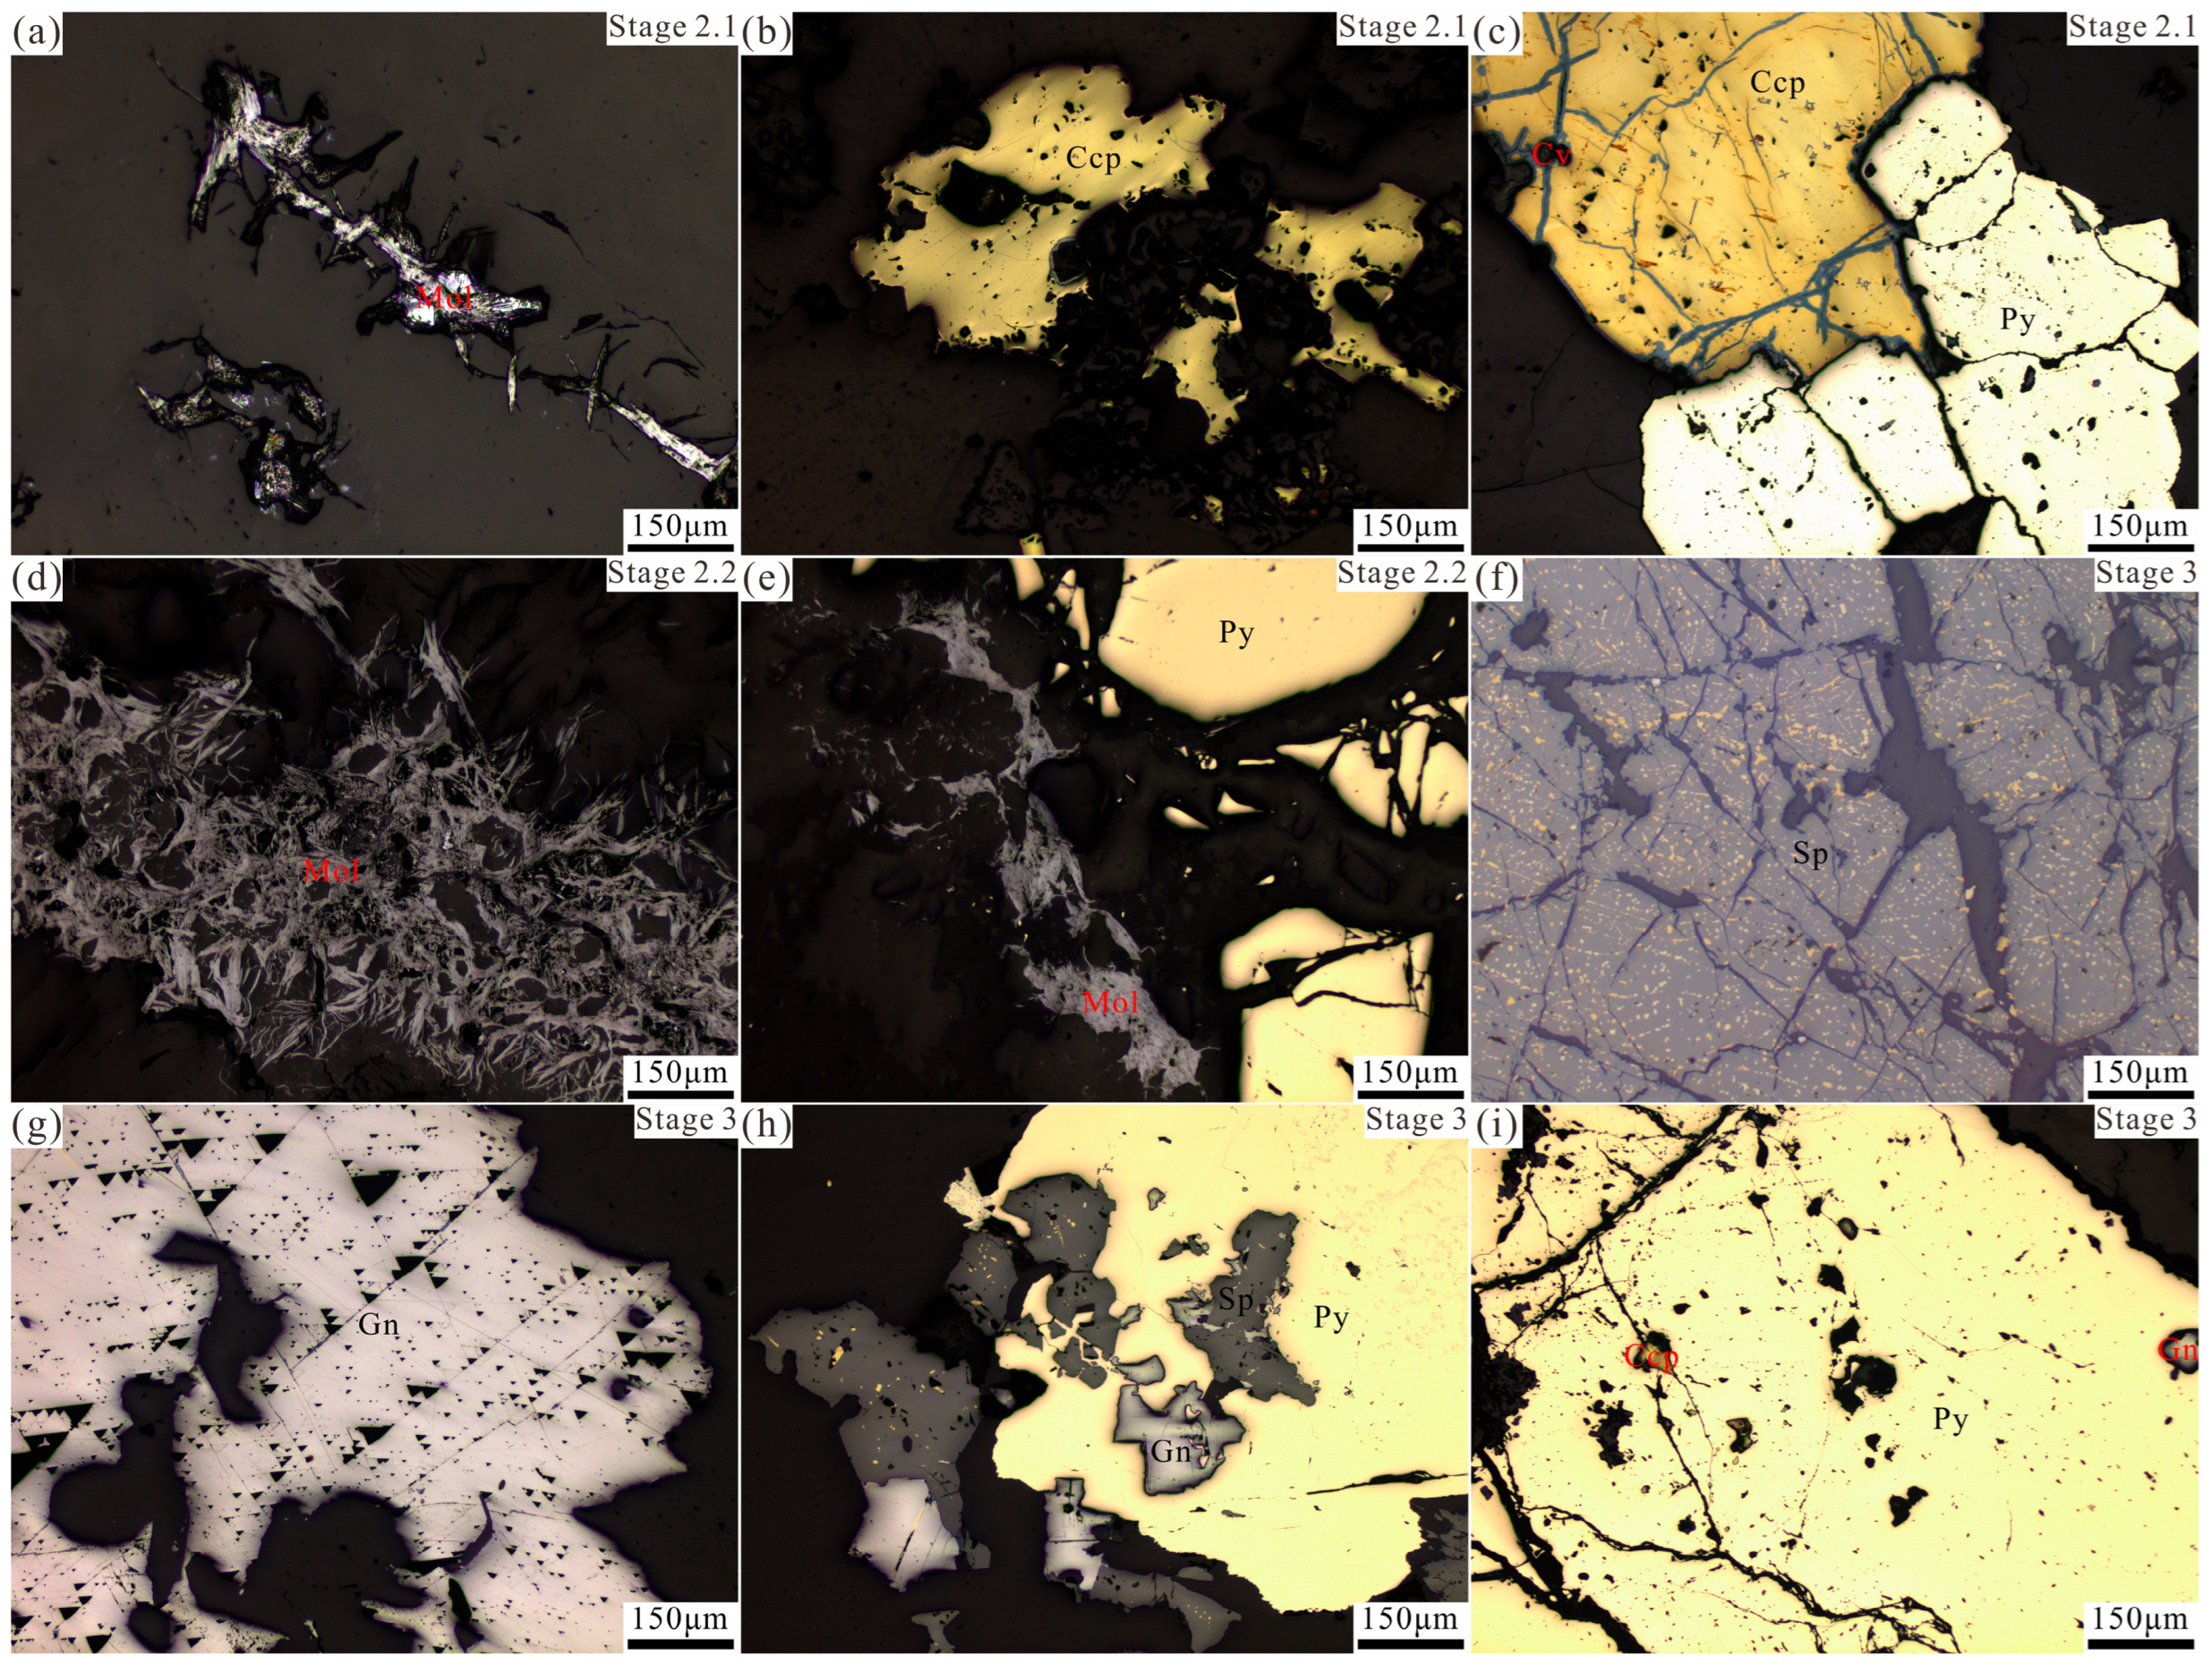
Stage 2 contains the main Mo mineralization and is hosted within quartz porphyry. The mineral assemblage includes molybdenite, chalcopyrite, pyrite, quartz, and sericite (Figure 4a–e). These veins are best developed at intermediate to shallow depths and are associated with strong silicification and sericitization. Vein margins are commonly lined with sericite and quartz (Figure 3d,g). Two substages are identified: quartz–molybdenite–chalcopyrite(–pyrite) veins (Vein 2.1; Figure 3a,b,f) and quartz–molybdenite–pyrite veins (Vein 2.2; Figure 3c,d,g,h). Vein 2.1 crosscuts Stage 1 quartz–K-feldspar–magnetite and quartz–magnetite veins (Figure 3a,b), whereas Vein 2.2 is crosscut by Stage 3 quartz–pyrite veins (Figure 3c). Vein 2.2 also crosscuts Stage 1 quartz–magnetite veins (Figure 3d) as well as Stage 2.1 quartz–molybdenite–chalcopyrite veins and Stage 1 barren quartz veins (Figure 3e). Notably, magnetite is absent in Stage 2 veins. Chalcopyrite and molybdenite coexist in Stage 2.1, but Stage 2.2 is characterized by abundant molybdenite without chalcopyrite.
Stage 3 veins occur mainly in shallow and peripheral parts of the deposit. These include quartz–pyrite (Figure 3c), quartz–pyrite–sphalerite (Figure 3f), quartz–pyrite–sphalerite–galena (Figure 3g), and quartz–sphalerite–galena veins (Figure 3i). This stage marks the introduction of Pb–Zn mineralization. Stage 3 quartz–pyrite–sphalerite veins crosscut both Stage 2.1 quartz–molybdenite–chalcopyrite veins (Figure 3f) and Stage 2.2 quartz–molybdenite veins (Figure 3g). Chalcopyrite occurs as exsolved droplets within sphalerite (Figure 4f), and sphalerite and galena replace pyrite along margins and fractures (Figure 4h). Pyrite hosts inclusions of chalcopyrite and galena (Figure 4i).
Stage 4 represents the demise of hydrothermal activity, featuring quartz, fluorite, calcite, and minor fine-grained pyrite. Stage 4 quartz–pyrite veins crosscut Stage 2.2 quartz–molybdenite veins (Figure 3h), and Stage 3 quartz–sphalerite–galena veins are cut by Stage 4 quartz–pyrite–fluorite–calcite veins (Figure 3i).

3. Sampling and Analytical Methods

3.1. Samples

A suite of sixty-four typical samples was systematically acquired from surface outcrops and drillholes for this investigation, with sample locations depicted in Figure 2. The collection comprises five granite porphyry samples, seventeen pyrite specimens, and forty-two quartz samples. All five granite porphyry samples (CJG-GP-1 to CJG-GP-5), selected from the unweathered section, were utilized for whole-rock Pb isotope analysis. Eight pyrite samples (CJG-7, CJG-9, CJG-11, CJG-12, CJG-21, CJG-24, CJG-26, and CJG-28) were analyzed for in situ S and Pb isotopic compositions. An additional nine pyrite samples (CJG-6, CJG-8, CJG-10, CJG-13, CJG-14, CJG-22, CJG-23, CJG-27, and CJG-29) were subjected to He–Ar isotope analysis. Quartz samples were obtained from veins representing all mineralization stages, including eight from Stage 1 quartz(–K-feldspar–magnetite) veins, ten from Stage 2.1 quartz–molybdenite–chalcopyrite(–pyrite) veins, ten from Stage 2.2 quartz–molybdenite(–pyrite) veins, eight from Stage 3 quartz–pyrite(–galena–sphalerite) veins, and six from Stage 4 quartz–pyrite veins. Among these, ten representative quartz samples—two from each mineralization stage (CJG-Q-1 and CJG-Q-2 from Stage 1; CJG-Q-3 and CJG-Q-4 from Stage 2.1; CJG-Q-5 and CJG-Q-6 from Stage 2.2; CJG-Q-7 and CJG-Q-8 from Stage 3; CJG-Q-9 and CJG-Q-10 from Stage 4)—were analyzed for H–O isotopes. The remaining quartz samples from all stages were used for FI petrography and microthermometry. A total of forty doubly polished thin sections (~200 μm thickness) were prepared from quartz samples for FI study.

3.2. FIs Microthermometry

927 FIs from 448 FIAs in 15 double-polished sections prepared from quartz samples of four stages were measured. Microthermometric measurements of FIs were performed using a Linkam THMS 600 heating–freezing system (Linkam Scientific Instruments Ltd., Tadworth, UK) mounted on a Zeiss microscope (Carl Zeiss AG, Oberkochen, Germany) at the IGGCAS, with an operational temperature range of −195 °C to +600 °C. The instrument was calibrated using synthetic FIs supplied by FLUID INC. Calibration references included the ice melting point of pure water (0 °C) and the critical point of water (374.1 °C). The microthermometric measurements were conducted by first cooling the FIs until they were completely frozen, followed by gradual heating to record key phase transition temperatures. Temperature measurement accuracies are ±0.2 °C during cooling, ±0.2 °C in the 0–100 °C interval, and ±2 °C between 100 °C and 500 °C. Heating rates were carefully controlled at 0.1 °C/min near freezing points and 0.2 °C/min approaching homogenization temperatures to accurately document phase transitions. Three key phase transition temperatures were recorded: halite dissolution temperature (TmH), final ice-melting temperature (Tmice), and total homogenization temperature (Thtal). Salinities of the H2O–NaCl systems were computed from Tmice and TmH using the equations established by [20].

3.3. Pyrite In Situ S Isotope Analyses

Sulfur isotope composition of pyrite was determined by in situ analysis using a Neptune Plus multi-collector inductively coupled plasma mass spectrometer (MC-ICP-MS) (Thermo Fisher Scientific, Bremen, Germany) equipped with a resolution SE 193 nm Ar–F excimer laser ablation system (Applied Spectra Inc., West Sacramento, CA, USA) at Beijing Createch Testing Technology Co., Ltd., Beijing, China. A standard-sample bracketing method was employed to correct for instrumental mass fractionation. To avoid the matrix effect, a pyrite standard PPP-1 was chosen as the reference material for correcting the natural pyrite samples [21]. Analytical conditions and procedures followed those outlined in [22]. Laser ablation was performed with a fluence of 4 J/cm2, repetition rate of 6 Hz, and spot sizes ranging from 24 to 38 μm. Each analysis included a 20 s background acquisition, 40 s of sample ablation and signal collection, and a 40 s washout period. The δ34S values were calibrated using the standard-sample bracketing method, with an analytical precision (2σ) better than 0.2‰.

3.4. Pyrite In Situ Pb Isotope Analyses

In situ Pb isotope analyses of pyrite were conducted using a Neptune Plus MC-ICP-MS (Thermo Fisher Scientific, Bremen, Germany) coupled with a Geolas HD excimer ArF laser ablation system (Coherent, Germany) at Wuhan Sample Solution Analytical Technology Co., Ltd., Wuhan, China. The mass fractionation of Pb isotopes was corrected by 205Tl/203Tl with the exponential law. Note that the optimized values of 205Tl/203Tl, which were calibrated from measuring two Pb isotope standards MASS-1 (USGS) and Sph-HYLM (sphalerite, in-house standard), replaced the natural Tl isotopic composition for the mass fractionation correction of Pb isotopes. The 202Hg signal was used to correct the remaining 204Hg interference on 204Pb, using the natural 202Hg/204Hg ratio (0.2301). In addition, the mass fractionation of 204Hg/202Hg was corrected by the 205Tl/203Tl normalization. In this case, we assumed identical mass fractionation factors for 204Hg/202Hg and 205Tl/203Tl. Detailed analytical procedures follow those reported by [23]. Laser spot diameters were adjusted between 44 and 90 μm based on real-time Pb signal intensity. Ablation was carried out at a pulse frequency of 4–10 Hz with a constant fluence of approximately 5 J/cm2. Each analysis comprised 30 s of background measurement, 50 s of sample ablation and signal acquisition, and a 40 s washout period to minimize memory effects. Analytical accuracy, relative to solution values obtained by MC-ICP-MS, was better than 0.2‰ for 206Pb/204Pb, 207Pb/204Pb, 208Pb/204Pb ratios, with typical external precision (2σ) of 0.4‰.

3.5. Granite Porphyry Whole-Rock Pb Isotope Analyses

Whole-rock Pb isotopic analyses were conducted at the State Key Laboratory of Isotope Geochemistry, Guangzhou Institute of Geochemistry, Chinese Academy of Sciences. An ISOPROBE-T thermal ionization mass spectrometer (Thermo Fisher Scientific, Waltham, MA, USA) was employed for isotopic measurements. Analytical accuracy exceeded 0.005% (2σ) for 207Pb/206Pb and 208Pb/206Pb ratios using 1 μg sample loads. All Pb isotope ratios are reported relative to the NBS-981 standard reference values [24]: 208Pb/204Pb of 36.673 ± 0.033, 207Pb/204Pb of 15.486 ± 0.012, and 206Pb/204Pb of 16.934 ± 0.007.

3.6. He-Ar Isotope Analyses

Helium and argon isotopic compositions of FIs in pyrite were measured using a Nu Instruments Noblesse HR mass spectrometer (Nu Instruments, Wrexham, UK) at the Institute of Geology and Geophysics, Chinese Academy of Sciences (IGGCAS), Beijing. The core measures to correct for fractionation and ensure data accuracy in He-Ar isotope analysis include: rigorous sample pre-treatment to remove surface contamination; employing step-heating extraction to distinguish gases from different reservoirs; efficient gas purification using cold traps and getters, which is particularly critical for removing sulfide gases produced during pyrite heating; instrumental mass discrimination correction using standard gases of known isotopic ratios; execution of complete procedural and sample blank subtractions to eliminate background; and mathematical correction for atmospheric argon interference. The Noblesse instrument is a single-focusing mass spectrometer featuring a 24 cm radius and 75° magnet, with a helium sensitivity exceeding 10−4 A Torr−1 and an absolute detection limit of approximately 5 × 10⁴ atoms of 3He. 3He was analyzed in pulse-counting mode with the central electron multiplier, while 4He was measured using a Faraday cup. The isotopes 40Ar, 38Ar, and 36Ar were simultaneously quantified using three central electron multipliers. Atmospheric standard values were assumed as 1.4 × 10⁻⁶ for 3He/4He and 295.5 for 40Ar/36Ar. The average 3He/4He ratios from calibration analyses showed uncertainties better than 5%, which were propagated into sample ratio calculations and subsequent corrections. Instrument operation and data reduction followed the methodology of [25].

3.7. H-O Isotope Analyses

Hydrogen and oxygen isotope measurements were performed on a MAT253 mass spectrometer (Thermo Fisher Scientific, Bremen, Germany) at the Beijing Research Institute of Uranium Geology, Beijing, China. The δD analyzed in this study was sourced entirely and directly from the water liberated from primary FIs within the quartz samples. Analytical precision for δD and δ18Oquartz values is better than ±2‰ and ±0.2‰, respectively. The fluid oxygen isotope composition (δ18Ofluid) was calculated using the fractionation equation 1000lnαquartz = 3.38 × 10⁶T−2 − 3.40 [26], where T represents temperature in Kelvin. The mean homogenization temperature with uncertainties of FIs from each mineralization stage was applied in the calculation.

4. Results

4.1. FIs Petrography

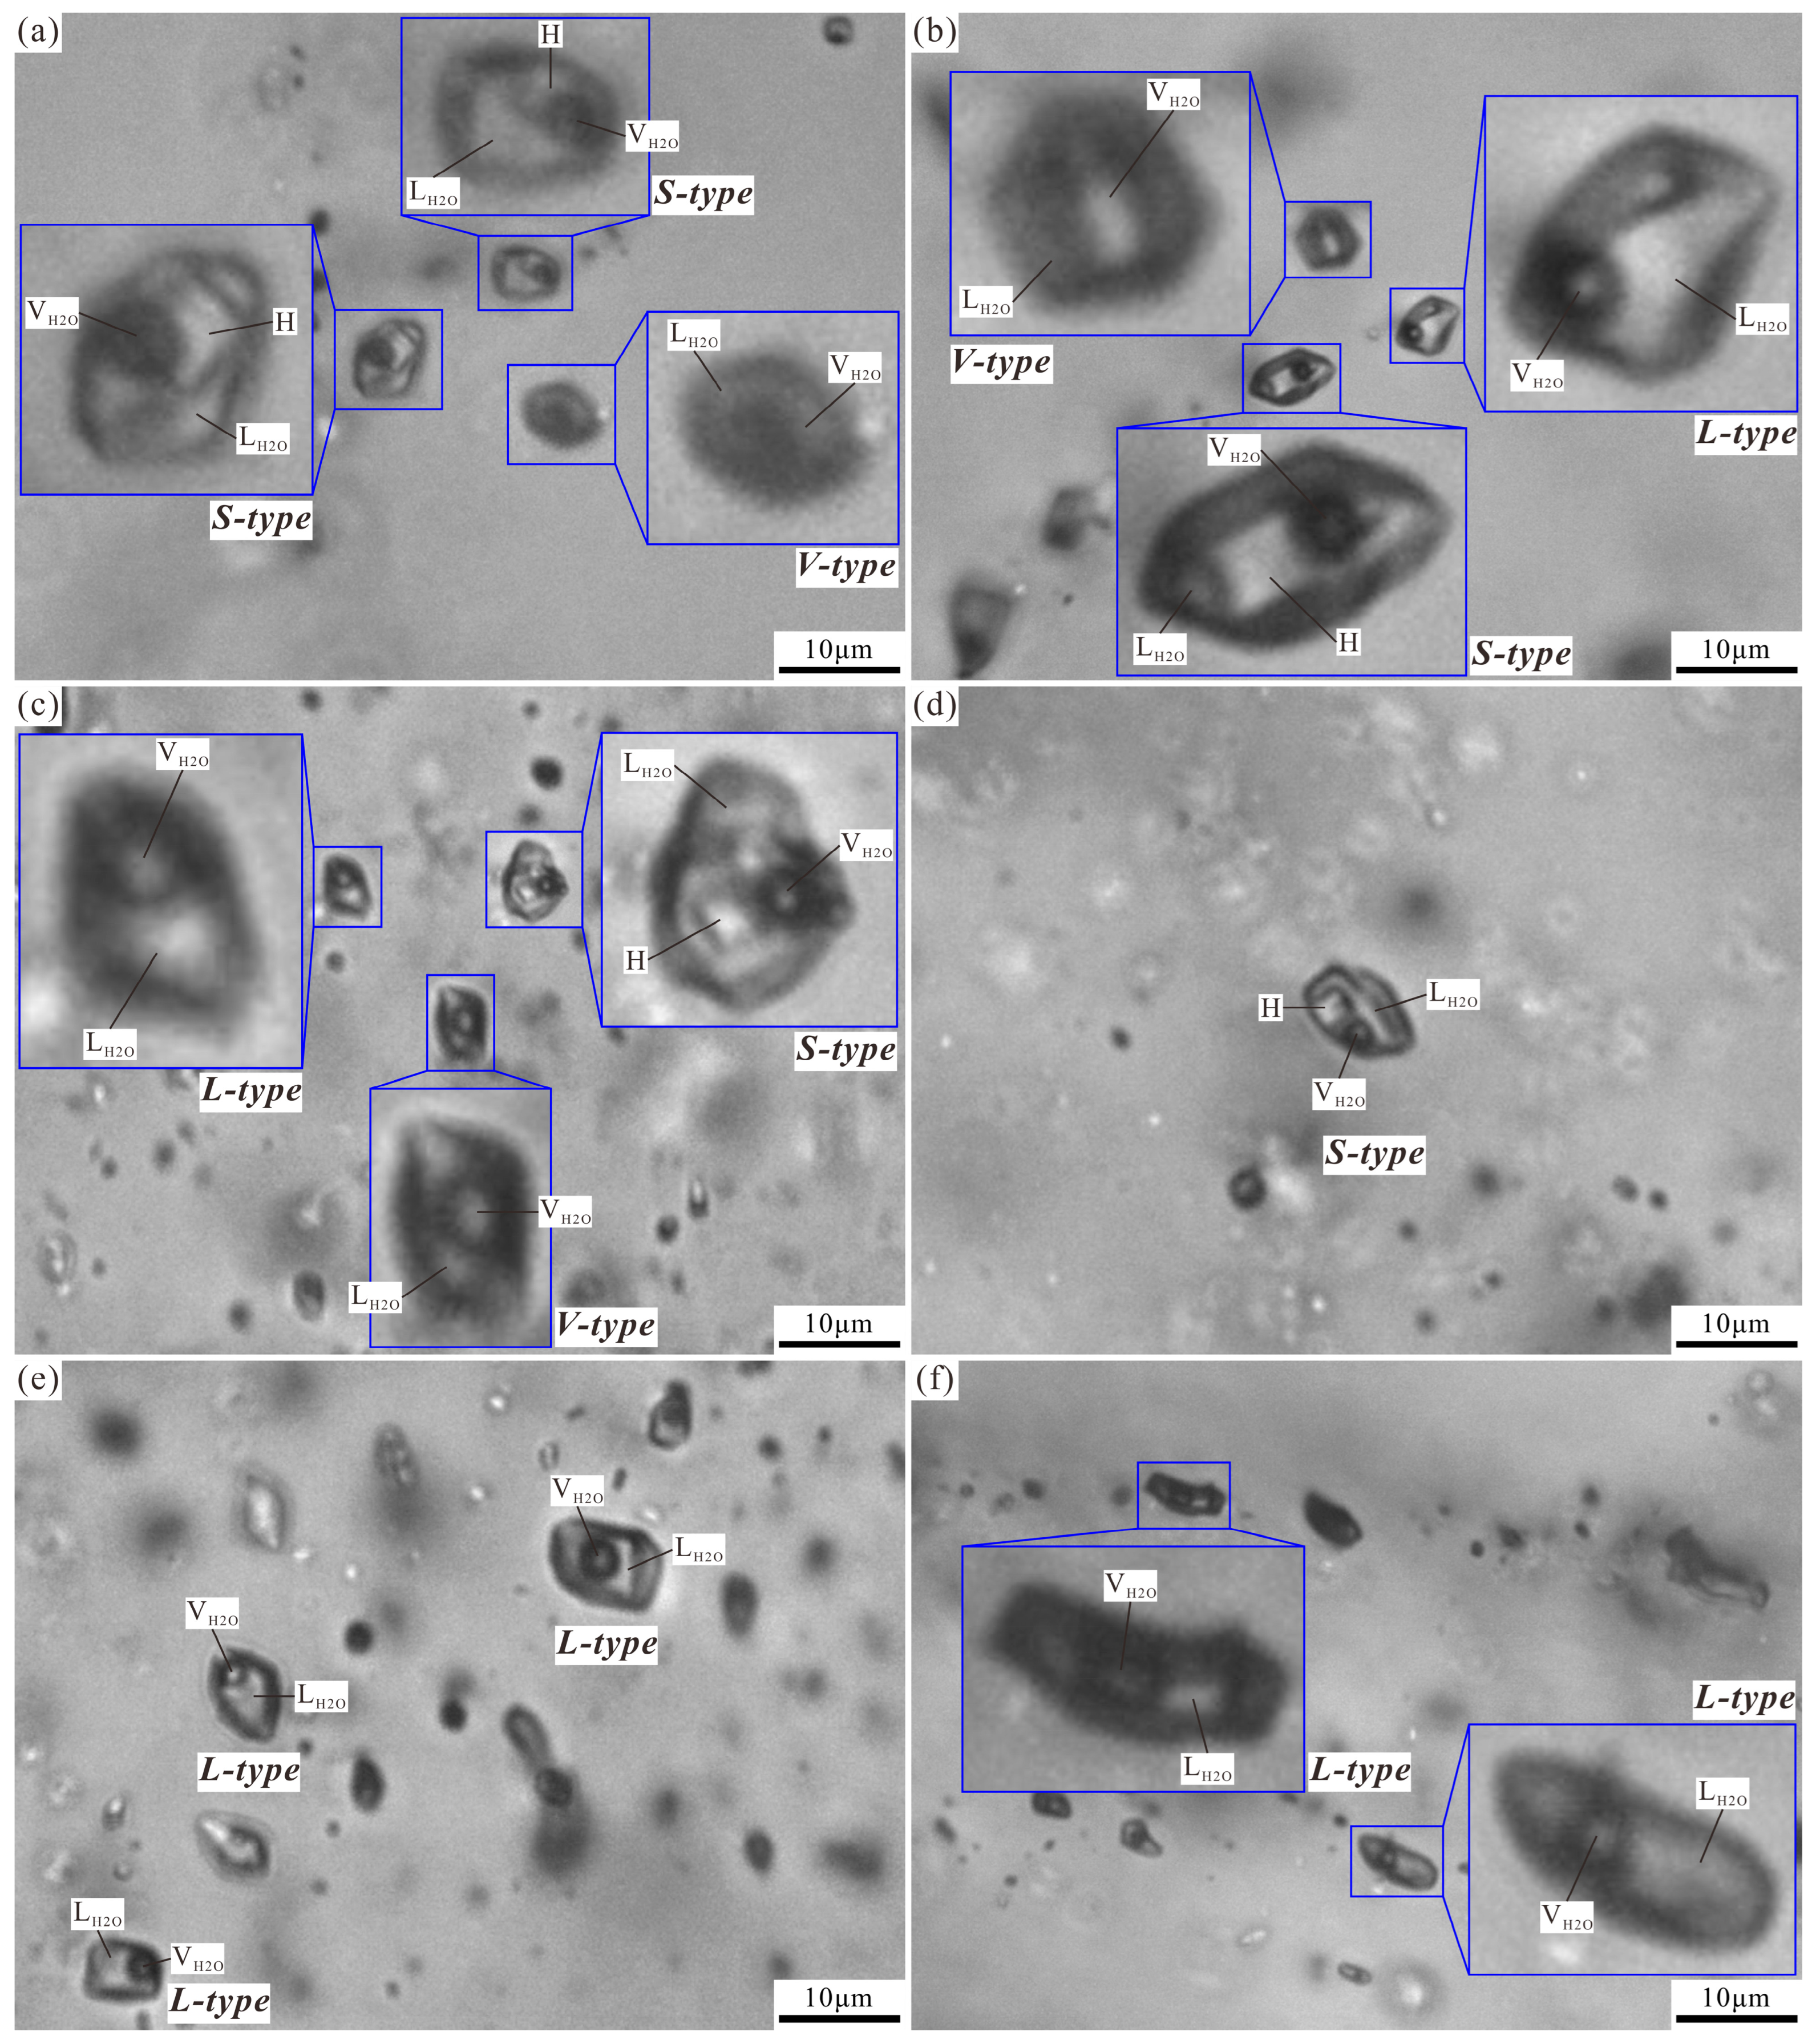
FIs were classified as primary, pseudo-secondary, or secondary following the criteria established by [27] and [28]. All interpretations are based on FI assemblages (FIAs) as defined by [28]. In euhedral quartz grains, FIs aligned along or within growth zones are relatively uncommon and typically below the resolution required for detailed analysis (<5 μm). Most measurable quartz-hosted FIs occur as isolated, clustered, or randomly distributed inclusions (Figure 7). Following the methodology of [29] and [30], FIs situated away from visible fractures are interpreted as primary. Based on phase proportions at room temperature and phase behavior during thermal cycling [31], three main types of FIs were identified: liquid-rich two-phase (L-type), vapor-rich two-phase (V-type), and halite-bearing three-phase (S-type) inclusions.
L-type FIs consist of an aqueous liquid and a vapor bubble at room temperature, with vapor volume ratios [VH2O/(VH2O + LH2O)] generally between 10–35 vol% (always <50 vol%; Figure 7). These inclusions, typically 5–10 μm in diameter, exhibit varied morphologies including irregular, rounded, elliptical, and negative-crystal forms. They occur as isolated or clustered inclusions in quartz from all paragenetic stages. In Stages 1 and 2, L-type FIs coexist with V-type and S-type inclusions within the same FIA.
V-type FIs contain a dominant vapor phase and a minor aqueous liquid at room temperature, with vapor volume ratios typically ranging from 65–85 vol% (>50 vol%; Figure 7). These inclusions, ranging from 5 to 9 μm, commonly display elliptical, spherical, or negative-crystal shapes. They are primarily observed in quartz from Stages 1 and 2.
S-type FIs are featured with the presence of a halite daughter mineral alongside a vapor bubble occupying 5–30 vol% of the inclusion volume. These inclusions, which range from 5 to 12 μm in size, typically show negative-crystal morphology (Figure 7). S-type inclusions occur exclusively in Stages 1 and 2, being absent in Stage 3 and later mineralization.

4.2. FIs Microthermometry

Microthermometric analysis in this study was restricted to primary FIs to minimize potential misinterpretation caused by post-entrapment modifications. The validity of microthermometric data was evaluated using the FIA concept [28]. Spatially associated inclusions exhibiting significant discrepancies in homogenization temperatures (>15 °C) were excluded from FIAs, as such variations likely result from stretching, necking, or heterogeneous entrapment [29]. Isolated inclusions were considered reliable unless their thermometric behavior substantially deviated from neighboring inclusions [30] (Figure 7d). Clusters containing a single inclusion type with homogenization temperature variations within 15 °C are interpreted to represent homogeneous fluid entrapment, precluding significant post-entrapment modification or heterogeneous trapping. For such clusters, the average values were used for subsequent interpretation [29]. When clusters contained different inclusion types with similar homogenization temperature ranges (variation < 15 °C) but different homogenization modes, they were classified as boiling assemblages, with average values for each type used to represent the entire FIA.
The results of FIs microthermometry are shown in Table S1 and Figure 8 and Figure 9. Following recent recommendations on FI best practices [32,33], we acknowledge that quartz-hosted inclusions frequently undergo post-entrapment modifications that can alter their original fluid properties. Well-preserved inclusions typically occur in clearly defined trails or growth zones, display consistent phase proportions, and yield tightly clustered microthermometric data. However, negative crystal shapes alone do not guarantee preservation of original properties. Randomly distributed clusters often represent disrupted secondary trails rather than primary inclusions, unless they follow specific growth patterns [32]. Post-entrapment modifications generally reduce inclusion volumes, resulting in steeper isochores, higher apparent densities, and lower homogenization temperatures. However, in magmatic–hydrothermal systems, water loss rarely exceeds 20%, suggesting that measured salinities generally approximate original values. In this study, inclusions showing evidence of post-entrapment modification (migration tracks, deformation, decrepitation halos, or stretching) were excluded from detailed analysis [27,34]. Consequently, while true homogenization temperatures were likely higher and true densities lower than measured values, salinities are considered largely unaffected. Therefore, our interpretation primarily relies on salinity data, with homogenization temperatures serving as reference values.
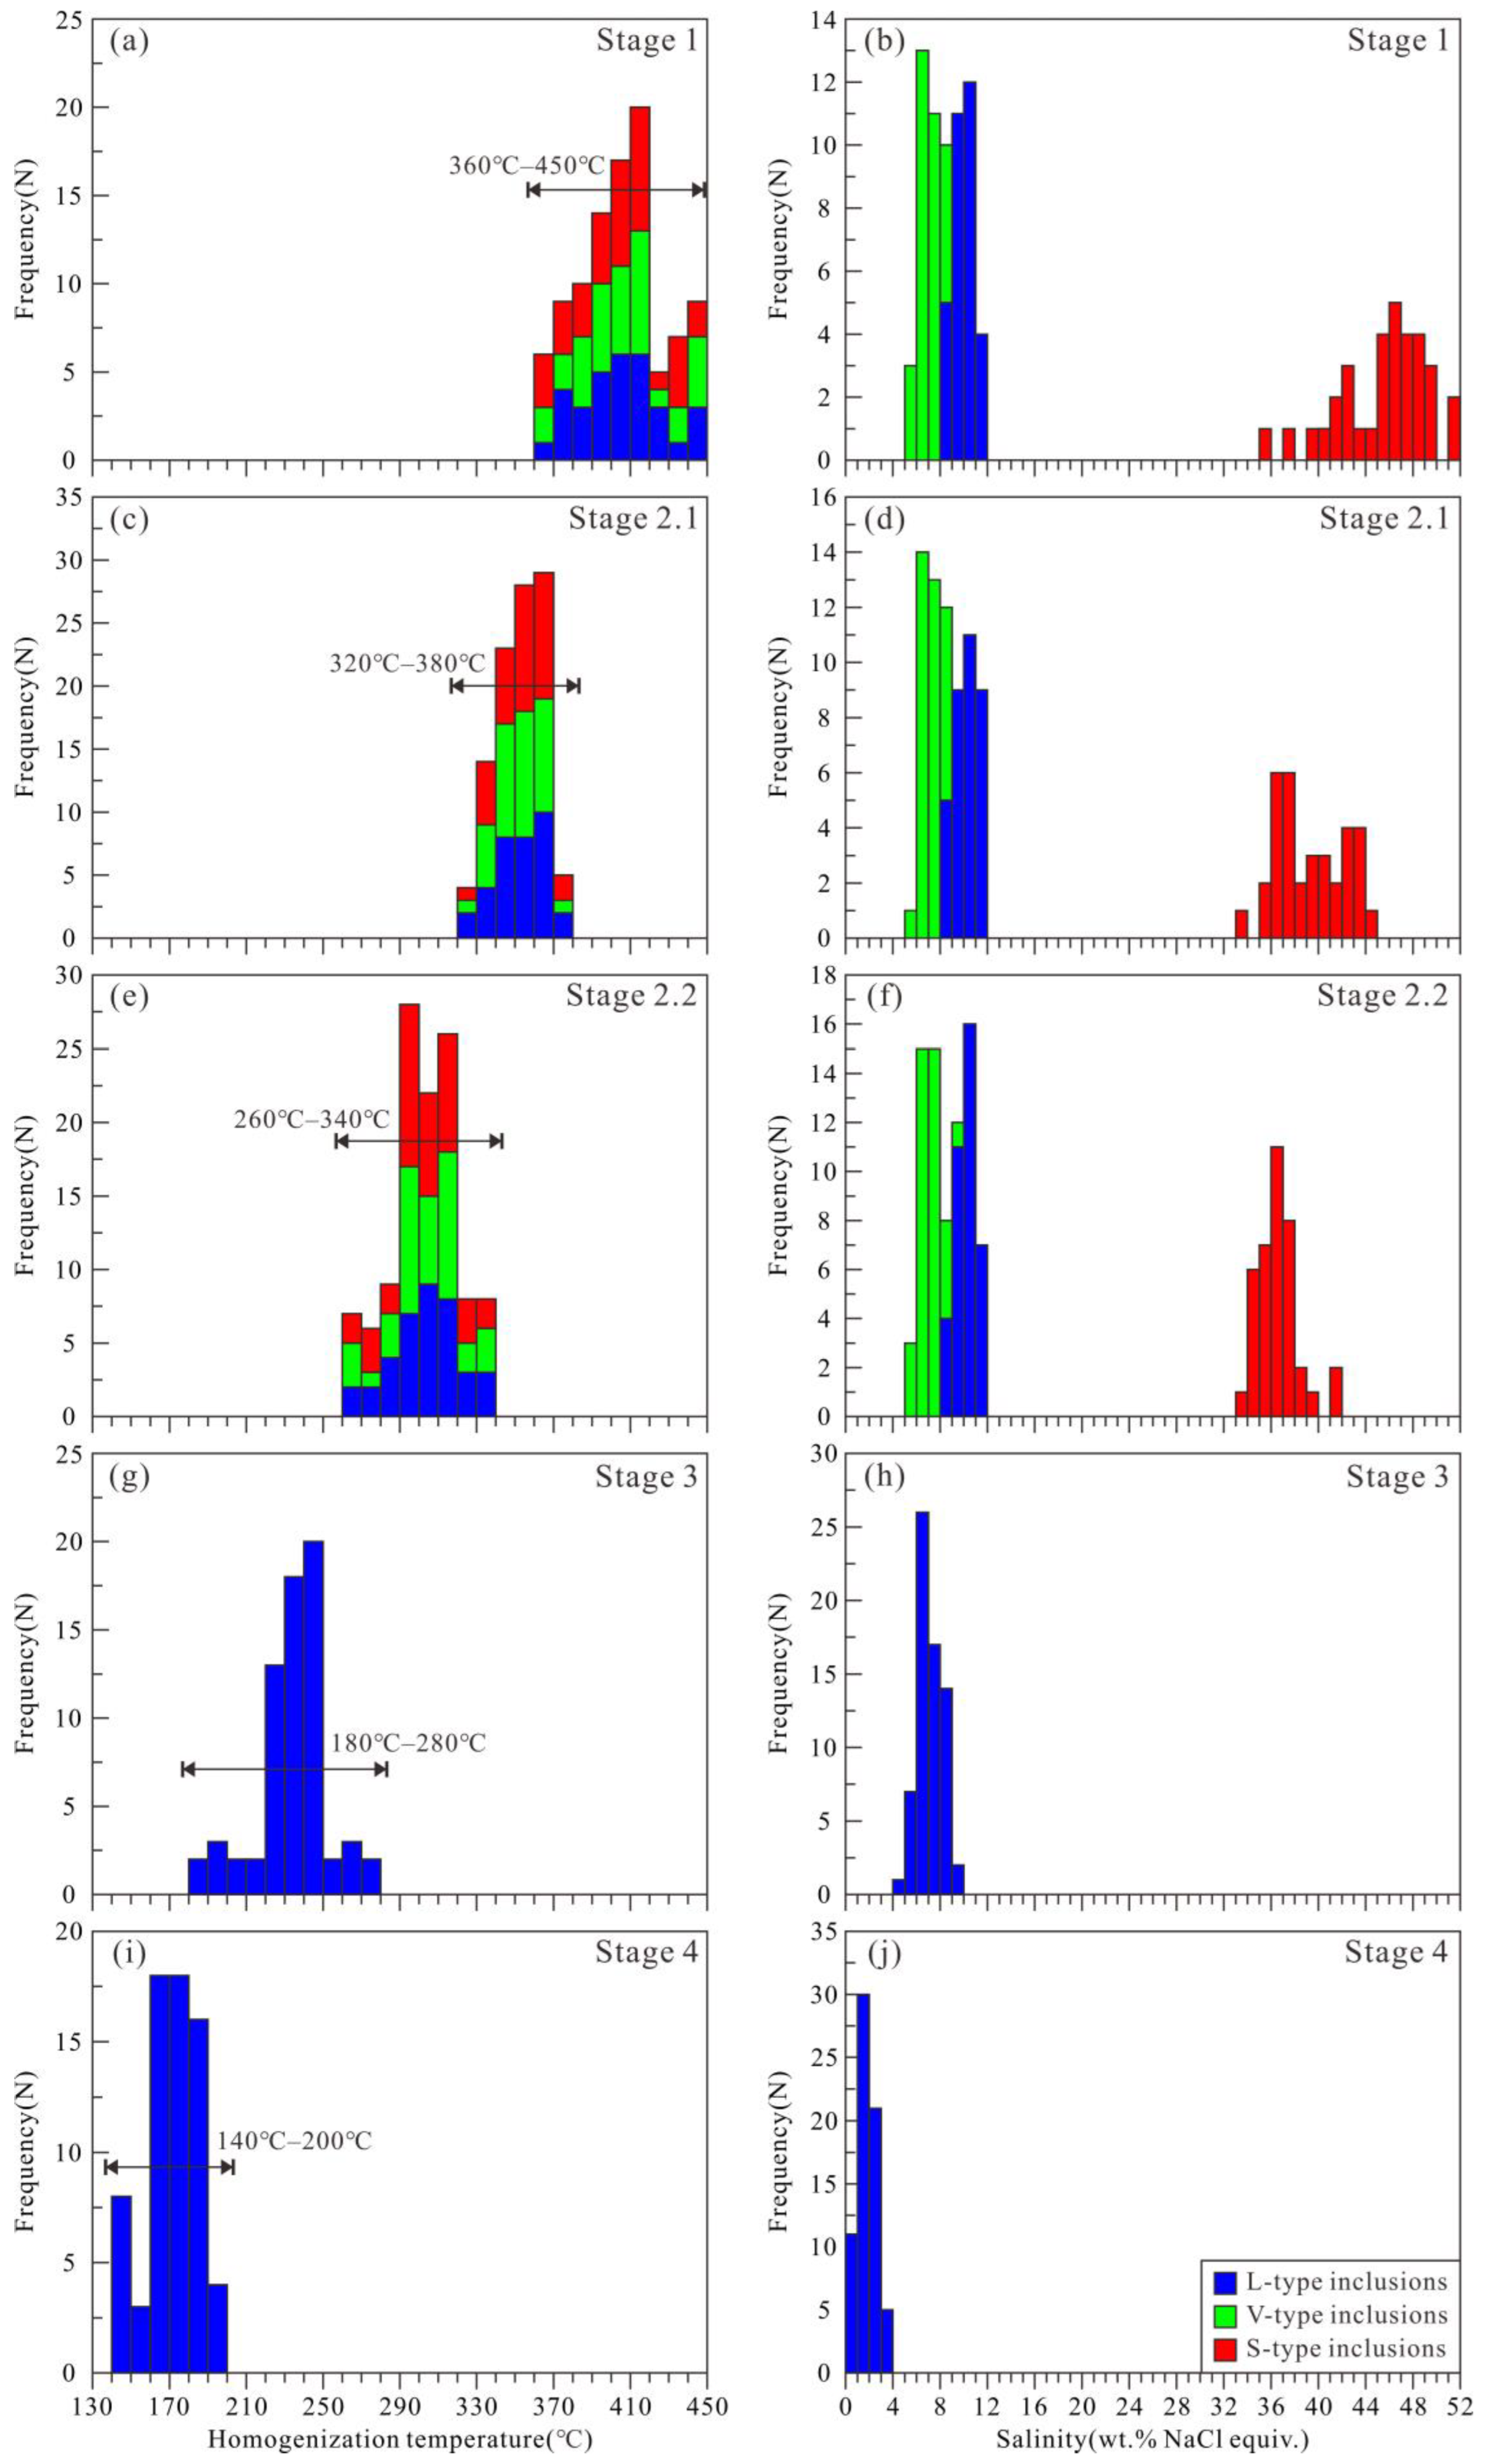
Stage 1 quartz veins contain L-, V-, and S-type inclusions. L-type inclusions homogenize to liquid at 366–447 °C with Tmice of −7.7 to −5.4 °C (8.4–11.3 wt.% NaCl equiv.). V-type inclusions homogenize to vapor at 366–444 °C with Tmice of −5.7 to −3.3 °C (5.3–8.7 wt.% NaCl equiv.). S-type inclusions homogenize at 364–444 °C via halite dissolution or vapor disappearance, with TmH of 262–432 °C (35.4–51.5 wt.% NaCl equiv.) (Figure 8a,b).
Stage 2.1 quartz veins contain all three inclusion types with similar salinities but lower homogenization temperatures than Stage 1. L-type inclusions homogenize at 323–373 °C with Tmice of −8.0 °C to −5.3 °C (8.2−11.7 wt.% NaCl equiv.). V-type inclusions homogenize to vapor at 327–377 °C and have Tmice of −5.8 °C to −3.3 °C (5.4–8.9 wt.% NaCl equiv.). S-type inclusions homogenize at 326–375 °C with TmH of 237–365 °C (33.9–44.5 wt.% NaCl equiv.) (Figure 8c,d). Stage 2.2 quartz veins show further temperature decreases. L-type inclusions homogenize at 264–334 °C with Tmice of −8.1 °C to −5.1 °C (8.0–11.8 wt.% NaCl equiv.). V-type inclusions homogenize to vapor at 268–336 °C and have Tmice of −5.9 °C to −3.2 °C (5.3–9.0 wt.% NaCl equiv.). S-type inclusions homogenize at 265–336 °C with TmH of 237–336 °C (33.8–41.9 wt.% NaCl equiv.) (Figure 8e,f).
Only L-type FIs occur in stage 3 quartz veins. Microthermometry reveals the Tmice of −6.0 °C to −2.7 °C (4.5–9.1 wt.% NaCl equiv.) and the Thtal of 185–274 °C (Figure 8g,h). The final homogenization is featured with the elimination of vapor bubbles.
L-type FIs are the unique type of FIs in stage 4 quartz(-calcite-fluorite-pyrite) veins, which have Tmice ranging from −2.4 °C to −0.2 °C, corresponding to salinities of 0.4–3.9 wt.% NaCl equiv. These FIs finally homogenize to the liquid phase at 144–196 °C (Figure 8i,j).

4.3. Pyrite In Situ S Isotopic Compositions

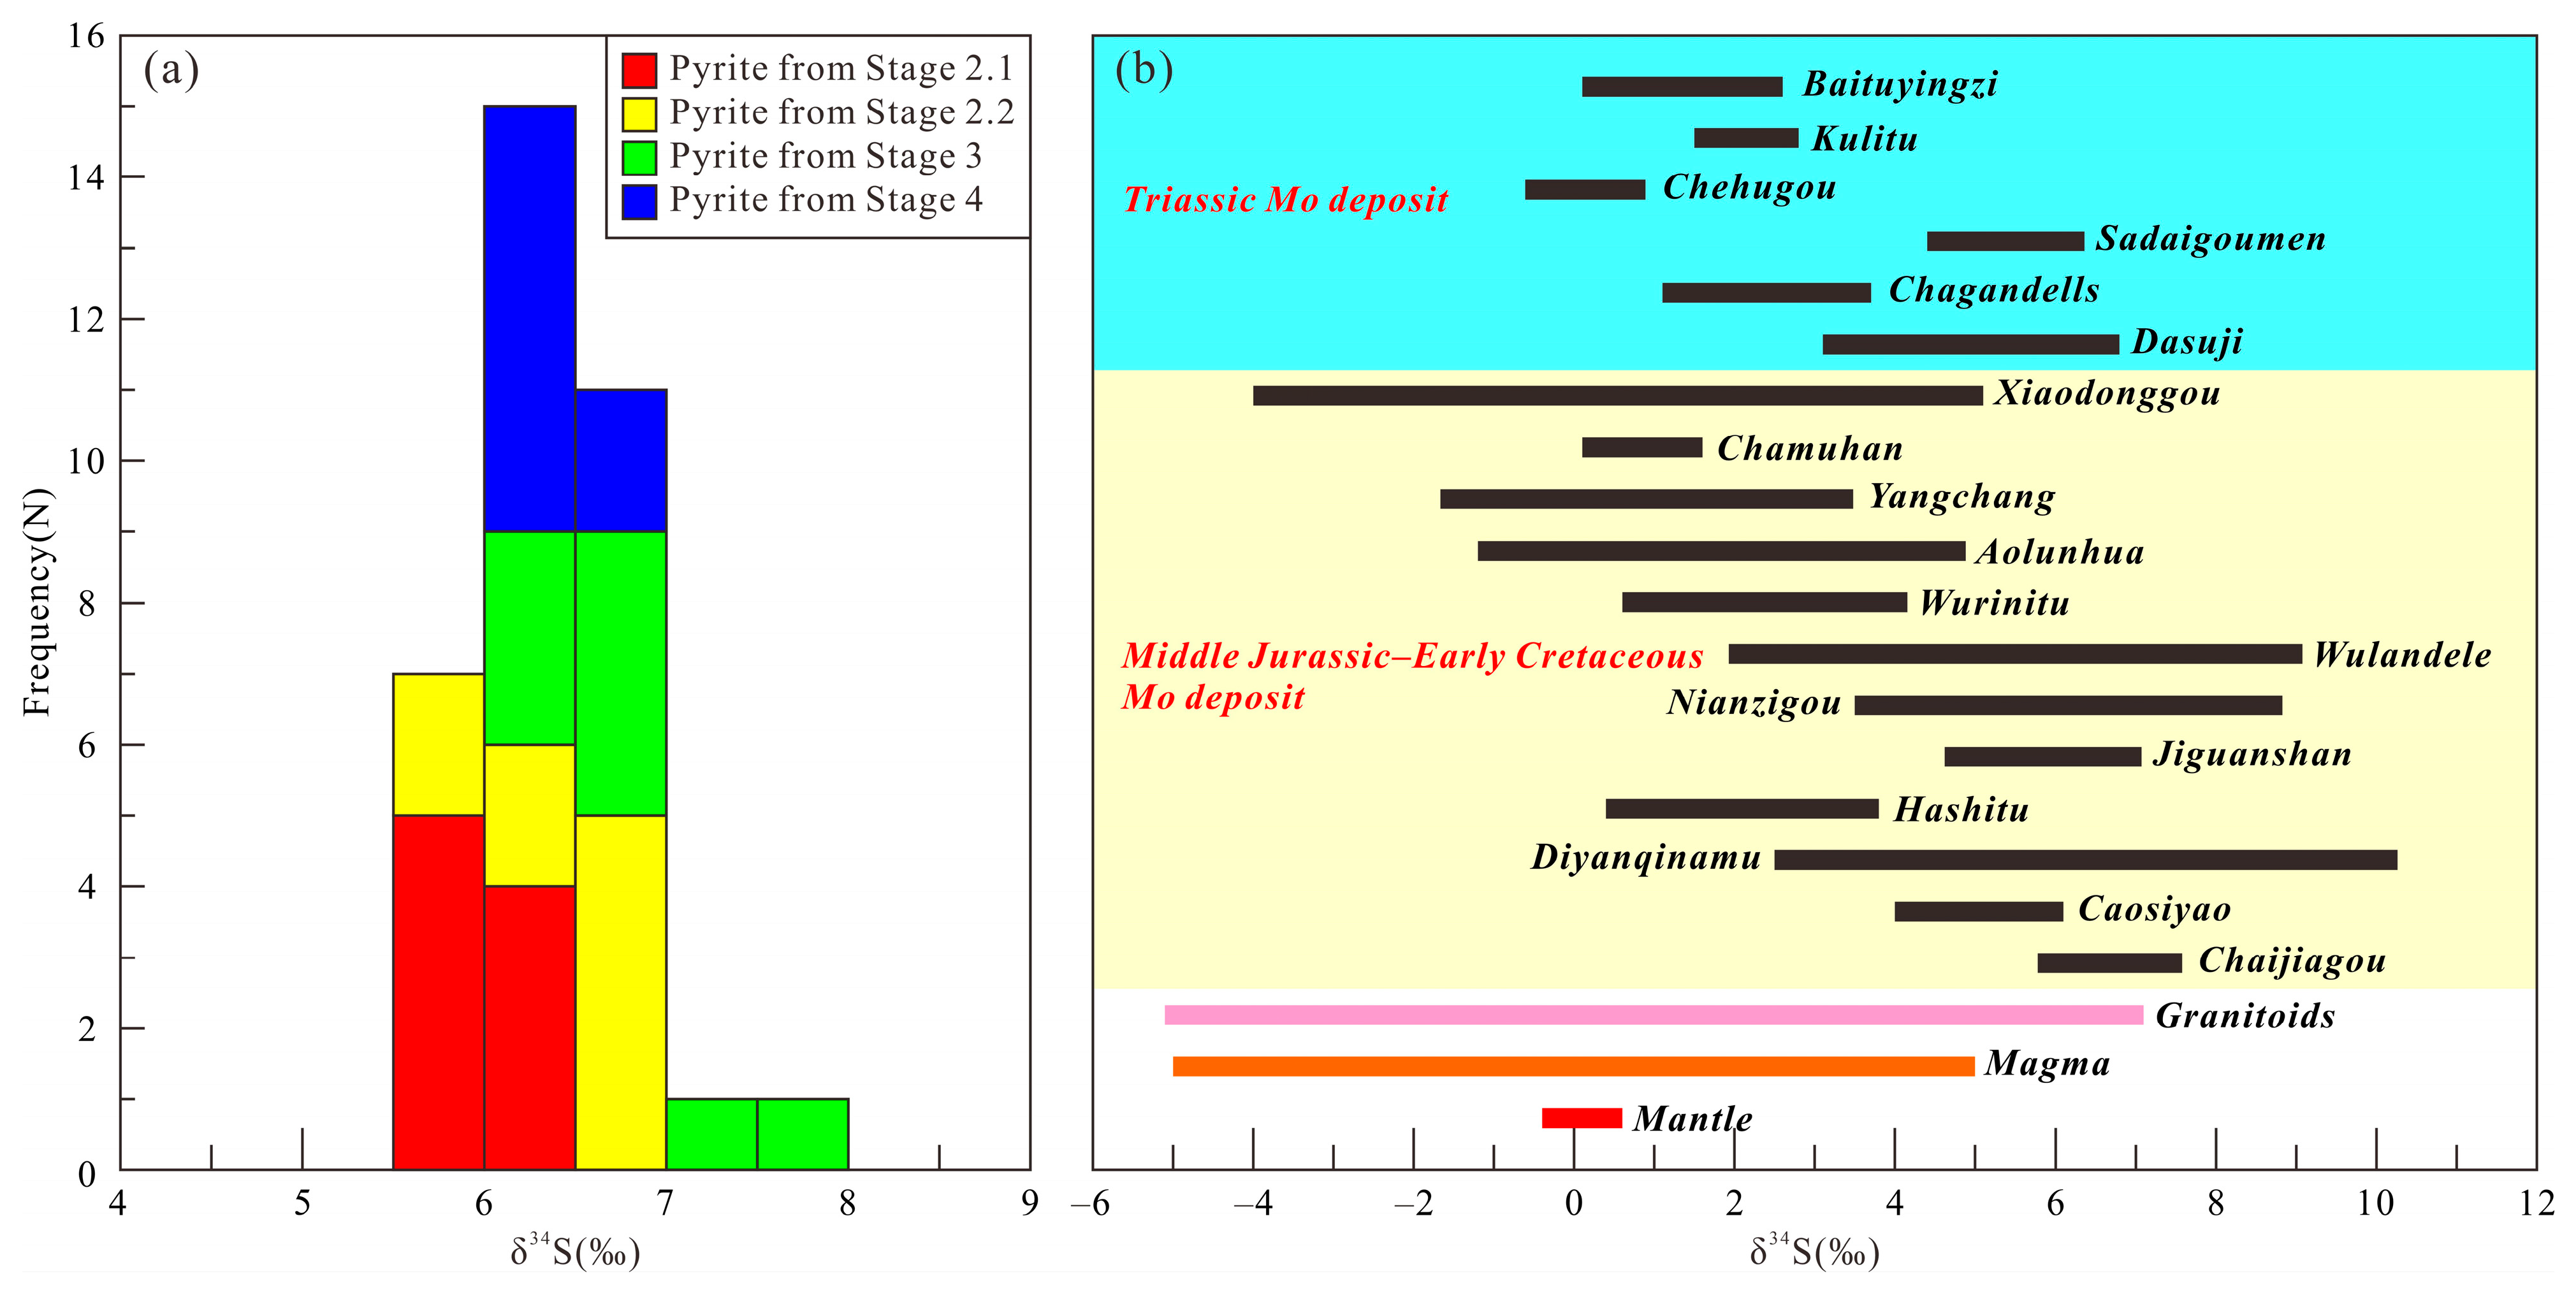
Sulfur isotope data for pyrite from various mineralization stages are provided in Table S2 and summarized in Figure 10. The δ34S values of pyrite from Stage 2.1 range between 5.78‰ and 6.10‰, with a mean of 5.93‰. Pyrite from Stage 2.2 exhibits δ34S values from 5.82‰ to 6.96‰ (mean = 6.45‰). For Stage 3 and Stage 4 pyrite, δ34S values vary from 6.16‰ to 7.58‰ (mean = 6.80‰) and 6.15‰ to 6.59‰ (mean = 6.34‰), respectively. Overall, the δ34S composition of pyrite across all stages spans a narrow interval from 5.78‰ to 7.58‰, averaging 6.38‰.

4.4. Pyrite and Granite Porphyry Pb Isotopic Compositions

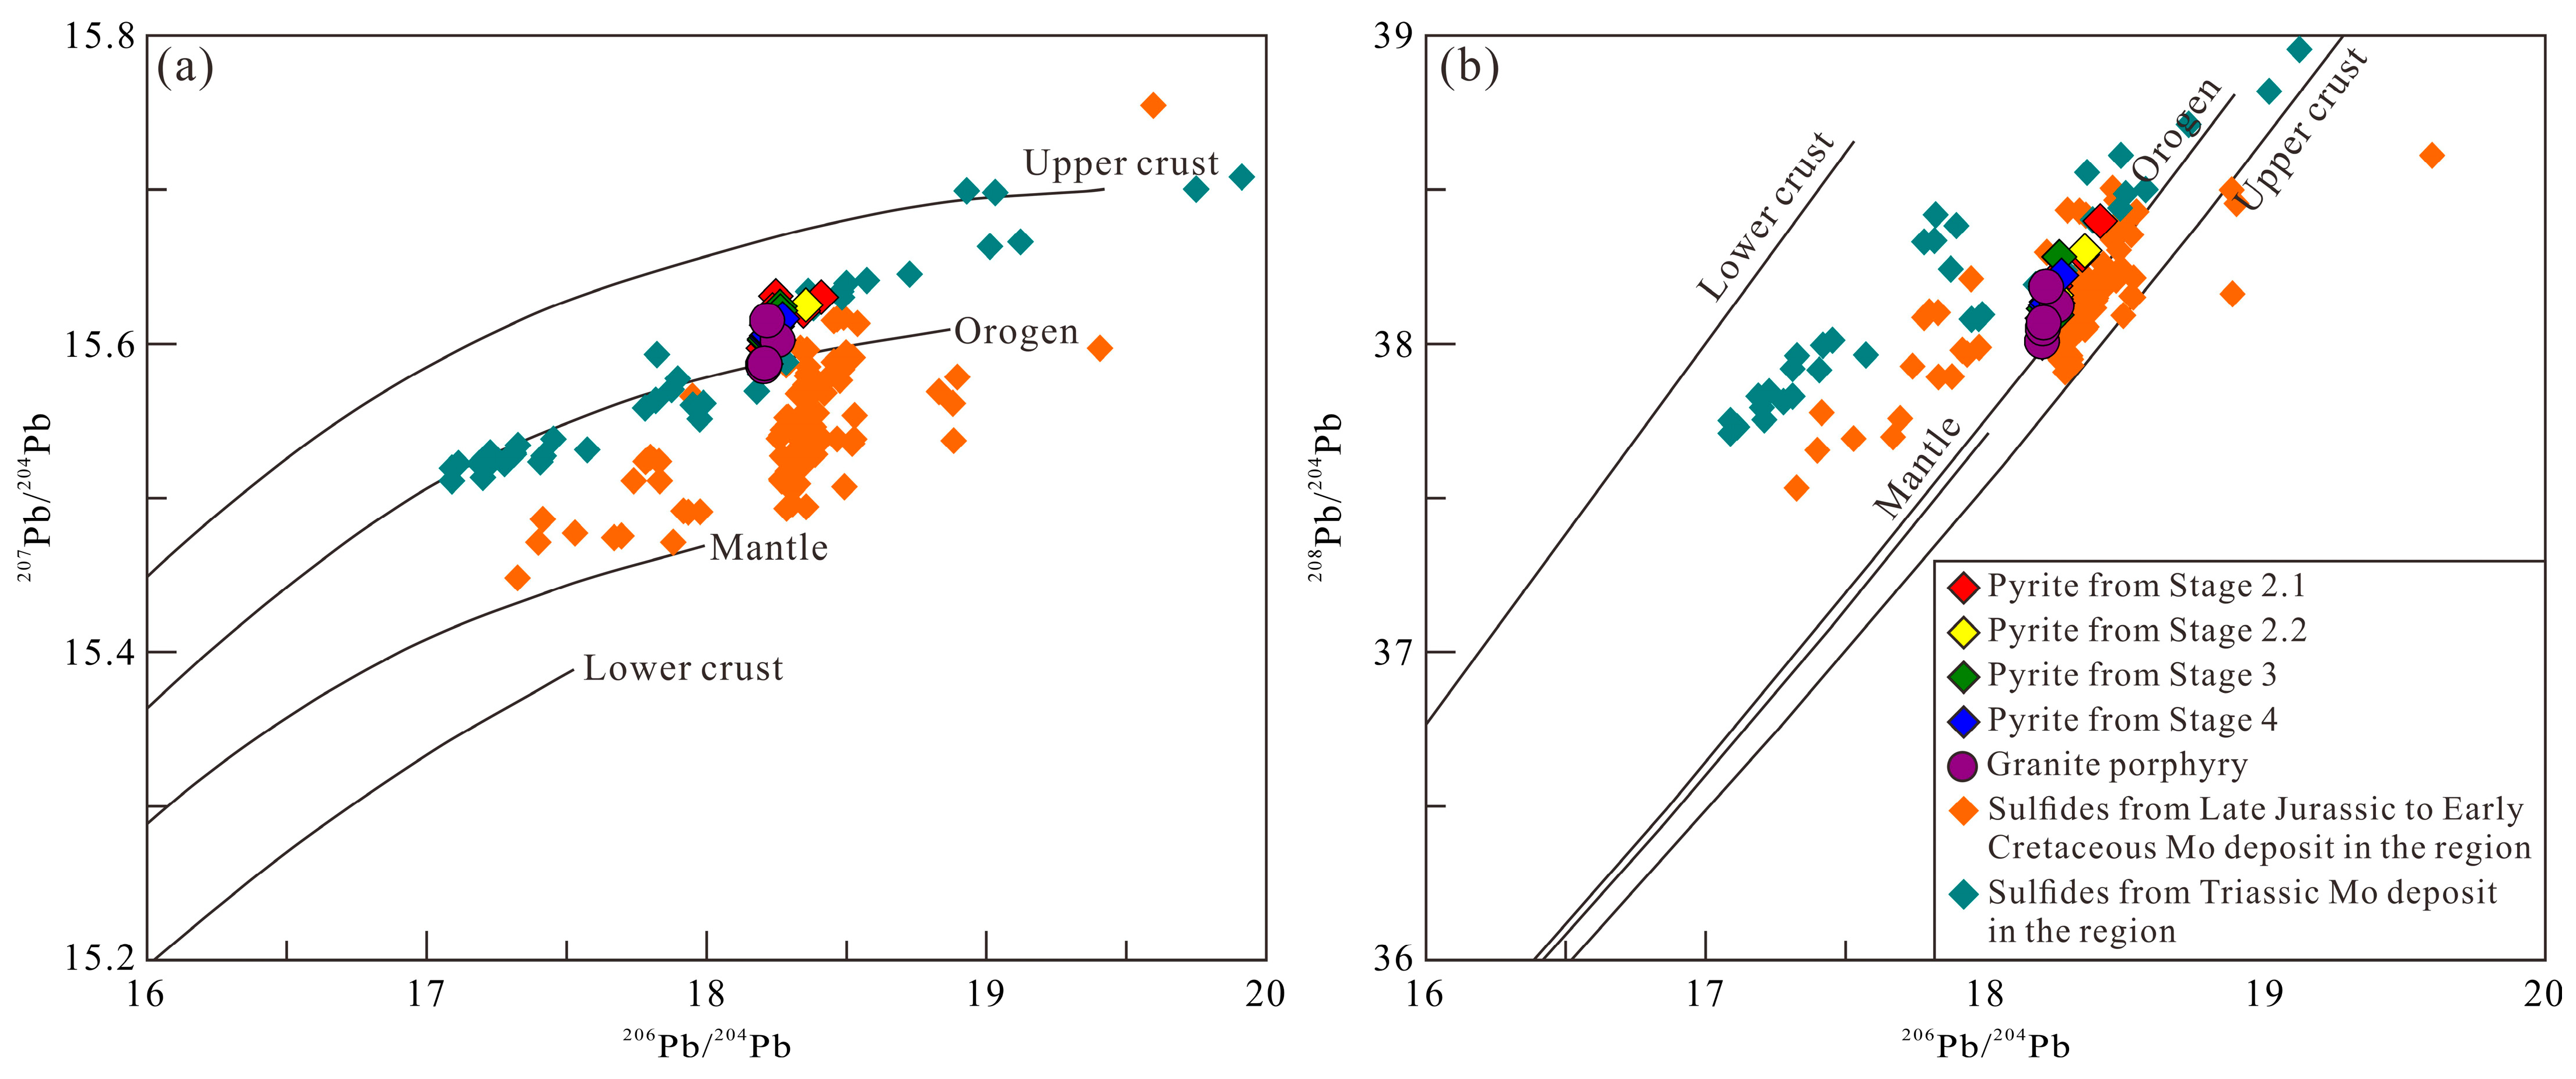
Lead isotope ratios for pyrite and the ore-bearing granite porphyry are compiled in Table S3 and graphically displayed in Figure 11. Pyrite from Stages 2.1, 2.2, 3, and 4 exhibits comparable Pb isotopic compositions, with overlapping ranges of 206Pb/204Pb (18.203–18.410), 207Pb/204Pb (15.586–15.631), and 208Pb/204Pb (38.002–38.398). The ore-bearing granite porphyry shows similar ratios, with 206Pb/204Pb = 18.203–18.255, 207Pb/204Pb = 15.585–15.615, and 208Pb/204Pb = 38.006–38.185.

4.5. He-Ar Isotopic Compositions

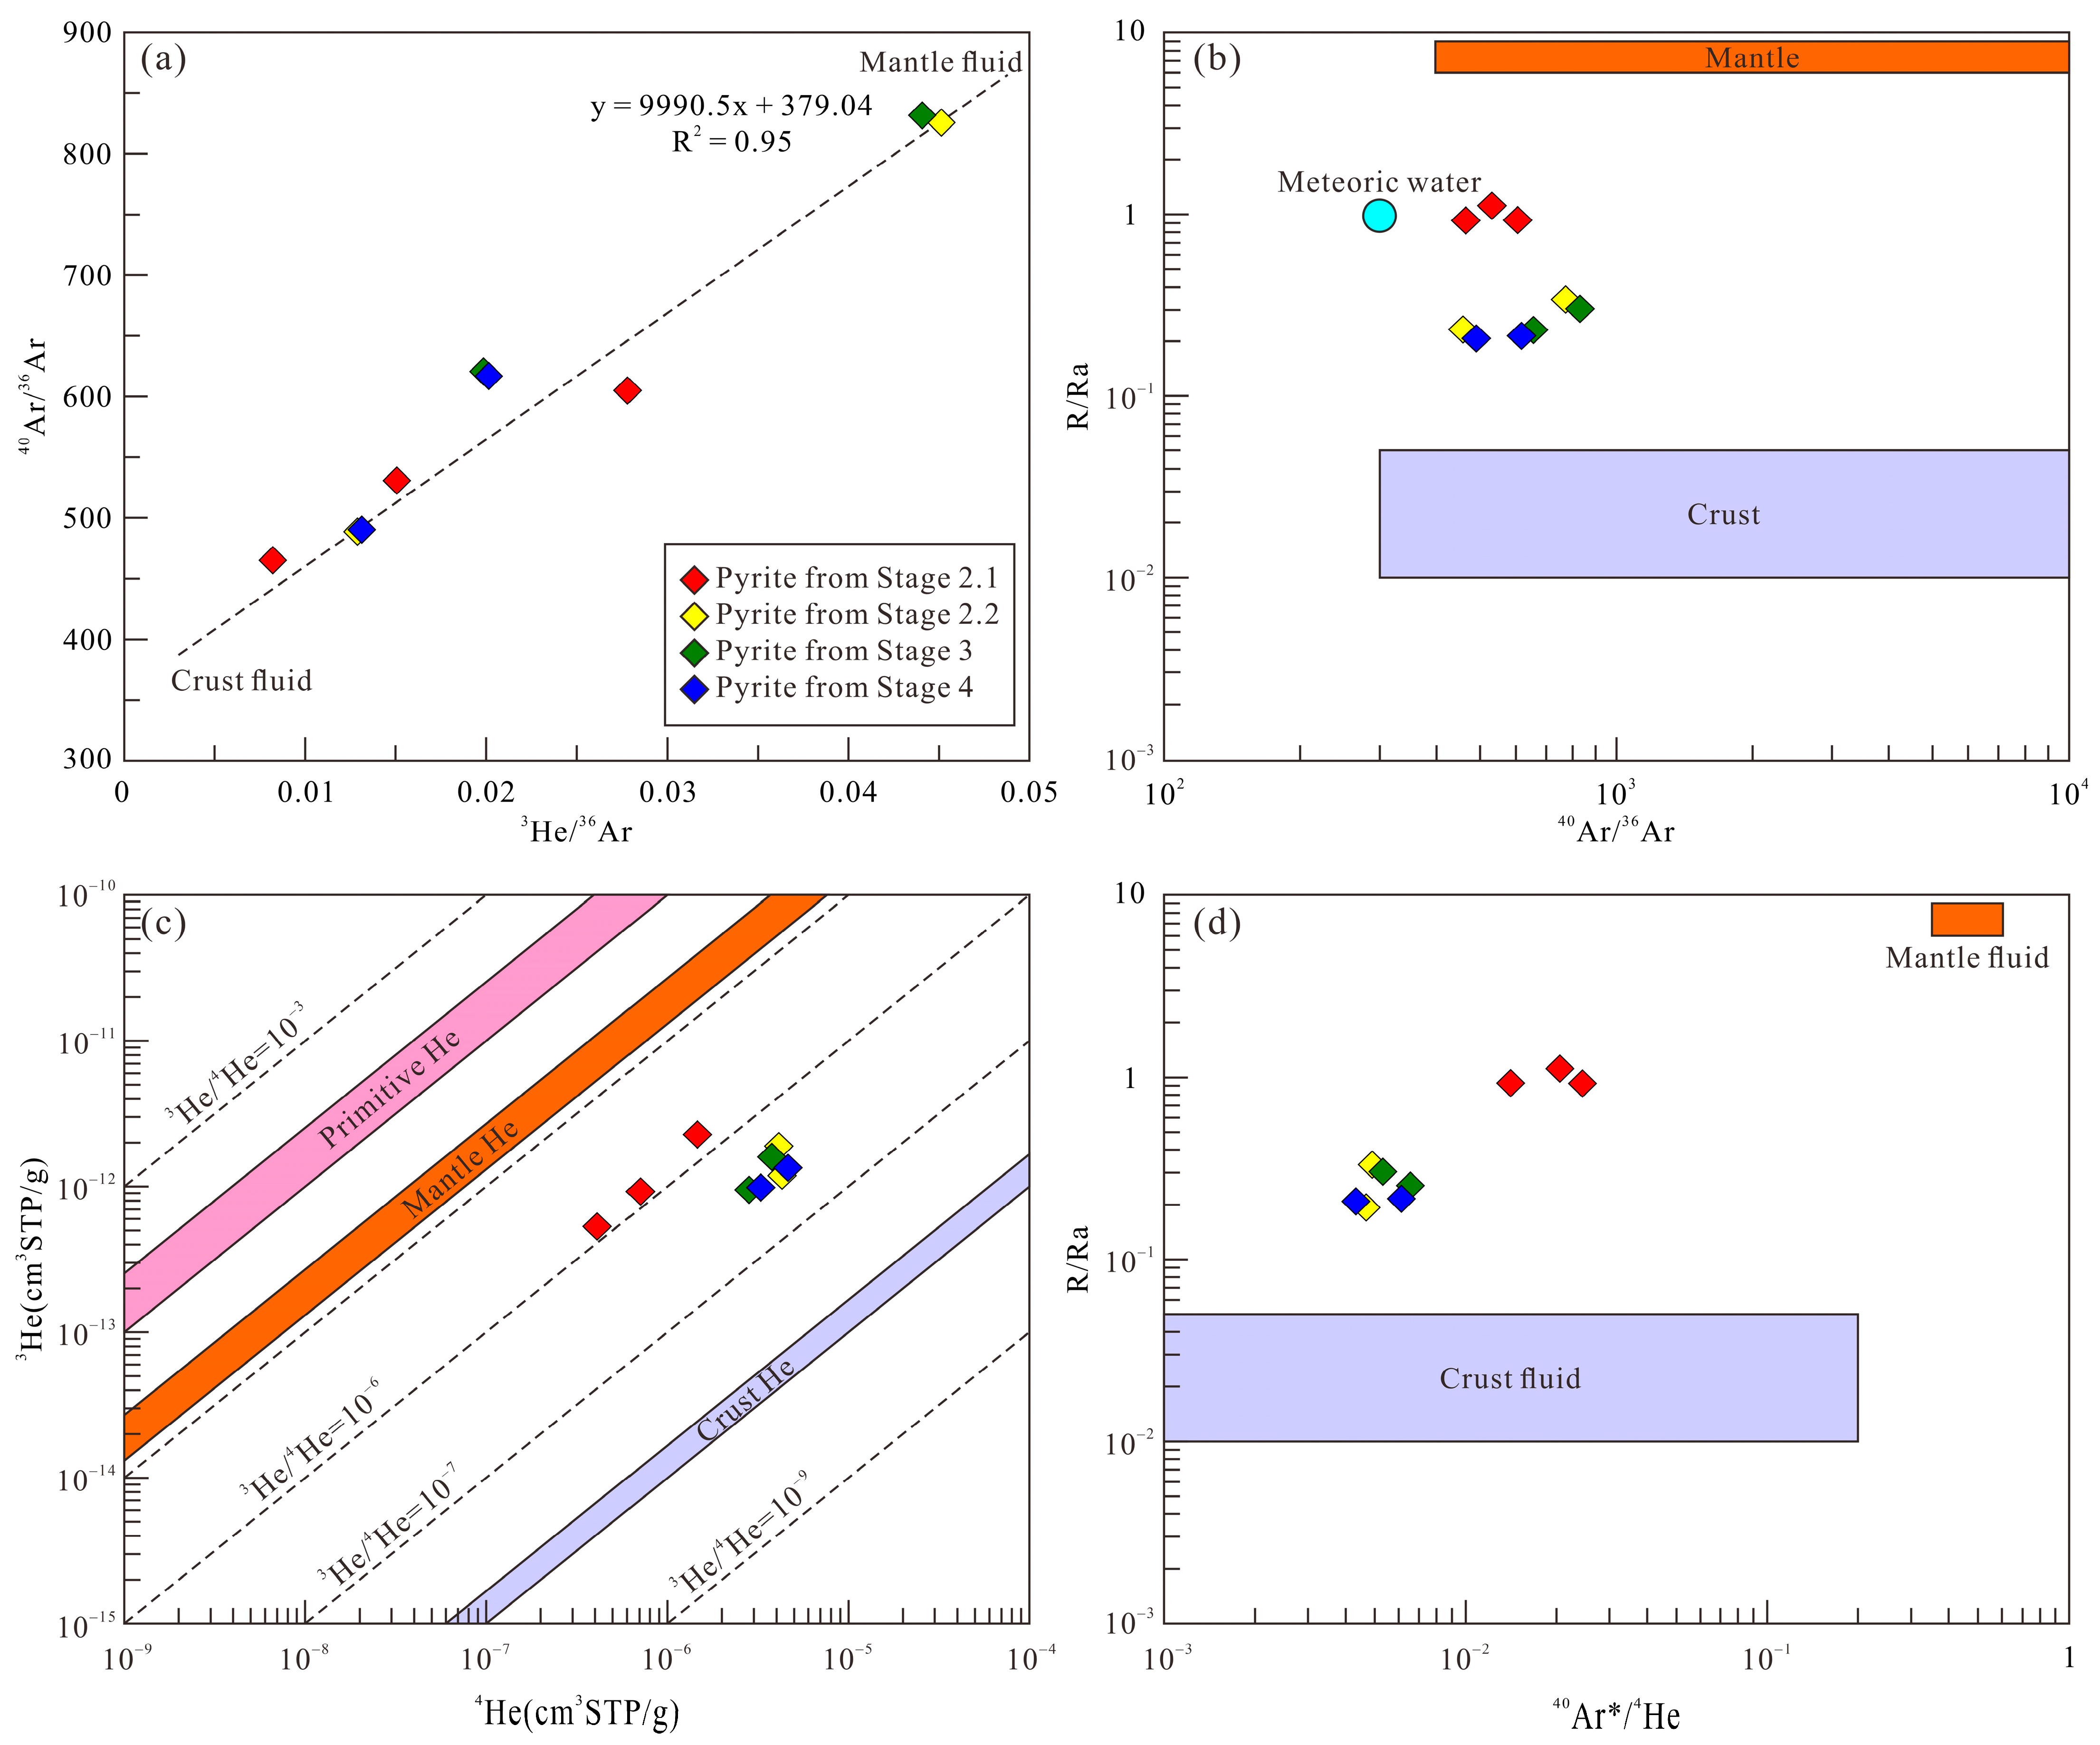
Helium and argon isotopic compositions of FIs in pyrite from the Chaijiagou Mo deposit are given in Table S4 and graphically represented in Figure 12. FIs in Stage 2.1 pyrite samples display 4He contents of 4.1–14.6 × 10⁻⁷ cm3 STP/g, 3He/4He ratios of 0.92–1.11 Ra (where 1 Ra = 1.4 × 10⁻⁶), 40Ar contents of 0.2–0.8 × 10⁻⁷ cm3 STP/g, and 40Ar/36Ar ratios ranging from 464.7 to 604.6. Pyrite samples from Stages 2.2, 3, and 4 exhibit comparable noble gas signatures, with 4He = 31.6–46.2 × 10⁻⁷ cm3 STP/g, 40Ar = 0.3–0.5 × 10⁻⁷ cm3 STP/g, 3He/4He = 0.21–0.30 Ra, and 40Ar/36Ar = 488.3–831.4.

4.6. H-O Isotopic Compositions

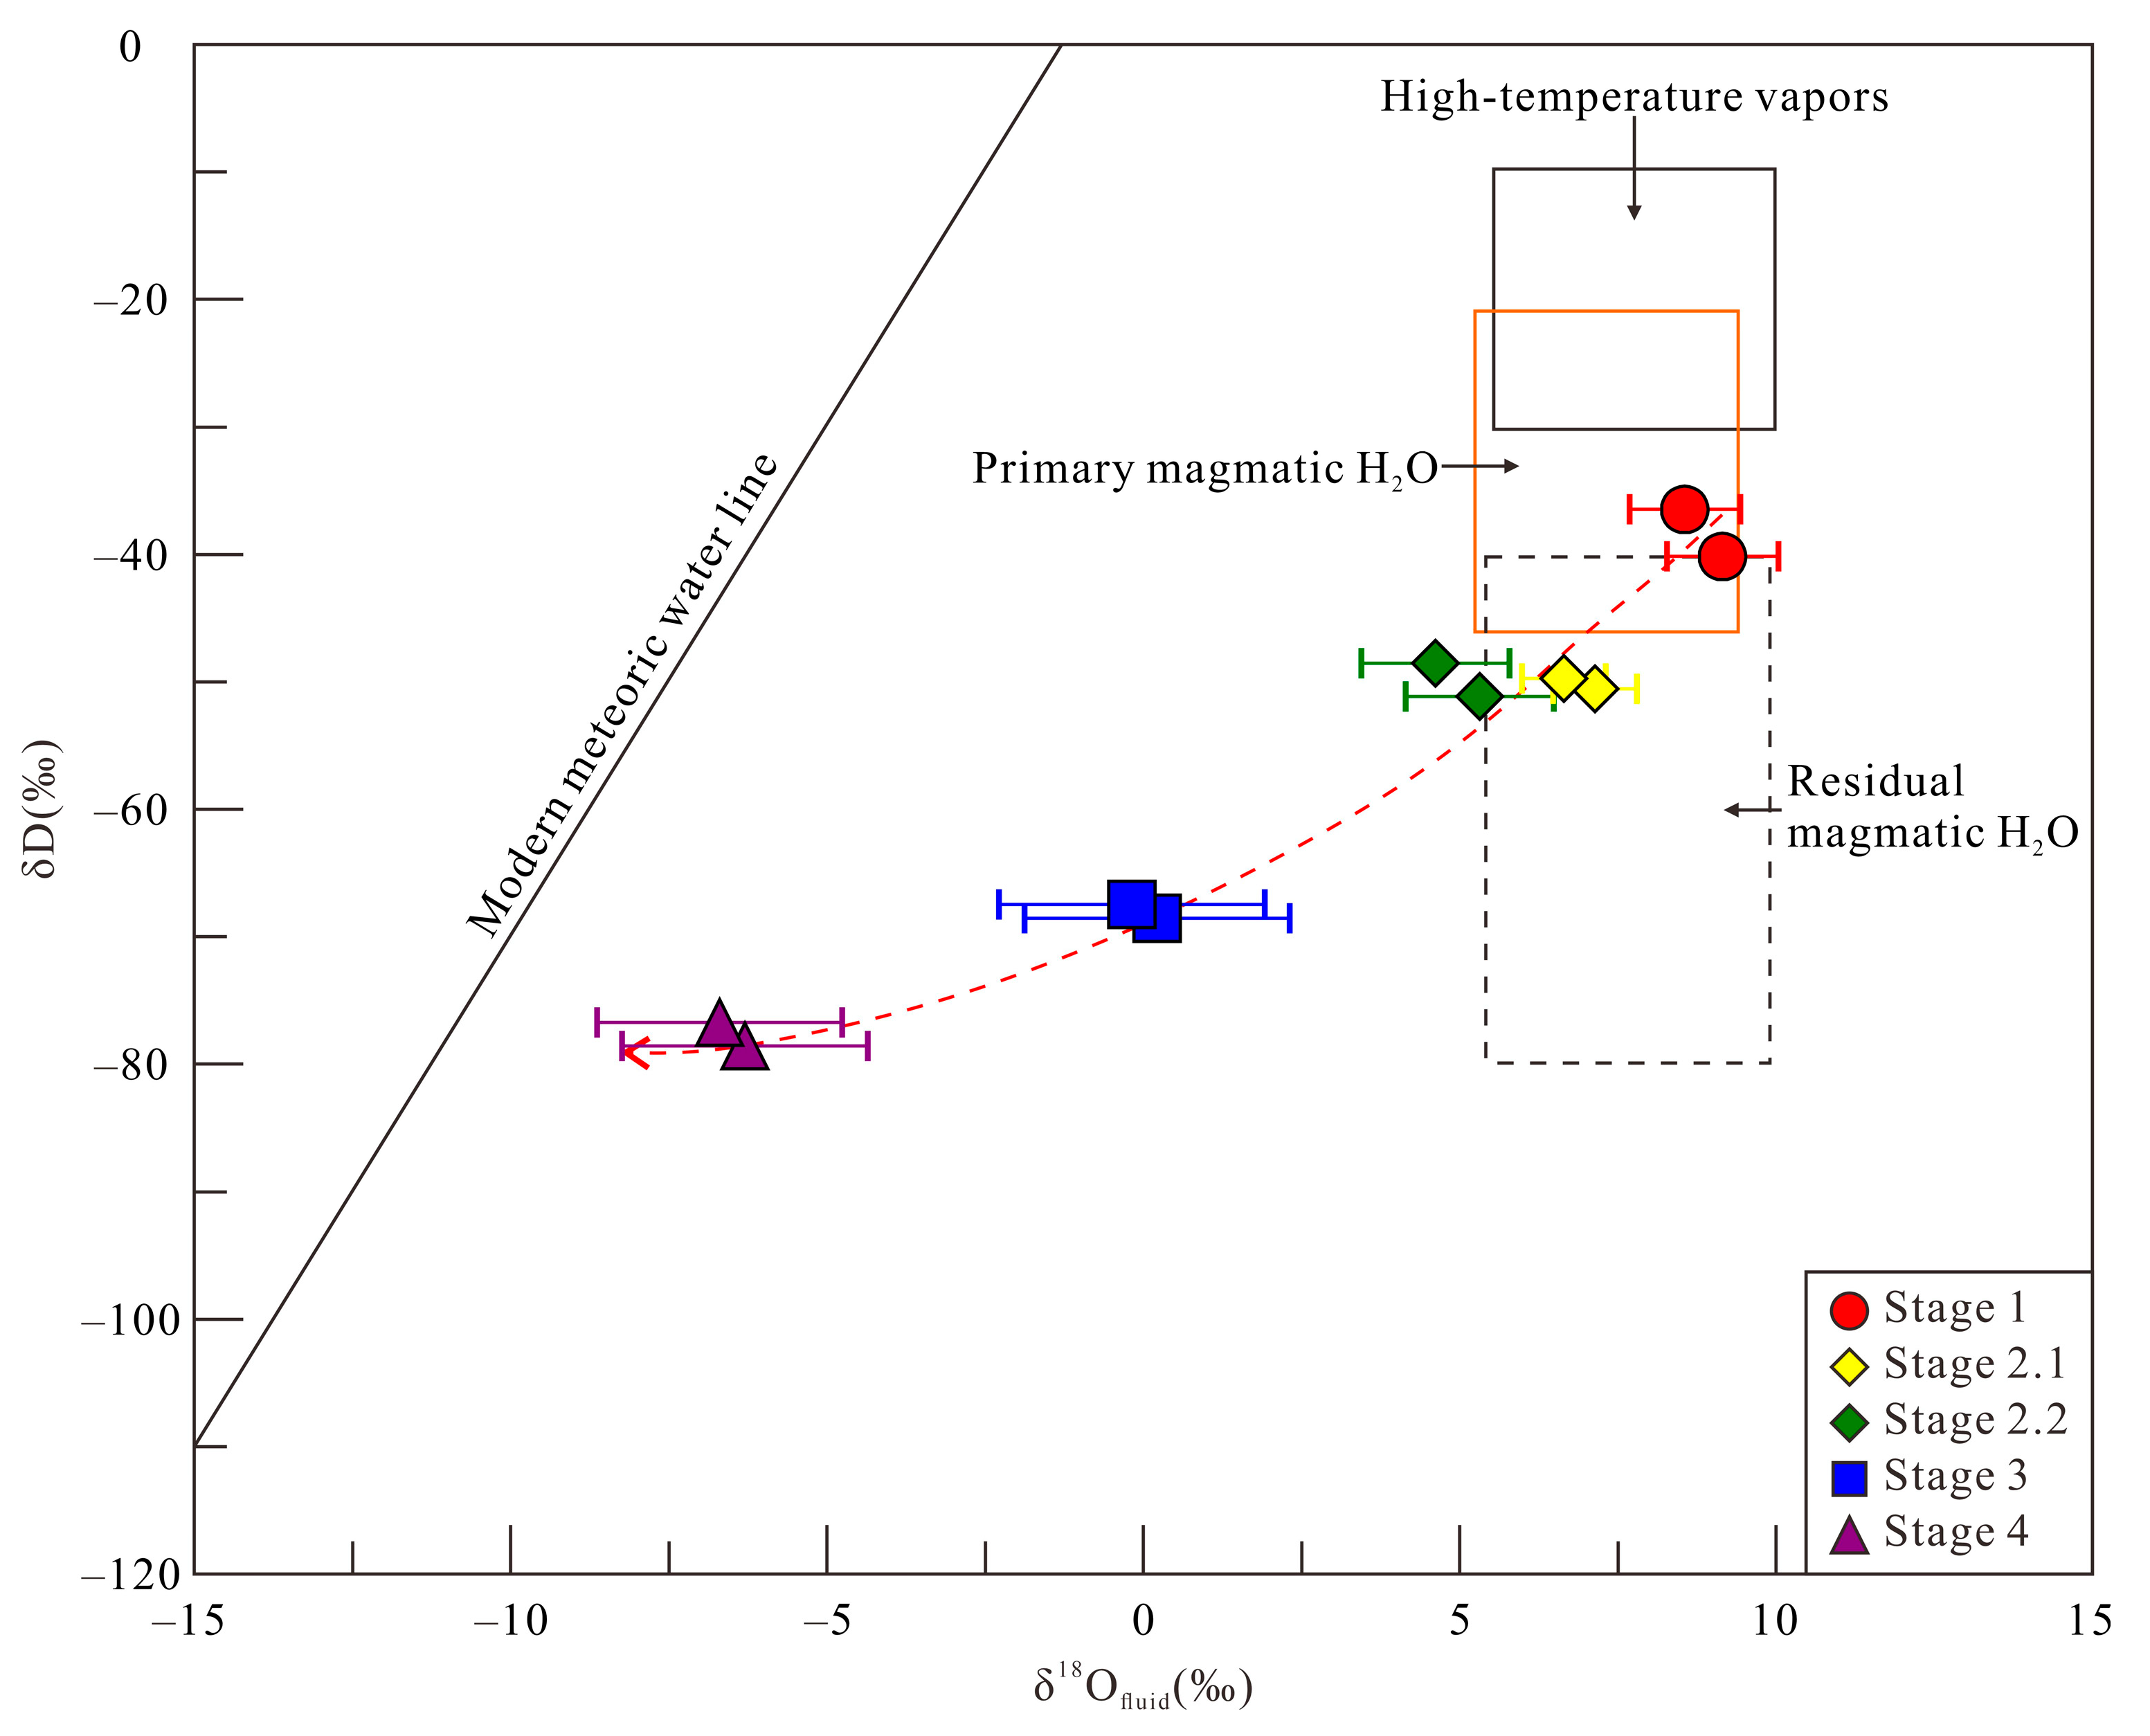
Hydrogen and oxygen isotope data from the Chaijiagou deposit are provided in Table S5. Stage 1 exhibits δ18Oquartz values of 12.6–13.2‰ and δD values of –40.2 to −36.5‰, yielding calculated δ18Ofluid values of 7.7−10.0‰. For Stage 2.1, δ18Oquartz ranges from 11.9‰ to 12.4‰ with δD between −50.6 and −49.8‰, corresponding to δ18Ofluid values of 6.0–7.8‰. Stage 2.2 shows δ18Oquartz of 11.5–12.2‰ and δD of −51.2 to −48.6‰, with calculated δ18Ofluid between 3.4‰ and 6.5‰. Stage 3 has δ18Oquartz values of 9.8–10.2‰ and δD values of −68.6 to −67.5‰, resulting in δ18Ofluid values of −2.3 to 2.3‰. Stage 4 displays δ18Oquartz of 7.2–7.6‰ and δD of −78.6 to −76.8‰, with calculated δ18Ofluid varying from −8.6 to −4.4‰.
In the δD vs. δ18O diagram (Figure 13), Stage 1 samples plot within the primary magmatic water field. Those from Stages 2.1 and 2.2 fall within or near the domain of residual magmatic water. In contrast, Stage 3 and Stage 4 samples are distributed between the meteoric water line and residual magmatic water zone, with Stage 4 values approaching closest to the meteoric water line.

5. Discussion

5.1. Source of Sulfur and Lead
Sulfide mineralization at the Chaijiagou Mo deposit is dominated by molybdenite, pyrite, and chalcopyrite, with minor galena, sphalerite, and covellite; no sulfate minerals have been identified. Under such conditions, the measured sulfur isotope compositions are considered representative of the ore-forming fluids [36]. The δ34S values of pyrite from different paragenetic stages vary narrowly from 5.78‰ to 7.58‰, consistent with typical magmatic sulfur (0 ± 5‰; [36]) and granitoid-related sulfur reservoirs (1.0 ± 6.1‰; [37]) (Figure 10). The similar and uniform δ34S values have been reported for other Mesozoic porphyry Mo(-polymetallic) deposits in the region, such as the Caosiyao (4.0–6.1; [38]), Diyanqinamu (2.5–10.2; [39]), Hashitu (0.4–3.8; [40]), Jiguanshan (4.6–7.1; [41]), Nianzigou (3.5–8.8; [42]), Wulandele (1.9–9.1; [43]), Wurinitu (0.6–4.1; [44,45]), Aolunhua (−1.2 to 4.9; [46,47,48]), Yangchang (−1.7 to 3.5; [49]), Chamuhan (0.1–1.6; [50]), Xiaodonggou (−4.0 to 5.1; [51]), Dasuji (3.1–6.8; [52]), Chagandells (1.1–3.7; [53]), Sadaigoumen (4.4–6.3; [54]), Chehugou (−0.6 to 0.9; [55]), Kulitu (1.5–2.8; [56]), and Baituyingzi (0.1–2.6; [56]), all of which have been interpreted as granitic magmatic origin. The combined evidence from our data and regional comparisons supports that the sulfur in multi-stage pyrite at Chaijiagou originated from a common granitic magma.
Figure 13. δD vs. δ18Ofluid diagram for the Chaijiagou Mo deposit (Residual magmatic H2O after [57]; High-temperature vapors after [58]; Primary magmatic H2O after [59]).
Minerals 16 00071 g013
Lead isotope compositions of sulfides provide key insights into metal sources, particularly since sulfides generally host low concentrations of U and Th and incorporate negligible radiogenic Pb after formation [35,60]. At Chaijiagou, pyrite from all mineralization stages exhibits uniform Pb isotope ratios: 206Pb/204Pb = 18.203–18.410, 207Pb/204Pb = 15.586–15.631, and 208Pb/204Pb = 38.002–38.398. These values overlap closely with those of the ore-bearing granite porphyry (206Pb/204Pb = 18.203–18.255, 207Pb/204Pb = 15.585–15.615, 208Pb/204Pb = 38.006–38.185), indicating a common Pb source. The μ values of pyrite and granite porphyry range from 9.46 to 9.54 and 9.46 to 9.51, respectively. These values fall between typical mantle (μ ≈ 8.92; [61] and upper crustal (μ > 9.58; [35] endmembers, supporting a predominantly crustal origin with a minor mantle contribution. On a 207Pb/204Pb versus 206Pb/204Pb diagram [35], both pyrite and granite porphyry samples plot between the orogenic belt and upper crust evolution curves (Figure 11a). In the 208Pb/204Pb versus 206Pb/204Pb diagram, most data align along the orogenic evolution curve (Figure 11b). This evidence indicates a homogeneous Pb source for both the mineralization and the intrusive host rocks, reinforcing that granitic magmatism played a fundamental role in supplying metals to the Chaijiagou porphyry Mo deposit. Regionally, the lead isotope data of sulfides from Late Jurassic to Early Cretaceous Mo(-polymetallic) deposits, including the Caosiyao Mo deposit [38], Diyanqinamu Mo deposit [39], Hashitu Mo deposit [40], Jiguanshan Mo deposit [41], Wulandele Mo deposit [43], Wurinitu Mo-W deposit [44,45], Aolunhua Mo-Cu deposit [47], Chamuhan W-Mo deposit [50], and Xiaodonggou Mo deposit [51], show that samples primarily distribute between the mantle and orogen evolution curves in the 207Pb/204Pb versus 206Pb/204Pb diagram, while in the 208Pb/204Pb versus 206Pb/204Pb diagram, they mainly follow the orogen evolution curve. In contrast, Triassic Mo deposits such as Dasuji [62], Sadaigoumen [63], Kulitu [56], and Baituyingzi [56] exhibit sulfide samples plotting between the orogen and upper crust evolution curves in the 207Pb/204Pb versus 206Pb/204Pb diagram and between the lower crust and orogen evolution curves in the 208Pb/204Pb versus 206Pb/204Pb diagram (Figure 11). While these regional variations reveal distinct lead source characteristics of Mo deposits from different periods, the lead in these deposits has been demonstrated to be predominantly derived from the granite magmatism associated with mineralization, further confirming a granite magmatic lead source for the Chaijiagou Mo deposit.

5.2. Source of Ore-Forming Fluids

The Chaijiagou Mo deposit has inevitably experienced various degrees of post-formation modification, which may have affected the geochemical signatures of FIs, including their noble gas isotopic compositions [33,64]. Nevertheless, previous investigations have demonstrated that noble gas systems in sulfide and sulfate minerals are generally robust against post-entrapment alteration, with pyrite being particularly effective at preserving original He and Ar isotopic signatures due to the exceptionally low diffusivity of these gases [64,65,66,67]. To minimize potential contamination from secondary FIs, all pyrite specimens selected for He–Ar analysis exhibited pristine crystal morphology without visible fractures and were obtained from drill cores to reduce near-surface influences, thereby limiting the incorporation of cosmogenic 3He [66,68].
Crustal fluids may incorporate noble gases from three principal reservoirs: air-saturated meteoric water, crust-derived fluids, and mantle-derived fluids, each characterized by distinct isotopic fingerprints [65,66]. This allows for tracing fluid origins using noble gas isotopic compositions preserved in sulfide minerals. Air-saturated water exhibits 3He/4He and 40Ar/36Ar ratios of 1 Ra and 295.5, respectively [69]. Crustal fluids are dominated by radiogenic helium and argon, typically with 3He/4He = 0.01–0.05 Ra and 40Ar/36Ar > 295.5, whereas mantle-derived fluids generally show 3He/4He = 6–9 Ra and 40Ar/36Ar > 40,000 [65,66,70,71]. Pyrite from the Chaijiagou deposit yields 3He/4He ratios ranging from 0.21 to 1.11 Ra (Table S4), intermediate between typical crustal and mantle values, indicating a mixed He source. In 3He/36Ar vs. 40Ar/36Ar (Figure 12a) and 40Ar/36Ar vs. R/Ra (Figure 12b) diagrams, the samples plot between crustal and mantle endmembers. Clear mixing trends are also evident in 3He vs. 4He (Figure 12c) and 40Ar*/4He vs. R/Ra (Figure 12d) diagrams, reflecting variable contributions from crustal and mantle reservoirs. The relative mantle He contribution can be quantified using the equation [70]:
4Hemantle (%) = 100 × [(3He/4He)sample − (3He/4He)crust]/[(3He/4He)mantle − (3He/4He)crust]
where endmember values of 6 Ra and 0.01 Ra represent pure mantle and crustal sources, respectively. Calculations indicate that mantle-derived 4He contributed 15.2%–18.4% to Stage 2.1 fluids, decreasing significantly to 3.3%–4.9% in subsequent stages (2.2, 3, and 4).
Hydrogen and oxygen isotope systematics provide complementary constraints on fluid evolution. As illustrated in Figure 13, Stage 1 fluids plot within the primary magmatic water field, whereas Stage 2 samples fall within or near the residual magmatic water field. In contrast, Stage 3 and 4 fluids display progressively lower δ18Ofluid values, trending toward the meteoric water line, indicating increasing meteoric water input during later mineralization stages.
In conclusion, the Chaijiagou ore-forming fluids were predominantly derived from crustal sources with a minor but discernible mantle component. Mantle contributions were most significant during Stage 2.1 but decreased markedly thereafter. Meteoric water began to substantially influence the hydrothermal system from Stage 3 onward, becoming increasingly dominant through Stage 4.

5.3. Metal Precipitation Mechanisms

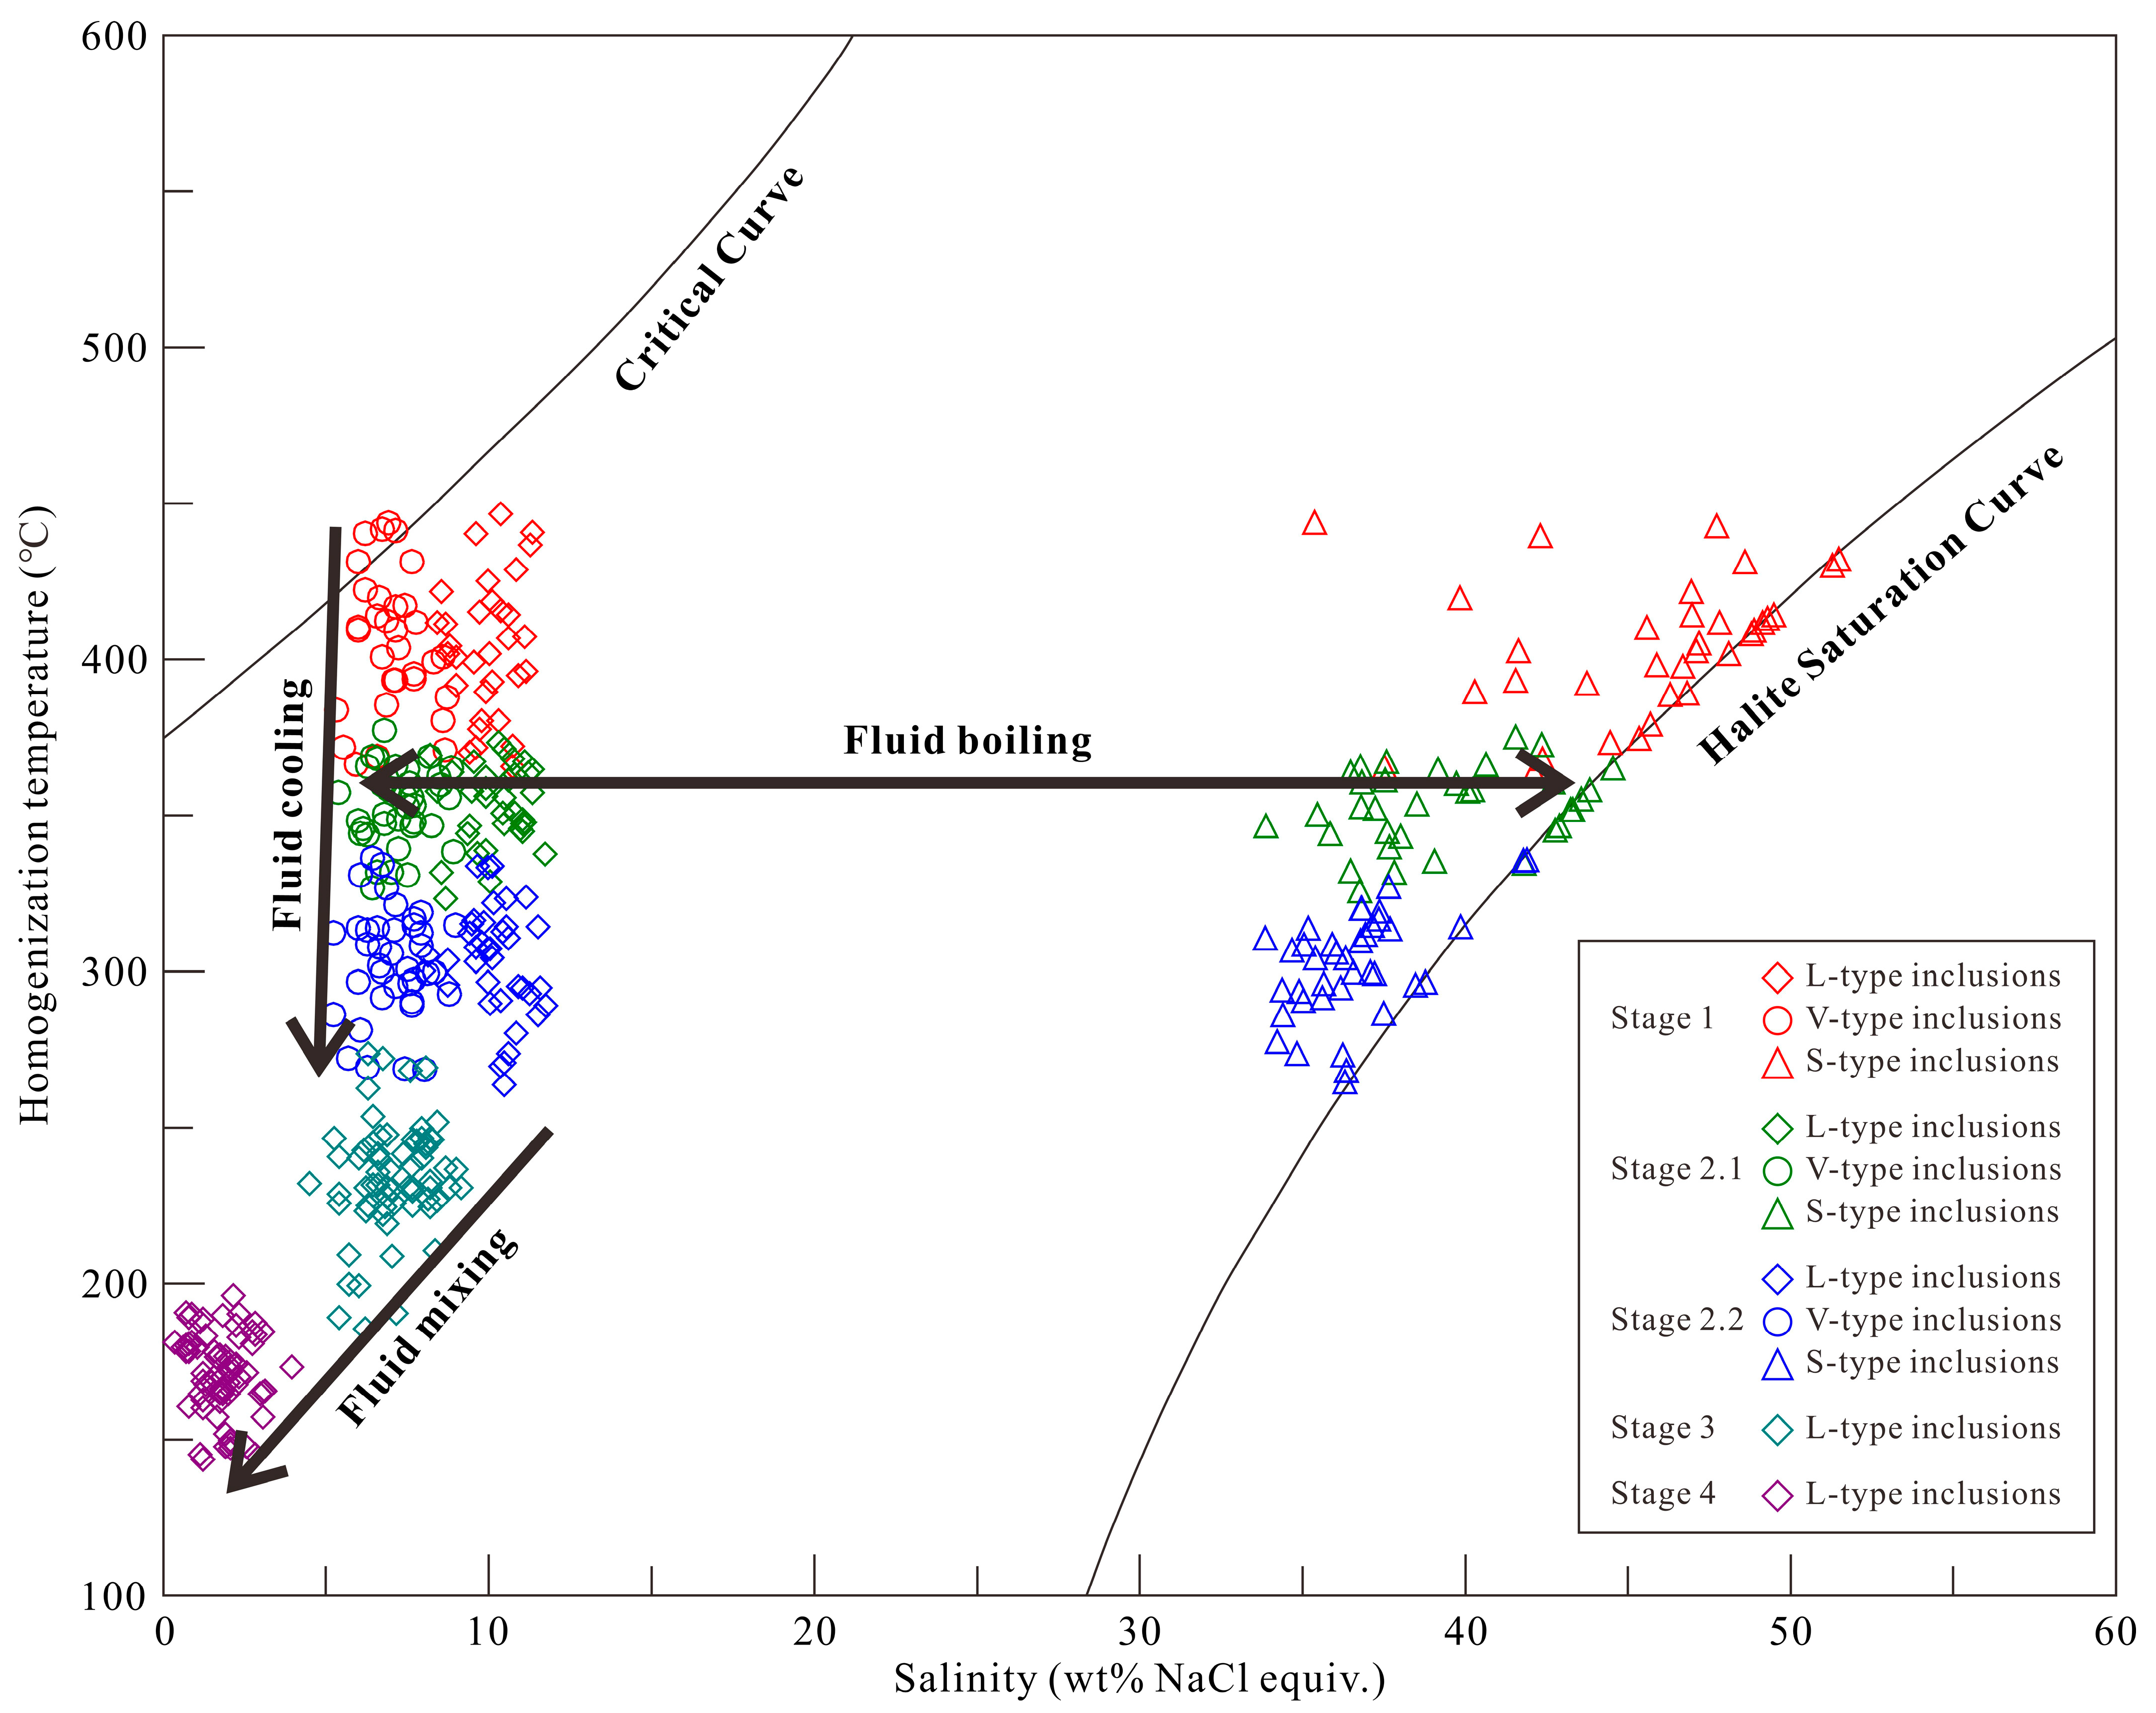
Fluid boiling represents a fundamental metal precipitation mechanism in magmatic–hydrothermal ore-forming systems, capable of significantly altering fluid temperature, pH, and salinity, thereby reducing metal solubility and triggering mineralization [72,73,74]. At Chaijiagou, compelling evidence for boiling during Stages 1 and 2 includes: (1) the intimate spatial association of S-type, L-type, and V-type FIs within the same quartz domains (Figure 7a); (2) contrasting homogenization behaviors among these inclusion types; and (3) comparable homogenization temperatures despite markedly different salinities (Figure 8a–f). The systematic coexistence of these inclusion types with distinct phase characteristics indicates simultaneous trapping of heterogeneous fluids [75]. The observed salinity discrepancy—where L-type FIs show higher salinities than co-existing V-types at similar homogenization temperatures—suggests phase separation accompanied by volatile loss, which would concentrate salts in the residual liquid phase [76,77]. This interpretation is further supported by the distinct clustering of Stage 1 and 2 FIs along boiling trends in salinity versus homogenization temperature diagram (Figure 9). Field observations of extensively fractured and brecciated granite porphyry provide additional evidence for abrupt pressure drops that would have promoted fluid boiling [27,31]. Integrated with hydrogen-oxygen isotope data indicating magmatic fluid signatures in Stage 1 quartz, we infer that the initial ore-forming fluids at Chaijiagou were of magmatic–hydrothermal origin. During ascent, decompression and cooling triggered volatile exsolution, leading to rapid fluid phase separation. This process caused sudden supersaturation, pH elevation, and destabilization of metal complexes, ultimately precipitating substantial molybdenite and chalcopyrite from Stage 2 fluids.
Fluid–rock interaction represents another crucial mechanism governing metal transport and deposition in intrusion-related mineralization systems [1,78,79]. Extensive research has demonstrated that fluid–rock reactions can significantly modify fluid physicochemical parameters, consequently affecting metal solubility and ore mineral stability [80,81]. At Chaijiagou, the spatial association between Mo mineralization and phyllic alteration zones—where primary K-feldspars are replaced by quartz–sericite assemblages (Figure 3)—highlights the importance of fluid–rock interaction. This alteration process consumed hydrogen ions and enhanced reduced sulfur (S2−) activity through reactions such as:
HS → H+ + S2−
H2S → H+ + HS
3NaAlSi3O8 + K+ + 2H+ → KAl3Si3O10(OH)2 (sericite) + 6SiO2 (quartz) + 3Na+
3KAlSi3O8 + 2H+ → KAl3Si3O10(OH)2 (sericite) + 6SiO2 (quartz) + 2K+
Concurrently, hydrogen sulfide dissociation would have provided the sulfide ions necessary to precipitate molybdenite and chalcopyrite. These reactions collectively suggest that phyllic alteration created chemically favorable conditions for ore mineral deposition, though detailed mineralogical and geochemical constraints await further investigation.
Fluid mixing represents a significant mineralization mechanism, particularly for base metal sulfide deposition, through combined effects of dilution, cooling, and chemical modification [82,83,84,85]. At Chaijiagou, the pronounced decreases in both salinity and homogenization temperature from Stage 2 to Stage 3 (Figure 9), coupled with progressively depleted δ18Ofluid values (Figure 13), provide clear evidence for meteoric water incursion into the hydrothermal system. The extensive fracturing generated during Stages 1 and 2 likely enhanced permeability, facilitating ingress of external fluids. Consequently, fluid mixing between evolved magmatic fluids and meteoric waters during Stage 3 would have caused rapid cooling, destabilization of metal–chloride complexes, and substantial deposition of galena and sphalerite.
In summary, the deposition of Stage 2 molybdenite and chalcopyrite was predominantly controlled by fluid–rock interaction and fluid boiling, whereas the Stage 3 Pb-Zn mineralization was primarily driven by fluid mixing.

5.4. Metallogenic Model for the Chaijiagou Mo System

The development of a robust genetic model provides critical guidance for mineral exploration and enhances the success rate of prospecting predictions, particularly for intrusion-related magmatic–hydrothermal systems [86]. Integrating our findings with previous research, we propose the following metallogenic model for the Chaijiagou Mo deposit.
During the Middle Jurassic, the study region experienced back-arc extension driven by retreating subduction of the Paleo-Pacific Plate [4,87,88]. Mantle-derived mafic magmas underplated the juvenile lower crust, triggering extensive crustal melting that generated a deep hot zone and produced voluminous felsic magmas. According to the model proposed by [89], this deep hot zone acted as a thermal barrier that largely prevented mafic magmas from ascending further, explaining the scarcity of contemporaneous mafic exposures in the area. Nevertheless, minor mantle-derived components (e.g., He) traversed this zone and were incorporated into evolving magma chambers. Subsequent crystal fractionation progressively concentrated ore-forming elements within the felsic magmas [90,91].
The highly evolved, compositionally homogeneous granite porphyry was emplaced at approximately 164 Ma [13], serving as the parent rock that supplied high-temperature, metal-rich fluids to the developing hydrothermal system. These fluids accumulated at the intrusion cupola, interacting with the cooling porphyry to form concentric potassic and phyllic alteration zones (Figure 2b). Concurrent upward migration and decompression of ore-forming fluids triggered intensive phase separation. The most primitive fluid signatures are preserved in Stage 1 quartz–K–feldspar–magnetite veins, which precipitated through fluid–rock interaction. These early fluids represent a high-temperature (360–450 °C), high-oxygen fugacity NaCl–H2O system with bimodal salinity distribution (5.3–11.3 and 35.4–51.5 wt.% NaCl equiv.).
The absence of magnetite in Stage 2.1 veins signals a significant drop in oxygen fugacity. Fluids of this stage maintained temperatures of 320–380 °C with bimodal salinities (5.4–11.7 and 33.9–44.5 wt.% NaCl equiv.). Combined fluid boiling and sericitic alteration increased fluid pH and promoted cooling, drastically reducing the solubility of molybdenum and copper, and precipitating molybdenite and chalcopyrite. Stage 2.2 fluids show lower temperatures (260–340 °C) while maintaining bimodal salinities (5.3–11.8 and 33.8–41.9 wt.% NaCl equiv.). Molybdenite precipitation mechanisms remained similar to Stage 2.1, though copper mineralization ceased, as evidenced by the lack of chalcopyrite.
Throughout Stages 1 and 2, elevated temperatures and internal fluid pressure likely minimized the influx of external fluids. Meteoric water incursion commenced during Stage 3. Molybdenite disappeared in this stage of veins. Only L-type inclusions are present, defining a medium-temperature (180–280 °C), low-salinity (4.5–9.1 wt.% NaCl equiv.) NaCl–H2O system. The abundant sphalerite and galena deposition indicates substantially reduced oxygen fugacity. Meteoric water dilution, combined with decreasing temperature, pH, salinity, and oxygen fugacity, destabilized metal–chloride complexes and dramatically reduced Pb-Zn solubility, triggering rapid sulfide precipitation.
Stage 4 is characterized by low-temperature (140–200 °C), low-salinity (0.4–3.9 wt.% NaCl equiv.) fluids that deposited quartz, carbonates, fluorite, and minor pyrite. This late-stage mineralization marks the terminal phase of hydrothermal activity at Chaijiagou.

6. Conclusions

This study presents a comprehensive dataset integrating sulfur and lead isotopes, noble gas (He–Ar) and stable (H–O) isotopes, and detailed FI analyses to elucidate the origin and evolution of the Chaijiagou porphyry Mo deposit. The main conclusions are as follows:
(1) The narrow range of δ34S values (5.78–7.58‰) from pyrite is indicative of a magmatic sulfur reservoir. Lead isotope compositions of sulfides are similar to those of the ore-bearing granite porphyry. These features indicate that the ore-forming materials of the Chaijiagou Mo deposit were predominantly sourced from a granitic magma.
(2) The ore-forming fluids evolved from a magmatic–hydrothermal system with a detectable mantle component to one increasingly dominated by meteoric water. Early high-temperature fluids (Stages 1–2) show hydrogen-oxygen isotopic signatures of magmatic water. Crucially, He–Ar isotopes (3He/4He = 0.21–1.11 Ra) reveal a mixed source, with mantle-derived helium contributing significantly (15.2%–18.4%) during the main Mo-Cu stage (Stage 2.1). A pronounced shift in later stages is marked by decreasing δ18Ofluid values and a drop in mantle He contribution, reflecting extensive meteoric water influx from Stage 3 onward.
(3) Distinct mechanisms controlled the sequential deposition of metals. The precipitation of molybdenite and chalcopyrite in the high-temperature regime (Stages 2.1–2.2) was primarily driven by fluid boiling and fluid–rock interaction, particularly phyllic alteration. In contrast, the later-stage Pb-Zn mineralization (Stage 3) was triggered mainly by fluid mixing between the residual magmatic fluids and meteoric water, leading to cooling, dilution, and destabilization of metal complexes.

Supplementary Materials

The following supporting information can be downloaded at https://www.mdpi.com/article/10.3390/min16010071/s1. Table S1: Microthermometry data for fluid inclusions in quartz from the Chaijiagou Mo deposit; Table S2: In situ sulfur isotopic compositions of pyrite from the Chaijiagou Mo deposit; Table S3: Lead isotopic compositions of pyrite and granite porphyry from the Chaijiagou Mo deposit; Table S4: He and Ar isotopic compositions of fluid inclusions of pyrite from the Chaijiagou Mo deposit; Table S5: Hydrogen and oxygen isotopic compositions of the Chaijiagou Mo deposit.

Author Contributions

Conceptualization, W.X. and C.J.; investigation, W.X.; writing—original draft preparation, W.X.; writing—review and editing, C.J., Q.Z. and L.Z.; data curation, R.D., Z.W. and K.W. All authors have read and agreed to the published version of the manuscript.

Funding

This work was funded by Science Research Project of the Hebei Education Department (Grant No. BJ2025178), Hebei Natural Science Foundation (Grant No. D2025402002, D2022402028), and Open Research Fund Program of Key Laboratory of Metallogenic Prediction of Nonferrous Metals and Geological Environment Monitoring (Ministry of Education), Central South University (Grant No. 2024YSJS10).

Data Availability Statement

The original contributions presented in this study are included in the article/Supplementary Materials. Further inquiries can be directed to the corresponding author.

Acknowledgments

We extend our sincere gratitude to the academic editor and three anonymous reviewers for their valuable comments and suggestions, which have significantly improved the quality of this manuscript. We would like to thank Yunze Huang and Zhenhua Hu from the Wuhan Sample Solution Analytical Technology Co., Ltd. for their help during the pyrite in situ Pb isotope analyses. We also thank Zheng-Tao Zhu and Jian-Mei Tang from the Beijing Createch Testing Technology Co., Ltd. for their expert assistance with pyrite in situ S isotope analyses.

Conflicts of Interest

The authors declare no conflicts of interest.

References

  1. Sillitoe, R.H. Porphyry copper systems. Econ. Geol. 2010, 105, 3–41. [Google Scholar] [CrossRef]
  2. Seedorff, E.; Dilles, J.H.; Proffett, J.M.; Einaudi, M.; Zurcher, L.; Stavast, W.J.A.; Johnson, D.A.; Barton, M.D. Porphyry deposits: Characteristics and origin of hypogene features. Econ. Geol. 2005, 100, 251–298. [Google Scholar]
  3. Wilkinson, J.J. Triggers for the formation of porphyry ore deposits in magmatic arcs. Nat. Geosci. 2013, 6, 917–925. [Google Scholar] [CrossRef]
  4. Zeng, Q.D.; Liu, J.M.; Qin, K.Z.; Fan, H.R.; Chu, S.X.; Wang, Y.B.; Zhou, L.L. Types, characteristics, and time–space distribution of molybdenum deposits in China. Int. Geol. Rev. 2013, 55, 1311–1358. [Google Scholar] [CrossRef]
  5. Zeng, Q.D.; Liu, J.M.; Chu, S.X.; Wang, Y.B.; Sun, Y.; Duan, X.X.; Zhou, L.L. Mesozoic molybdenum deposits in the East Xingmeng orogenic belt, northeast China: Characteristics and tectonic setting. Int. Geol. Rev. 2012, 54, 1843−1869. [Google Scholar] [CrossRef]
  6. Ouyang, H.G.; Mao, J.W.; Hu, R.Z. Geochemistry and Crystallization Conditions of Magmas Related to Porphyry Mo Mineralization in Northeastern China. Econ. Geol. 2020, 115, 79–100. [Google Scholar] [CrossRef]
  7. Wang, R.L.; Zeng, Q.D.; Zhang, Z.C.; Zhou, L.L.; Qin, K.Z. Extensive mineralization in the eastern segment of the Xingmeng orogenic belt, NE China: A regional view. Ore Geol. Rev. 2021, 135, 104204. [Google Scholar] [CrossRef]
  8. Chen, Y.J.; Zhang, C.; Wang, P.; Pirajno, F.; Li, N. The Mo deposits of Northeast China: A powerful indicator of tectonic settings and associated evolutionary trends. Ore Geol. Rev. 2017, 81, 602–640. [Google Scholar] [CrossRef]
  9. Zhao, H.R.; Yuan, X.P.; Zhang, J.; Wei, C.Y.; Chen, Z.; Liang, J.L.; Wang, Z.Q.; Qiu, J.Q.; Jin, Z.H.; Lin, X.L. Detailed Geological Investigation Report of the Chaijiagou Molybdenum Deposit (Lines 9–16) in Shatuozi Township, Pingquan County, Hebei Province. School of Earth Science and Engineering, Hebei University of Engineering: Handan, China, 2015; unpublished geological report. [Google Scholar]
  10. Yuan, X.P.; Xue, Y.P.; Su, H.J.; Liang, J.L. The geological characteristics and prospecting potential of Chaijiagou deposit. China Molybdenum Ind. 2019, 43, 17–21. [Google Scholar]
  11. Wang, Y.M. Chaijiagou molybdenum Hebei Geological characteristics and pros pecting criteria research. World Nonferr. Met. 2016, 18, 108–111. [Google Scholar]
  12. Zhang, J.Y. Genesis analysis of Chaijiagou molybdenum deposit in Pingquan City, Hebei Province. South. Met. 2019, 5, 10–18. [Google Scholar]
  13. Miao, G.; Dong, G.C.; Chen, Z.; Zhao, H.R.; Ren, L.; Quan, R.; Xu, Y.M.; Liu, X.Y. Origin of the granite porphyry and their geological significances in the Chaijiagou molybdenum deposit, northern Hebei. China Min. Mag. 2016, 25, 306–313. [Google Scholar]
  14. Mou, F.Q.; Ren, L.; Miao, G. Fluid inclusion characteristics and mineralization of Chaijiagou molybdenum deposit, Hebei Province. World Nonferr. Met. 2020, 18, 192–196. [Google Scholar]
  15. Xue, Y.P.; Yuan, X.P.; Liang, J.L.; Yang, R.; Zhou, H.F.; Jing, Z.H. Geological characteristics, prospecting marker and genesis discussion of Chaijiagou molybdenum deposit in Pingquan city of Hebei. Miner. Resour. Geol. 2023, 37, 39–48. [Google Scholar]
  16. Liu, Y.J.; Li, W.M.; Feng, Z.Q.; Wen, Q.B.; Neubauer, F.; Liang, C.Y. A review of the Paleozoic tectonics in the eastern part of Central Asian Orogenic Belt. Gondwana Res. 2017, 43, 123−148. [Google Scholar] [CrossRef]
  17. Zhao, G.C.; Sun, M.; Wilde, S.A.; Li, S.Z. Late Archaean to Paleoproterozoic evolution of the North China Craton: Key issues revisited. Precambrian Res. 2005, 136, 177–202. [Google Scholar] [CrossRef]
  18. Tang, H.S.; Chen, Y.J.; Wu, G.; Lai, Y. Paleoproterozoic positive δ13Ccarb excursion in the northeastern Sino-Korean craton: Evidence of the Lomagundi Event. Gondwana Res. 2011, 19, 471–481. [Google Scholar] [CrossRef]
  19. IBGM. Regional Geology of Inner Mongolia Autonomous Region; Geological Publishing House: Beijing, China, 1991. [Google Scholar]
  20. Bodnar, R.J. Revised equation and table for determining the freezing point depression of H2O-NaCl solutions. Geochim. Cosmochim. Acta 1993, 57, 683–684. [Google Scholar] [CrossRef]
  21. Fu, J.L.; Hu, Z.C.; Zhang, W.; Yang, L.; Liu, Y.S.; Li, M.; Zong, K.Q.; Gao, S.; Hu, S.H. In situ, sulfur isotopes (δ34S and δ33S) analyses in sulfides and elemental sulfur using high sensitivity cones combined with the addition of nitrogen by Laser Ablation MC-ICP-MS. Anal. Chim. Acta 2016, 911, 14–26. [Google Scholar] [CrossRef] [PubMed]
  22. Ma, X.H.; Zeng, Q.W.; Tao, S.Y.; Cao, R.; Zhou, Z.H. Mineralogical Characteristics and in-situ Sulfur Isotopic Analysis of Gold-Bearing Sulfides from the Qilishan Gold Deposit in the Jiaodong Peninsula, China. J. Earth Sci.-China 2021, 32, 116–126. [Google Scholar] [CrossRef]
  23. Zhang, W.; Hu, Z.C.; Gunther, D.; Liu, Y.S.; Ling, W.L.; Zong, K.Q.; Chen, H.H.; Gao, S.; Xu, L. Direct lead isotope analysis in Hg-rich sulfides by LA-MC-ICP-MS with a gas exchange device and matrix-matched calibration. Anal. Chim. Acta 2016, 948, 9–18. [Google Scholar] [CrossRef] [PubMed]
  24. Todt, W.; Cliff, R.A.; Hanser, A.; Hofmann, A.W. Re-calibration of NBS lead standards using a 202Pb-205Pb double spike. Terra Abstr. 1993, 5, 396. [Google Scholar]
  25. He, H.Y.; Zhu, R.X.; Saxton, J. Noble gas isotopes in corundum and peridotite xenoliths from the eastern North China Craton: Implication for comprehensive refertilization of lithospheric mantle. Phys. Earth Planet. Inter. 2011, 189, 185–191. [Google Scholar] [CrossRef]
  26. Clayton, R.N.; O’Neil, J.R.; Mayeda, T.K. Oxygen isotope exchange between quartz and water. J. Geophys. Res. 1972, 77, 3057–3067. [Google Scholar] [CrossRef]
  27. Roedder, E. Fluid inclusions. Geol. Soc. Am. Bull. 1984, 12, 1–644. [Google Scholar]
  28. Goldstein, R.H.; Reynolds, T.J. Systematics of fluid inclusions in diagenetic minerals. Soc. Sediment. Geol. 1994, 31, 199. [Google Scholar]
  29. Chi, G.X.; Lu, H.Z. Validation and representation of fluid inclusion microthermometric data using the fluid inclusion assemblage (FIA) concept. Acta Petrol. Sin. 2008, 24, 1945−1953. [Google Scholar]
  30. Chi, G.X.; Diamond, L.W.; Lu, H.Z.; Lai, J.Q.; Chu, H.X. Common Problems and Pitfalls in Fluid Inclusion Study: A Review and Discussion. Minerals 2021, 11, 7. [Google Scholar] [CrossRef]
  31. Lu, H.Z.; Fan, H.R.; Ni, P.; Ou, G.X.; Shen, K.; Zhang, W.H. Fluid Inclusions; Science Press: Beijing, China, 2004; p. 444. [Google Scholar]
  32. Audétat, A. A Plea for More Skepticism toward Fluid Inclusions: Part II. Homogenization via Halite Dissolution in Brine Inclusions from Magmatic-Hydrothermal Systems Is Commonly the Result of Postentrapment Modifications. Econ. Geol. 2023, 118, 43–55. [Google Scholar] [CrossRef]
  33. Zhang, D.H.; Audétat, A. A Plea for More Skepticism toward Fluid Inclusions: Part I. Postentrapment Changes in Fluid Density and Fluid Salinity Are Very Common. Econ. Geol. 2023, 118, 15–41. [Google Scholar] [CrossRef]
  34. Audétat, A.; Günther, D. Mobility and H2O loss from fluid inclusions in natural quartz crystals. Contrib. Mineral. Petr. 1999, 137, 1–14. [Google Scholar] [CrossRef]
  35. Zartman, R.E.; Doe, B.R. Plumbotectonics: The model. Tectonophysics 1981, 75, 135–162. [Google Scholar] [CrossRef]
  36. Ohmoto, H.; Rye, R.O. Isotope of sulfur and carbon. In Geochemistry of Hydrothermal Ore Deposits, 2nd ed.; Barnes, H.L., Ed.; John Wileyand Sons: New York, NY, USA, 1979. [Google Scholar]
  37. Seal, R.R. Sulfur Isotope Geochemistry of Sulfide Minerals. Rev. Mineral. Geochem. 2006, 61, 633–677. [Google Scholar] [CrossRef]
  38. Wang, G.R.; Wu, G.; Xu, L.Q.; Li, X.Z.; Zhang, T.; Quan, Z.X.; Wu, H.; Li, T.G.; Liu, J.; Chen, Y.C. Molybdenite Re–Os age, H–O–C–S–Pb isotopes, and fluid inclusion study of the Caosiyao porphyry Mo deposit in Inner Mongolia, China. Ore Geol. Rev. 2017, 81, 728–744. [Google Scholar] [CrossRef]
  39. Leng, C.B.; Zhang, X.C.; Huang, Z.L.; Huang, Q.Y.; Wang, S.X.; Ma, D.Y.; Luo, T.Y.; Li, C.; Li, W.B. Geology, Re-Os ages, sulfur and lead isotopes of the Diyanqinamu porphyry Mo deposit, Inner Mongolia, NE China. Econ. Geol. 2015, 110, 557–574. [Google Scholar] [CrossRef]
  40. Zhai, D.G.; Liu, J.J.; Tombros, S.; Williams-Jones, A.E. The genesis of the Hashitu porphyry molybdenum deposit, Inner Mongolia, NE China: Constraints from mineralogical, fluid inclusion, and multiple isotope (H, O, S, Mo, Pb) studies. Miner. Depos. 2017, 53, 377–397. [Google Scholar] [CrossRef]
  41. Chen, W.J.; Chu, S.X.; Liu, J.M.; Liu, H.T.; Zeng, Q.D. S and Pb isotopic composition of the Jiguanshan porphyry molybdenum deposit in Inner Mongolia: Indication to the source of ore-forming material. Geol. Explor. 2020, 56, 68–77. [Google Scholar]
  42. Zhang, Z.L.; Liu, J.M.; Zeng, Q.D. SHRIMP zircon U-Pb dating and sulfur isotope compositions of Nianzigou molybdenum deposit in Inner Mongolia and their geological significance. Miner. Depos. 2011, 30, 1122–1128. [Google Scholar]
  43. Zhang, F.F.; Wang, Y.H.; Liu, J.J.; Wang, J.C. Ore genesis and hydrothermal evolution of the Wulandele Mo deposit, Inner Mongolia, Northeast China: Evidence from geology, fluid inclusions and H–O–S–Pb isotopes. Ore Geol. Rev. 2018, 93, 181–199. [Google Scholar] [CrossRef]
  44. Yang, Z.H.; Wang, J.P.; Liu, J.J.; Wang, S.G.; Wang, Q.Y.; Kang, S.G.; Zhang, J.X.; Zhao, Y. Isotope geochemistry of the Wurinitu W-Mo deposit in Sunid Zuoqi, Inner Mongolia, China. Geoscience 2013, 27, 13−23. [Google Scholar]
  45. Wang, Y.H.; Zhang, F.F.; Liu, J.J.; Xue, C.J.; Zhang, Z.C. Genesis of the Wurinitu W-Mo deposit, Inner Mongolia, northeast China: Constraints from geology, fluid inclusions and isotope systematics. Ore Geol. Rev. 2018, 94, 367−382. [Google Scholar] [CrossRef]
  46. Zou, T.; Wang, J.B.; Wang, Y.W.; Yuan, J.M.; Lin, L.J.; Dou, J.L.; Jiang, W.; Li, W.; Ma, X.H. Geological characteristics and genesis of the Aolunhua porphyry Mo-Cu deposit, Inner Mongolia. Geol. Explor. 2011, 47, 737–747. [Google Scholar]
  47. Ma, X.H.; Chen, B. The source of hydrothermal fluids and mineralization in the Aolunhua porphyry Mo-Cu deposit, southern Da Hinggan Mountains: Constraints from stable (C, H, O and S) and radiogenic (Pb) isotopes. J. Jilin Univ. (Earth Sci. Ed.) 2011, 41, 1770–1783. [Google Scholar]
  48. Li, X.; Fu, L.J.; Huang, G.H.; Cui, Z.L.; Wang, K.Y.; Sun, Q.F. Source of ore-forming fluids and metallogenic mechanism in Aolunhua Mo- Cu deposit, Inner Mongolia. Gold 2021, 42, 1–7. [Google Scholar]
  49. Zhang, Z.L.; Zhou, Q.Z.; Liu, J.M.; Zeng, Q.D. Sulfur isotope composition of the Yangchang molybdenum—Copper deposit in Inner Mongolia and its geological significance. Geol. Explor. 2018, 54, 544–551. [Google Scholar]
  50. Han, N. The Study on the Metallogenesis of the Chamuhan W-Mo Deposit, Hexigten Banner, Inner Mongolia; Chinese Academy of Geological Sciences: Beijing, China, 2016. [Google Scholar]
  51. Sun, J.Y. Geology, ore genesis and the source of ore-forming materials in the Xiaodonggou Mo deposit, Inner Mongolia. Xinjiang Nonferr. Met. 2017, 40, 54–60. [Google Scholar]
  52. Chen, P.W.; Zeng, Q.D.; Zhou, T.C.; Chen, J.Q. He, Ar, and S isotopic constraints on the origin of the Dasuji porphyry Mo deposit, China. Arab. J. Geosci. 2021, 14, 437. [Google Scholar] [CrossRef]
  53. Zhang, Y.F.; Liang, S. Geochemistry of ore-forming fluids and genesis of Chagandells molybdenum deposit in Inner Mongolia. Northwest. Geol. 2017, 50, 106–114. [Google Scholar]
  54. Wu, D. Isotopic Geochemistry and Ore-Forming Fluids Evolution of the Sadaigoumen Mo Deposit, Hebei Province, China; China University of Geosciences (Beijing): Beijing, China, 2018. [Google Scholar]
  55. Weng, H.J.; Wei, L.M. The characteristic and genesis of porphyry copper molybdenum deposit from Chehugou, Inner Mongolia. West. Resour. 2014, 2, 126–129. [Google Scholar]
  56. Sun, Y.; Liu, J.M.; Zeng, Q.D.; Wang, J.B.; Zhou, L.L.; Wang, Y.W. Genetic links between porphyry Mo and peripheral quartz vein Mo–Cu mineralization in the Baituyingzi district, eastern Inner Mongolia, NE China. J. Asian Earth Sci. 2018, 165, 305–327. [Google Scholar] [CrossRef]
  57. Taylor, H.P. The application of oxygen and hydrogen isotope studies to problems of hydrothermal alteration and ore deposition. Econ. Geol. 1974, 69, 843−883. [Google Scholar] [CrossRef]
  58. Giggenbach, W.F. Isotopic shifts in waters from geothermal and volcanic systems along convergent plate boundaries and their origin. Earth Planet. Sci. Lett. 1992, 113, 495–510. [Google Scholar] [CrossRef]
  59. Taylor, B.E. Degassing of H2O from rhyolite magma during eruption and shallow intrusion, and the isotopic composition of magmatic water in hydrothermal systems. Magmatic contributions to hydrothermal systems. Geochem. J. 1992, 279, 190–194. [Google Scholar]
  60. Pass, H.E.; Cooke, D.R.; Davidson, G.; Maas, R.; Dipple, G.; Rees, C.; Ferreira, L.; Taylor, C.; Deyell, C.L. Isotope geochemistry of the Northeast Zone, Mount Polley Alkalic Cu-Au-Ag Porphyry Deposit, British Columbia: A case for carbonate assimilation. Econ. Geol. 2014, 109, 859–890. [Google Scholar] [CrossRef]
  61. Doe, B.R.; Zartman, R.E. Plumbotectonics I, the Phanerozoic. In Geochemistry of Hydrothermal Ore Deposits, 2nd ed.; Barnes, H.L., Ed.; John Wiley & Sons Inc.: New York, NY, USA, 1979; pp. 22–70. [Google Scholar]
  62. Chen, P.W.; Zeng, Q.D.; Wang, Y.B.; Zhou, T.C.; Yu, B.; Chen, J.Q. Petrogenesis of the Dasuji porphyry Mo deposit at the northern margin of North China Craton: Constrains from geochronology, geochemistry and isotopes characteristics. Lithos 2018, 322, 87–103. [Google Scholar] [CrossRef]
  63. Chen, P.W.; Liu, B.; Long, Z.; Zhou, L.L.; Fu, Y.; Zeng, Q.D. Ore genesis of the Sadaigoumen porphyry Mo deposit, North China Craton: Constraints from pyrite trace element and lead isotope analyses. Ore Geol. Rev. 2022, 142, 104698. [Google Scholar] [CrossRef]
  64. Hu, R.Z.; Bi, X.W.; Jiang, G.H.; Chen, H.W.; Peng, J.T.; Qi, Y.Q.; Wu, L.Y.; Wei, W.F. Mantle-derived noble gases in ore-forming fluids of the granite-related Yaogangxian tungsten deposit, Southeastern China. Miner. Depos. 2012, 47, 623–632. [Google Scholar] [CrossRef]
  65. Burnard, P.G.; Hu, R.Z.; Turner, G.; Bi, X.W. Mantle, crustal and atmospheric noble gases in Ailaoshan gold deposits, Yunnan province, China. Geochim. Cosmochim. Acta 1999, 63, 1595–1604. [Google Scholar] [CrossRef]
  66. Stuart, F.M.; Burnard, P.G.; Taylor, R.E.A.; Turner, G. Resolving mantle and crustal contributions to ancient hydrothermal fluids: H-Ar isotopes in fluid inclusions from Dae Hwa W-Mo mineralisation, South Korea. Geochim. Cosmochim. Acta 1995, 59, 4663–4673. [Google Scholar]
  67. Turner, G.; Stuart, F.M. Helium/heat ratios and deposition temperatures of sulphides from the ocean floor. Nature 1992, 357, 581–583. [Google Scholar] [CrossRef]
  68. Simmons, S.F.; Sawkins, F.J.; Schlutter, D.J. Mantle-derived helium in two Peruvian hydrothermal ore deposits. Nature 1987, 329, 429–432. [Google Scholar] [CrossRef]
  69. Kendrick, M.A.; Burgess, R.; Pattrick, R.A.; Turner, G. Fluid inclusion noble gas and halogen evidence on the origin of Cu-porphyry mineralizing fluids. Geochim. Cosmochim. Acta 2001, 65, 2651–2668. [Google Scholar] [CrossRef]
  70. Anderson, D.L. The statistics and distribution of helium in the mantle. Int. Geol. Rev. 2000, 42, 289–311. [Google Scholar] [CrossRef]
  71. Ballentine, C.J.; Burgess, R.; Marty, B. Tracing fluid origin, transport and interaction in the crust. Rev. Mineral. Geochem. 2002, 47, 539–614. [Google Scholar] [CrossRef]
  72. Rusk, B.G.; Reed, M.H.; Dilles, J.H. Fluid inclusion evidence for magmatic-hydrothermal fluid evolution in the porphyry copper-molybdenum deposit at Butte, Montana. Econ. Geol. 2008, 103, 307–334. [Google Scholar] [CrossRef]
  73. Cline, J.S.; Bodnar, R.J. Direct evolution of brine from crystallizing silicic melt at the Questa, New Mexico, Molybdenum deposit. Econ. Geol. 1994, 89, 1780–1802. [Google Scholar] [CrossRef]
  74. Ulrich, T.; Günther, D.; Heinrich, C.A. The evolution of a porphyry Cu-Au deposit, based on LA-ICP-MS analysis of fluid inclusions: Bajo de la Alumbrera, Argentina. Econ. Geol. 2002, 97, 1889–1920. [Google Scholar] [CrossRef]
  75. Shepherd, T.J.; Rankin, A.H.; Alderton, D.H.M. A Practical Guide to Fluid Inclusion Studies; Chapman & Hall: Milwaukee, WI, USA, 1985; p. 239. [Google Scholar]
  76. Xiong, Y.Q.; Shao, Y.J.; Mao, J.W.; Wu, S.C.; Zhou, H.D.; Zheng, M.H. The polymetallic magmatic-hydrothermal Xiangdong and Dalong systems in the W–Sn–Cu–Pb–Zn–Ag Dengfuxian orefield, SE China: Constraints from geology, fluid inclusions, H–O–S–Pb isotopes, and sphalerite Rb–Sr geochronology. Miner. Depos. 2019, 54, 1101–1124. [Google Scholar] [CrossRef]
  77. Wei, W.F.; Hu, R.Z.; Bi, X.W.; Peng, J.T.; Su, W.C.; Song, S.Q.; Shi, S.H. Infrared microthermometric and stable isotopic study of fluid inclusions in wolframite at the Xihuashan tungsten deposit, Jiangxi province, China. Miner. Depos. 2012, 47, 589–605. [Google Scholar] [CrossRef]
  78. Pirajno, F. Hydrothermal Mineral Deposits; Springer: Berlin/Heidelberg, Germany, 2009; p. 1250. [Google Scholar]
  79. Putnis, A. Mineral replacement reactions. Rev. Mineral. Geochem. 2009, 70, 87–124. [Google Scholar] [CrossRef]
  80. Guillemette, N.; Williams-Jones, A.E. Genesis of the Sb-W-Au deposits at Ixtahuacan, Guatemala: Evidence from fluid inclusions and stable isotopes. Miner. Depos. 1993, 28, 167–180. [Google Scholar] [CrossRef]
  81. Zhao, X.Y.; Zhong, H.; Hu, R.Z.; Mao, W.; Bai, Z.J.; Lan, T.G.; Xue, K. Evolution of Multistage Hydrothermal Fluids in the Luoboling Porphyry Cu-Mo Deposit, Zijinshan Ore Field, Fujian Province, China: Insights from LA-ICP-MS Analyses of Fluid Inclusions. Econ. Geol. 2021, 116, 581–606. [Google Scholar] [CrossRef]
  82. Baker, T.; Van Achterberg, E.; Ryan, C.G.; Lang, J.R. Composition and evolution of ore fluids in a magmatic-hydrothermal skarn deposit. Geology 2004, 32, 117–120. [Google Scholar] [CrossRef]
  83. Shu, Q.H.; Chang, Z.S.; Hammerli, J.; Lai, Y.; Huizenga, J.M. Composition and Evolution of Fluids Forming the Baiyinnuo’er Zn-Pb Skarn Deposit, Northeastern China: Insights from Laser Ablation ICP-MS Study of Fluid Inclusions. Econ. Geol. 2017, 112, 1441–1460. [Google Scholar]
  84. Shu, Q.H.; Chang, Z.S.; Mavrogenes, J. Fluid compositions reveal fluid nature, metal deposition mechanisms, and mineralization potential: An example at the Haobugao Zn-Pb skarn, China. Geology 2021, 49, 473–477. [Google Scholar] [CrossRef]
  85. Stoffell, B.; Appold, M.S.; Wilkinson, J.J.; McClean, N.A.; Jeffries, T.E. Geochemistry and evolution of mississippi valley-type mineralizing brines from the tri-state and northern arkansas districts determined by LA-ICP-MS microanalysis of fluid inclusions. Econ. Geol. 2008, 103, 1411–1435. [Google Scholar] [CrossRef]
  86. Stein, H.J. Dating and tracing the history of ore formation. In Treatise in Geochemistry, 2nd ed.; Turekian, K.K., Holland, H.D., Scott, S.D., Eds.; Elsevier-Pergamon: Oxford, UK, 2014; Volume 12. [Google Scholar]
  87. Zhang, L.C.; Wu, H.Y.; Wan, B.; Chen, Z.G. Ages and geodynamic settings of Xilamulun Mo–Cu metallogenic belt in the northern part of the North China Craton. Gondwana Res. 2009, 16, 243−254. [Google Scholar] [CrossRef]
  88. Zhang, Z.J.; Cheng, Q.M.; Wu, G.P.; Hu, X.L. Petrogenesis of the Quanzigou porphyry Mo deposit at the northern margin of the North China Craton: Constrains from geochronology, geochemistry, and Sr–Nd–Hf isotopes characteristics. J. Geochem. Explor. 2021, 231, 106681. [Google Scholar] [CrossRef]
  89. Annen, C.; Blundy, J.D.; Sparks, R.S.J. The genesis of intermediate and silicicmagmas in deep crustal hot zones. J. Petrol. 2006, 47, 505−539. [Google Scholar] [CrossRef]
  90. Lehmann, B.; Ishihara, S.; Michel, H.; Miller, J.; Rapela, C.; Sanchez, A.; Tistl, M.; Winkelmann, L. The Bolivian tin province and regional tin distribution in the Cental Andes: A reassessment. Econ. Geol. 1990, 85, 1044–1058. [Google Scholar] [CrossRef]
  91. Ballouard, C.; Poujol, M.; Boulvais, P.; Branquet, Y.; Tartèse, R.; Vigneresse, J.L. Nb-Ta fractionation in peraluminous granites: A marker of the magmatic-hydrothermal transition. Geology 2016, 44, 231–234. [Google Scholar]
Figure 1. (a) Location of the NCC (after [17]). (b) Regional structure and spatial occurrence of major porphyry Mo deposits on the NCC northern margin (after [4]). (c) Simplified geological map of the Chaijiagou Mo deposit and adjacent areas (after [9]). Porphyry Mo deposits: 1—Diyanqinamu; 2—Wulandele; 3—Wurinitu; 4—Zhunsujihua; 5—Hashitu; 6—Aolunhua; 7—Haolibao; 8—Banlashan; 9—Laojiagou; 10—Yangchang; 11—Nailinggou; 12—Chamuhan; 13—Hongshanzi; 14—Xiaodonggou; 15—Jiguanshan; 16—Chehugou; 17—Nianzigou; 18—Yuanbaoshan; 19—Baituyingzi; 20—Kulitu; 21—Xiaojiayingzi; 22—Lanjiagou; 23—Yangjiazhangzi; 24—Chaganhua; 25—Chagandeersi; 26—Dasuji; 27—Caosiyao; 28—Sadaigoumen; 29—Dacaoping; 30—Dazhuangke.
Minerals 16 00071 g001
Figure 2. (a) Simplified geological map and (b) cross-section along an exploration line through the Chaijiagou Mo deposit (after [9]).
Minerals 16 00071 g002
Figure 3. Characteristic mineralization relationships at Chaijiagou. (a) Stage 2.1 quartz–molybdenite–chalcopyrite–pyrite vein cutting Stage 1 quartz–K–feldspar–magnetite assemblage; (b) Stage 2.1 quartz–molybdenite–chalcopyrite–pyrite vein cutting Stage 1 quartz–magnetite vein; (c) Stage 3 quartz–pyrite vein cross-cutting Stage 2.2 quartz–molybdenite–pyrite mineralization; (d) Stage 2.2 quartz–molybdenite–pyrite vein cross-cutting Stage 1 quartz–magnetite vein; (e) Stage 2.2 quartz–molybdenite–pyrite vein cutting both Stage 1 barren quartz vein and Stage 2.1 quartz–molybdenite–chalcopyrite vein; (f) Stage 3 quartz–pyrite–sphalerite vein cross-cutting Stage 2.1 quartz–molybdenite–chalcopyrite vein; (g) Stage 3 quartz–pyrite–galena–sphalerite vein cross-cutting Stage 2.2 quartz–molybdenite vein; (h) Stage 4 quartz–pyrite vein cutting Stage 2.2 quartz–molybdenite vein; (i) Stage 4 quartz–pyrite–calcite–fluorite vein cross-cutting Stage 3 quartz–galena–sphalerite vein. Abbreviations: Fl = fluorite; Cal = calcite; Kfs = K-feldspar; Qtz = quartz; Sp = sphalerite; Gn = galena; Py = pyrite; Ccp = chalcopyrite; Mol = molybdenite; Mt = magnetite.
Minerals 16 00071 g003
Figure 4. Representative photomicrographs showing mineralogical relationships at Chaijiagou. (a) Molybdenite crystals from Stage 2.1 veins; (b) Chalcopyrite occurrence in Stage 2.1; (c) Chalcopyrite replacing pyrite along grain boundaries, with subsequent covellite alteration along fractures; (d) Molybdenite of Stage 2.2 veins; (e) Intergrown molybdenite and pyrite assemblage in Stage 2.2; (f) Sphalerite with chalcopyrite disease of Stage 3; (g) Galena in Stage 3 veins; (h) Sphalerite and galena replacing pyrite along margins and fractures; (i) Pyrite grains from Stage 3 containing chalcopyrite and galena inclusions. Abbreviations: Cv = covellite; Gn = galena; Sp = sphalerite; Py = pyrite; Ccp = chalcopyrite; Mol = molybdenite.
Minerals 16 00071 g004
Figure 5. Representative hand specimen and photomicrographs of the main hydrothermal alteration from the Chaijiagou deposit. (a) K-feldspathization and sericitization; (b) Granite porphyry contains sericitization, quartz vein, and calcite vein; (c) Chloritization and carbonatization; (d) Fluoritization, chloritization, and carbonatization; (e) Biotite replaced by chlorite (plane-polarized light); (f) Sericite replacing K-feldspar (crossed-polarized light); (g) Plagioclase replaced by sericite (crossed-polarized light); (h) Calcite replacing K-feldspar (crossed-polarized light). Abbreviations: Kfs = K-feldspar; Ser = sericite; Cal = calcite; Qtz = quartz; Chl = chlorite; Fl = fluorite; Pl = plagioclase.
Minerals 16 00071 g005
Figure 6. Paragenesis of minerals in the Chaijiagou Mo deposit.
Minerals 16 00071 g006
Figure 7. Representative photomicrographs of FIs in quartz veins at Chaijiagou. (a) S- and V-type FIs coexisting in Stage 1 quartz; (b) Boiling FIA comprising L-, V-, and S-types in Stage 2.1; (c) L-, V-, and S-type FIs documenting phase separation during Stage 2.2; (d) Isolated S-type FI hosted in Stage 2.2 quartz; (e) Primary L-type FIs forming a FIA in Stage 3; (f) Cluster of L-type FIs characterizing Stage 4 mineralization. Abbreviation: H = halite; LH2O = liquid H2O; VH2O = vapor H2O.
Minerals 16 00071 g007
Figure 8. Histograms of homogenization temperatures (a,c,e,g,i) and salinities (b,d,f,h,j) for FIs from the Chaijiagou Mo deposit according to the concept of FIAs.
Minerals 16 00071 g008
Figure 9. Homogenization temperature vs. salinity of FIs from all stages.
Minerals 16 00071 g009
Figure 10. (a) Histogram of δ34S values for pyrite from the Chaijiagou Mo deposit. (b) Comparison of δ34S values from the Chaijiagou deposit with the regional Mesozoic Mo mineralized systems.
Minerals 16 00071 g010
Figure 11. Diagrams of (a) 207Pb/204Pb vs. 206Pb/204Pb and (b) 208Pb/204Pb vs. 206Pb/204Pb (after [35]).
Minerals 16 00071 g011
Figure 12. Diagrams of 40Ar/36Ar vs. 3He/36Ar (a), R/Ra vs. 40Ar/36Ar (b), 3He vs. 4He (c), and R/Ra vs. 40Ar*/4He (d).
Minerals 16 00071 g012
Disclaimer/Publisher’s Note: The statements, opinions and data contained in all publications are solely those of the individual author(s) and contributor(s) and not of MDPI and/or the editor(s). MDPI and/or the editor(s) disclaim responsibility for any injury to people or property resulting from any ideas, methods, instructions or products referred to in the content.