Article

Clay-Hosted Lithium Exploration in the Wenshan Region of Southeastern Yunnan Province, China, Using Multi-Source Remote Sensing and Structural Interpretation

1
School of Earth Sciences, Yunnan University, Kunming 650500, China
2
Yunnan International Joint Laboratory of China-Laos-Bangladesh-Myanmar Natural Resources Remote Sensing Monitoring, Kunming 650500, China
3
Research Center of Domestic High-Resolution Satellite Remote Sensing Geological Engineering, Universities in Yunnan Province, Kunming 650500, China
4
Yunnan Key Laboratory of Sanjiang Metallogeny and Resources Exploration and Utilization, Kunming 650051, China
5
Yunnan Geological and Mineral Exploration and Development Bureau Second Geological Team, Wenshan 663000, China
6
Geological Science Research Institute of Yunnan Province, Kunming 650051, China
*
Author to whom correspondence should be addressed.
Minerals 2025, 15(8), 826; https://doi.org/10.3390/min15080826 (registering DOI)
Submission received: 4 June 2025 / Revised: 15 July 2025 / Accepted: 29 July 2025 / Published: 2 August 2025

Abstract

With the rapid increase in global lithium demand, the exploration of newly discovered lithium in the bauxite of the Wenshan area in southeastern Yunnan has become increasingly important. However, the current research on clay-type lithium in the Wenshan area has primarily focused on local exploration, and large-scale predictive metallogenic studies remain limited. To address this, this study utilized multi-source remote sensing data from ZY1-02D and ASTER, combined with ALOS 12.5 m DEM and Sentinel-2 imagery, to carry out remote sensing mineral identification, structural interpretation, and prospectivity mapping for clay-type lithium in the Wenshan area. This study indicates that clay-type lithium in the Wenshan area is controlled by NW, EW, and NE linear structures and are mainly distributed in the region from north of the Wenshan–Malipo fault to south of the Guangnan–Funing fault. High-value areas of iron-rich silicates and iron–magnesium minerals revealed by ASTER data indicate lithium enrichment, while montmorillonite and cookeite identification by ZY1-02D have strong indicative significance for lithium. Field verification samples show the highest Li2O content reaching 11,150 μg/g, with six samples meeting the comprehensive utilization criteria for lithium in bauxite (Li2O ≥ 500 μg/g) and also showing an enrichment of rare earth elements (REEs) and gallium (Ga). By integrating stratigraphic, structural, mineral identification, geochemical characteristics, and field verification data, ten mineral exploration target areas were delineated. This study validates the effectiveness of remote sensing technology in the exploration of clay-type lithium and provides an applicable workflow for similar environments worldwide.

1. Introduction

Rare metal lithium (Lithium, Li) is hailed as the “new energy metal of the 21st century” and the “metal promoting world progress”, possessing extremely high economic and strategic value [1,2]. With the rapid development of electric vehicles (EVs) and the new energy industry, the global demand for lithium resources is growing rapidly [3,4,5]. Lithium resources are typically classified into three types: brine-type in lacustrine evaporite formations, granite–pegmatite-type deposits, and sedimentary clay-type deposits, with salt lake brines and pegmatites being the primary sources of lithium [6,7]. However, in recent years, due to the substantial reserve potential of clay-type lithium resources, they gained increasing attention and are considered an important component of future lithium resource development [7,8]. Therefore, refining exploration strategies and widening the scope of targets for clay-type lithium resources holds significant practical value.
Clay-type lithium resources have been discovered in numerous countries, including the United States, Mexico [9], Afghanistan [10], and Mozambique [11], and are associated with igneous rocks formed from clastic sediments or volcanic ash through hydrothermal alteration or the action of hypersaline brines [12,13,14]. With the support of the national key research and development plan in the southwestern region of China, a new type of clay-type lithium resource—“carbonate-hosted clay-type lithium deposit”—has been discovered [15]. This subtype is distinct from conventional clay-hosted lithium deposits, as it is characterized by lithium-rich claystones developed from the weathering and sedimentary transformation of carbonate rocks, such as dolomite and limestone [15]. The lithium-enriched rock systems of these deposits developed above the unconformity surfaces of carbonate formations, where the weathering and depositional processes of these carbonates serve as the primary mechanism for the formation of lithium-rich claystones. Currently, the main ore-bearing strata for clay-type lithium resources are identified as the Lower Carboniferous Jiujialu Formation (C1jj) in Guizhou and the Lower Permian Daoshitou Formation (P1d) in central Yunnan, both of which are enriched bauxite ore layers [15,16]. Lithium is mainly hosted in clay minerals such as montmorillonite, chlorite, and cookeite, which occur in iron- and magnesium-bearing lithological environments. These minerals serve as important hosts for lithium through mechanisms such as the interlayer ion insertion, adsorption, and formation of secondary phases [8,17,18].
In recent years, clay-type lithium occurrences have been identified for the first time within bauxite-rich formations in the Wenshan region, showcasing immense potential for mineral exploration. In 2022, during preliminary mineral research in the southeastern Wenshan area, the Second Geological Team of the Yunnan Provincial Bureau of Geological and Mineral Exploration and Development made key breakthroughs at the Zhewa lithium occurrences in Xichou County and the Xiaohuayuan lithium occurrences in Yanshan County. Li2O concentrations ranging from 1022 μg/g to 6282 μg/g were detected, underscoring the importance and feasibility of conducting lithium exploration in the Wenshan region. By integrating the metallogenic characteristics of carbonate clay-type lithium resources with the regional geological context, comprehensive studies on prospecting indicators and ore-controlling factors will provide critical support for future lithium exploration efforts.
Satellite remote sensing technology offers unique advantages in detecting surface rock and mineral compositions [19,20,21]. In recent years, it has been successfully applied to lithium resources detection and the identification of pegmatite-type lithium deposits across various regions, including Portugal, Spain [9], China [22], Afghanistan [10], and Mozambique [11]. Concurrently, scholars have efficiently identified minerals associated with clay-type lithium—such as montmorillonite, chlorite, kaolinite, illite, and dolomite—using ASTER and ZY1-02D data [19,20,23]. Furthermore, by integrating Sentinel-2 imagery with ALOS 12.5 m DEM data, researchers have achieved notable results in interpreting regional geological structures [19,24,25].
However, there is currently a lack of studies utilizing remote sensing techniques specifically for the identification of relevant minerals and the delineation of targets associated with clay-type lithium resources. Furthermore, comprehensive structural interpretation and mineralogical analysis across the broader Wenshan region remain limited, particularly with regard to their application to lithium exploration. In this study, we integrate ALOS 12.5 m DEM data and Sentinel-2 imagery to systematically interpret the geological structures of the Wenshan area. We also utilize ASTER and ZY1-02D data to identify lithium-bearing minerals associated with clay-type lithium deposits, supporting more precise targeting for exploration. By combining lithium geochemical data, known lithium occurrences, and field verification in the Wenshan region, this research analyzes the ore-controlling factors of clay-type lithium deposits, summarizes key prospecting indicators, delineates exploration targets, and provides important theoretical guidance for future mineral exploration in the area.

2. Overview of the Study Area

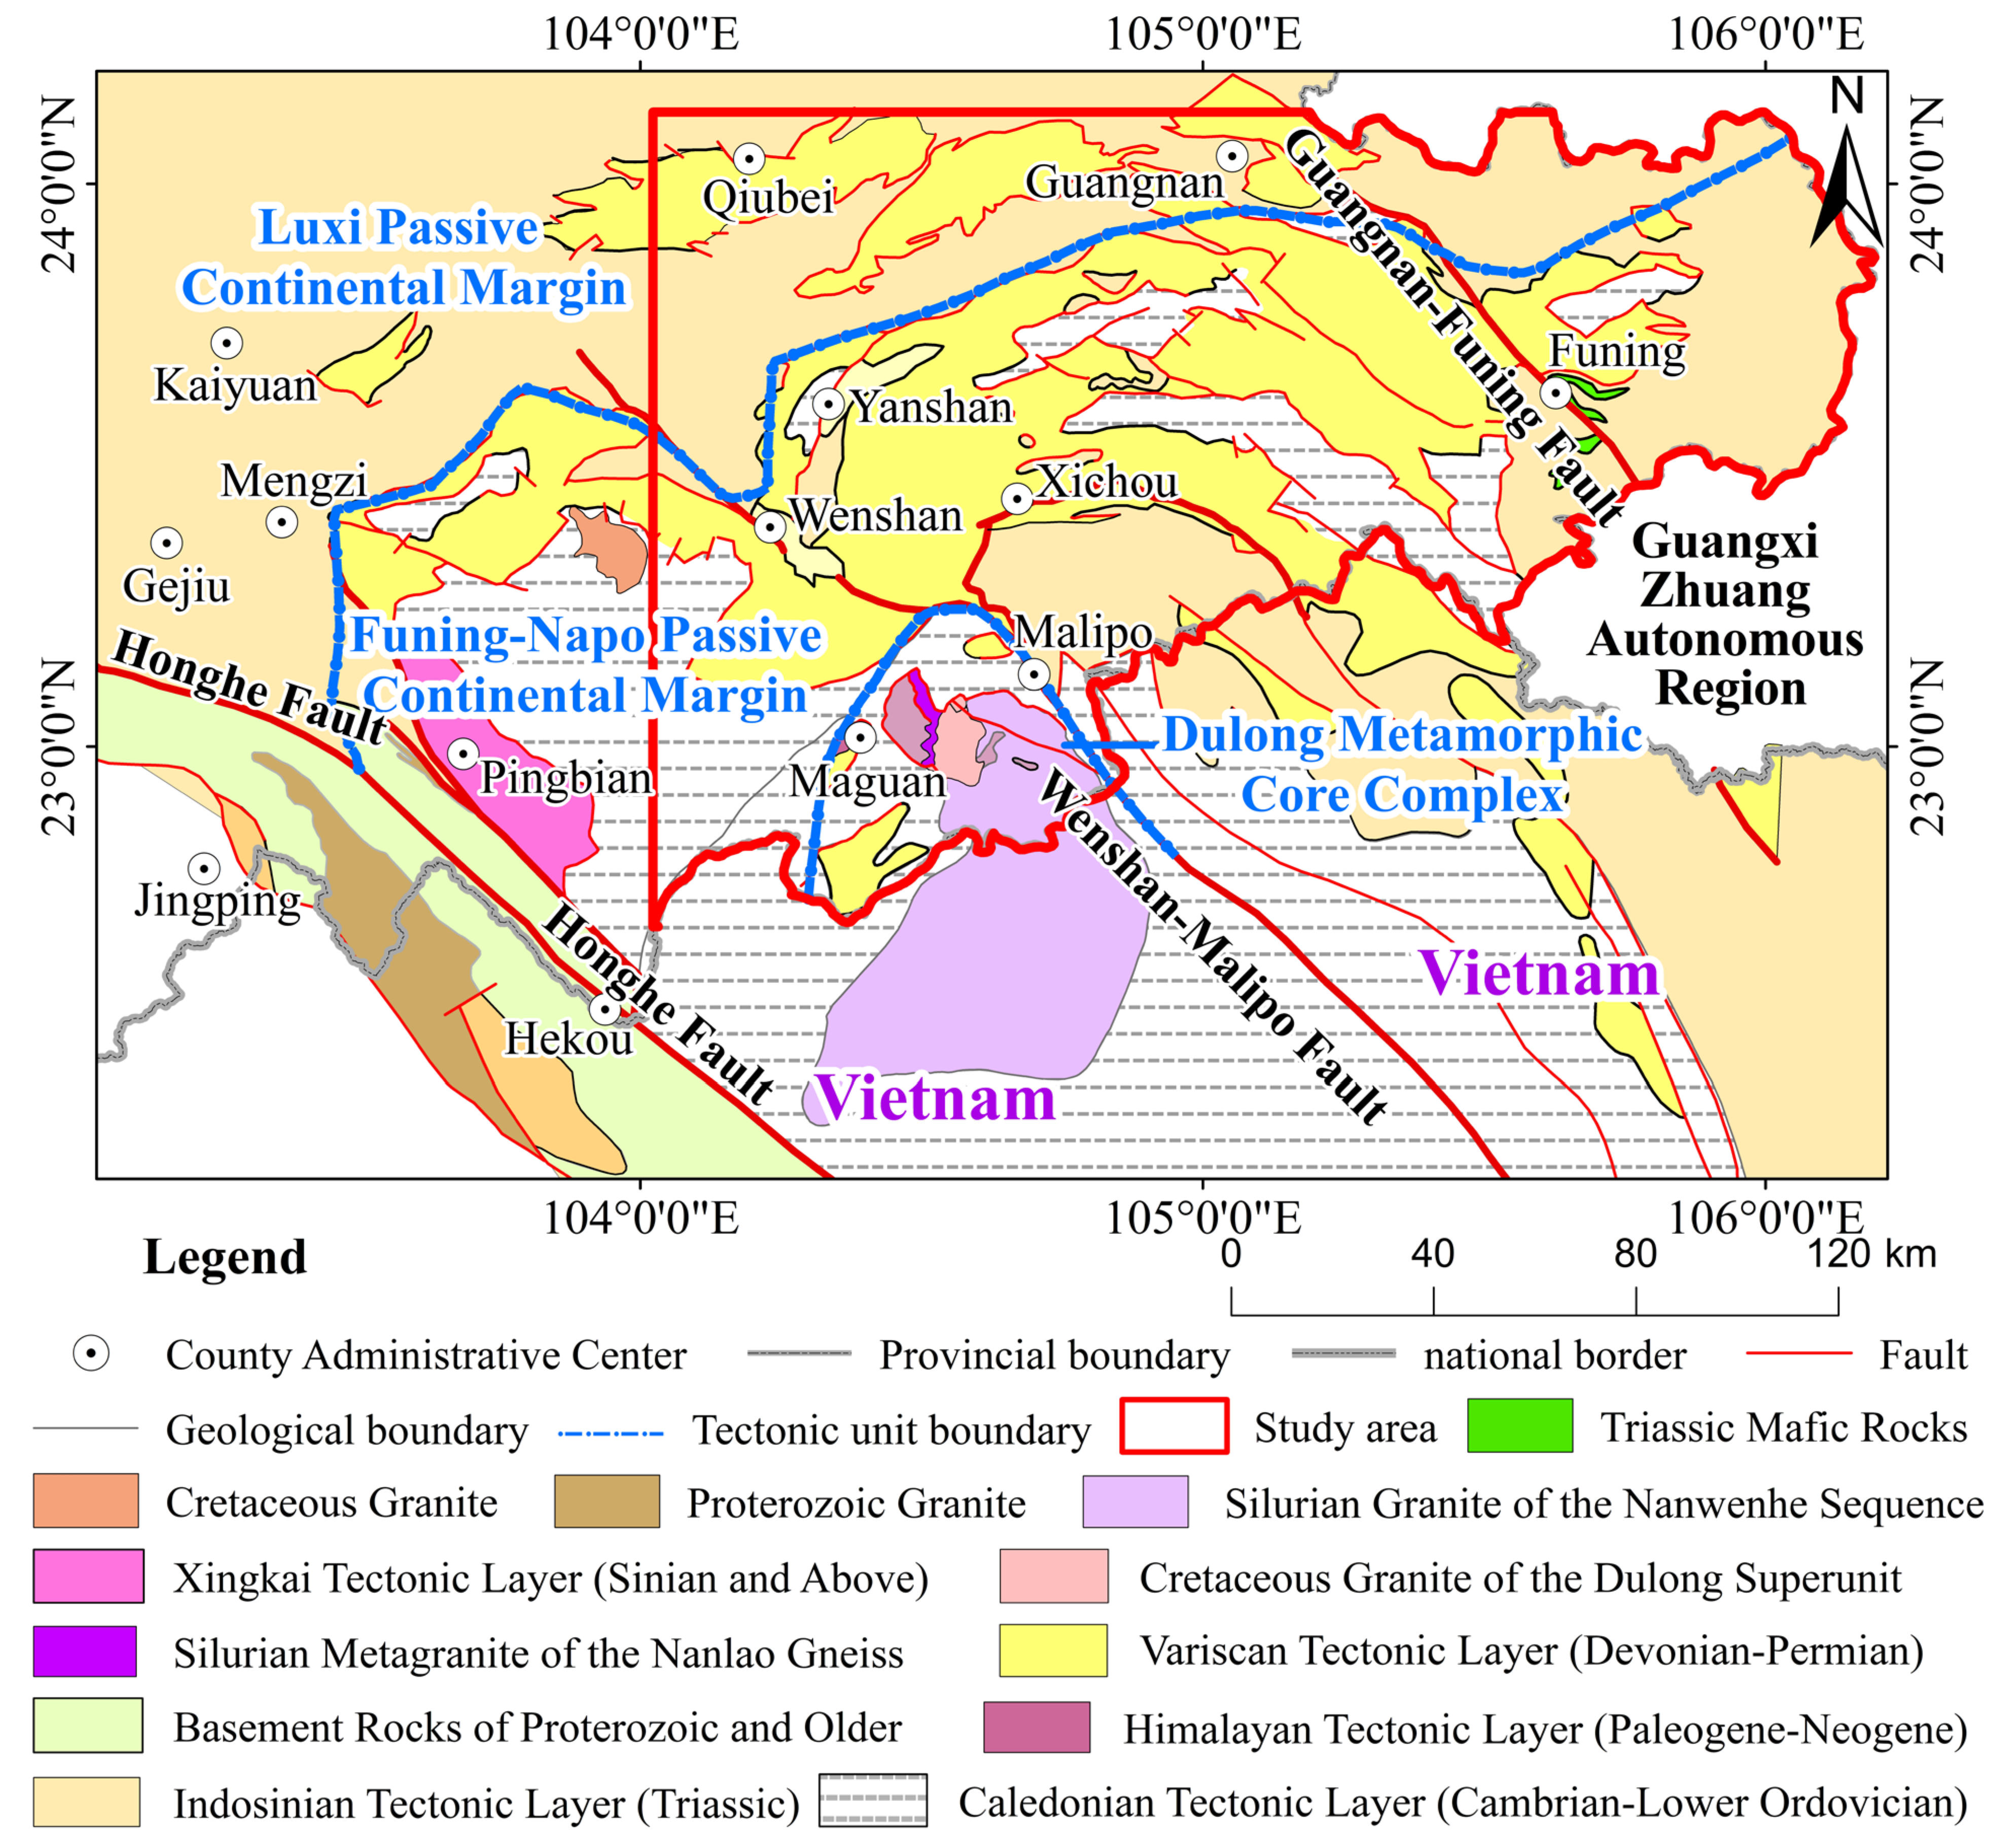
2.1. Geographical Location of the Study Area

The study area is located in the southeastern part of Yunnan Province, extending eastward from 104°01′22″ E to the provincial border of Yunnan, and southward from 24°07′55″ N to the provincial and national borders of China. Administratively, it falls under the jurisdiction of eight counties and cities in Wenshan Prefecture, Yunnan Province, covering an area of approximately 20,950 square kilometers.

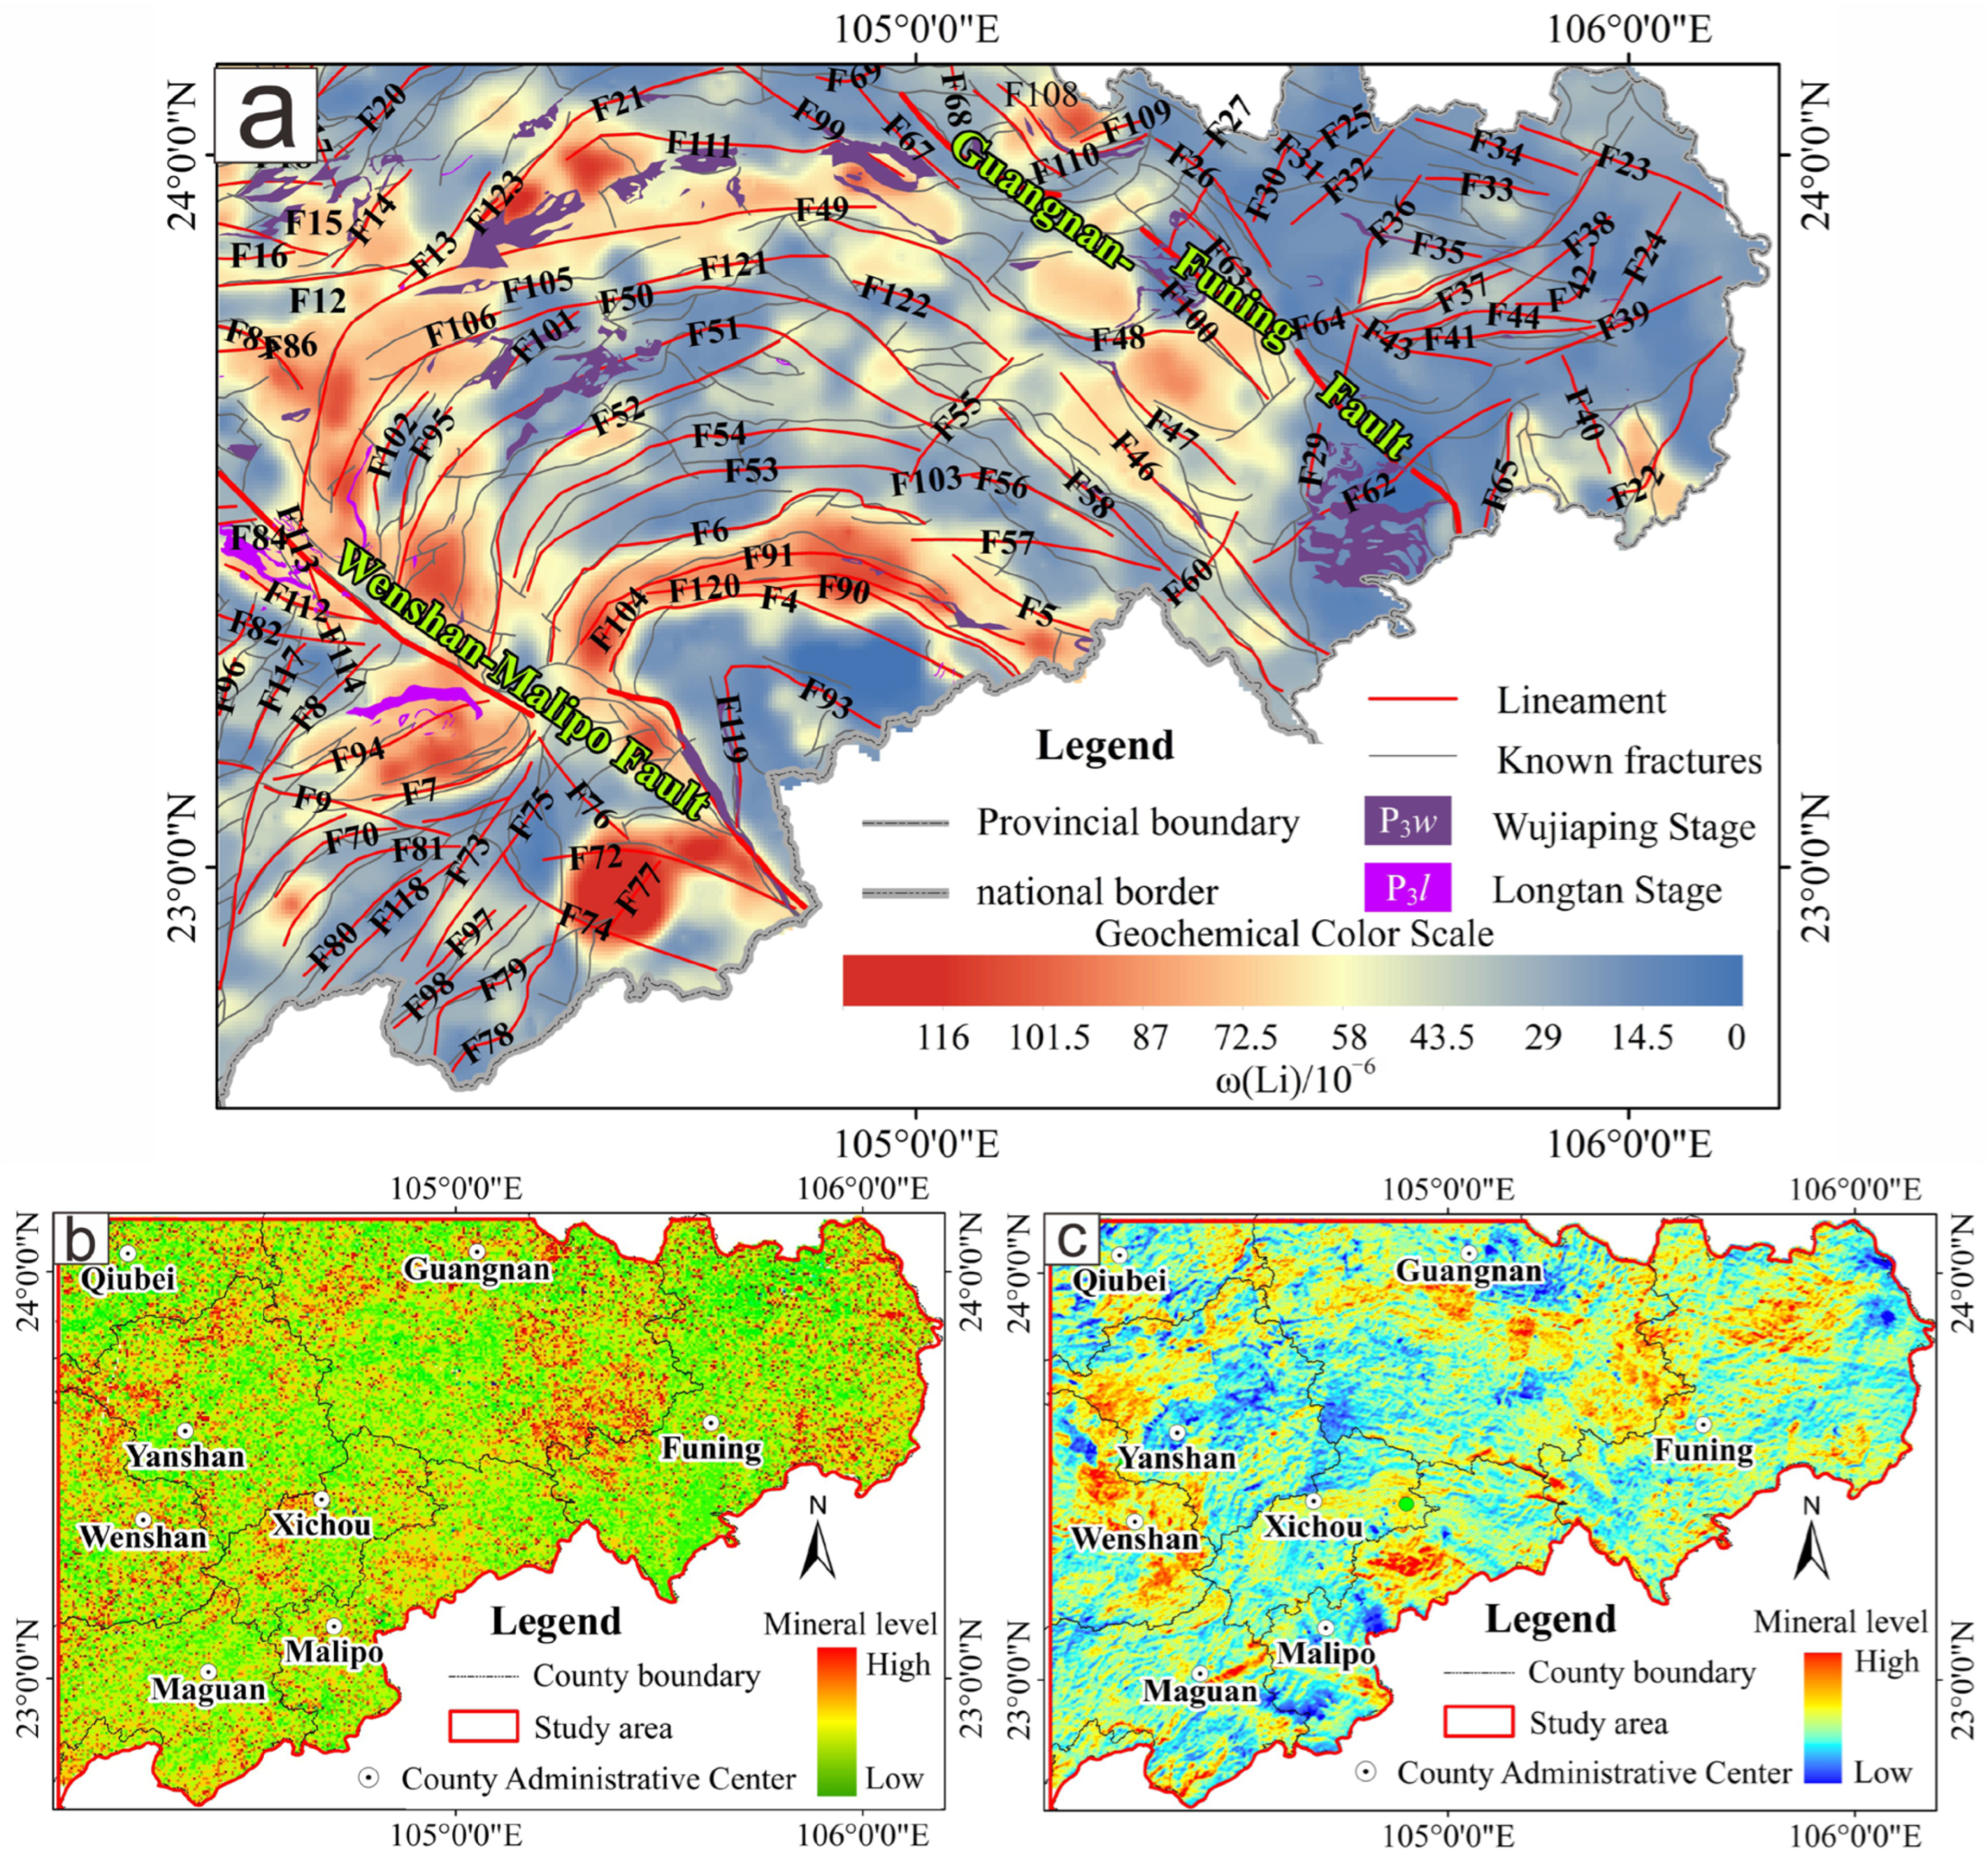
2.2. Regional Geology

2.2.1. Metallogenic Geological Background

From the perspective of tectonics and regional paleogeography, the study area is located to the east of the Red River Fault, in the central part of the Yangtze Plate. During the Permian period, the study area was bordered by the West Sichuan Central Yunnan Massif to the west, adjacent to the Cathaysian Block the east, and adjacent to the Ping Ma-N Viet Nam Old Land to the south, belonging to the northern marginal subsidence area of the Ping Ma-N Viet Nam Old Land. In the Late Permian period, the area was on the edge of the N Viet Nam Old Land in a long and narrow coastal marsh environment, with sedimentary environments dominated by muddy, low-energy coastal areas and restricted shallow seas (Figure 1) [26,27]. In the transitional environment where the paleocontinent and paleo-ocean met, the anoxic, low-energy coastal marshes, lagoons, and the confined, enclosed paleobays (basins) between the paleocontinents provided favorable geological settings for the enrichment of lithium and the formation of high-concentration ore deposits [28]. Therefore, the study area possesses geological conditions conducive to lithium enrichment.
During the Proto-Tethys phase (pre-Neoproterozoic), the study area comprised seamounts and oceanic islands with Precambrian fold belts or a crystalline basement within the Tethys Ocean between the Gondwana and Laurasia continents (represented by the Ailaoshan, Pingbian, and Mengdong rock groups). In the Paleo-Tethys phase, the Caledonian period witnessed the amalgamation of landmasses, followed by alternating evolution during the Hercynian period. Subsequently, the area became part of the Youjiang Indosinian passive continental margin rift basin. The orogeny in the Late Indosinian phase caused the closure and subduction of the Paleo-Tethys Ocean, leading to the amalgamation of the South China and Indosinian microplates, which marked the onset of the Yanshanian intracontinental orogeny. By the Late Jurassic to Early Cretaceous period, the area entered the continental collision orogeny phase. The Himalayan movement, which resulted from the convergence and collision of the Indian and Eurasian plates, caused lateral extrusion extension effects, ultimately shaping the region’s tectonic framework (Figure 2) [27,30,31].
The magmatic activities in the area are dominated by the eruption of submarine basic volcanic rocks in the Hercynian–Indosinian period and the intrusion (eruption) of basic (ultrabasic) and acidic magma in the Indosinian–Yanshan period. Affected by the Hercynian movement, the basalt in the Middle–Late Permian began to erupt, and the eruption range was very wide, forming the Emeishan basalt group. The Dongwu movement in the Middle–Late Permian caused rapid differential uplift of the regional crust, which caused the underlying strata (including the Emeishan basalt) to undergo long-term weathering and denudation [27,30].

2.2.2. Regional Stratigraphy

The study area hosts extensive strata ranging in age from the Proterozoic to the Cenozoic, excluding the Jurassic and Cretaceous periods. Bauxite deposits are primarily hosted within the Upper Permian Wujiaping Formation (P3w) and Longtan Formation (P3l), which are contemporaneous but differ in facies, displaying marine–terrestrial interfingering coal-bearing sequences [32]. Both formations are key bauxite-bearing units in the Wenshan area. Given the established correlation between bauxite-bearing strata and lithium-rich clay deposits—such as those in the Jiujialu Formation (C1jj) in Guizhou and the Daoshitou Formation (P1d) in central Yunnan—bauxite and lithium deposits are considered mutual prospecting indicators in these geological settings [15].
The Wujiaping Formation (P3w) is mainly distributed to the east of the Wenshan–Yanshan–Qiubei line (Figure 3) and is characterized as coastal–shallow marine platform sedimentation. The lower part consists of brownish-red bauxite and bauxitic mudstone; the middle and upper parts are dominated by dark gray, gray-black medium-thin-bedded limestone, dolomitic limestone, bioclastic limestone, and dolostone, with local interbeds of siliceous rocks. Overall, it is primarily characterized by gray medium-thick-bedded blocky micritic limestone, chert nodule-bearing limestone, and bioclastic limestone.
The Longtan Formation (P3l) is mainly distributed to the west of the Wenshan–Yanshan–Qiubei line (Figure 3) and is a typical marine–terrestrial interfingering coal-bearing sediment. The lower part consists of grayish-brown to reddish-brown ferruginous mudstone, ferruginous–bauxitic mudstone, and bauxite, with dense blocky, clastic, pisoidal, and granular structures, and well-developed massive and banded structures, commonly with disseminated or strawberry-like pyrite; the middle part is gray to brownish-gray silty mudstone interbedded with dark gray, gray-black carbonaceous mudstone and thin coal seams; the upper part consists of limestone and siliceous limestone, with local interbeds of siliceous rocks.

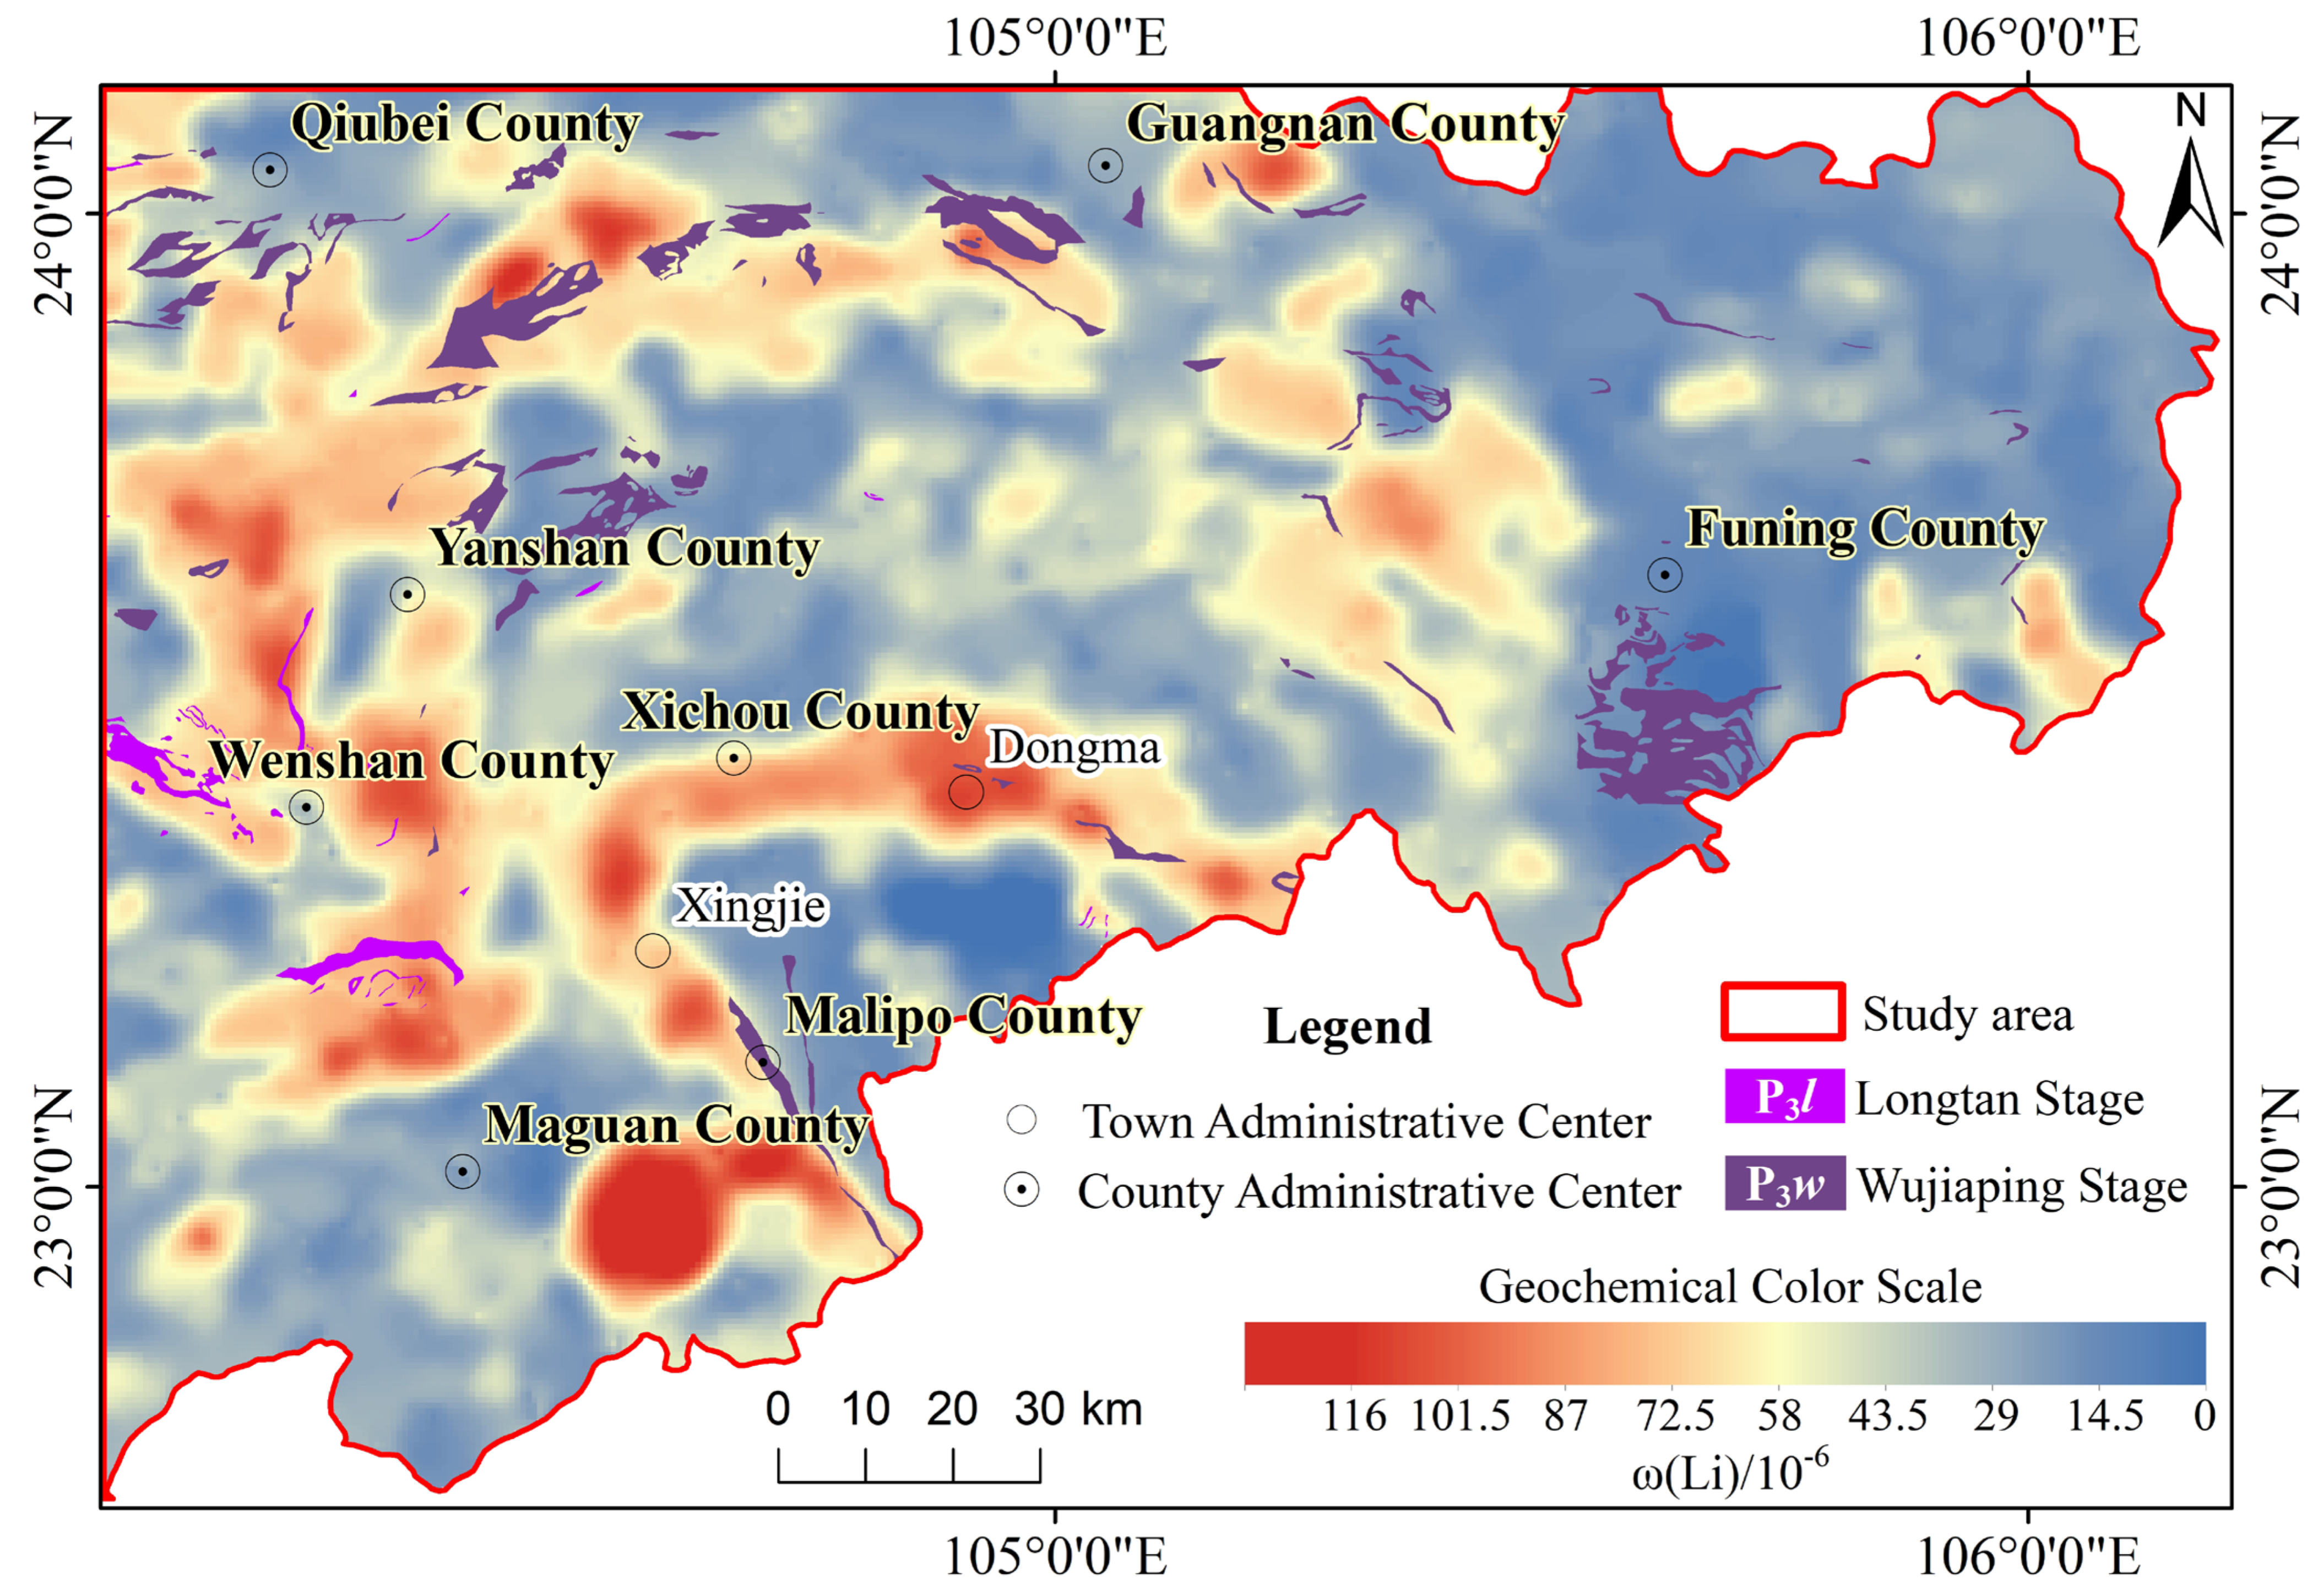
2.2.3. Geochemical Characteristics of Lithium in the Wenshan Region

The geochemical distribution of lithium in the Wenshan area of southeastern Yunnan is shown in Figure 3 [33]. This figure is taken from the “Yunnan Province Geophysical and Geochemical Atlas” (Geological Publishing House), compiled based on 1:200,000 stream sediment measurement data points, with a data grid density of 2 km × 2 km. The lithium geochemical anomaly areas in the Wenshan region generally present two sets of approximately parallel arc-shaped belts, with the outer arc being the Wenshan–Yanshan–Guangnan–Funing lithium anomaly belt, and the inner arc distributed in the Dongma-Xingjie Town area of Xichou County. The anomaly distribution is controlled by regional structures, strata, and rocks, with lithium background values higher than the surrounding areas. Except for the Laojun Mountain rock body in Maguan, the concentration gradient belts shown in the lithium geochemical map are mainly controlled by the regional iron–aluminum rock series, and their distribution highly coincides with the exposure areas of the Permian Wujia Ping Formation (P3w) and Longtan Formation (P3l) on the 1:200,000 geological map (Figure 3).

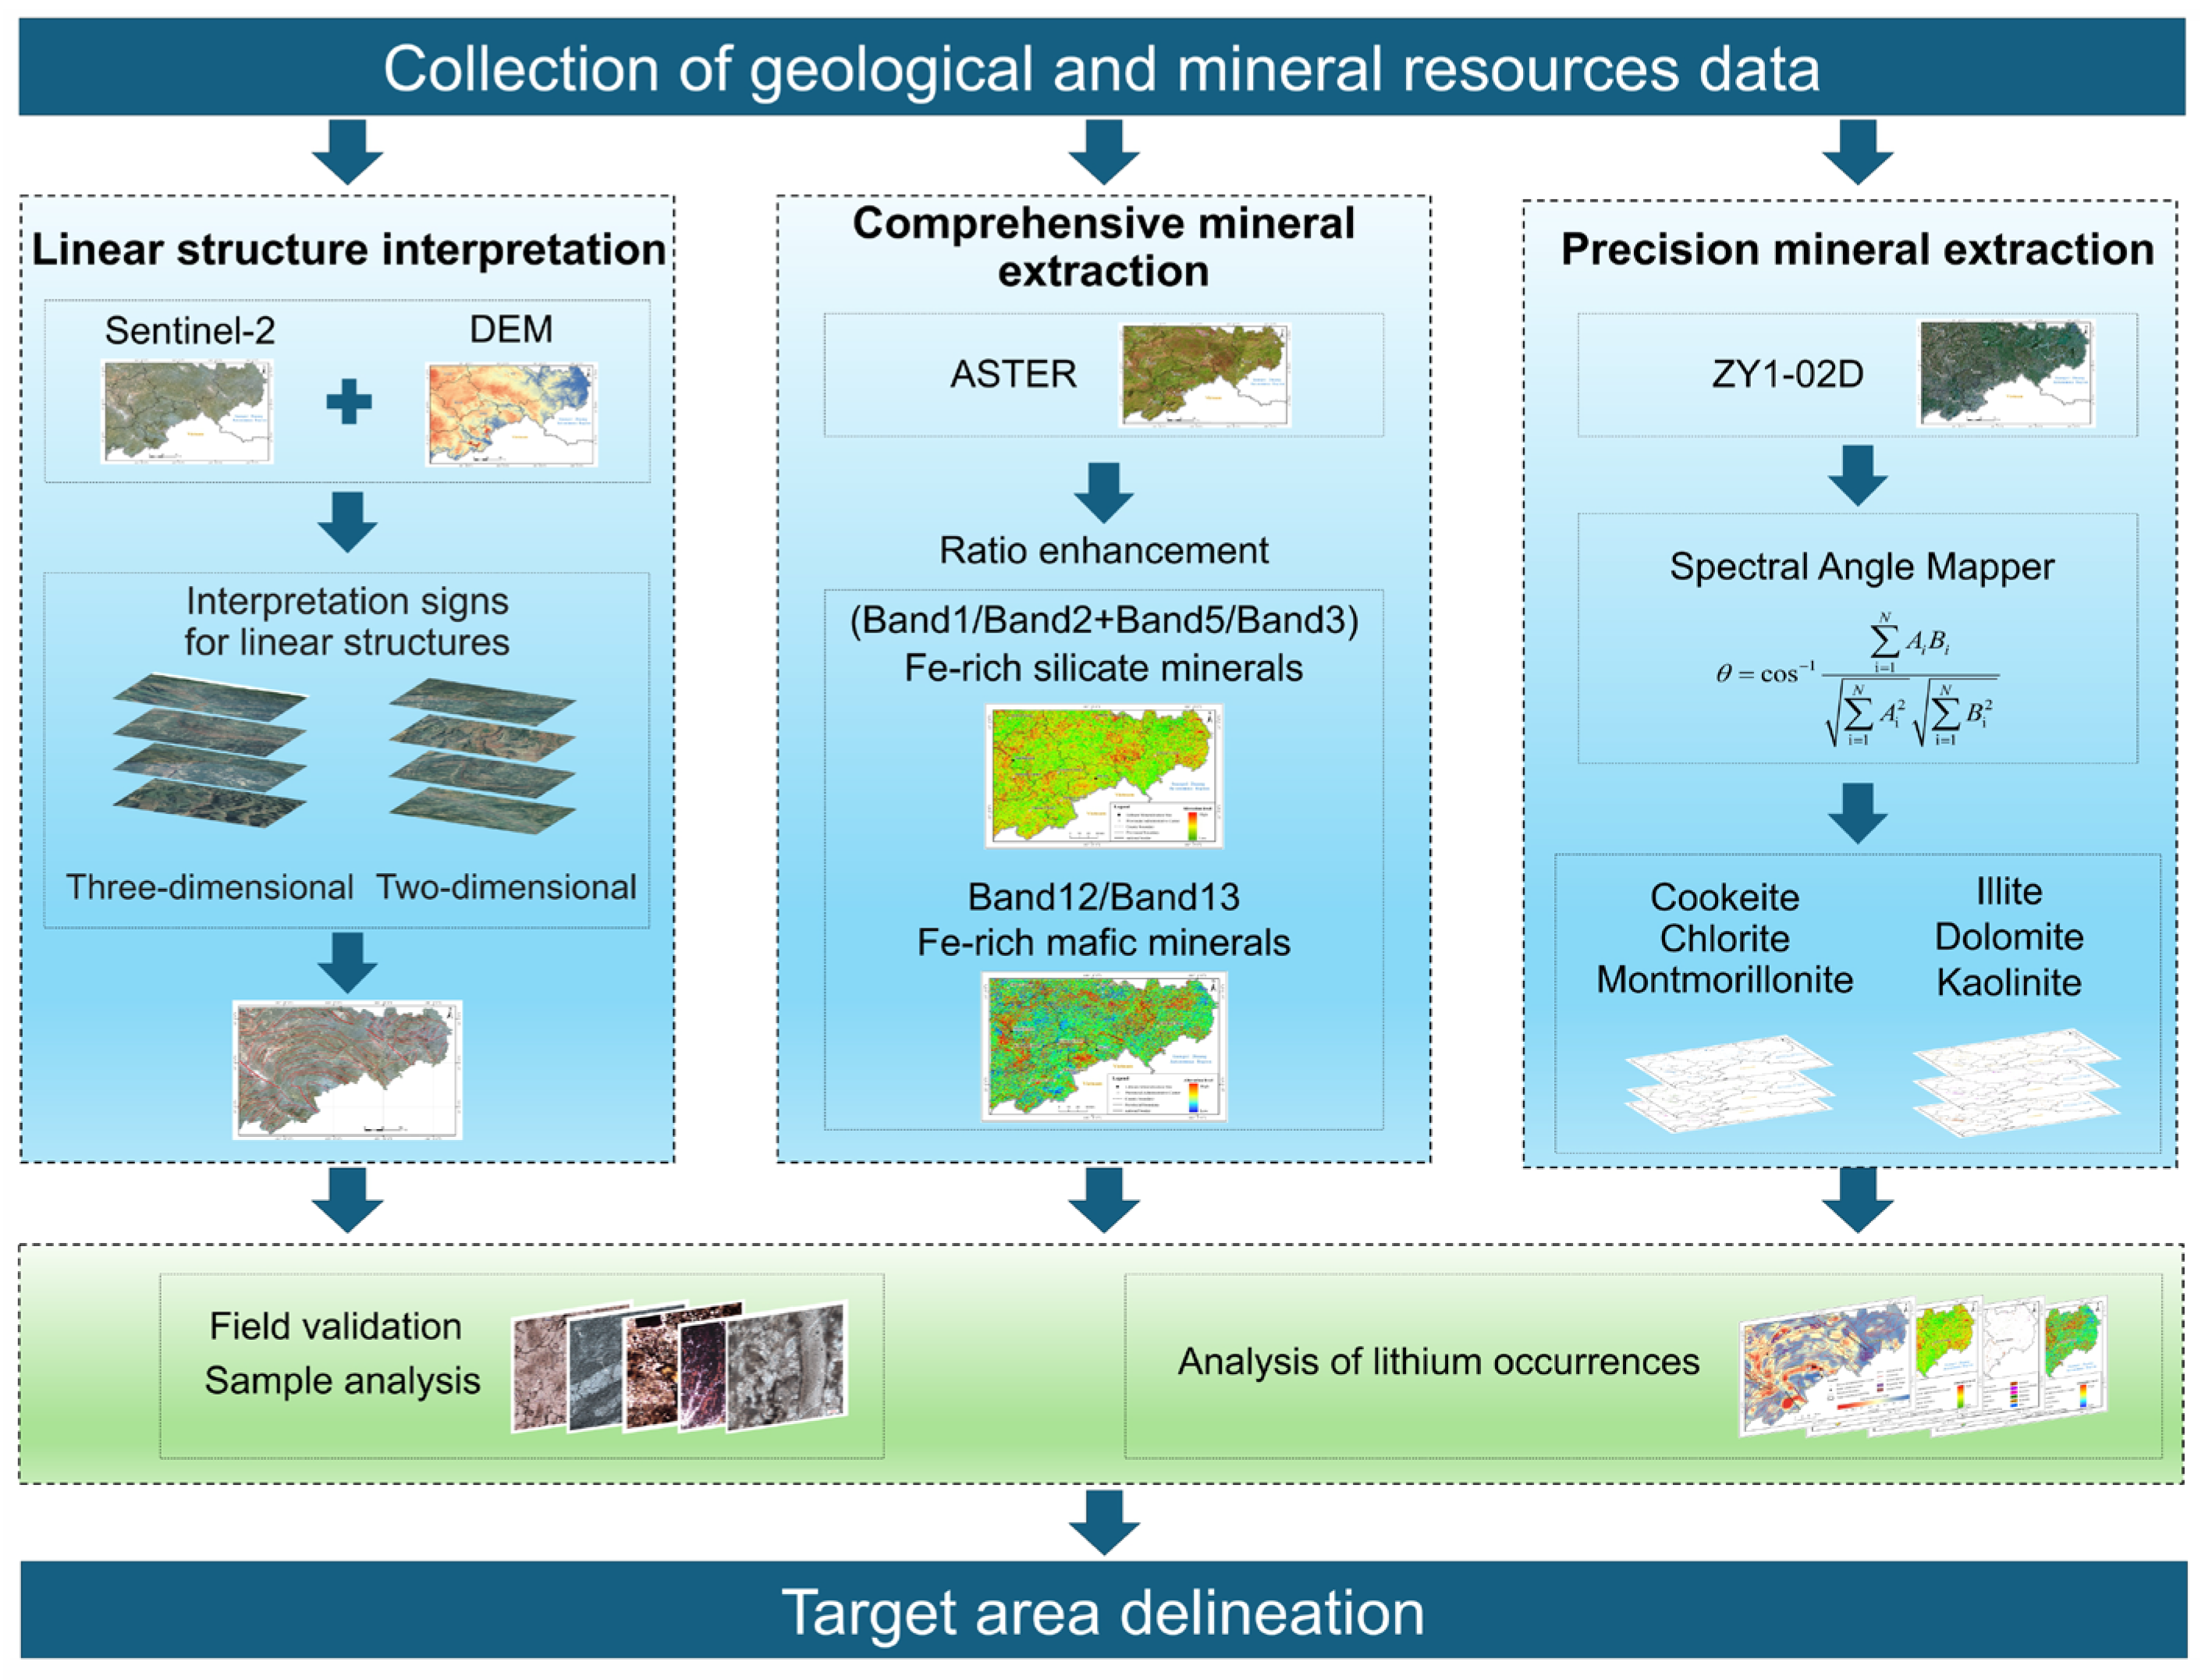
3. Materials and Methods

3.1. Data Sources and Preprocessing

3.1.1. ALOS 12.5 m DEM and Sentinel-2 Data

The ALOS (Advanced Land Observing Satellite) was launched by Japan on 24 January 2006. The 12.5 m DEM data is collected by the PALSAR sensor onboard ALOS. The data’s horizontal and vertical accuracy can reach up to 12 m. In this study, 17 scenes of ALOS 12.5 m DEM data were acquired, and the DEM data were mosaicked and cropped according to the study area [34,35].
Sentinel-2, developed by the European Space Agency (ESA), is a dual-satellite optical constellation (Sentinel-2A/2B) designed for high-resolution Earth observation. It provides 13 spectral bands spanning visible, near-infrared (VNIR), and shortwave infrared (SWIR) wavelengths, with spatial resolutions of 10 m (VNIR), 20 m (red-edge & SWIR), and 60 m (atmospheric bands) (Table 1). Compared with ASTER and Landsat 8/9, Sentinel-2 offers a superior spatial resolution (10 m in VNIR), enabling the enhanced identification of structural features such as faults, folds, lithological contacts, and geomorphic lineaments, thereby supporting high-precision structural interpretation. Its wide swath width (290 km) greatly reduces the need for image mosaicking compared with ASTER (60 km) and Landsat (185 km), significantly improving processing efficiency in large-scale regional geological studies [36,37]. Moreover, the five-day revisit cycle ensures a high temporal resolution, supporting the dynamic monitoring of geological processes and short-term surface changes. As a mature, open-access dataset, Sentinel-2 has demonstrated excellent performance in both macro- and micro-scale geological applications, and is widely employed in structural geology research [24,37]. Given these advantages, this study utilizes Sentinel-2A (L2A) data, which has already undergone atmospheric correction. Only mosaicking and cropping are required to meet the research needs.

3.1.2. ASTER Data

ASTER, a multispectral sensor onboard the Terra satellite, integrates near-infrared, shortwave infrared, and thermal infrared capabilities, encompassing 14 spectral bands that span the visible/near-infrared (VNIR), shortwave infrared (SWIR), and thermal infrared (TIR) regions. Its spatial resolution ranges from 15 m to 90 m (Table 2). ASTER data, acquired by the Terra satellite, demonstrates significant advantages in the remote sensing-based identification of mineralogical information.
Research has shown that ASTER’s VNIR and SWIR bands are effective in mapping iron oxides/hydroxides, as well as clay, phyllosilicate, and carbonate minerals, achieving remarkable results [38,39]. Additionally, ASTER data excels in extracting iron- and magnesium-rich minerals, as well as iron-bearing silicate minerals, with numerous real-world case studies confirming its effectiveness [40,41,42]. Mature mineral identification methods and tools, such as band ratioing, principal component analysis (PCA), and spectral angle mapping (SAM) [38,39,43], have been developed specifically for ASTER data, enabling the efficient identification of various mineral types.
It is worth noting that ASTER’s SWIR detector ceased functioning on 1 April 2008, due to a high-temperature failure [24]. Consequently, this study selected 16 ASTER scenes acquired before 2008. The chosen data features rich spectral information, minimal cloud interference in the study area, clear imagery with well-defined layers, uniform tones, and moderate contrast, ensuring complete coverage of the research region. Preprocessing of ASTER multispectral data included radiometric calibration, atmospheric correction, band combination, image mosaicking, and cropping, providing a robust foundation for subsequent analysis.

3.1.3. ZY1-02D Data

The ZY1-02D satellite (5-m optical satellite), successfully launched on 12 September 2019, carries a hyperspectral imager that showcases exceptional remote sensing capabilities. Its hyperspectral data covers a swath width of 60 km and consists of 166 bands, with spectral resolutions of 10 nm and 20 nm in the visible/near-infrared (VNIR) and shortwave infrared (SWIR) ranges, respectively (Table 2). This satellite data offers high spatial resolution, abundant spectral bands, low noise interference, and superior data quality, with particular emphasis on the fine division of the shortwave infrared spectrum, enabling precise identification of minerals’ specific spectral features (e.g., absorption peaks). Compared to traditional methods, this data has demonstrated outstanding performance in studies such as coastal wetland mapping [44], inversion of soil geochemical elements [45], and alteration mineral mapping [20,23], supported by well-established algorithms and models [46], significantly enhancing the efficiency and value of resource exploration.
The preprocessing workflow for ZY1-02D data in this work includes radiometric calibration, atmospheric correction, orthorectification, and data restoration. Given that the Advanced Hyperspectral Sensor (AHSI) hyperspectral sensor on the ZY1-02D satellite has defective CCD detector elements and that certain bands are affected by water vapor absorption when the radiative energy reaches the sensor, it was necessary to exclude the affected bands, specifically bands 98–103 and bands 125–135, totaling 17 bands. Additionally, due to the overlap between NIR bands 72–76 and SWIR bands 77–79, and considering the high signal-to-noise ratio of the visible and near-infrared bands, bands 72–76 are retained while bands 77–79 are removed. Furthermore, the bands beyond 163 exhibit a low signal-to-noise ratio, rendering them incapable of extracting useful information, and are thus also excluded. Ultimately, 143 bands meet the required quality standards for this work [47]. The preprocessed 19 ZY1-02D scenes were then mosaicked and cropped according to the research area (Figure 4).

3.2. Technical Methods

The methodological workflow of this study is illustrated in Figure 5 and can be summarized in the following steps. First, geological and mineral resource data were collected and compiled to analyze the sources, spatial distribution, and occurrence characteristics of lithium within the bauxite strata. Second, multi-source remote sensing data—including ALOS 12.5 m DEM, Sentinel-2, ASTER, and ZY1-02D—were acquired and preprocessed. Geological structural interpretation was then carried out using ALOS 12.5 m DEM data integrated with Sentinel-2 imagery. Third, mineral mapping was conducted. Iron silicate-rich and magnesium-rich minerals were extracted from ASTER data using the band ratio method. Cookeite, Chlorite, Montmorillonite, Illite, Dolomite, and Kaolinite were identified from the ZY1-02D imagery using the Spectral Angle Mapper (SAM) technique, with field validation. Finally, the structural interpretation results, mineral distribution patterns, lithium geochemical anomalies in the Wenshan area, known lithium occurrences, and field validation data were integrated. This comprehensive analysis allowed for the identification of ore-controlling factors, key prospecting indicators, and the delineation of target exploration zones. The results provide a valuable reference for future lithium exploration in the Wenshan region.

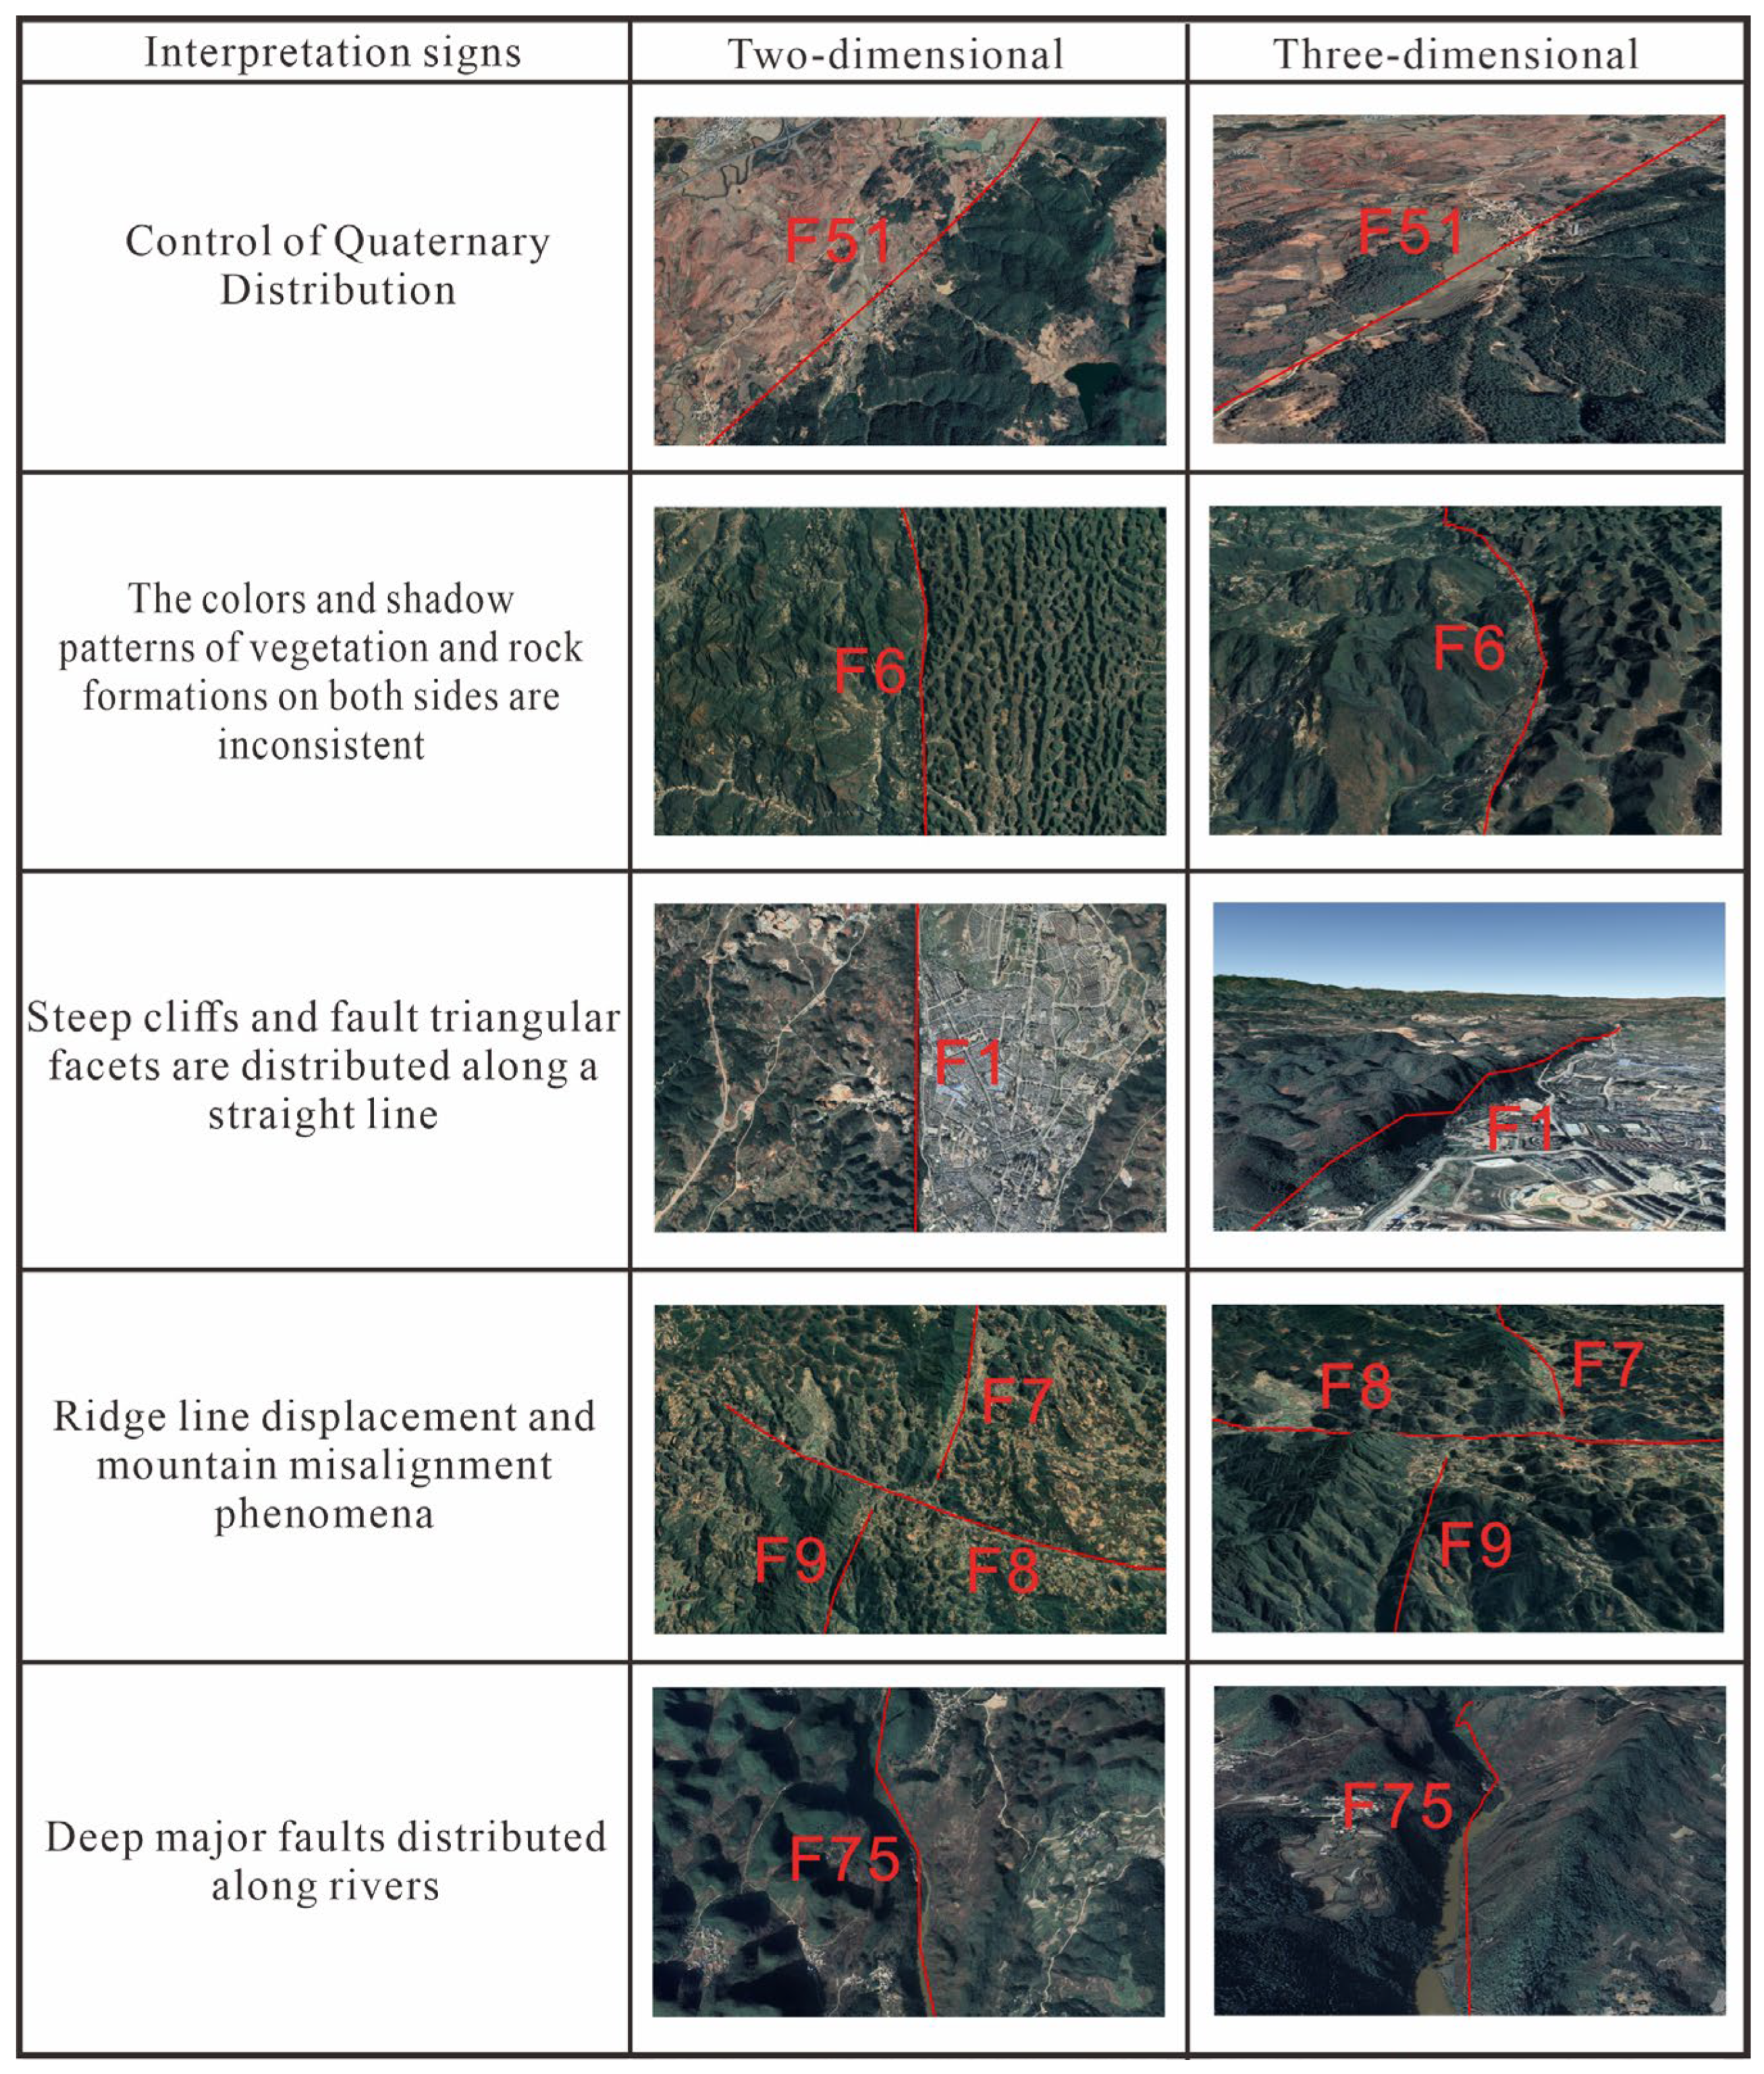
3.2.1. Remote Sensing Linear Structural Interpretation

Linear structures, including faults, fractures, fold axes, and other features formed by tectonic activity, play a critical role in controlling the morphology, distribution, and evolution of sedimentary basins. Active faults often lead to increased sediment thickness due to rapid subsidence, resulting in the formation of tectono-sedimentary units. In remote sensing imagery, these linear structures typically manifest as prominent fault-related linear features.
Under tectonic stress, fold structures are reflected as banded or linear features in remote sensing imagery, especially in regions with pronounced topographic relief. Faulting of sedimentary strata results in stratigraphic displacement or segmentation, appearing in imagery as discontinuous linear stratigraphic features that align with fault traces.
In the Wenshan region, the development of translithospheric faults has controlled the regional tectonic framework, sedimentary processes, and mineral deposit formation, closely linked to the extensional evolution of the southeastern Yunnan basin [32]. Thus, conducting structural interpretation is crucial for analyzing ore-controlling factors and delineating prospective ore-forming zones. Remote sensing imagery, due to its macroscopic and intuitive nature, provides critical support for large-scale structural interpretation. Linear structures are indirectly expressed in imagery through their control over lithology, facies, landforms, and drainage patterns, which can be identified using tonal, morphological, and geomorphological features as interpretation markers (Figure 6) [19,24]. To this end, this study integrates ALOS 12.5 m DEM data with Sentinel-2 imagery and employs the three-dimensional visualization capabilities of ArcGIS Pro 10.8 to conduct geological structural interpretation.

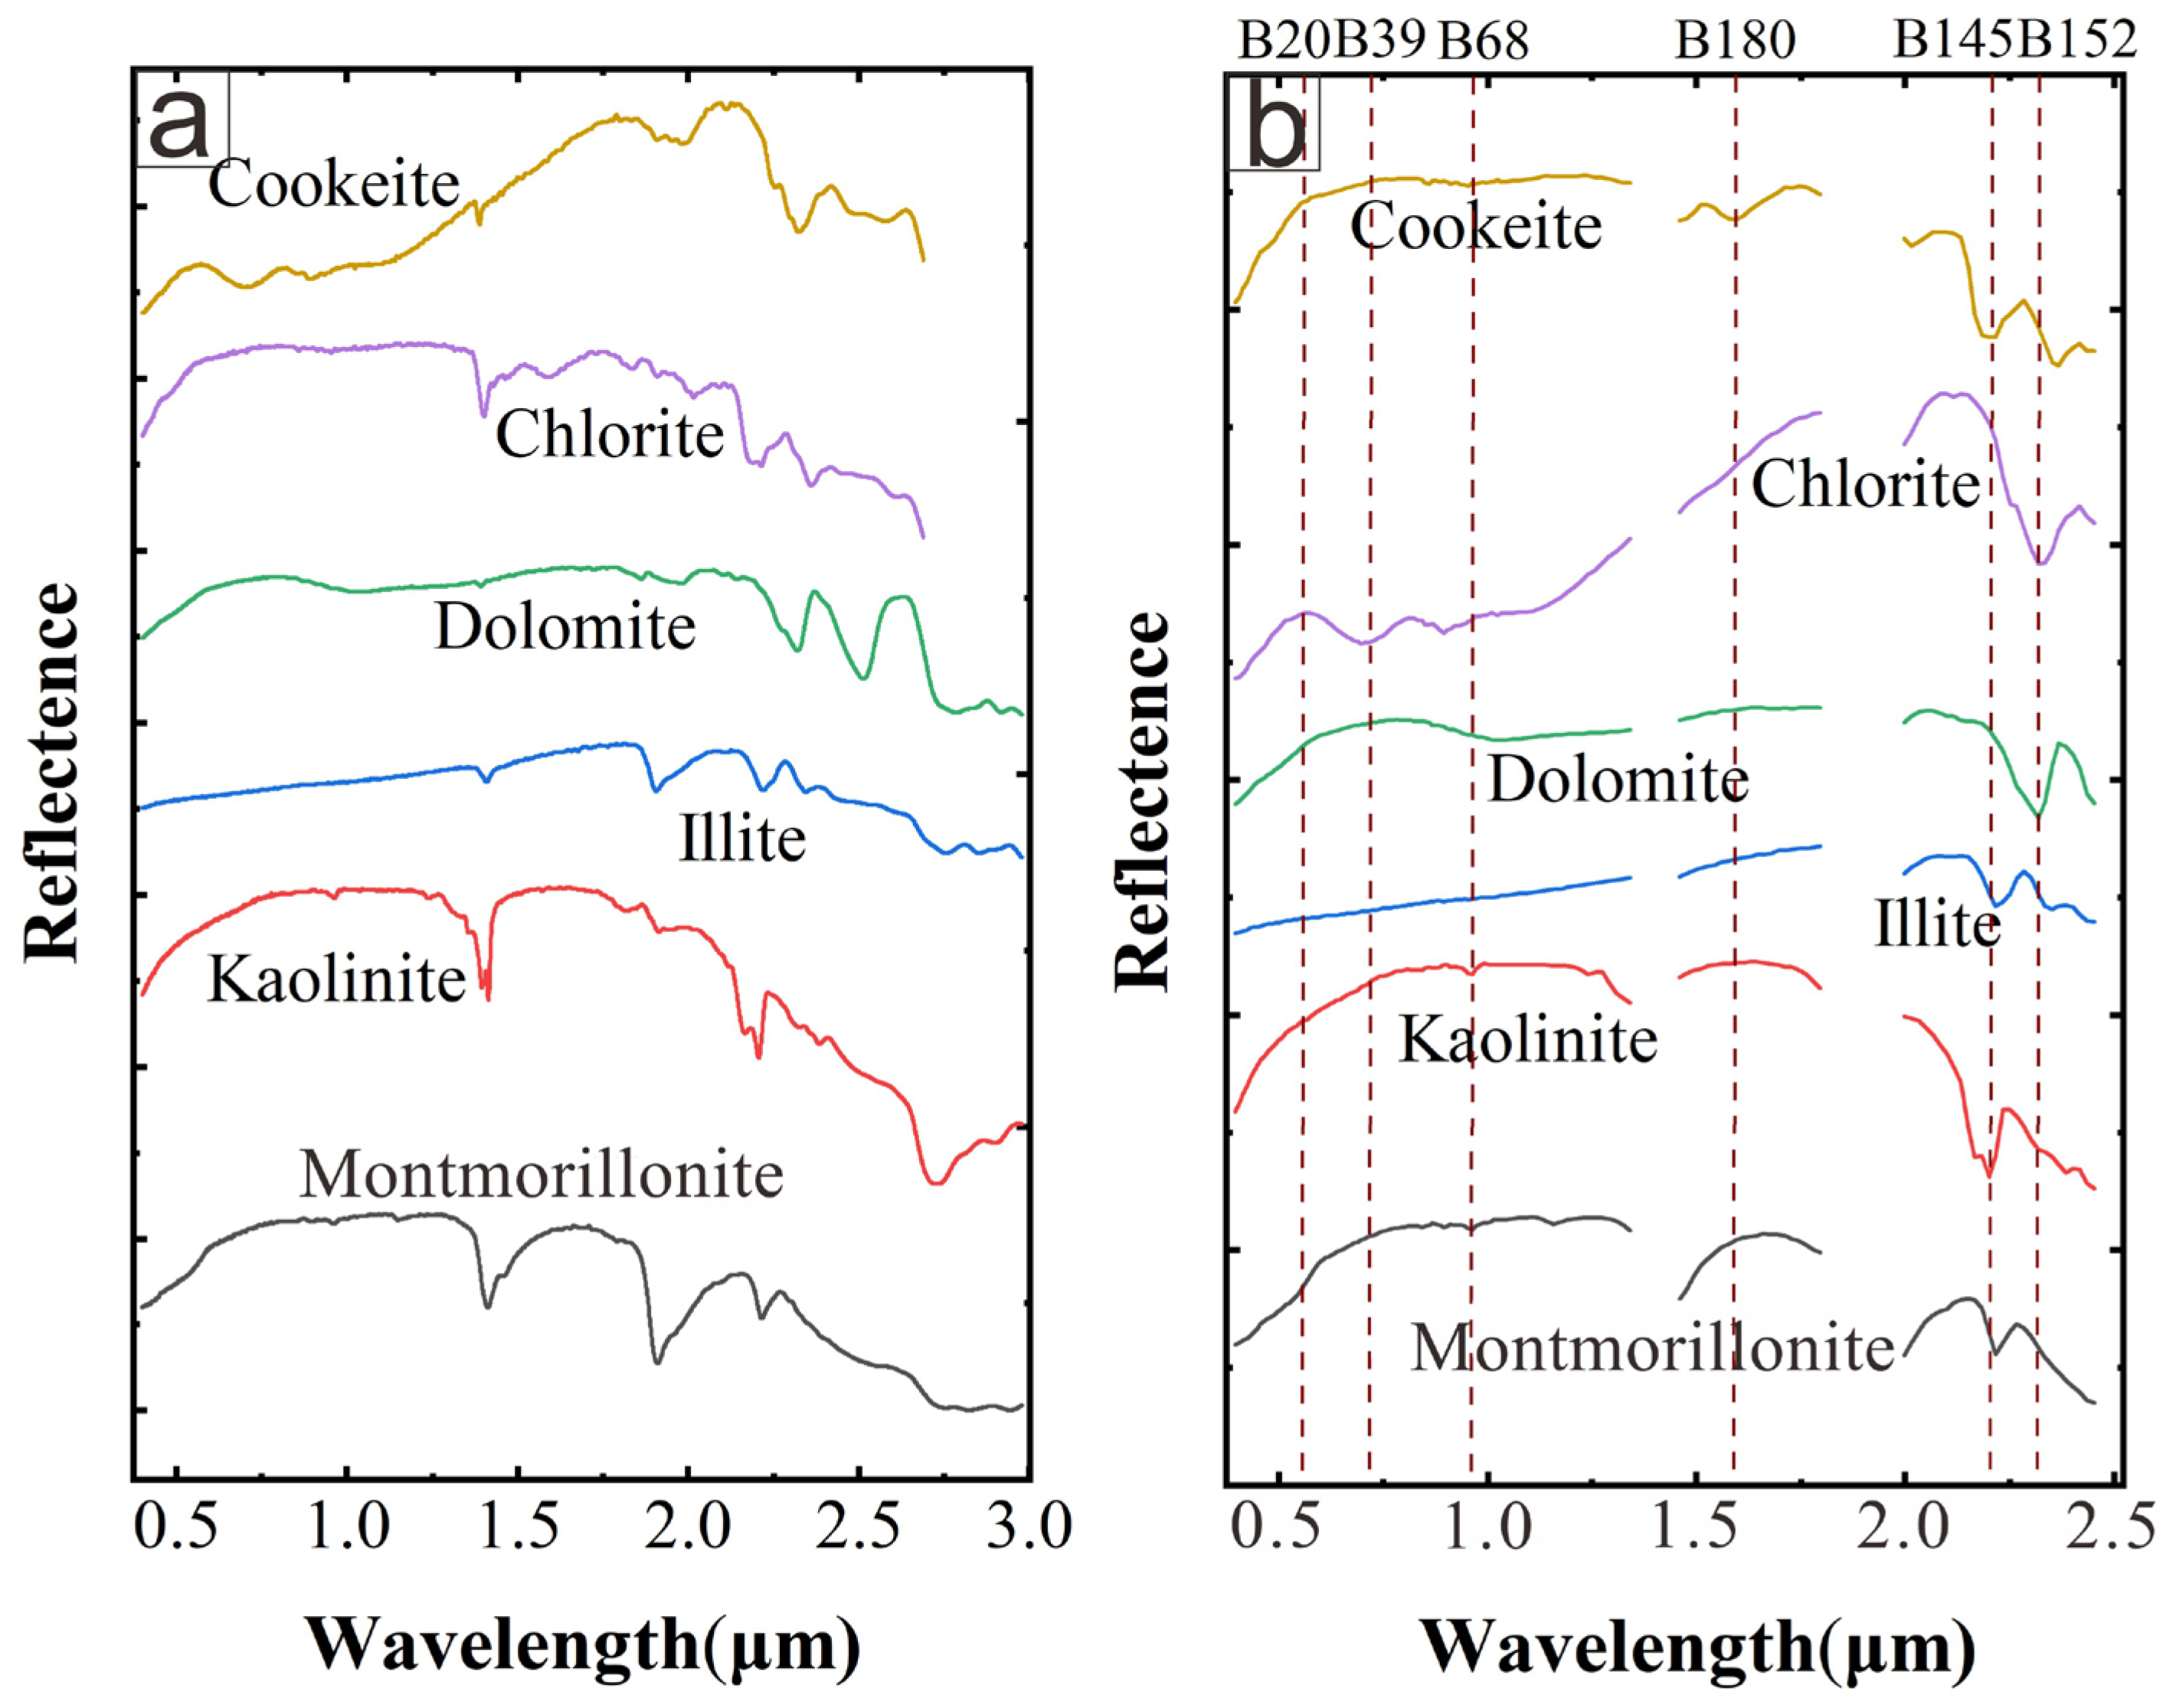
3.2.2. Comprehensive Mineral Identification Based on ASTER Data

Using ASTER data, this study applied the band ratio method to extract iron silicate-rich minerals and magnesium-rich minerals from multispectral images. The band ratio method operates based on the principle of algebraic operations, whereby the spectral differences between rock types are enhanced by calculating the ratio between the reflective and absorptive bands when band differences are small but slopes vary. This method suppresses topographical effects and reveals dynamic ranges. By analyzing the spectral curve of minerals, intervals with the greatest slope change and reflection peaks and absorption troughs are identified, defining the spectral range for ratio enhancement, thus producing an image highlighting mineral information. The sensitivity analysis of mineral spectra is as follows:
In the visible to near-infrared (VNIR) wavelength range, ASTER has three bands (Table 1), and the absorption within this range is mainly caused by electronic transition processes such as color centers, conduction bands, lattice field effects, or valence band migration [40]. Fe2+ ions within silicate lattice structures often result in low reflectance within the 0.6–1.2 μm spectral range. The ASTER band ratio of band1/band2 is sensitive to ferrous absorption, while the ratio of band5/band3 reflects the steep slope caused by ferrous absorption in the VNIR region and the lack of Al-OH absorption in the SWIR band5. Therefore, the ASTER band ratio (band1/band2 + band5/band3) is primarily used to interpret surface-exposed iron-rich silicate minerals [41]. In practical application, the band ratio (band1/band2 + band5/band3) has proven particularly effective in highlighting Mg-OH-bearing iron silicate minerals such as Chlorite and Epidote [48]. For rocks mainly composed of silicate minerals, as the SiO2 content decreases, the reflectance trough shifts toward longer wavelengths, causing the emissivity of band12 to rise relative to band13. As a result, the band ratio of band12/band13 inversely correlates with SiO2 content and can be used to measure the abundance of iron–magnesium-rich minerals in surface rocks [49,50].

3.2.3. Fine Mineral Identification Based on ZY1-02D Data

The spectral angle mapping (SAM) method is widely used and highly effective in remote sensing-based mineral exploration [51,52,53]. In this study, SAM was employed on ZY1-02D data to extract six types of clay minerals: Montmorillonite, Cookeite, Illite, Chlorite, Kaolinite, and Dolomite.
SAM, a supervised classification technique, treats the spectrum of an individual pixel as a vector in an n-dimensional space. The similarity between a pixel’s spectrum and a reference spectrum is determined by calculating the spectral angle between the vectors in an N-band space, with smaller angles indicating a higher similarity [50,54]. The spectral curves of minerals in this study were derived from the USGS standard mineral spectral library, with resampling conducted to match the spectral resolution of the ZY1-02D hyperspectral data (Figure 7), enabling the classification of the corresponding clay minerals. The formula for calculating the spectral angle is shown in Equation (1) as below:
θ = cos 1 i = 1 N A i B i i = 1 N A i 2 i = 1 N B i 2
where θ is the spectral angle, N represents the number of bands, and A = (A1, A2, …, AN) and B = (B1, B2, …, BN) represent the spectral vectors of A and B in N bands (typically using spectral reflectance).

3.3. Field Survey and Laboratory Analysis
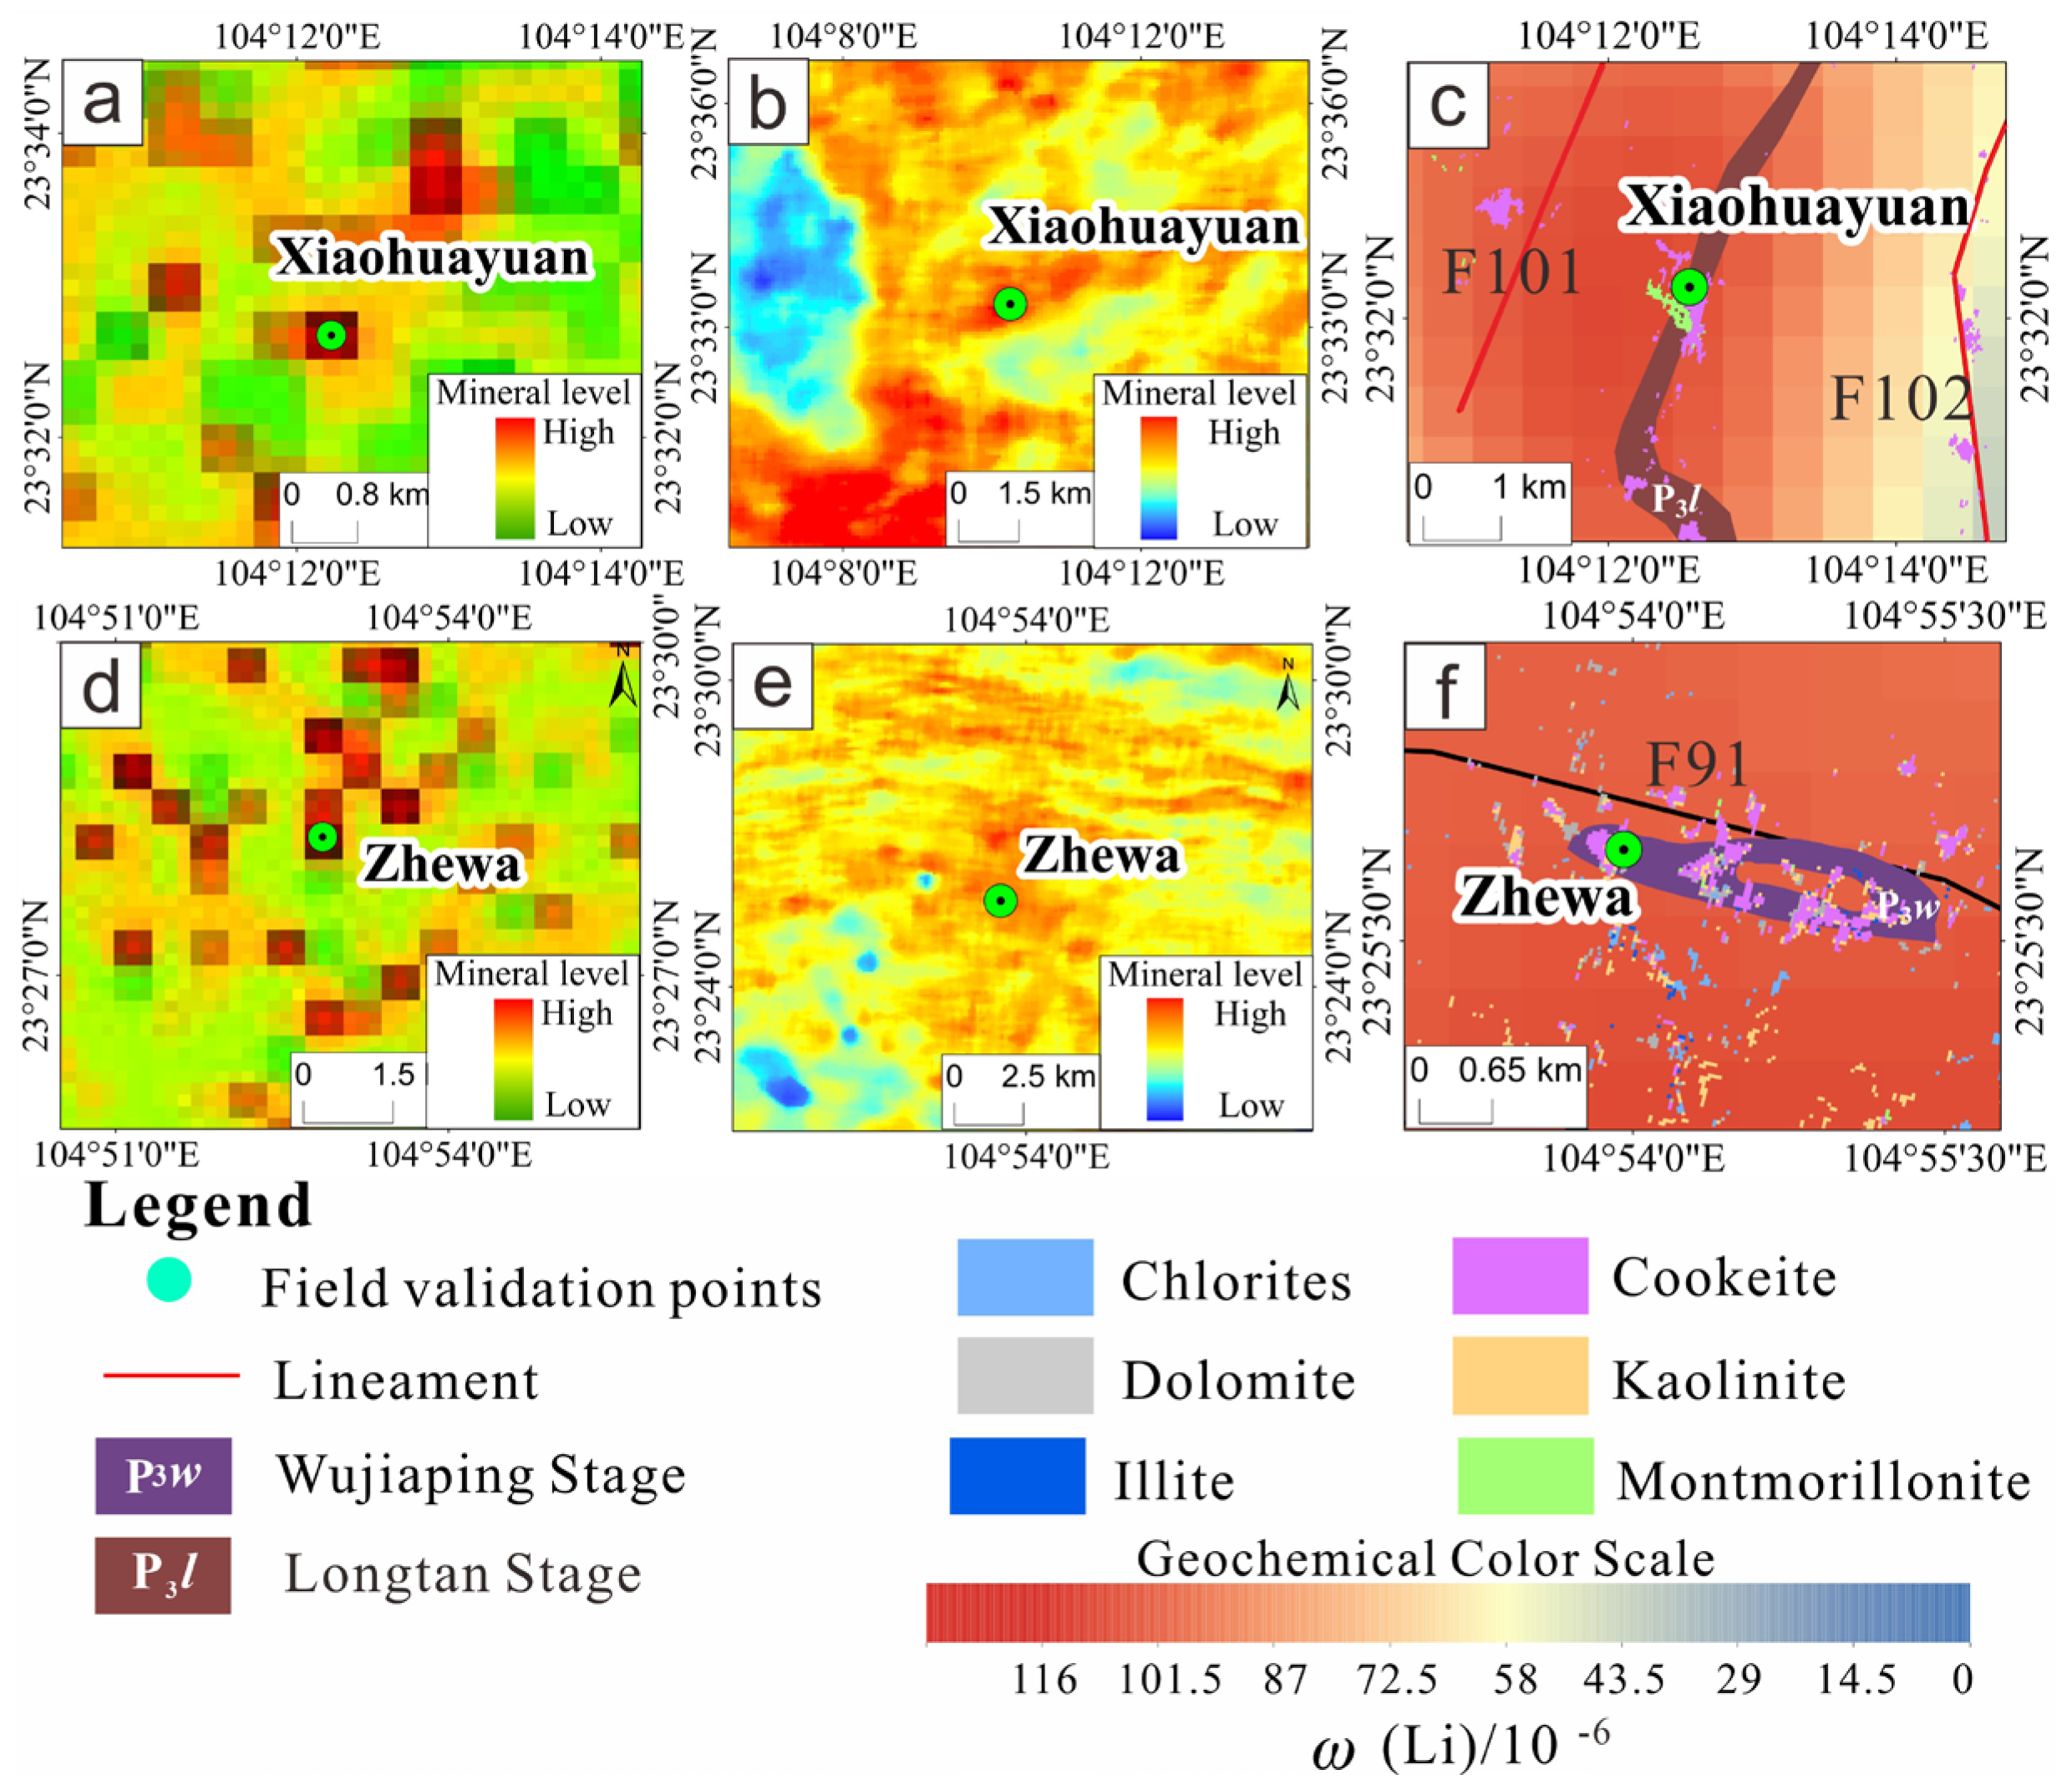
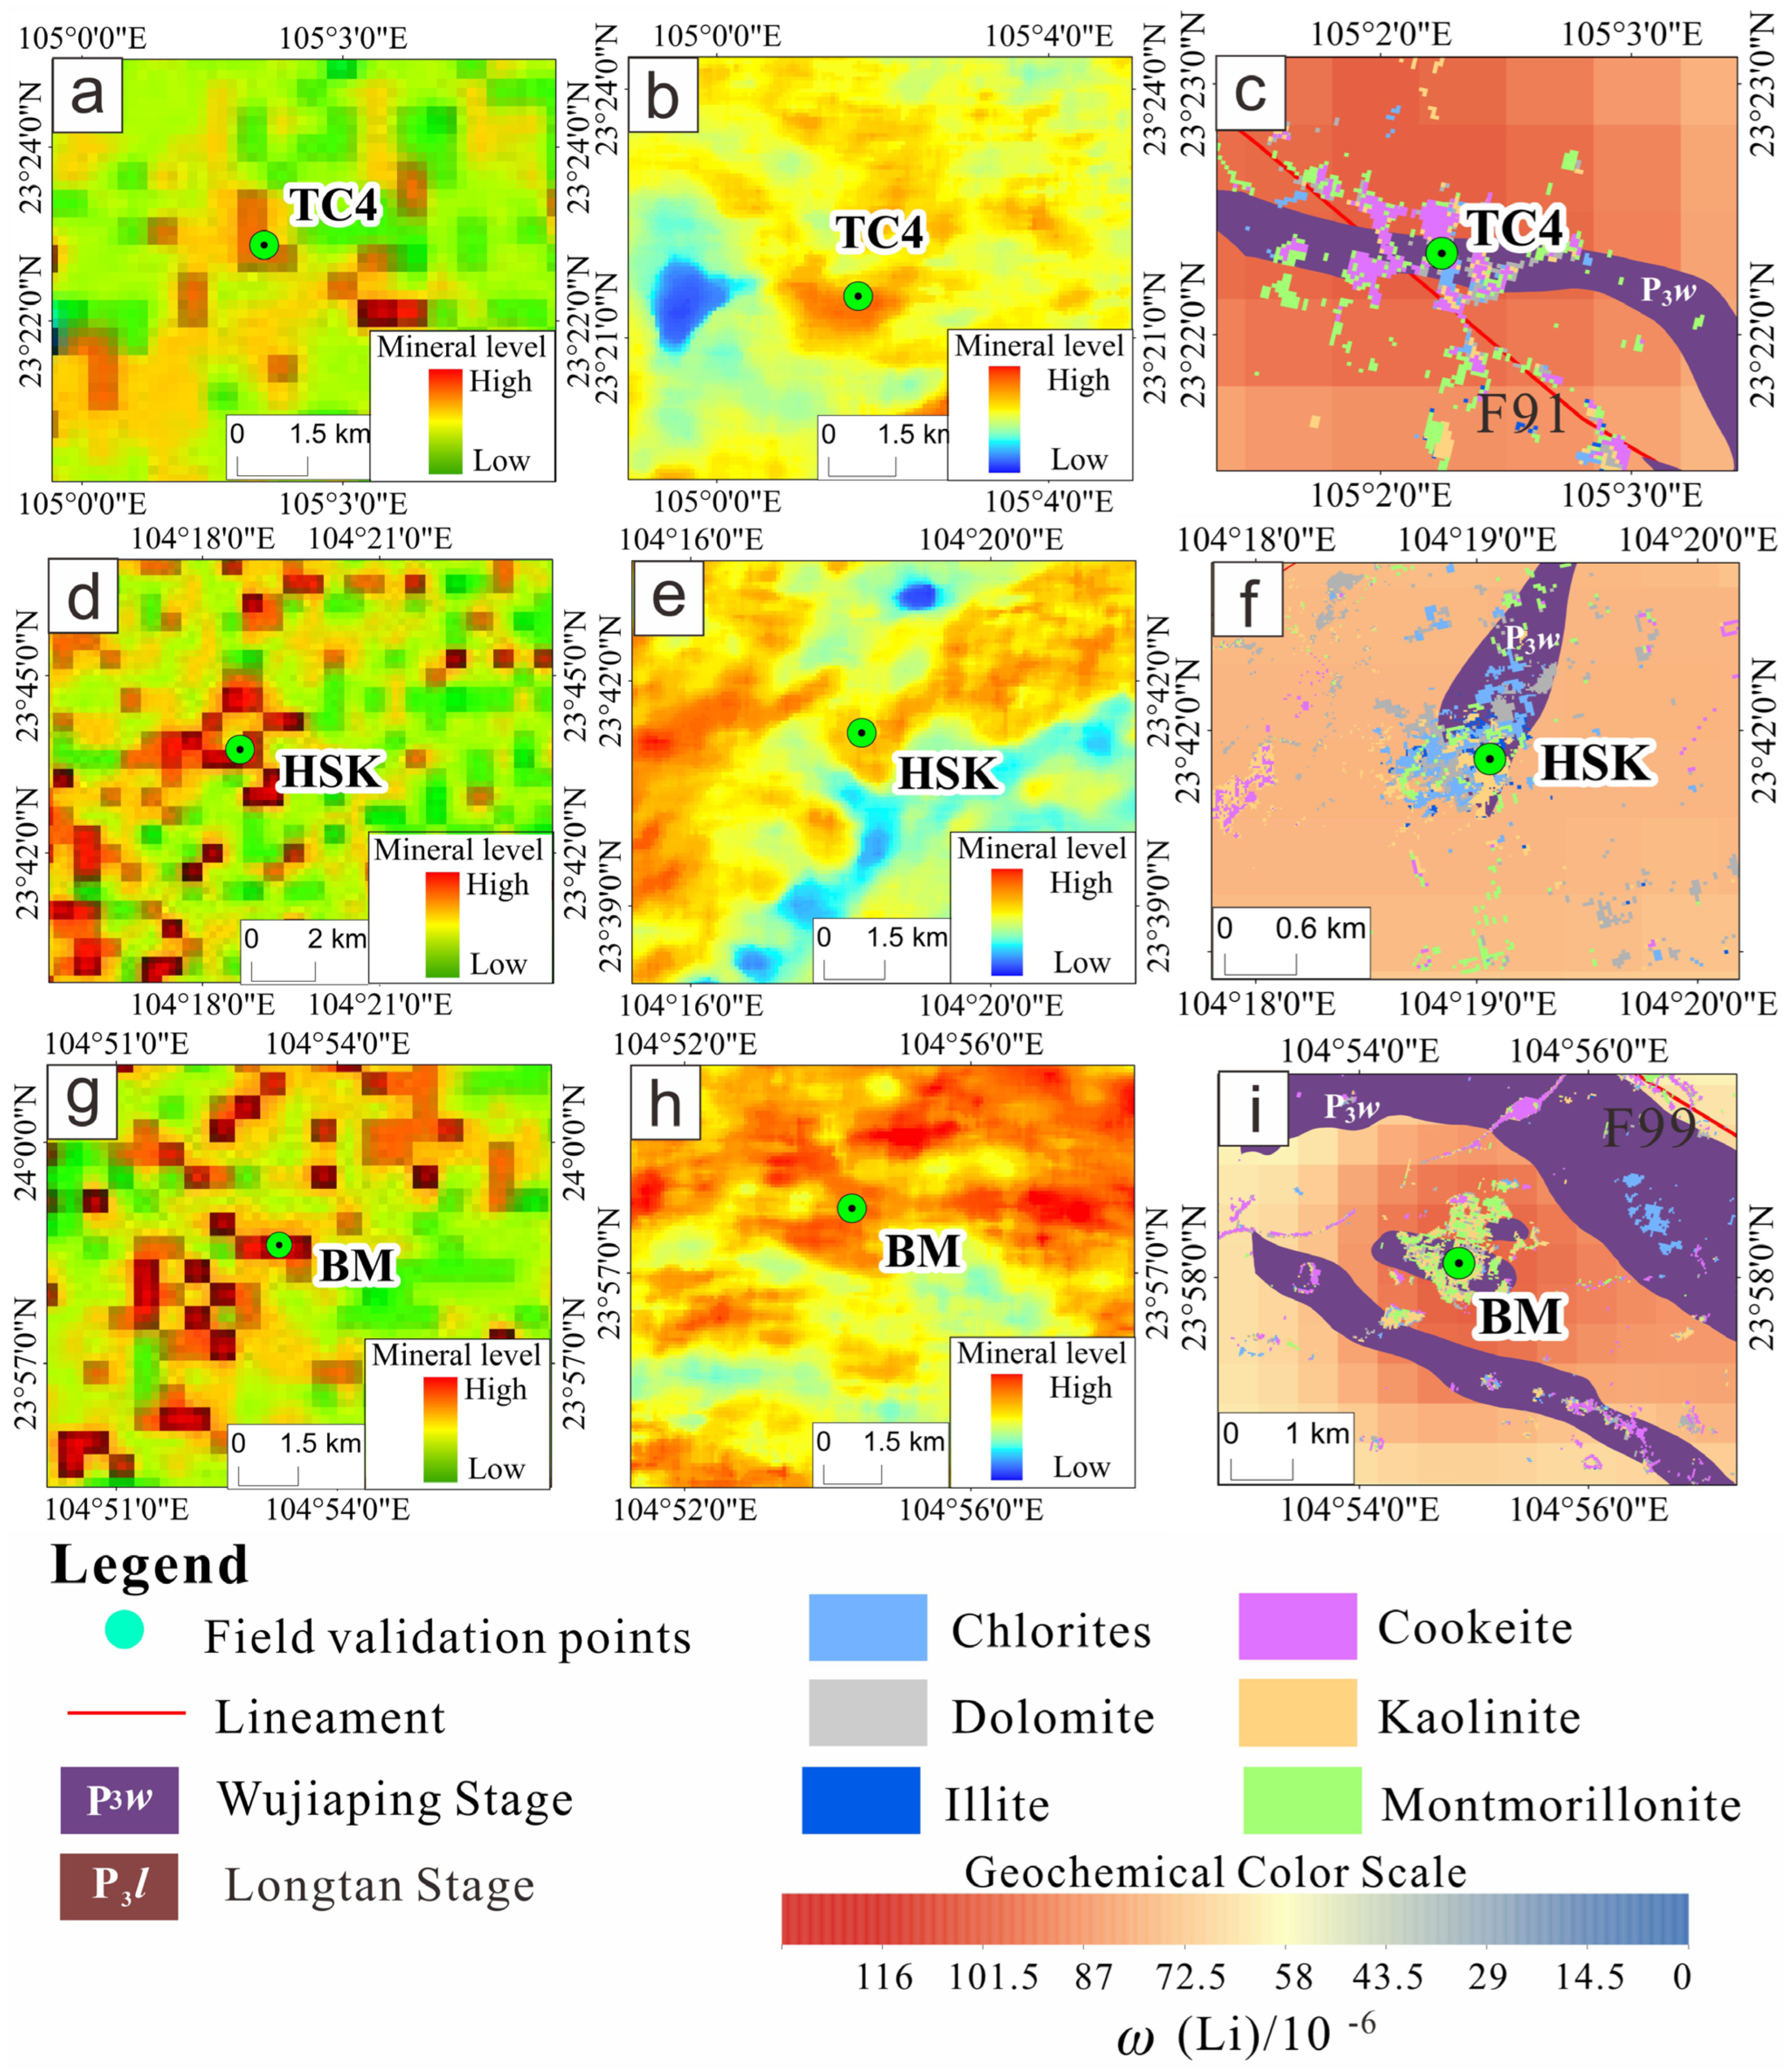
To verify the results of the structural interpretation and mineral identification, both field surveys and laboratory analyses were conducted. The fieldwork involved GPS positioning, photography, and sample collection at seven key validation sites: TC1, TC2, TC3, TC4, HSK, MJP, and BM. GPS was used to accurately record the spatial locations of these sites, while field photographs were taken to document geological features and surface characteristics. Rock and soil samples were collected for further indoor analysis. In the laboratory, thin sections were prepared for lithological examination under a polarizing microscope, providing microstructural insights that supported the field observations.

4. Results

4.1. Results of Structural Interpretation

The widespread development of linear structures in the study area provides critical pathways and accumulation zones for clay-type lithium mineralization. In this study, a total of 123 linear structures were identified and numbered sequentially from F1 to F123. These structures were interpreted primarily through remote sensing imagery, with their orientations quantitatively analyzed using rose diagram analysis. The interpretation results show a strong correlation with fault patterns depicted in the original geological map. While the original map displayed more fragmented and discontinuous faults, our interpretation revealed significantly improved fault continuity (Figure 8a).
Two major fault systems intersect the study area: the Wenshan–Malipo fault in the southwest and the Guangnan–Funing fault in the northeast. Between these, a dense network of NW-, EW-, and NE-trending linear structures has developed, with distinct features clearly visible in the remote sensing imagery. The 1:200,000 lithium geochemical anomaly zones are primarily concentrated between the EW-trending linear structures F4–F6 and F102–F111, as well as on both flanks of the Wenshan–Malipo fault. These anomalous areas coincide with the outcrops of the Permian Wujiaping Formation (P3w) and Longtan Formation (P3l), which are distributed along the major linear structures. North of the Guangnan–Funing fault, NW- and NE-trending structures are dominant, while similar trends are also prevalent south of the Wenshan–Malipo fault (Figure 8a).

4.2. Results of Comprehensive Mineral Identification Based on ASTER Data

4.2.1. Identification of Iron-Rich Silicate Minerals

The high-value areas of iron-rich silicate minerals are distributed in an arc shape within the study area, mainly concentrated in the northern parts of Wenshan City, Yanshan County, and Guangnan County, as well as in the southeastern parts of Guangnan County, Xichou County, and the northern part of Malipo County. Other regions show a sporadic distribution. Notably, there is a strong spatial coupling relationship between the high-value areas of iron-rich silicate minerals and the 1:200,000 lithium geochemical high-value areas (Figure 8b).

4.2.2. Identification of Iron-Rich Magnesium Minerals

The high-value areas of iron-rich magnesium minerals also display an arc-shaped distribution within the study area, primarily concentrated in the northern parts of Wenshan City, Yanshan County, and central and southeastern Guangnan County, as well as in the northern parts of Xichou County and Malipo County. Other areas show a sporadic distribution. It is worth noting that these high-value areas of iron-rich magnesium minerals also exhibit a good spatial coupling relationship with the 1:200,000 lithium geochemical high-value areas (Figure 8c).
The results, combining structural interpretation and comprehensive mineral identification, reveal that the ore-rich strata—Wujiaping Formation (P3w) and Longtan Formation (P3l)—are primarily distributed along with high-value zones of lithium geochemical anomalies, iron-rich silicate minerals, and iron–magnesium-rich minerals mapped at a 1:200,000 scale. These zones are mainly located between the Wenshan–Malipo fault to the north and the Guangnan–Funing fault to the south, exhibiting WNW-, EW-, and ENE-oriented arcuate linear structural patterns. These patterns are predominantly controlled by the linear structures F4, F6, F7, F8, F21, F46, F47, F48, F49, F50, F58, F102, F100, and F111. In contrast, low-value zones are situated to the north of the Guangnan–Funing fault and to the south of the Wenshan–Malipo fault (Figure 8).

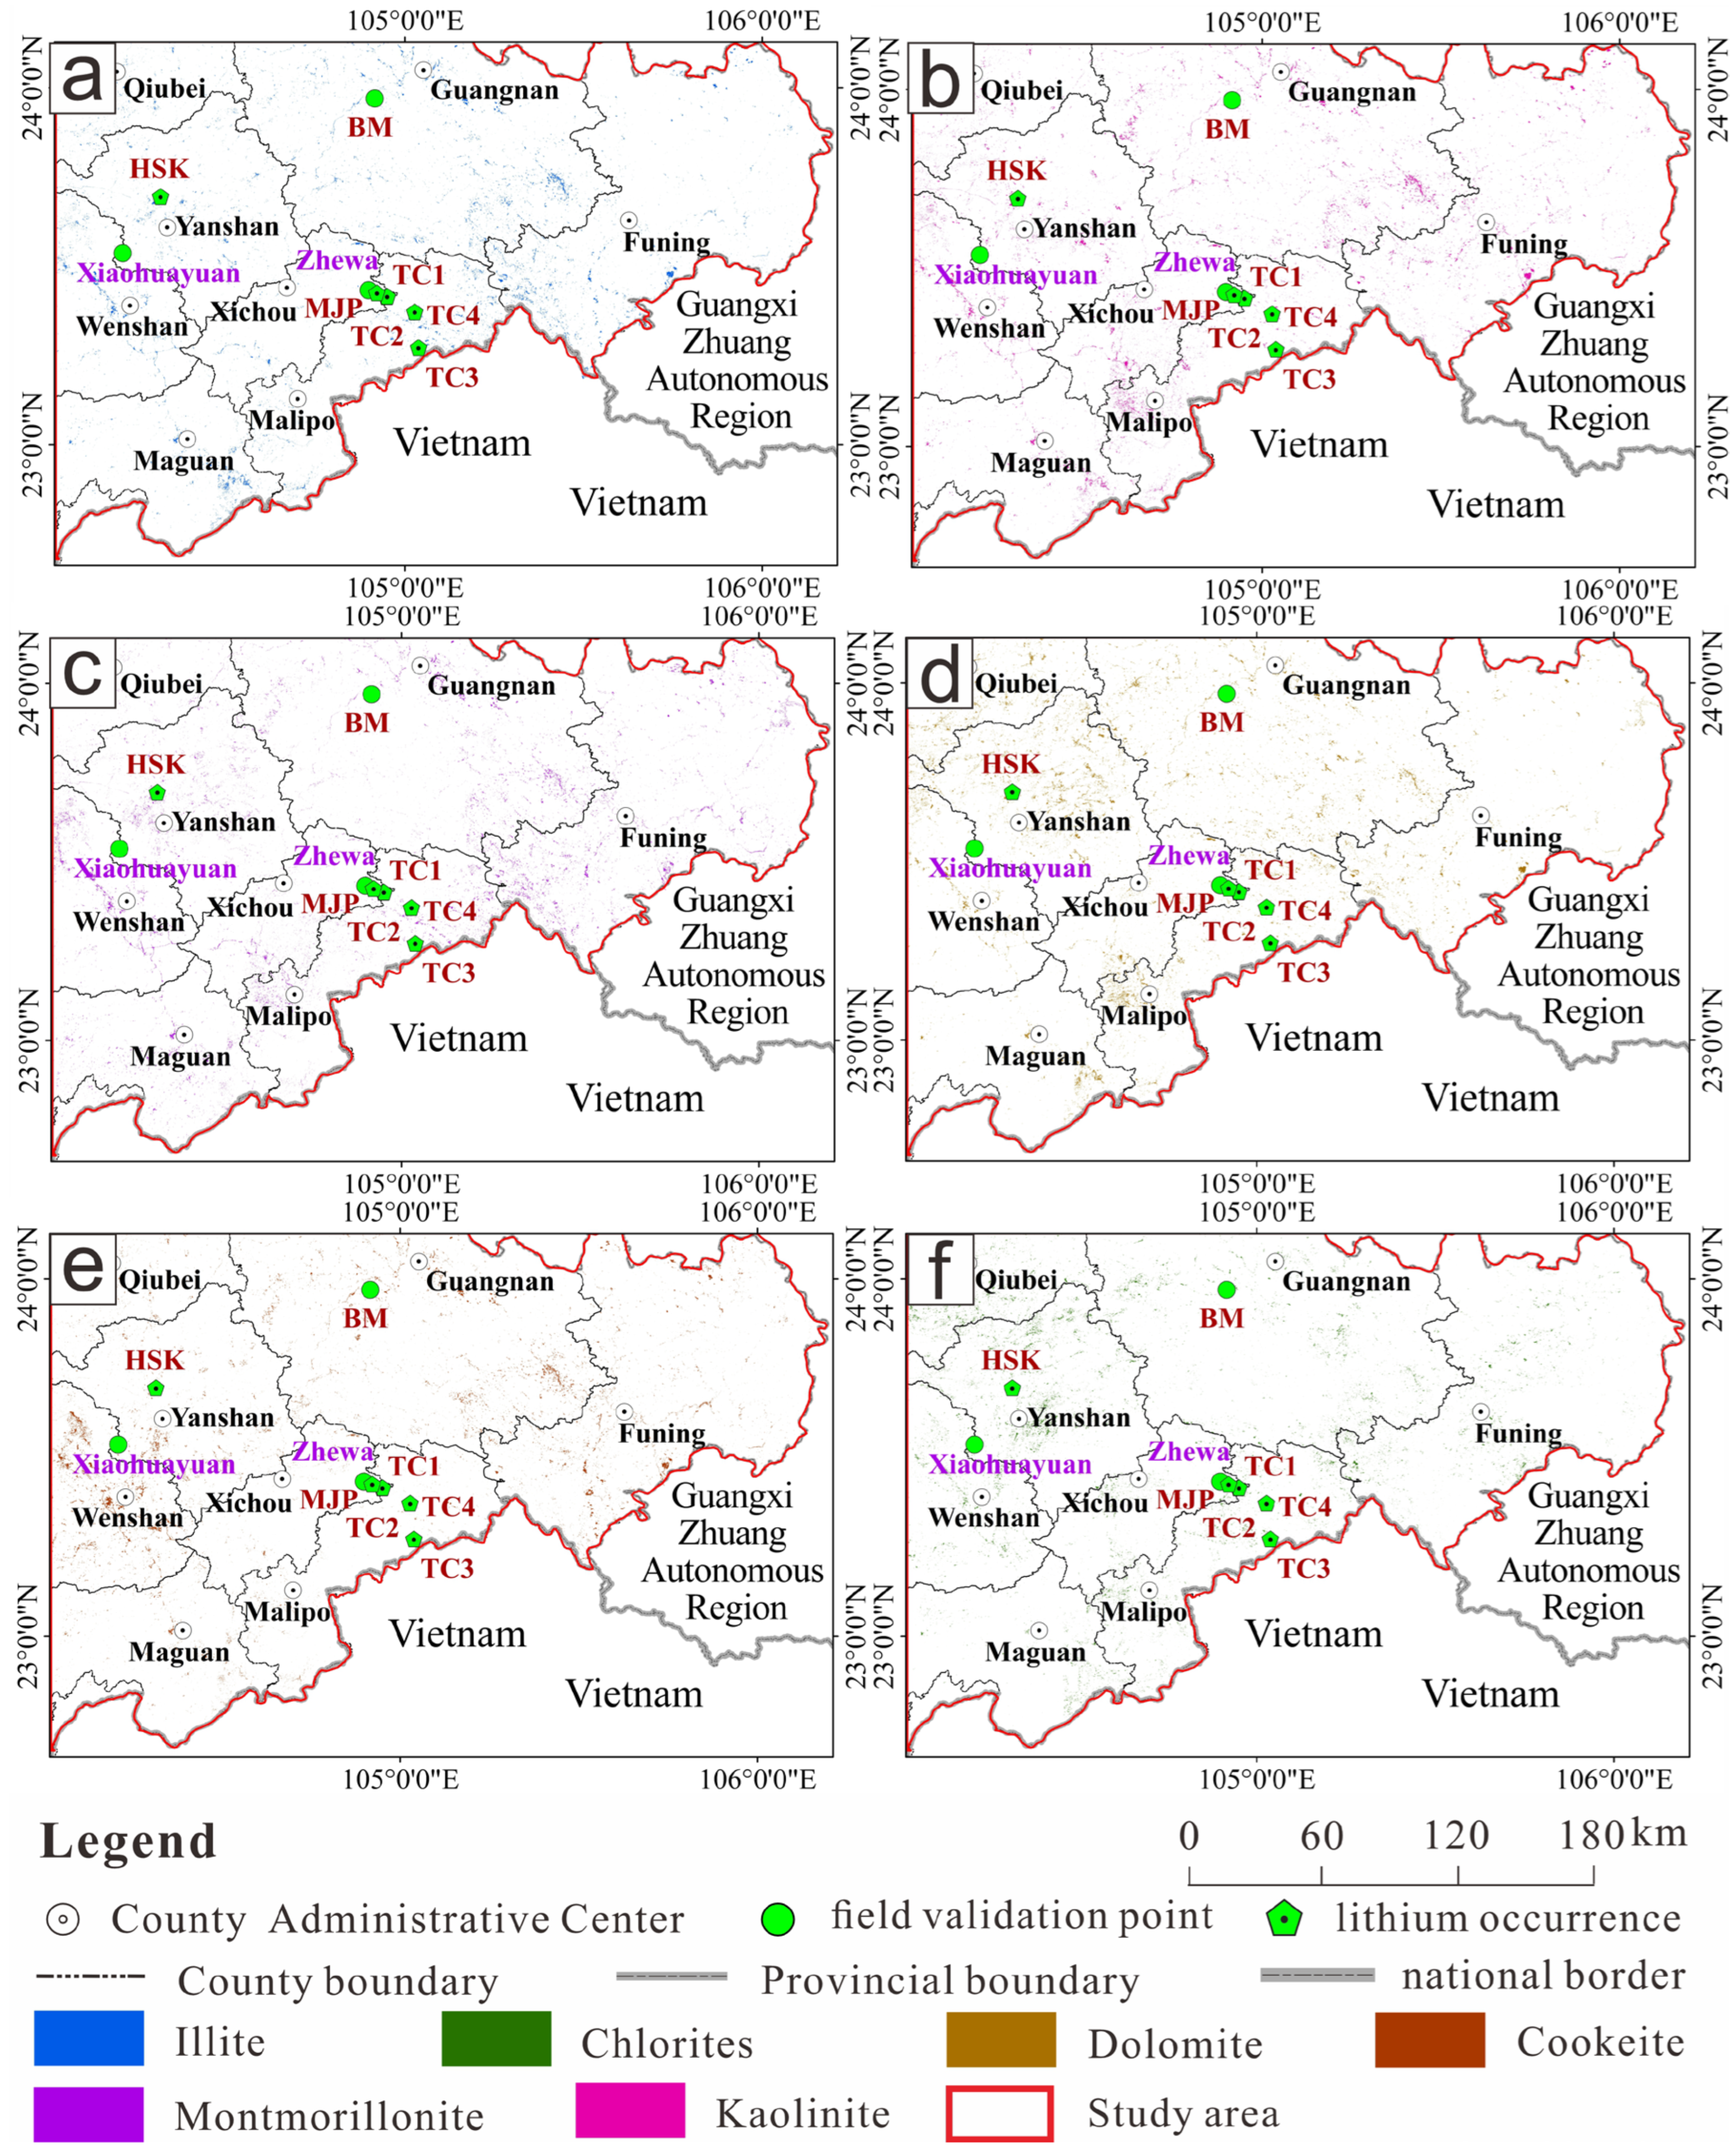
4.3. Results of Fine Mineral Identification Based on ZY1-02D Data

The identification of minerals such as cookeite, chlorite, montmorillonite, illite, dolomite, and kaolinite based on ZY1-02D data reveals a largely consistent spatial distribution. These minerals are primarily concentrated between the two major faults: north of the Wenshan–Malipo fault and south of the Guangnan–Funing fault. while, the areas south of the Wenshan–Malipo fault and north of the Guangnan–Funing fault show a sporadic distribution (Figure 9).

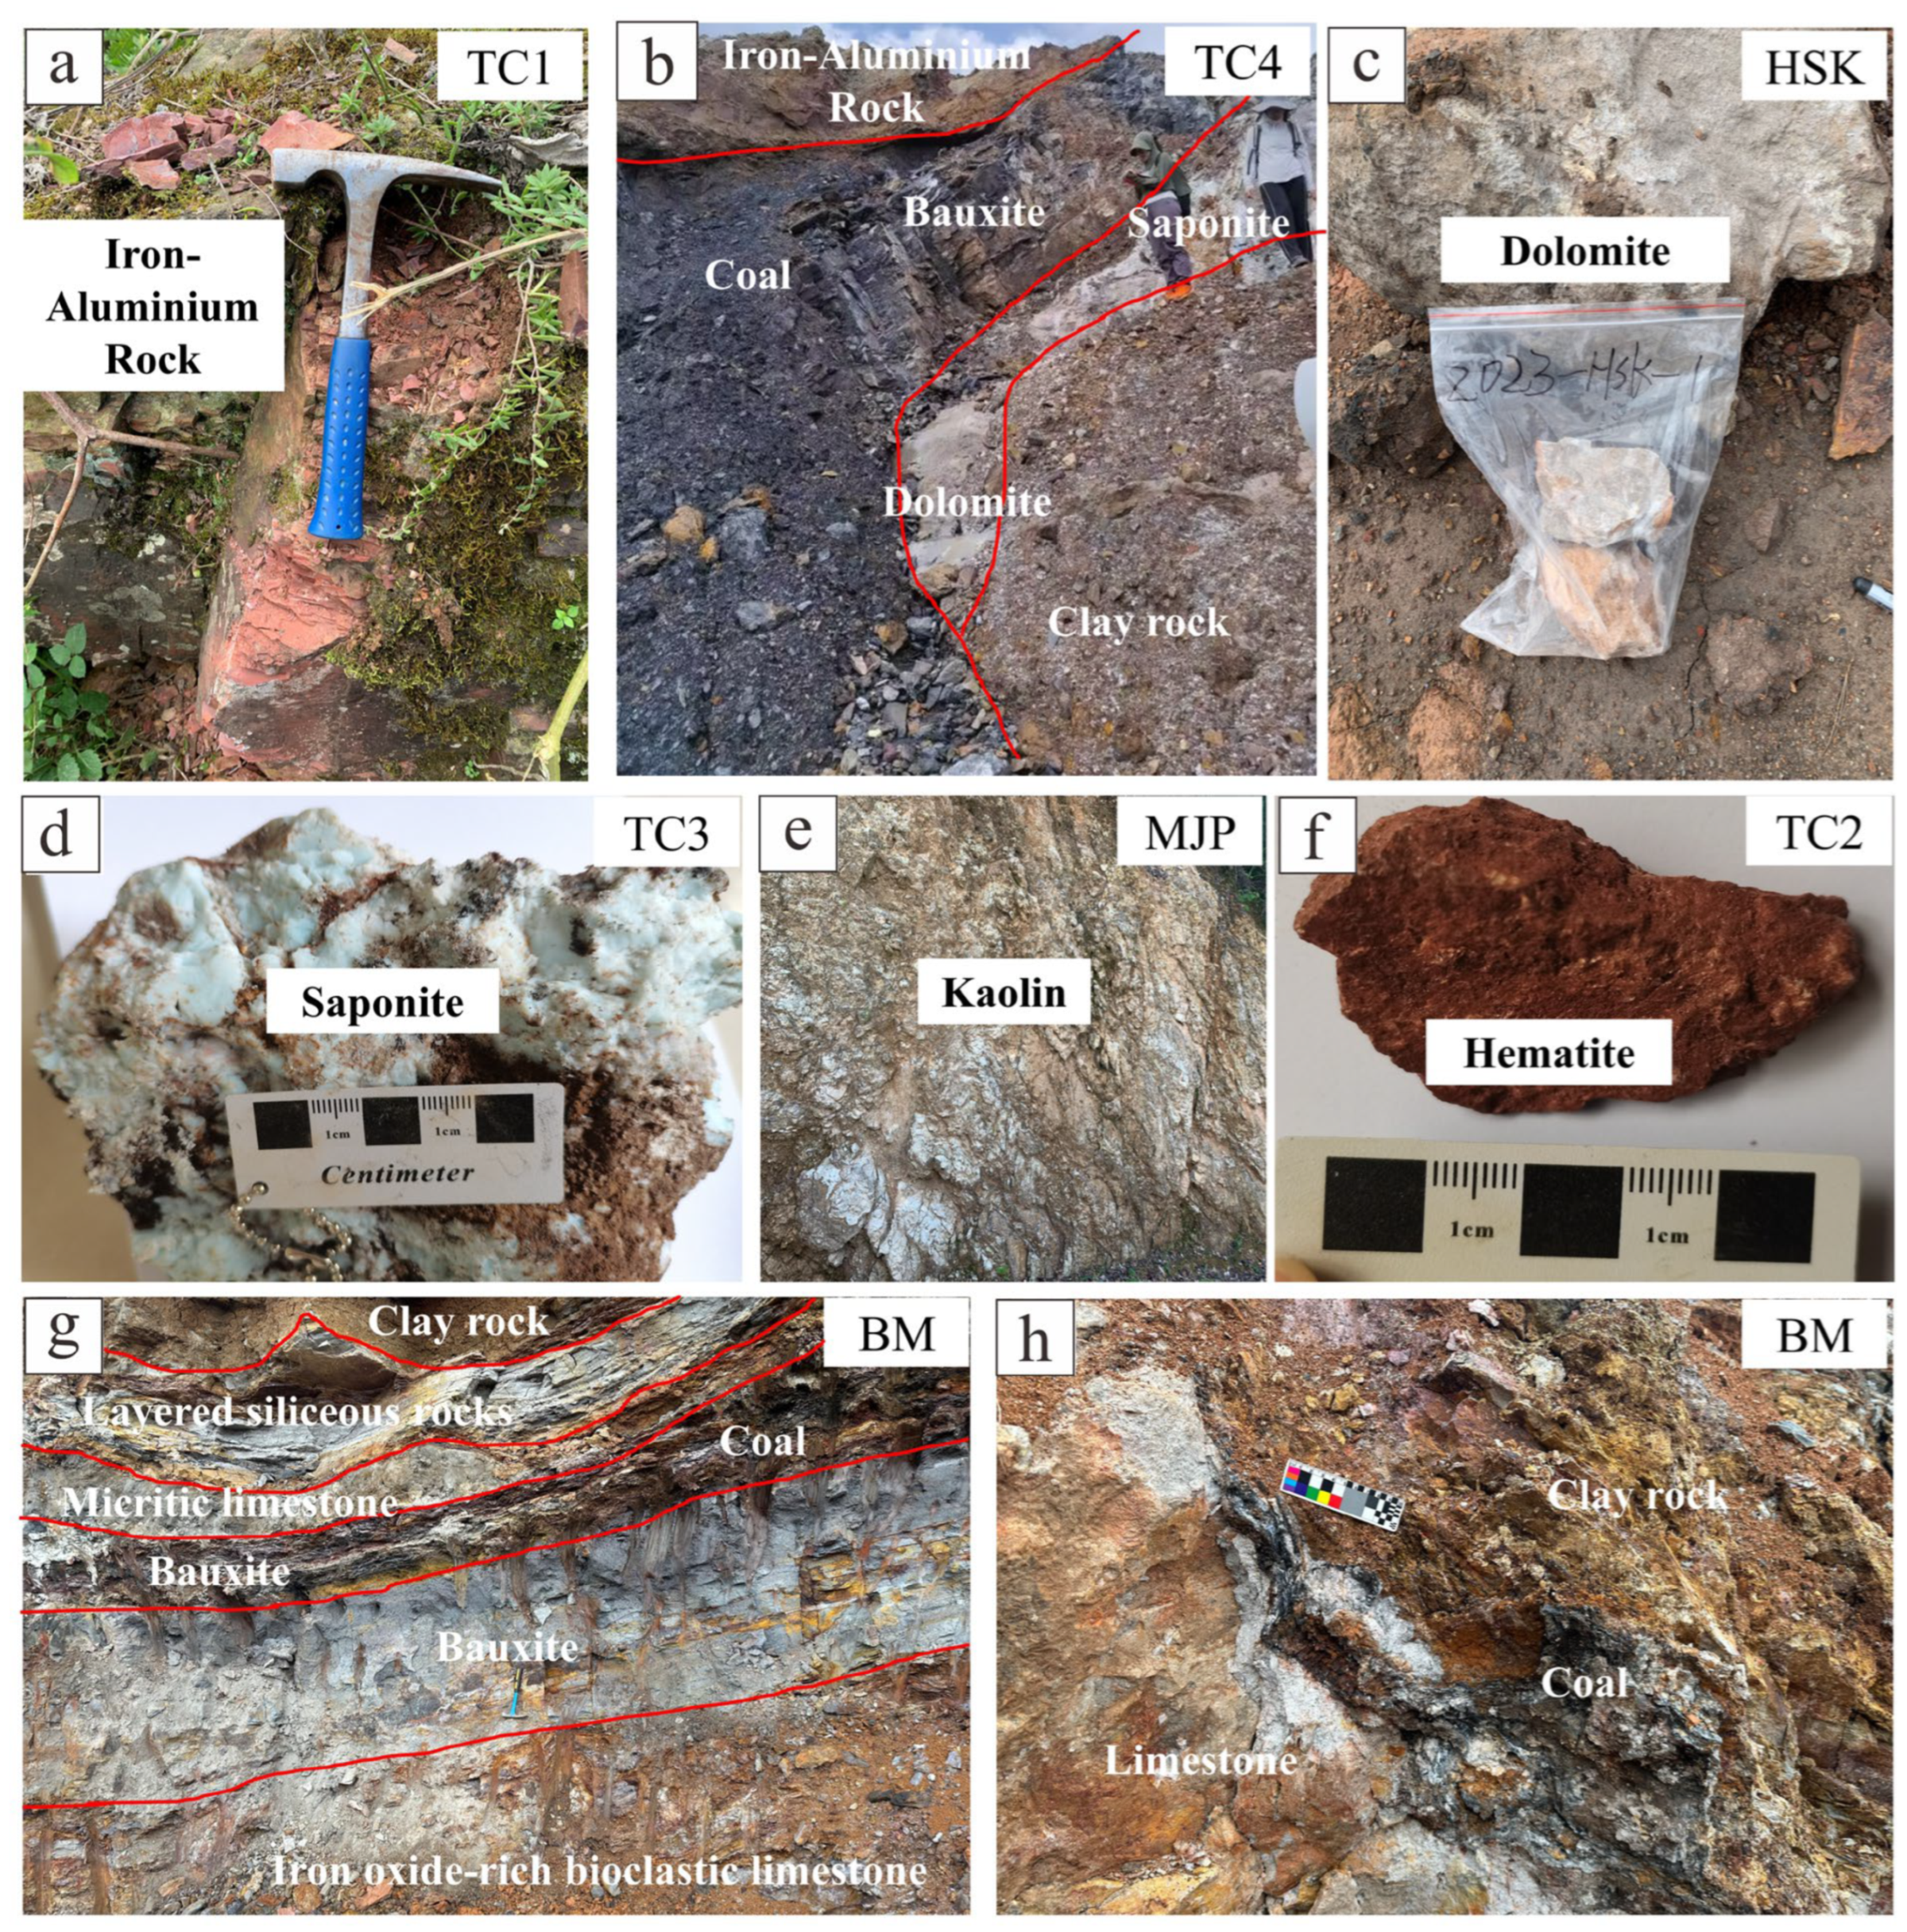
4.4. Results of Field Investigation and Laboratory Analysis

Based on remote sensing interpretation, our study focused on the area between the Wenshan–Malipo Fault to the north and the Guangnan–Funing Fault to the south, targeting the high-value zones of iron-rich silicate minerals and iron–magnesium-rich minerals controlled by WN-, EW-, and EN-oriented arcuate linear structures. We integrated mineral information identification from ZY1-02D data, including cookeite, chlorite, montmorillonite, illite, dolomite, and kaolinite, to conduct a comprehensive field investigation. Using GPS positioning, lithological identification, sample collection, and field photography, we accurately documented seven field validation points (Figure 9) and conducted a detailed analysis of the mineralogical and lithological characteristics at each point. These validation points, designated as TC1, TC2, TC3, TC4, HSK, MJP, and BM, are all developed within the Wujiaping Formation (P3w) and Longtan Formation (P3l) strata, located within high-value zones of minerals such as montmorillonite, cookeite, kaolinite, chlorite, dolomite, and illite. Field investigations confirmed that the strata in these areas developed along linear structures, aligning well with the structural trends identified through remote sensing interpretation. Furthermore, it was observed that the study area is extensively distributed with rocks such as ferruginous aluminous rock, claystone, kaolin, and dolostone.
Iron-rich silicate and iron-rich magnesium minerals identification from ASTER satellite data revealed the presence of iron-rich minerals at all seven field validation points (Figure 10). The collected samples were cut and prepared into thin sections, which were then subjected to petrographic analysis. Microscopic identification confirmed the presence of minerals such as iron oxides, montmorillonite, kaolinite, chlorite, dolomite, and illite (Figure 11). These findings demonstrate that the mineral identification results derived from remote sensing are consistent with field verification, further validating the accuracy of remote sensing mineral information to a certain extent.

4.5. Prospecting Prediction

4.5.1. Analysis of Lithium Occurrences

The Xiaohuayuan lithium occurrences is located on the eastern flank of the Yanshan anticline, with the ore-bearing horizon being the Upper Permian Longtan Formation (P3l), which has a parallel unconformable contact with the underlying Yangxin Formation (P2y). In the red iron–alumina rock blocks accumulated above the karstified basement limestone in this area, two block samples were collected. An analysis by the Yunnan Provincial Geological and Mineral Testing Center revealed that the Li2O content in the samples ranged between 6282 μg/g and 1850 μg/g, confirming the presence of a lithium-rich layer.
The Zhewa lithium occurrences are situated on the southern flank of the Xichou anticline, with the ore-bearing horizon being the Upper Permian Wujiaping Formation (P3w), which has a parallel unconformable contact with the underlying Yangxin Formation (P2y). In the red iron–alumina rock blocks accumulated above the karstified basement limestone in this region, a single block sample was collected, with the analysis by the Yunnan Provincial Geological and Mineral Testing Center showing a Li2O content of up to 1947 μg/g. Additionally, a channel sample was taken from the synsedimentary breccia layer of the parallel unconformity limestone. The analysis revealed a lithium content of 1022 μg/g in the iron–alumina cement, confirming the presence of a lithium-rich layer.
Both the Xiaohuayuan and Zhewa lithium occurrences are located in high-value zones of iron-rich silicate and iron-rich magnesium minerals, along an EW-oriented linear structure between the Wenshan–Malipo and Guangnan–Funing faults. The enriched strata of the Xiaohuayuan lithium occurrence are distributed along faults F101 and F102, corresponding to the remotely sensed information of montmorillonite and cookeite minerals. Meanwhile, the enriched strata of the Zhewa lithium occurrence are distributed along fault F91, corresponding to the remotely sensed information about montmorillonite, cookeite, chlorite, kaolinite, illite, and dolomite minerals (Figure 12).
The comprehensive analysis indicates that the stratigraphic distribution in the Wenshan region is controlled by EW-oriented linear structures between the Wenshan–Malipo fault and the Guangnan–Funing fault. The ore-bearing strata are the Longtan Formation (P3l) and the Wujiaping Formation (P3w), with this structural framework further governing the distribution of clay-type lithium. The high-value zones of iron-rich silicate and iron-rich magnesium mineral identification from ASTER data may indicate lithium enrichment, while minerals such as montmorillonite, cookeite, chlorite, kaolinite, illite, and dolomite identification from ZY1-02D data all serve as indicators for lithium, with montmorillonite and cookeite being particularly strong indicators.

4.5.2. Prediction of Ore Prospective Areas

Through a comprehensive integration of geological data, lithium geochemical anomalies, structural interpretation, and mineral identification results in the Wenshan area, this study delineated ten ore prospective zones (Figure 13). These zones were identified using a GIS-based spatial overlay analysis, wherein multiple thematic layers—such as the distribution of lithium-associated minerals, geochemical anomalies, and interpreted fault structures—were intersected to highlight regions with a high mineralization potential.
All ten target areas are situated within zones enriched in iron silicate and iron-magnesium minerals and exhibit a widespread presence of lithium-indicative minerals, including cookeite, montmorillonite, kaolinite, chlorite, dolomite, and illite. The EW-trending linear structural belt between the Wenshan–Malipo fault and the Guangnan–Funing fault transects target areas T1 through T9 and plays a major role in controlling the distribution of ore-bearing strata.
Target area T1: This area is located on the outer arc of the lithium geochemical anomaly belt of Wenshan–Yanshan–Guangnan–Funing, it is traversed by WN- and SN-oriented linear structures (F49, F95, F87, F102, F87). The strata in the area containing lithium are the Wujiaping Formation (P3w) and Longtan Formation (P3l), including the Yanshan Xiaohuayuan lithium occurrence and the field validation point HSK, making it an important exploration target in the region.
Target areas T2, T3, T4, T5, and T6: These areas belong to the outer arc of the Wenshan–Yanshan–Guangnan–Funing lithium anomaly belt, traversed by WN-, EW-, and EN-oriented linear structures (such as F49, F111, F122, F46, F58), controlling the distribution of the main lithium-bearing strata, the Wujiaping Formation (P3w). Among them, target area T3 includes the field validation point BM and has a high potential for mineral exploration.
Target areas T7, T8, and T9: These areas are distributed in the inner arc of the lithium geochemical anomaly belt of Xichou County Dongma-Xingjie Town, controlled by WN-, EW-, and EN-oriented linear structures (F4, F90, F91, F102, F104) that control the distribution of the lithium-rich strata, with the ore-rich strata being the Wujiaping Formation (P3w). Among them, target area T7 includes the Zhewa lithium occurrences and field validation points TC1, TC2, TC4, and MJP, while TC3 is located in target area T8.
Target area T10: This area is located in the area south of the Wenshan–Malipo Fault, although the Longtan Formation (P3l) is widely distributed in this area, overall it is within the outer arc of the lithium geochemical anomaly belt of Wenshan–Yanshan–Guangnan–Funing, and the WS-oriented remote sensing-interpreted linear structure F94 traverses this target area, controlling the distribution of strata in the region. Therefore, it is speculated that this area may contain clay-type bauxite deposits.

5. Discussion

5.1. Remote Sensing Mineral Identification and Lithology Correspondence and Verification Analysis

By comparing the remote sensing identification mineral information with the lithological map of the 1:10,000 field verification point in the TC4 area (Figure 14), it was found that the cookeite, chlorite, montmorillonite, illite, dolomite, and kaolinite identification from the ZY1-02D data are primarily distributed in the lithological units of the P3l, P2y, and T1x strata, with sparse distribution in the Ch and T1x strata. This aligns closely with the geological map results (Figure 14), fully verifying the accuracy of the remote sensing mineral identification.
Under conditions of low redox potential, Mg2+ ions can be released from Fe oxides; under high redox potential, Mg2+ ions are once again fixed into Fe oxides. The repeated release and incorporation of these ions may result in the net migration and redistribution of Mg within Fe2+ oxides, clay minerals, and ions in soil water [56,57]. The results derived from ASTER data highlighting Fe-rich ferrosilicate minerals are particularly significant for Fe2+-containing silicate minerals and Mg-OH-bearing ferrosilicate minerals, such as chlorite and montmorillonite [48,58]. The findings on Fe–Mg-rich minerals are especially notable for minerals containing Mg2+ and Fe2+ ions, such as cookeite, chlorite, montmorillonite, illite, dolomite, and kaolinite, all of which contain Mg2+ and Fe2+ ions [59,60]. The high-value regions of Fe-rich silicates and Fe–Mg-rich minerals identification from ASTER data align closely with the high-value regions of minerals such as cookeite, chlorite, montmorillonite, illite, dolomite, and kaolinite identification from ZY1-02D data, further validating the reliability of the results.

5.2. Analysis of the Relationship Between Structural Interpretation, Mineral Identification, and Clay-Type Lithium

The overall structural deformation of the study area is an arc-shaped structure concentrically distributed around the Pingma–Yuebei Old Land. This arc-shaped structure is composed of numerous linear arc-shaped folds and longitudinal and radial fault structures [26,27]. Combining the results of structural interpretation with identification mineral information reveals that the ore-rich Wujiaping Formation (P3w), Longtan Formation (P3l), the high-value lithium geochemical zones from the 1:200,000 survey, and the high-value areas of iron silicate and iron–magnesium minerals are mainly distributed along the arc-shaped linear structures in the WN, EW, and EN directions, from north of the Wenshan–Malipo fault to south of the Guangnan–Funing fault. These areas are primarily controlled by linear structures F4, F6, F7, F8, F21, F46, F47, F48, F49, F50, F58, F102, F100, and F111, while the low-value areas lie to the north of the Guangnan–Funing fault and south of the Wenshan–Malipo fault. Furthermore, mineral information such as cookeite, chlorite, montmorillonite, illite, dolomite, and kaolinite identification from the ZY1-02D satellite data shows similar distribution patterns (Figure 8 and Figure 9). It can thus be inferred that the structures not only control the distribution of strata but also play a key role in the enrichment and spatial distribution of minerals. They serve as critical pathways and reservoirs for the migration of clay-type lithium and the accumulation of ore-forming materials, acting as a dominant factor in the ore formation process. Consequently, analyzing the relationship between structural distribution and ore-forming minerals provides significant theoretical value for advancing remote sensing exploration of clay-type lithium.

5.3. Analysis of Prospecting Prediction Results

To further validate the effectiveness and feasibility of the research findings, three field verification points were selected as key anomalous areas for focused validation: field verification point BM in target area T3, point TC4 in target area T7, and point HSK in target area T1. A total of 19 samples from TC4 and 18 samples from HSK underwent a quantitative analysis of major and trace elements, while 5 samples from BM were analyzed for Li2O, Al2O3, and TFe2O3 elements. The results from TC4 and HSK revealed the presence of elements such as Al, Fe, Li, Mg, Al2O3, TFe2O3, and MgO in the samples (Table 3, Figure 15), further validating the accuracy of mineral identification.
In the TC4 samples, two samples with an extremely high lithium content were detected, with values of 766 × 10−6 and 2590 × 10−6, respectively. One sample from HSK showed a lithium content of 1050 × 10−6, and three samples from BM showed lithium contents of 1830 × 10−6, 1078 × 10−6, and 1062 × 10−6, respectively. The Li2O content in the three field verification points ranged from 3340 μg/g to 11,150 μg/g, All of them meet the indicators of comprehensive utilization of lithium in bauxite [15]. While the arithmetic mean lithium concentrations in samples TC4, HSK, and BM appear relatively low, the presence of markedly elevated values in several individual samples underscores their potential significance and merits further investigation. Additionally, by integrating ALOS 12.5 m DEM data with Sentinel-2 remote sensing imagery for structural interpretation, and employing techniques such as band ratioing and spectral angle mapping on ASTER and ZY-02D remote sensing images for mineral identification, this study validated the effectiveness of these methods in prospecting for clay-type lithium. This provides significant guidance for delineating target areas and future exploration efforts.

5.4. Enrichment of Rare Earth Elements

Quantitative analysis of major and trace elements was conducted on 19 samples from TC4 and 18 samples from HSK, and the results indicate that both gallium (Ga) and rare earth elements (REEs) are enriched to some extent in the samples, consistent with the characteristics of many clay-rock-type lithium resources [7,15].
The total rare earth elements (ΣREEs) in TC4 samples range from 12.04 to 1215.47 μg/g, and the enrichment factor relative to chondrites ranges from 2.01 to 202.89, with the highest enrichment factor being 202.89 and the mean enrichment factor being 101.48. For HSK samples, the total rare earth elements range from 37.2 to 1817.6 μg/g, and the enrichment factor relative to chondrites ranges from 6.21 to 303.4, with the highest enrichment factor being 303.4 and the mean enrichment factor being 149.47. Both TC4 and HSK show an obvious enrichment of REEs.
Among them, the highest light rare earth elements concentration (ΣLREEs) of TC4 is 925 μg/g, and the mean ΣLREEs is 429.71 μg/g, while those of samples from HSK are 1296 μg/g and 590.88 μg/g, respectively. Both TC4 and HSK have negative Eu anomalies, with EuN ranging from 0.33 to 0.57 in TC4 and 0.46 to 0.61 in HSK. Additionally, the content of gallium in the samples is also high, with the highest content in TC4 samples reaching 77.90 μg/g and an average of 41.67 μg/g, and those of samples from HSK are 86.6 μg/g and 47.43 μg/g, respectively, all exceeding the industrial concentrations of bauxite-type gallium deposits [15]. This indicates that the samples in the study area are not only significantly enriched in rare earth elements but also have high industrial potential for gallium resources.
Previous studies have shown that a slight negative anomaly of EuN is related to the source of volcanic material [61], and that mafic and ultramafic rocks usually exhibit weak negative or no Eu anomalies, while felsic rocks display strong negative Eu anomalies. These characteristics, if preserved in sedimentary rocks, can serve as provenance indicators [62]. Volcanic tuff is widely developed in the Permian strata of the Wenshan area, mainly formed by the large-scale eruption of the Emeishan basalt about 260 Ma ago, belonging to continental flood basalts [62,63]. The TC4 and HSK profiles contain volcanic tuff, leading to significant negative Eu anomalies in the sedimentary record.
Further analysis found no correlation between lithium and heavy rare earth elements, light rare earth elements, LREEs/HREEs ratio, δEuN values, and Ga in the samples. Clay minerals (such as montmorillonite and kaolinite) are not only the main carriers of lithium but can also adsorb rare earth elements and gallium. Lithium is mainly hosted in iron–magnesium silicate minerals such as montmorillonite, chlorite, and lithium-rich chlorite [8,17,18,64], while in weathering-type rare earth deposits (such as southern ion-type rare earth deposits), rare earth elements are adsorbed onto the surfaces of clay minerals like kaolinite and montmorillonite [65,66]; gallium replaces aluminum in the lattice of aluminum oxides or is adsorbed onto the surfaces of clay minerals [67]. Therefore, in weathering-type deposits, REE, Li, and Ga may dissolve and migrate due to intense chemical weathering, enriching in different mineral phases, which could be the reason for their lack of correlation.

6. Conclusions

This study comprehensively utilized multi-source remote sensing data from ZY1-02D and ASTER, combined with geological maps and field verification, to successfully extract key mineral information such as cookeite, chlorite, montmorillonite, illite, dolomite, and kaolinite. The distribution of these minerals highly coincides with the lithological units of the target stratigraphic units (P3l, P2y), validating the high precision and practicality of remote sensing mineral identification techniques and further indicating the significant application potential of remote sensing technology in the identification and exploration of clay-type lithium.
Structural analysis shows that the NW-, EW-, and NE-trending arc-shaped linear structures in the study area play a key controlling role in the spatial distribution and enrichment of minerals, with the ore-bearing horizons being the Longtan Formation (P3l) and the Wujiaping Formation (P3w). This structural pattern not only provides favorable geological conditions for the migration and accumulation of ore-forming materials, but also directly affects the distribution characteristics of clay-type lithium. The high-value areas of iron-rich silicates and iron-rich magnesium minerals revealed by ASTER data can effectively indicate the enrichment of lithium deposits; minerals such as montmorillonite, cookeite, chlorite, kaolinite, illite and dolomite extracted from ZY1-02D data all show indicative significance for lithium, among which the indication of montmorillonite and cookeite is particularly significant. Based on the comprehensive information of strata, structure, remote sensing mineral identification, geochemical characteristics, and field verification data, this study delineated 10 potential mineral exploration targets. Further analysis of field samples confirmed that six samples from target areas T3, T7, and T1 met the comprehensive utilization index of lithium in bauxite (Li2O ≥ 500 μg/g), indicating that the study area has significant potential for mineral exploration and development value.
In summary, this study systematically validated the effectiveness of remote sensing technology combined with structural interpretation and mineral identification in regional exploration and resource evaluation, providing important technical support and reference for the theoretical research and practical exploration of clay-type lithium. These results not only provide a scientific basis for guiding future geological exploration and resource development but also establish a technical paradigm for the exploration modeling of similar deposits globally.

7. Patents

Zhao, Z.; Feng, L.; Yang, C.; Zhao, X. A prospecting method and device for clay-type lithium ore. China Patent CN119493965B, 2025.

Author Contributions

Conceptualization, L.F., H.Y., and Z.Z.; methodology, L.F. and Q.C.; software, L.F., Q.C., G.Z., X.Z. (Xinle Zhang), and Z.Z.; validation, L.F., H.Y., C.Y., and X.Z. (Xinle Zhang); formal analysis, L.F.; investigation, L.F., H.Y., C.Y., and X.Z. (Xiao Zhao); resources, L.F. and Z.Z.; data curation, L.F., Q.C., G.Z., X.Z. (Xinle Zhang), X.D., and Z.Z.; writing—original draft preparation, L.F., Z.Z., and Q.C.; writing—review and editing, L.F. and Z.Z.; visualization, L.F. and Z.Z.; supervision, L.F. and Z.Z.; project administration, L.F. and Z.Z.; funding acquisition, Z.Z. All authors have read and agreed to the published version of the manuscript.

Funding

This study is supported by the “Yunnan International Joint Laboratory of China–Laos–Bangladesh–Myanmar Natural Resources Remote Sensing Monitoring” (Grant No. 202303AP140015) and the “Lithium Resource Exploration Prediction Project in Wenshan, Yunnan” (Grant No. K207004240027).

Data Availability Statement

The data of experimental images used to support the findings of this research are available from the corresponding author upon reasonable request.

Acknowledgments

The authors gratefully acknowledge the support and field resources provided by the leadership and colleagues of the Second Geological Team of the Yunnan Geological Exploration and Development Bureau. Special thanks are extended to Zhifang Zhao, Haiying Yang, Qi Chen, Changbi Yang, Xiao Zhao, Geng Zhang, Xinle Zhang, and Dong Xin for their valuable assistance in fieldwork and manuscript preparation.

Conflicts of Interest

The authors declare no conflicts of interest.

References

  1. Ghorbani, Y.; Zhang, S.E.; Bourdeau, J.E.; Chipangamate, N.S.; Rose, D.H.; Valodia, I.; Nwaila, G.T. The Strategic Role of Lithium in the Green Energy Transition: Towards an OPEC-Style Framework for Green Energy-Mineral Exporting Countries (GEMEC). Resour. Policy 2024, 90, 104737. [Google Scholar] [CrossRef]
  2. Tabelin, C.B.; Dallas, J.; Casanova, S.; Pelech, T.; Bournival, G.; Saydam, S.; Canbulat, I. Towards a Low-Carbon Society: A Review of Lithium Resource Availability, Challenges and Innovations in Mining, Extraction and Recycling, and Future Perspectives. Miner. Eng. 2021, 163, 106743. [Google Scholar] [CrossRef]
  3. Shi, D.; Zhang, L.; Peng, X.; Li, L.; Song, F.; Nie, F.; Ji, L.; Zhang, Y. Extraction of Lithium from Salt Lake Brine Containing Boron Using Multistage Centrifuge Extractors. Desalination 2018, 441, 44–51. [Google Scholar] [CrossRef]
  4. Zhang, L.; Li, L.; Shi, D.; Li, J.; Peng, X.; Nie, F. Selective Extraction of Lithium from Alkaline Brine Using HBTA-TOPO Synergistic Extraction System. Sep. Purif. Technol. 2017, 188, 167–173. [Google Scholar] [CrossRef]
  5. Mohr, S.H.; Mudd, G.M.; Giurco, D. Lithium Resources and Production: Critical Assessment and Global Projections. Minerals 2012, 2, 65–84. [Google Scholar] [CrossRef]
  6. Wang, W.; Jiang, S.-Y.; Ge, W.; Zhang, Q.; Liu, T.; Zhang, X. Geological Characteristics and Genetic Mechanism of the Lacustrine Sedimentary Clay Type Lithium Deposit. BMPG 2024, 43, 64–78. [Google Scholar] [CrossRef]
  7. Wang, W.; Jiang, S.-Y.; Zhang, W.-S.; Yin, J. A New Type of Clay-Li Deposit: Fault-Controlled Hydrothermal Alteration in Southern Hubei Province, China. Ore Geol. Rev. 2024, 170, 106138. [Google Scholar] [CrossRef]
  8. Zhang, J.-Y.; Wang, Q.; Liu, X.-F.; Zhou, G.-F.; Xu, H.-P.; Zhu, Y.-G. Provenance and Ore-Forming Process of Permian Lithium-Rich Bauxite in Central Yunnan, SW China. Ore Geol. Rev. 2022, 145, 104862. [Google Scholar] [CrossRef]
  9. Cardoso-Fernandes, J.; Silva, J.; Perrotta, M.M.; Lima, A.; Teodoro, A.C.; Ribeiro, M.A.; Dias, F.; Barrès, O.; Cauzid, J.; Roda-Robles, E. Interpretation of the Reflectance Spectra of Lithium (Li) Minerals and Pegmatites: A Case Study for Mineralogical and Lithological Identification in the Fregeneda-Almendra Area. Remote Sens. 2021, 13, 3688. [Google Scholar] [CrossRef]
  10. Mashkoor, R.; Ahmadi, H.; Rahmani, A.B.; Pekkan, E. Detecting Li-Bearing Pegmatites Using Geospatial Technology: The Case of SW Konar Province, Eastern Afghanistan. Geocarto Int. 2022, 37, 14105–14126. [Google Scholar] [CrossRef]
  11. Gemusse, U.; Lima, A.; Teodoro, A.C.M. Comparing Different Techniques of Satellite Imagery Classification to Mineral Mapping Pegmatite of Muiane and Naipa: Mozambique. In Proceedings of the Earth Resources and Environmental Remote Sensing/GIS Applications X; Schulz, K., Nikolakopoulos, K.G., Michel, U., Eds.; SPIE: Strasbourg, France, 2019; p. 49. [Google Scholar]
  12. Benson, T.R.; Coble, M.A.; Dilles, J.H. Hydrothermal Enrichment of Lithium in Intracaldera Illite-Bearing Claystones. Sci. Adv. 2023, 9, eadh8183. [Google Scholar] [CrossRef]
  13. Li, C.; Li, Z.; Wu, T.; Luo, Y.; Zhao, J.; Li, X.; Yang, W.; Chen, X. Metallogenic Characteristics and Formation Mechanism of Naomugeng Clay-Type Lithium Deposit in Central Inner Mongolia, China. Minerals 2021, 11, 238. [Google Scholar] [CrossRef]
  14. Castor, S.B.; Henry, C.D. Lithium-Rich Claystone in the McDermitt Caldera, Nevada, USA: Geologic, Mineralogical, and Geochemical Characteristics and Possible Origin. Minerals 2020, 10, 68. [Google Scholar] [CrossRef]
  15. Wen, H.; Luo, C.; Du, S.; Yu, W.; Gu, H.; Ling, K.; Cui, Y.; Li, Y.; Yang, J. Carbonate-Hosted Clay-Type Lithium Deposit and Its Prospecting Significance. CSB 2020, 65, 53–59. [Google Scholar] [CrossRef]
  16. Wang, R.; Wang, Q.; Huang, Y.; Yang, S.; Liu, X.; Zhou, Q. Combined Tectonic and Paleogeographic Controls on the Genesis of Bauxite in the Early Carboniferous to Permian Central Yangtze Island. Ore Geol. Rev. 2018, 101, 468–480. [Google Scholar] [CrossRef]
  17. Wang, T.; Fu, Y.; Chen, P.; Hou, K.; Tang, B.; Luo, P.; Yao, L.; Liu, B.; Long, Z.; Liu, Y.; et al. Detrital Composition and Sedimentary Provenance of Early Carboniferous Al-Bearing Rock Series in Central Guizhou. Ore Geol. Rev. 2023, 156, 105404. [Google Scholar] [CrossRef]
  18. Yang, J.; Wen, H.; Guo, X.; Luo, C.; Yu, W.; Du, S.; Cui, Y.; Zhao, B. Detrital Zircon U–Pb Ages and Trace Elements Indicate the Provenance of Early Carboniferous Li-Rich Claystone from Central Guizhou, South China. Sediment. Geol. 2022, 442, 106278. [Google Scholar] [CrossRef]
  19. Zhang, G.; Zhao, Z.; Zhang, X.; Wu, X.; Zheng, Y.; Feng, L.; Huang, Z. Comprehensive Multi-Source Remote Sensing Data Integration for Enhanced Mineralization Alteration Extraction and Geological Structure Interpretation in the Lala Region of Sichuan Province. Ore Geol. Rev. 2024, 168, 106032. [Google Scholar] [CrossRef]
  20. Zhang, X.; Zhao, Z.; Chen, Q.; Chai, W.; Li, Z.; Zhang, G.; Yang, H.; Niu, L. Mapping Hydrothermal Alteration of the Pulang Porphyry Copper Deposit, SW China, Using ASTER and ZY1-02D Satellite Data. Ore Geol. Rev. 2023, 161, 105605. [Google Scholar] [CrossRef]
  21. Ren, Z.; Sun, L.; Zhai, Q. Improved K-Means and Spectral Matching for Hyperspectral Mineral Mapping. Int. J. Appl. Earth Obs. Geoinf. 2020, 91, 102154. [Google Scholar] [CrossRef]
  22. Chen, L.; Zhang, N.; Zhao, T.; Zhang, H.; Chang, J.; Tao, J.; Chi, Y. Lithium-Bearing Pegmatite Identification, Based on Spectral Analysis and Machine Learning: A Case Study of the Dahongliutan Area, NW China. Remote Sens. 2023, 15, 493. [Google Scholar] [CrossRef]
  23. Chen, L.; Sui, X.; Liu, R.; Chen, H.; Li, Y.; Zhang, X.; Chen, H. Mapping Alteration Minerals Using ZY-1 02D Hyperspectral Remote Sensing Data in Coalbed Methane Enrichment Areas. Remote Sens. 2023, 15, 3590. [Google Scholar] [CrossRef]
  24. Feng, Y.; Dai, J.; Bai, L.; Wu, C. Prospecting Prediction for the Yulong Metallogenic Belt in Tibet Based on Remote Sensing Alteration Information and Structural Interpretation. Remote Sens. 2024, 16, 1343. [Google Scholar] [CrossRef]
  25. Shebl, A.; Badawi, M.; Dawoud, M.; Abd El-Wahed, M.; El-Dokouny, H.A.; Csámer, Á. Novel Comprehensions of Lithological and Structural Features Gleaned via Sentinel 2 Texture Analysis. Ore Geol. Rev. 2024, 168, 106068. [Google Scholar] [CrossRef]
  26. Luo, J.-X.; He, Y.-B.; Wang, R.; Liu, M.; Hu, X.-F. Lithofacies Palaeogeography of the Late Permian Wujiaping Age in the Middle and Upper Yangtze Region, China. J. Palaeogeogr. 2014, 3, 384–409. [Google Scholar] [CrossRef]
  27. Yue, W.; Yugan, J. Permian Palaeogeographic Evolution of the Jiangnan Basin, South China. Palaeogeogr. Palaeoclimatol. Palaeoecol. 2000, 160, 35–44. [Google Scholar] [CrossRef]
  28. Wen, H.J.; Luo, C.G.; Du, S.J.; Yu, X.W.; Ling, K.Y.; Li, Y.; Yang, J.H. Carbonate Hosted Clay-Type Lithium Deposit and Its Prospecting Significance. Chin. Sci. Bul. 2020, 65, 53–59. (In Chinese) [Google Scholar] [CrossRef]
  29. Lei, Y. Genesis and Metallogenic Regularity of Late Permiansedimentary Bauxite Deposit, Southeast Yunnan. Ph.D. Thesis, China University of Geosciences, Beijing, China, 2012. [Google Scholar]
  30. Liu, X.; Zhao, L.; Wang, Q.; Sun, X.; Liu, L.; Yang, S.; Deng, J. Provenance and Genesis of Karstic Bauxite Deposits in China: Implications for the Formation of Super-Large Karstic Bauxite Deposits. Earth Sci. Rev. 2024, 257, 104882. [Google Scholar] [CrossRef]
  31. He, B.; Xu, Y.-G.; Chung, S.-L.; Xiao, L.; Wang, Y. Sedimentary Evidence for a Rapid, Kilometer-Scale Crustal Doming Prior to the Eruption of the Emeishan Flood Basalts. Earth Planet. Sci. Lett. 2003, 213, 391–405. [Google Scholar] [CrossRef]
  32. Zhang, L.; Park, C.; Wang, G.; Wu, C.; Santosh, M.; Chung, D.; Song, Y. Phase Transformation Processes in Karst-Type Bauxite Deposit from Yunnan Area, China. Ore Geol. Rev. 2017, 89, 407–420. [Google Scholar] [CrossRef]
  33. Chen, Y.; Yang, G.; Li, K. Atlas of Geophysics and Geochemistry of Yunnan Province; Xie, K., Ed.; Geological Publishing House: Beijing, China, 2015; ISBN 978-7-116-09294-5. [Google Scholar]
  34. Lehmann, J.; Brower, A.M.; Owen-Smith, T.M.; Bybee, G.M.; Hayes, B. Landsat 8 and Alos DEM Geological Mapping Reveals the Architecture of the Giant Mesoproterozoic Kunene Complex Anorthosite Suite (Angola/Namibia). Geosci. Front. 2023, 14, 101620. [Google Scholar] [CrossRef]
  35. Fatdillah, E.; Rehan, B.M.; Rameshwaran, P.; Bell, V.A.; Zulkafli, Z.; Yusuf, B.; Sayers, P. Spatial Estimates of Flood Damage and Risk Are Influenced by the Underpinning DEM Resolution: A Case Study in Kuala Lumpur, Malaysia. Water 2022, 14, 2208. [Google Scholar] [CrossRef]
  36. Mandanici, E.; Bitelli, G. Preliminary Comparison of Sentinel-2 and Landsat 8 Imagery for a Combined Use. Remote Sens. 2016, 8, 1014. [Google Scholar] [CrossRef]
  37. Sekandari, M.; Masoumi, I.; Beiranvand Pour, A.; M Muslim, A.; Rahmani, O.; Hashim, M.; Zoheir, B.; Pradhan, B.; Misra, A.; Aminpour, S.M. Application of Landsat-8, Sentinel-2, ASTER and WorldView-3 Spectral Imagery for Exploration of Carbonate-Hosted Pb-Zn Deposits in the Central Iranian Terrane (CIT). Remote Sens. 2020, 12, 1239. [Google Scholar] [CrossRef]
  38. Ahmadirouhani, R.; Karimpour, M.-H.; Rahimi, B.; Malekzadeh-Shafaroudi, A.; Pour, A.B.; Pradhan, B. Integration of SPOT-5 and ASTER Satellite Data for Structural Tracing and Hydrothermal Alteration Mineral Mapping: Implications for Cu–Au Prospecting. Int. J. Image Data Fusion 2018, 9, 237–262. [Google Scholar] [CrossRef]
  39. Mahanta, P.; Maiti, S. Regional Scale Demarcation of Alteration Zone Using ASTER Imageries in South Purulia Shear Zone, East India: Implication for Mineral Exploration in Vegetated Regions. Ore Geol. Rev. 2018, 102, 846–861. [Google Scholar] [CrossRef]
  40. Rowan, L.C.; Mars, J.C. Lithologic Mapping in the Mountain Pass, California Area Using Advanced Spaceborne Thermal Emission and Reflection Radiometer (ASTER) Data. Remote Sens. Environ. 2003, 84, 350–366. [Google Scholar] [CrossRef]
  41. Rowan, L.C.; Mars, J.C.; Simpson, C.J. Lithologic Mapping of the Mordor, NT, Australia Ultramafic Complex by Using the Advanced Spaceborne Thermal Emission and Reflection Radiometer (ASTER). Remote Sens. Environ. 2005, 99, 105–126. [Google Scholar] [CrossRef]
  42. Xiao, D.; Le, B.T.; Ha, T.T.L. Iron Ore Identification Method Using Reflectance Spectrometer and a Deep Neural Network Framework. Spectrochim. Acta Part A Mol. Biomol. Spectrosc. 2021, 248, 119168. [Google Scholar] [CrossRef]
  43. Safari, M.; Maghsoudi, A.; Pour, A.B. Application of Landsat-8 and ASTER Satellite Remote Sensing Data for Porphyry Copper Exploration: A Case Study from Shahr-e-Babak, Kerman, South of Iran. Geocarto Int. 2018, 33, 1186–1201. [Google Scholar] [CrossRef]
  44. Sun, W.; Liu, K.; Ren, G.; Liu, W.; Yang, G.; Meng, X.; Peng, J. A Simple and Effective Spectral-Spatial Method for Mapping Large-Scale Coastal Wetlands Using China ZY1-02D Satellite Hyperspectral Images. Int. J. Appl. Earth Obs. Geoinf. 2021, 104, 102572. [Google Scholar] [CrossRef]
  45. Guo, H.; Zhang, R.; Dai, W.; Zhou, X.; Zhang, D.; Yang, Y.; Cui, J. Mapping Soil Organic Matter Content Based on Feature Band Selection with ZY1-02D Hyperspectral Satellite Data in the Agricultural Region. Agronomy 2022, 12, 2111. [Google Scholar] [CrossRef]
  46. Lu, H.; Qiao, D.; Li, Y.; Wu, S.; Deng, L. Fusion of China ZY-1 02D Hyperspectral Data and Multispectral Data: Which Methods Should Be Used? Remote Sens. 2021, 13, 2354. [Google Scholar] [CrossRef]
  47. Qi, C.W.; Dong, J.E.; Chen, X.; Ye, G.F.; He, S.Y.; Dai, W.; Wang, B. Application of Altered Mineral Mapping and Mineral Exploration by Using ZY-1 02D Hyperspectral Data in Northern Desert Area of Qaidam Basin. Remote Sens. Nat. Resour. 2024, 1–12. [Google Scholar] [CrossRef]
  48. Zhang, R.S.; Cao, H.; Zeng, M.; Zhang, D.X.; Li, G.X. Scientific Belt Lithologic Mapping Based on ASTER Spectral Analysis: A Case Study from the Tashkorgan Area (Xinjiang, China). Acta Petrol. Sin. 2016, 32, 3835–3846. [Google Scholar]
  49. Ninomiya, Y.; Fu, B.; Cudahy, T.J. Detecting Lithology with Advanced Spaceborne Thermal Emission and Reflection Radiometer (ASTER) Multispectral Thermal Infrared “Radiance-at-Sensor” Data. Remote Sens. Environ. 2005, 99, 127–139. [Google Scholar] [CrossRef]
  50. Guha, S.; Govil, H. Evaluation of ASTER TIR Data-Based Lithological Indices in Malanjkhand Copper Mines of Madhya Pradesh, India. Appl. Earth Sci. 2020, 129, 3–8. [Google Scholar] [CrossRef]
  51. Ding, W.; Ding, L.; Li, Q.; Li, J.; Zhang, L. Lithium-Rich Pegmatite Detection Integrating High-Resolution and Hyperspectral Satellite Data in Zhawulong Area, Western Sichuan, China. Remote Sens. 2023, 15, 3969. [Google Scholar] [CrossRef]
  52. Petropoulos, G.P.; Vadrevu, K.P.; Kalaitzidis, C. Spectral Angle Mapper and Object-Based Classification Combined with Hyperspectral Remote Sensing Imagery for Obtaining Land Use/Cover Mapping in a Mediterranean Region. Geocarto Int. 2013, 28, 114–129. [Google Scholar] [CrossRef]
  53. Tripathi, M.K.; Govil, H.; Diwan, P. Comparative Evaluation Threshold Parameters of Spectral Angle Mapper (SAM) for Mapping of Chhabadiya Talc Minerals, Jahajpur, Bhilwara, India Using Hyperion Hyperspectral Remote Sensing Data. In Proceedings of the 2019 2nd International Conference on Intelligent Communication and Computational Techniques (ICCT), Jaipur, India, 28–29 September 2019; pp. 70–74. [Google Scholar]
  54. Kruse, F.A.; Lefkoff, A.B.; Heidebrecht, K.B. The Spectral Image Processing System (Sips)—Software For Integrated Analysis Of Aviris Data. In Proceedings of the Third Annual JPL Airborne Geoscience Workshop. Volume 1: AVIRIS Workshop, Pasadena, CA, USA, 1–5 June 1992. [Google Scholar]
  55. Warr, L.N. IMA–CNMNC Approved Mineral Symbols. Mineral. Mag. 2021, 85, 291–320. [Google Scholar] [CrossRef]
  56. Palumbo, B.; Bellanca, A.; Neri, R.; Roe, M.J. Trace Metal Partitioning in Fe–Mn Nodules from Sicilian Soils, Italy. Chem. Geol. 2001, 173, 257–269. [Google Scholar] [CrossRef]
  57. Gao, T.; Ke, S.; Wang, S.-J.; Li, F.; Liu, C.; Lei, J.; Liao, C.; Wu, F. Contrasting Mg Isotopic Compositions between Fe-Mn Nodules and Surrounding Soils: Accumulation of Light Mg Isotopes by Mg-Depleted Clay Minerals and Fe Oxides. Geochim. Et Cosmochim. Acta 2018, 237, 205–222. [Google Scholar] [CrossRef]
  58. Ilgen, A.G.; Kukkadapu, R.K.; Leung, K.; Washington, R.E. “Switching on” Iron in Clay Minerals. Environ. Sci. Nano 2019, 6, 1704–1715. [Google Scholar] [CrossRef]
  59. Tipper, E.T.; Calmels, D.; Gaillardet, J.; Louvat, P.; Capmas, F.; Dubacq, B. Positive Correlation between Li and Mg Isotope Ratios in the River Waters of the Mackenzie Basin Challenges the Interpretation of Apparent Isotopic Fractionation during Weathering. Earth Planet. Sci. Lett. 2012, 333–334, 35–45. [Google Scholar] [CrossRef]
  60. Wimpenny, J.; Colla, C.A.; Yin, Q.-Z.; Rustad, J.R.; Casey, W.H. Investigating the Behaviour of Mg Isotopes during the Formation of Clay Minerals. Geochim. Et Cosmochim. Acta 2014, 128, 178–194. [Google Scholar] [CrossRef]
  61. Ling, K.; Wen, H.; Zhang, Q.; Luo, C.; Gu, H.; Du, S.; Yu, W. Super-Enrichment of Lithium and Niobium in the Upper Permian Heshan Formation in Pingguo, Guangxi, China. Sci. China Earth Sci. 2021, 64, 753–772. [Google Scholar] [CrossRef]
  62. He, B.; Xu, Y.-G.; Huang, X.-L.; Luo, Z.-Y.; Shi, Y.-R.; Yang, Q.-J.; Yu, S.-Y. Age and Duration of the Emeishan Flood Volcanism, SW China: Geochemistry and SHRIMP Zircon U–Pb Dating of Silicic Ignimbrites, Post-Volcanic Xuanwei Formation and Clay Tuff at the Chaotian Section. Earth Planet. Sci. Lett. 2007, 255, 306–323. [Google Scholar] [CrossRef]
  63. Xu, Y.; Zheng, L.; Yang, Z.; Tong, Y.-B.; Wang, B.; Yuan, W.; Jing, X. Rapid Eruption of the Emeishan Continental Flood Basalts: New Paleomagnetic and Geochronologic Constraints. GSA Bull. 2021, 134, 1845–1862. [Google Scholar] [CrossRef]
  64. Ling, K.-Y.; Tang, H.-S.; Zhang, Z.-W.; Wen, H.-J. Host Minerals of Li–Ga–V–Rare Earth Elements in Carboniferous Karstic Bauxites in Southwest China. Ore Geol. Rev. 2020, 119, 103325. [Google Scholar] [CrossRef]
  65. Feng, X.; Onel, O.; Council-Troche, M.; Noble, A.; Yoon, R.-H.; Morris, J.R. A Study of Rare Earth Ion-Adsorption Clays: The Speciation of Rare Earth Elements on Kaolinite at Basic pH. Appl. Clay Sci. 2021, 201, 105920. [Google Scholar] [CrossRef]
  66. Xiao, Y.; Huang, L.; Long, Z.; Feng, Z.; Wang, L. Adsorption Ability of Rare Earth Elements on Clay Minerals and Its Practical Performance. J. Rare Earths 2016, 34, 543–548. [Google Scholar] [CrossRef]
  67. Hugo, R.C.; Hoagland, R.G. Gallium Penetration of Aluminum: In-Situ TEM Observations at the Penetration Front. Scr. Mater. 1999, 41, 1341–1346. [Google Scholar] [CrossRef]
Figure 1. Simplified lithofacies–paleogeographic map of southeastern Yunnan and adjacent areas during the Wujiapingian stage of the Late Permian [29].
Minerals 15 00826 g001
Figure 2. Tectonic division and simplified geological map of southeastern Yunnan and adjacent areas (source: Geological and Mineral Resources Exploration and Development Bureau of Yunnan Province), 1:200,000 geological and mineral maps (Gejiu sheet, Jianshui sheet, Jinping-Yuanhekou sheet, Yuanyang-Damaluka sheet, Wenshan-Funing-Maguan sheet: 1966–1972); 1:50,000 geological maps (Maguan County sheet—Bazhai sheet: 2000, Maguopo County sheet—Bu Longfu: 1998); Geological and Mineral Resources Exploration and Development Bureau of Yunnan Province, 1:750,000 tectonic and metallogenic zoning map: 1998; Yunnan Provincial Nonferrous Geological Exploration Institute, Geological Map of the Indochina Peninsula (Xidian, Laos, Thailand, Cambodia, Vietnam) (1:2,500,000): 2001; Tectonic division referenced from Tectonic Map and Specification of the Qinghai-Tibet Plateau and Adjacent Areas (1:1500000).
Minerals 15 00826 g002
Figure 3. 1:200,000 lithium geochemical map of the Wenshan region in Southeastern Yunnan [33].
Minerals 15 00826 g003
Figure 4. (a) Results of ZY-1 02D AHSI data, showing a true-color composite image with B29 (R), B19 (G), and B10 (B). The red dot indicate the locations of the vegetation spectra. (b) Vegetation spectra at the red dot from the unprocessed ZY-1 02D image. (c) Vegetation spectra at the red dot from the preprocessed ZY-1 02D image.
Minerals 15 00826 g004
Figure 5. Flowchart.
Minerals 15 00826 g005
Figure 6. Remote sensing interpretation signs for linear structures.
Minerals 15 00826 g006
Figure 7. (a) The spectral curve from the USGS, while (b) shows the resampled spectral curve from ZY1-02D.
Minerals 15 00826 g007
Figure 8. (a) Interpretation results of linear structures; (b) map of iron-rich silicate minerals; (c) map of iron-rich magnesium minerals.
Minerals 15 00826 g008
Figure 9. (a) Illite; (b) Kaolinite; (c) Montmorillonite; (d) Dolomite; (e) Cookeite; (f) Chlorite.
Minerals 15 00826 g009
Figure 10. (a) Iron aluminum rock; (b) TC4 profile diagram; (c) Dolomite; (d) Saponite; (e) Kaolin; (f) Hematite; (g,h) BM profile diagrams.
Minerals 15 00826 g010
Figure 11. Presents the petrographic study of clay minerals under the microscope: (a) dolomite and calcite; (b,c) iron oxides; (d) illite, montmorillonite, and chlorite; (e) montmorillonite, kaolinite, chlorite, and boehmite; (f) montmorillonite, kaolinite, and chlorite. Note: (af) were taken under microscope under plane-polarized light. Abbreviations: Dol = dolomite; Cal = calcite; Chl = Chlorite; Ilt = Illite; Mnt = Montmorillonite; Kln = Kaolinite; Dsp = Diaspore [55].
Minerals 15 00826 g011
Figure 12. (a,d) High-value zones of iron-rich silicate minerals; (b,e) high-value zones of iron-rich magnesium minerals; (c,f) 1:200,000 lithium geochemical map and mineral information extraction results.
Minerals 15 00826 g012
Figure 13. Distribution map of remote sensing geological prospecting targets in the Wenshan area: (a) extraction results of iron-rich silicate minerals; (b) extraction results of iron-rich magnesium minerals; (c) interpretation results of linear structures; (d) detailed mineral extraction results from ZY1-02D.
Minerals 15 00826 g013
Figure 14. Geological map of TC4 at 1:10,000 scale and detailed mineral extraction results from ZY1-02D data.
Minerals 15 00826 g014
Figure 15. (a,d,g) High-value areas of Fe-rich iron silicate minerals; (b,e,h) High-value areas of iron–magnesium-rich minerals; (c,f,i) High-value areas of lithium anomalies and results of mineral information extraction.
Minerals 15 00826 g015
Table 1. Sentinel-2 data.
ItemSentinel-2
Launch datesentinel-2A 23 June 2015
sentinel-2B 7 March 2017
Nominal equatorial crossing time10:30 a.m.
altitudesun-synchronous orbit (786 km)
Ultra443 nm (60 m)
Swath/field of view290 km/20.6
Visible490 nm (10 m), 560 nm (10 m), 665 nm (10 m)
Red705 nm (20 m), 740 nm (20 m), 783 nm (20 m)
NIR842 nm (10 m), 865 nm (20 m)
SWIR1610 nm (20 m), 2190 nm (20 m)
Cirrus1375 nm (60 m)
Water vapor945 nm (60 m)
Table 2. Details of ASTER sensor and AHSI sensor.
ItemEmptyCellTerra(ASTER)ZY1-02D(AHSI)
Spectral rangeVL/NIR0.556 μm0.396 μm–1.04 μm
(b1–b76)
0.661 μm
0.807 μm
SWIR1.656 μm1.005 μm–2.501 μm
(b77–b166)
2.167 μm
2.209 μm
2.262 μm
2.336 μm
2.4 μm
TIR8.291 μmNull
8.634 μm
9.075 μm
10.657 μm
11.318 μm
Spatial resolutionVL/NIR10 m30 m
SWIR30 m
TIR90 m
Spectral resolutionVL/NIRNull10 nm
SWIR 20 nm
TIR Null
Table 3. Brief table of quantitative analysis of TC4, HSK, and BM elements.
Sample/StatisticAl, %Fe, %Li, μg/gMg, %Al2O3, %TFe2O3, %MgO, %
TC4 minimum0.010.027.300.010.040.050.02
TC4 maximum17.0016.052590.008.1365.1123.131.82
TC4 mean value8.914.20229.430.9734.368.290.43
HSK minimum0.080.060.200.010.040.310.02
HSK mean value19.4536.001050.001.0069.2154.630.51
HSK mean value11.5616.07326.850.3240.8823.860.26
BM minimum9.120.560.30
BM maximum1739.0062.9127.22
BM mean value775.0834.3311.47
Disclaimer/Publisher’s Note: The statements, opinions and data contained in all publications are solely those of the individual author(s) and contributor(s) and not of MDPI and/or the editor(s). MDPI and/or the editor(s) disclaim responsibility for any injury to people or property resulting from any ideas, methods, instructions or products referred to in the content.

