Article

Identification of Alteration Minerals and Lithium-Bearing Pegmatite Deposits Using Remote Sensing Satellite Data in Dahongliutan Area, Western Kunlun, NW China

1
School of Resource and Environmental Engineering, Inner Mongolia University of Technology, Hohhot 010051, China
2
Technology and Engineering Center for Space Utilization, Chinese Academy of Sciences, Beijing 100094, China
3
The Xinjiang Key Laboratory of Mineral Resources and Digital Geology, Xinjiang Institute of Ecology and Geography, Chinese Academy of Sciences, Urumqi 830011, China
*
Authors to whom correspondence should be addressed.
Minerals 2025, 15(7), 671; https://doi.org/10.3390/min15070671 (registering DOI)
Submission received: 21 May 2025 / Revised: 17 June 2025 / Accepted: 20 June 2025 / Published: 22 June 2025

Abstract

:
Remote sensing technology has significant technical advantages over traditional geological methods in geological mapping and mineral resource exploration, especially in high-altitude and steep topography areas. Geochemical sampling and geological mapping methods in these areas are difficult to use directly in mountainous regions such as West Kunlun. Therefore, in the face of Li-Be-Nb-Ta mineralization of the Dahongliutan rare-metal pegmatite deposit in West Kunlun, remote sensing has become an effective means to identify areas of interest for exploration in the early stage of the exploration campaigns. Several methods have been developed to detect pegmatites. Still, in this study, this methodology is based on spectral analysis to select bands of the ASTER and Landsat-8 OLI satellites, and methods, such as principal component analysis (PCA) and mixture tuned matched filtering (MTMF), to delineate the prospective areas of pegmatite. The results proved that PCA could map the hydrothermal alteration and structure information for pegmatites. To define new locations of interest for exploration, we introduced the spectra of spodumene-bearing pegmatites and tourmaline-bearing pegmatites as endmembers for the MTMF approach. The results indicate that the location of pegmatite areas on the ASTER and Landsat-8 OLI images overlaps with the ore deposits, and the location of potential ore-bearing pegmatites is delineated using remote sensing and geological sampling. Although this does not guarantee that all prospective areas have the mining value of ore-bearing pegmatites, it can provide basic data and technical references for early exploration of Li.

1. Introduction

As the “energy metal of the 21st century”, Li deposits are not only an important strategic mineral resource but also occupy an important position in economic development models relying on traditional fossil energy [1]. With the rapid development of the new energy economy, the demand for rare metals is increasing. Currently, hard-rock deposits are an important source of Li-ore resources, and identifying Li-ore resources to achieve breakthrough prospecting is an effective way to solve critical energy issues [2,3,4]. To date, the discovered Li deposits mainly include brine, hard-rock, and clay-hosted types. Pegmatite-type Li deposits in China are mainly distributed in Western Sichuan, Jiajika, Altay Xinjiang, Dahongliutan, and other areas. The metallogenic and enrichment mechanisms of rare earth elements of pegmatite deposits are related to parental magmatism, accompanied by strong alteration of the surrounding rocks, providing the basic conditions for the use of remote sensing technology to identify different geological bodies and extract mineralization signs.
With the rapid increase in demand for Li resources, it is difficult for traditional geological methods to meet the demand for efficient Li resource exploration, especially in areas with harsh environments, where traditional detection techniques are more challenging to implement. However, remote sensing technology can obtain a wide range of feature information, achieving efficient geological exploration through alteration mapping, lithological distinction, and mineral exploration [5]. Therefore, geological remote sensing has been widely studied and has developed rapidly. Previous efforts have mainly established remote sensing anomaly prospecting systems for hydrothermal gold deposits, porphyry copper deposits, and skarn deposits [6,7,8,9,10]. For pegmatite rare metal deposits, more research has focused on rock mineralogy. Many large Li mineral occurrences have been discovered in the Bayankala Fold Belt, including Daoban 505, 507, and 509 and South Fulugou 1# and 2# mineral occurrences [11,12]. The disadvantages of conventional geological methods in the high-altitude area of West Kunlun are obvious, such as high cost and time consumption. However, remote sensing techniques have rapidly become a powerful means of geological prospecting, relying mainly on the unique spectral characteristics of minerals to identify rock ore types. These tasks are achieved through the analysis of spectral signatures recorded in the visible-near infrared (VNIR) and shortwave (SWIR) regions of the electromagnetic spectrum, with the diagnostic spectral signature constituting the key mineral identification criterion. Therefore, it is of great significance to identify the mineral assemblage, alteration type, and rock mass.
Remote sensing has been applied in the exploration of rare earth elements of pegmatite deposits since the 1980s [13]. Satellite multispectral data have been widely applied to detect Li-deposits because they are easy to obtain and process, such as ASTER, Landsat-8, Landsat-5, and Sentinel-2, among others. Concerning pegmatite exploration, Perrotta et al. and Mendes et al. used a spectral angle mapper (SAM) and mixed tuned matched filtering (MTMF) to map Li-bearing pegmatites based on ASTER data [14,15]. Cardoso-Fernandes et al. used ASTER, Landsat-8, and Sentinel-2 data to identify Li-bearing pegmatites by using PCA, band ratio, and false-color synthesis [16,17,18,19]. Dai et al. conducted ore-bearing pegmatite mineral spectroscopy research and mapping based on Landsat-8 and GeoEye-1 images in the Mika area of Western Sichuan [20,21]. Yao et al. used weak lithology enhancement signal technology to process ASTER data and identified pegmatite veins [22]. These methods aimed to detect hydrothermally altered zones associated with mineralization and Li-bearing minerals directly. The results were often indecisive because the identification scale and accuracy are limited by the recognition of alteration assemblages associated with mineral deposits, the size of pegmatite outcrop, and the spatial resolution of remote sensing data. At the same time, regional geochemical and geological mapping with high cost and low efficiency makes it difficult to quickly delineate areas that might host economic concentrations of minerals in high-altitude and steep topography areas. The application of remote sensing technology is becoming increasingly widespread to distinguish the nature of geology and mineral exploration in remote regions. This includes the assessment of areas of interest based on the spectral analysis of multisource remote sensing data to quickly identify new areas of investigation and decrease the impact of early-stage exploration.
This contribution is based on the spectral analysis of spodumene-bearing pegmatites, tourmaline-bearing pegmatites, and alteration minerals, and the locations of potential ore-bearing pegmatites are delineated using combined remote sensing and geological information. This study included a PCA of Landsat-8 OLI and ASTER images and the extraction of Li-bearing pegmatite alteration information and ore-controlling structure information. Then, the spectra of spodumene-bearing pegmatites and tourmaline-bearing pegmatites were used as input in the MTMF to evaluate the pegmatite areas already known. At the end of this study, new areas were identified in the case study of Dahongliutan pegmatites, which provided an effective reference for the remote sensing investigation of pegmatites in the West Kunlun region.

2. Materials and Methods
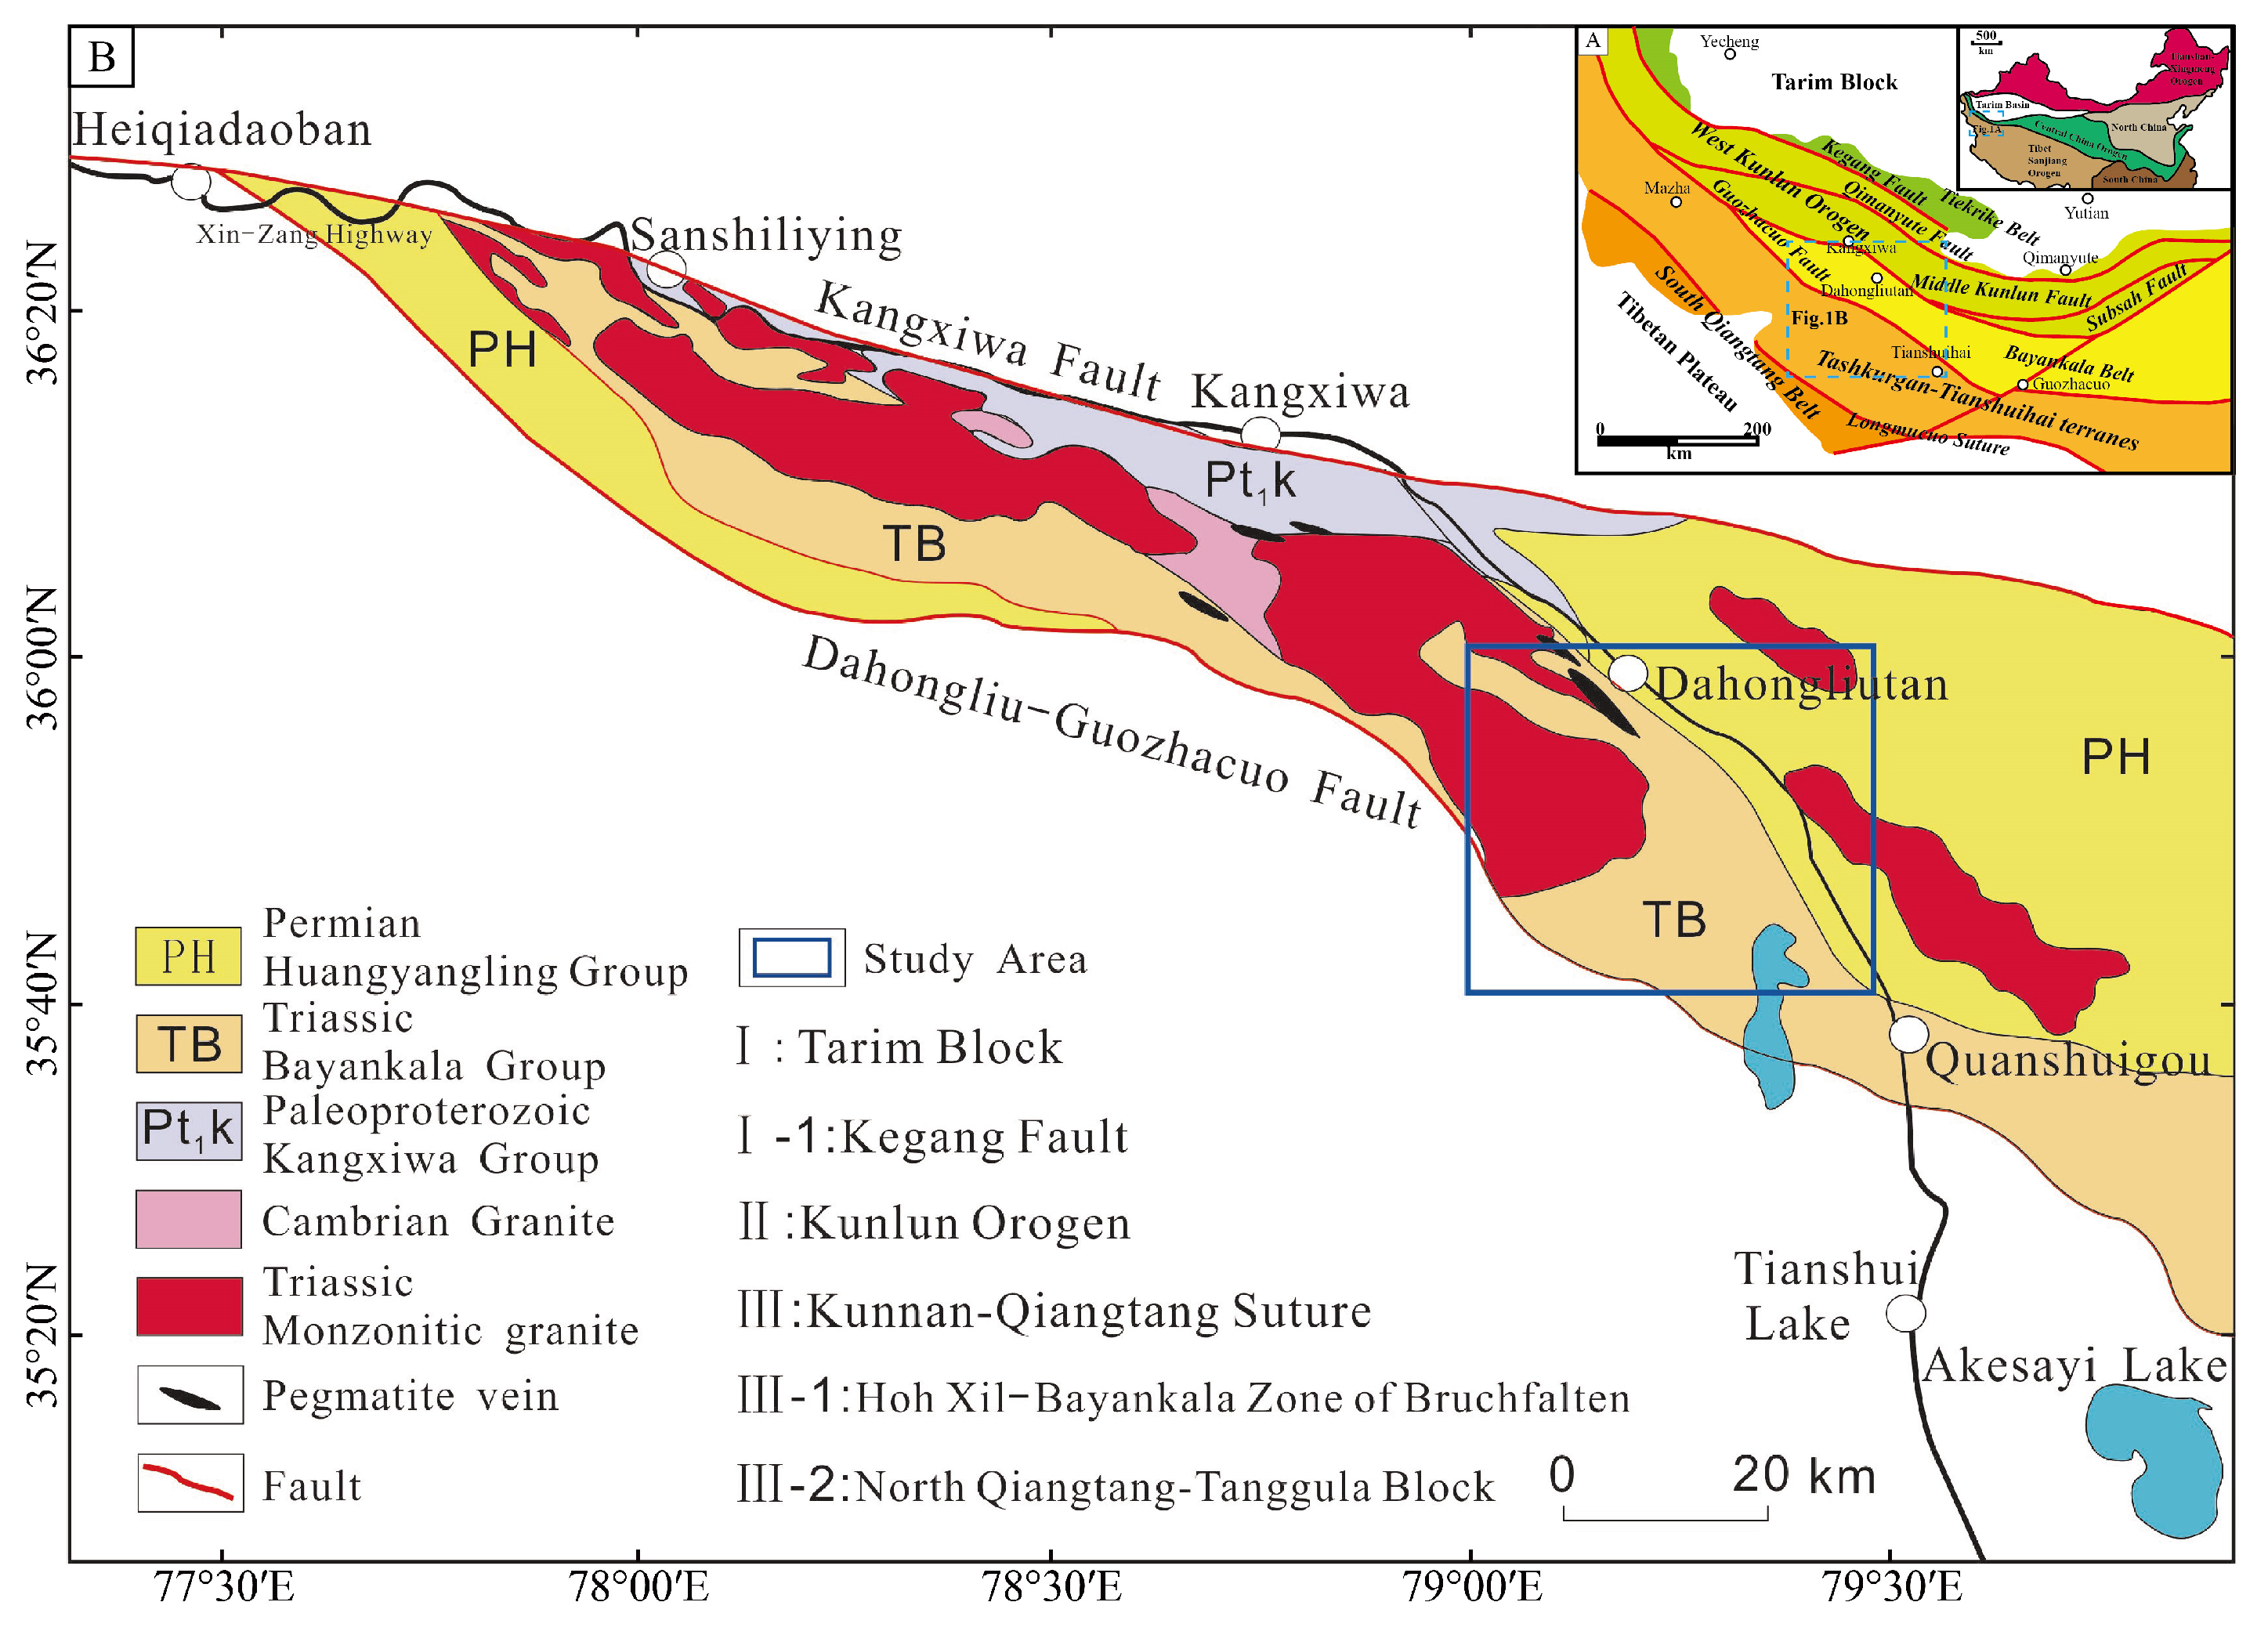
2.1. Study Area

The study area is on the northwestern margin of the Tibetan Plateau and the westernmost segment of the Northwest Orogenic Belt, tectonically located in the Bayankala Fold Belt, which is in a northwest–southeast wedge-shaped body sandwiched by the Mazha–Kangxiwa suture zone and the Dahongliutan–Guozhacuo fault (Figure 1) [23,24,25]. The Mesozoic Triassic Bayan Harshan Group (TB) and the Late Paleozoic Permian Huangyangling Group (PH) are mainly exposed in the area. Among them, the Permian Huangyangling Group (PH) is mainly composed of a series of fine clastic rocks such as feldspar lithic sandstone, quartz sandstone, and sandstone, containing a small amount of basic volcanic rocks and carbonate rocks. The Bayankala Group (TB) of the Triassic is mainly composed of gray-green sandstone and two-mica quartz schist [26,27,28]. The structural development in the study area is mainly dominated by the NW-trending Kangxiwa fault and Dahongliutan–Guozhacuo fault. The rock mass presents a NW-SE distribution, which is consistent with the distribution of major faults. The lithology is mainly adamellite, classified as S-type high-specificity granites, which provides important physical and heat sources for the enrichment of rare metal mineralization. Granitic pegmatite is mainly exposed around Dahongliutan granite and Bayankala formation, which trend southeast and crop out as irregular lenticular or banded bodies [23].

2.2. Acquisition and Preprocessing of Remote Sensing Data

2.2.1. Landsat-8 OLI and ASTER Data

The Landsat-8 satellite is part of the Landsat Data Continuity Mission, which was launched on 11 February 2013. Landsat-8 has two sensors, including the Operational Land Imager (OLI) and the Thermal Infrared Sensor (TIRS), which cover a wide spectral region with 11 bands from visible to thermal infrared, with a spectral and radiometric resolution, as shown in Table 1. Nine visible-near infrared and shortwave infrared bands from 430 to 2290 nm, and two thermal infrared bands from 10,600 to 12,510 nm offer spatial resolutions of 30 m and 100 m, respectively. The swath width of one Landsat-8 OLI scene is 185 km (each scene covers an area of 185 × 185 km2). The Advance Spaceborne Thermal Emission and Reflectance Radiometer (ASTER) sensor was launched on 18 December 1999, onboard the first NASA Earth Observation System (EOS) series of satellites, Terra. ASTER contains three visible near-infrared bands (from 520 to 860 nm) with a 15 m spatial resolution, six shortwave-infrared bands (from 1600 to 2430 nm) with a 30 m spatial resolution, and five thermal-infrared bands (from 8130 to 11,650 nm) with a 90 m spatial resolution. Each ASTER scene acquires 60 km swaths and is segmented into 60 × 60 km2 scenes (Table 1).
Landsat-8 OLI and ASTER images were preprocessed via radiometric calibration and atmospheric corrections to convert the DN value into surface reflectance, eliminating the influence of the sensor itself, atmosphere, and ambient light. Radiometric corrections were used to correct sensor-related anomalies, and the Fast Line-of-sight Atmospheric Analysis of Spectral Hypercubes (FLAASH) was applied for atmospheric correction [29].

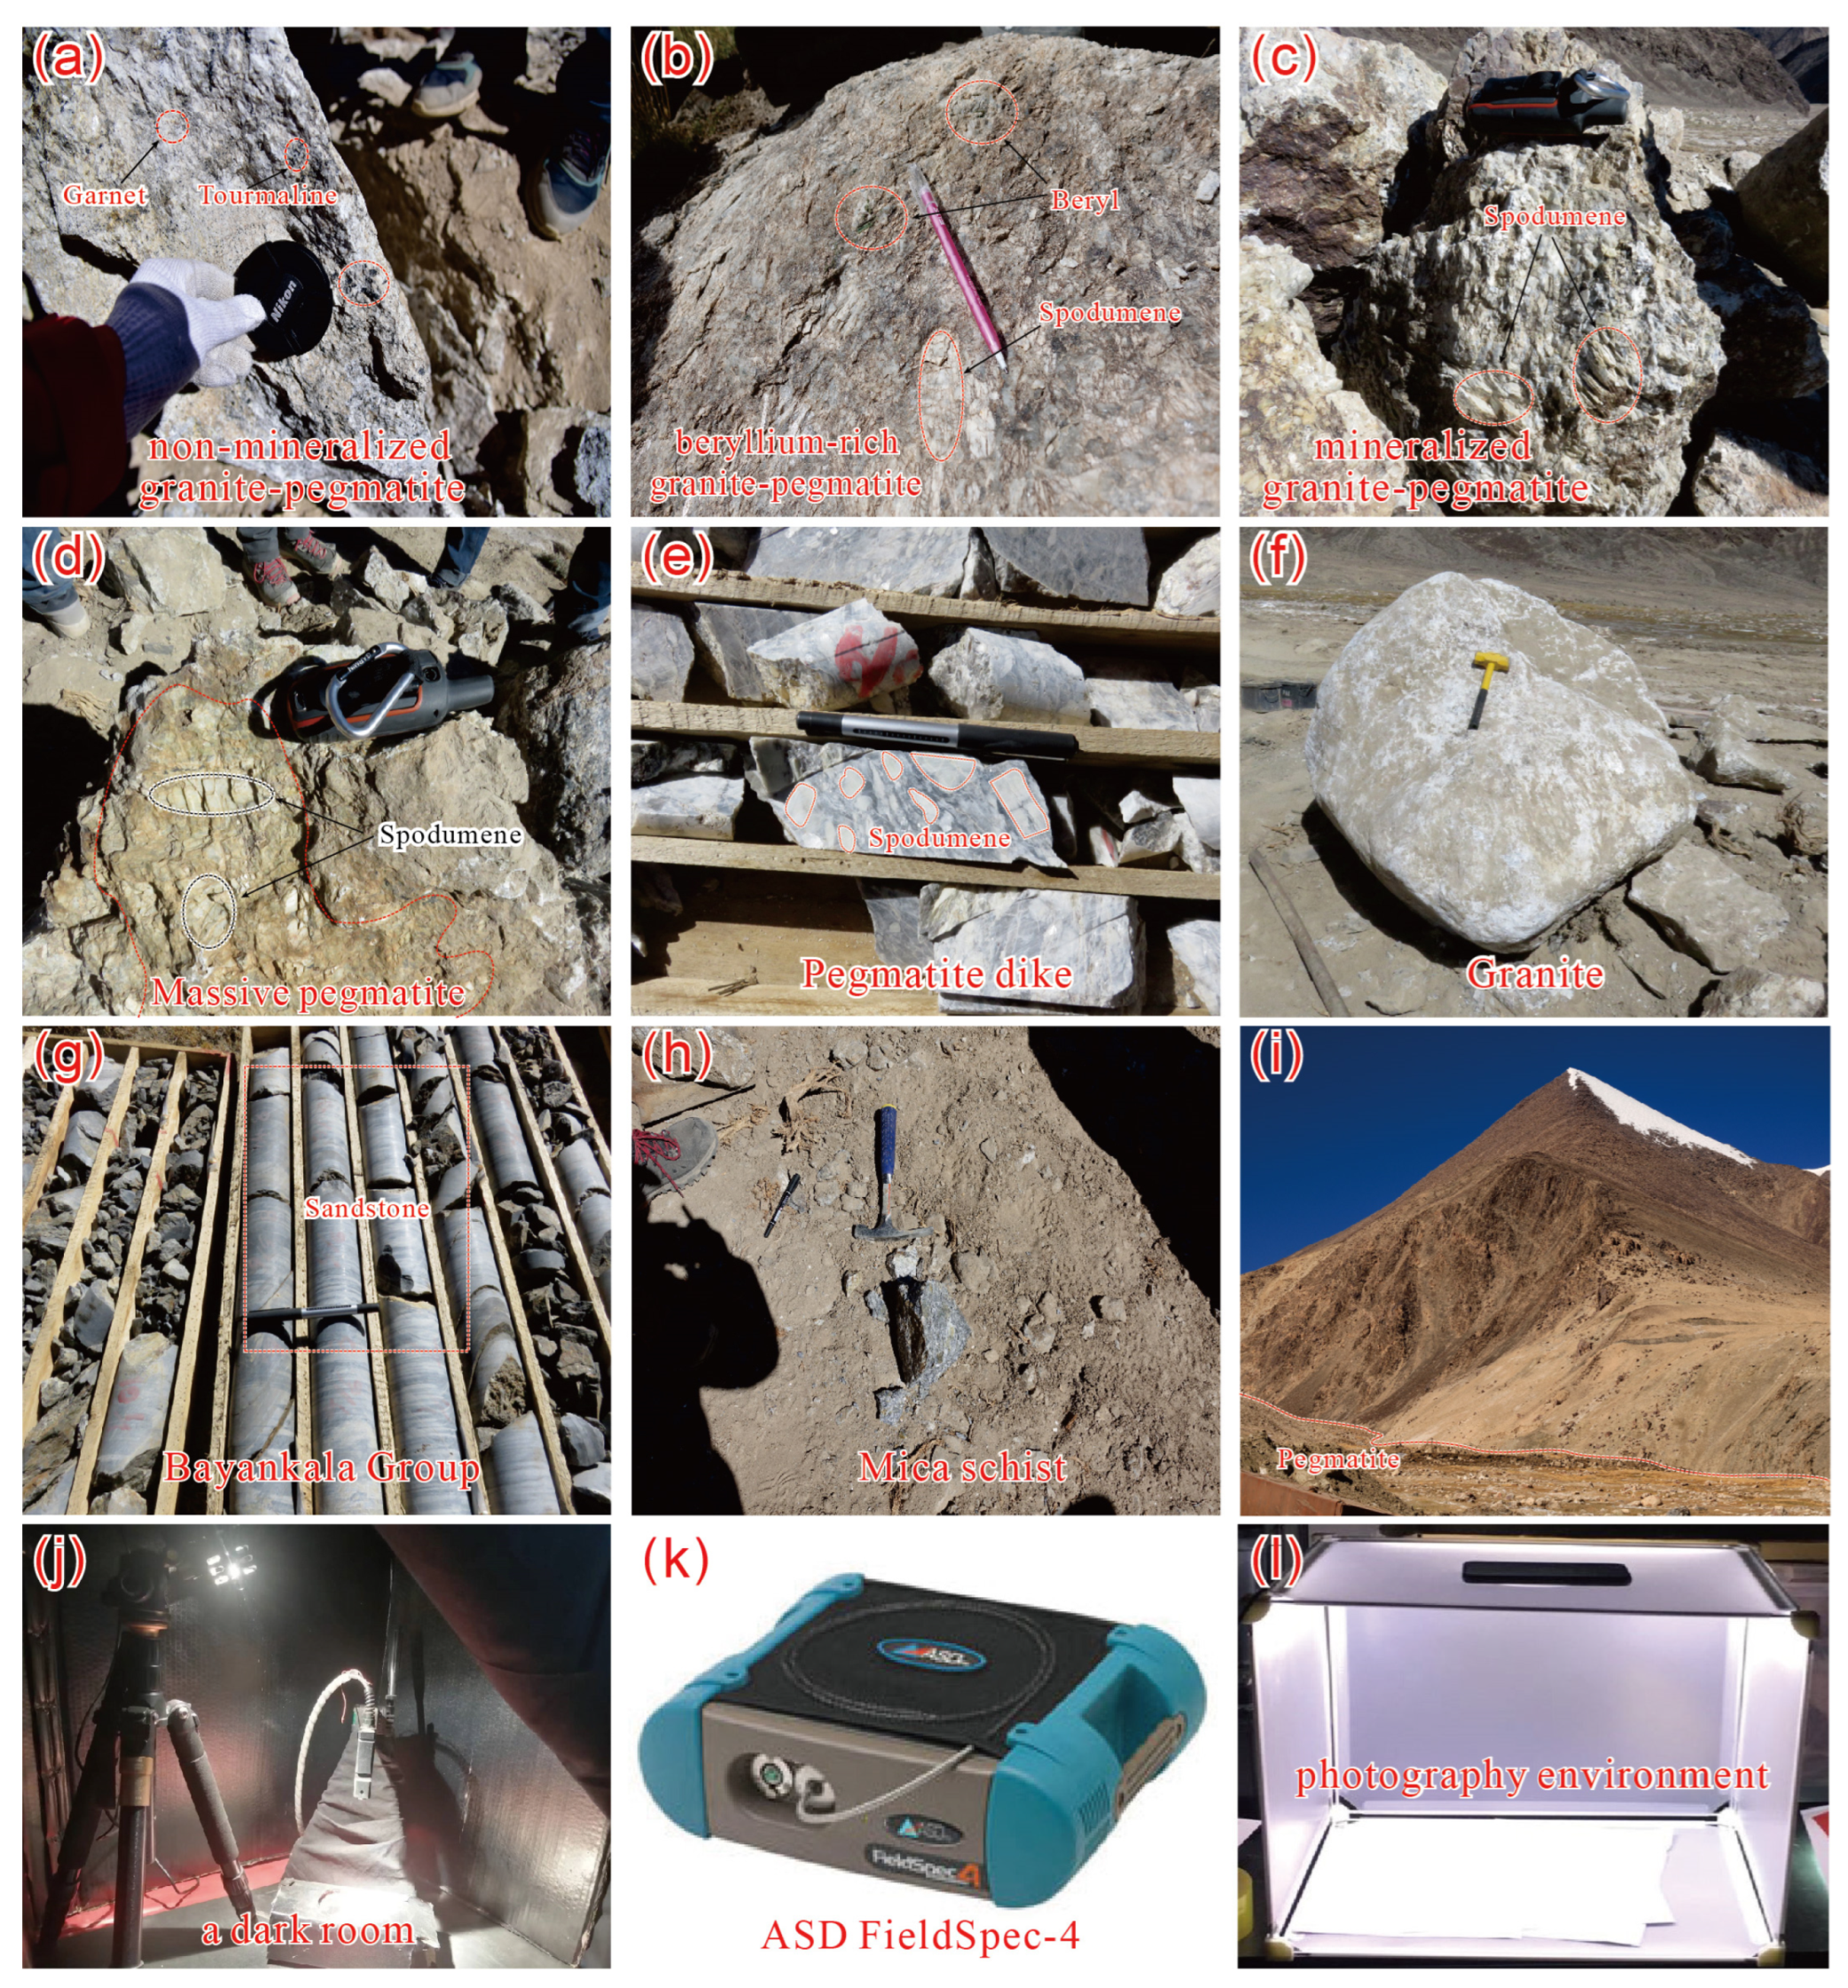
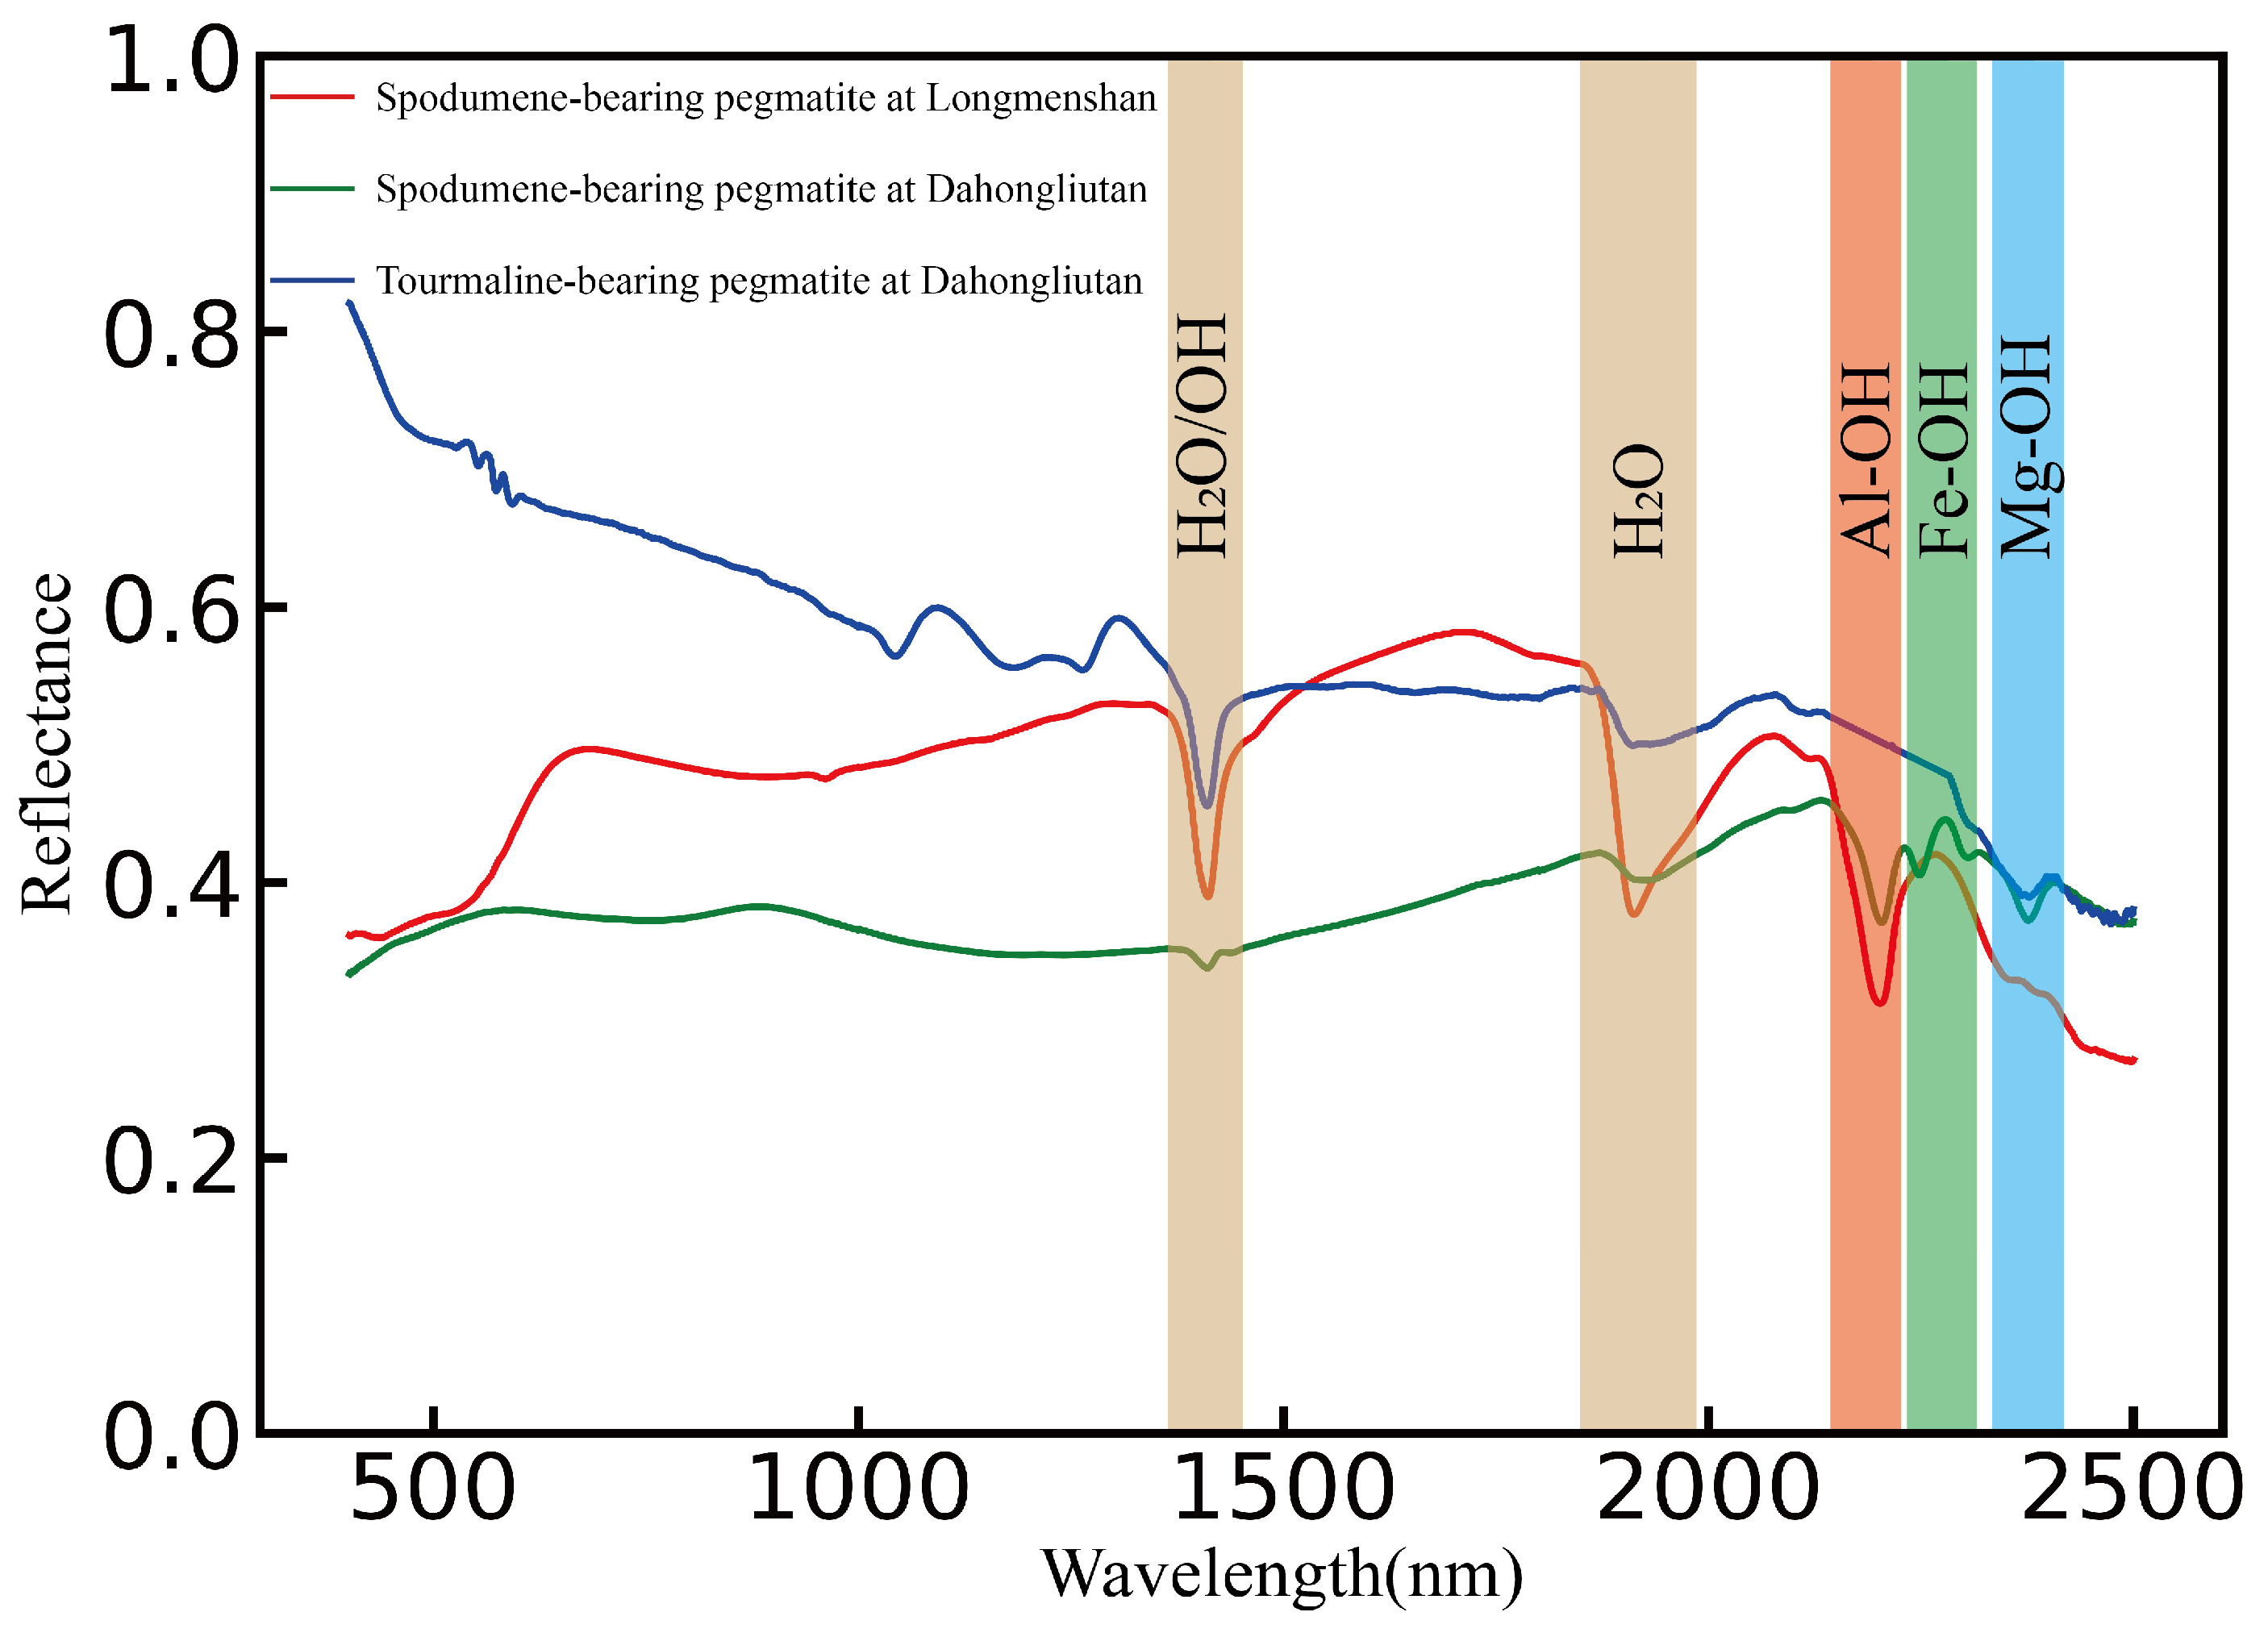
2.2.2. Spectroradiometric Measurements

The Li deposits and occurrences in the Dahongliutan area are found in pegmatite dykes and veins along the margin of the Triassic Dahongliutan Granite. Approximately 30 samples, including Figure 2a nonmineralized microplagioclase granite–pegmatite containing garnet and tourmaline, Figure 2b Be-rich beryl-muscovite granite–pegmatite, and Figure 2c–e spodumene–albitite granite–pegmatite, Figure 2f granite, Figure 2h mica schist, Figure 2g sandstone, and other exposed strata, were collected in the field Figure 2i. We measured the spectral signature of samples in the laboratory using the Analytical Spectral Devices (ASD) FieldSpec-4 spectroradiometer Figure 2k. ASD is designed to record the signal throughout the spectral region covering 350 nm to 1020 nm at a spectral resolution of 3 nm and 1020 nm to 2500 nm at a spectral resolution of 10 nm. Data quality is affected by factors such as the environment and instrument stability during measurement. To ensure the accuracy and validity of the data, all spectral measurements were performed in a dark-room environment Figure 2j. The sample was placed in the center of the light spot of the quartz–tungsten–halogen lamp to ensure that the signal received by the probe comes from the sample. During the measurement process, the probe is perpendicular to the surface, and a flat surface is chosen as the measurement surface. The distance between the probe and the sample was adjusted based on the size of the sample to ensure that the diameter of the field of view was approximately 2 cm. Ten spectra were collected for each spot, and the spectra of the white reference panel were obtained with a sampling interval of ten samples. All samples were photographed in a homemade camera fixture Figure 2l for reference prior to analyses.
The data collected in the laboratory using the spectrometer were received and stored using ASD ViewSpec Pro™ software (version 6.20), while an average of these ten spectra was calculated to acquire the final spectra and improve the signal-to-noise ratio. To evaluate the minimum absorption and reflectance peaks of all spectra, we used the spectral preprocessing technique of continuum removal [30,31,32] via the pysptools library, and visual analysis of spectral data was implemented in Python 3.8.

2.3. Spectral Analysis and Mineral Mapping

To ensure the accuracy of the data processing results, this study uses methods such as band ratio and threshold selection to remove interference factors. Meanwhile, the spectral characteristics of the study area in terms of mapping pegmatite mineralization were presented using image enhancement methods such as color composite and PCA.

2.3.1. Principal Component Analysis (PCA)

PCA [33,34,35,36,37], principal component analysis, is a multidimensional orthogonal linear transformation method based on multivariate statistics, and it is a common method used for the extraction of remote sensing alteration information. Feature principal component analysis is a method of PCA based on the target’s spectral characteristics and the wavelength band corresponding to the selected spectral diagnostic characteristics. The contribution coefficient of each principal component of the feature vector matrix is used to extract the target feature information. The principal component analysis method can concentrate as much useful information as possible in a few principal components to achieve data compression and dimensionality reduction [38,39,40]. Therefore, the PCA technique is applied to map alteration information from multispectral remote sensing data to highlight spectral signatures related to hydrothermal alteration minerals. Due to the low spectral resolution of ASTER and Landsat-8 OLI, the bands were selected based on the spectrum of characteristic minerals. Four characteristic bands were selected from subsets of Landsat-8 OLI and ASTER VNIR+SWIR bands to distinguish the main hydrothermal alteration minerals. The Al-OH minerals show strong absorption features between 2.185 µm and 2.215 µm, and the absorption valley position is approximately 2.2 µm, corresponding to bands 5 and 6 of ASTER and band 7 of Landsat-8 OLI, whereas the Fe/Mg-OH mineral spectra show strong absorption features between 2.331 µm and 2.358 µm, and the absorption position is approximately 2.35 µm, corresponding to bands 7 and 8 of ASTER. Al-OH minerals such as kaolinite and muscovite show strong reflectance at 0.48 µm and 1.6 µm, equivalent to bands 2 and 6 of Landsat-8 OLI, whereas the reflectance of Fe/Mg-OH minerals at 0.52–0.60 µm and 1.6–1.7 µm is in the rising stage, corresponding to bands 1 and 4 of ASTER. Muscovite shows weak absorption features in band 5 of Landsat-8 OLI and band 3 of ASTER (0.86 µm). The corresponding relationship between the spectral characteristics of hydroxyl minerals and the bands of Landsat-8 OLI and ASTER images is shown in Figure 3.
Iron-staining minerals are minerals containing Fe2+ and Fe3+ ions, including hematite, limonite, jarosite, and goethite, which is a typical manifestation of near ore surrounding rock alteration and has important guiding significance for revealing mineralization information. Because Fe2+ and Fe3+ electron transitions need to absorb energy, Fe2+-rich minerals have absorption characteristics between 1.0 µm and 1.1 µm, as well as other absorptions near ~0.43 µm, ~0.51 µm, and 0.55 µm. Fe3+-rich minerals have absorptions near ~0.85 µm and ~0.94 µm [41,42]. Iron oxide/hydroxide minerals such as hematite, limonite, jarosite, and goethite have low reflectance in the visible region and higher reflectance in the near-infrared region, with a declining region near 0.8 µm, corresponding to bands 2, 4, 5, and 6 of Landsat-8 OLI data and bands 1, 2, 3, and 4 of ASTER data. The spectral characteristics of iron oxide/hydroxide minerals in Landsat-8 OLI and ASTER are shown in Figure 4. After applying PCA, we considered the size and sign symbol of the eigenvectors matrix to identify which of the principal components contains relevant information related to Al-OH and Fe/Mg-OH alteration minerals and iron-staining minerals.

2.3.2. Mixed Tuned Matched Filtering (MTMF)

MTMF is combined linear spectral mixture model and matched filtering technology with a mapping method that includes minimum noise fraction (MNF) transformation, matched filter (MF) abundance estimation, and mixture tuning (MT), which rejects false positive [43,44,45,46,47,48], uses the spectral response of the filter to enhance components, and inhibits the spectral response of background pixels; the linear decomposition of mixed pixels decomposes each end element in a pixel, thus reducing the detection limit of the mineral. In this study, an automated spectral hourglass (ASH) was applied to extract endmember minerals. Pegmatite exhibits distinct zoning characteristics, primarily comprising tourmaline-bearing pegmatite (mineral composition of spodumene, quartz, and mica) and spodumene-bearing pegmatite (mineral composition of microcline, albite, quartz, and tourmaline). The spectral data of spodumene-bearing pegmatite at Dahongliutan, spodumene-bearing pegmatite at Longmenshan, and tourmaline-bearing pegmatite at Dahongliutan from the laboratory were resampled to response functions of VNIR+SWIR bands of Landsat-8 OLI and ASTER to determine the mineral endmember reference spectrum. The overall spectral reflectance of tourmaline-bearing pegmatite decreased. The spectral reflectance of spodumene-bearing pegmatite shows little change, and there are peaks and valleys in VNIR and SWIR (Figure 5A). Spodumene-bearing pegmatites both have absorption at 2.2 μm, while the spectrum of tourmaline-bearing pegmatites has no absorption characteristics near 2.2 μm (Figure 5B).

3. Results

3.1. Alteration and Structure Mapping Using Landsat-8 OLI and ASTER

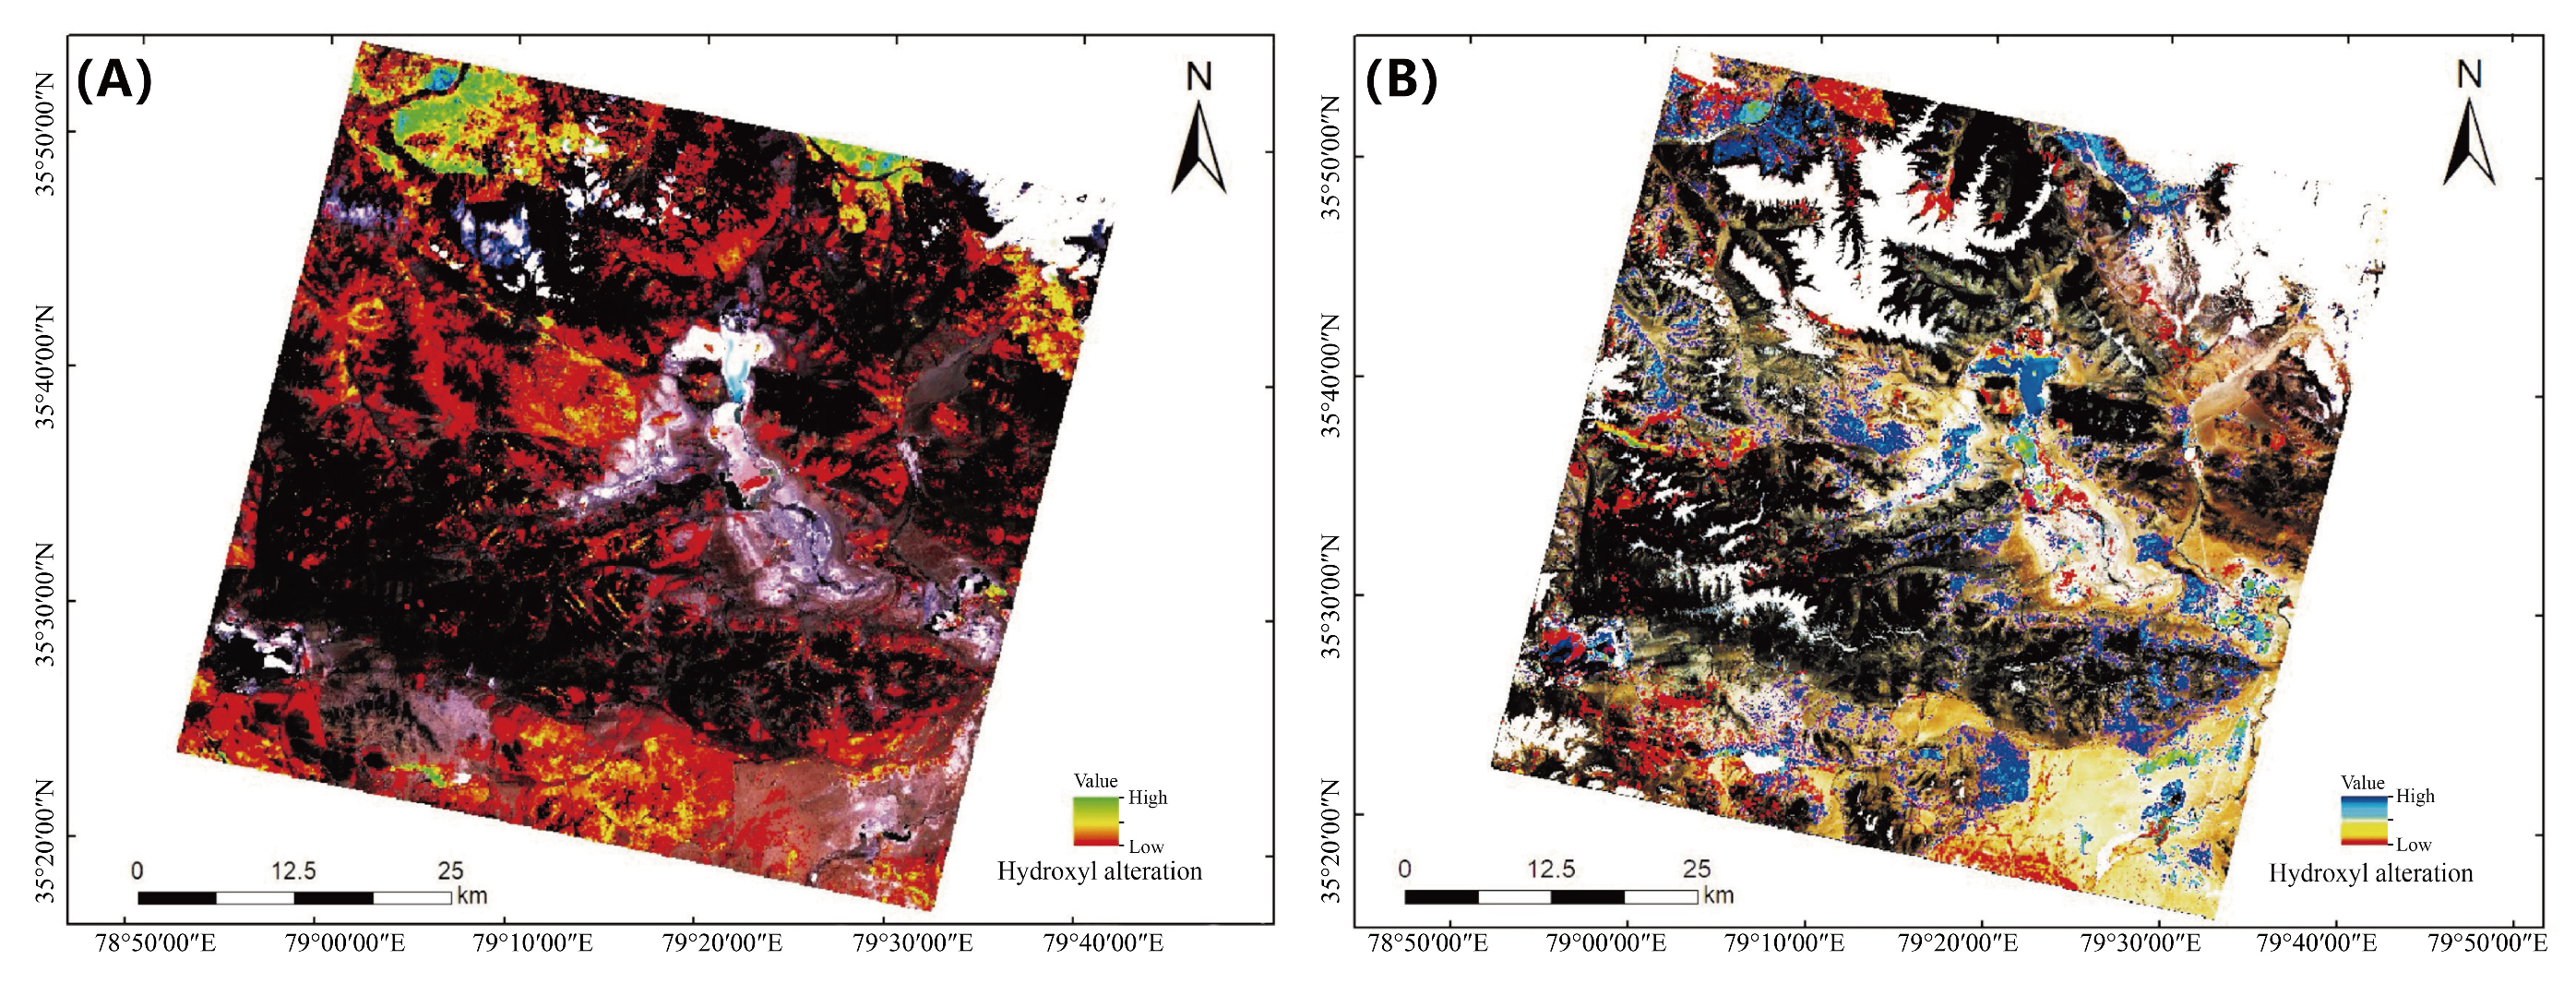
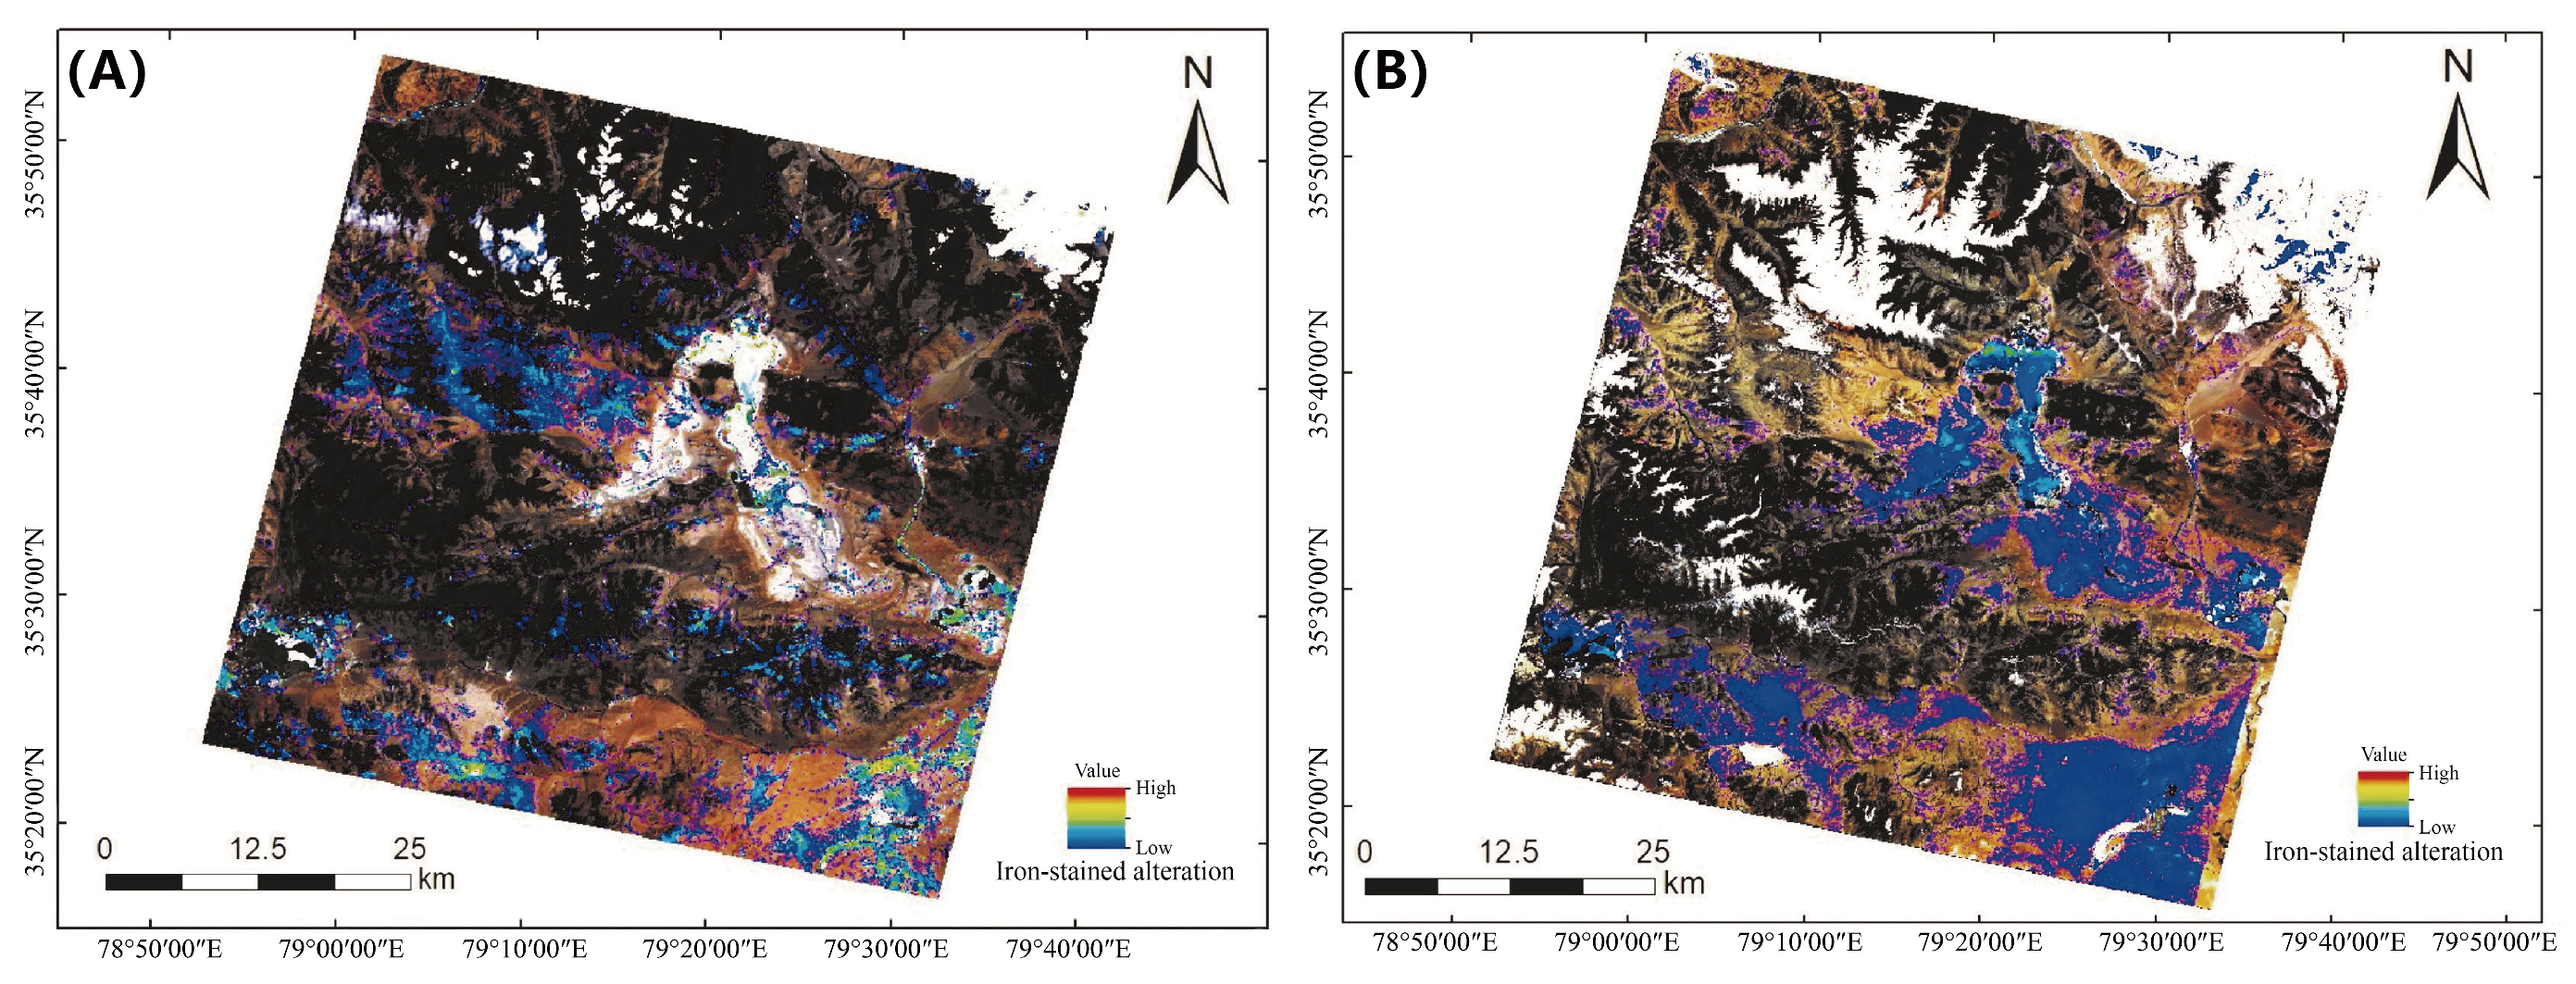
3.1.1. Alteration Mapping

Analyzing eigenvector loadings derived from the PCA technique for Landsat-8 OLI-selected bands (bands 2, 5, 6, and 7) shows that PC4 contains key information related to OH- alteration (Table 2). The eigenvector matrix obtained from the Landsat-8 OLI image is shown in Table 2. Given the magnitude and the sign of the eigenvector loadings, it is apparent that PC 4 has the highest positive eigenvector loadings for band 7 (0.63) and the highest negative eigenvector loadings for band 6 (−0.66). Meanwhile, PC 4 has eigenvector loadings in band 5 (0.29) and band 6 (−0.66) with opposite signs (Table 2). Thus, OH-alteration minerals are represented as dark pixels in the PC4 image due to the positive contribution of bands 5 and 7 (absorption bands). The dark pixels were inverted to bright pixels by negation (multiplication by −1). Figure 6A shows a pseudocolor ramp of the PC4 image for the study area.
In addition, analyzing eigenvector loadings derived from PCA techniques for ASTER selected bands (bands 1, 3, 4, and 6 and bands 1, 3, 4, and 8) shows that PC 4 is the key information related to Al-OH and Fe/Mg-OH alterations, respectively (Table 3 and Table 4). Considering eigenvector loading for mapping Al-OH and Fe/Mg-OH alteration minerals, PC4 contains strong positive loading in band 6 (0.97) and band 8 (0.99) and negative loading in band 4 (Table 3 and Table 4). Hydroxyl-bearing alteration exhibits spectral absorption features at 2100–2500 nm (equal to band 6 (2185–2225 nm) and band 8 (2295–2365 nm) of ASTER) due to over-tones and combinations of the fundamental vibrations, whereas their spectral reflectance typically occurs at 1550–1750 nm (equal to band 4 (1600–1700 nm) in ASTER). Thus, Al-OH/Fe-Mg-OH-bearing minerals manifest as dark pixels in the PC4 image because of the positive contribution of bands 6 and 8 (absorption band). The dark pixels were inverted to bright pixels via negation (multiplication by −1). Figure 6B shows a pseudocolor ramp of the study area.
This study used bands 2, band 4, band 5, and band 6 in Landsat-8 OLI to perform PCA to identify minerals containing Fe2+ and Fe3+, because band 4 represents the spectral region where iron oxide/hydroxides manifest strong reflection, while bands 2 and 5 represent strong absorption. In the results shown in Table 5, it can be observed that iron-staining minerals will best be mapped in PC3 because of the large positive eigenvector loadings at PC3 band 5 (0.78) and negative loadings at PC3 bands 4 (−0.41) and 6 (−0.27) which appears as same signs (Table 5). Thus, iron oxide/hydroxides manifest as dark pixels in the PC3 image due to the positive contribution of band 5 (absorption band). The dark pixels were inverted to bright pixels by negation (multiplication by −1). Figure 7A shows a pseudocolor ramp of the PC3 image of the study area. Table 6 shows the eigenvector matrix for ASTER bands 1, 2, 3, and 4. Analyzing the eigenvector loadings for mapping iron oxide/hydroxides indicated that PC3 has spectral information related to the target minerals due to strong loadings in band 4 (0.73) and band 3 (−0.31) with opposite signs (Table 6). Iron oxide/hydroxides minerals are characterized by a high absorption feature about 400–1100 nm (equal to band 3 (780–860 nm) of ASTER) and high reflectance around 1600 nm (equal to band 4 (1600–1700 nm) of ASTER). Thus, iron oxide/hydroxides manifest as bright in the PC3 image because of the positive contribution of band 4 (reflectance band). Figure 7B shows a pseudocolor ramp of the PC3 image for the study area.

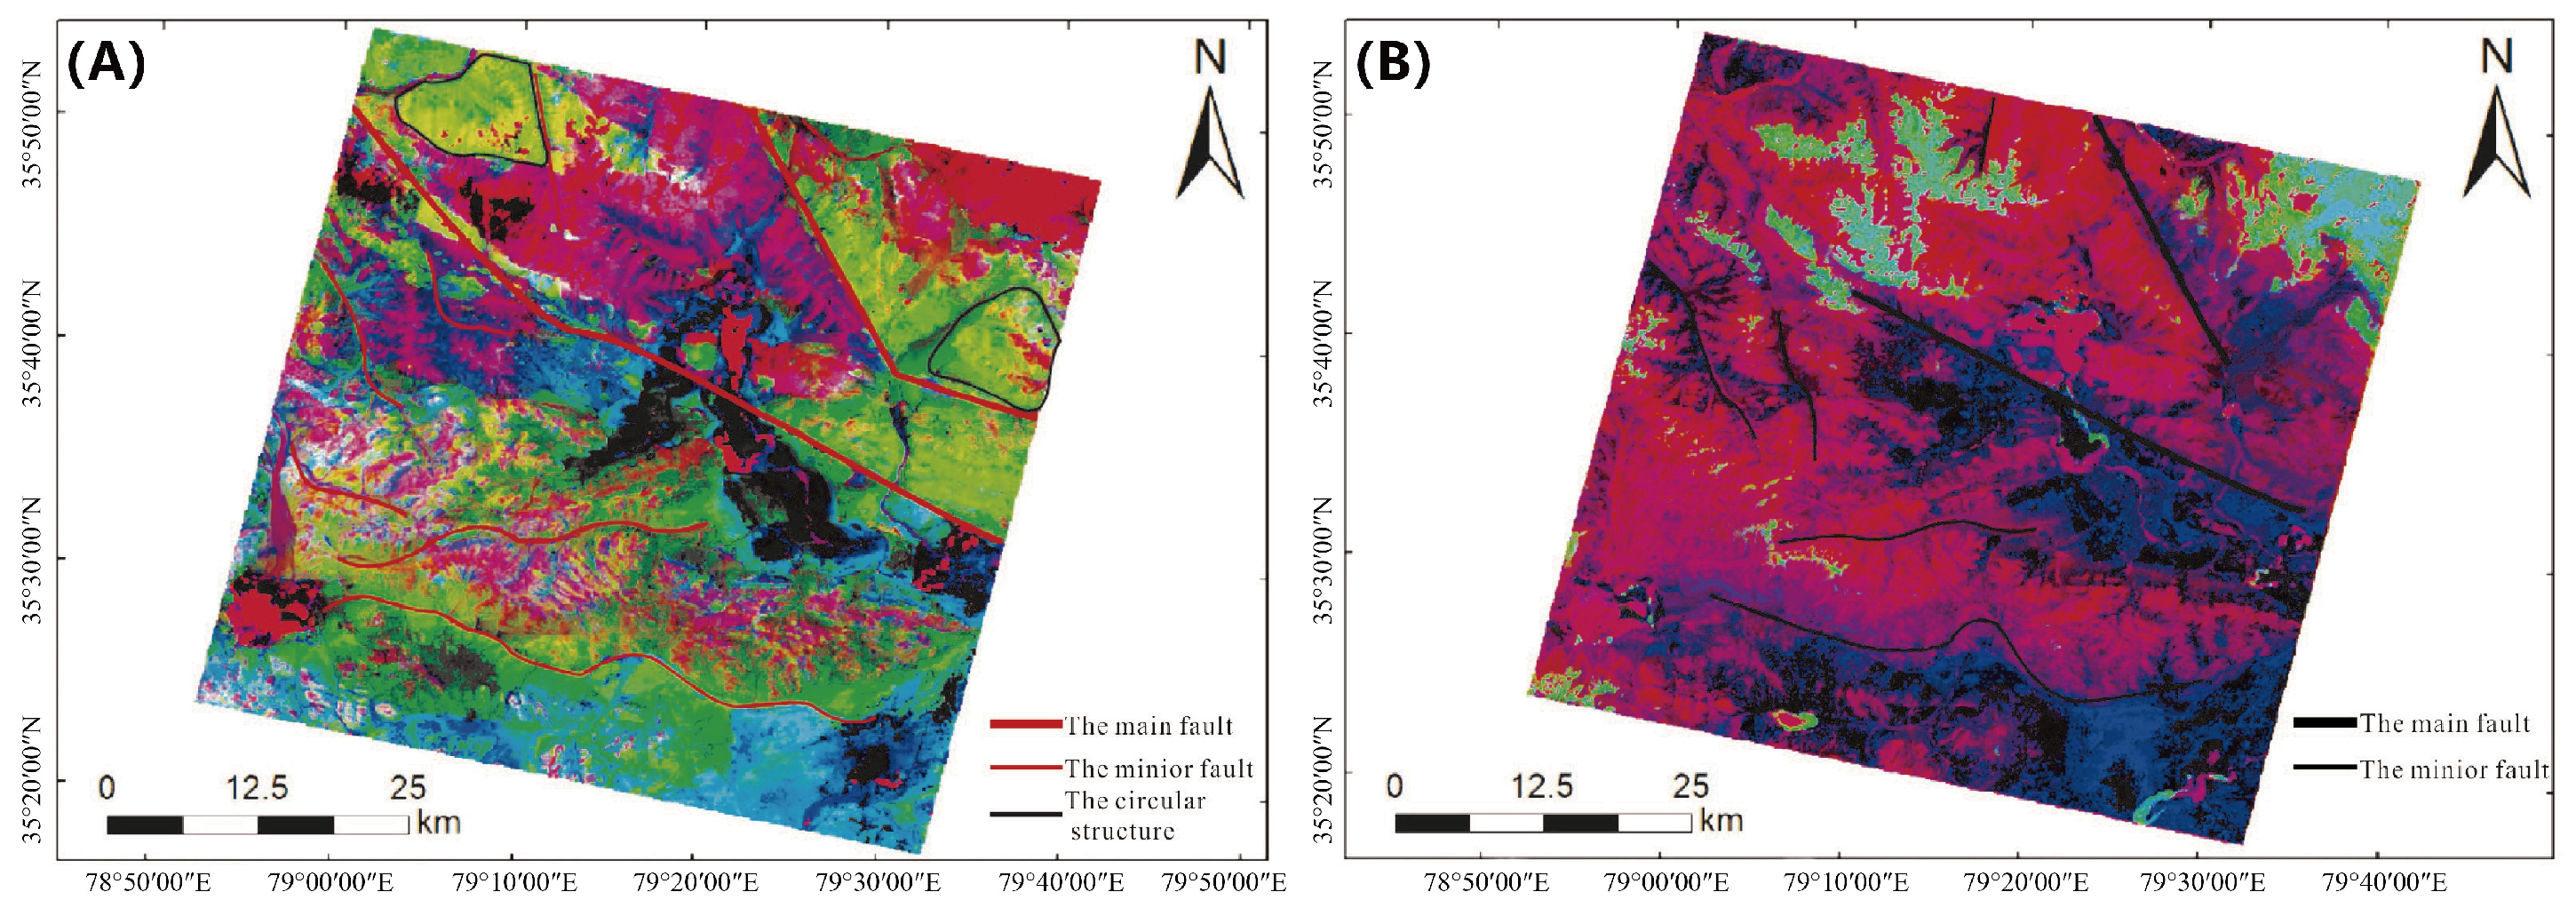
3.1.2. Structural Interpretation

After PCA, the main information is concentrated in the first few principal components. Therefore, the first component contains information about the maximum variance. In this study, the linear structure information was extracted using the principal component synthesis method. After undergoing PCA, the main information is concentrated in the first three bands for Landsat-8 OLI images and the first four bands for ASTER images. Therefore, the RGB combination for Landsat-8 OLI used PC1, PC2, and PC3, and for ASTER, it used PC4, PC2, and PC1 (Figure 8). Figure 8A is the false-color composite map of Landsat-8 OLI. There are apparent differences in the images of geological bodies and linear structures with different lithologies. The northern part of the study area is the Qitai fault, with different colors on both sides of the fault. The northern part of the fault is mainly green, and the southern part is mainly pink. The overall appearance is extended in the NW direction. The Dahongliutan–Guozhacuo fault in the south is highlighted in the image due to the different strata on both sides, and the south is mainly pinkish green. In addition, Figure 8A shows that the granite body is lenticular and vein-like. Different colors indicate different strata. Pink-green indicates the Tianshuihai rock group of the Great Wall system, and rose color is the Bayankala of the Triassic system. The mountain group and the yellow-green color show the Permian Huangyangling Group. Figure 8B is the primary component color composite image of ASTER. The image is mainly red-blue, the linear structure is prominent, and the fault structure is marked by a red-to-blue transition area.

3.2. Lithological Mapping Using Landsat-8 OLI and ASTER

As shown in Figure 9, the spectra of spodumene-bearing pegmatite at Longmenshan and spodumene-bearing pegmatite at Dahongliutan have high similarity in terms of the overall waveform and characteristic absorption band. Comparing their spectral characteristics, a strong first-order absorption signature of 2200 nm and a second-order absorption signature of 2350 nm are presented, which are related to the hydroxyl groups. The tourmaline-bearing pegmatite at Dahongliutan has a strong first-order absorption signature of 2350 nm without an obvious second-order absorption signature. Second, due to the broad spectral bands of Landsat-8 OLI and ASTER, the extraction effect of Li-mineralized pegmatite and non-Li mineralized pegmatite by PCA is poor. According to spectral characteristics, the absorption characteristics of spodumene-bearing pegmatites and tourmaline-bearing pegmatites could correspond to each band of remote sensing imaging in Landsat-8 OLI and ASTER images. Spodumene-bearing pegmatites display a reflection feature in band 4 of the Landsat-8 OLI data, which are characterized by a strong first-order absorption in the ASTER band. In the Landsat-8 OLI bands, tourmaline-bearing pegmatites are characterized by strong absorption in Landsat-8 OLI band 7 and ASTER band 8. Using these criteria, the MTMF was used to process Landsat-8 OLI and ASTER images to identify the ore-bearing pegmatite veins.
The light-colored minerals in the ore-bearing pegmatite are mainly quartz, feldspar, muscovite, and spodumene (off-white), accompanied by possible cookeite alteration and Li-bearing clay minerals. In the 400–2500 nm spectral range, hydroxyl-containing minerals and spodumene-bearing pegmatites have significant absorption characteristics at approximately 1400 nm, 1900 nm, 2200 nm, and 2350 nm. This study extracts mineral information by decomposing the mixed pixels of Landsat-8 OLI and ASTER multispectral data. The key to the decomposition of mixed pixels is the selection of end-member spectra. Spodumene-bearing pegmatites and tourmaline-bearing pegmatites in the measured spectrum are selected as the reference spectra according to the samples of sampling points, and the number of reference spectra is less than the number of bands, which meets the requirements of solving the linear equations and avoids the error of mixed decomposition caused by too many end-members. The results are shown in Figure 10.

4. Discussion

4.1. Alteration and Mineralization

The samples used in this paper were collected from the Longmenshan and Dahongliutan Li-Be mining areas. The ore-bearing granite pegmatite minerals are mainly spodumene, feldspar, and quartz. The nonmineralized granite pegmatite contains a large amount of tourmaline, which is distributed in granite or sandstone as veins [48,49]. Figure 6, Figure 7, and Figure 16 show that the ore points are distributed in the abnormally high-value area of hydroxyl alteration and iron staining alteration. Compared with Figure 6A,B, the hydroxyl altered area extracted by Landsat-8 OLI is much larger than that based on ASTER extraction. This may be because the absorption bands of hydroxyl alteration are approximately 2.2 μm and 2.3 μm. Although both Landsat-8 OLI Band 7 and ASTER Bands 5–9 operate in the SWIR (Short-Wave Infrared) region, Landsat-8 OLI has fewer bands with broader spectral ranges compared to ASTER. Due to this wider bandwidth, Landsat-8 OLI can detect ground objects with absorption features across a broader s50pectral range, resulting in a larger extraction scope [50,51,52,53,54,55]. In terms of iron-staining alteration extraction, Landsat-8 OLI has a smaller area and a higher accuracy than ASTER images (Figure 7). This may be because the characteristic absorption band of iron-staining alteration is in the VNIR band [56,57,58]. Compared with ASTER, Landsat-8 OLI has more and narrower bands in the VNIR. The image recognition results were verified by field sampling and spectral measurements, as shown in Figure 11 and Figure 12.
In this study, an ASD spectrometer was used in the laboratory to measure the spectra of the samples collected in the field, which verified the accuracy of the extraction results. Meanwhile, comprehensive geological fieldworks were carried out in the study area, especially in the detected prospects and mineralologically interesting zones. Figure 11A shows the spectral curve of the hand samples of pegmatite. Compared with the cookeite in the USGS standard spectral library (Figure 11B), pegmatite in the spectrum measured using ASD has 2214 nm Al-OH and 2369 nm Fe/Mg-OH absorption characteristics (Figure 11A). Meanwhile, the absorption characteristics at 1593 nm and 1838 nm show that the pegmatite surface contains cookeite alteration [59,60,61]. This may be because cookeite and Li-bearing clays are water-containing silicate minerals, and the characteristic absorption peak position and corresponding peak depth are related to the mineral itself and the external environment (temperature, pH, salinity, minerals that coexist with cookeite, etc.).
The main minerals coexisting with cookeite and Li-bearing clay minerals are feldspar, quartz, and mica (Figure 11C). Cookeite and Li-bearing clay minerals are mainly distributed in the periphery of granite and ore-bearing pegmatite, with a weak alteration. In particular, the study area contains a significant concentration of cookeite alteration and Li-bearing clay minerals (Figure 11D,E). The iron-staining alteration is mainly distributed in the periphery of the mining area, and the alteration is dispersed. Minerals containing Fe2+, Fe3+, and Fe-OH, which include iron-oxides, clays, or heterophyllosilicates, can be mapped using the diagnostic spectral features in the VNIR and SWIR bands [61]. Figure 12 shows a hand specimen of goethite (Figure 12C) and its spectral curve. Based on diagnostic spectral features in the VNIR spectrum caused by characteristic electronic processes involving ferric (Fe3+), the diagnostic spectral feature manifests as one or two peaks at approximately 700 nm followed by a broad feature centered at approximately 1000 nm (Figure 12A), corresponding to the goethite reference of the USGS standard spectrum library (Figure 12B) [62]. Goethite-rich altered oxidized zones also cover large parts of the study area (Figure 12D). Combining previous research results [63], the alteration information dominated by Al-OH and Fe/Mg-OH includes rock mass and pegmatite information. The main mineral of the ore-bearing pegmatite is spodumene, and the rock body is mainly monzogranite [49]. The main minerals are plagioclase, potash feldspar, and muscovite. Granite and pegmatite are similar in mineral composition, and both show light color, which is obviously different from the metamorphic sandstone in color (Figure 13C and Figure 14). Typically, granite and pegmatite show a close spatial relationship in many parts of the study area (Figure 13D,E). In Figure 13A,B, it can be seen that the spectral reflectance of granite and pegmatite is between 0.2 and 0.9. There are absorption characteristics near 1400 nm, 1900 nm, 2200 nm, and 2300 nm [64], which are similar to the spectral characteristics of hydroxyl alteration, which is consistent with the alteration extraction results. Therefore, it is important to distinguish pegmatite and granite from hydroxyl alteration.

4.2. Structure and Mineralization

The study area is in the West Kunlun orogenic belt, and the rare metal metallogenic belt is between the Kangxiwa fault and the Dahongliutan–Guozhacuo fault [65,66]. The granite rock mass is elongated or nearly elliptical, and the whole is northwest–southeast. It spreads along the direction of the Kangxiwa fault and the Dahongliutan–Guozhacuo fault (Figure 8). The overall strike of the faults to the south of Figure 8A,B is consistent with the two large faults and the geological structure of the study area. The ring structure in Figure 8A is consistent with the Triassic intrusive rock mass. Pegmatite veins are widely developed on the internal and external contacts of the rock mass. Figure 14A shows that pegmatite with zonation characteristics is developed outside the monzogranite, indicating that the Dahongliutan mineralized pegmatites are associated with the Triassic granite and mineral fractionation from the parental magma. Figure 14B shows that the pegmatite in the core borehole is distributed in the strata as veins, which verifies that the distribution of pegmatites in the area is structurally controlled by joints and shears within the Bayankala Formation and Dahongliutan granite.

4.3. Mineral Prospectivity Maps for the Study Area

This study uses the MTMF method to extract hydroxyl alteration information and distinguishes pegmatite and granite based on this information. Compared with other methods, MTMF can highlight the proportion of pegmatite and granite and suppress the type and quantity of interference information, such as hydroxyl information and iron staining [67,68,69]. The spodumene crystal form is good and accounts for over 80% of the pegmatite samples, and the tourmaline crystal form in the granitic surrounding rocks is well developed and accounts for a relatively large proportion (Figure 13C). The spectra of spodumene-bearing pegmatites measured by ASD are similar to those of hydroxyl-containing minerals (Figure 15A). The spectra of spodumene-bearing pegmatites exhibit an increase in reflectivity in the visible light range at 500 nm. Relatively stable reflectance exists in the range of ~1350 nm and 1450–1850 nm (Figure 15B). In Figure 15B, spodumene-bearing pegmatites, illite, kaolinite, and montmorillonite all have absorption characteristics around 1410 nm, 1910 nm, and 2200 nm. Based on previous studies, these diagnostic characteristics are related to molecular groups such as OH-, H2O, and Al-OH [70,71,72]. The hydroxyl group-containing spodumene mineral exhibits asymmetry in the absorption characteristics of 1410 nm, 1910 nm, and 2200 nm at three wavelengths, especially having a secondary absorption in the 2100–2500 nm spectral region.
In extracting information from non-Li-bearing pegmatites, we selected tourmaline-bearing pegmatites as the endmember spectrum. The spectra of granitic surrounding rock, spodumene-bearing pegmatites, and tourmaline-bearing pegmatites have great similarities overall (Figure 9 and Figure 13A). The spodumene-bearing pegmatites have a strong absorption at 2200 nm and a secondary absorption at 2350 nm. Tourmaline-bearing pegmatites have only first-order absorption at 2350 nm. Therefore, using these spectral characteristic differences of ore-bearing pegmatites, Landsat-8 OLI and ASTER remote sensing images were enhanced, making it easier to delineate the prospective areas of pegmatite through PCA and MTMF. Based on the overlay analysis of PCA and MTMF, combining the locations of deposits and samples, the favorable area of ore-bearing pegmatites is delineated (Figure 16). The deposits in regions of interest 2, 3, and 7 at the edge of granite (Figure 16) are located at the side of the ridge, and there are strong alterations in the areas. Regions of interest 4 and 5 (Figure 16A) are consistent with the above-mentioned remote sensing information. Regions of interest 1, 6, and 8 (Figure 16) are located south of the Dahongliutan area, which could represent non-Li mineralized pegmatites, such as quartz-feldspar pegmatite and the weathering product of the rock mass. However, this does not guarantee that all prospective areas host the mining value of ore-bearing pegmatites. Nevertheless, the results of these methods focus on metallogenic prospective areas and improve prospecting efficiency.

5. Conclusions

In this study, based on the comprehensive analysis of geological information that includes the pegmatite zonation of spodumene-bearing and tourmaline-bearing pegmatite, granite, and structure, we used remote sensing and fieldwork to delineate prospective target areas of potential ore-bearing pegmatites. As for the methods adapted from the analysis of the spectra extracted from the Landsat-8 OLI and ASTER bands, we can say that principal component analysis was able to provide some hydrothermal alteration and structure information for pegmatites. The mixed tuned matched filtering analysis of Landsat-8 OLI and ASTER data is applied to the Li-bearing pegmatite distribution area extraction. The results show that pegmatite areas are closely related to alteration and structural information, and new locations of interest for exploration are defined. However, this does not guarantee that all prospects contain mining potential, which provides an important basis for the rapid discovery of ore-bearing pegmatite deposits in West Kunlun, China.
However, the identification of pegmatites encountered some difficulties, such as the sizes of the pegmatites are sometimes small compared to pixel size and the spectral similarity of some classes of pegmatites that merge with the host rock and alteration (the measured spectra of ore-bearing pegmatite have diagnostic absorption characteristics near 1400, 1900, 2200, 2350, and 2450 nm). Therefore, to further improve this study, it would be desirable to develop a sensor with a high spectral resolution and spatial resolution, such as drone-borne hyperspectral sensors, and more efficient algorithms to provide prospecting target information and reduce the scope of early-stage exploration.

Author Contributions

Conceptualization, Y.B. and J.W.; data curation, Y.B.; formal analysis, Y.B.; funding acquisition, K.Z. and J.W.; investigation, Y.B.; methodology, Y.B., J.W., G.J., S.Z., W.M., and Y.A.; project administration, K.Z.; resources, J.W.; software, K.Z.; supervision, K.Z. and J.W.; validation, Y.B., J.W., and S.Z.; visualization, Y.B. and J.W.; writing—original draft, Y.B.; writing—review and editing, K.Z. and J.W. All authors have read and agreed to the published version of the manuscript.

Funding

This work was supported by Sponsored by the Xinjiang Key Laboratory of Mineral Resources and Digital Geology, the Xinjiang Institute of Ecology and Geography, and the Chinese Academy of Sciences, grant number RZ2400003862; the Strategic Priority Research Program of the Chinese Academy of Sciences, grant number XDA0430103; the Third Xinjiang Scientific Expedition Program, grant number 2022xjkk1306; and the Science and Technology Major Project of Xinjiang Uygur Autonomous Region, China, grant number 2021A03001-3.

Data Availability Statement

The data that support the findings of this study are available from the corresponding author upon reasonable request.

Acknowledgments

We thank the first geological brigade of the Xinjiang Bureau of Geology and Mineral Resources for providing support in carrying out the field samples.

Conflicts of Interest

The authors declare no conflicts of interest.

References

  1. Kesler, S.E.; Gruber, P.W.; Medina, P.A.; Keoleian, G.A.; Everson, M.P.; Wallington, T.J. Global lithium resources: Relative importance of pegmatite, brine and other deposits. Ore Geol. Rev. 2012, 48, 55–69. [Google Scholar] [CrossRef]
  2. Meng, F.; McNeice, J.; Zadeh, S.S.; Ghahreman, A. Review of Lithium Production and Recovery from Minerals, Brines, and Lithium-Ion Batteries. Miner. Process. Extr. Metall. Rev. 2019, 42, 123–141. [Google Scholar] [CrossRef]
  3. Linnen, R.L.; Van Lichtervelde, M.; Černý, P. Granitic pegmatites as sources of strategic metals. Elements 2012, 8, 275–280. [Google Scholar] [CrossRef]
  4. London, D. Ore-forming processes within granitic pegmatites. Ore Geol. Rev. 2018, 101, 349–383. [Google Scholar] [CrossRef]
  5. Sabins, F.F. Remote sensing for mineral exploration. Ore Geol. Rev. 1999, 14, 157–183. [Google Scholar] [CrossRef]
  6. Laakso, K.; Peter, J.M.; Rivard, B.; White, H.P. Short-Wave Infrared Spectral and Geochemical Characteristics of Hydrothermal Alteration at the Archean Izok Lake Zn-Cu-Pb-Ag Volcanogenic Massive Sulfide Deposit, Nunavut, Canada: Application in Exploration Target Vectoring. Econ. Geol. 2016, 111, 1223–1239. [Google Scholar] [CrossRef]
  7. Rowan, L.C.; Mars, J.C. Lithologic mapping in the Mountain Pass, California area using Advanced Spaceborne Thermal Emission and Reflection Radiometer (ASTER) data. Remote Sens. Environ. 2003, 84, 350–366. [Google Scholar] [CrossRef]
  8. Naleto, J.L.C.; Perrotta, M.M.; Costa, F.G.d.; Souza Filho, C.R.d. Point and imaging spectroscopy investigations on the Pedra Branca orogenic gold deposit, Troia Massif, Northeast Brazil: Implications for mineral exploration in amphibolite metamorphic-grade terrains. Ore Geol. Rev. 2019, 107, 283–309. [Google Scholar] [CrossRef]
  9. Alaaddin, V.; Dogan, A. Determination of lithological differences and hydrothermal alteration areas by remote sensing studies: Kisacik (Ayvacik-Canakkale, Biga Peninsula, Turkey). J. Eng. Res. Appl. Sci. 2020, 9, 341–560. [Google Scholar]
  10. Corumluoglu, O.; Vural, A.; Asri, I. Determination of Kula basalts (geosite) in Turkey using remote sensing techniques. Arab. J. Geosci. 2015, 8, 10105–10117. [Google Scholar] [CrossRef]
  11. Feng, Y.; Liang, T.; Yang, X.; Zhang, Z.; Wang, Y. Chemical Evolution of Nb-Ta Oxides and Cassiterite in Phosphorus-Rich Albite-Spodumene Pegmatites in the Kangxiwa–Dahongliutan Pegmatite Field, Western Kunlun Orogen, China. Minerals 2019, 9, 166. [Google Scholar] [CrossRef]
  12. Wang, H.; Gao, H.; Zhang, X.-Y.; Yan, Q.-H.; Xu, Y.; Zhou, K.; Dong, R.; Li, P. Geology and geochronology of the super-large Bailongshan Li–Rb–(Be) rare-metal pegmatite deposit, West Kunlun orogenic belt, NW China. Lithos 2020, 360–361. [Google Scholar] [CrossRef]
  13. Lefevre, M.J. Teledetection d’anomalies geobotaniques appliquee a la recherche miniere par la methode de traitement d’images, Echassieres (Allier). Bull. Société Géologique Fr. 1982, 7, 127–130. [Google Scholar] [CrossRef]
  14. Mendes, D.; Perrotta, M.M.; Costa, M.A.C.; Paes, V.J.C. Mapeamento espectral para identificação de assinaturas espectrais de minerais de lítio em imagens ASTER (NE/MG). In Proceedings of the Anais do XVIII Simpósio Brasileiro de Sensoriamento Remoto, Santos, Brazil, 28–31 May 2017. 28–29. [Google Scholar]
  15. Salehi, T.H.; Tangestani, M. Large-scale mapping of iron oxide and hydroxide minerals of Zefreh porphyry copper deposit, using Worldview-3 VNIR data in the Northeastern Isfahan, Iran. Int. J. Appl. Earth Obs. Geoinf. 2018, 73, 156–169. [Google Scholar] [CrossRef]
  16. Cardoso-Fernandes, J.; Lima, A.; Teodoro, A.C. Potential of Sentinel-2 data in the detection of lithium (Li)-bearing pegmatites: A study case. In Proceedings of the Earth Resources and Environmental Remote Sensing/GIS Applications IX, Berlin, Germany, 10–13 September 2018; Volume 10790. [Google Scholar]
  17. Cardoso-Fernandes, J.; Teodoro, A.C.; Lima, A. Remote sensing data in lithium (Li) exploration: A new approach for the detection of Li-bearing pegmatites. Int. J. Appl. Earth Obs. Geoinf. 2019, 76, 10–25. [Google Scholar] [CrossRef]
  18. Cardoso-Fernandes, J.; Teodoro, A.C.; Lima, A.; Perrotta, M.; Roda-Robles, E. Detecting Lithium (Li) Mineralizations from Space: Current Research and Future Perspectives. Appl. Sci. 2020, 10, 1785. [Google Scholar] [CrossRef]
  19. Cardoso-Fernandes, J.; Silva, J.; Perrotta, M.M.; Lima, A.; Teodoro, A.C.; Ribeiro, M.A.; Dias, F.; Barrès, O.; Cauzid, J.; Roda-Robles, E. Interpretation of the Reflectance Spectra of Lithium (Li) Minerals and Pegmatites: A Case Study for Mineralogical and Lithological Identification in the Fregeneda-Almendra Area. Remote Sens. 2021, 13, 3688. [Google Scholar] [CrossRef]
  20. Dai, J.J.; Wang, D.H.; Dai, H.Z.; Liu, L.j.; Wu, Y.N. Geological mapping and ore-prospecting study using remote sensing technology in Jiajika area of Western Sichuan Province. Geol. China 2017, 44, 389–398, (In Chinese with English Abstract). [Google Scholar]
  21. Dai, J.J.; Wang, D.H.; Dai, H.Z.; Liu, L.J.; Ling, T.Y. Reflectance Spectral Characteristics of Rocks and Minerals in Jiajika Lithium Deposits in West Sichuan. Rock Miner. Anal. 2018, 37, 507–517, (In Chinese with English Abstract). [Google Scholar]
  22. Yao, F.J.; Xu, X.W.; Yang, J.M.; Wu, L.N.; Gen, X.X. A technology for identifying Li-Be pegmatite using ASTER remote sensing data in granite of Gobi shallow-covered area: A case study of recognition and prediction of Li-Be pegmatite in Jingerquan Xinjiang. Miner. Depos. 2020, 39, 686–696, (In Chinese with English Abstract). [Google Scholar]
  23. Yan, Q.-H.; Qiu, Z.-W.; Wang, H.; Wang, M.; Wei, X.-P.; Li, P.; Zhang, R.-Q.; Li, C.-Y.; Liu, J.-p. Age of the Dahongliutan rare metal pegmatite deposit, West Kunlun, Xinjiang (NW China): Constraints from LA–ICP–MS U–Pb dating of columbite-(Fe) and cassiterite. Ore Geol. Rev. 2018, 100, 561–573. [Google Scholar] [CrossRef]
  24. Xiao, W.; Han, F.; Windley, B.F.; Yuan, C.; Zhou, H.; Li, J. Multiple Accretionary Orogenesis and Episodic Growth of Continents: Insights from the Western Kunlun Range, Central Asia. Int. Geol. Rev. 2010, 45, 303–328. [Google Scholar] [CrossRef]
  25. Mattern, F.; Schneider, W. Suturing of the Proto- and Paleo-Tethys oceans in the western Kunlun (Xinjiang, China). J. Asian Earth Sci. 2000, 18, 637–650. [Google Scholar] [CrossRef]
  26. Wei, X.P.; Wang, H.; Hu, J.; Mu, S.L.; Qiu, Z.W.; Yan, Q.H.; Li, P. Geochemistry and geochronology of the Dahongliutan two-mica granite pluton in western Kunlun orogen: Geotectonic implications. Geochemistry 2017, 46, 66–80, (In Chinese with English Abstract). [Google Scholar]
  27. Yan, Z.Q.; Wang, H.T.; Li, Y.M.; Wang, J.Z.; Li, K.; Wang, Y.X.; Ren, W.X.; Yu, C.; Zhou, Y.Q. Potential Evaluation of Pegmatite-type lithium-beryllium mineral resources in Dahongliutan area, West Kunlun. Gansu Geol. 2018, 27, 42–48, (In Chinese with English Abstract). [Google Scholar]
  28. Qiao, G.B.; Zhang, H.D.; Wu, Y.Z.; Jin, M.S.; Du, W.; Zhao, X.J.; Chen, D.H. Petrogenesis of the Dahongliutan Monzogranite in Western Kunlun: Constraints from SHRIMP Zircon U-Pb Geochronology and Geochemical Characteristics. Acta Geol. Sin. 2015, 89, 1180–1194, (In Chinese with English Abstract). [Google Scholar]
  29. Claverie, M.; Vermote, E.F.; Franch, B.; Masek, J.G. Evaluation of the Landsat-5 TM and Landsat-7 ETM+ surface reflectance products. Remote Sens. Environ. 2015, 169, 390–403. [Google Scholar] [CrossRef]
  30. Clark, R.N.; Roush, T.L. Reflectance spectroscopy: Quantitative analysis techniques for remote sensing applications. J. Geophys. Res. Solid Earth 1984, 89, 6329–6340. [Google Scholar] [CrossRef]
  31. Hecker, C.; van Ruitenbeek, F.J.A.; Bakker, W.H.; Fagbohun, B.J.; Riley, D.; van der Werff, H.M.A.; van der Meer, F.D. Mapping the wavelength position of mineral features in hyperspectral thermal infrared data. Int. J. Appl. Earth Obs. Geoinf. 2019, 79, 133–140. [Google Scholar] [CrossRef]
  32. Kokaly, R.F.; Clark, R.N. Spectroscopic Determination of Leaf Biochemistry Using Band-Depth Analysis of Absorption Features and Stepwise Multiple Linear Regression. Remote Sens. Environ. 1999, 67, 267–287. [Google Scholar] [CrossRef]
  33. Eldosouky, A.M.; Sehsah, H.; Elkhateeb, S.O.; Pour, A.B. Integrating aeromagnetic data and Landsat-8 imagery for detection of post-accretionary shear zones controlling hydrothermal alterations: The Allaqi-Heiani Suture zone, South Eastern Desert Egypt. Adv. Space Res. 2020, 65, 1008–1024. [Google Scholar] [CrossRef]
  34. Crosta, A.P.; De Souza Filho, C.R.; Azevedo, F.; Brodie, C. Targeting key alteration minerals in epithermal deposits in Patagonia, Argentina, using ASTER imagery and principal component analysis. Int. J. Remote Sens. 2003, 24, 4233–4240. [Google Scholar] [CrossRef]
  35. Loughlin, W.P. Principal component analysis for alteration mapping. Photogramm. Eng. Remote Sens. 1991, 57, 1163–1169. [Google Scholar]
  36. Boardman, J.W.; Kruse, F.A. Automated spectral analysis: A geologic example using AVIRIS data, north Grapevine Mountains, Nevada. In Proceedings of the Tenth Thematic Conference on Geologic Remote Sensing, San Antonio, TX, USA, 9–12 May 1994. [Google Scholar]
  37. Gupta, R.P.; Tiwari, R.K.; Saini, V.; Srivastava, N. A Simplified Approach for Interpreting Principal Component Images. Adv. Remote Sens. 2013, 2, 111–119. [Google Scholar] [CrossRef]
  38. Boardman, J.W.; Kruscl, F.A.; Grccn, R.O. Mapping target signatures via partial unmixing of AVIRIS data. In Proceedings of the 5th Annual JPL Airborne Earth Science Workshop, Pasadena, CA, USA, 23–26 January 1995. JPL. [Google Scholar]
  39. Vural, A.; Akpinar, İ.; Sipahi, F. Mineralogical and Chemical Characteristics of Clay Areas, Gümüşhane Region (NE Turkey), and Their Detection Using the Crósta Technique with Landsat 7 and 8 Images. Nat. Resour. Res. 2021, 30, 3955–3985. [Google Scholar] [CrossRef]
  40. Green, A.A.; Berman, M.; Switzer, P.; Craig, M.D. A transformation for ordering multispectral data in terms of image quality with implications for noise removal. IEEE Trans. Geosci. Remote Sens. 1988, 26, 65–74. [Google Scholar] [CrossRef]
  41. Van der Werff, H.; van der Meer, F. Sentinel-2A MSI and Landsat8 OLI Provide Data Continuity for Geological Remote Sensing. Remote Sens. 2016, 8, 883. [Google Scholar] [CrossRef]
  42. Kokaly, R.F.; Clark, R.N.; Swayze, G.A.; Livo, K.E.; Hoefen, T.M.; Pearson, N.C.; Wise, R.A.; Benzel, W.; Lowers, H.A.; Driscoll, R.L.; et al. USGS Spectral Library Version 7: U.S. Geol. Surv. Data Ser. 2017, 1035, 61. [Google Scholar]
  43. Honarmand, M.; Ranjbar, H.; Shahabpour, J. Application of Principal Component Analysis and Spectral Angle Mapper in the Mapping of Hydrothermal Alteration in the Jebal-Barez Area, Southeastern Iran. Resour. Geol. 2012, 62, 119–139. [Google Scholar] [CrossRef]
  44. Ghosh, U.K.; Naik, K.K.; Kesari, M.P. Digital image processing of multispectral ASTER imagery for delineation of alteration and related clay minerals in Sausar Belt-a case study. Indian J. Geosci. 2016, 70, 49–58. [Google Scholar]
  45. Tompkins, S.; Mustard, J.F.; Pieters, C.M.; Forsyth, D.W. Optimization of endmembers for spectral mixture analysis. Remote Sens. Environ. 1997, 59, 472–489. [Google Scholar] [CrossRef]
  46. Siddiqui, A.; Chauhan, P.; Kumar, V.; Jain, G.; Kumar, P. Characterization of urban materials in AVIRIS-NG data using a mixture tuned matched filtering (MTMF) approach. Geocarto International. 2020. [Google Scholar] [CrossRef]
  47. Ye, B.; Tian, S.; Ge, J.; Sun, Y. Assessment of WorldView-3 Data for Lithological Mapping. Remote Sens. 2017, 9, 1132. [Google Scholar] [CrossRef]
  48. Goodarzi Mehr, S.; Ahadnejad, V.; Abbaspour, R.A.; Hamzeh, M. Using the mixture-tuned matched filtering method for lithological mapping with Landsat TM5 images. Int. J. Remote Sens. 2013, 34, 8803–8816. [Google Scholar] [CrossRef]
  49. Cao, R.; Gao, Y.; Chen, B.; Bagas, L.; Yan, S.; Huang, C.; Zhao, H. Pegmatite magmatic evolution and rare metal mineralization of the Dahongliutan pegmatite field, Western Kunlun Orogen: Constraints from the B isotopic composition and mineral-chemistry. Int. Geol. Rev. 2021, 65, 1224–1242. [Google Scholar] [CrossRef]
  50. Gao, J.G.; Liang, T.; Wang, D.H.; Feng, Y.G.; Li, Y.; Tan, X.J.; Cen, J.B.; He, L. The metallogenic mechanism of rare metaldeposits in the Dahongliutan ore field, Hotian, Xinjiang. Acta Petrol. Sin. 2024, 40, 2753–2768, (In Chinese with English Abstract). [Google Scholar] [CrossRef]
  51. Pour, A.B.; Sekandari, M.; Rahmani, O.; Crispini, L.; Läufer, A.; Park, Y.; Hong, J.K.; Pradhan, B.; Hashim, M.; Hossain, M.S.; et al. Identification of Phyllosilicates in the Antarctic Environment Using ASTER Satellite Data: Case Study from the Mesa Range, Campbell and Priestley Glaciers, Northern Victoria Land. Remote Sens. 2020, 13, 38. [Google Scholar] [CrossRef]
  52. Pour, A.B.; Hashim, M.; Hong, J.K.; Park, Y. Lithological and alteration mineral mapping in poorly exposed lithologies using Landsat-8 and ASTER satellite data: North-eastern Graham Land, Antarctic Peninsula. Ore Geol. Rev. 2019, 108, 112–133. [Google Scholar] [CrossRef]
  53. Mars, J.C.; Rowan, L.C. ASTER spectral analysis and lithologic mapping of the Khanneshin carbonatite volcano, Afghanistan. Geosphere 2011, 7, 276–289. [Google Scholar] [CrossRef]
  54. Wu, M.; Zhou, K.; Wang, Q.; Wang, J. Mapping Hydrothermal Zoning Pattern of Porphyry Cu Deposit Using Absorption Feature Parameters Calculated from ASTER Data. Remote Sens. 2019, 11, 1729. [Google Scholar] [CrossRef]
  55. Mars, J.C.; Rowan, L.C. Regional mapping of phyllic- and argillic-altered rocks in the Zagros magmatic arc, Iran, using Advanced Spaceborne Thermal Emission and Reflection Radiometer (ASTER) data and logical operator algorithms. Geosphere 2006, 2, 161–186. [Google Scholar] [CrossRef]
  56. Carranza, E.J.M.; Hale, M. Mineral imaging with Landsat Thematic Mapper data for hydrothermal alteration mapping in heavily vegetated terrane. Int. J. Remote Sens. 2002, 23, 4827–4852. [Google Scholar] [CrossRef]
  57. Hunt, G.R.; Graham, R. Spectral signature of particular minerals in the visible and infrared. Geophysics 1977, 42, 501–513. [Google Scholar] [CrossRef]
  58. Gersman, R.; Ben-Dor, E.; Beyth, M.; Avigad, D.; Abraha, M.; Kibreab, A. Mapping of hydrothermally altered rocks by the EO-1 Hyperion sensor, Northern Danakil Depression, Eritrea. Int. J. Remote Sens. 2008, 29, 3911–3936. [Google Scholar] [CrossRef]
  59. Laukamp, C.; Rodger, A.; LeGras, M.; Lampinen, H.; Lau, I.C.; Pejcic, B.; Stromberg, J.; Francis, N.; Ramanaidou, E. Mineral Physicochemistry Underlying Feature-Based Extraction of Mineral Abundance and Composition from Shortwave, Mid and Thermal Infrared Reflectance Spectra. Minerals 2021, 11, 347. [Google Scholar] [CrossRef]
  60. Corrado, F.; Putzolu, F.; Armstrong, R.N.; Mondillo, N.; Chirico, R.; Casarotto, B.; Massironi, M.; Fuller, D.; Ball, R.; Herrington, R.J. Application of satellite and proximal hyperspectral sensing to target lithium mineralization in volcano-sedimentary deposits: A case study from the McDermitt caldera, USA. Remote Sens. Environ. 2025, 323. [Google Scholar] [CrossRef]
  61. Jiang, Q.; Dai, J.; Wang, D.; Wang, C.; Tian, S. Lithium-bearing pegmatite exploration in Western Altun, Xinjiang, using remote-sensing technology. Acta Geol. Sin. 2023, 97, 681–694. [Google Scholar] [CrossRef]
  62. Hunt, G.R.; Ashley, P. Spectra of altered rocks in the visible and near infrared. Econ. Geol. 1979, 74, 1613–1629. [Google Scholar] [CrossRef]
  63. Crowley, J.K.; Williams, D.E.; Hammarstrom, J.M.; Piatak, N.; Chou, I.M.; Mars, J.C. Spectral reflectance properties (0.4–2.5 μm) of secondary Fe-oxide, Fe-hydroxide, and Fe-sulphate-hydrate minerals associated with sulphide-bearing mine wastes. Geochem. Explor. Environ. Anal. 2003, 3, 219–228. [Google Scholar] [CrossRef]
  64. Tang, J.L.; Ke, Q.; Xu, X.W.; Kang, K.; Li, H.; Tan, K.B.; Dong, L.H.; Liu, Y.X. Magma evolution and mineralization of Longmenshan lithium-beryllium pegmatite in Dahongliutan area, West Kunlun. Acta Geol. Sin. 2022, 38, 655–675. [Google Scholar]
  65. Gao, Y.; Bagas, L.; Li, K.; Jin, M.; Liu, Y.; Teng, J. Newly Discovered Triassic Lithium Deposits in the Dahongliutan Area, NorthWest China: A Case Study for the Detection of Lithium-Bearing Pegmatite Deposits in Rugged Terrains Using Remote-Sensing Data and Images. Front. Earth Sci. 2020, 8. [Google Scholar] [CrossRef]
  66. Qiao, G.B.; Wu, Y.Z.; Liu, T. Zircon U-Pb age of pegmatite veins in Dahongliutan lithium deposit, western Kunlun. China Geol. 2021, 4, 185–187. [Google Scholar] [CrossRef]
  67. Fan, J.J.; Tang, G.J.; Wei, G.J.; Wang, H.; Xu, Y.G.; Wang, Q.; Zhou, J.S.; Zhang, Z.Y.; Huang, T.Y.; Wang, Z.L. Lithium isotope fractionation during fluid exsolution: Implications for Li mineralization of the Bailongshan pegmatites in the West Kunlun, NW Tibet. Lithos 2020. [Google Scholar] [CrossRef]
  68. Asadzadeh, S.; De Souza Filho, C.R. A review on spectral processing methods for geological remote sensing. Int. J. Appl. Earth Obs. Geoinf. 2016, 47, 69–90. [Google Scholar] [CrossRef]
  69. Boardman, J.W.; Kruse, F.A. Analysis of Imaging Spectrometer Data Using N-Dimensional Geometry and a Mixture-Tuned Matched Filtering Approach. IEEE Trans. Geosci. Remote Sens. 2011, 49, 4138–4152. [Google Scholar] [CrossRef]
  70. Son, Y.-S.; You, B.-W.; Bang, E.-S.; Cho, S.-J.; Kim, K.-E.; Baik, H. Mapping Alteration Mineralogy in Eastern Tsogttsetsii, Mongolia, Based on the WorldView-3 and Field Shortwave-Infrared Spectroscopy Analyses. Remote Sens. 2021, 13, 914. [Google Scholar] [CrossRef]
  71. Liu, J.; He, H.; Michalski, J.; Cuadros, J.; Yao, Y.; Tan, W.; Qin, X.; Li, S.; Wei, G. Reflectance spectroscopy applied to clay mineralogy and alteration intensity of a thick basaltic weathering sequence in Hainan Island, South China. Appl. Clay Sci. 2021, 201. [Google Scholar] [CrossRef]
  72. Gilles, G.; Xavier, B.; Karine, A.; Anne, B.; Audrey, H. Clay Minerals Mapping from Imaging Spectroscopy. In Geospatial Analyses of Earth Observation (EO) Data; Pepe, A., Zhao, Q., Eds.; IntechOpen: Rijeka, Croatia, 2019. [Google Scholar]
Figure 1. The geological map in the Dahongliutan area, NW China: (A) tectonic units of the West Kunlun Orogen and Bayankala Fold Belt and (B) geotectonic location and regional geological map of Kangxiwa–Dahongliutan in the study area (modified from [23]).
Minerals 15 00671 g001
Figure 2. Photographs of samples and data acquisition equipment in the study area. (a) Non-mineralized micro-plagioclase granite–pegmatite containing garnet; (b) beryllium-rich beryl-muscovite granite–pegmatite; (c) spodumene-albitite granite-pegmatite; (d) massive pegmatite; (e) pegmatite dike; (f) ore-rich surrounding granite rocks; (g) Bayankala Group sandstone; (h) mica schist; (i) geographical location of mining area; (j) a dark-room environment; (k) ASD FieldSpec-4; (l) photography environment.
Minerals 15 00671 g002
Figure 3. Spectra (USGS library) of selected minerals associated with hydroxyl-bearing alteration types in the study area superimposed over (A) Landsat-8 OLI and (B) ASTER band positions [41].
Minerals 15 00671 g003
Figure 4. Spectra (USGS library) of selected minerals associated with iron-bearing alteration types in the study area superimposed over (A) Landsat-8 OLI and (B) ASTER band positions [41].
Minerals 15 00671 g004
Figure 5. Reflectance spectra of different lithological samples extracted from laboratory that were resampled to response functions of VNIR+SWIR bands of Landsat-8 OLI (A) and ASTER (B).
Minerals 15 00671 g005
Figure 6. Remote sensing image RGB combinations used to highlight hydroxyl alteration: (A) RGB 432 for Landsat-8 OLI base map, with pseudocolor ramp of the -PC4 image showing surface distribution of OH-alteration in the study area; (B) RGB 321 for ASTER base map, with pseudocolor ramp of the -PC4 rule image showing surface distribution.
Minerals 15 00671 g006
Figure 7. Remote sensing images of RGB combinations to highlight iron-staining alteration: (A) RGB 432 for Landsat-8 OLI base map, with pseudocolor ramp of the -PC3 rule image showing surface distribution of iron oxide/hydroxides in the study area; (B) RGB 321 for ASTER base map, with pseudocolor ramp of the PC3 image showing surface distribution of iron oxide/hydroxides in the study area.
Minerals 15 00671 g007
Figure 8. False-color composite remote sensing images of principal component analysis (PCA) of (A) Landsat-8 OLI RGB-PC1, PC2, and PC3, as well as (B) ASTER RGB-PC4, PC2, and PC1.
Minerals 15 00671 g008
Figure 9. VNIR-SWIR spectra of minerals from the hand samples captured using the ASD. Spectrum curve for spodumene-bearing pegmatite at Longmenshan, spodumene-bearing pegmatite at Dahongliutan, and tourmaline-bearing pegmatite at Dahongliutan.
Minerals 15 00671 g009
Figure 10. Remote sensing images of RGB combinations used to highlight pegmatite: (A) RGB 432 for Landsat-8 OLI base map; (B) RGB 321 for ASTER base map. Li mineralized pegmatite areas appear in red.
Minerals 15 00671 g010
Figure 11. (A) The spectra curve of samples obtained by ASD; (B) the spectra curve of samples obtained by USGS; (C) hand specimens of cookeite; (D) a regional view of the pegmatite dike; (E) a close-up of a specimen from the pegmatite dike.
Minerals 15 00671 g011
Figure 12. (A) The spectra curve of samples (as shown in (C)) obtained using ASD; (B) the spectra curve of samples obtained by USGS; (C) hand specimens of goethite; (D) a view of iron oxide zones.
Minerals 15 00671 g012
Figure 13. (A) The original spectra curve of samples (as shown in (C)); (B) the original spectra curve of samples in the range of 2100 nm to 2500 nm; (C) samples of different lithologies (granite and spodumene-bearing pegmatite); (D) a panoramic view of pegmatite dike; (E) a region view of granitic pegmatite.
Minerals 15 00671 g013
Figure 14. Field photographs of samples from the Dahongliutan area showing (A) spodumene-bearing pegmatite and tourmaline-bearing pegmatite in the host monzogranite with zonation characteristics; (B) spodumene-bearing pegmatite veins and metamorphic sandstone of the Bayankala Formation.
Minerals 15 00671 g014
Figure 15. Spectrum curve for spodumene-bearing pegmatite, illite, kaolinite, and montmorillonite: (A) original spectrum curve; (B) spectrum curve with continuum removed.
Minerals 15 00671 g015
Figure 16. RGB combinations to highlight Li-bearing pegmatite sub-regions of study areas: (A) RGB 432 for Landsat-8 OLI; (B) RGB 321 for ASTER. Possible Li-bearing pegmatite areas appear in red, while possible non-Li-bearing pegmatite areas appear in green. Overview of the study area where regions of interest 1–8 for exploration are defined by the red rectangle.
Minerals 15 00671 g016
Table 1. Performance characteristics of Landsat-8 OLI and ASTER.
SensorSubsystemBand NumberSpectral Range (µm)Spatial Resolution (m)Swath Width (m)
Landsat-8VNIRPAN (8)0.500–0.68015185
Coastal aerosol (1)0.433–0.45330
Blue (2)0.450–0.515
Green (3)0.525–0.600
Red (4)0.630–0.680
NIR (5)0.845–0.885
SWIRSWIR1 (6)1.560–1.660
SWIR2 (7)2.100–2.300
Cirrus (9)1.360–1.390
TIRTIRS1 (10)10.60–11.19100
TIRS2 (11)11.50–12.51
ASTERVNIR10.520–0.6001560
20.630–0.690
3N0.780–0.860
3B0.780–0.860
SWIR41.600–1.70030
52.145–2.185
62.185–2.225
72.235–2.285
82.295–2.365
92.360–2.430
TIR108.125–8.47590
118.475–8.825
128.925–9.275
1310.25–10.95
1410.95–11.65
Table 2. Eigenvector matrix derived from PCA for the selected bands of Landsat-8 OLI bands (2, 5, 6, and 7) used in this study.
EigenvectorsBand 2Band 5Band 6Band 7
PC10.230.520.630.53
PC20.680.51−0.39−0.34
PC30.63−0.61−0.110.47
PC4−0.290.29−0.660.63
Table 3. Eigenvector matrix derived from PCA for the selected bands of ASTER bands (1, 3, 4, and 6) used in this study.
EigenvectorsBand 1Band 3Band 4Band 6
PC1−0.11−0.97−0.21−0.04
PC2−0.69−0.08−0.700.16
PC3−0.720.23−0.64−0.18
PC4−0.020.01−0.250.97
Table 4. Eigenvector matrix derived from PCA for the selected bands of ASTER bands (1, 3, 4, and 8) used in this study.
EigenvectorsBand 1Band 3Band 4Band 8
PC1−0.11−0.97−0.21−0.03
PC2−0.70−0.07−0.700.10
PC3−0.710.22−0.66−0.13
PC4−0.020.01−0.160.99
Table 5. Eigenvector matrix derived from PCA for the selected Landsat-8 OLI bands (2, 4, 5, and 6) used in this study.
EigenvectorsBand 2Band 4Band 5Band 6
PC10.250.400.570.67
PC20.610.360.26−0.66
PC3−0.39−0.410.78−0.27
PC4−0.640.74−0.01−0.19
Table 6. Eigenvector matrix derived from PCA for the selected ASTER bands (1, 2, 3, and 4) used in this study.
EigenvectorsBand 1Band 2Band 3Band 4
PC10.110.290.930.19
PC20.650.38−0.06−0.66
PC30.540.28−0.310.73
PC40.52−0.830.200.02
Disclaimer/Publisher’s Note: The statements, opinions and data contained in all publications are solely those of the individual author(s) and contributor(s) and not of MDPI and/or the editor(s). MDPI and/or the editor(s) disclaim responsibility for any injury to people or property resulting from any ideas, methods, instructions or products referred to in the content.

