Article

Mineral Phase Transformation and Leaching Behavior During the Roasting–Acid–Leaching Process of Clay-Type Lithium Ore in the Qaidam Basin

1
Salt Lake Chemical Engineering Research Complex, Qinghai University, Xining 810016, China
2
Institute of Resources and Environmental Engineering, Shanxi University, Taiyuan 030006, China
3
Qinghai Fourth Geological Exploration Institute, Xining 810016, China
4
Qinghai Provincial Key Laboratory of Shale Gas Resources, Xining 810016, China
*
Author to whom correspondence should be addressed.
Minerals 2025, 15(8), 777; https://doi.org/10.3390/min15080777
Submission received: 30 May 2025 / Revised: 18 July 2025 / Accepted: 22 July 2025 / Published: 24 July 2025
(This article belongs to the Section Mineral Processing and Extractive Metallurgy)

Abstract

To address lithium extraction from clay-type lithium ore from the Qaidam Basin, this study identified key controlling factors through particle fractionation, acid-leaching–roasting experiments, and mineral characterization. The results demonstrate that particle size optimization enriched the lithium to 87.65 ppm, where a 74% leaching rate was achieved with 65 ppm extraction, which established intermediate-sized samples as optimal. During acid leaching, adsorbed lithium ions with a phyllosilicate interlayer were released via the ion exchange process instead of mineral dissolution, as verified by the Li-O/S-O peak shifts in the FTIR spectra. The roasting induced hydroxyl elimination, carbonate decomposition, and silicate restructuring but triggered lithium encapsulation via mineral phase reorganization, which caused a sharp leaching rate decline. Effective lithium extraction requires integrated particle size screening, acid-leaching optimization, and roasting-induced phase encapsulation disruption. This study established theoretical foundations for clay-type lithium ore exploitation.

1. Introduction

Lithium, a critical metal, plays irreplaceable roles in new energy sources, medicine, and materials [1,2,3,4]. The global lithium consumption surged 41% from 95,000 tons (2021) to 134,000 tons (2022) [5], with projections indicating a 60% demand rise by 2060 [6]. Addressing high-grade ore depletion and supply chain vulnerabilities [7], China’s “reserve expansion and production enhancement” strategy prioritizes low-grade deposit exploitation as critical for resource security [8]. China’s lithium deposits primarily include hard rock, brine, and clay, with the latter offering extensive reserves, wide distribution, and cost-effective extraction [9]. Genetic classification defines clay-type lithium resources as being volcanic, carbonate, or Jadarite types [10]. Based on their crystal structures, clay minerals can be classified into 1:1-type layer structures, 2:1-type layer structures, and layer–chain transitional structures [11].
In clay-type lithium ores, lithium mainly exists in the crystal lattice of clay minerals and is fixed by interlayer adsorption, surface adsorption, and similar image substitution [12]. This state determines the extraction difficulty and availability of lithium. Zhong et al. studied a method for extracting lithium from lithium-rich kaolin resources, which is a 1:1 layered silicate mineral with strong interlayer binding and is difficult to extract using traditional acid-leaching methods (such as H2SO4 leaching). This problem was successfully solved using Na2SO4 roasting and water immersion, with an extraction efficiency of up to 84% for lithium [13]. Ran et al. studied a method for extracting lithium from low-grade clay-type lithium ores and proposed a roasting process using chloride salt as an additive combined with water leaching to extract lithium. This method is significantly better than the traditional roasting–acid-leaching process regarding the lithium extraction efficiency, with a lithium recovery rate of 92.35%, which not only improves the lithium extraction efficiency but also reduces the use of acid and the resulting environmental impact [14]. Xie et al. proposed a method for extracting lithium from clay-type lithium deposits, namely, ammonium persulfate and water leaching combined with low-temperature (400 °C) roasting, which is significantly colder than the traditional roasting temperature (usually 600 °C and above). This technology achieves efficient lithium extraction while reducing energy consumption, with a lithium extraction rate of 80.10% [15]. Zhou et al. studied a method for extracting lithium from clay-type lithium ores and proposed a process using a sulfuric and phosphoric acid mixture as a leaching agent, which achieved a lithium leaching rate of up to 97.83% by optimizing parameters such as the acid ratio, roasting temperature, roasting time, leaching time, and leaching temperature. This leaching rate is significantly higher than that of single-acid leaching, indicating the high efficiency of mixed acids in lithium extraction [16]. Li et al. studied an environmentally friendly strategy for the integrated recovery of lithium (Li), aluminum (Al), and silicon (Si) from low-grade clay-type lithium deposits, especially through the process of sodium hydroxide (NaOH)-assisted roasting combined with sulfuric acid leaching, which achieved a lithium leaching rate of 96.8% under optimized sulfuric-acid-leaching conditions, while the solid residue yield was only 8% of the raw ore. This result is significantly better than the traditional roasting and leaching process, indicating that NaOH-assisted roasting can effectively promote lithium leaching [17]. Zhao et al. used blank roasting combined with calcium hydroxide (CaO)-assisted alkali leaching to achieve efficient selective lithium leaching. Under optimal conditions, the lithium-leaching efficiency reached 82.84%, while the leaching efficiencies of aluminum, silicon, magnesium, and iron were extremely low [18]. Some studies focused on the regulation of acid-leaching conditions [19], others focused on the roasting-immersion process [20,21], and some focused on the systematic study of the subsequent lithium extraction from the leaching solution [22]. To sum up, the existing extraction schemes mainly involve roasting first and then leaching, where roasting is mainly divided into blank roasting or adding roasting aids, and leaching mainly includes water, acid, and alkali leaching.
Roasting may increase the leaching rate through mineral aggregate expansion or mineral transformation [23], while acid leaching has outstanding advantages due to its low cost and universality for mineral leaching. Studies have shown that factors such as the particle size and mineral composition of clay minerals affect the occurrence state and migration of lithium [24]. However, there is a lack of systematic research on the feasibility of the screening–roasting–acid-leaching process for clay-type lithium deposits from the Qaidam Basin and the transformation of the ore facies, microscopic morphology, and functional groups during the process; instead, the research on clay-type lithium deposits from the Qaidam Basin mostly focused on the characteristics of the element occurrence morphology. This study focused on how the particle size regulation affected the lithium enrichment by systematically evaluating the acid-leaching process feasibility and exploring the mechanisms by which roasting pretreatment influences the leaching efficiency. Through analyzing the interrelationships between the mineral phase evolution, microstructural changes, and functional group transformations, this study explored the roasting-induced suppression mechanisms that affected the lithium extraction, which provided a theoretical foundation for process optimization.

2. Materials and Methods

This study targeted typical clay-type lithium deposits from the Qaidam Basin, where two representative ore samples were collected (gray-brown clay mineral A and gray-green clay mineral B). A and B were dried and crushed (Figure 1) via standard geological sampling to guarantee the sample representativeness. The experimental reagents were deionized water and sulfuric acid (analytical-grade, Sinopharm Chemical Reagent Co., Ltd.,China).
The elemental content was quantified using inductively coupled plasma–optical emission spectrometry (ICP-OES, Agilent 5110, Agilent Technologies, Inc., Santa Clara, CA, USA). The mineral phases and their treatment-induced transformations were characterized using X-ray diffraction (XRD, Smart Lab 3KW, Rigaku Corporation, Akishima, Japan). The mineralogical features and microstructural evolution were revealed using scanning electron microscopy with energy-dispersive spectroscopy (SEM-EDS, JSM-IT500HR, Japan Electron Co., Ltd., Tokyo, Japan). The functional group dynamics were monitored using Fourier-transform infrared spectroscopy (FTIR, NVENSIO-S, Bruker Scientific Technology Co., Ltd., Karlsruhe, Germany) throughout the processing stages.
The samples were oven-dried at 60 °C for 2 h, then crushed and sieved into seven particle fractions: 0–40 mesh (>425 μm), 40–80 mesh (425–180 μm), 80–120 mesh (178–124 μm), 120–160 mesh (124–100 μm), 160–200 mesh (100–75 μm), 200–250 mesh (75–63 μm), and >250 mesh (<63 μm). The lithium content analysis determined the experimental size range. Acid leaching was conducted in a thermostatic magnetic stirrer with temperature control using 2 mol/L H2SO4 at 60 °C with a 1:5 solid–liquid ratio under continuous stirring (3 h). Post-leaching, solid–liquid separation was achieved via Buchner funnel filtration. The residues were dried (105 °C, 1 h) and ground. The elemental leaching rate was calculated using the standard formula:
ϵ = m 1 ω 1 m 2 ω 2 m 1 ω 1 × 100 %
where ϵ represents the leaching rate of lithium (%); m1 represents the raw ore mass (g); ω1 represents the lithium content in the raw ore (%); m2 represents the leach residue mass (g); and ω2 represents the lithium content in the leach residue (%).
The acid-leaching feasibility was confirmed experimentally, followed by the roasting–acid-leaching process evaluation. Selected raw ore samples were subjected to programmed roasting in a vacuum atmosphere furnace that was set to rise to 200 °C over 50 min, then rise to 600 °C over 80 min, and remain at the programmed temperature for 1 h; then, the above acid-leaching treatment was carried out. A centrifuge was used for the solid–liquid separation of the acid-leaching residue after the roasting pretreatment.

3. Results and Discussion

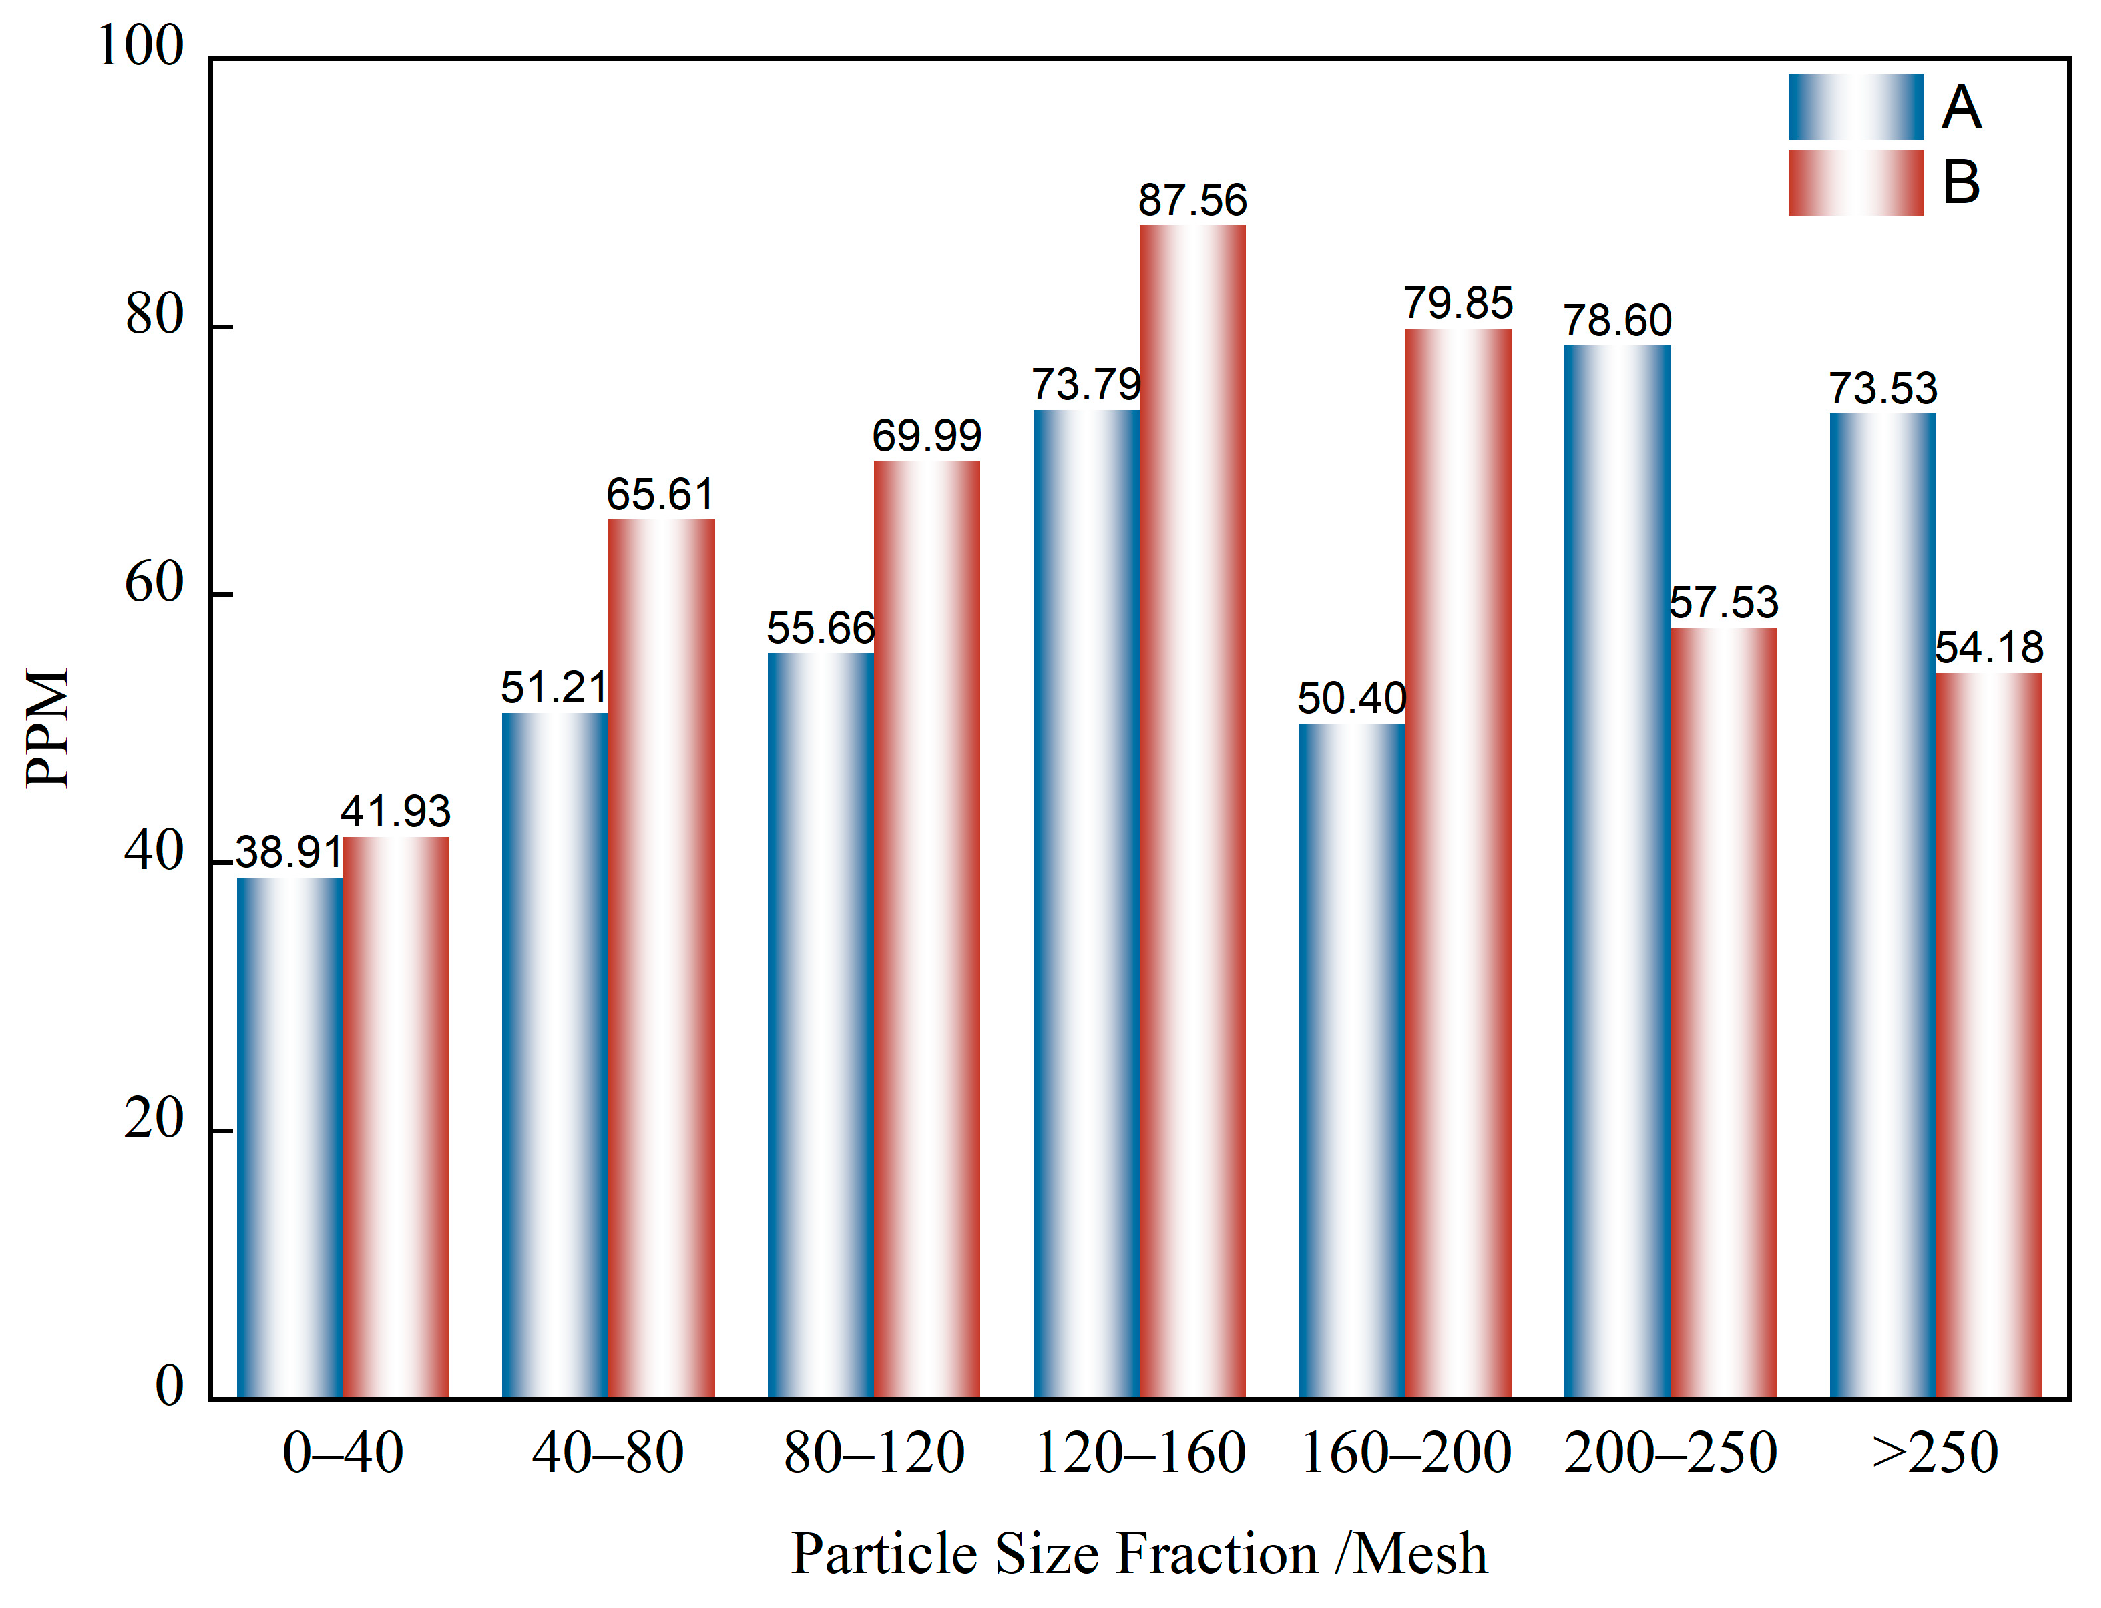
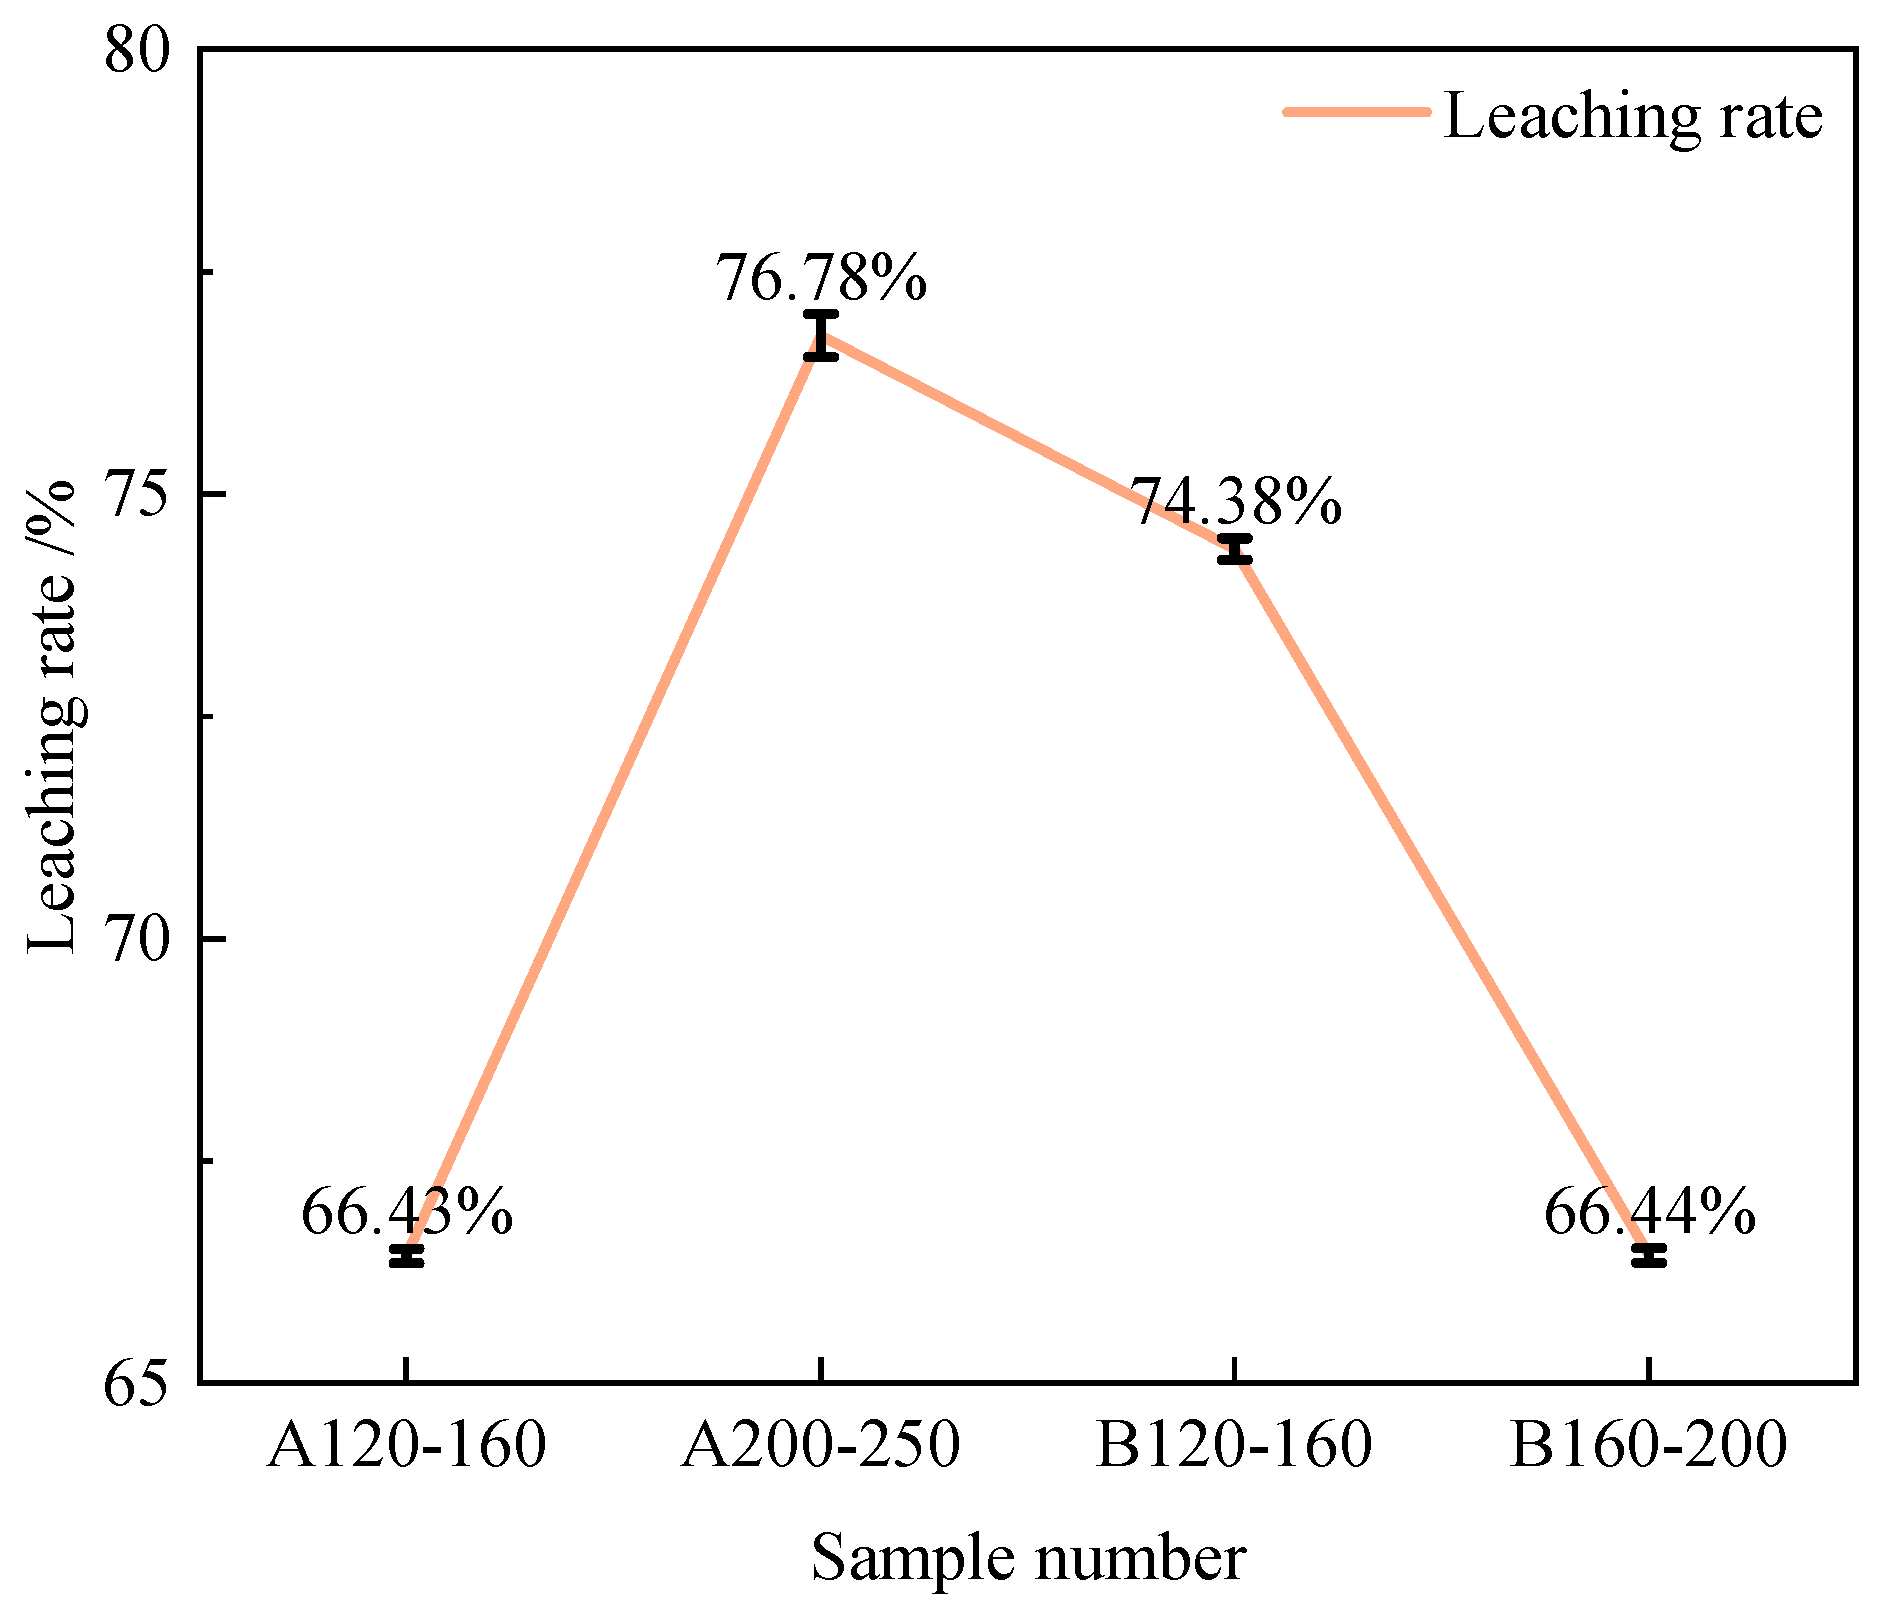
3.1. Lithium Content Evolution in Raw, Acid-Leached, and Roasted–Acid-Leached Ores

The ICP-OES analysis quantified the Li contents in the raw, acid-leached, and roasted–acid-leached clay lithium ore from the Qaidam dry salt lake across the particle size fractions.
Figure 2 displays the Li distributions across the particle size fractions in samples A and B, which exhibited non-monotonic Li enrichment patterns: as the particle size decreased from 80–120 to >250 mesh, the Li content initially rose until it peaked at intermediate sizes (120–200 mesh) before declining. Notably, sample A achieved a maximum Li concentration (78.60 ppm) at 200–250 mesh, while sample B showed peak enrichment (87.56 ppm) at 120–160 mesh. This size-dependent enrichment behavior highlights the optimal particle range (120–250 mesh) for Li recovery.
The acid-leaching experiments were conducted on four pre-concentrated samples: A120–160, A200–250, B120–160, and B160–200. Table 1 presents the Li content in the raw ore samples before and after the acid leaching. The post-leaching Li concentrations exhibited significant depletion compared with the pretreatment values, which confirmed effective lithium mobilization. These results highlight the potential for enhancing the leaching efficiency through process parameter optimization. Figure 3 illustrates the Li leaching rates across samples, revealing substantial variability (66%–77%). Specifically, sample A200–250 achieved the maximum leaching rate (77%), while sample B160–200 showed the lowest efficiency (66%). This size- and sample-type-dependent leaching behavior underscored the critical roles of particle characteristics. Notably, cross-referencing Table 1 revealed a counterintuitive relationship: despite A200–250’s superior leaching rate, its extraction yield was less than B120–160’s. This necessitated the dual optimization of the leaching efficiency and mass transfer dynamics in the process design. It is generally recognized that smaller particle sizes correspond to larger specific surface areas, exposing more surface area to the leaching medium and thereby promoting element dissolution. Additionally, a reduced particle size shortens the diffusion path from the particle interior to the surface, minimizing the diffusion resistance. However, this conclusion only considers the direct impact of particle size on leaching while overlooking the influence of mineralogical properties. Variations in the element occurrence states also significantly affect the leaching efficiency. The higher leaching rate observed in B120–160 compared with B160–200 may be attributed to two factors: B120–160 contained more lithium, predominantly in easily leachable forms; for sample B, finer particles are more susceptible to passivation effects—smaller specific surface areas slow the reaction interface renewal, facilitating passivation layer formation.
Roasting, a thermal activation process, facilitates microstructural aggregate expansion, thereby liberating the encapsulated target-element-bearing minerals or transforming the Li-bearing phases into more soluble species. Despite its intended application as a pretreatment to enhance the Li extraction efficiency, roasting paradoxically induced a significant decline in the leaching rates. Samples A120–160, A200–250, B120–160, and B160–200 underwent roasting pretreatments. Table 1 shows that the post-acid-leaching lithium extraction rates generally decreased across these samples, with the leached lithium quantities significantly reduced.
In summary, the particle size critically governed the Li extraction efficiency from the Qaidam Basin clay lithium ores. Significant Li concentration disparities across the size fractions necessitated the dual evaluation of the leaching efficiency and extraction yield during the process design. The acid leaching achieved a moderate efficiency (~70%), yet roasting–acid leaching exhibited a drastic efficiency reduction (45.3% for B120–160). Decoupling the thermal-activation-induced encapsulation mechanisms represents a priority for further optimization.

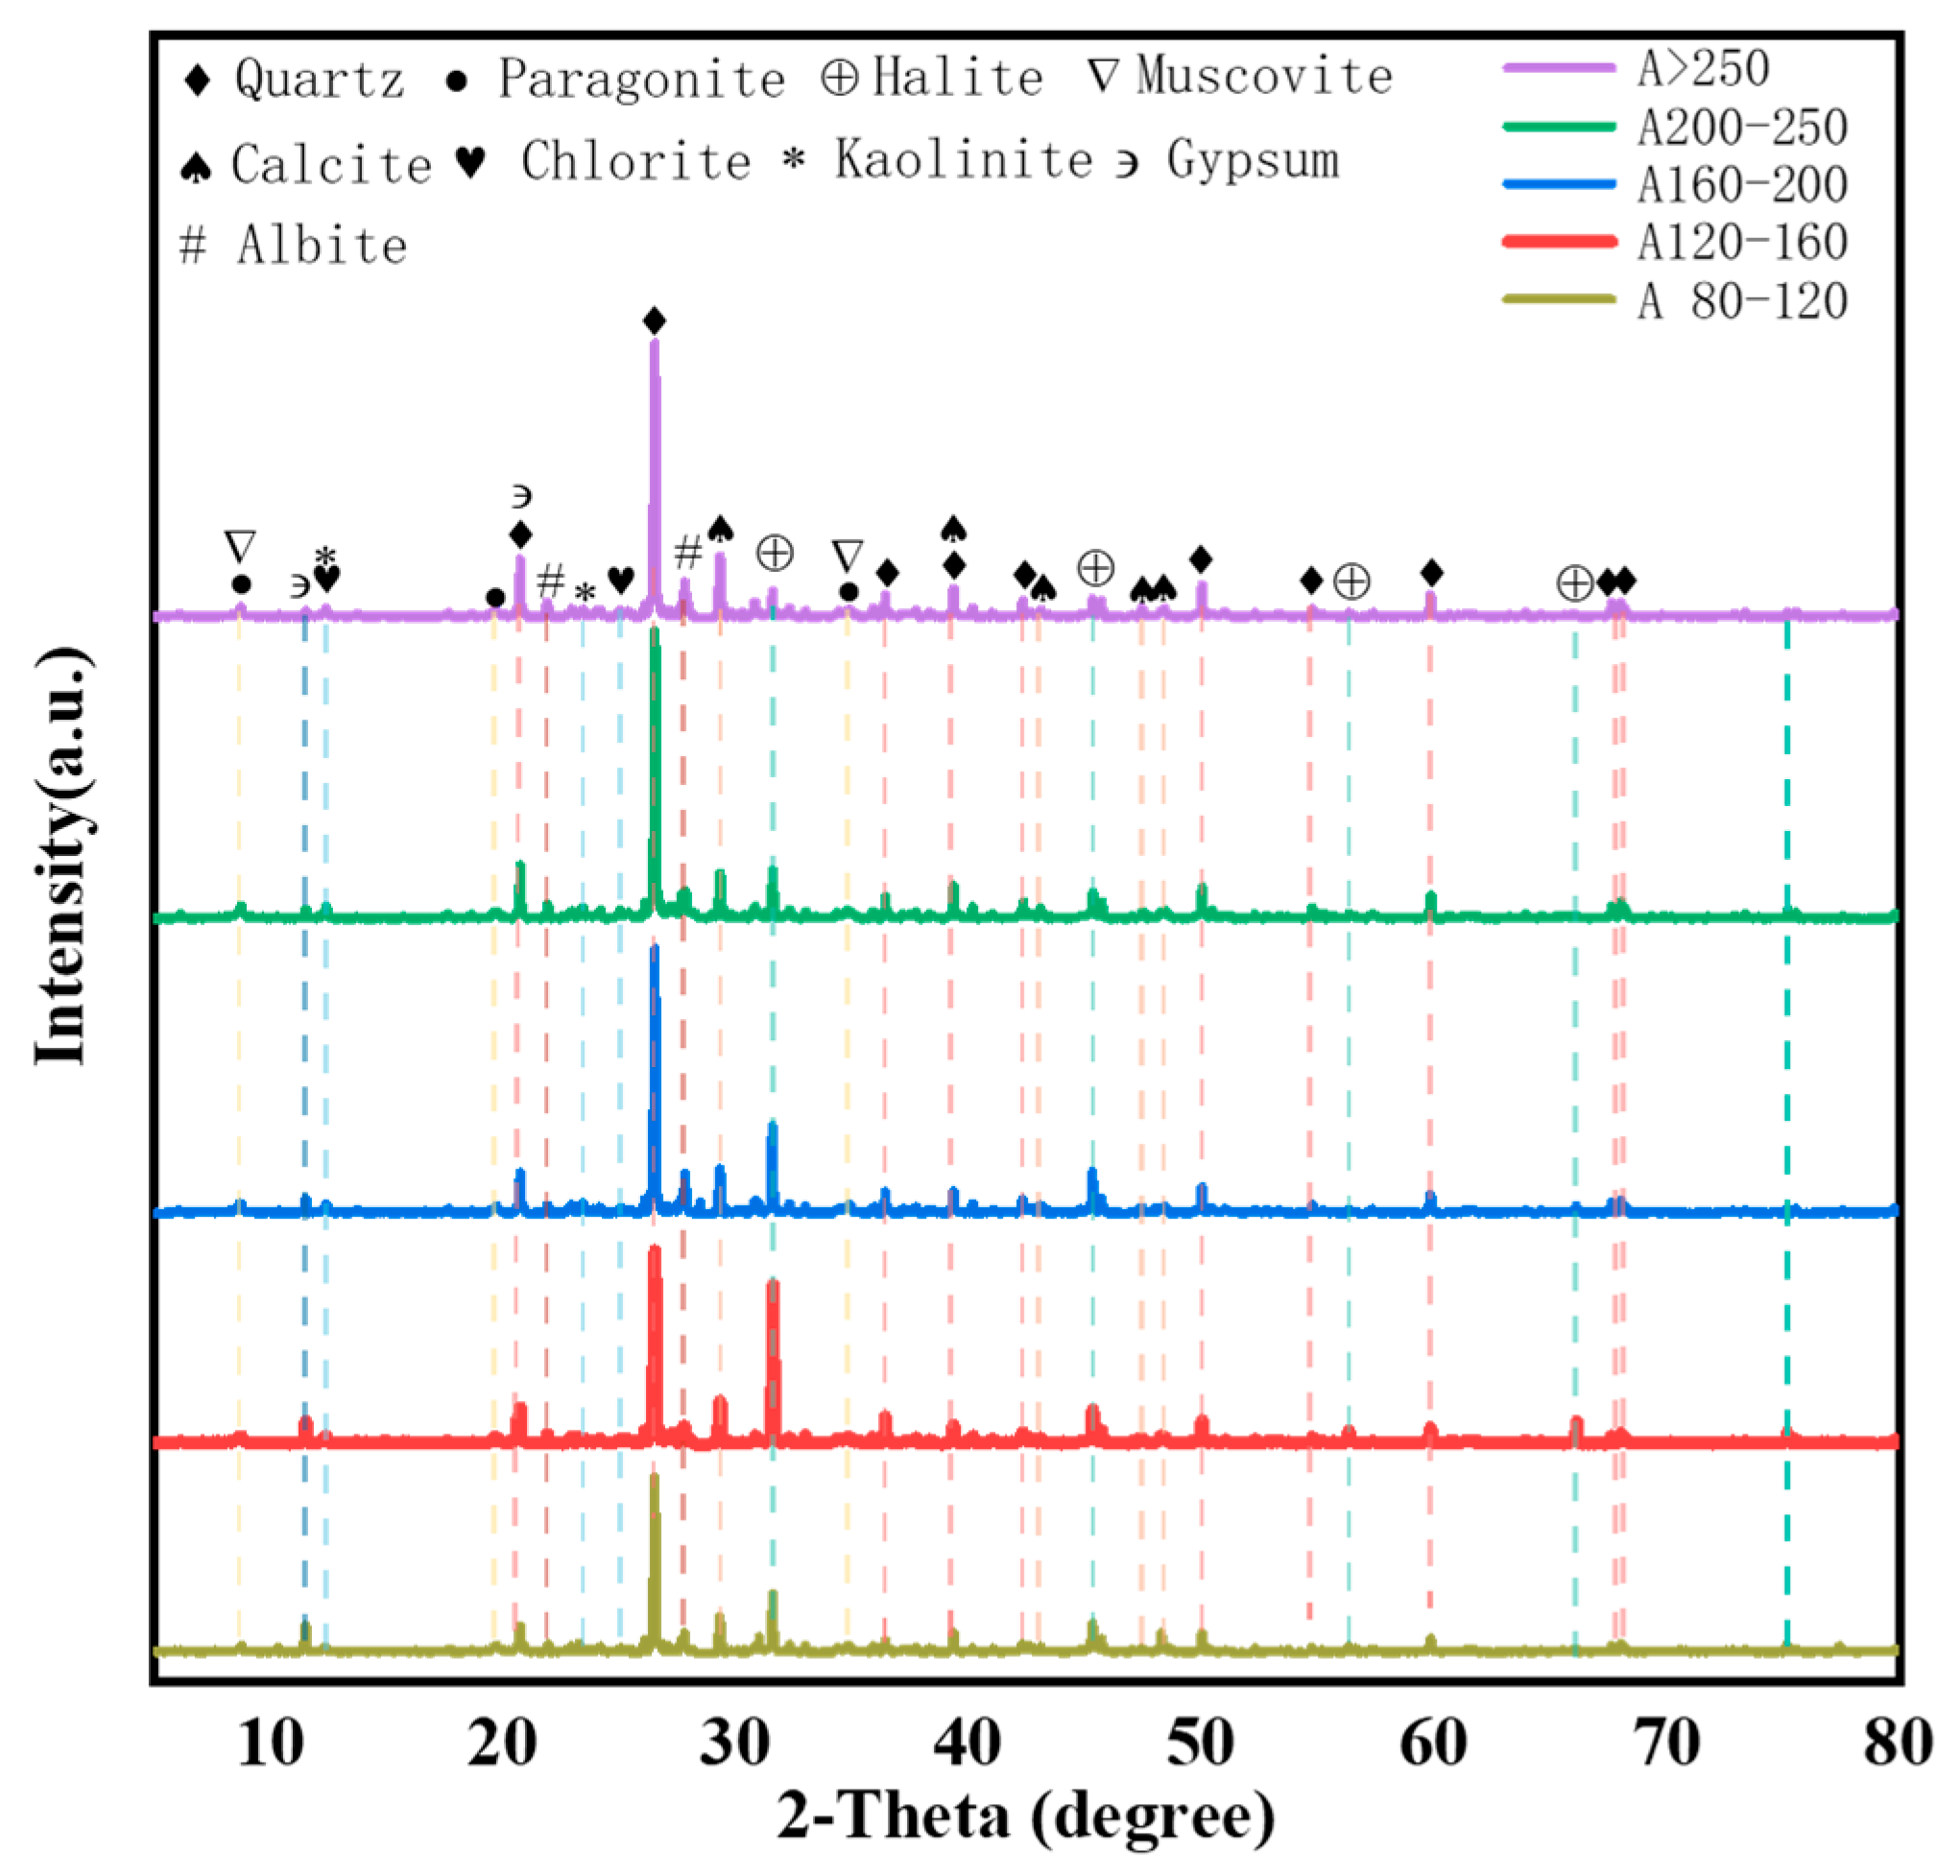
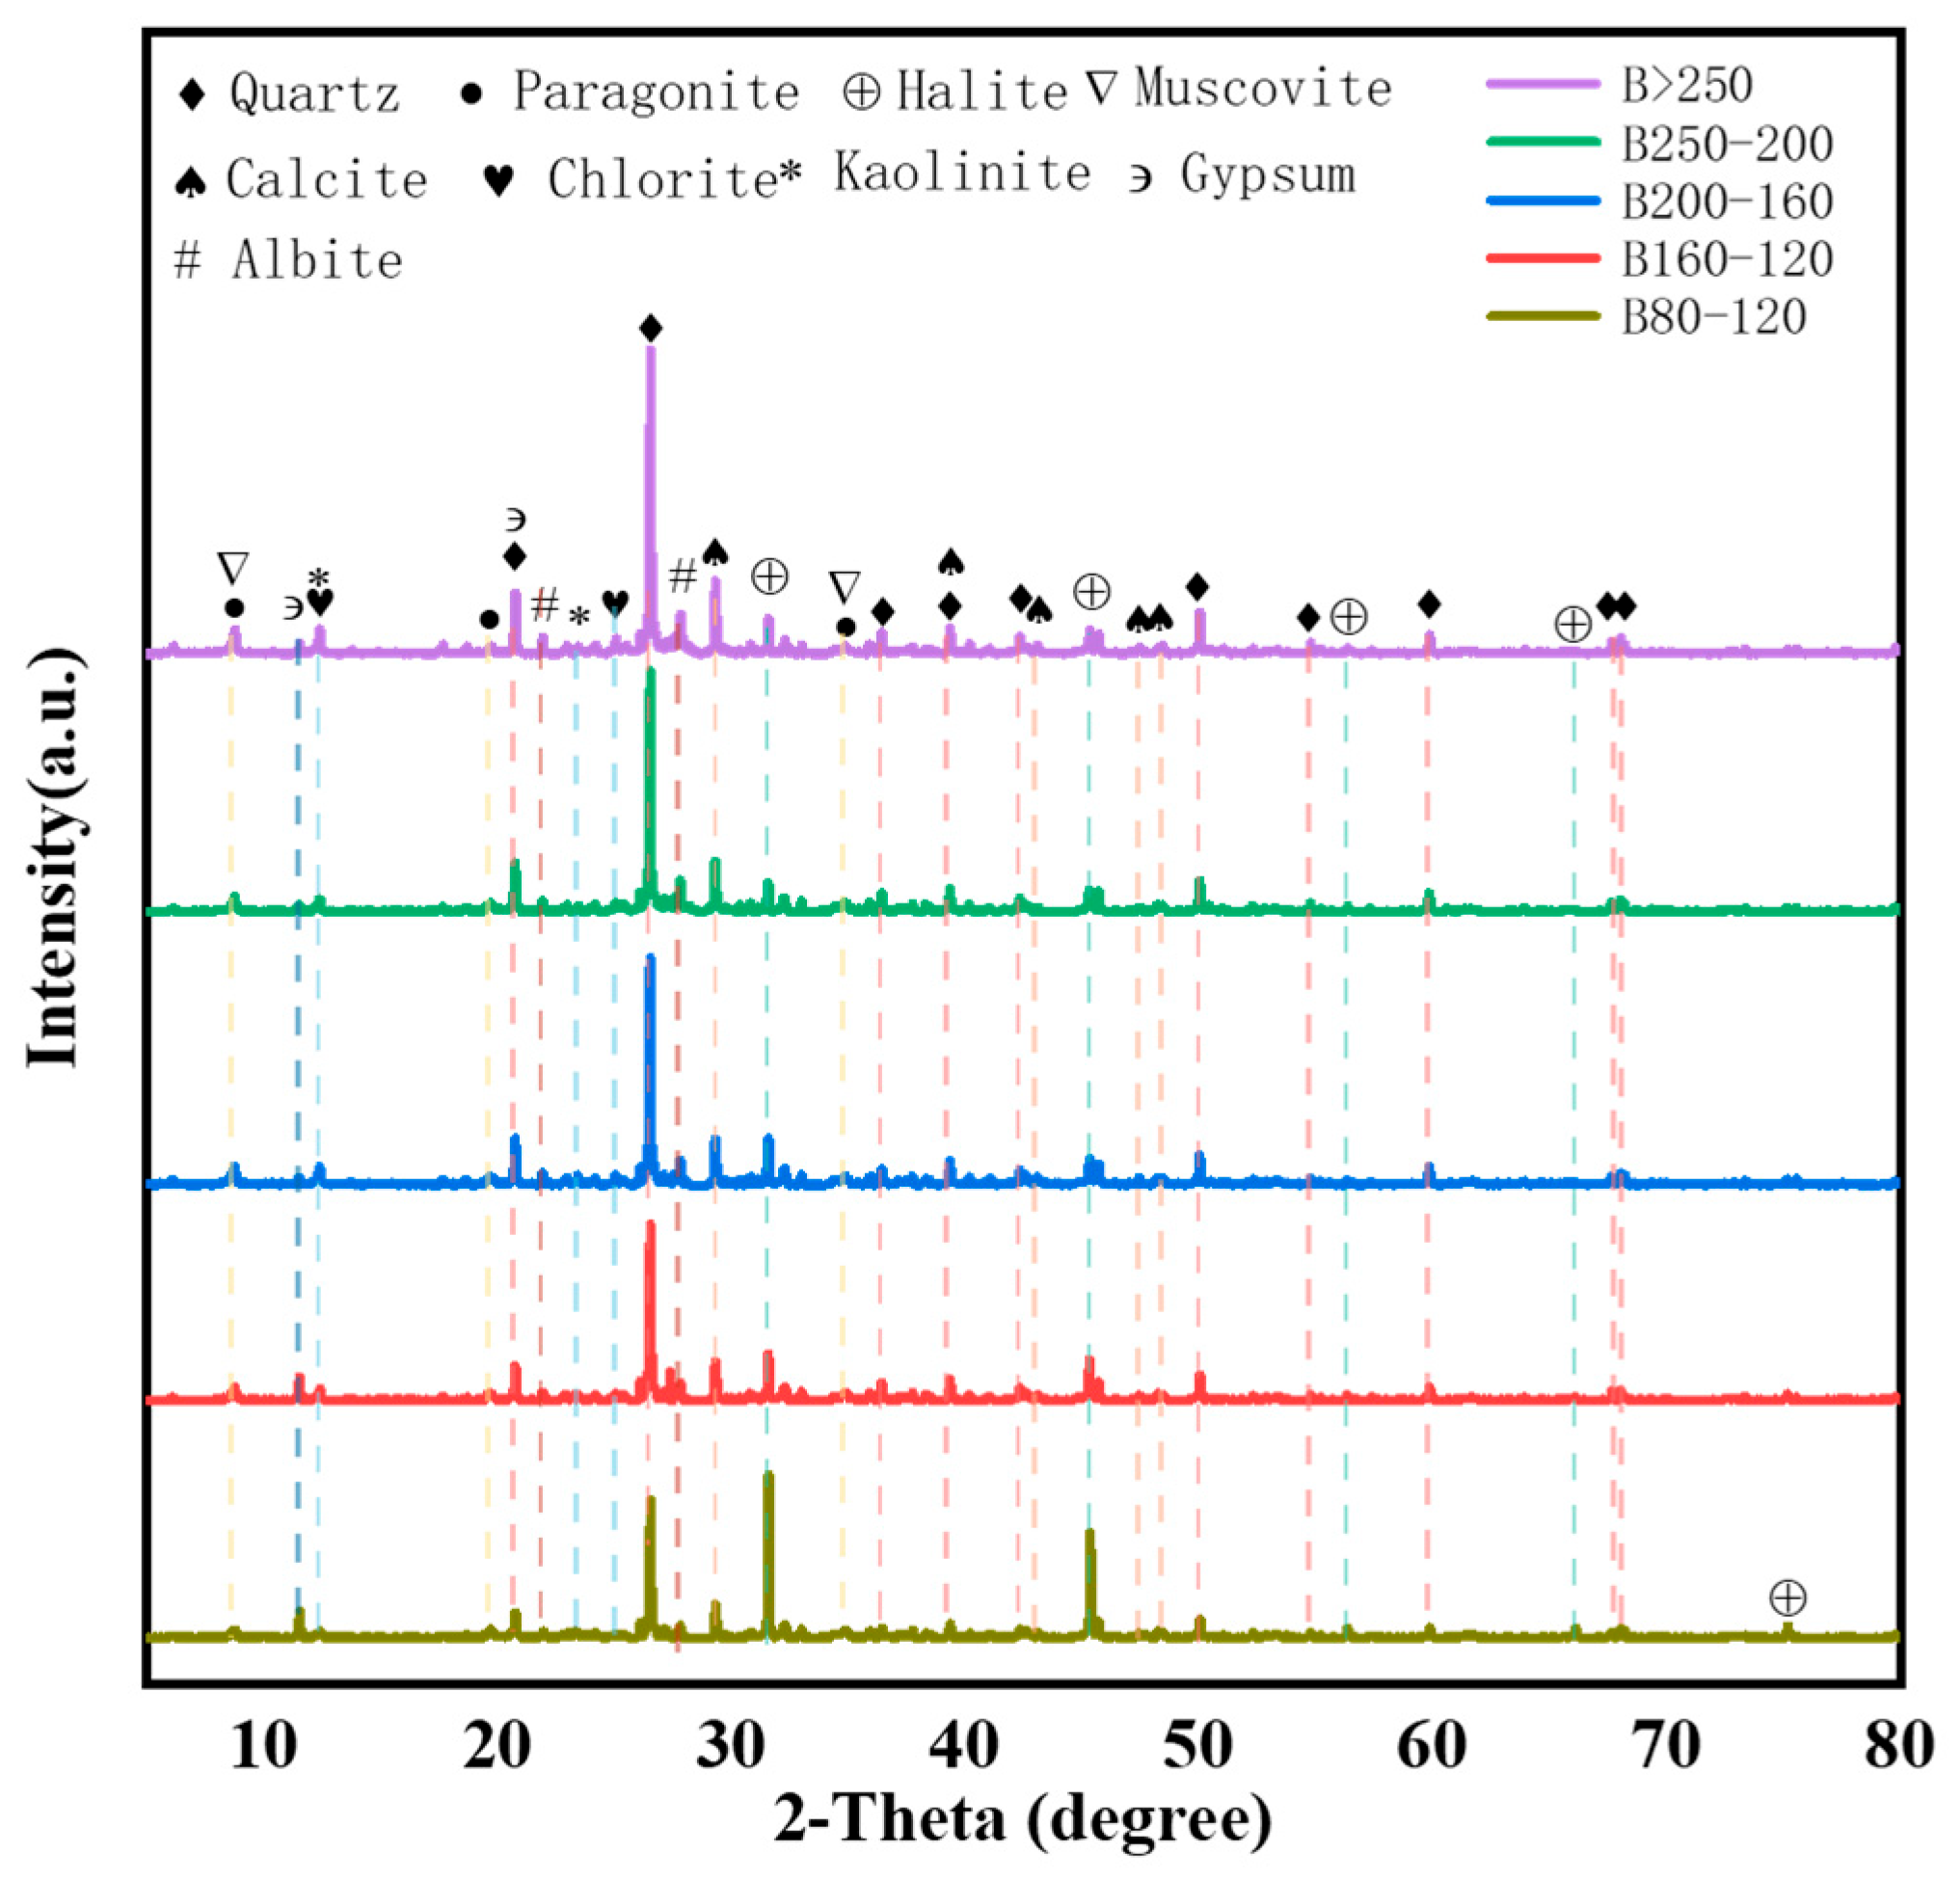
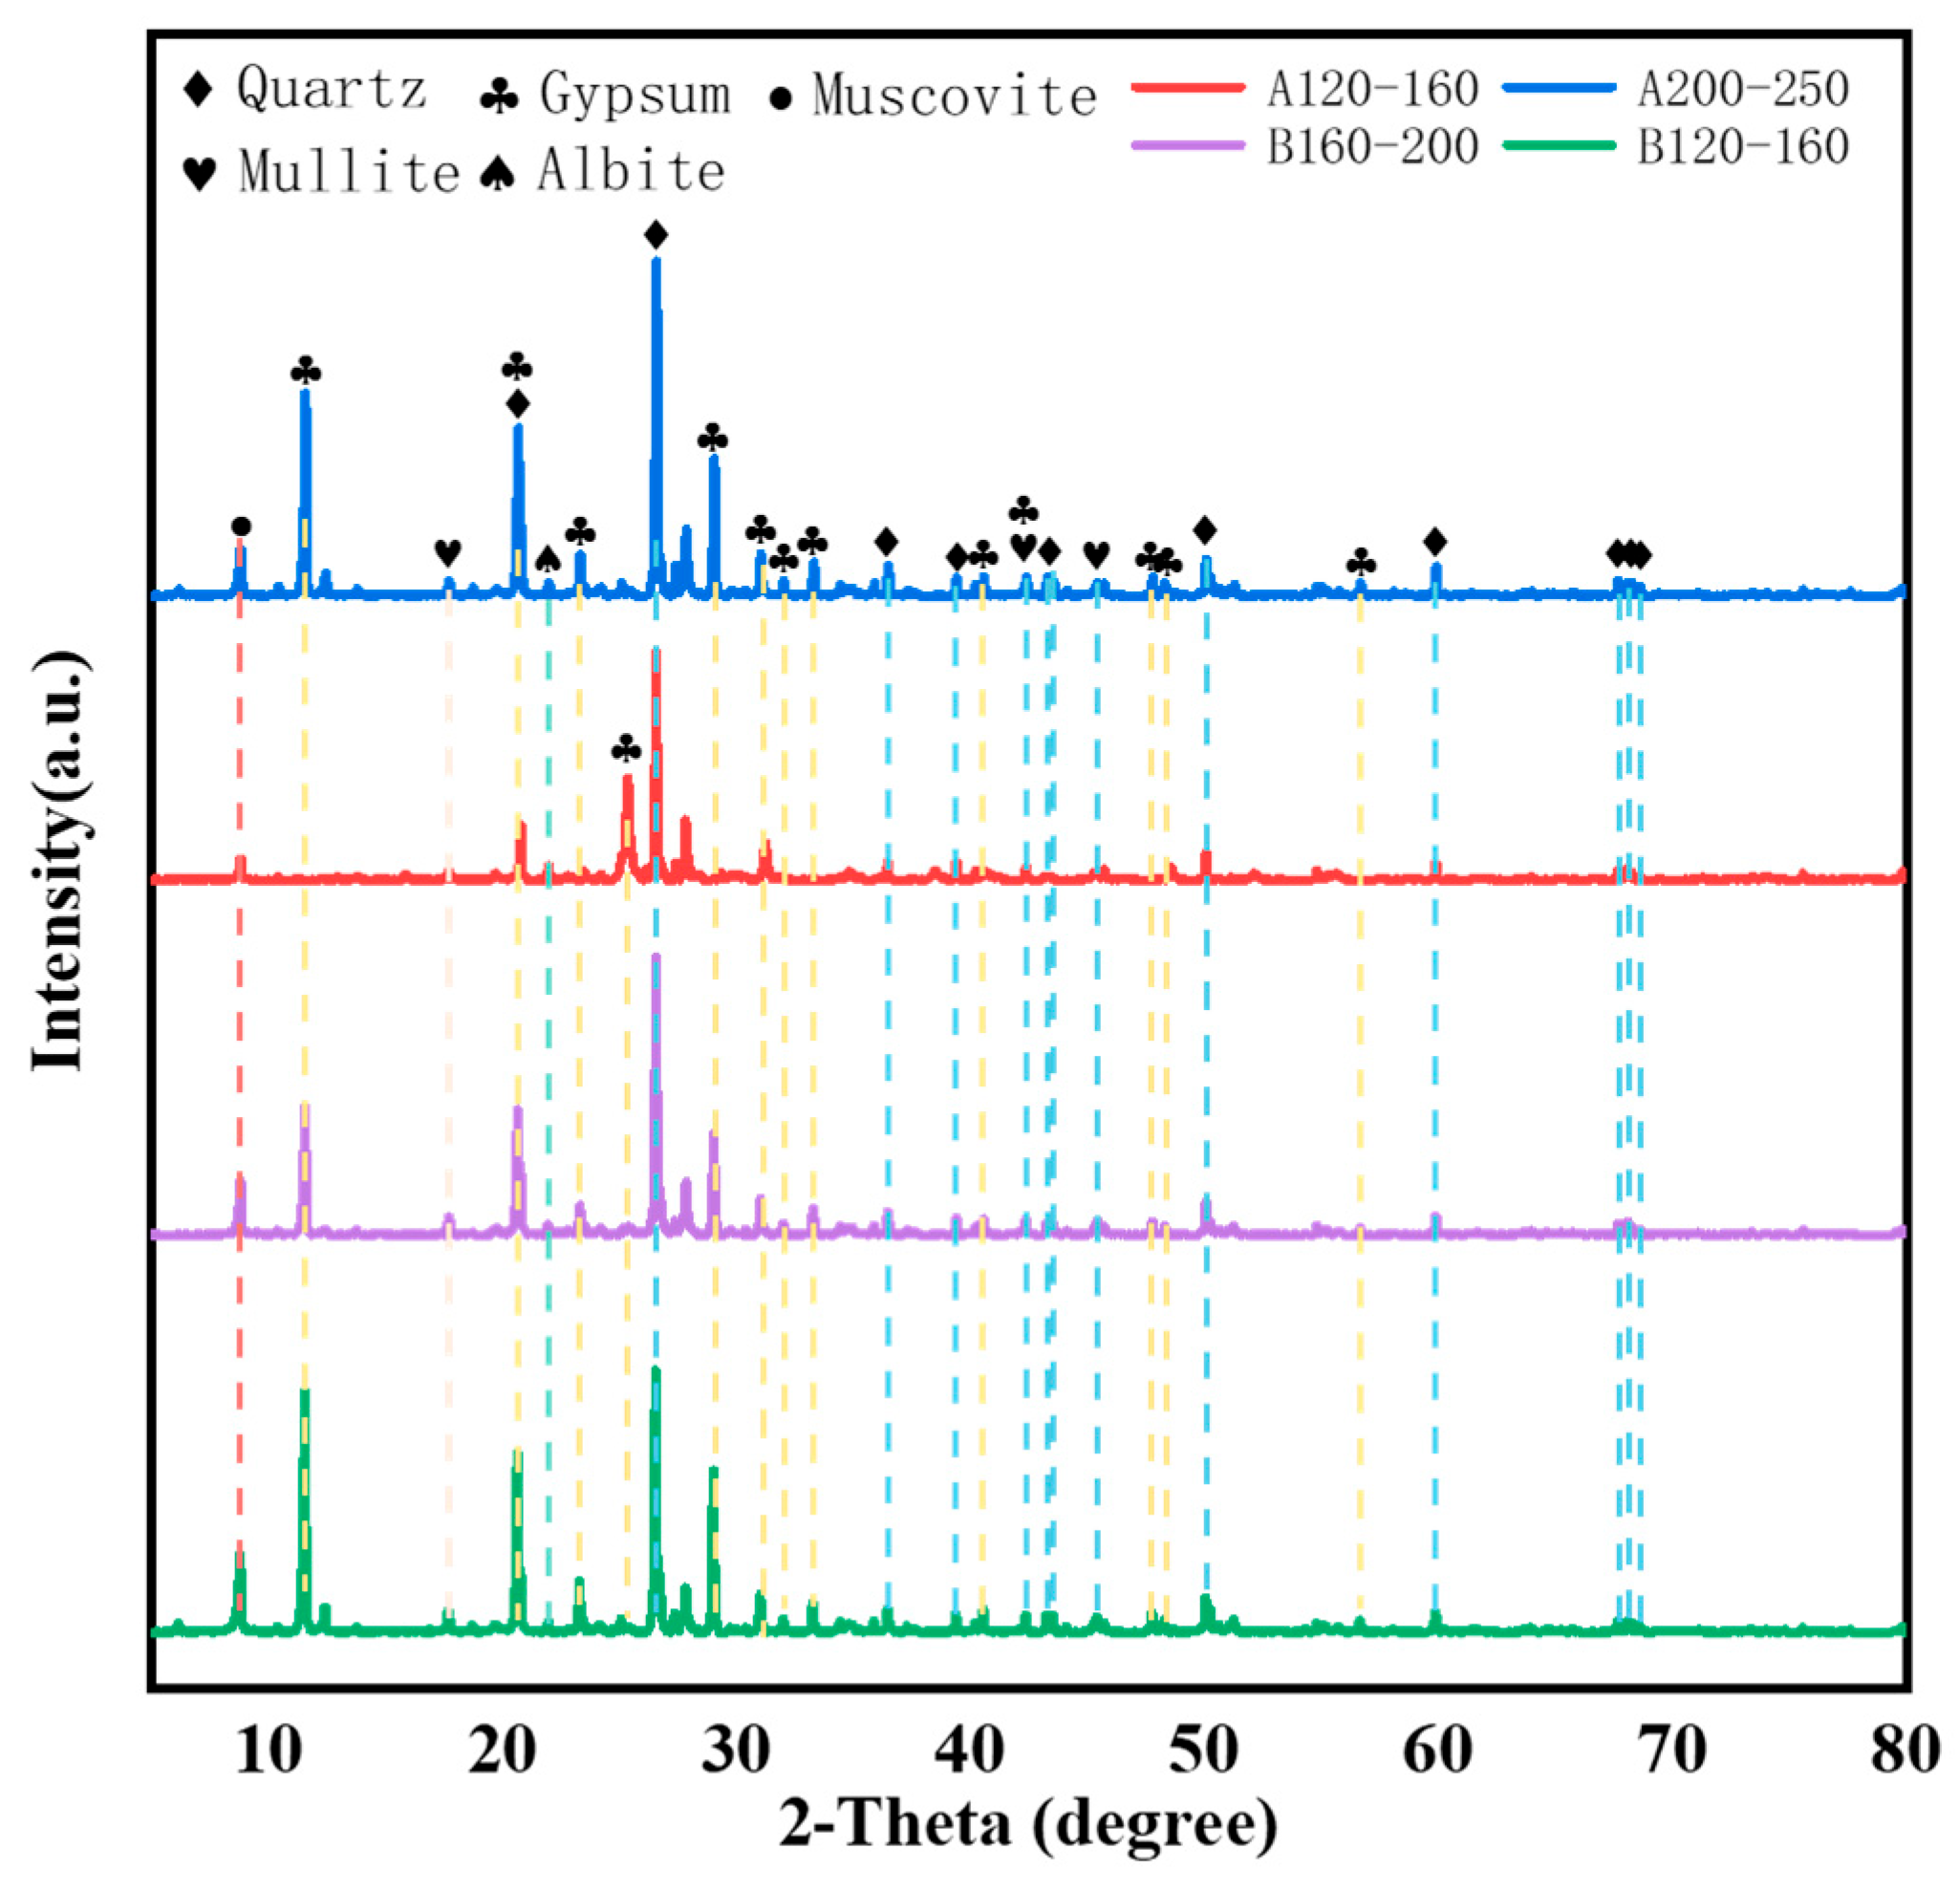
3.2. Mineral Phase Evolution During Acid-Leaching, Roasting, and Roasting–Acid-Leaching Processes

Through the XRD analysis of five particle size fractions from clay-type lithium ores from the Qaidam Basin dry salt lake, this study systematically investigated the size-dependent variations in the dominant mineral composition and content. By integrating the post-treatment mineralogical transformations (acid leaching/roasting), we elucidated the mechanistic correlations between the particle size distribution and lithium extraction efficiency, and thus, we established a scientific framework for designing optimized lithium recovery protocols.
The XRD analysis results of the particle size fractions in samples A and B (Figure 4 and Figure 5) demonstrate that both samples predominantly comprised quartz, albite, and mica assemblages with accessory calcite, halite, chlorite, and kaolinite, though no discrete lithium-bearing minerals were detected. The ICP-OES correlation suggests that Li+ ions were adsorbed within phyllosilicate interlayers via ion-exchange mechanisms. Quartz exhibited persistent high-intensity diffraction peaks across all particle sizes, which confirmed its structural stability as the dominant phase. Albite displayed significant size-dependent crystallinity variations: sample A’s fine fractions (>250 mesh) showed higher peak intensities than the coarse fractions, whereas sample B’s intensities were lower than A’s counterparts, which reflected divergent mineral sorting efficiencies. Mica and calcite exhibited fine-fraction (>250 μm) enrichment with progressive peak attenuation as the particle size increased—sample A’s fine-grained calcite peaks were stronger than for the coarse grains. The halite distributions differed markedly: the mid-fraction enrichment (120–200 mesh) in sample A contrasted with the coarse-fraction dominance (>160 mesh) in sample B. Chlorite and kaolinite preferentially concentrated in the mid-fine fractions (160–250 mesh), where their characteristic peaks intensified compared with the coarse fractions. A comparative analysis revealed analogous mineral distribution patterns but distinct compositional disparities: the albite content in sample A exceeded that in sample B, and sample B’s fine-fraction feldspar peaks (B > 250, B250–200) remained weaker than A’s equivalents, indicating texture-dependent crystallinity degradation.
Post-acid leaching, the mineral compositions exhibited marked transformations across the particle size fractions (Figure 6). The quartz maintained prominent diffraction peaks in all fractions, which confirmed exceptional acid resistance. The mica phase attenuation in the residues suggests partial dissolution or mineralogical reconstitution during leaching. The albite persistence with reduced peak intensities indicates moderate reactivity under acidic conditions. Notably, mullite emerged as a neo-formed phase, likely from the mineral phase transformation or secondary crystallization. The localized gypsum precipitation (<160 mesh) implies sulfate–calcium interactions during leaching. Distinctive depletion patterns were observed: complete dissolution of halite (water-soluble) and calcite (H2SO4-reactive); progressive attenuation of chlorite/kaolinite peaks, which correlated directly with the Li leaching efficiency; and structural collapse signatures in phyllosilicates, which imply potential Li encapsulation within chlorite–kaolinite frameworks.
Post-roasting, the mineral compositions underwent further phase transformations across the particle size fractions. The XRD patterns of roasted products (Figure 7) reveal the following: quartz retention: stable diffraction peaks confirmed thermal resilience; feldspar persistence: reduced peak intensities suggest partial melting/phase transition; muscovite attenuation: weakened peaks indicate dehydration/lattice reorganization; and accessory mineral depletion: halite, calcite, chlorite, kaolinite, and gypsum exhibited peak attenuation or disappearance. Figure 8 demonstrates the mineral phase distribution across the various size fractions following the roasting–acid-leaching treatment. The quartz characteristic peaks persisted across all the samples but displayed a notably higher intensity in sample A. Concurrently, distinct gypsum diffraction peaks emerged, which confirmed the post-treatment gypsum formation. The mineral assemblage underwent significant transformations: the dolomite phases completely disappeared while new biotite phases formed. However, albite variants maintained a stable presence, as evidenced by their persistent diffraction signatures. Notably, compared with the solely roasted samples, this combined process achieved complete carbonate dissolution and exhibited mica formation patterns that showed a comparable phase evolution to standard acid-leaching outcomes.
In summary, the primary mineral phases identified in the raw ore were quartz, feldspar, mica, halite, calcite, and chlorite. Notably, chlorite and kaolinite exhibited relatively strong characteristic diffraction intensities within the medium-grained fraction. The acid-leaching and roasting treatments significantly altered the mineralogical composition. A distinct mullite phase emerged in the acid-leached residues, while the characteristic peaks corresponding to chlorite, kaolinite, calcite, and halite showed marked attenuation or complete disappearance following the acid treatment. A comparative analysis with the raw ore revealed a substantial reduction in or elimination of characteristic diffraction peaks for halite, calcite, chlorite, kaolinite, and gypsum after the processing.

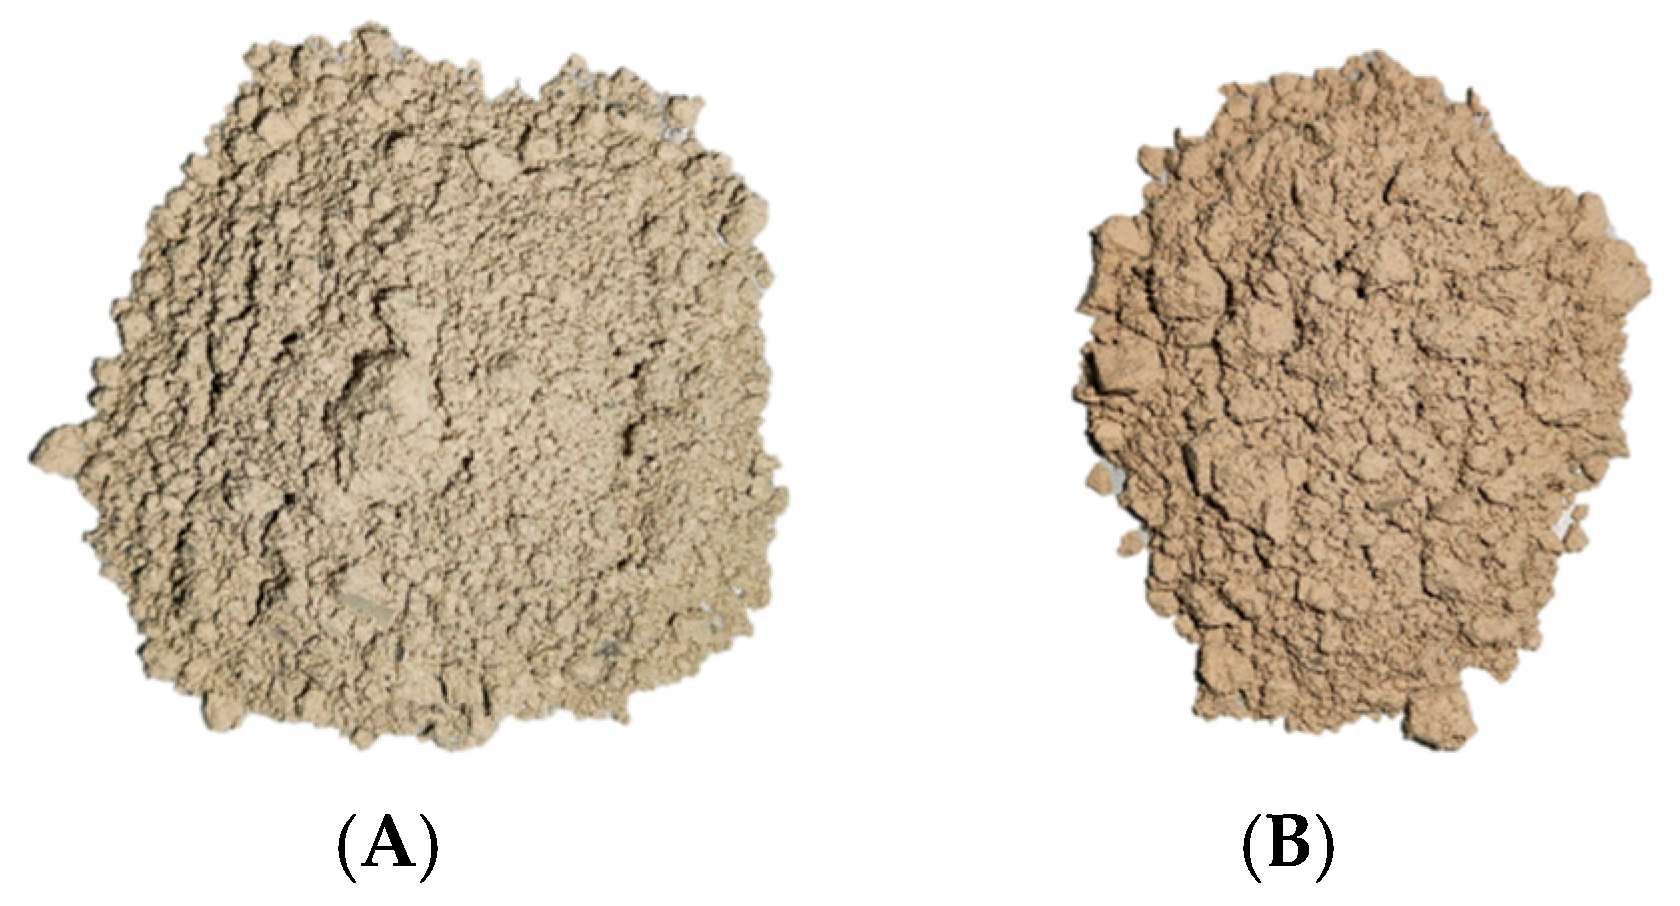
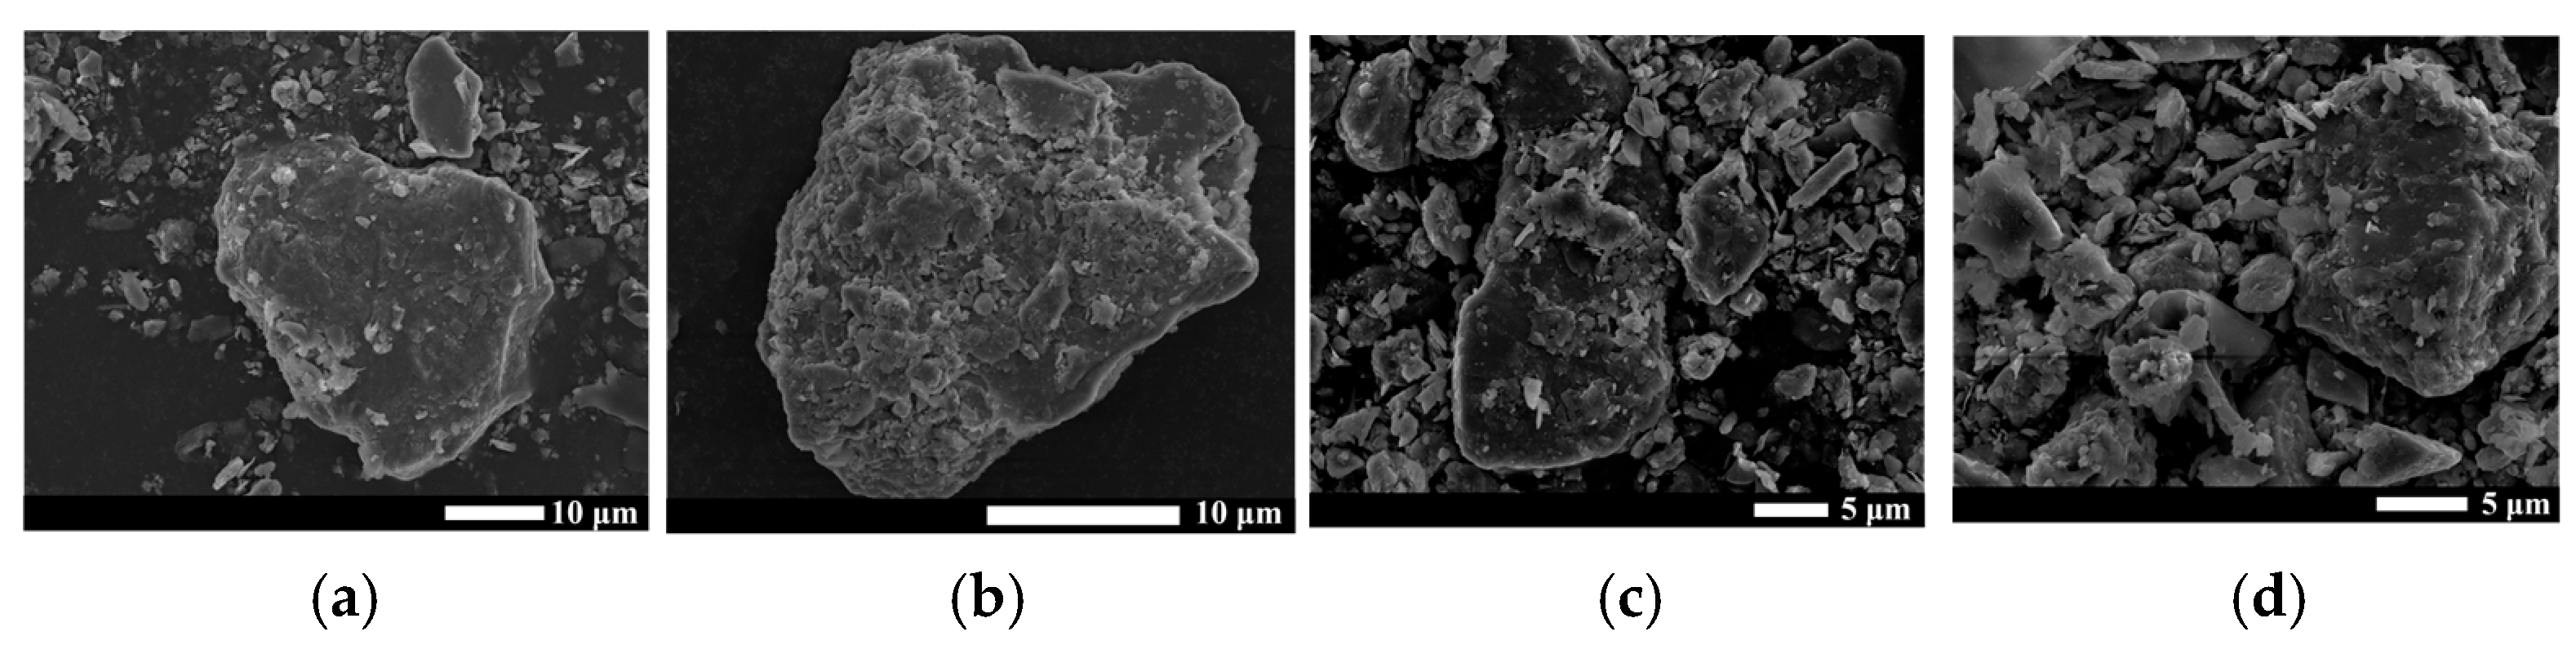
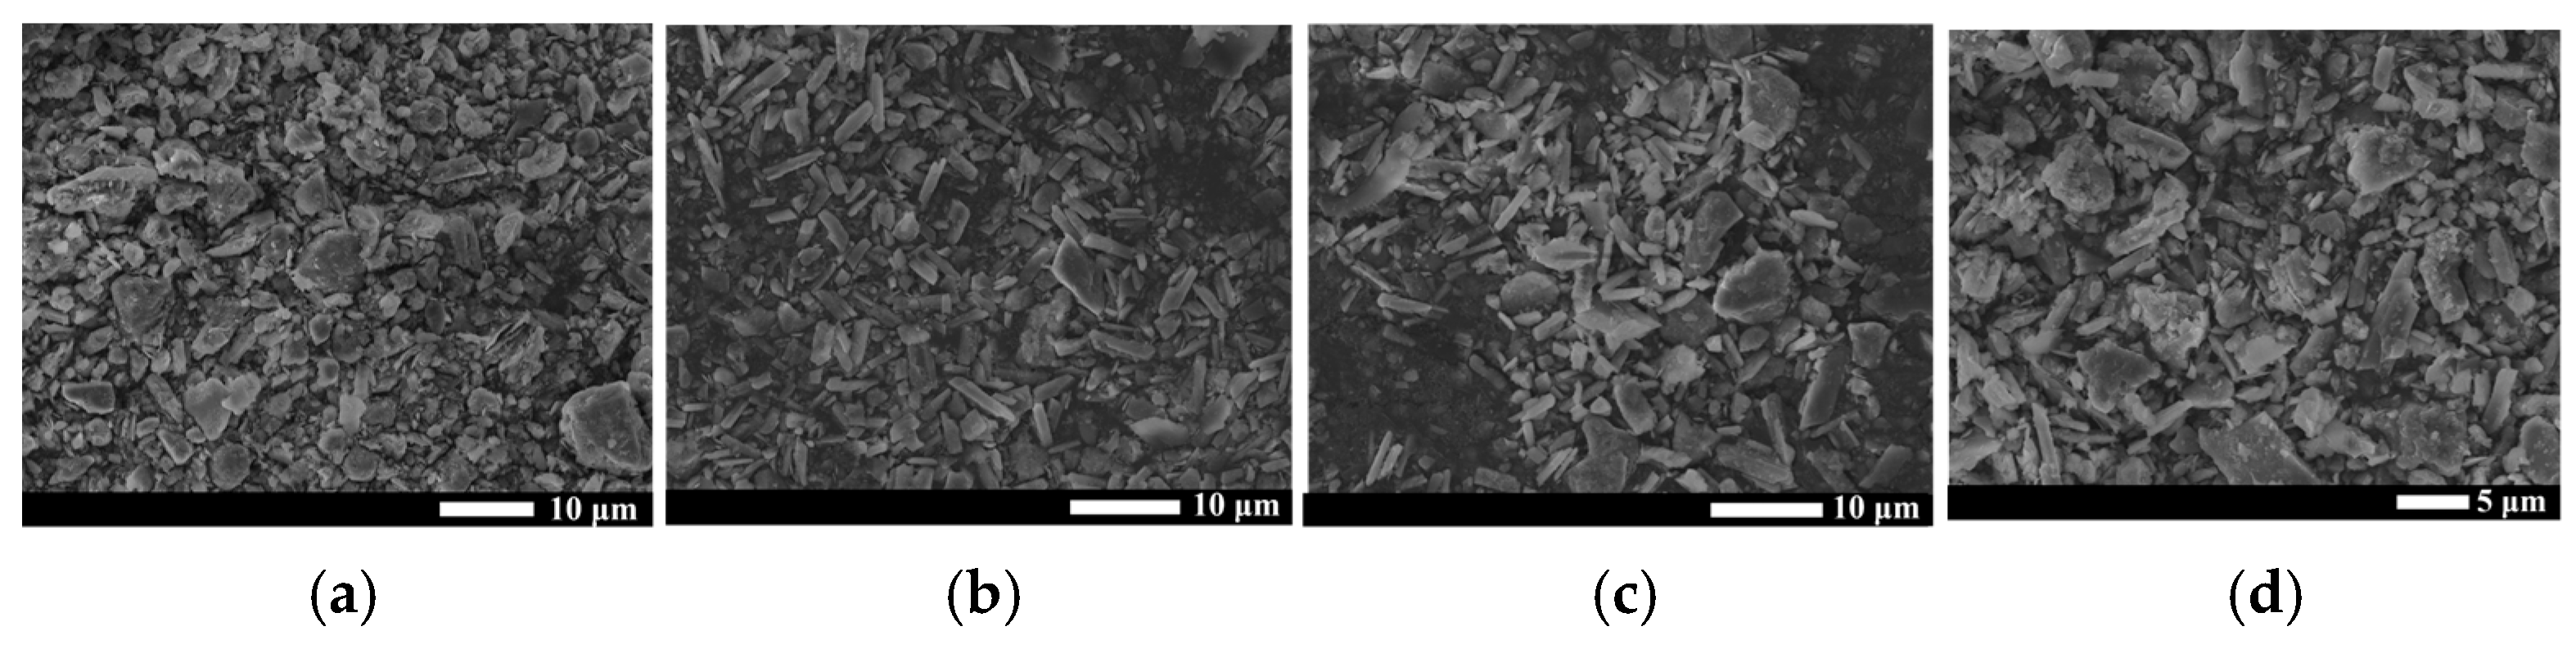
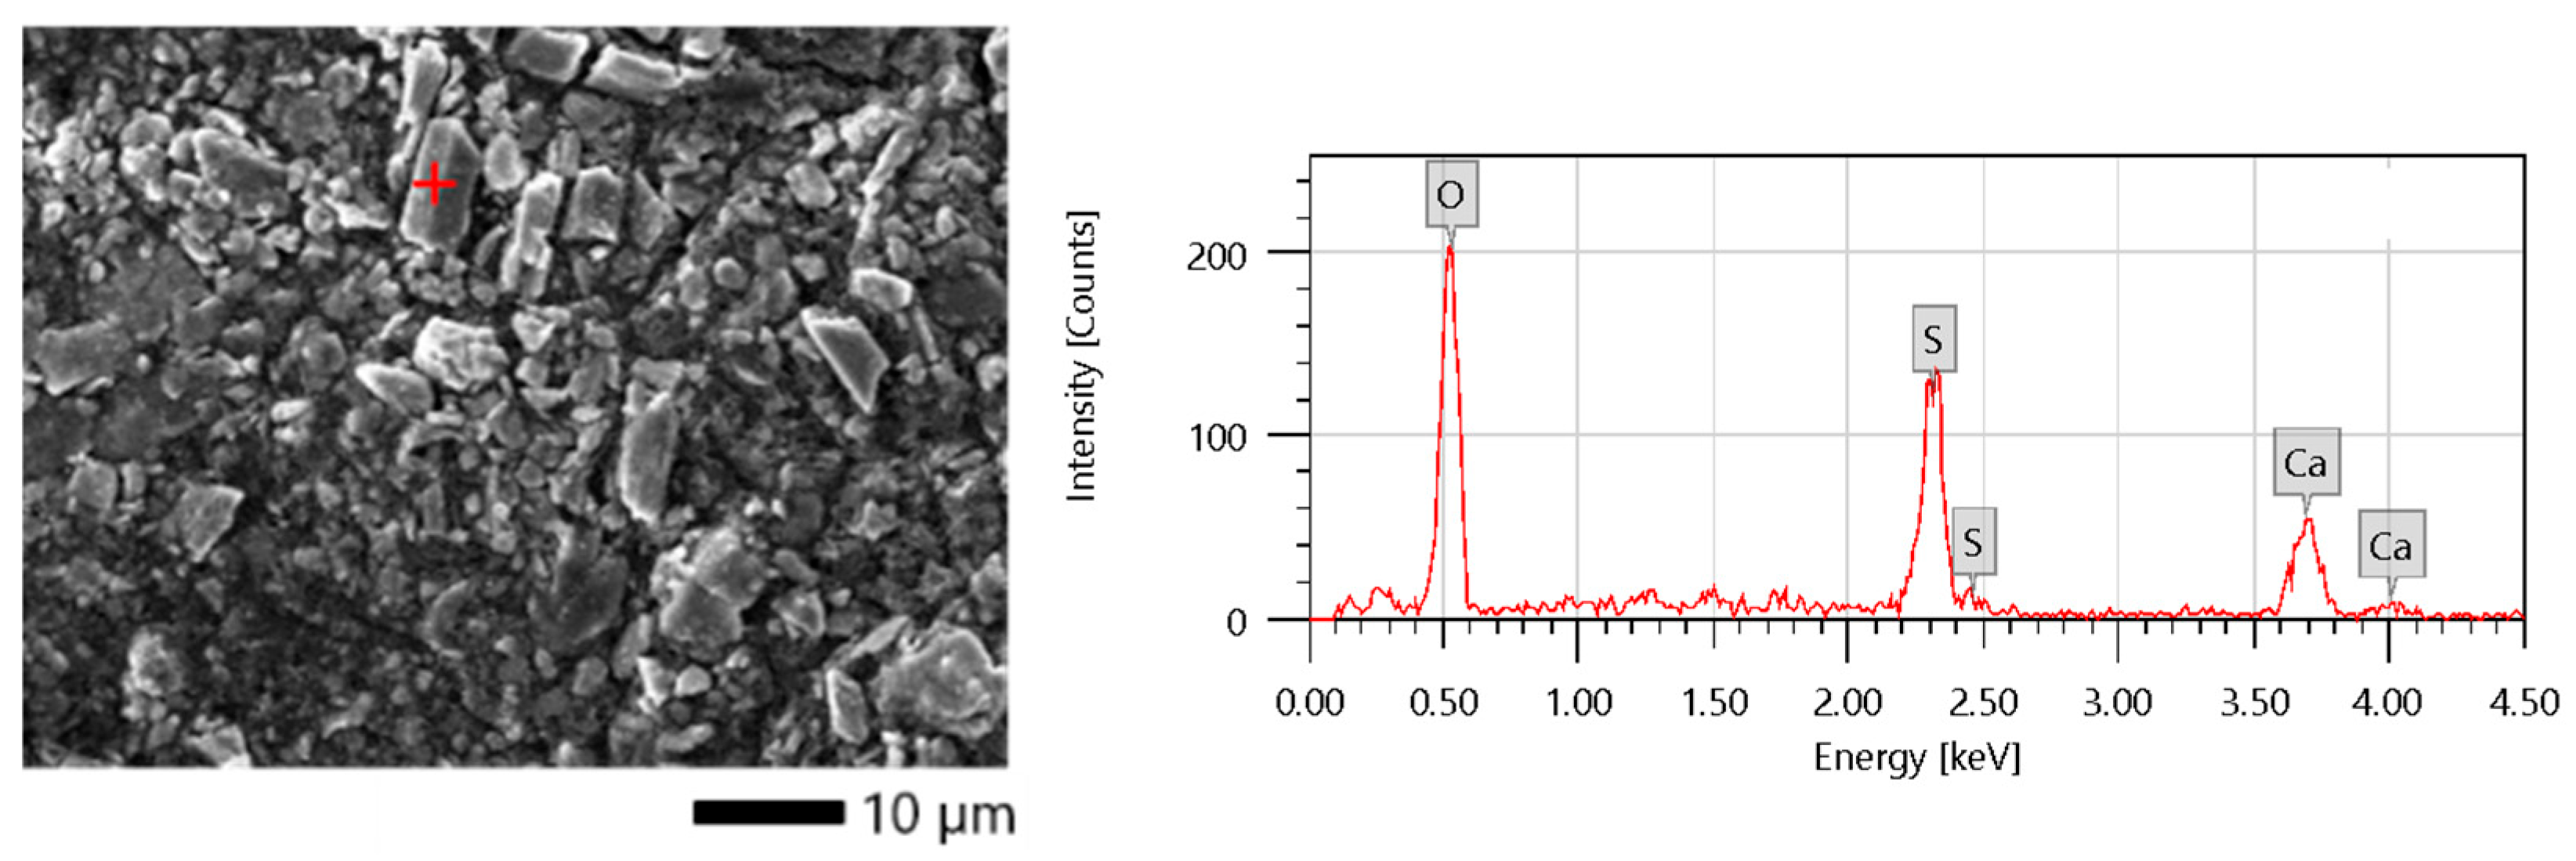
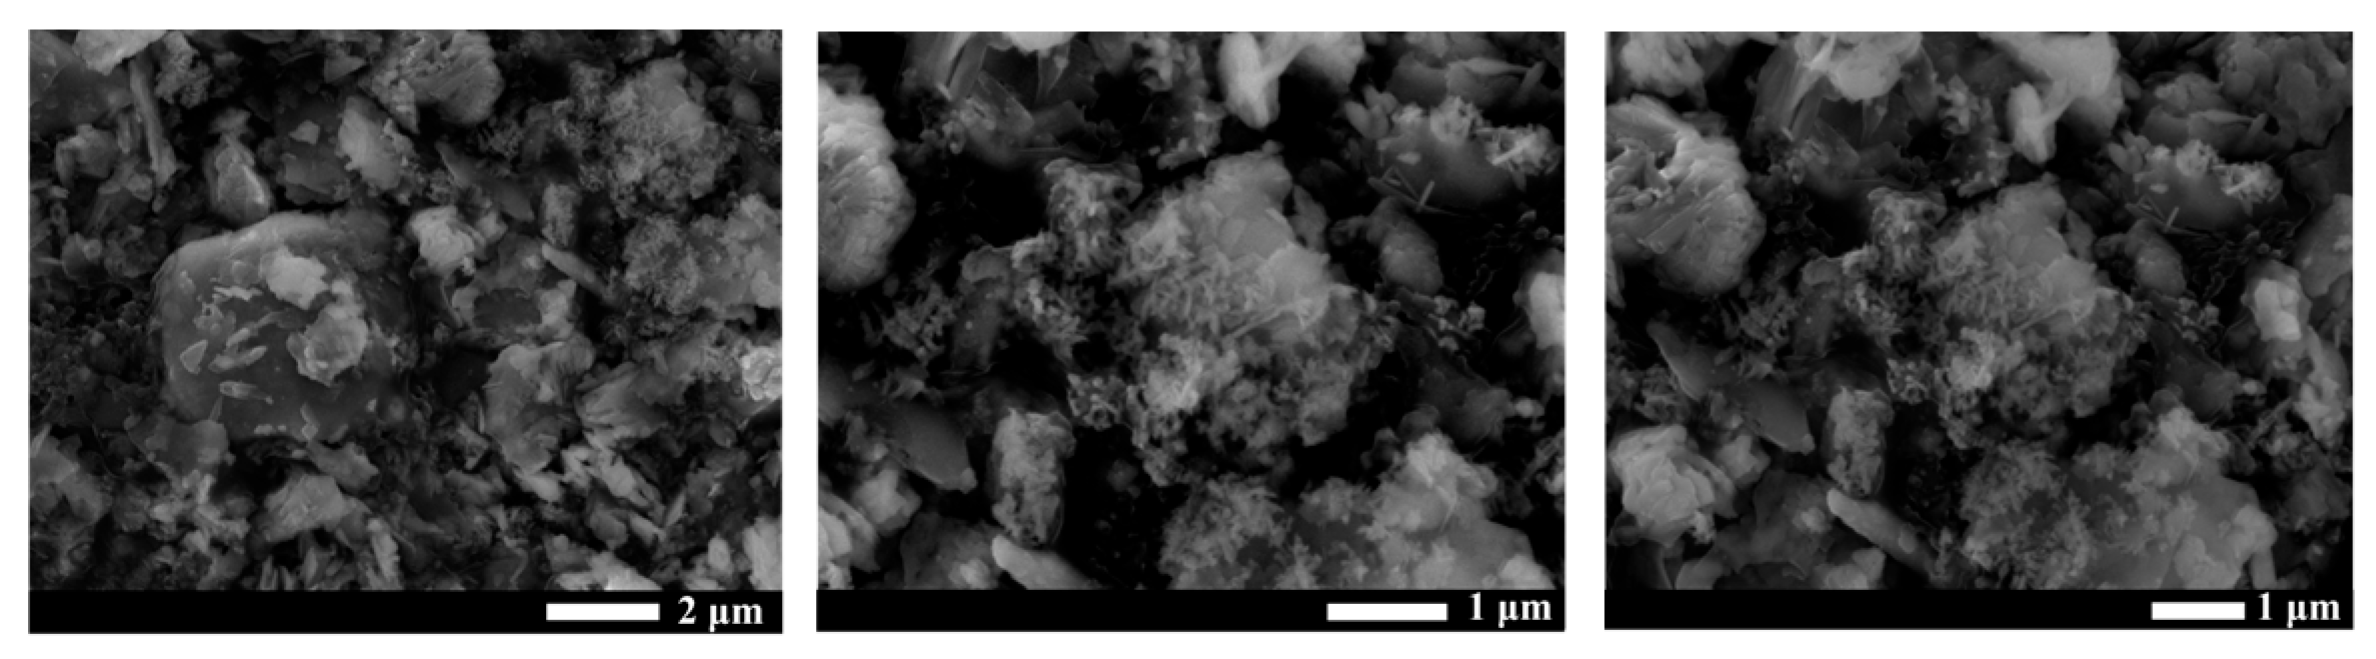
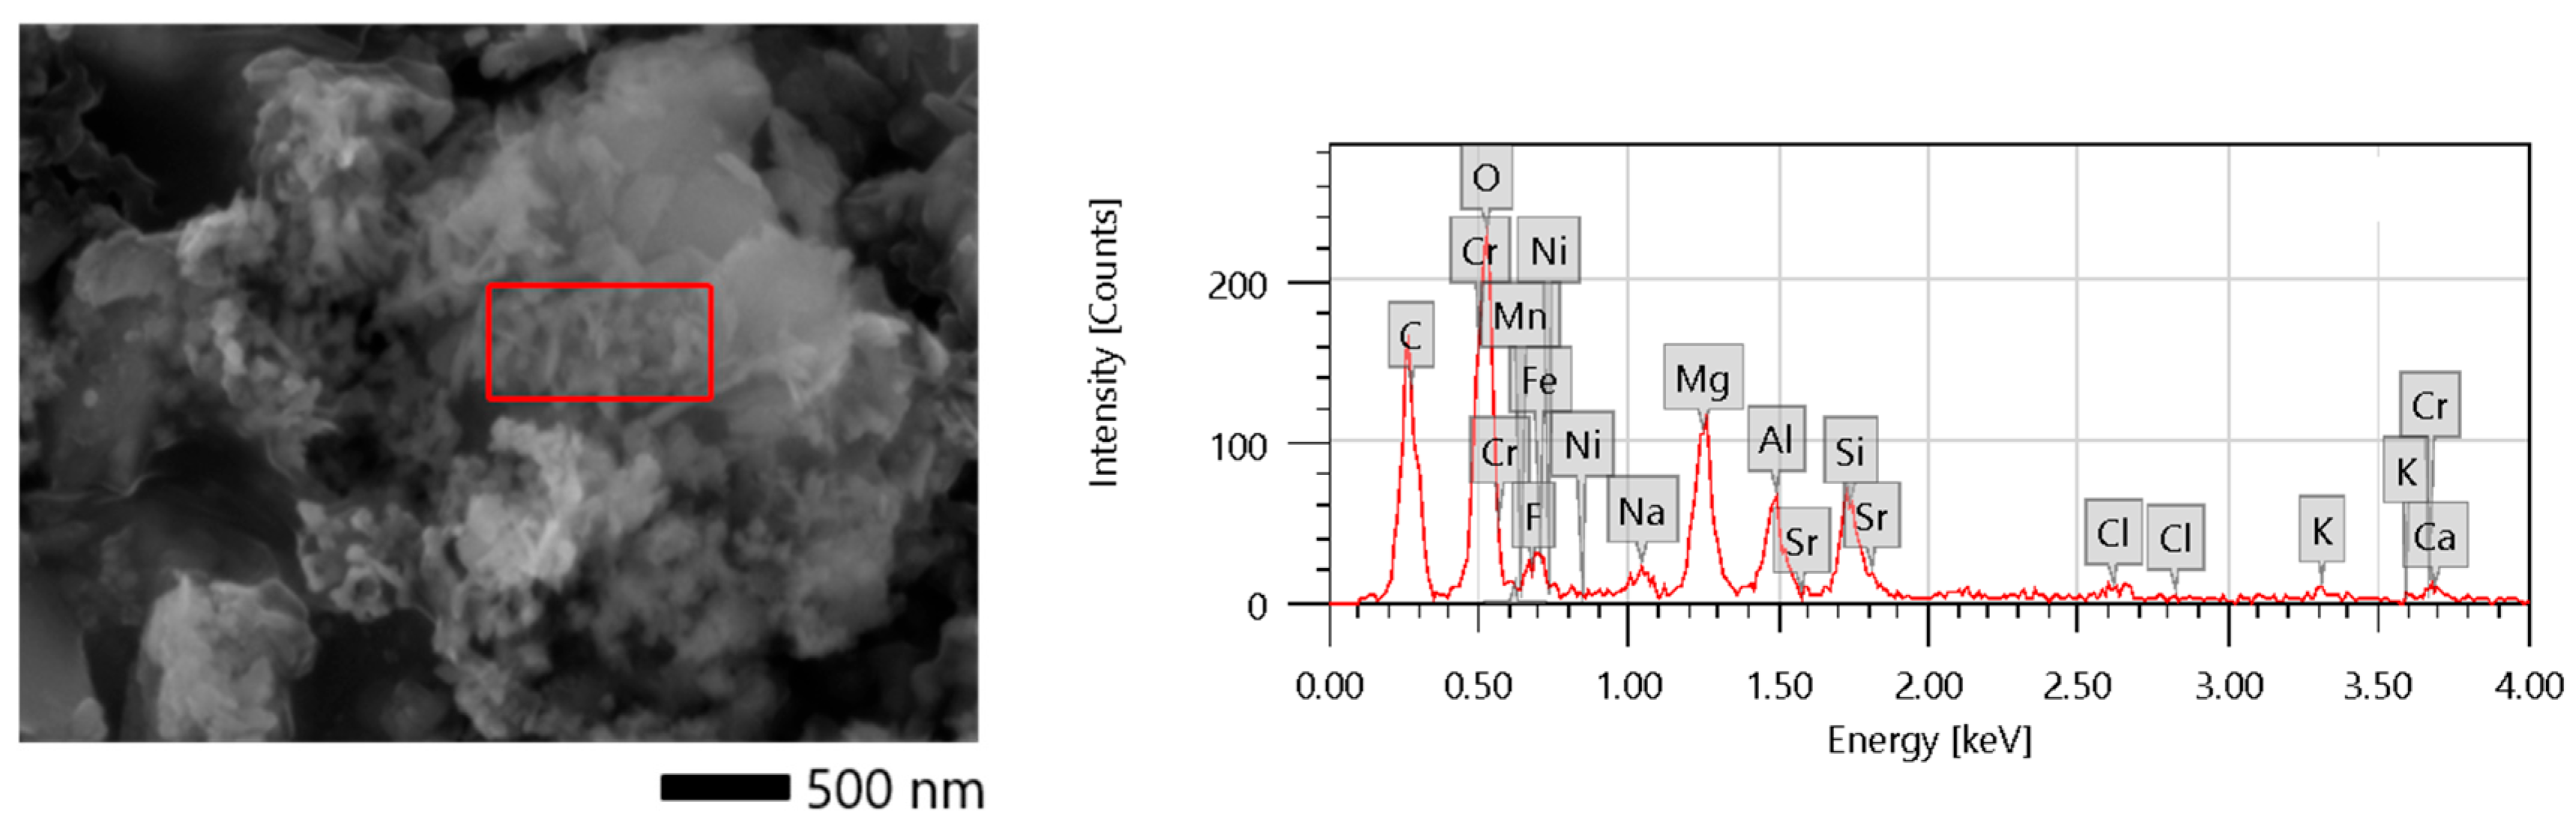
3.3. The Morphological Transformation Pattern Observed During the Acid-Leaching, Roasting, and Combined Roasting–Acid-Leaching Processes

The microstructural features and elemental constituents of the raw ore, acid-leached residue, roasted sample, and roasting–acid-leached sample were subjected to systematic characterization using SEM (scanning electron microscopy) and EDS (energy-dispersive spectroscopy).
Figure 9 displays the hierarchical structural features of raw ore under progressively increasing magnification (left to right); the low-magnification field reveals irregular block matrices with micron-scale particulates, while the high-resolution imaging resolves distinct scale-like and rod-like morphologies. Layered/sheet silicate mineral configurations aligned with the observed structural patterns. Notably, the reduced particle size correlated with the enhanced surface area, which facilitated increased reactive site availability for improved lithium leaching efficiency.
Figure 10 presents the SEM micrographs of the acid-leached residues stratified by particle size (A120–160, A200–250, B120–160, B160–200). The comparative analysis revealed that rod-shaped morphologies (~10 μm length) dominated in the acid-treated specimens versus the raw ore, as shown in Figure 11. As demonstrated in Table 2, the EDS quantification identified O (67.23 at%), S (18.48 at%), and Ca (14.28 at%) as the primary constituents, which concurred with the XRD-derived calcium sulfate identification (Figure 7). For the A120–160 specimen, lamellar structures with surface roughening and localized exfoliation evidenced progressive mineral dissolution. The finer-grained A200–250 counterparts exhibited enhanced structural definition with pronounced delamination, which correlated with the elevated lithium extraction efficiency in the smaller particles. Analogous trends manifested in the B120–160 and B160–200 fractions.
Figure 12 presents the SEM micrographs of roasted specimens stratified by granulometry (A120–160, A200–250, B120–160, B160–200). Post-roasting, the ore underwent substantial microstructural reorganization. The high-magnification examination (Figure 13) revealed localized particle agglomeration on roasted surfaces. Figure 14 and Table 3 delineate the agglomerated roasted particles with the associated EDS spectra and elemental quantification: the amorphous aggregation patterns exhibited C (25.45 mass%, 40.35 at%), O (28.81 mass%, 34.29 at%), and F (1.38 mass%, 1.38 at%). This compositional profile suggests carbonaceous residues (lithium-bearing/impurity phases) in the roasted samples. Multifaceted mineralogical reactions during the roasting yielded neo-phases that exhibited lithium encapsulation effects, which compromised the leaching accessibility during the acid treatment.
Figure 15 displays the SEM microstructural evolution of the roasted–acid-leached specimens. A comparative analysis with the roasted-only samples revealed enhanced surface porosity and localized acid-etched signatures, which demonstrated the acid treatment’s selective dissolution efficacy on the roasted matrices. Contrastingly, the unroasted acid residues exhibited superior structural porosity and reactivity, whereas the roasted–leached specimens displayed structural densification with diminished reactive interfaces. The mineralogical complexity and phase consolidation during the roasting impeded the lithium liberation through acid solution permeation barriers. Additionally, the rod-shaped crystalline phases and calcium sulfate deposits showed marked depletion.
In summary, distinctive scale-like and rod-shaped structural features were observed in the raw ore, while the silicate minerals primarily exhibited layered structures with scaly morphologies, which further confirmed the substantial presence of silicate minerals. Post-acid leaching, a significant number of regular rod-shaped structures emerged, which were chemically identified as calcium sulfate through phase characterization. The roasting induced mineralogical reorganization and microstructural alterations, which yielded complex mineral phases with agglomerated morphologies. These neo-formed phases demonstrated lithium encapsulation effects, which diminished the acid-leaching process efficiency.

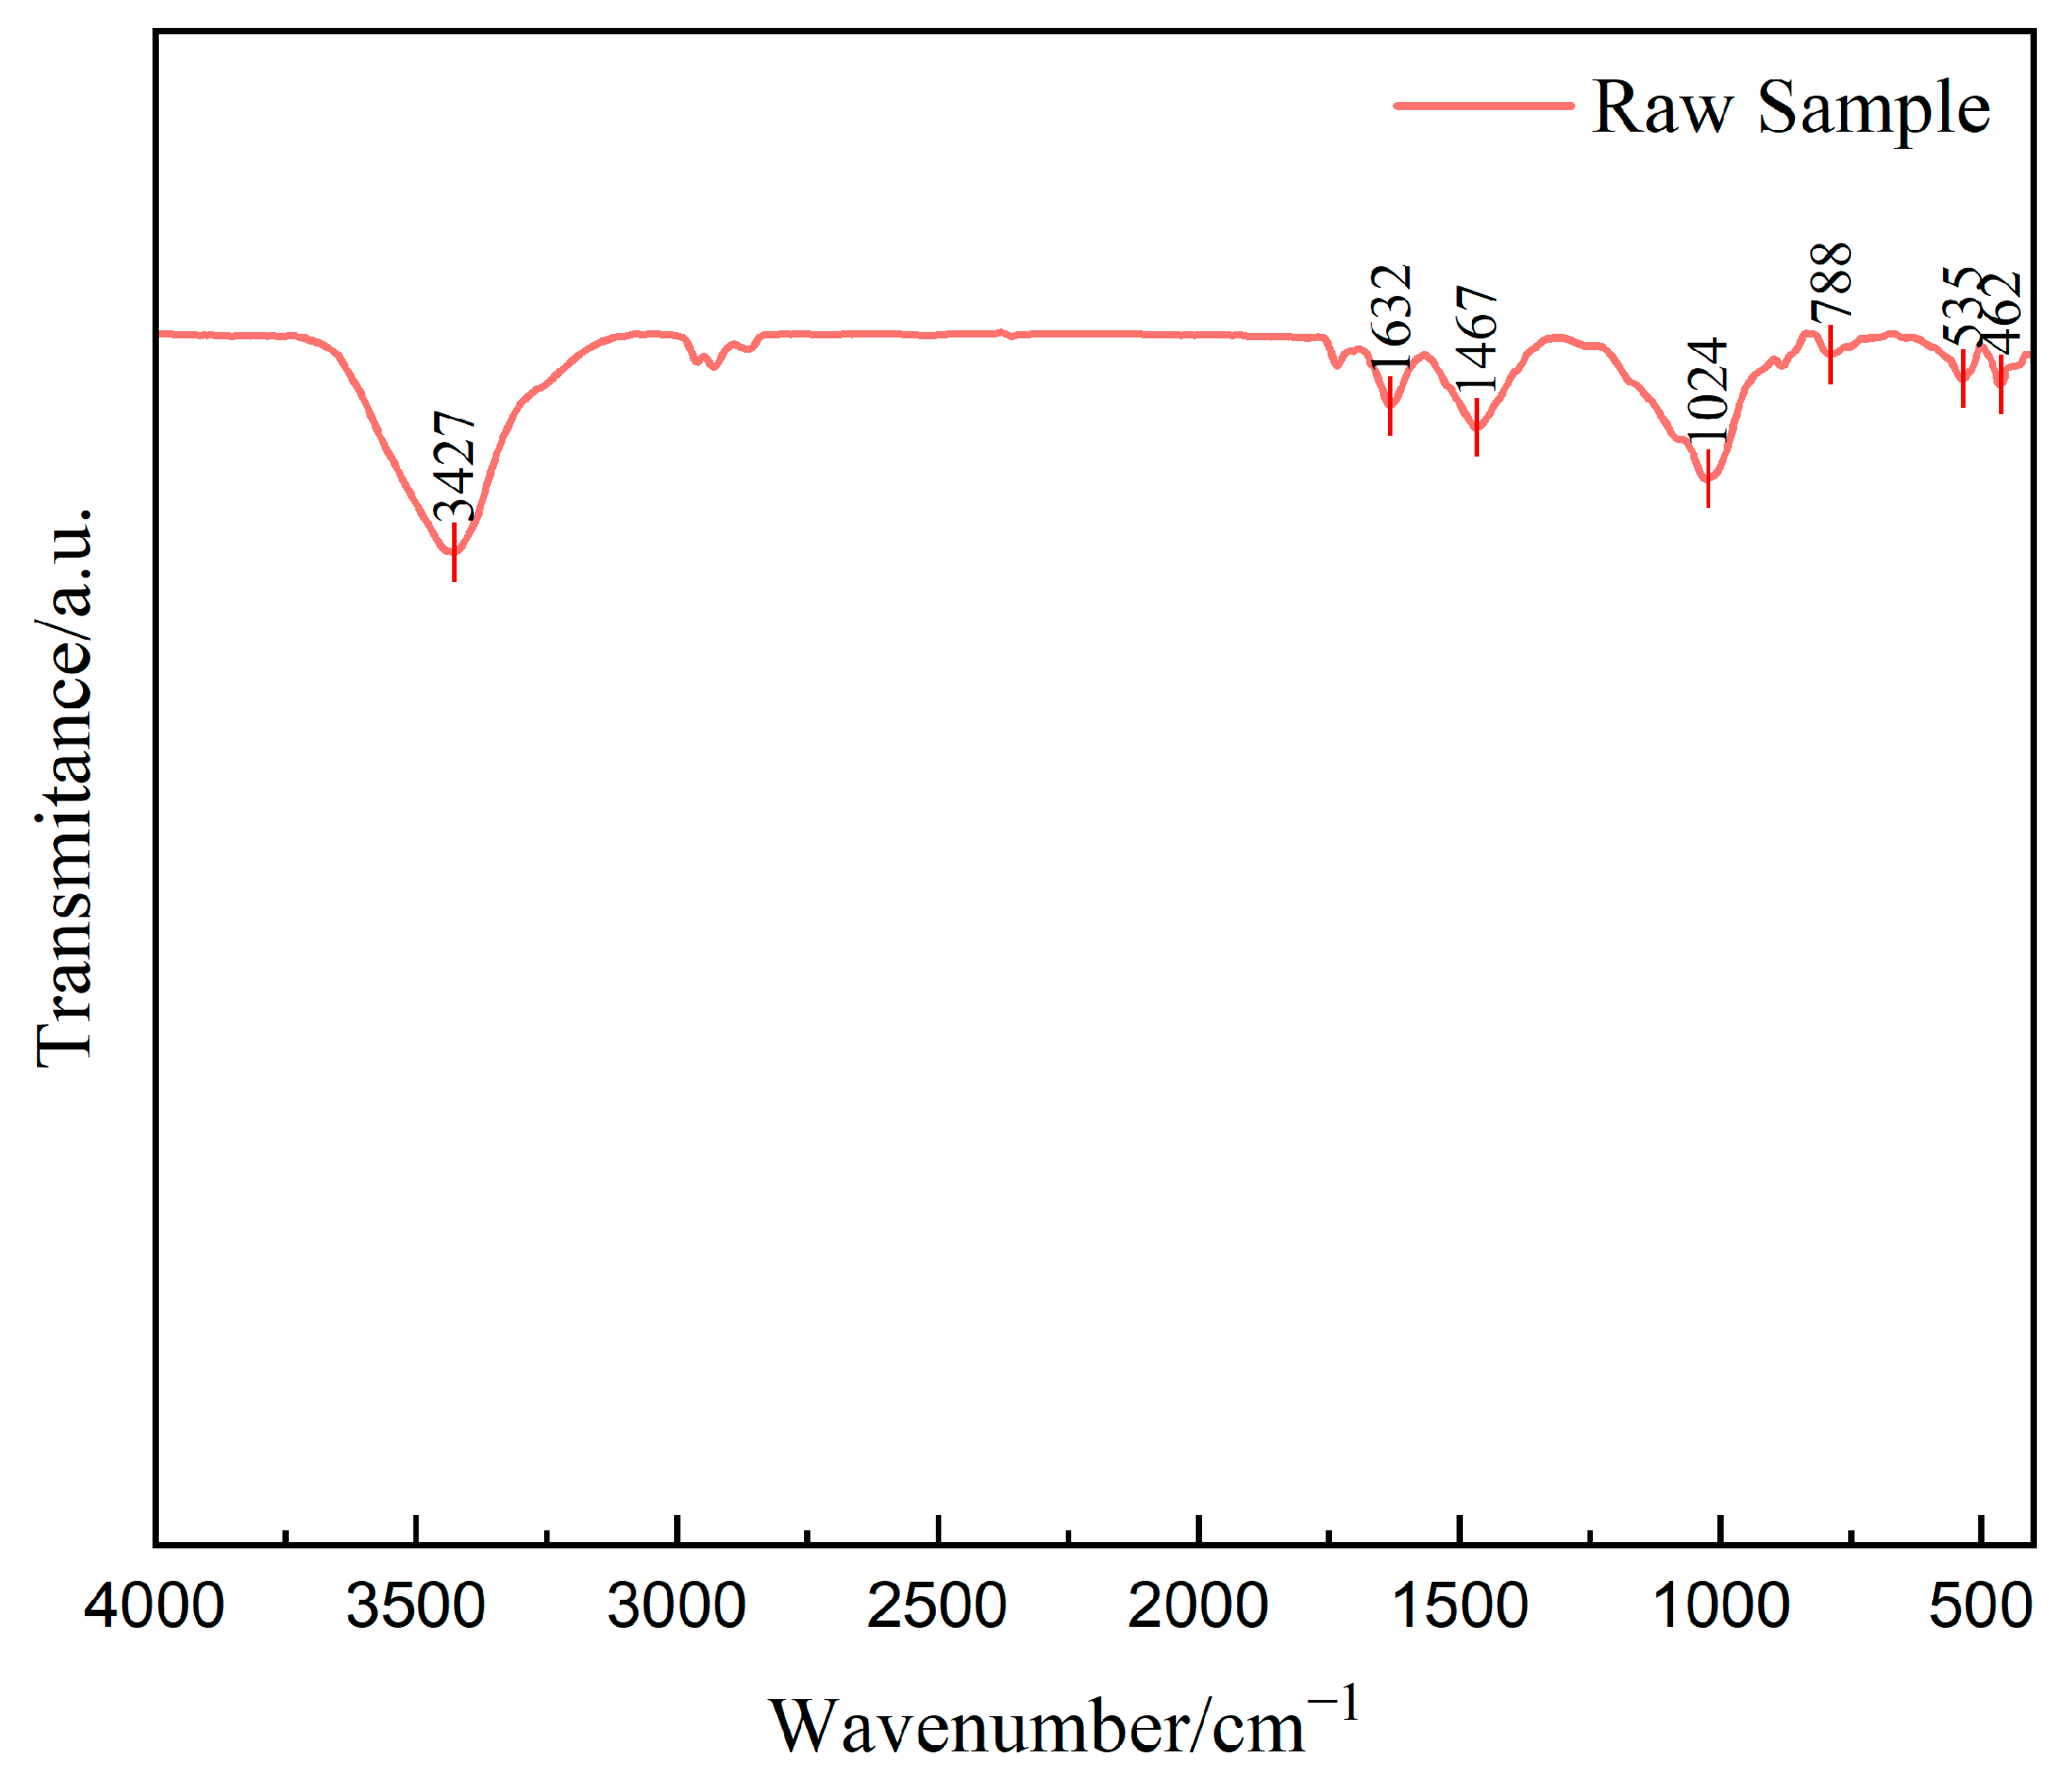
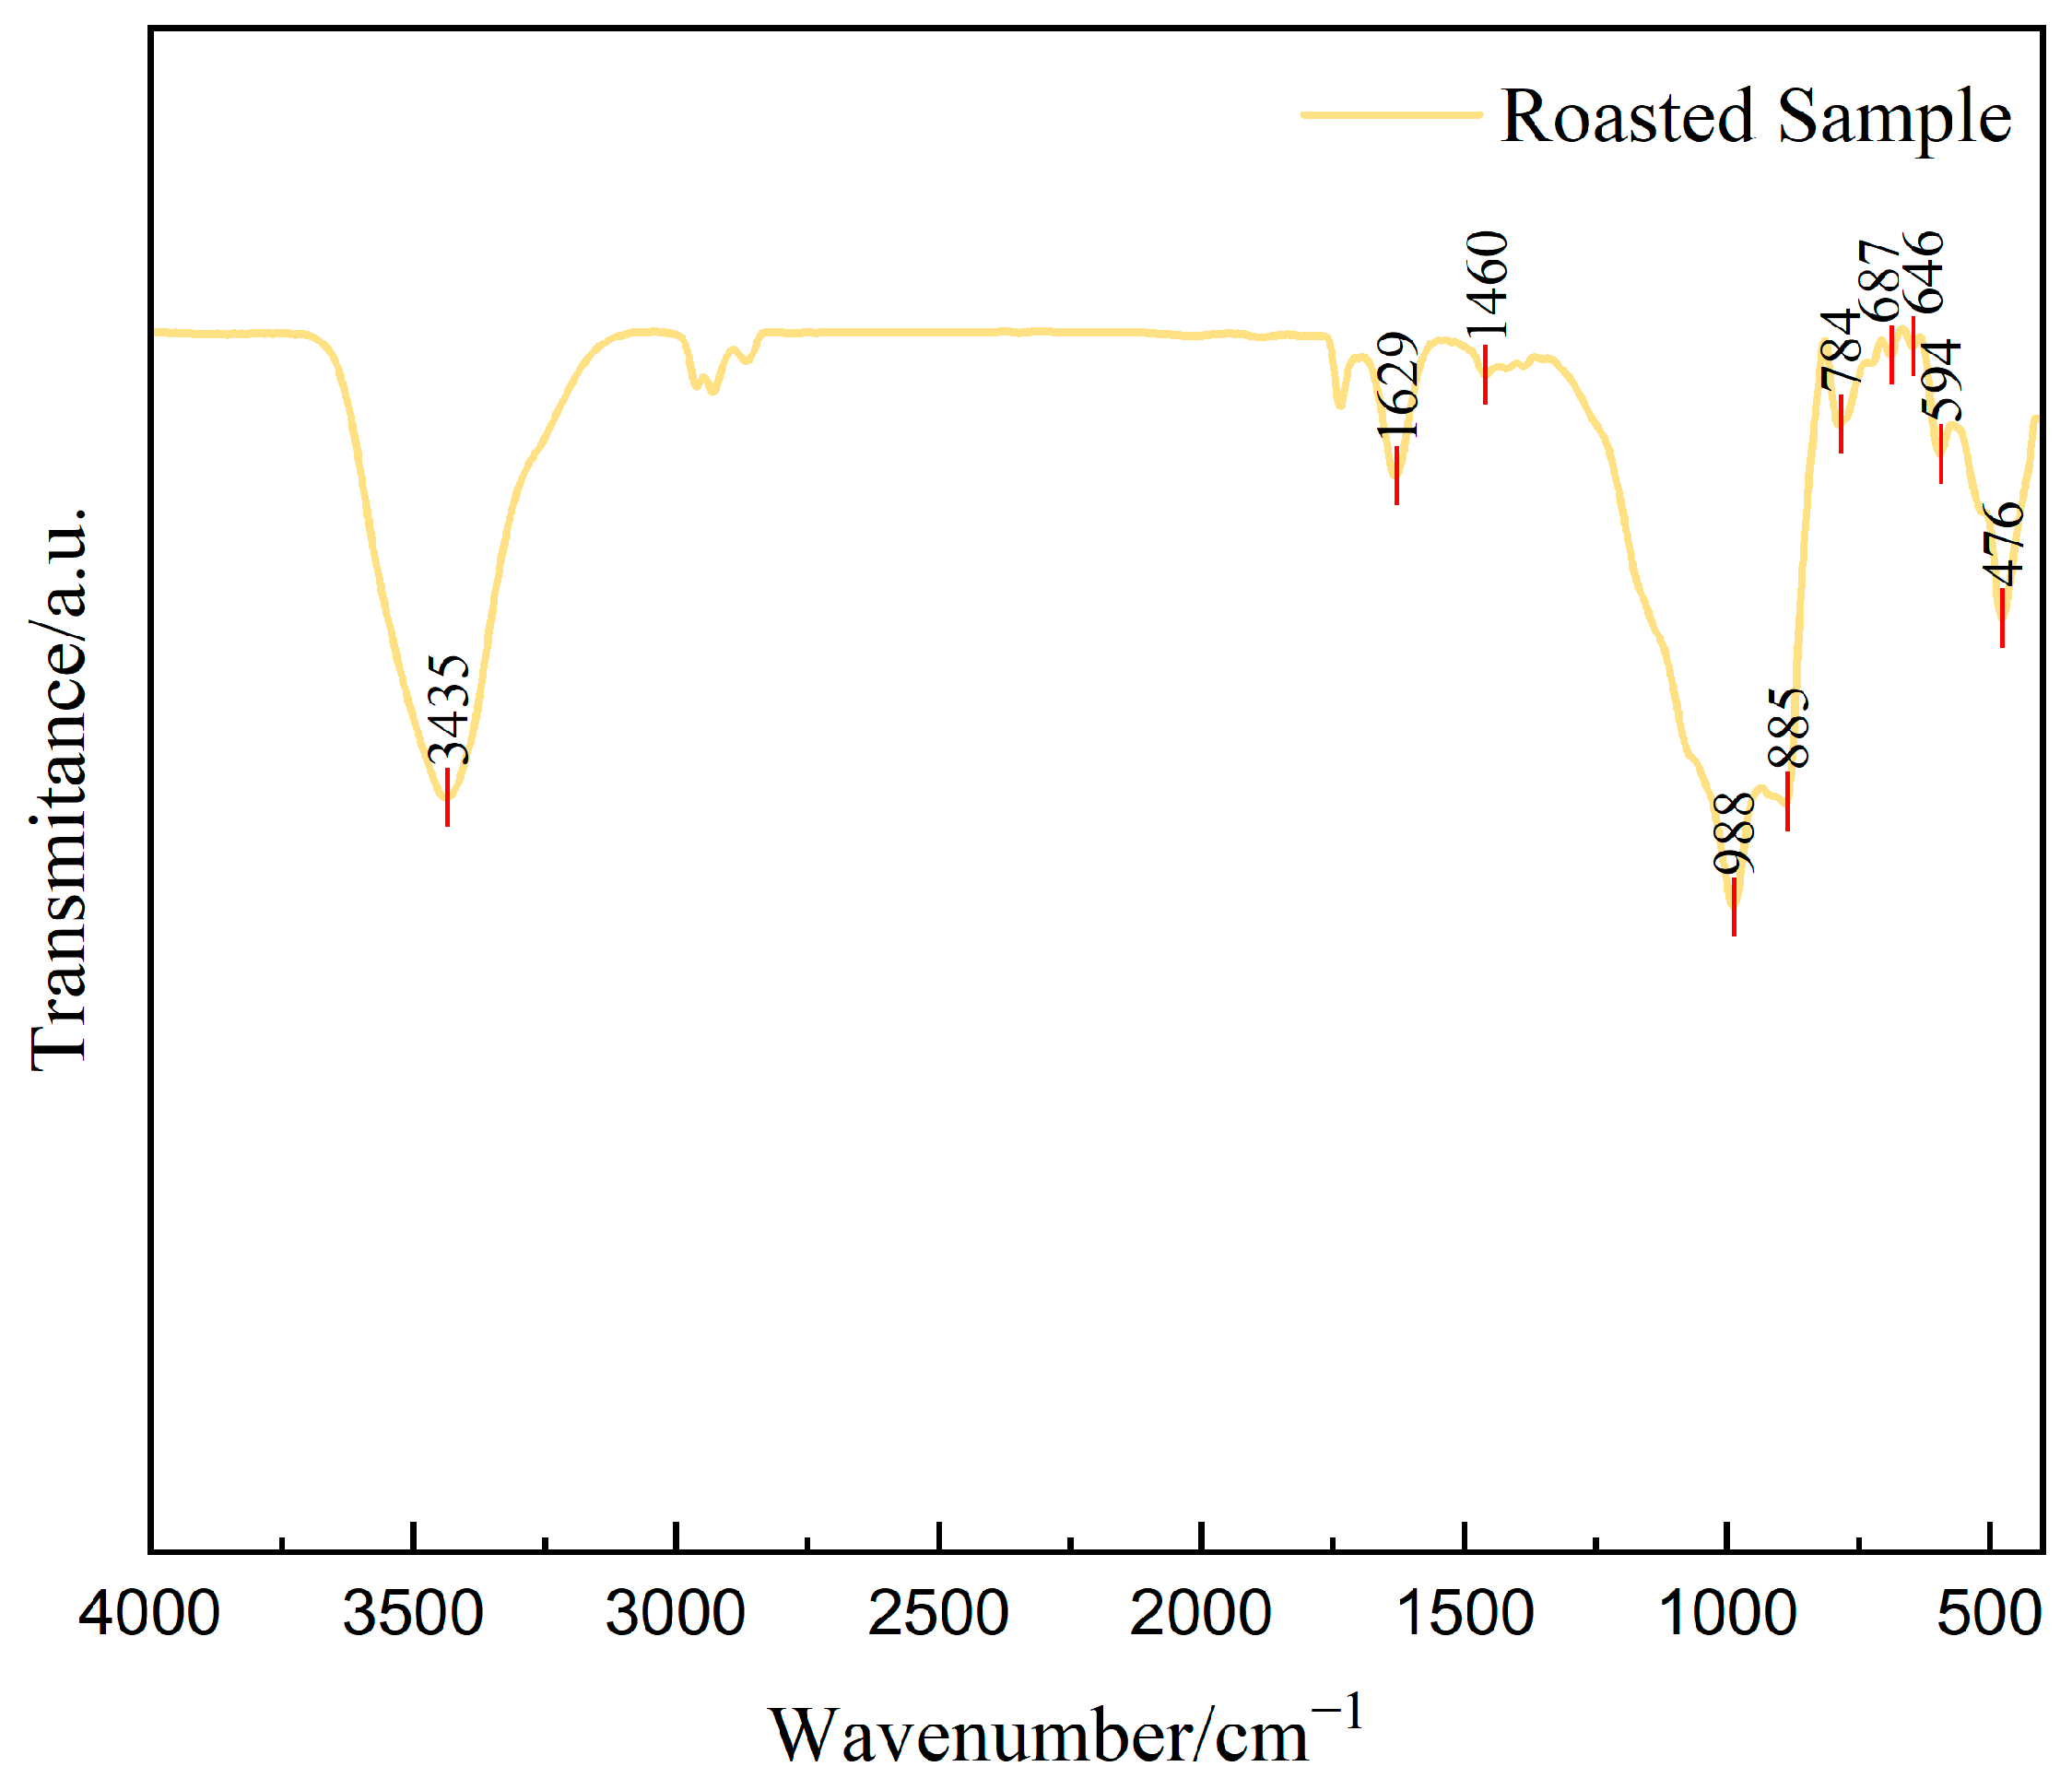
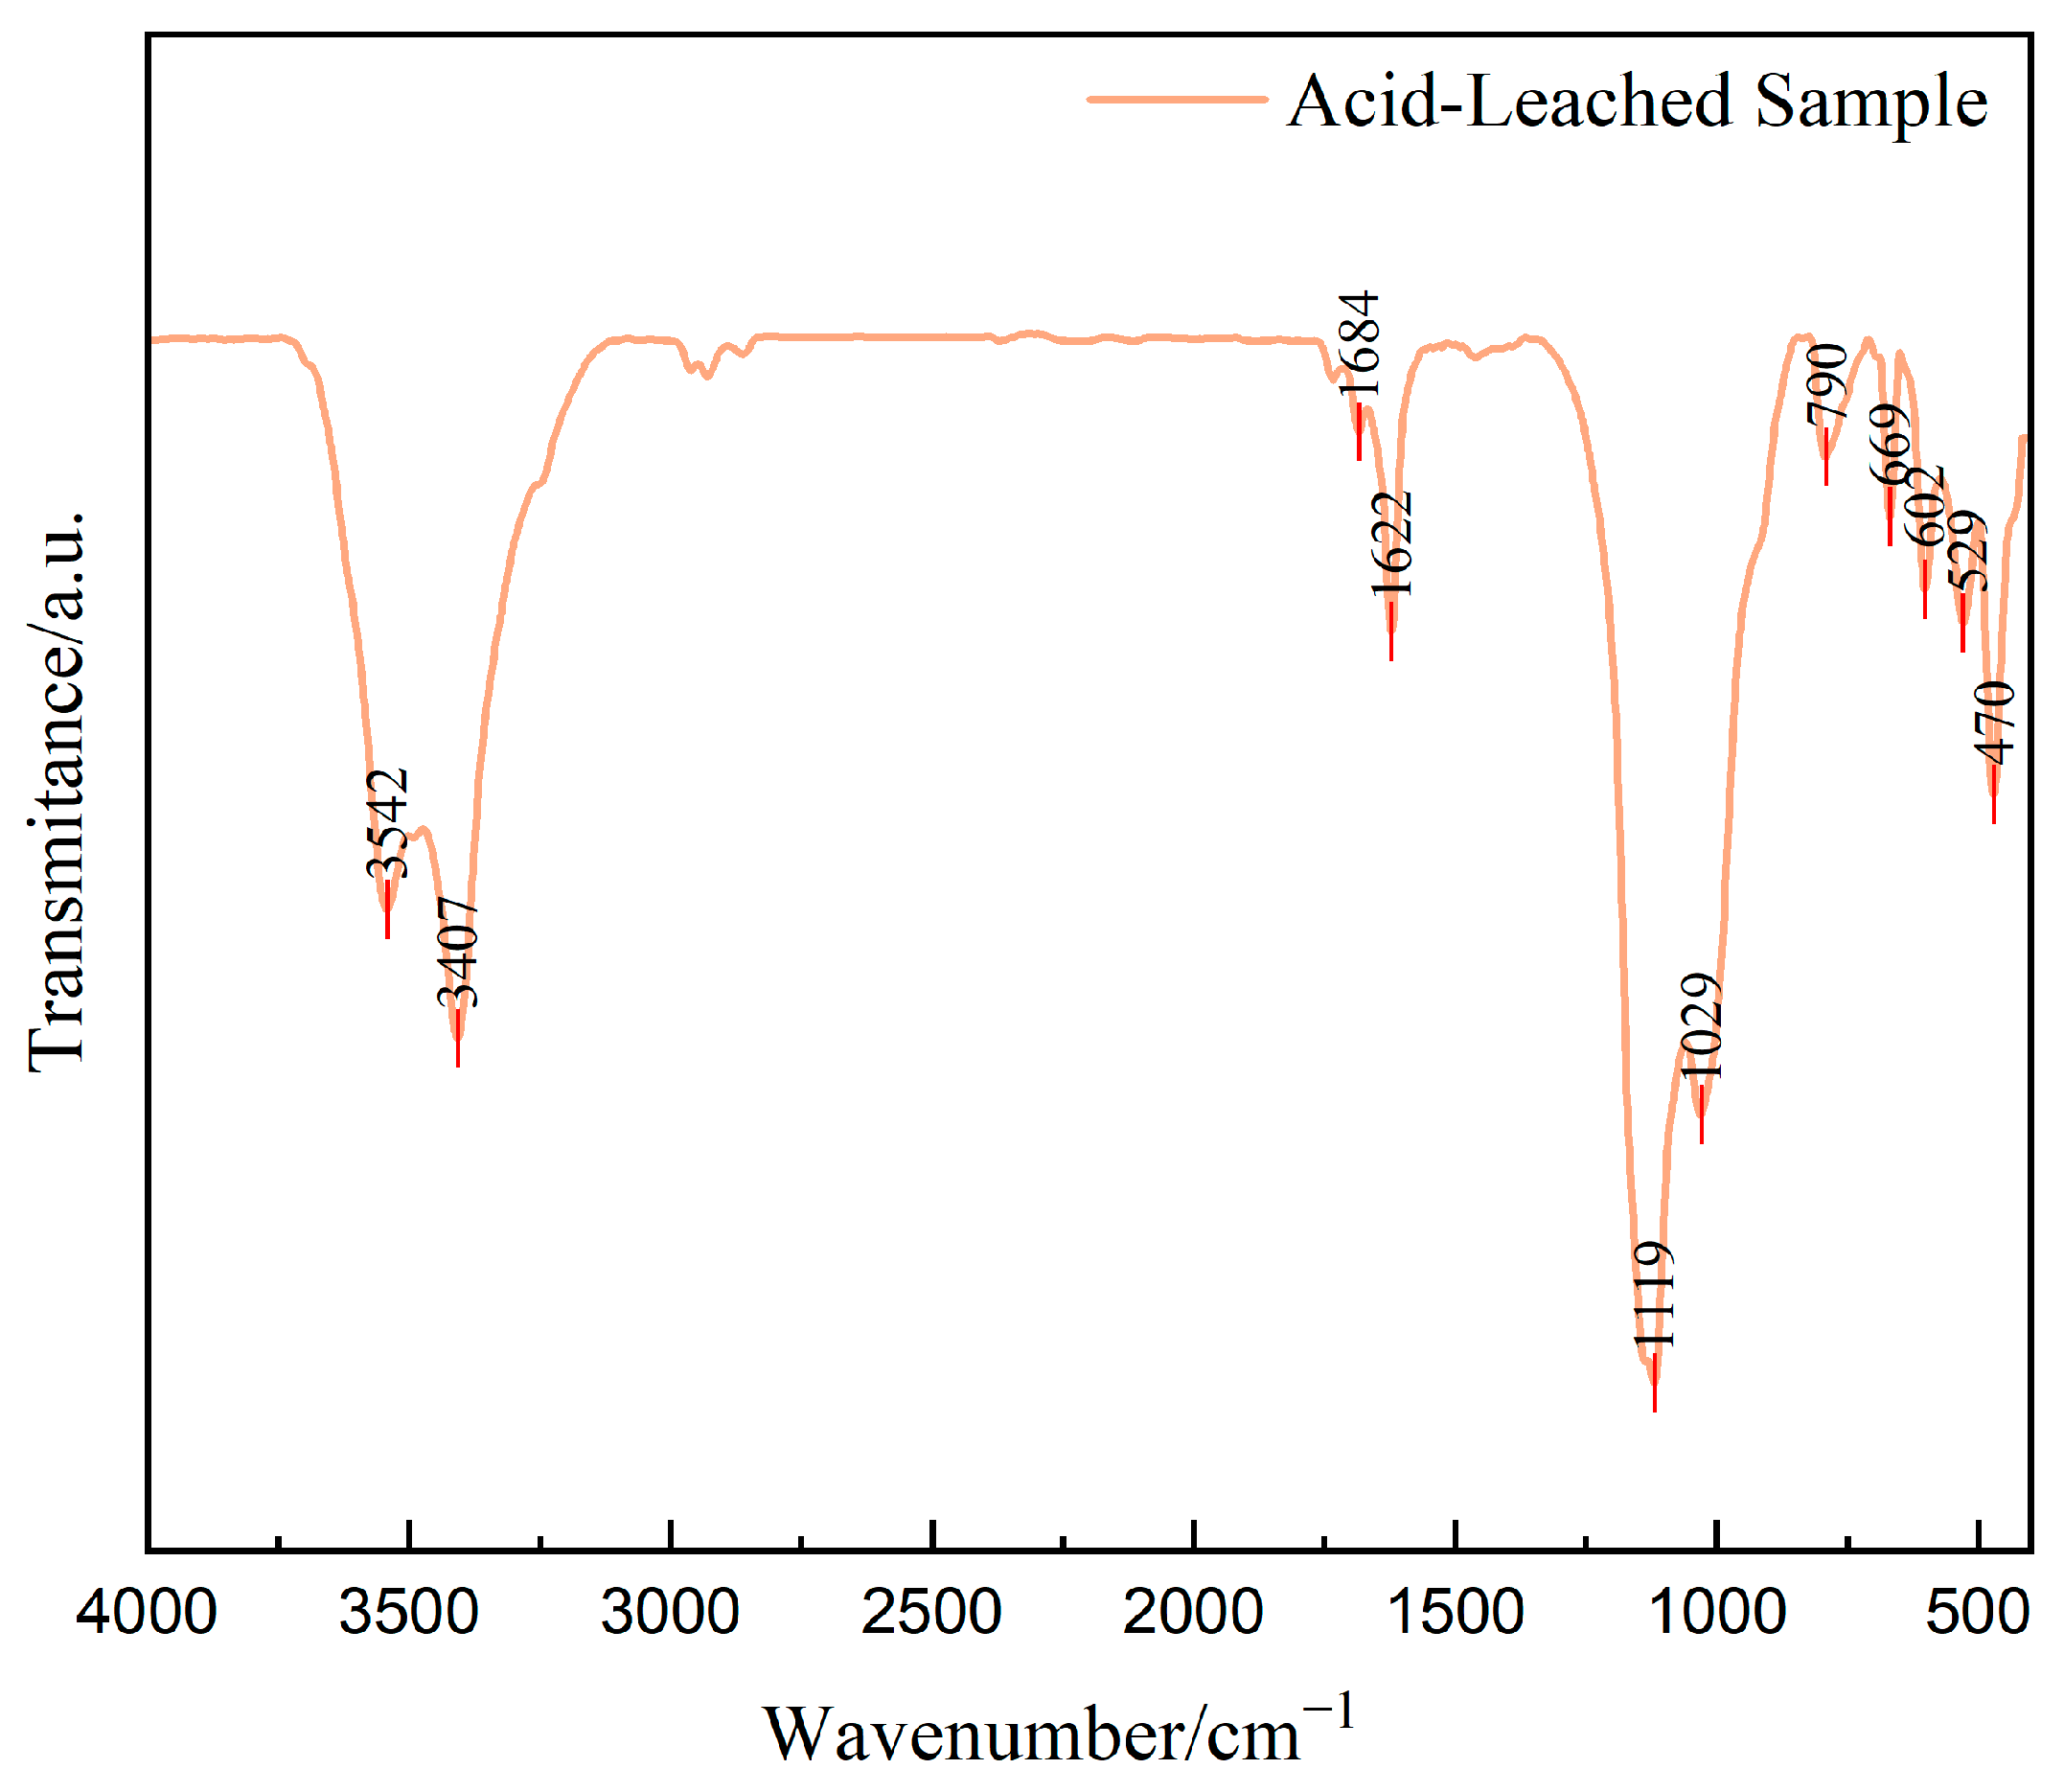
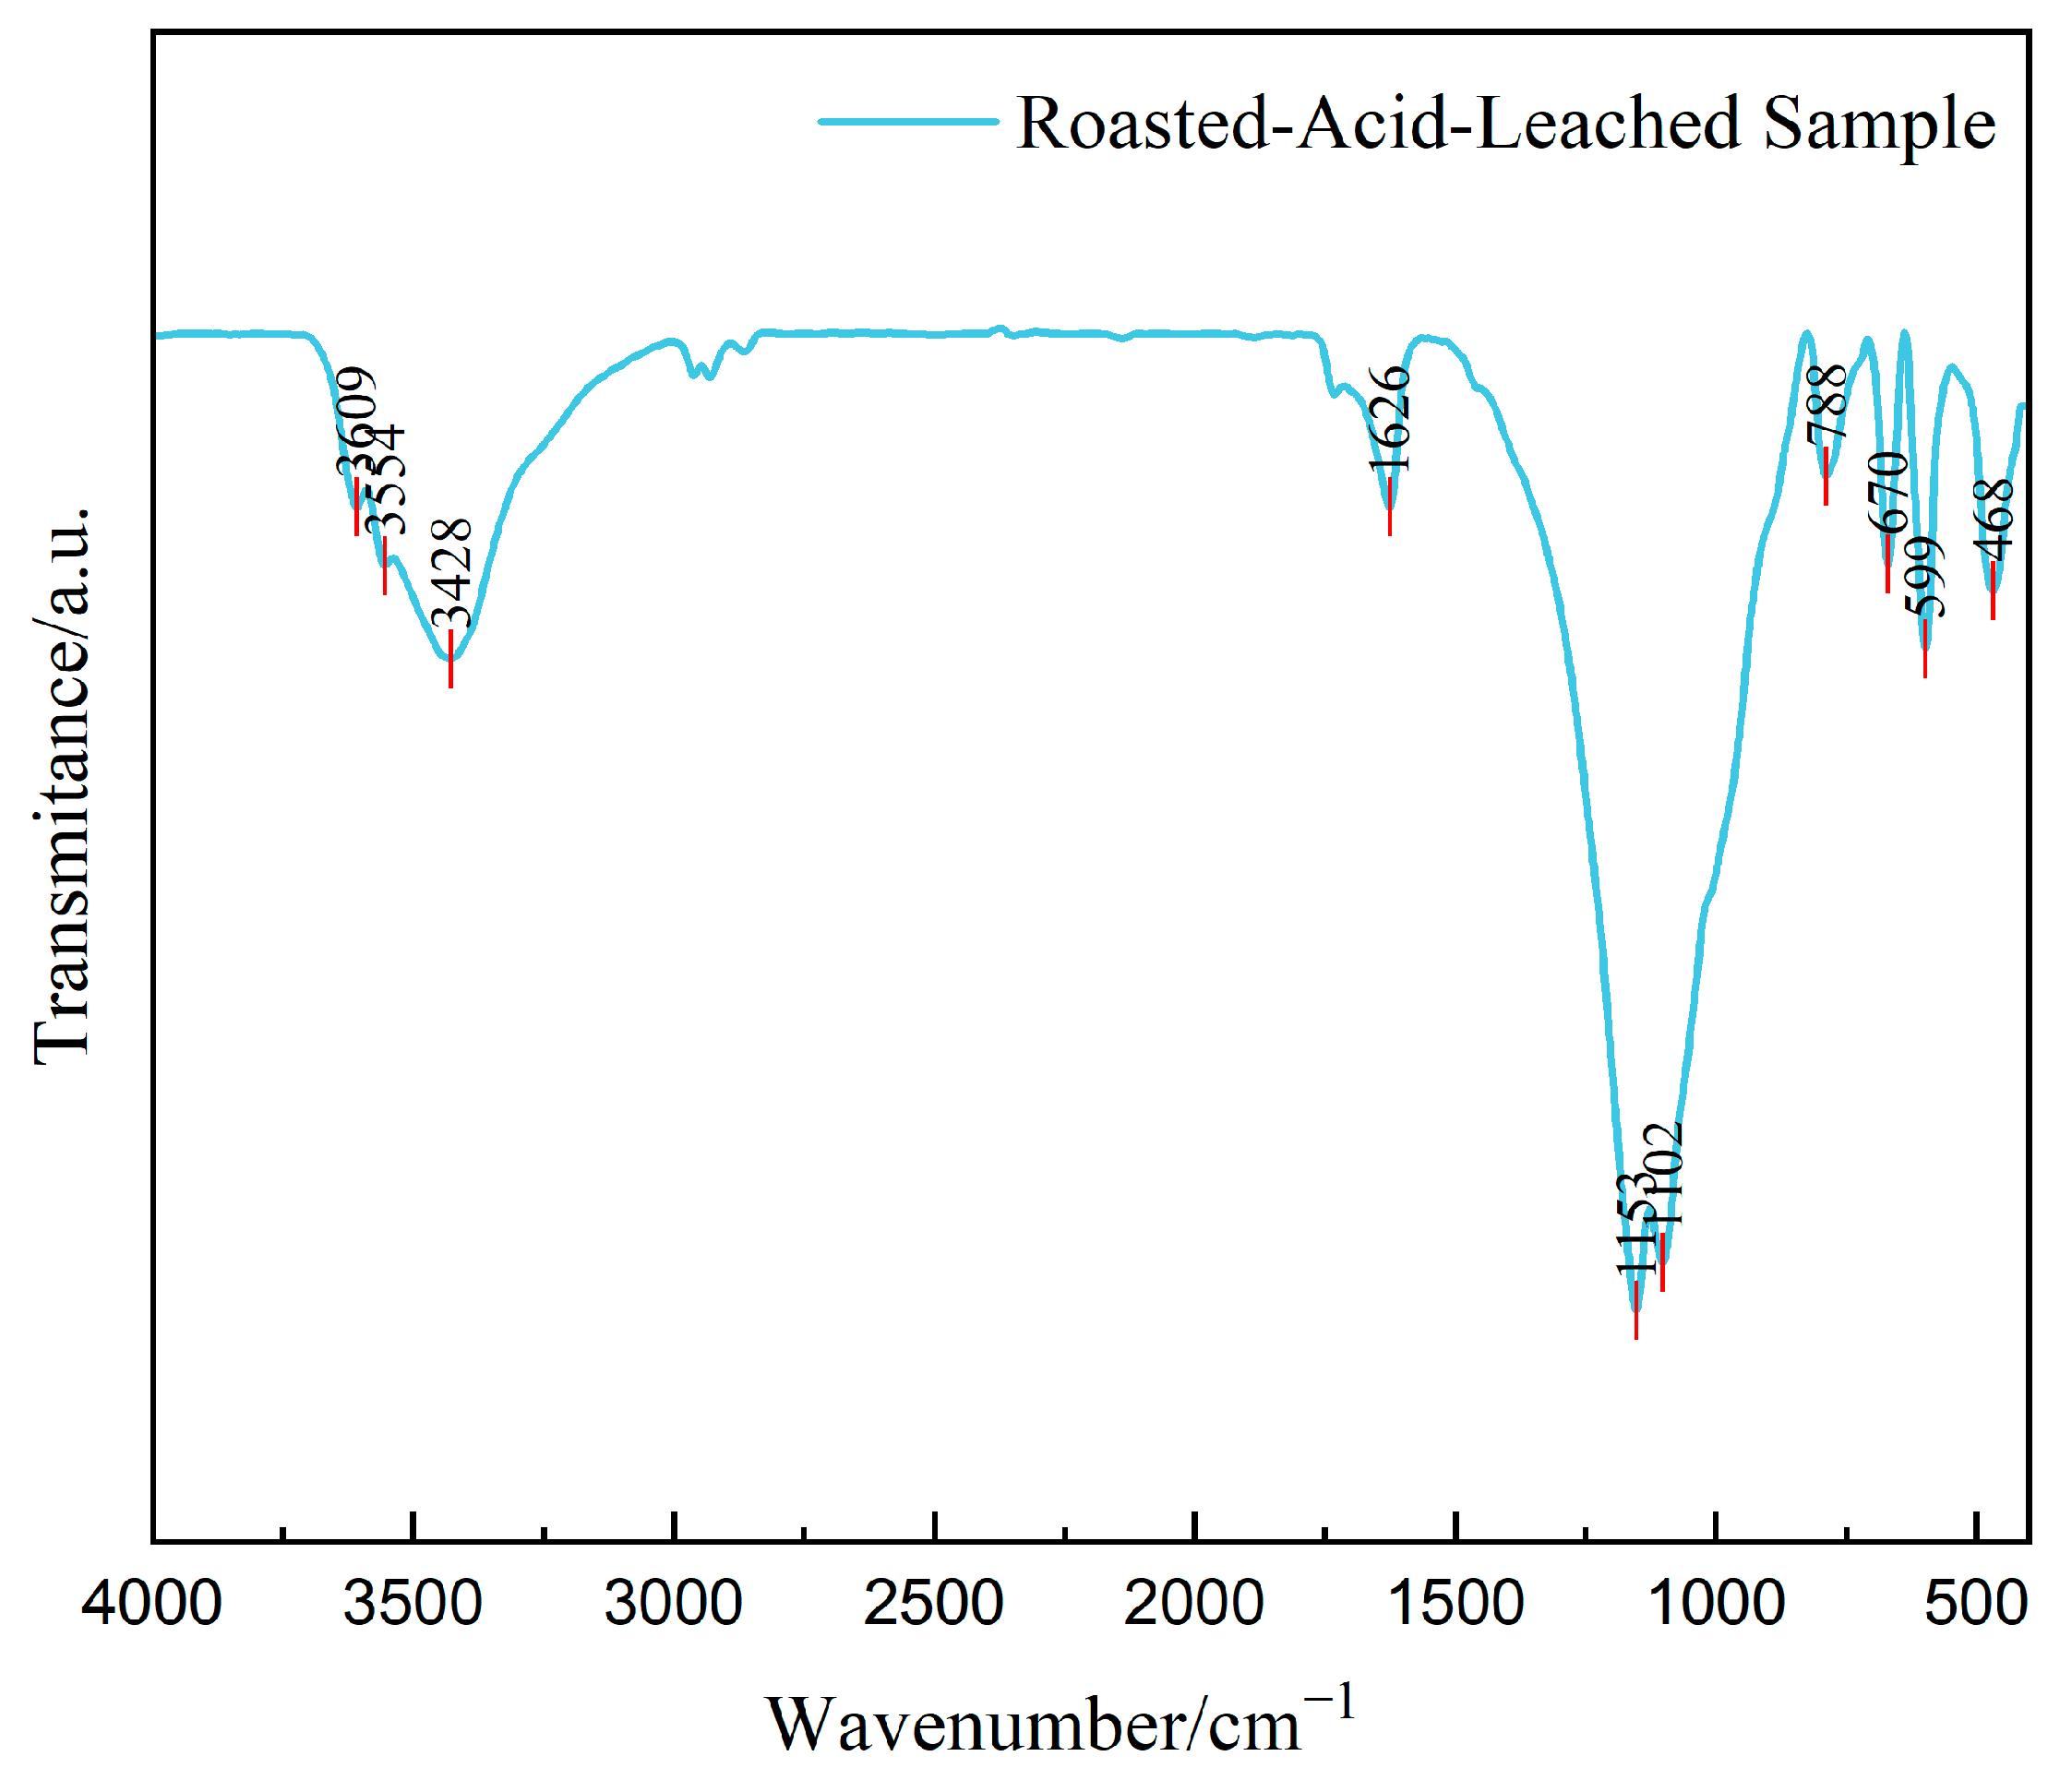
3.4. The Evolutionary Behavior of Functional Groups During the Sequential Acid-Leaching, Roasting, and Roasting–Acid-Leaching Processes

The FTIR analysis of the optimal sample B120–160 revealed characteristic absorption bands predominantly distributed across four spectral regions: 3750–3250, 1750–1500, and 1250–500 cm−1 (Figure 16). Figure 17, Figure 18, Figure 19 and Figure 20 present the infrared spectra of the B120–160 raw sample, roasted product, acid-leached residue, and roasting–acid-leached specimen, respectively.
Within the 3750–3250 cm−1 spectral range, the broad band at 3427 cm−1 in the raw ore corresponded to O-H stretching vibrations of adsorbed water and clay mineral hydroxyl groups, which confirmed the presence of bound water and hydroxyl species. The O-H peak at 3435 cm−1 in the roasted samples exhibited a blue-shifted position and reduced intensity, indicating the partial removal of adsorbed water/hydroxyls while retaining thermally stable hydroxyl residues. The roasting–acid-leached specimens displayed sharp narrow peaks at 3609/3554 cm−1, which was tentatively assigned to neo-formed crystalline water or coordinated hydroxyl groups, with residual adsorbed water at 3428 cm−1. The acid-leached samples demonstrated the simultaneous presence of free hydroxyl groups (3542 cm−1) and adsorbed water (3407 cm−1). The acid leaching further modified the hydroxyl environments, which potentially facilitated the lithium liberation from the layered structures.
Within the 1750–1500 cm−1 spectral region, the H-O-H bending vibration at 1632 cm−1 in the raw ore confirmed the presence of adsorbed water, while the 1467 cm−1 band tentatively corresponded to carbonate (CO32−), which aligned with the XRD phase identification. The roasted samples exhibited modified hydration signatures: the attenuated 1629 cm−1 bending mode suggests adsorbed water reduction, which was accompanied by a diminished 1460 cm−1 intensity, indicating partial carbonate decomposition. In the roasting–acid-leached specimens, the residual adsorbed water manifested at 1626 cm−1, with the complete attenuation of the 1460 cm−1 peak attributed to acid-mediated carbonate dissolution. The acid-leached samples displayed 1684 cm−1 vibrational features (C=O/N=O stretching from residual acids) and persistent adsorbed water at 1622 cm−1. The thermochemical decomposition of carbonates during roasting, coupled with acid-driven impurity removal, generated permeable architectures that were conducive to lithium mobilization.
In the 1250–500 cm−1 region, the Si–O–Si symmetric stretching vibration at 1024 cm−1 in the raw ore revealed a layered silicate architecture. The 788/535 cm−1 bending vibrations (Si–O–Al/Mg) corroborated the phyllosilicate framework. The roasted samples exhibited silicate reorganization at 988 cm−1, suggesting neo-formed Si–O–Si networks, while the 687–594 cm−1 vibrational modes were tentatively assigned to Li–O bond restructuring post-roasting. The roasting–acid-leached specimens displayed S–O stretching bands (1153/1102 cm−1) indicative of sulfate incorporation (SO42−), with Li–O vibrational signatures at 670/599 cm−1. The acid-leached samples showed 1119/1029 cm−1 absorptions (residual silicates/neo-sulfate–nitrate phases) and enhanced Li–O vibrations (669/602 cm−1), demonstrating effective lithium mobilization through soluble salt formation.
In summary, the vibrational spectroscopy analysis delineated the structural evolution under the processing conditions. The broad band at 3427 cm−1 in the raw ore arose from clay mineral hydroxyls and adsorbed water O-H stretching. The roasting-induced peak attenuation (3435 cm−1) signified partial dehydroxylation, which mechanistically involved adsorbed water/hydroxyl removal and carbonate decomposition. The siloxane bond reorganization (1024→988 cm−1 shift) reflected the structural reconfiguration. The acid leaching preferentially dissolved Al/Mg cations from silicates, which liberated the interlayer lithium as solvated ions, as evidenced by the Li-O vibrations that emerged in low-wavenumber regions. The S-O stretching modes confirmed sulfate formation post-acid treatment. The sharp hydroxyl signatures (3609/3554 cm−1) correlated with lithium dissolution and neo-phase crystallization. The roasting–acid-leaching-triggered sulfate generation demonstrated effective mineral lattice disruption, which facilitated lithium liberation.

4. Conclusions

This investigation elucidated the phase–microstructure–functional group evolution during the roasting–acid-leaching processing of Qaidam Basin clay-type lithium ore. Neo-phase generation and agglomeration mechanisms were identified as critical limiting factors for lithium extraction efficiency. The phyllosilicates (chlorite/kaolinite) in raw ore underwent significant phase transformation post-acid leaching, which manifested as attenuated characteristic peaks and gypsum formation. While this phase evolution facilitated Al-O octahedra dissociation (which achieved 74% interlayer lithium liberation), the roasting pretreatment induced neo-phase crystallization–aggregation, which led to surface densification that reduced the leaching efficiency to 45.3%. Process optimization should prioritize mitigating lithium encapsulation via controlled roasting parameters (temperature/duration) to prevent densification; mechanochemical activation coupled with synergistic leaching to disrupt Si-O encapsulation layers; and multiscale regulation integrating particle classification, acid-leaching optimization, and roasting process refinement. These strategies provide novel pathways for the efficient exploitation of analogous clay-type lithium resources, where the extraction performance is governed by interdependent particle gradation, mineral phase occurrence states, and microstructural characteristics.

Author Contributions

Methodology, D.A.; validation, Y.L. and J.Z.; formal analysis, J.Z.; investigation, Y.L.; writing—original draft preparation, X.Z.; writing—review and editing, X.Z.; visualization, H.S.; supervision, Y.M.; project administration, H.C.; funding acquisition, H.C. All authors have read and agreed to the published version of the manuscript.

Funding

This work was financially supported by the Centrally Guided Local Science and Technology Development Fund Projects of Qinghai Province (2024ZY006), National Natural Science Foundation of China (22478232), and National Key Research and Development Program of China–Strategic Science and Technology Innovation Cooperation [2023YFE0100700]. We are grateful for their financial support and valuable guidance.

Data Availability Statement

The data are contained within the article.

Conflicts of Interest

The authors declare no conflicts of interest.

References

  1. Wang, W.; Liu, Z.; Zhu, Z.; Ma, Y.; Zhang, K.; Meng, Y.; Ahmad, T.; Khan, N.A.; Peng, Q.; Xie, Z.; et al. Electrochemical Lithium Recycling from Spent Batteries with Electricity Generation. Nat. Sustain. 2025, 8, 287–296. [Google Scholar] [CrossRef]
  2. Rijal, S.; Jang, S.H.; Park, S.J.; Han, S.K. Lithium Enhances the GABAergic Synaptic Activities on the Hypothalamic Preoptic Area (hPOA) Neurons. Int. J. Mol. Sci. 2021, 22, 3908. [Google Scholar] [CrossRef] [PubMed]
  3. Jia, J.; Lei, X.; Han, K.; Yue, P.; Fan, S.; Zhang, C.; Song, N.; Yang, G.; Zhang, Y.; Zhang, S. Synergistic Adsorption and Lubrication Mechanism of CeO2 Nanoparticle and MoDTC in Lithium Complex Grease. Tribol. Int. 2024, 197, 109819. [Google Scholar] [CrossRef]
  4. Mususa, P.; Piersiak, M.; Nansai, K.; Haeckel, M.; Boetius, A.; Werner, T.; Wong, S.S.; Bebbington, A.; Månberger, A. Sustainable Opportunities for Critical Metals. One Earth 2021, 4, 327–330. [Google Scholar] [CrossRef]
  5. Mineral Commodity Summaries 2024. Available online: https://pubs.usgs.gov/periodicals/mcs2024/mcs2024-lithium.pdf (accessed on 15 April 2025).
  6. Environment, U.N. Global Resources Outlook 2024 | UNEP—UN Environment Programme. Available online: https://www.unep.org/zh-hans/resources/Global-Resource-Outlook-2024 (accessed on 22 December 2024).
  7. Global Risks Report 2024. Available online: https://www.weforum.org/publications/global-risks-report-2024/ (accessed on 22 December 2024).
  8. Unleash the Vitality of Scientific and Technological Innovation to Drive Major Breakthroughs in Mineral Exploration—China Geological Survey. Available online: https://www.cgs.gov.cn/xwl/ddyw/202410/t20241008_773399.html (accessed on 9 December 2024).
  9. Liu, X.; Wang, C.; Liu, X.; Liu, D.; Yan, K.; Liu, S.; Liu, Y. Main types, distribution, development and utilization of China. Geol. China 2024, 51, 811–832. [Google Scholar]
  10. Xie, R.; Zhao, Z.; Tong, X.; Xie, X.; Song, Q.; Fan, P. Review of the Research on the Development and Utilization of Clay-Type Lithium Resources. Particuology 2024, 87, 46–53. [Google Scholar] [CrossRef]
  11. Li, J.; Sun, L.; Lv, G.; Liao, L. Application of Clay Minerals in Lithium-Sulfur Batteries: A Review. J. Energy Storage 2025, 106, 114852. [Google Scholar] [CrossRef]
  12. Li, P.; Zeng, Y.; Yu, X.; Hong, Y. Current research status on lithium extraction technologies and occurrence characteristics of clay-type lithium deposits. Ind. Miner. Process. 2025, 1–13. Available online: https://kns.cnki.net/KCMS/detail/detail.aspx?dbcode=CAPJ&dbname=CAPJLAST&filename=HGKJ20250603001 (accessed on 12 July 2025).
  13. Zhong, W.; Feng, H.; Tong, L.; Li, D.; Yang, L.; Rao, F. Lithium Extraction from a Li-Rich Kaolin Resource through Na2SO4 Roasting and Water Leaching. Miner. Eng. 2024, 218, 109004. [Google Scholar] [CrossRef]
  14. Ran, Y.; Qu, G.; Yang, J.; Zhou, S.; Li, B.; Wang, H.; Wei, Y. Efficient Separation and Extraction of Lithium from Low-Grade Claystone by Chloride Salt-Enhanced Roasting Process. J. Clean. Prod. 2024, 434, 140156. [Google Scholar] [CrossRef]
  15. Xie, R.; Zhou, W.; Tong, X.; Liu, Y.; Xie, X.; Wang, X. Study on Extraction of Lithium from Clay-Type Lithium Ore with Low Roasting Temperature and Water and Its Mechanism. Sep. Purif. Technol. 2025, 364, 132450. [Google Scholar] [CrossRef]
  16. Zhou, W.; Xie, R.; Tong, X.; Xie, X.; Liu, Y.; Zhao, Z. Extract Lithium from Clay-Type Lithium Ore by Mixed Acid and Its Mechanism. Particuology 2024, 91, 323–332. [Google Scholar] [CrossRef]
  17. Li, X.; Zhou, Z.; Zhao, K.; Liu, J.; Liu, Z. An Environment-Friendly Strategy for Comprehensive Recovery of Li, Al and Si from Low-Grade Clay-Type Lithium Ore. Chem. Eng. J. 2025, 505, 159651. [Google Scholar] [CrossRef]
  18. Zhao, S.; Meng, F.; Liu, Y.; Zhang, J.; Wang, Y.; Tian, X.; Li, X.; Chen, D.; Wang, L.; Qi, T. Selective Extraction of Lithium from the Clay-Type Lithium Ore by a Novel Process of Blank Roasting and CaO-Aided Alkaline Leaching. Miner. Eng. 2025, 227, 109252. [Google Scholar] [CrossRef]
  19. Peng, K.; Zhou, R.; Qian, X. Experimental study on the leaching of lithium in a clay type lithium ore. Gold 2023, 44, 47–50. [Google Scholar]
  20. Liu, Y.; Tong, X.; Xie, R.; Xie, X.; Song, Q.; Fan, P. Study on Roasting and Non-acid Leaching Test of a Low Grade Clay Type Lithium Ores. Met. Mine 2024, 364, 112–116. [Google Scholar] [CrossRef]
  21. Rao, M.; Dou, Z.; Wang, J.; Zhong, Y.; Chang, S.; Wang, B. A study on the lithium extraction from the clay-type lithium ore by using the activation-roasting and water leaching technique. Acta Mineral. Sin. 2025, 45, 1–14. Available online: http://kns.cnki.net/kcms/detail/52.1045.P.20250121.1138.002.html (accessed on 13 July 2025). [CrossRef]
  22. Yang, Y.; Yang, M. Preparation of Crude Lithium Carbonate from Roasting-Oxalic Acid Leach Solution of Clay-Type Lithium Ores. China Metall. 2024, 34, 117–123. [Google Scholar] [CrossRef]
  23. Ji, B.; Li, Q.; Honaker, R.; Zhang, W. Acid Leaching Recovery and Occurrence Modes of Rare Earth Elements (REEs) from Natural Kaolinites. Miner. Eng. 2022, 175, 107278. [Google Scholar] [CrossRef]
  24. Zheng, M.; Xing, E.; Zhang, X.; Li, M.; Che, D.; Bu, L.; Hanb, J.; Ye, C. Classification and Mineralization of Global Lithium Deposits and Lithium Extraction Technologies for Exogenetic Lithium Deposits. China Geol. 2023, 6, 547–566. [Google Scholar] [CrossRef]
Figure 1. Samples (A) and (B).
Minerals 15 00777 g001
Figure 2. Li contents in different particle size fractions of samples A and B.
Minerals 15 00777 g002
Figure 3. Li leaching rates from samples A and B after acid leaching.
Minerals 15 00777 g003
Figure 4. XRD patterns of five particle size fractions in sample A.
Minerals 15 00777 g004
Figure 5. XRD patterns of five particle size fractions in sample B.
Minerals 15 00777 g005
Figure 6. XRD patterns of acid-leaching residues from different particle size sample fractions.
Minerals 15 00777 g006
Figure 7. XRD patterns of roasted residues from different particle size sample fractions.
Minerals 15 00777 g007
Figure 8. XRD patterns of roasted–acid-leached residues from different particle size sample fractions.
Minerals 15 00777 g008
Figure 9. SEM images of raw ore (with sequentially increasing magnification from (ad)).
Minerals 15 00777 g009
Figure 10. SEM images of acid-leached residues ((a): A120–160; (b): A200–250; (c): B120–160; (d): B160–200).
Minerals 15 00777 g010
Figure 11. SEM-EDS analysis of rod-shaped structures in acid-leached residues. (The EDS spectrum corresponding to the red crosshair marker on the rod-shaped feature in the left panel is displayed on the right.)
Minerals 15 00777 g011
Figure 12. SEM images of roasted samples ((a): A120–160; (b): A200–250; (c): B120–160; (d): B160–200).
Minerals 15 00777 g012
Figure 13. Locally magnified SEM images of the B120–160 roasted sample.
Minerals 15 00777 g013
Figure 14. SEM-EDS images of agglomerates in the roasted residue. (The energy spectrum analysis corresponding to the red box on the left agglomerate is shown in the right figure.)
Minerals 15 00777 g014
Figure 15. SEM images of the roasted–acid-leached samples. ((a): A120–160; (b): A200–250; (c): B120–160; (d): B160–200).
Minerals 15 00777 g015
Figure 16. FTIR spectra of B120–160 samples processed using different treatment methods.
Minerals 15 00777 g016
Figure 17. FTIR spectra of B120–160 raw sample.
Minerals 15 00777 g017
Figure 18. FTIR spectra of roasted B120–160 sample.
Minerals 15 00777 g018
Figure 19. FTIR spectra of acid-leached B120–160 sample.
Minerals 15 00777 g019
Figure 20. FTIR spectra of roasted–acid-leached B120–160 sample.
Minerals 15 00777 g020
Table 1. The lithium leaching efficiency of acid leaching versus roasting–acid leaching.
Sample NumberContent in Raw SampleAcid-Leaching Rate and AmountRoasted–Acid-Leached Rate and Amount
A120–16073.79 ppm66%, 49.02 ppm46.90%, 34.60 ppm
A200–25078.60 ppm77%, 60.35 ppm41.96%, 32.98 ppm
B120–16087.56 ppm74%, 65.13 ppm45.30%, 39.66 ppm
B160–20079.85 ppm66%, 53.05 ppm47.53%, 37.95 ppm
Table 2. Surface element content of rod-shaped structures in acid-leached residues.
ElementMass %Atom %
O48.00 ± 1.0967.23 ± 1.53
S24.65 ± 0.7818.48 ± 0.55
Ca26.55 ± 1.2614.28 ± 0.70
Total100100
Table 3. Elemental composition of the surfaces of agglomerates in the roasted residue.
ElementMass %Atom %
C25.45 ± 0.3840.35 ± 0.61
O28.81 ± 0.6434.29 ± 0.76
F1.38 ± 0.271.38 ± 0.27
Na1.38 ± 0.171.14 ± 0.14
Mg8.74 ± 0.376.85 ± 0.29
Al4.56 ± 0.293.22 ± 0.21
Si6.42 ± 0.384.35 ± 0.26
Cl1.18 ± 0.180.63 ± 0.10
K1.41 ± 0.260.69 ± 0.13
Ca2.13 ± 0.341.01 ± 0.16
Cr1.02 ± 0.420.37 ± 0.15
Mn1.42 ± 0.640.49 ± 0.22
Fe10.05 ± 1.603.43 ± 0.55
Ni4.44 ± 1.931.44 ± 0.63
Sr1.06 ± 0.700.35 ± 0.15
Total100100
Disclaimer/Publisher’s Note: The statements, opinions and data contained in all publications are solely those of the individual author(s) and contributor(s) and not of MDPI and/or the editor(s). MDPI and/or the editor(s) disclaim responsibility for any injury to people or property resulting from any ideas, methods, instructions or products referred to in the content.

