Article

Effective Treatment of Acid Mine Drainage with Microbial Fuel Cells: An Emphasis on Typical Energy Substrates

1
School of Metallurgy and Environment, Central South University, Changsha 410083, Hunan, China
2
School of Minerals Processing and Bioengineering, Central South University, Changsha 410083, Hunan, China
3
Chinese National Engineering Research Center for Control and Treatment of Heavy Metal Pollution, Central South University, Changsha 410083, Hunan, China
4
Key Laboratory of Biometallurgy of Ministry of Education, Central South University, Changsha 410083, China
5
College of Environmental Science and Engineering, Fujian Key Laboratory of Pollution Control & Resource Reuse, Fujian Normal University, Fuzhou 350007, Fujian Province, China
6
Central South Water Science and Technology Co., LTD, Changsha 410083, China
7
National City Supply Water Quality Monitoring Network Changsha Monitoring Station, Changsha 410083, China
*
Author to whom correspondence should be addressed.
Minerals 2020, 10(5), 443; https://doi.org/10.3390/min10050443
Submission received: 10 April 2020 / Revised: 10 May 2020 / Accepted: 10 May 2020 / Published: 15 May 2020

Abstract

:
Acid mine drainage (AMD), characterized by a high concentration of heavy metals, poses a threat to the ecosystem and human health. Bioelectrochemical system (BES) is a promising technology for the simultaneous treatment of organic wastewater and recovery of metal ions from AMD. Different kinds of organic wastewater usually contain different predominant organic chemicals. However, the effect of different energy substrates on AMD treatment and microbial communities of BES remains largely unknown. Here, results showed that different energy substrates (such as glucose, acetate, ethanol, or lactate) affected the startup, maximum voltage output, power density, coulombic efficiency, and microbial communities of the microbial fuel cell (MFC). Compared with the maximum voltage output (55 mV) obtained by glucose-fed-MFC, much higher maximum voltage output (187 to 212 mV) was achieved by MFCs fed individually with other energy substrates. Acetate-fed-MFC showed the highest power density (195.07 mW/m2), followed by lactate (98.63 mW/m2), ethanol (52.02 mW/m2), and glucose (3.23 mW/m2). Microbial community analysis indicated that the microbial communities of anodic electroactive biofilms changed with different energy substrates. The unclassified_f_Enterobacteriaceae (87.48%) was predominant in glucose-fed-MFC, while Geobacter species only accounted for 0.63%. The genera of Methanobrevibacter (23.70%), Burkholderia-Paraburkholderia (23.47%), and Geobacter (11.90%) were the major genera enriched in the ethanol-fed-MFC. Geobacter was most predominant in MFC enriched by lactate (45.28%) or acetate (49.72%). Results showed that the abundance of exoelectrogens Geobacter species correlated to electricity-generation capacities of electroactive biofilms. Electroactive biofilms enriched with acetate, lactate, or ethanol effectively recovered all Cu2+ ion (349 mg/L) of simulated AMD in a cathodic chamber within 53 h by reduction as Cu0 on the cathode. However, only 34.65% of the total Cu2+ ion was removed in glucose-fed-MFC by precipitation with anions and cations rather than Cu0 on the cathode.

1. Introduction

Acid mine drainage (AMD) is one typical pollutant of water in many countries that have historic or current mining activities. Sulfide minerals present in mining wastes (e.g., open pits, mining waste rock, and tailings) are inevitably oxidized to form AMD when exposed to water, air, and chemolithotrophic acidophiles [1,2,3]. AMD is characterized by a high acidity and high concentration of toxic heavy metals/metalloids [2]. Thus, if it is not managed properly, AMD can undoubtedly cause considerable water and soil contamination, massive biodiversity loss in the aquatic ecosystem, and severe health impacts on nearby communities [4]. In order to achieve the long-term environmental sustainability regarding mining activities, effective and efficient technologies that can tackle the remediation of AMD are highly required.
Alkaline neutralizing chemicals, such as limestone and slaked lime, are conventionally adopted to treat AMD by decreasing the extreme acidity and precipitating the dissolved various poisonous metals/metalloids as hydroxides [5]. Despite effective remediation, the large volumes of sludges resulted from precipitation containing heavy metals/metalloids, which are categorized as hazardous materials and need further safe disposal. Other active and passive remediation technologies, such as bioremediation, phytoremediation, electrodialysis, wetlands, and adsorption, are also commonly used to treat AMD [4]. However, all those technologies have the drawbacks of either low remediation efficiency or high cost. Besides, some of those technologies generally produce new wastes (e.g., sludge, brines, and spent media), which require further treatment.
In fact, the high concentration of dissolved metals in AMD can be recovered by the bioelectrochemical system (BES) as valuable products to offset the cost of treatment. Therefore, the bioelectrochemical system is a promising technology for the treatment of AMD. The bioelectrochemical system is a special biological treatment process of sewage wastewater, which mainly utilizes the catalytic activity of electroactive microorganisms [6]. Under anaerobic conditions, electroactive microorganisms degrade organic pollutants and transmit electrons through external circuits to generate electricity [7]. As a new form of biomass energy utilization and pollutant removal, bioelectrochemical systems have received extensive attention due to their non-polluting characteristics [8,9]. Compared with a single strain, the electrogenic microbial consortium has many more advantages, such as higher electricity generation efficiency, a wider range of organic substrate, and higher coulombic efficiency [10,11]. Therefore, the enrichment and acclimation of electrogenic microbial consortium from environmental samples is a conventional and effective way to increase the power density of bioelectrochemical systems. Previous studies have shown that different energy substrates used to enrich electrogenic consortium can modulate the microbial community of electroactive biofilms [12,13]. However, studies focusing on the effects of typical energy substrates on the capacities of AMD treatment and microbial communities of BES are not available.
The purposes of this study were to compare the impacts of four typical energy substrates on the performance, microbial communities, and capacities of AMD treatment of enriched electroactive biofilms. Here, single-chamber microbial fuel cells were inoculated with anaerobic sludge and fed with glucose, acetate, ethanol, or lactate, respectively, as energy substrates to enrich electroactive biofilms. The performance of enriched electroactive biofilms was evaluated after the maximum voltage output was reached. The microbial communities of enriched electroactive biofilms were analyzed by high throughput sequence technology. The AMD treatment capacities of enriched electroactive biofilms were evaluated in dual-chamber microbial fuel cells. In addition, the mechanism for copper removal on the surface of the cathode was explored. These results indicated that the effects of organic chemical (that is usually contained in organic wastewater) on the enrichment of electroactive biofilm should be first evaluated in order to obtain an efficiently simultaneous treatment of organic wastewater and AMD.

2. Materials and Methods

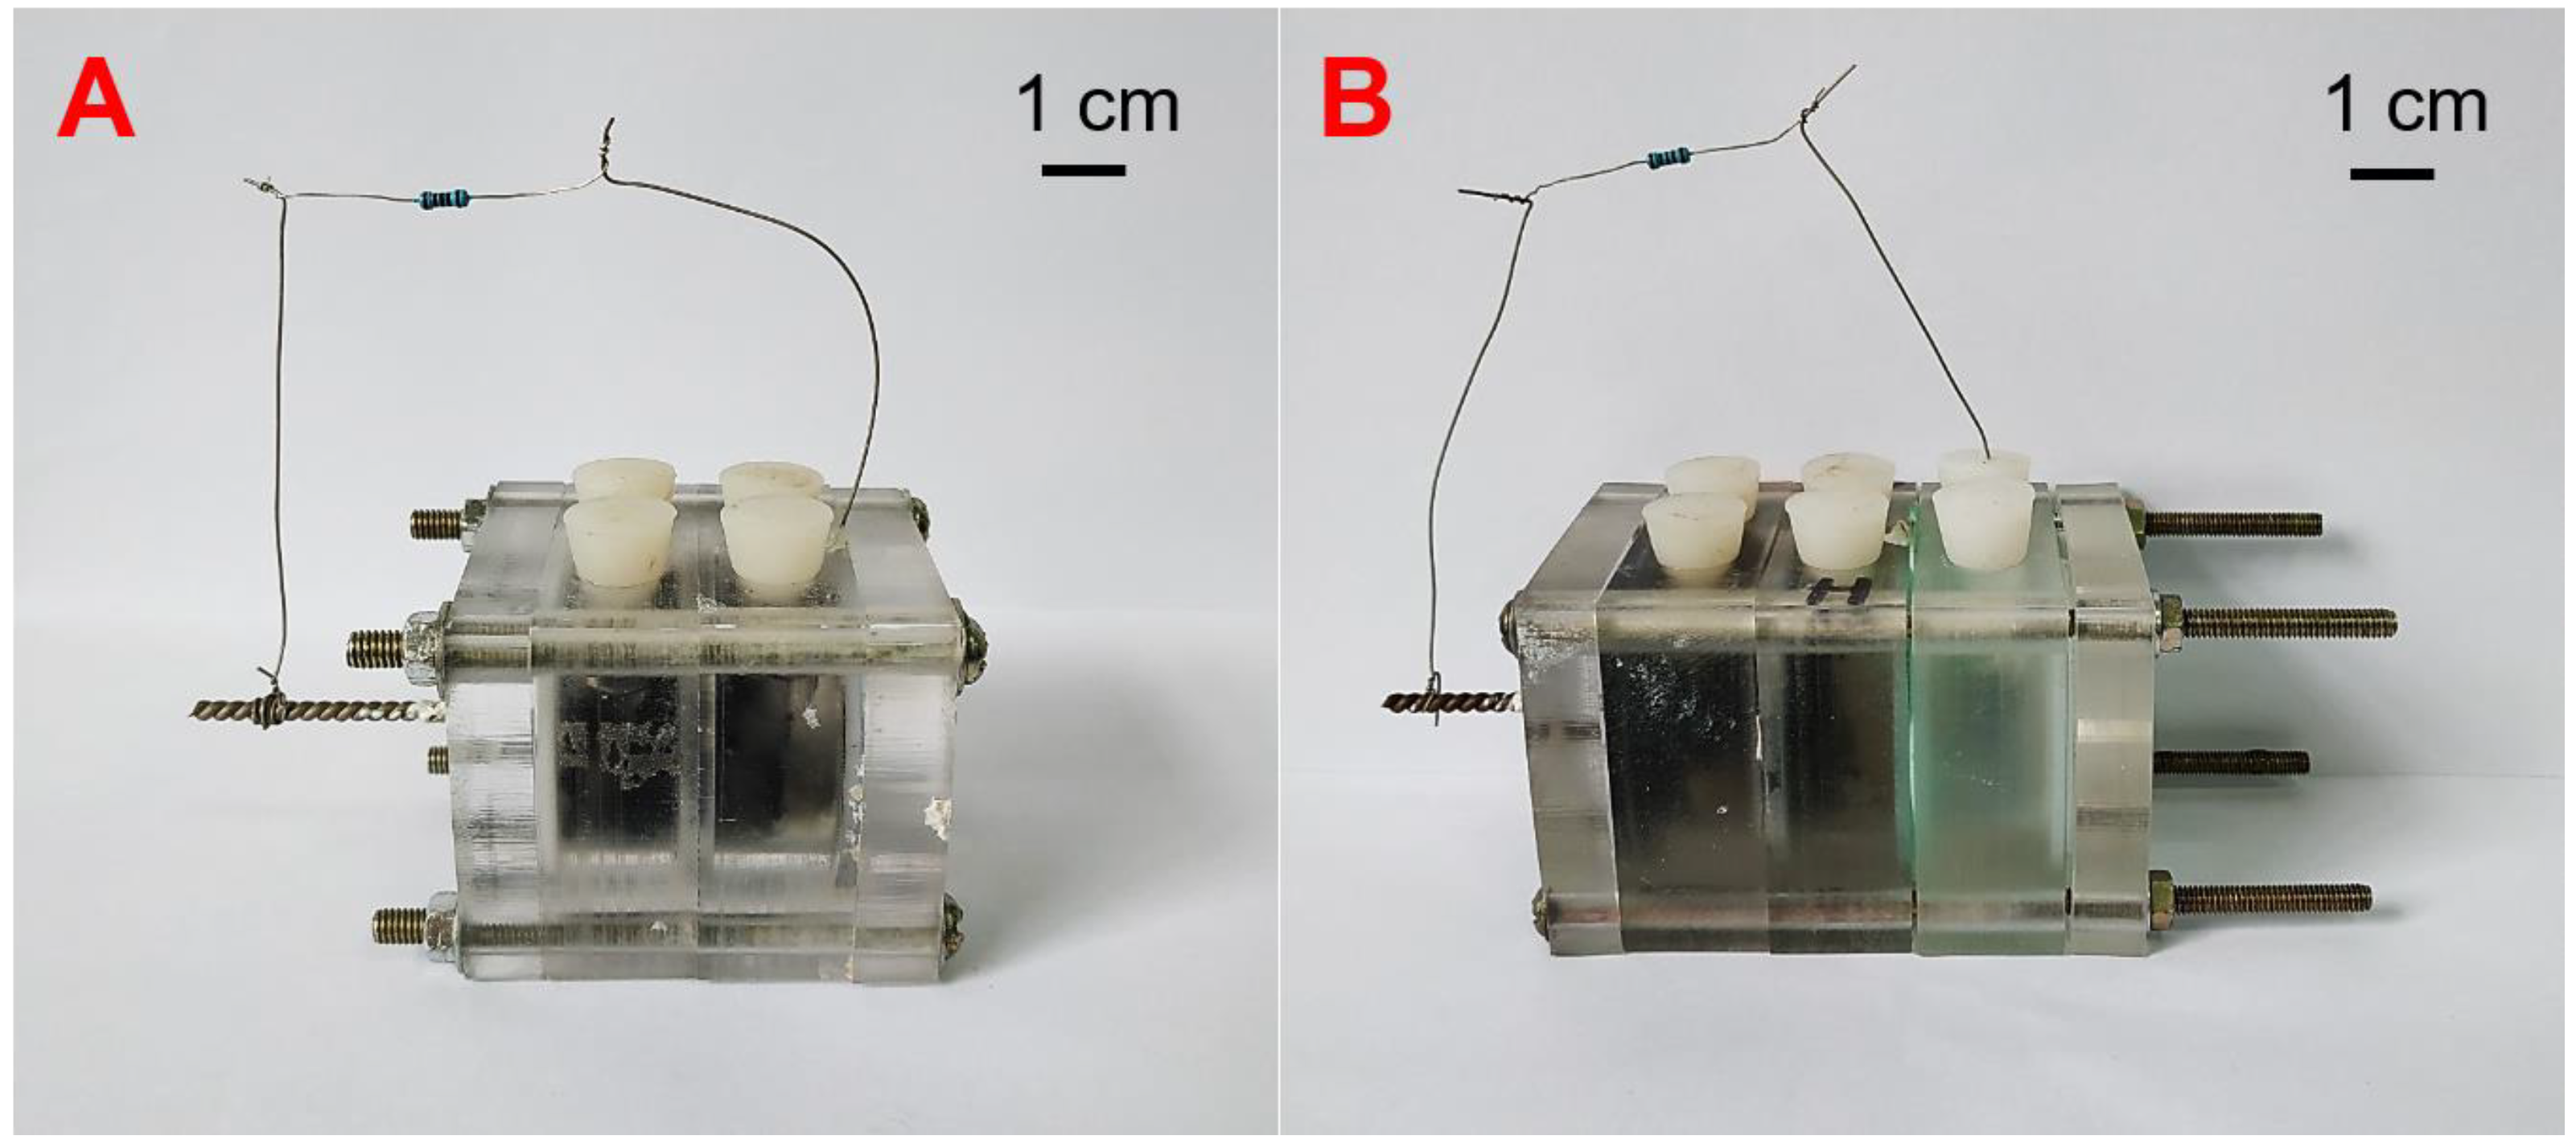
2.1. The Configuration of Microbial Fuel Cell (MFC) Reactors

A single-chamber MFC reactor was adopted to enrich electroactive biofilms (Figure 1A). The cube-shaped single-chamber MFC reactor with a cylindrical chamber (3 cm diameter × 4 cm length) was made of Perspex. Each MFC reactor (with a working volume 28 mL) consisted of a carbon brush (1.5 cm in radius × 3 cm in length) as anode and a carbon cloth with disk shape (projected surface area of 7.07 cm2) as a cathode. To save cost, the expensive Pt catalyst usually used to coat cathode was not adopted in this study [14]. The anode and cathode were connected by an external resistance of 1000 Ω by titanium wire. In order to remove contaminants on the surface, both carbon brush and carbon cloth were soaked overnight in acetone, followed by washing with distilled water and baked in a muffle furnace at 450 °C for 30 min. The dual-chamber MFC reactor was adopted to treat the simulated acid mine drainage (Figure 1B). The dual-chamber MFC reactor consisted of an anode chamber (28 mL) and a cathode chamber (15 mL). The anodes enriched in these single-chamber MFCs were then used in the double-chamber MFC. The two chambers were separated by an anion exchange membrane (Hangzhou Grion Environmental Technology, Co., Ltd, Hangzhou, China). The cathode and the electroactive anode of the dual-chamber MFC reactor were connected by an external resistance of 10 Ω. The cathode of the dual-chamber MFC reactor was made of carbon cloth with a rectangle shape (2.5 cm in length × 0.9 cm in width) immersed in simulated AMD.

2.2. Startup and Operation of MFC

The single-chamber MFCs were inoculated with anaerobic sludge obtained from a municipal wastewater treatment plant. Abiotic single-chamber MFCs without the inoculum of anaerobic sludge were set up. Duplicate single-chamber MFC reactors were set up for each energy substrate. The medium used to enrich electroactive biofilms contained 20 mM energy substrate (glucose, acetate, ethanol, or lactate, respectively), trace element solution (100 μL/L), and Wolfe’s vitamins (0.5 mL/L) in 50 mM phosphate buffer (4.56 g/L, Na2HPO4; 2.45 g/L, NaH2PO4; 0.31 g/L, NH4Cl; 0.13 g/L, KCl; 0.02 g/L, CaCl2), as modified from previous study [15]. The trace element solution contained the following chemicals per liter: 3.00 g MgSO4, 0.25 g FeSO4·7H2O, 0.15 g ZnCl2, 0.60 g MnSO4·H2O, 0.01 g H3BO3, 0.01 g CuSO4·2H2O, 0.03 g NiCl2·6H2O, 0.03 g Na2MoO4, 0.20 g CoCl2, 0.03 g Na2WO4·2H2O, and 0.15g KAl(SO4)2·12H2O. All the chemicals used in this study were analytic pure (Sinopharm Chemical Reagent Co., Ltd, Shanghai, China). These MFCs were operated in a fed-batch mode in a temperature-controlled incubator (30 °C). The medium was replaced once the output voltage of MFC declined below 20 mV. The medium used to maintain the growth of enriched bioelectroactive biofilms in the anode chamber of these dual-chamber MFCs was identical with that used for the single-chamber MFCs. The cathode chamber was fed with the simulated AMD that was diluted from the leachate of chalcopyrite bioleaching with acid water (pH 1.80) [16]. The simulated AMD mainly contained 348.87 mg/L Cu2+, 45.06 mg/L Fe3+, and 7.03 mg/L Fe2+ with a pH value of 1.80. The Cu2+ and Fe3+ could be served as terminal electron acceptors. Abiotic double-chamber MFCs without the enriched electroactive biofilm were set up. Duplicate double-chamber MFC reactors containing the electroactive biofilms enriched with each of these different energy substrates were set up to treat the simulated AMD.

2.3. Analysis and Calculations

The voltage across the 1000 Ω external resistance of single-chamber MFCs was recorded every 50 s by the data acquisition unit (ADAM-4017 Analog Input Model, Advantech Co., Ltd, Shenzhen, China) connected to the computer. The power density and polarization curve of single-chamber MFCs were analyzed and calculated, as described in a previous study [17]. The power density was normalized to the geometrical surface area of the anode. Coulombic efficiency of single-chamber MFCs was calculated according to a previous study [18]. Electrochemical impedance spectroscopy (EIS) was applied to determine the internal resistance of these single-chamber MFCs enriched with different energy substrates using a potentiostat (Gamry reference 600+ workstation, Philadelphia, Pennsylvania, USA). The EIS measurements were conducted using a three-electrode configuration, with a saturated Ag/AgCl reference electrode and the anode serving as the working electrode and the cathode as the counter electrode. For each experimental condition, the EIS measurement was conducted in the frequency range from 1000 kHz to 0.01 Hz with an AC amplitude of 5 mV and analyzed by the software of Zview. The concentration of Fe2+ and Fe3+ in the cathode chamber was determined using the phenanthroline method [19]. The concentration of Cu2+ was quantified with bis-cyclohexanone oxalyldihydrazone (BCO) [20]. The pH value of catholyte was measured with a pH-meter (SJ-4A, Leichi, Shanghai, China).
Scanning electron micrograph (SEM, JSM-6490LV, JEOL, Tokyo, Japan) was adopted to observe the enriched electroactive biofilms and the structure of cathode surfaces. The energy dispersive X-ray spectrometry (EDXS; Elect super, EDAX AMETEK, Kleve, Germany) equipped for SEM was used to examine the morphologies and compositions of the deposits on cathode electrodes after the treatment of AMD. The products deposited on the cathode electrode were determined by the X-ray powder diffraction (XRD) (D8 Advance, Bruker Corporation, Karlsruhe, Germany), in which data were recorded in the 2θ range of 10 to 80 degree with a step of 0.02 degree.

2.4. Genomic DNA Extraction and MiSeq Sequencing of Bioelectroactive Biofilms

The electroactive biofilms enriched with different energy substrates in MFCs with stable output voltages were sampled to extract the total genomic DNA by the DNeasy PowerSoil DNA Isolation Kit (QIAGEN, Chatsworth, CA, USA). Illumina adapter sequence, together with the universal primer pair 515FmodF (5’-GTGYCAGCMGCCGCGGTAA-3’) and 806RmodR (5’-GGACTACNVGGGTWTCTAAT-3’), were used to amplify the V4 region of the bacterial and archaeal 16S rDNA genes. PCR amplification was performed on Applied Biosystems GeneAmp® 9700 thermal cycler (ABI Inc., Foster City, CA, USA). PCR system (25 μL) consisted of 1 μL of template DNA, 1 μL (10 nM) of each primer, 9.5 μL of DNase-free deionized water, and 12.5 μL of 2× Taq PCR Master Mix (TransGen, Beijing, China). Triplicate amplifications for each genomic DNA sample were amplified and blended to minimize potential biases of amplification, which were separated by agarose gel electrophoresis (2%, w/v) and recovered using AxyPrep DNA gel extraction kit (Axygen Scientific Inc., Union City, CA, USA). The concentration of the recovered PCR products was measured using QuantiFluor™-ST Fluorometer (Promega Corporation, Madison, WI, USA). Sequencing libraries were prepared and sequenced by the Illumina MiSeq platform with the sequencing strategy PE250 (Shanghai Majorbio Bio-pharm Technology Co., Ltd, Shanghai, China).
The raw data of 16S rRNA gene sequences from MiSeq sequencing was in FASTQ format. The Illumina adapter and other specific sequences were trimmed before the following process. Then, the pair-end reads with at least 10 bp overlap, and lower than 5% mismatches were merged using the Fast Length Adjustment of SHort reads (FLASH) software [21]. The sequences shorter than 240 bp, chimeric sequences, and low-quality sequences were filtered, trimmed, and removed [22]. Operational taxonomic units (OTUs) were obtained based on the threshold of 97% similarity by using UPARSE [23]. The taxonomy of OTU representative sequences was phylogenetically assigned to taxonomic classifications by the Ribosomal Database Project (RDP) classifier at the threshold of 70% for confidence based on the Bayesian algorithm [24]. Community richness, Ace and Shannon indices, and Chao1 richness estimates were obtained by MOTHUR analysis [25].

3. Results and Discussion

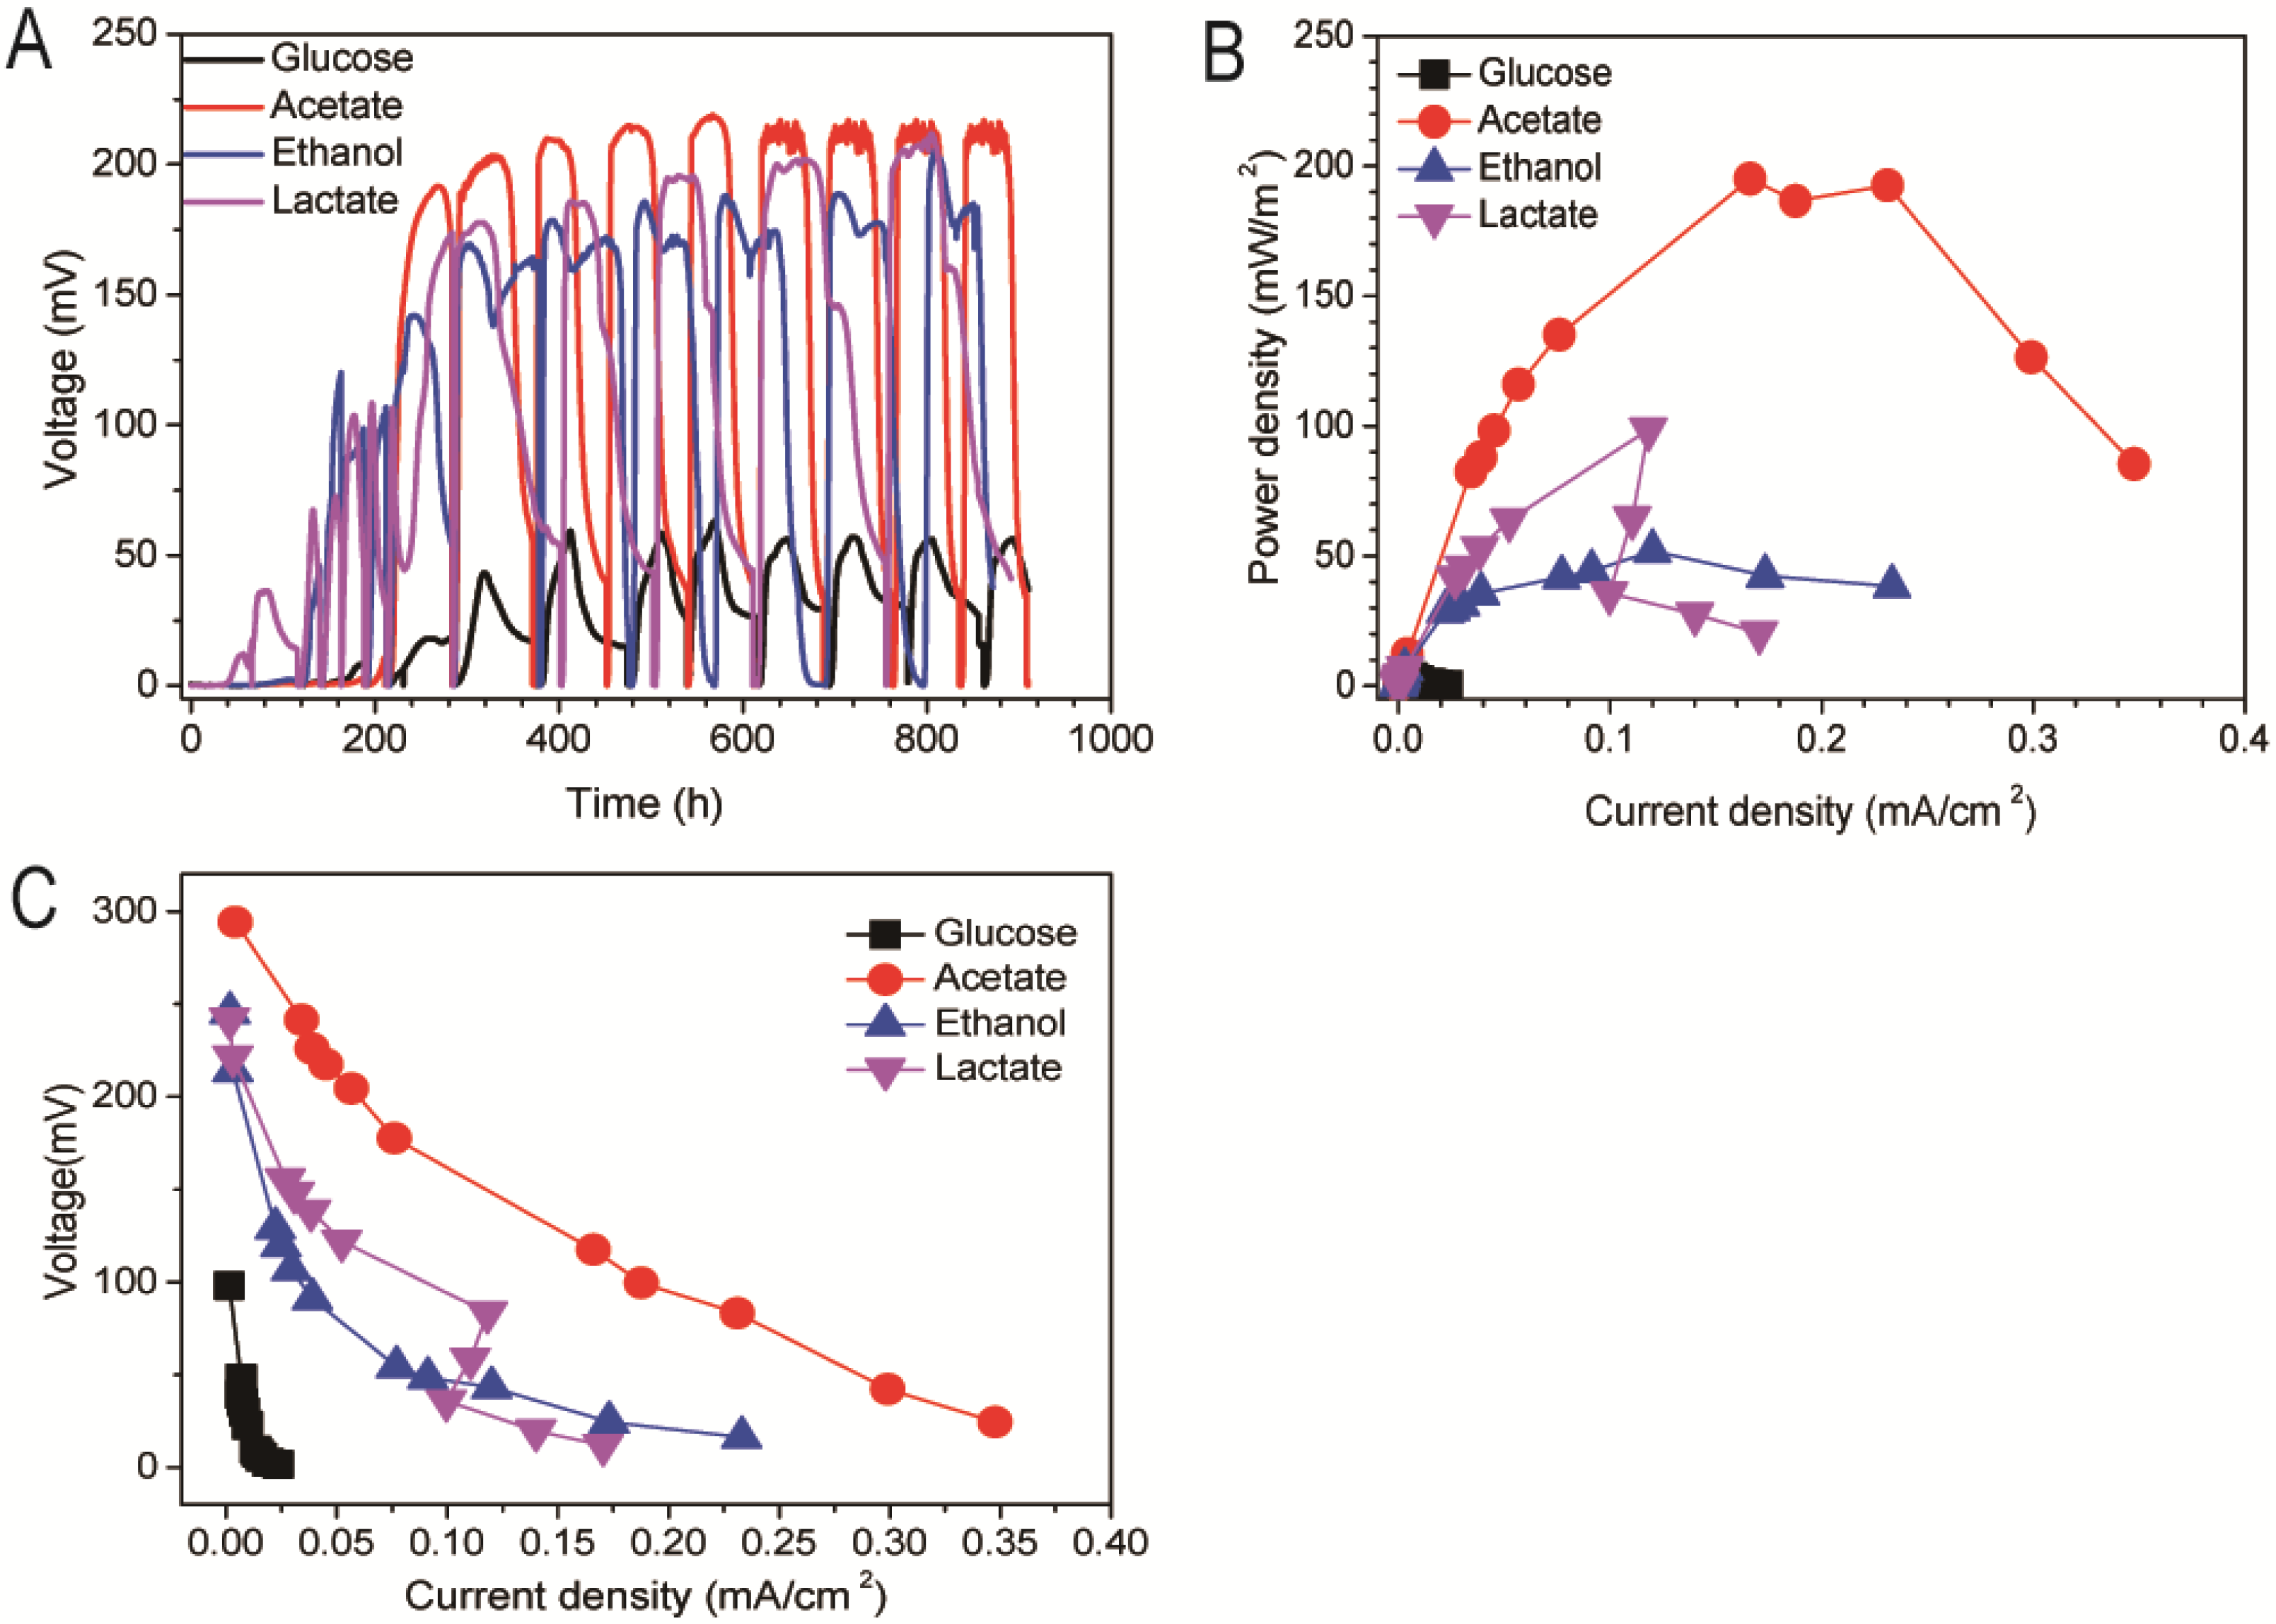
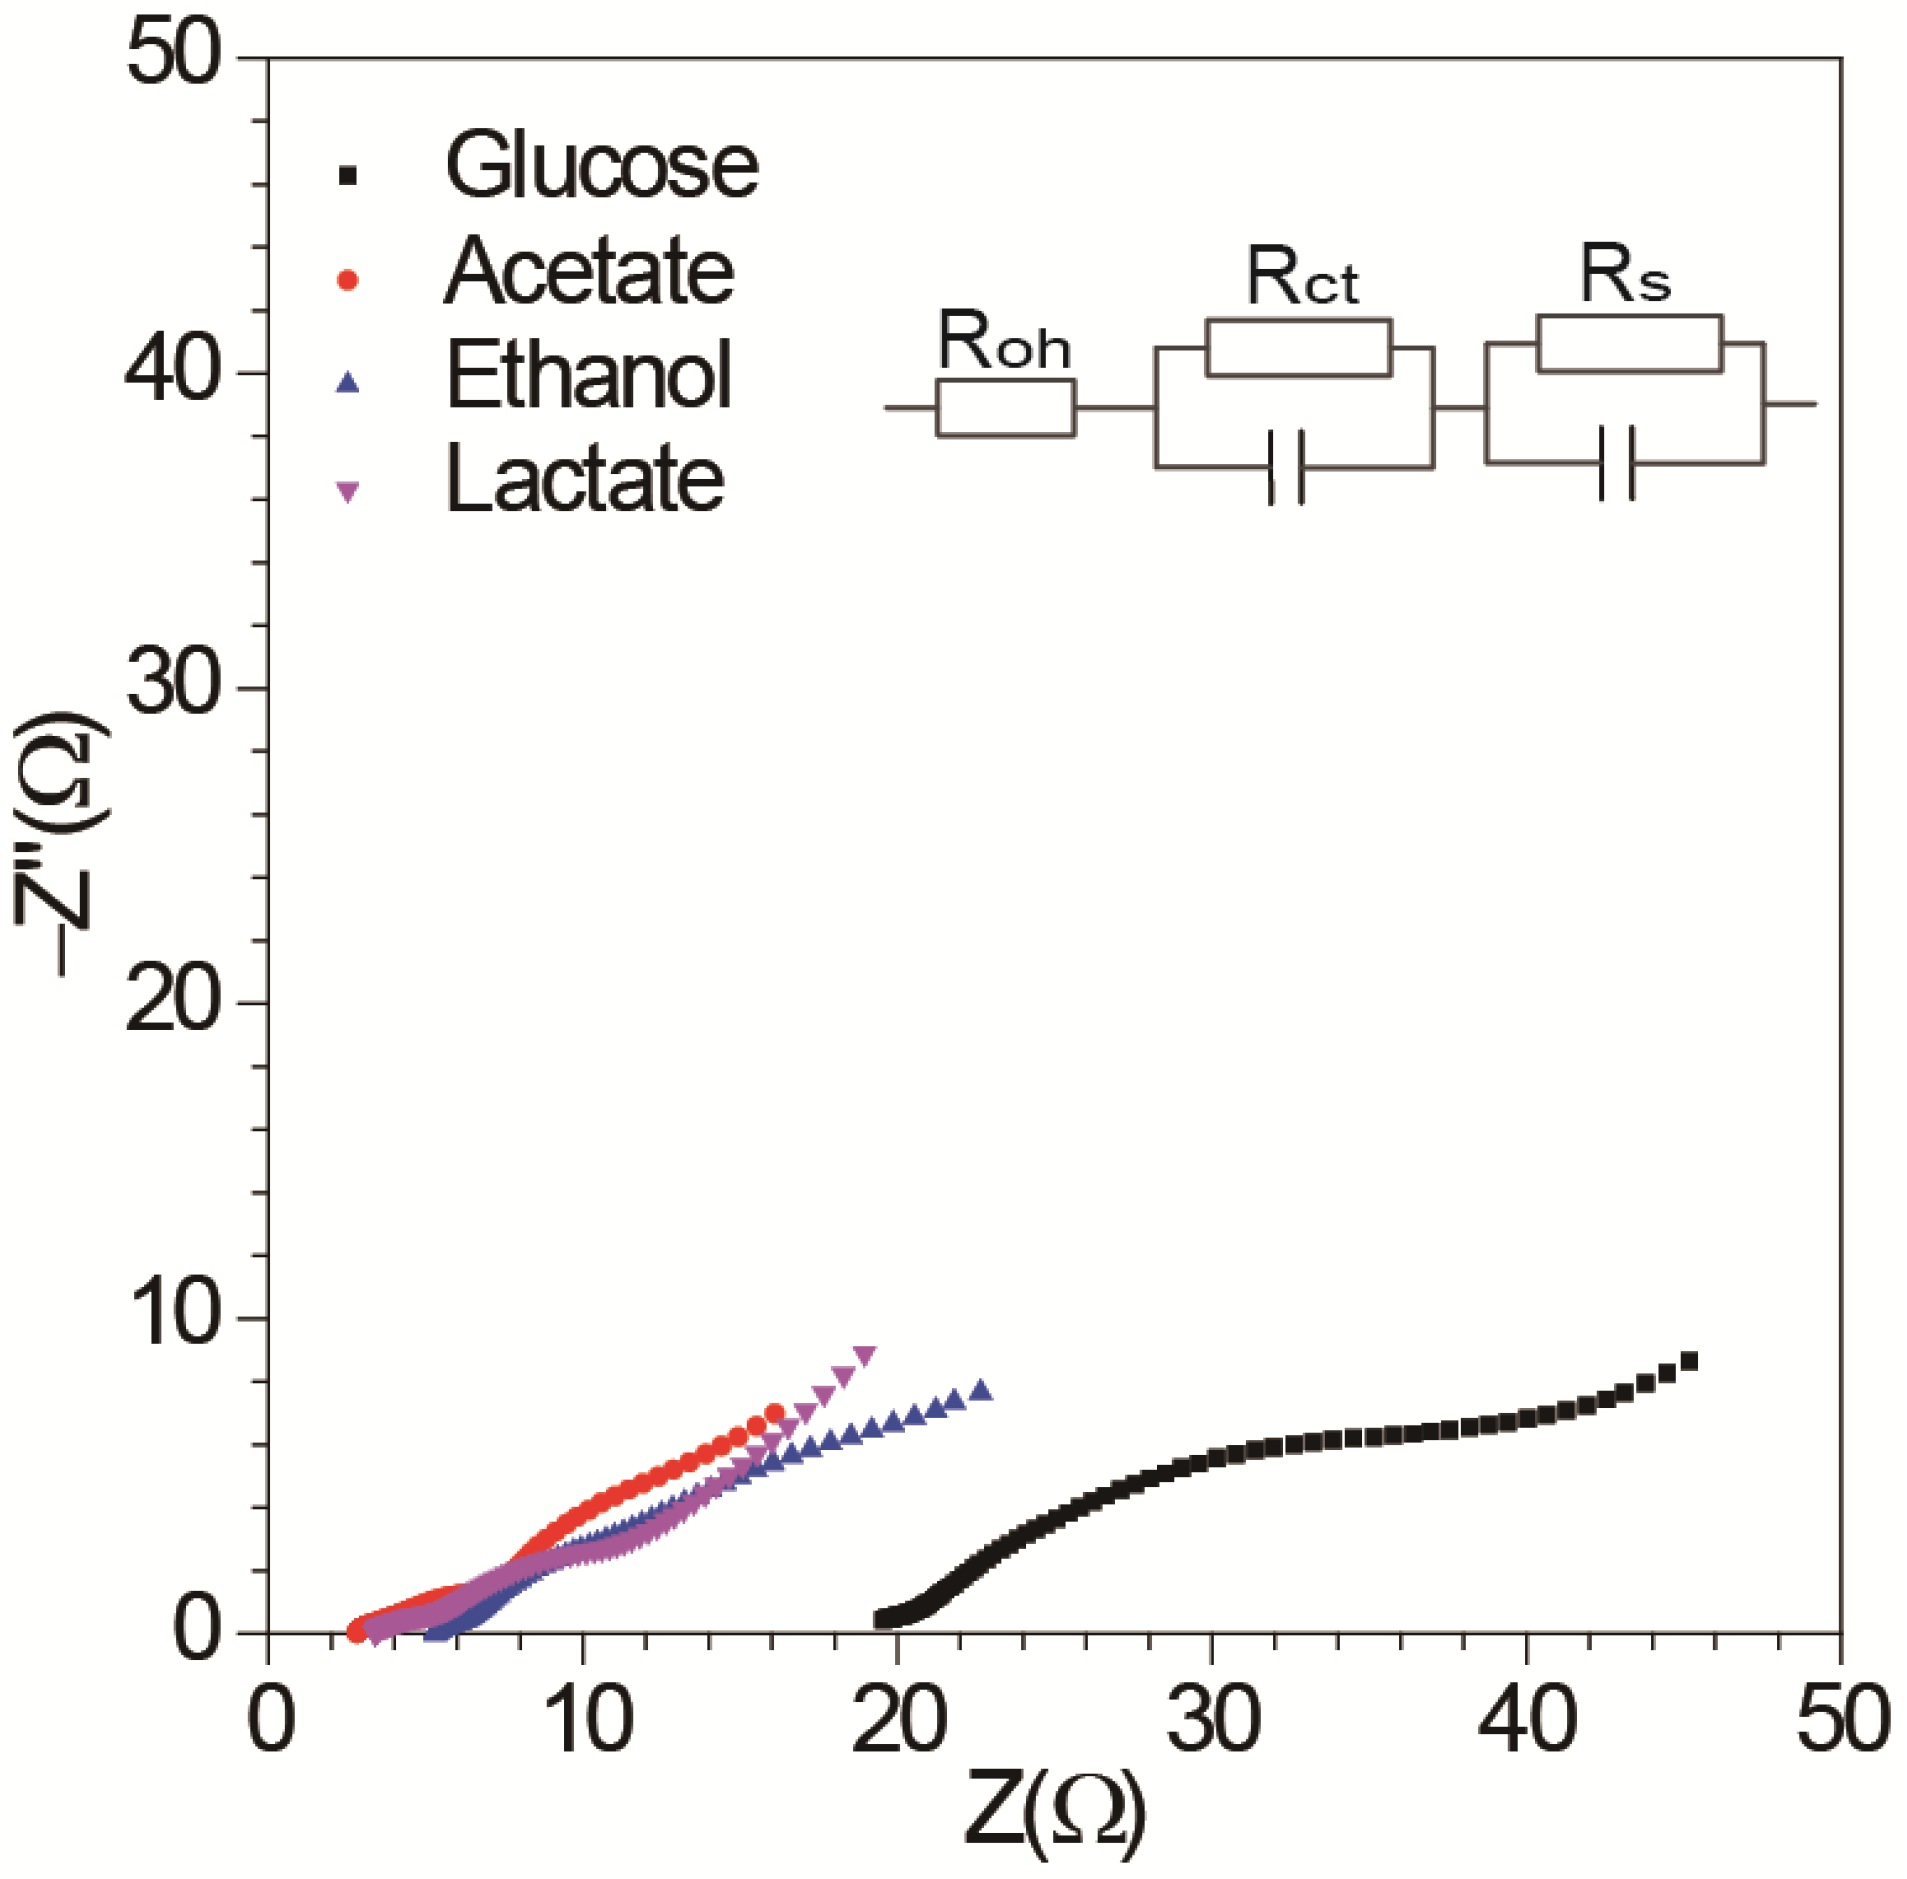
3.1. Effect of Different Energy Substrates on Single Chamber MFC Performance

Different energy substrates (i.e., glucose, acetate, ethanol, or lactate) affected the startup, maximum voltage output, power density, and coulombic efficiency of single-chamber microbial fuel cells (Figure 2). The output voltage of the MFCs enriched with lactate as an energy substrate began to be detectable only 40 h after the inoculation with anaerobic sludge (Figure 2A). However, in order to generate a detectable output voltage, 120, 210, or 220 h was required, respectively, for the MFCs enriched with ethanol, acetate, or glucose. Compared with the maximum voltage output (55 mV) obtained by glucose-fed-MFC, much higher maximum voltage output (187 to 212mV) was achieved by MFCs fed individually with the other three energy substrates. Around 400 h after the initial inoculation, the output voltage of each MFC reached the maximum. Thereafter, the output voltage could rapidly increase to the maximum value immediately after the removal of planktonic microorganisms by replenishing with growth medium containing each energy substrate (Figure 2A). This rapid recovery of maximum output voltage indicated that the current was mainly generated by the sessile microorganisms on the surface of the anode. Acetate-fed-MFC showed the highest power density (195.07 mW/m2), followed by lactate (98.63 mW/m2), ethanol (52.02 mW/m2), and glucose (3.23 mW/m2) (Figure 2B). As indicated by the polarization test, the output voltage of acetate-fed-MFC was much higher than those of other MFCs at different external resistance (Figure 2C). On the contrary, the output voltage of glucose-fed-MFC was the lowest (Figure 2C). Coulombic efficiencies of these MFCs were dependent on the energy substrates. The MFCs enriched with lactate had the highest coulombic efficiency (33.34%), followed by the MFCs enriched with ethanol (14.30%), acetate (12.53%), and glucose (1.98%). The lowest coulombic efficiency obtained by the glucose-fed-MFCs was consistent with the previous studies because the glucose is a fermentable substrate that can be utilized by diverse microorganisms besides the exoelectrogens enriched in the electroactive biofilms under the anaerobic condition [12,26].
The ohmic resistance and charge transfer resistances of these MFCs were obtained by electrochemical impedance spectroscopy (EIS) (Figure 3). As described in the previous study, the impedance at the high-frequency limit is the ohmic resistance, and the diameter of the semicircle is the charge transfer resistance [27]. The ohmic resistance of MFC containing the bioelectroactive biofilms enriched with glucose was 19.55 Ω. However, the MFCs containing the bioelectroactive biofilms enriched with acetate (2.81 Ω), lactate (3.39 Ω), and ethanol (5.31 Ω) had much lower ohmic resistance (Figure 3). The charge transfer resistances of the MFCs containing different bioelectroactive biofilms were also dependent on the energy substrate used for enrichment. The charge transfer resistances of the MFCs containing different bioelectroactive biofilms enriched with glucose, acetate, ethanol, and lactate were 33.67 Ω, 7.39 Ω, 15.00 Ω, and 15.38 Ω, respectively. Discrepancy regarding startup, maximum voltage output, power density, coulombic efficiency, and charge transfer resistances of single-chamber MFCs enriched with different energy substrate implied that the electroactive biofilms enriched on the surface of anode were different in terms of the microbial community.

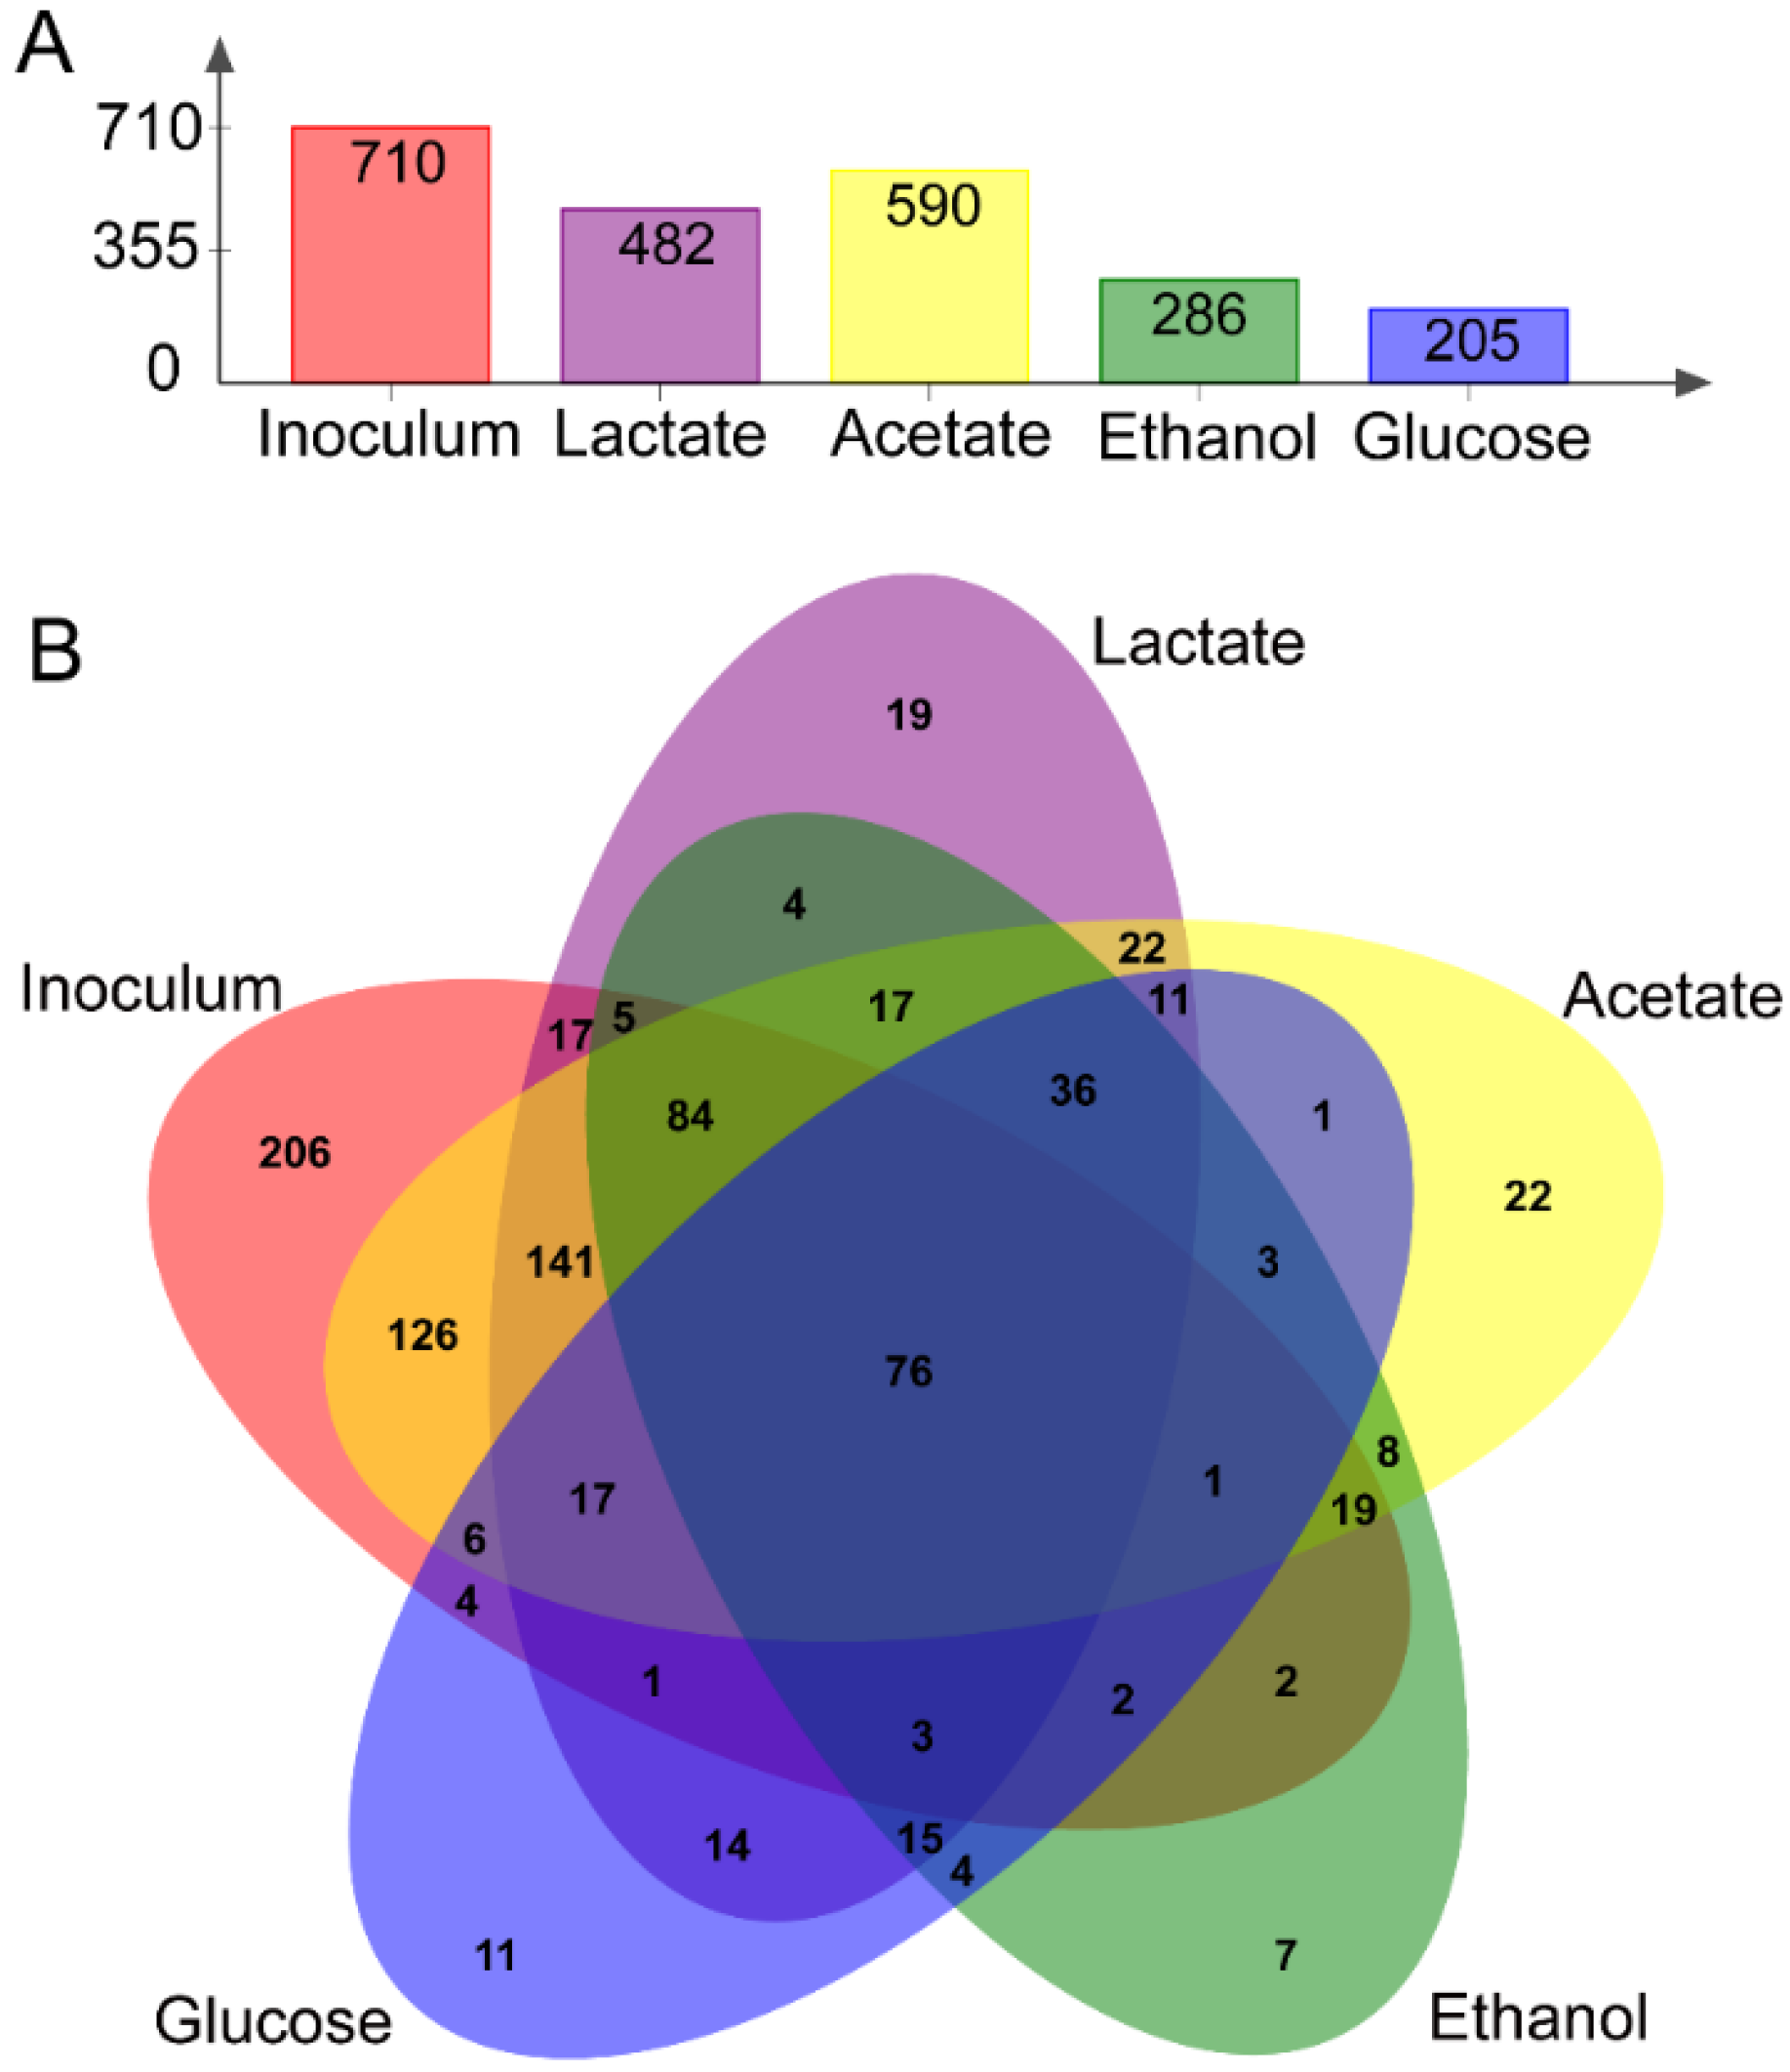
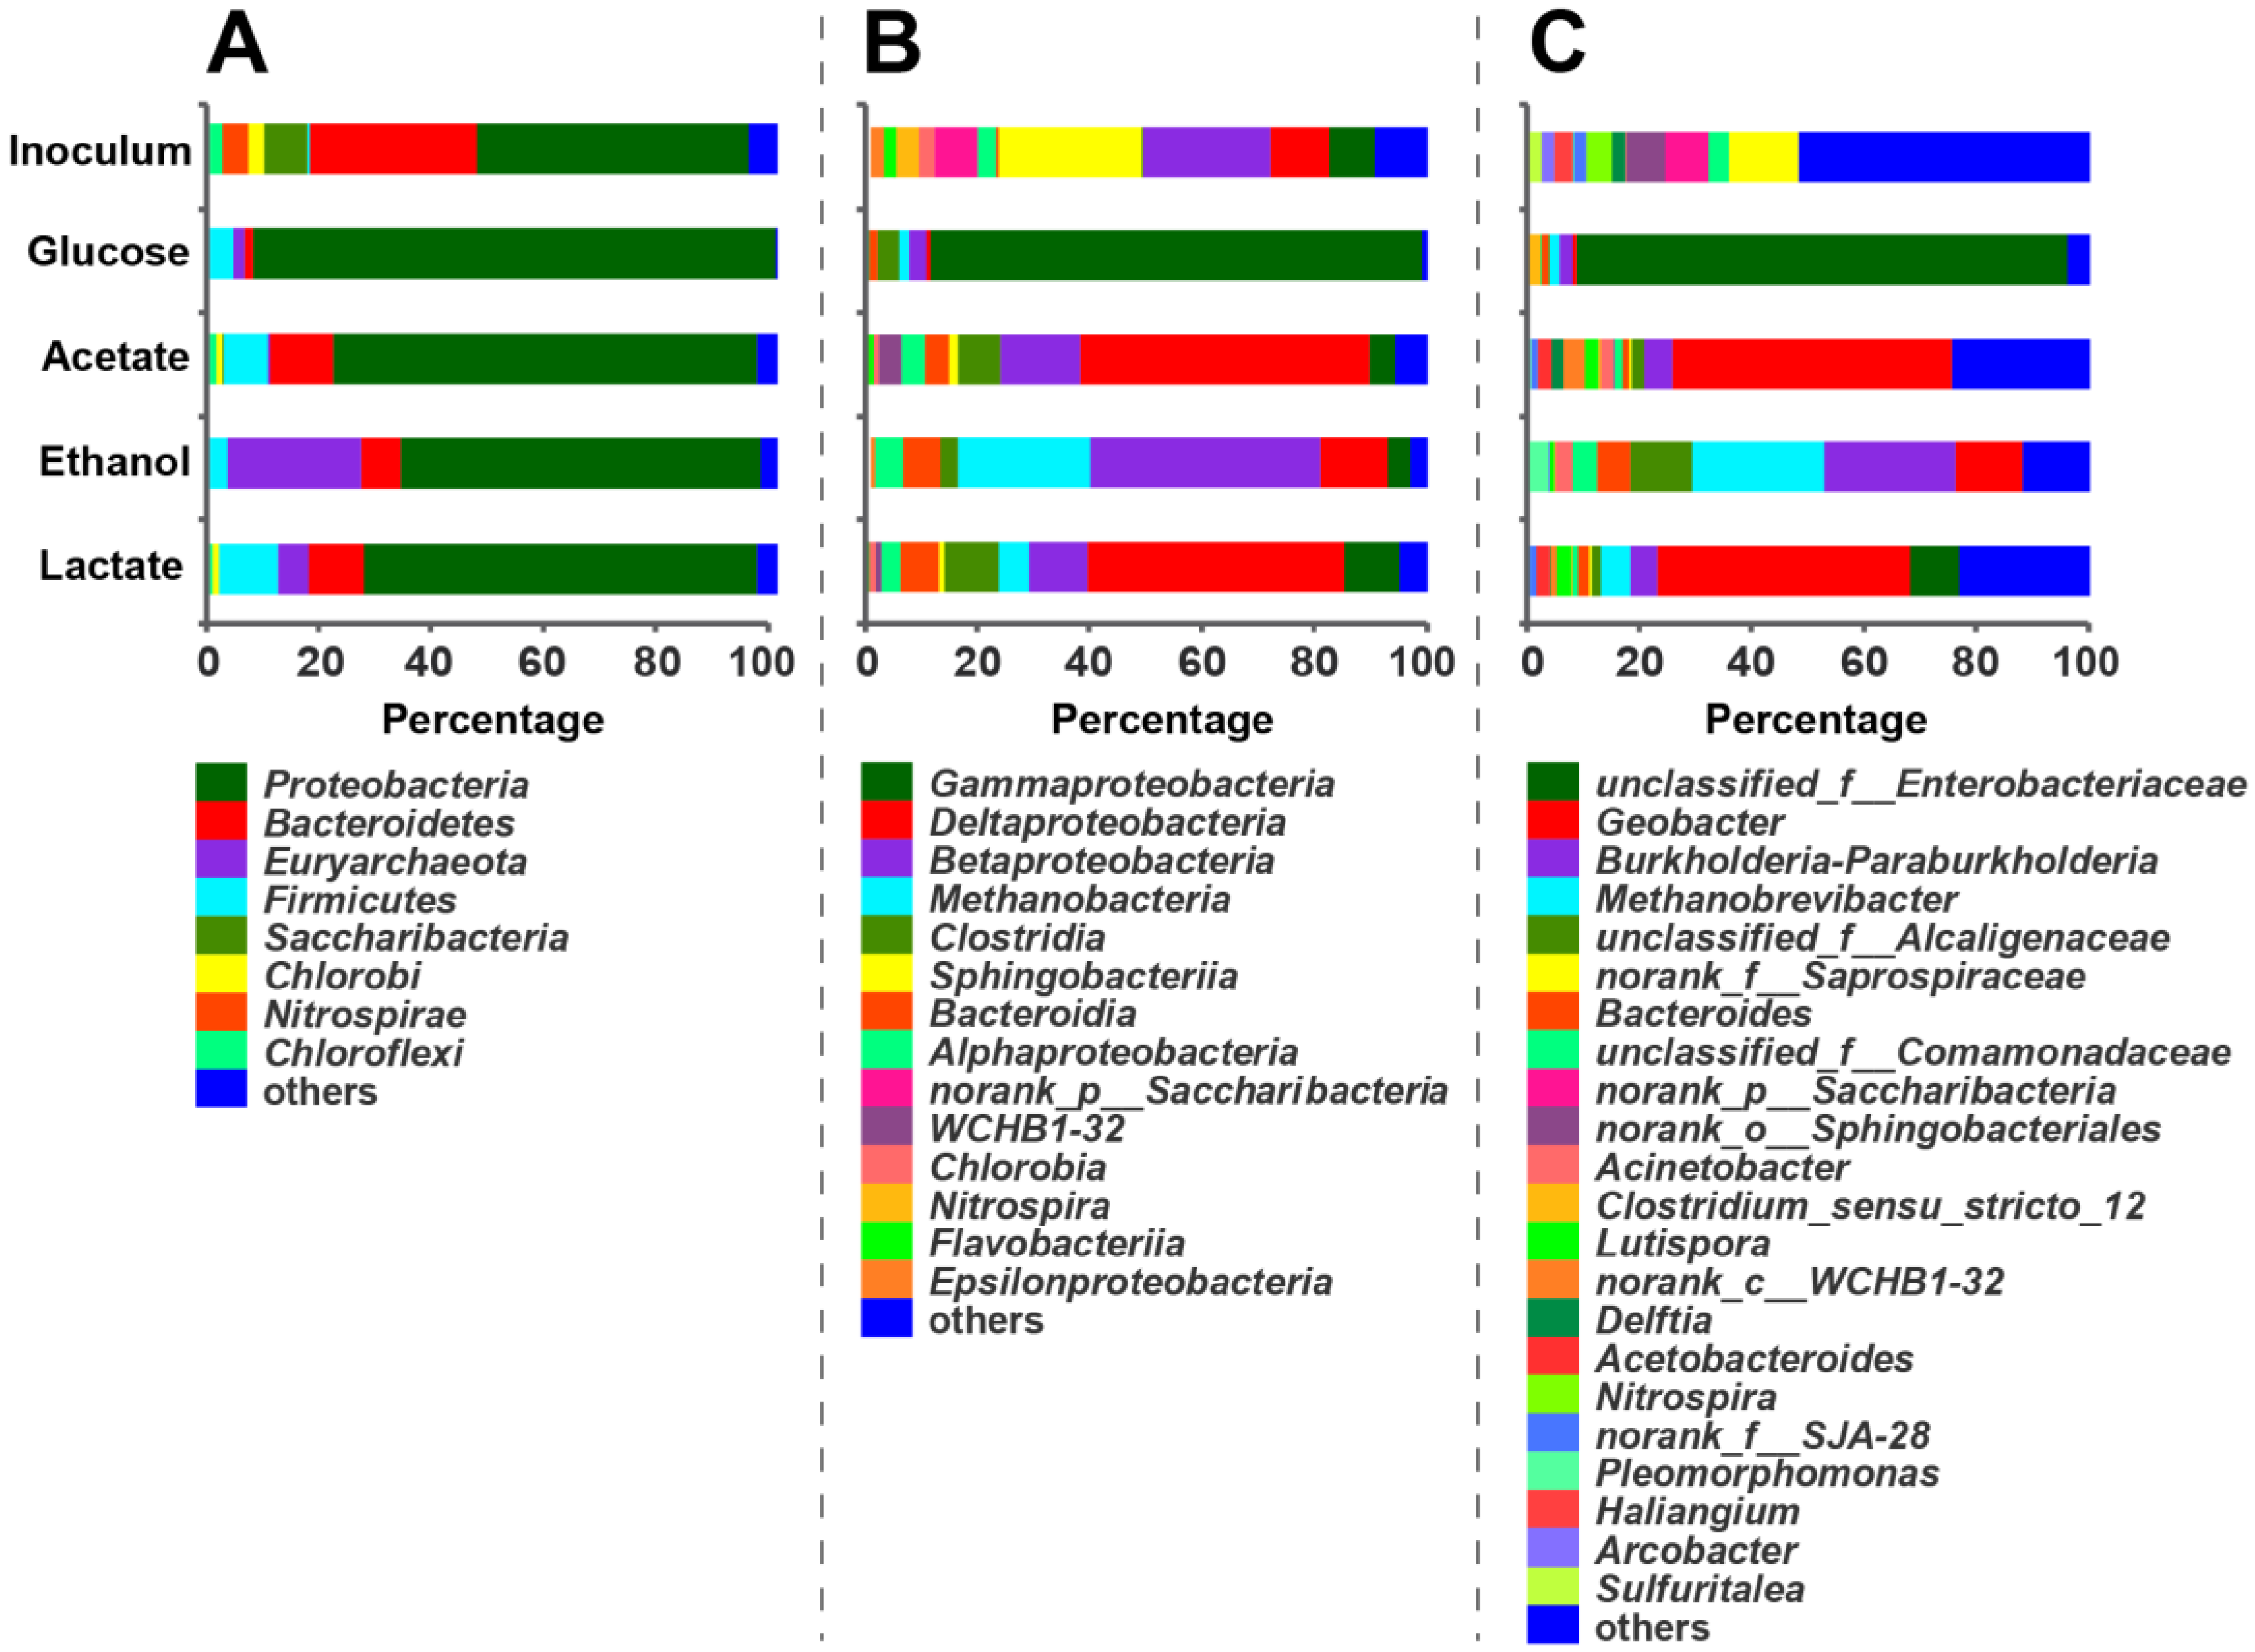
3.2. Microbial Community of Anodic Bioelectroactive Biofilms

In contrast to the abiotic control, electroactive biofilms were enriched on the surface of the anode of MFCs when they reached the maximum output voltage, as revealed by SEM analysis (Figure 4). The existence of electroactive biofilms on the surface of anode demonstrated the importance of electroactive biofilms for the generation of electricity. These electroactive biofilms consisted of microorganisms with different cell morphologies. This indicated the diversity of electroactive biofilm regarding the microbial community.
In order to investigate the microbial community of electroactive biofilms enriched by different energy substrates (i.e., glucose, acetate, ethanol, or lactate), approximately 32,430 to 97,701 high-quality sequencing reads were obtained from each sample (Table 1). A total number of 710 OTU was detected in the inoculated anaerobic sludge (Figure 5). During the enrichment of the bioelectroactive biofilms process, there was a succession of microorganisms at the OTU level. After MFCs reached the stable maximum output voltage, there were 590,482,286 and 205 OTUs in the bioelectroactive biofilms enriched by acetate, lactate, ethanol, and glucose, respectively (Figure 5). Both the microbial abundance and microbial diversity of these electroactive biofilms enriched by different energy substrates were less than that of the inoculated anaerobic sludge, as indicated by the Shannon index and Simpson index listed in Table 1. These data indicated that the microbial abundance and microbial diversity of these electroactive biofilms were dependent on the energy substrate.
The most dominant phyla were Proteobacteria, Bacteroidetes, and Saccharibacteria in the inoculated anaerobic sludge (Figure 6). Both Proteobacteria and Bacteroidetes remained as the dominant phyla in these enriched electroactive biofilms. The proportion of Proteobacteria increased significantly, while the proportion of Bacteroidetes decreased remarkably in these electroactive biofilms (Figure 6A). Firmicutes was enriched as one of the dominant phyla in these electroactive biofilms. It was worth mentioning that Euryarchaeota was enriched in these electroactive biofilms, especially in the electroactive biofilms fed with ethanol as an energy substrate.
The major classes in the electroactive biofilms were different from that of the anaerobic sludge (Figure 6B). Gammaproteobacteria, Deltaproteobacteria, and Betaproteobacteria were the three major classes within the inoculated anaerobic sludge and the electroactive biofilms enriched, respectively, with acetate, ethanol, or lactate. However, only Gammaproteobacteria constituted as the major class of the electroactive biofilms enriched with glucose (87.70%). Sphingobacteriia (25.48%) and norank_p_Saccharibacteria (7.66%) were two major classes that existed in the inoculated anaerobic sludge, both of which were shifted as minor constituents in these electroactive biofilms.
The major genera in anodic electroactive biofilms were modulated by energy substrates (Figure 6C). The unclassified_f_Enterobacteriaceae (87.48%) was predominant in the glucose-fed-MFC, while Geobacter species only accounted for 0.63%. The genera of Methanobrevibacter (23.70%), Burkholderia-Paraburkholderia (23.47%), and Geobacter (11.90%) were the major genera enriched in the ethanol-fed-MFC. Geobacter was most predominant in the MFC enriched by lactate (45.28%) or acetate (49.72%), which corroborated with a previous study [28]. Results showed that the abundance of classic exoelectrogens Geobacter species correlated to the electricity-generation capacities of electroactive biofilms. It is worth mentioning that the Euryarchaeota was enriched in these electroactive biofilms, especially in the electroactive biofilms fed with ethanol as an energy substrate (Table 2). Recent studies have shown that quorum sensing (QS) plays an important role in shaping the dynamics of microbial community structure and enhancing the electron transfer process in the anodic electroactive biofilms of MFCs [29,30].
The expression of functional genes in either single strain or microbial consortium has been altered by various physicochemical parameters [16,31,32]. Therefore, it is necessary to identify and compare the important genes involved in the electron transfer for electricity generation of these electrochemical biofilms in MFCs by comparative metagenomic and transcriptomic analyses in the future. The extracellular polymeric substances (EPS) are important for the functional roles of single strain and consortium [30,33,34]. The EPS of electroactive biofilm contains proteins, glycoproteins, extracellular DNA, glycolipids, and humic substances [30]. Previous studies have shown that cytochrome proteins, pili, and nanowire in EPS are directly involved in electron transfer [30,35]. Characterization of the compositions and redox properties of the EPS of these enriched electrochemical biofilms will provide novel insights into the functional role of EPS in mediating electron transfer.

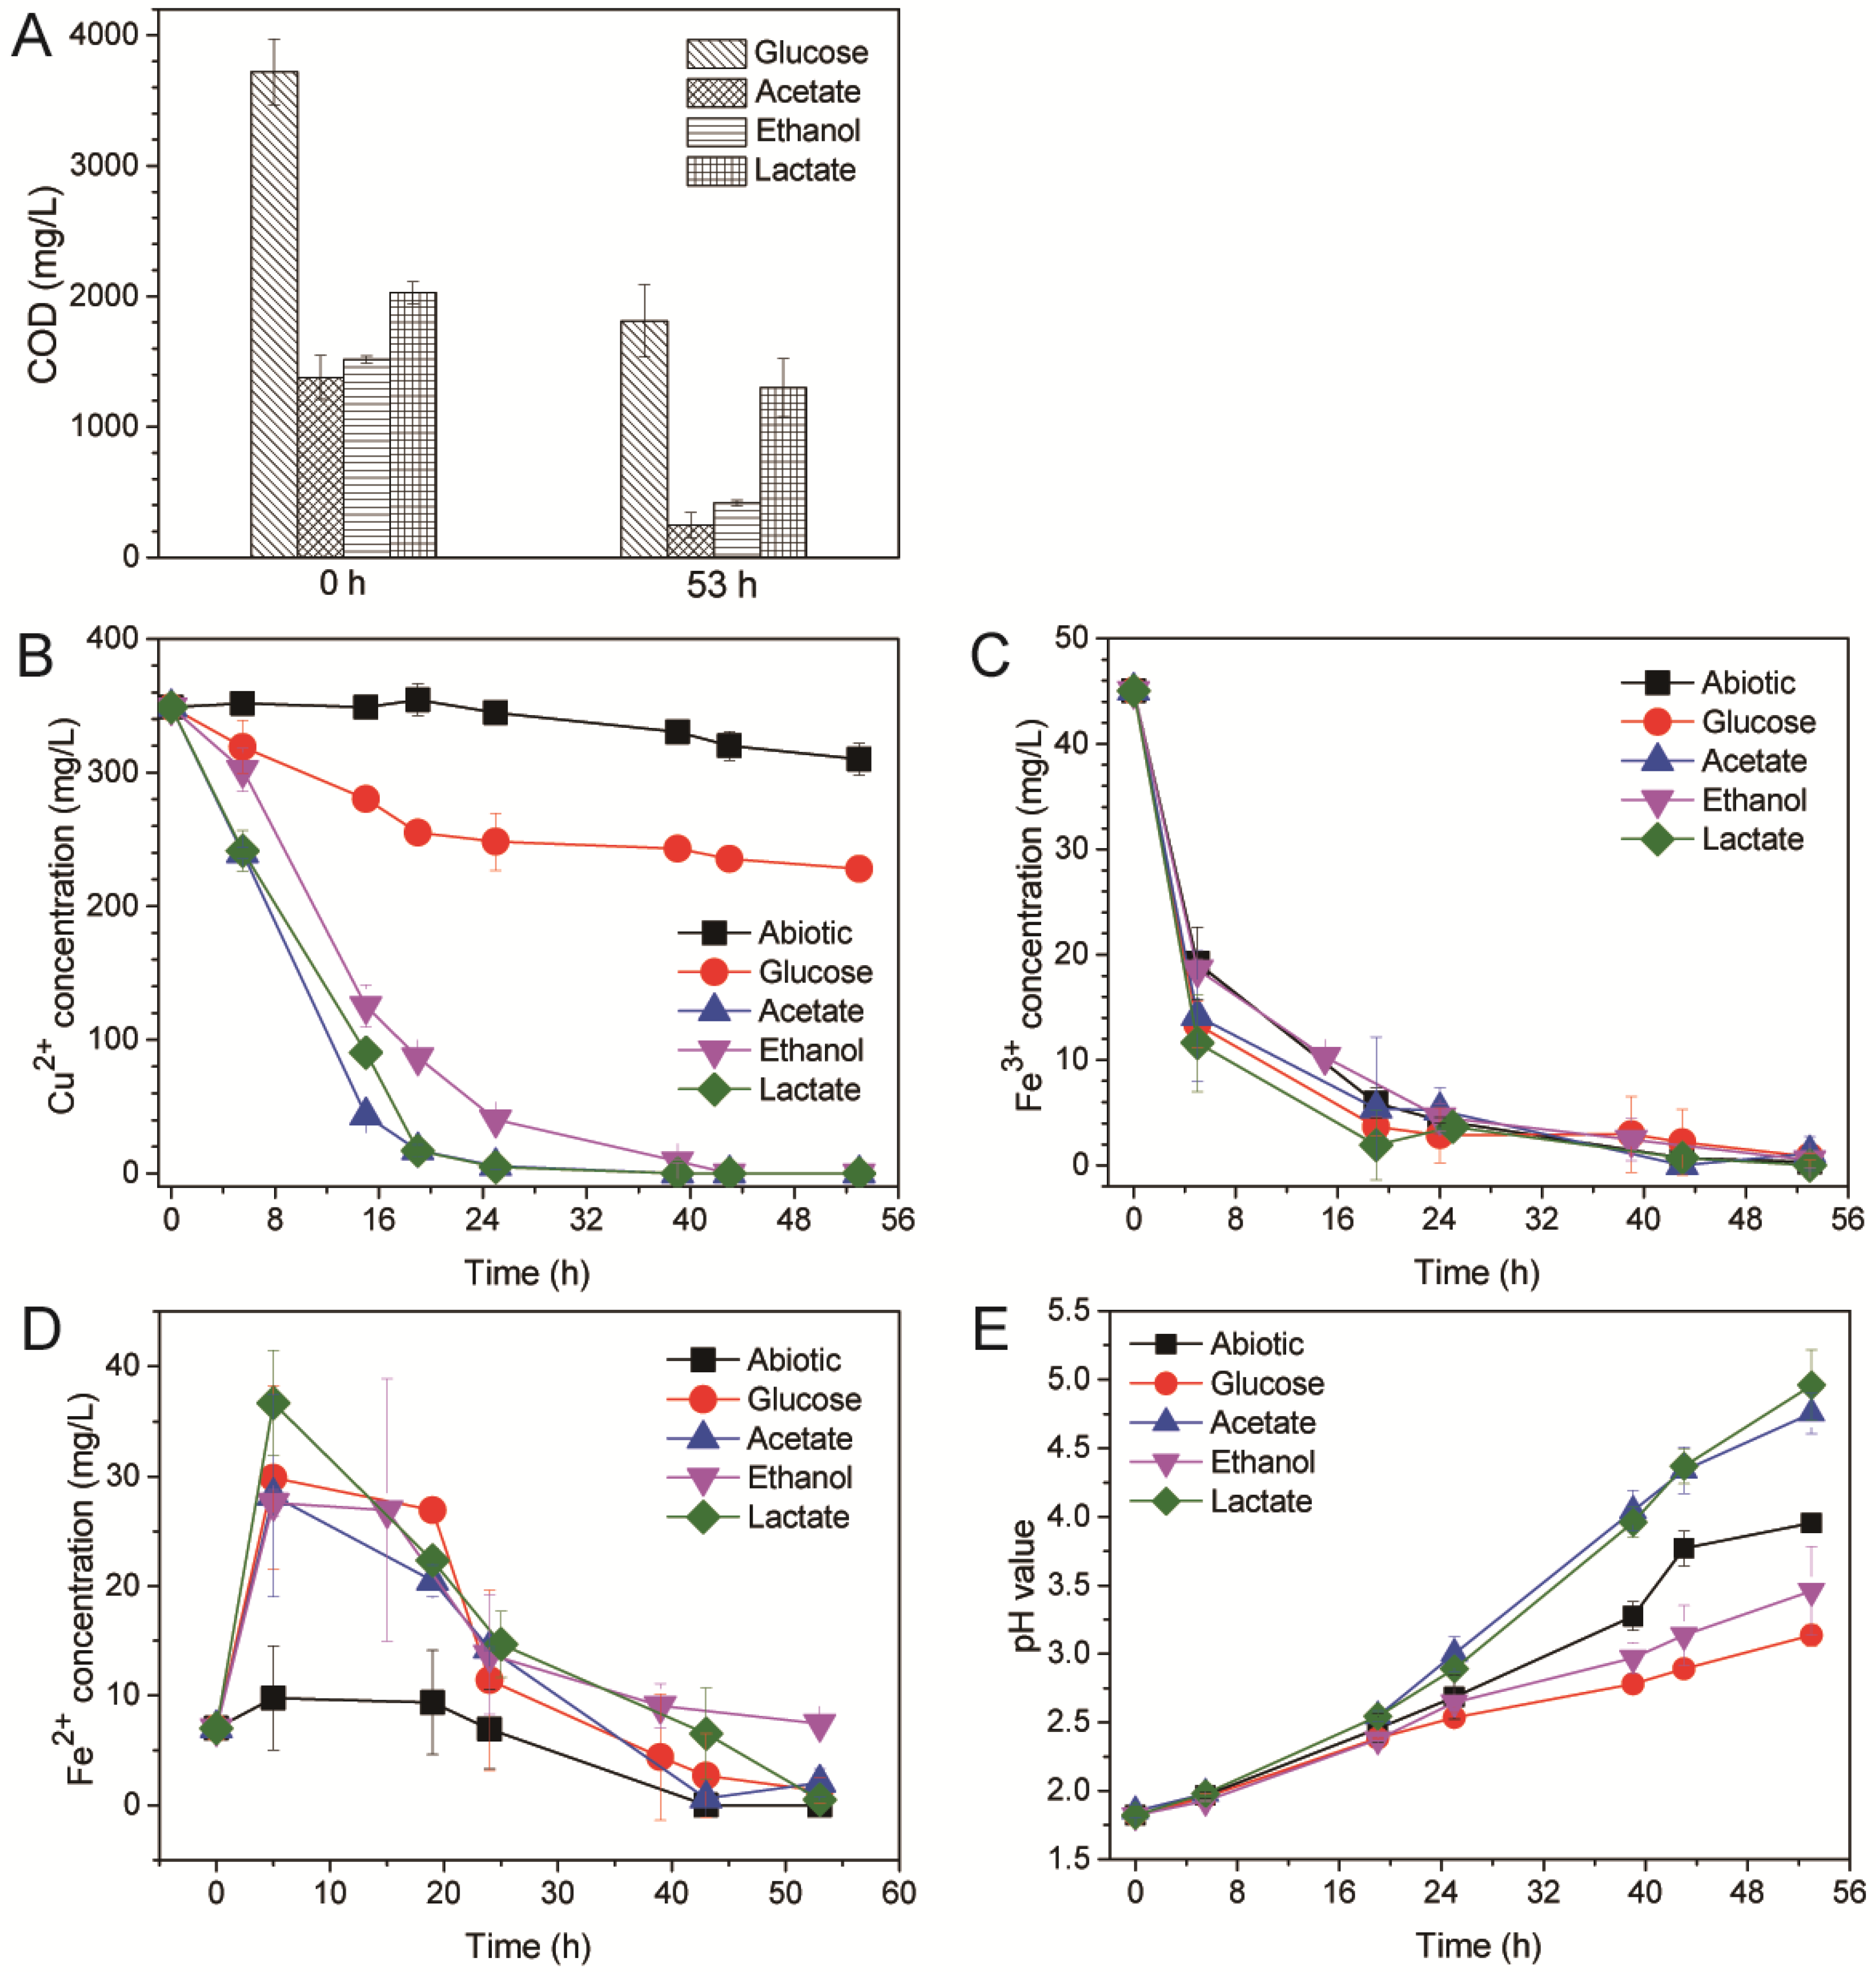
3.3. Contribution of Electroactive Biofilms on Anolyte’s Chemical Oxygen Demand Removal and Catholyte’s Copper Recovery

Different ratio of chemical oxygen demand (COD) was depleted in the anodic chamber for the electroactive biofilms enriched by glucose (51.32%), acetate (82.00%), ethanol (72.49%), or lactate (35.95%), respectively, in 53 h after replenishing with fresh growth medium for copper recovery in dual-chamber MFCs (Figure 7A). A high concentration of COD (1909 mg/L) was removed in the anolyte of MFC fed with glucose as an energy substrate. Considering the lowest electricity production in each batch, most of the COD removed in the anolyte of glucose-fed-MFC was ascribed to the anaerobic growth by non-electrogenic microorganisms. It is worth mentioning that the number of planktonic microorganisms in MFC fed with glucose was much higher than those in the MFCs fed with other energy substrates.
The dual-chamber MFCs containing the electroactive biofilms enriched with acetate, ethanol, or lactate, respectively, could effectively recover copper from the acid mine drainage (Figure 7B). The copper in the catholyte of these MFCs decreased significantly after the initiation of the treatment of AMD. At the 39th h, no detectable copper ion was found in catholyte of MFCs containing the electroactive biofilms enriched with acetate or lactate. At the 43rd h, the copper ion in the catholyte of MFC containing the electroactive biofilms fed by ethanol was also completely recovered. However, the dual-chamber MFC containing electroactive biofilms enriched with glucose was deficient in the recovery of copper (Figure 7B). Only part of the copper ion (34.65%) was removed at the 53rd h, with a high concentration of Cu2+ (228.00 mg/L) remaining in the catholyte. The high concentration of Cu2+ (310 mg/L) remained in the catholyte of abiotic control at the end of this experiment. Iron ions in the stimulated AMD were mainly Fe3+ (Figure 7C,D). The decrease of Fe3+ concentration in the catholyte of MFCs containing electroactive biofilms was partially ascribed to the bioelectrochemical reduction at the cathode to Fe2+ (Figure 7D). The decrease of iron ions in the catholyte of abiotic control probably resulted from the elevated pH value (Figure 7E). The pH values in catholyte of all these MFCs with electroactive biofilms were increased during the treatment of AMD. The increase in pH value was likely ascribed to the diffusion of anions from the anolyte across the anion exchange member and reacted with the protons in the catholyte. Therefore, the decrease of iron ions in the catholyte of MFCs with electroactive biofilms was also affected by the increased pH values.

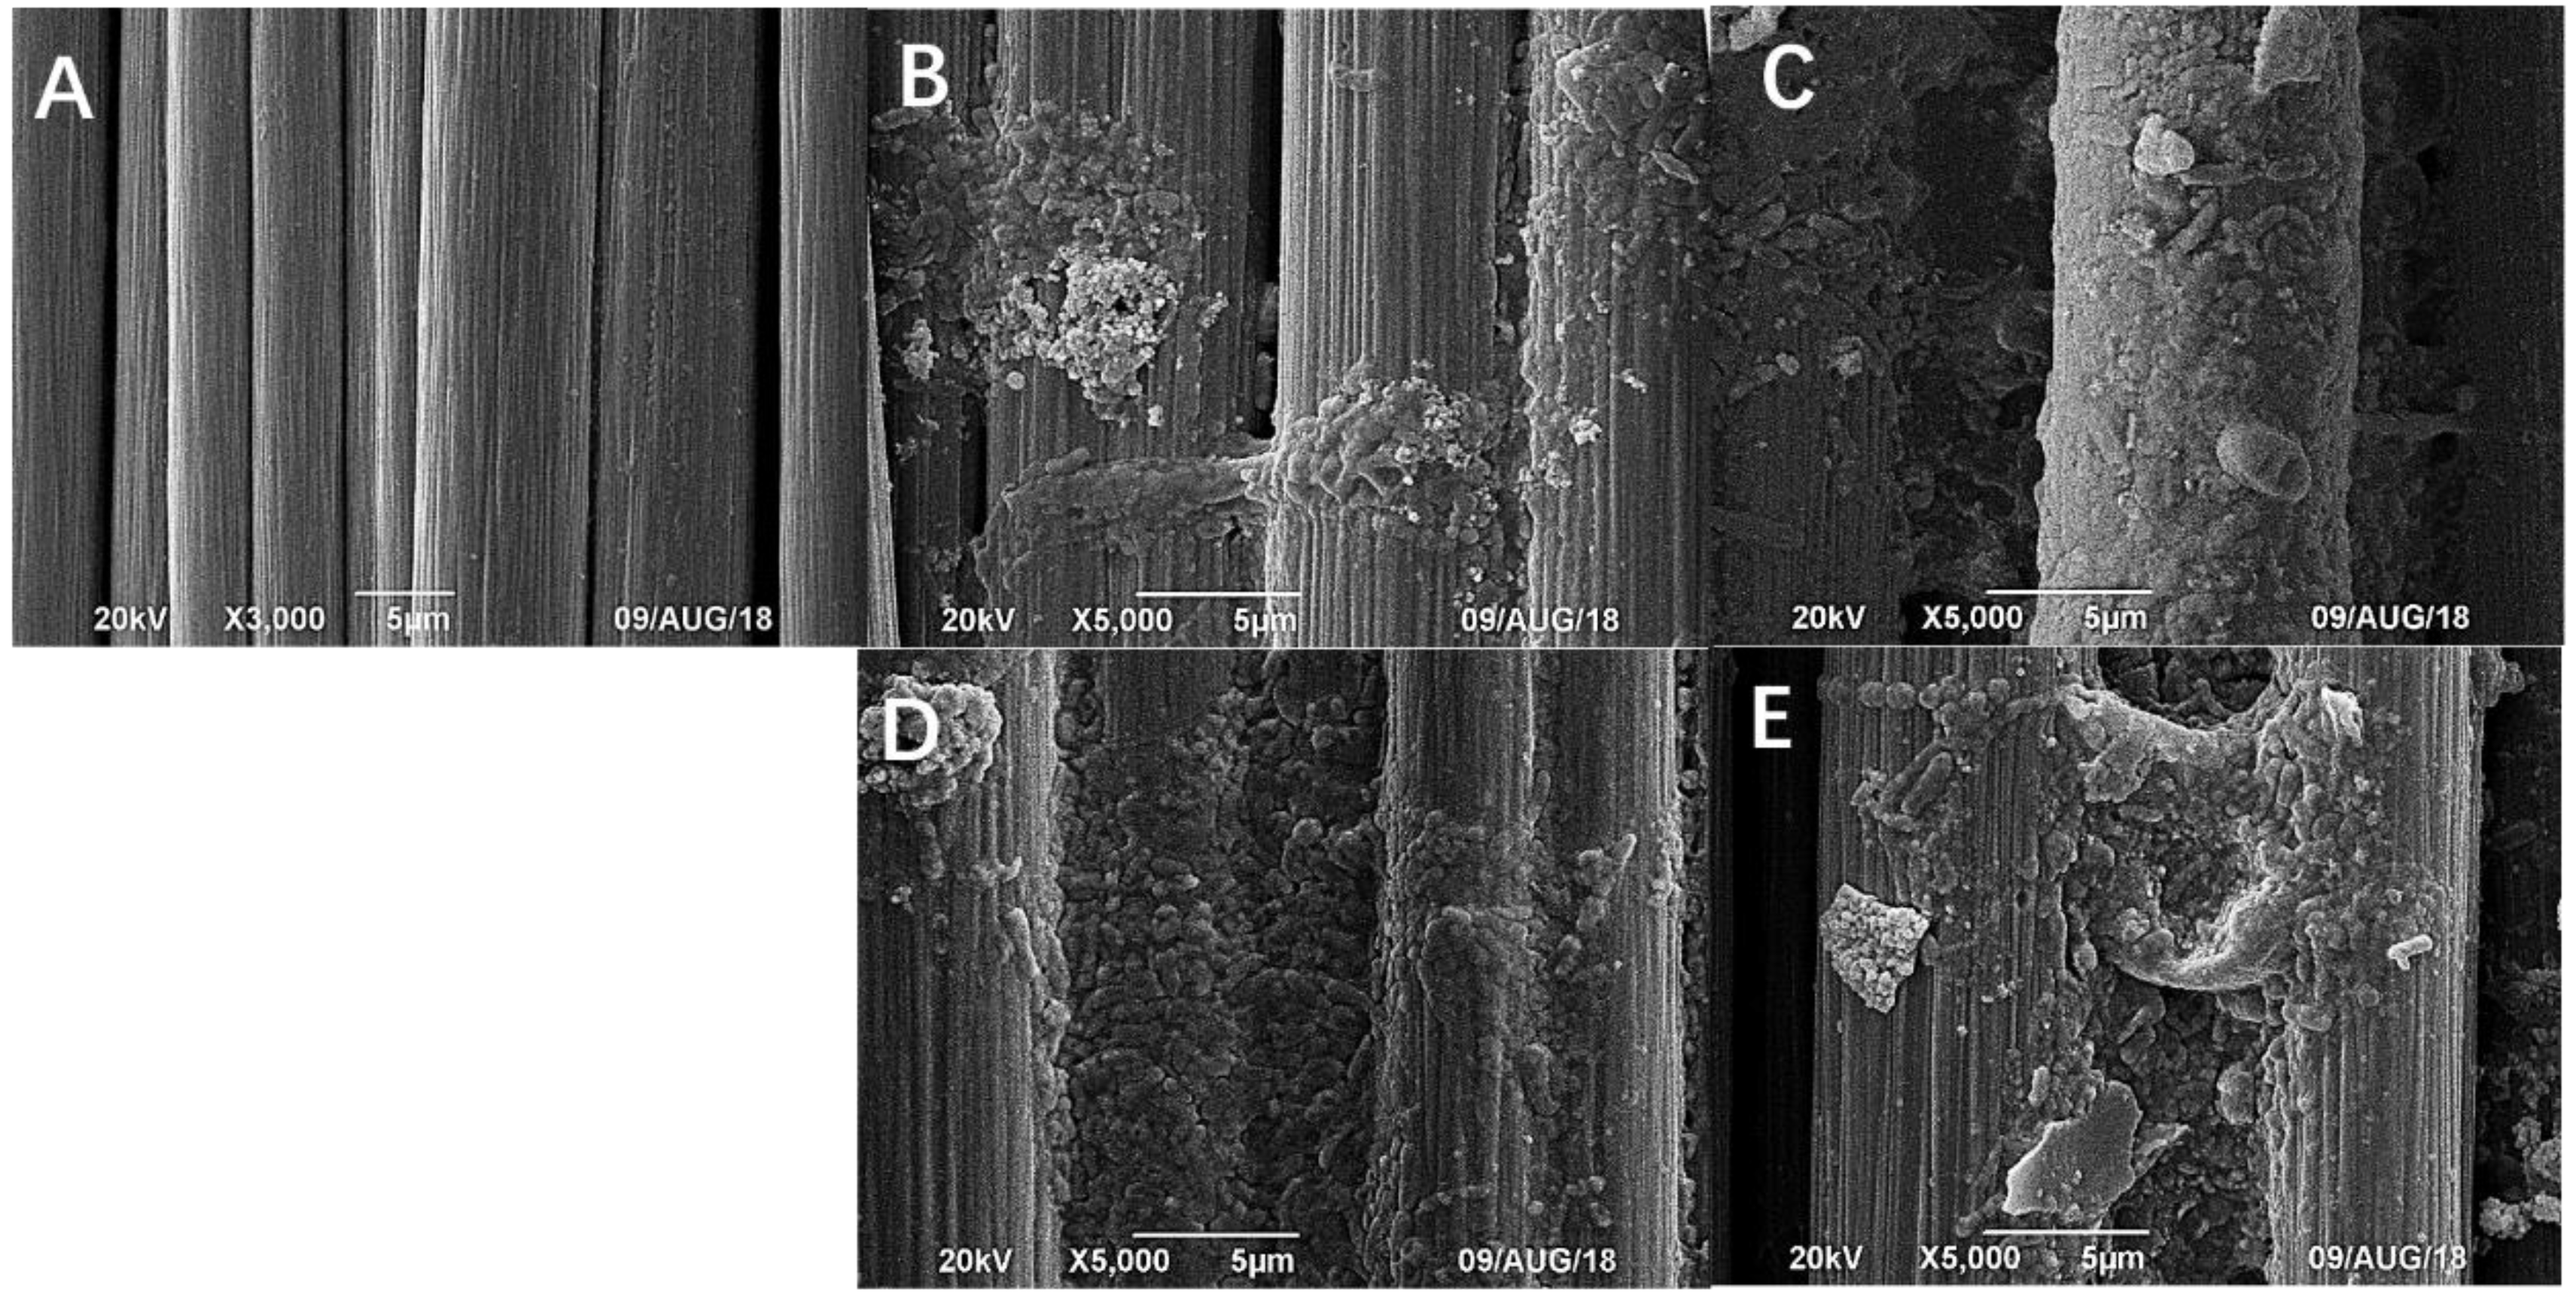
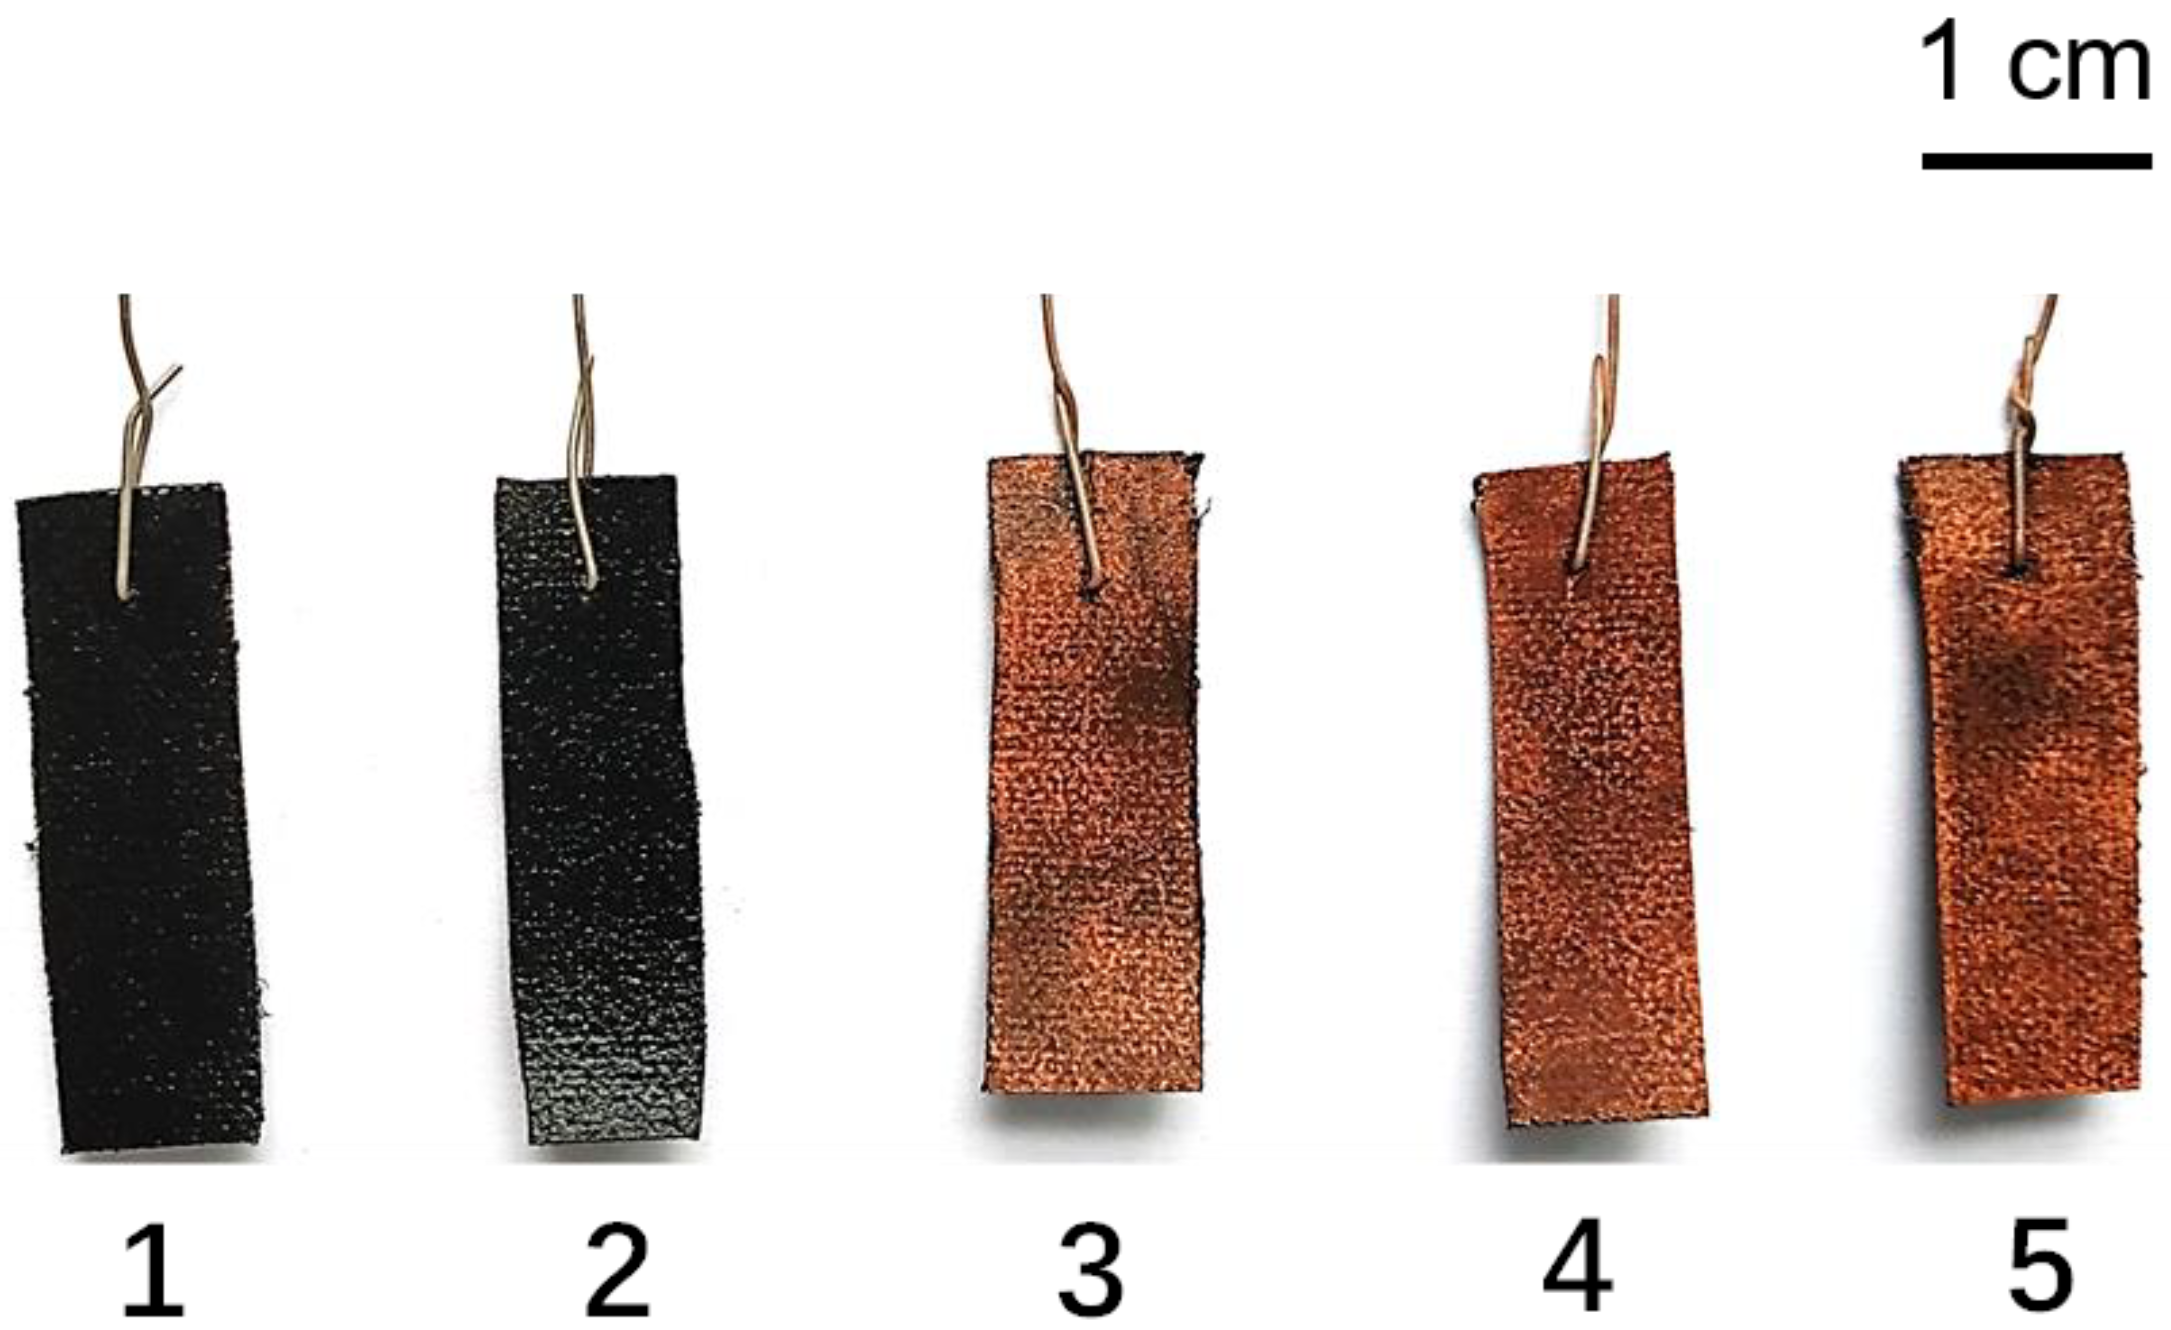
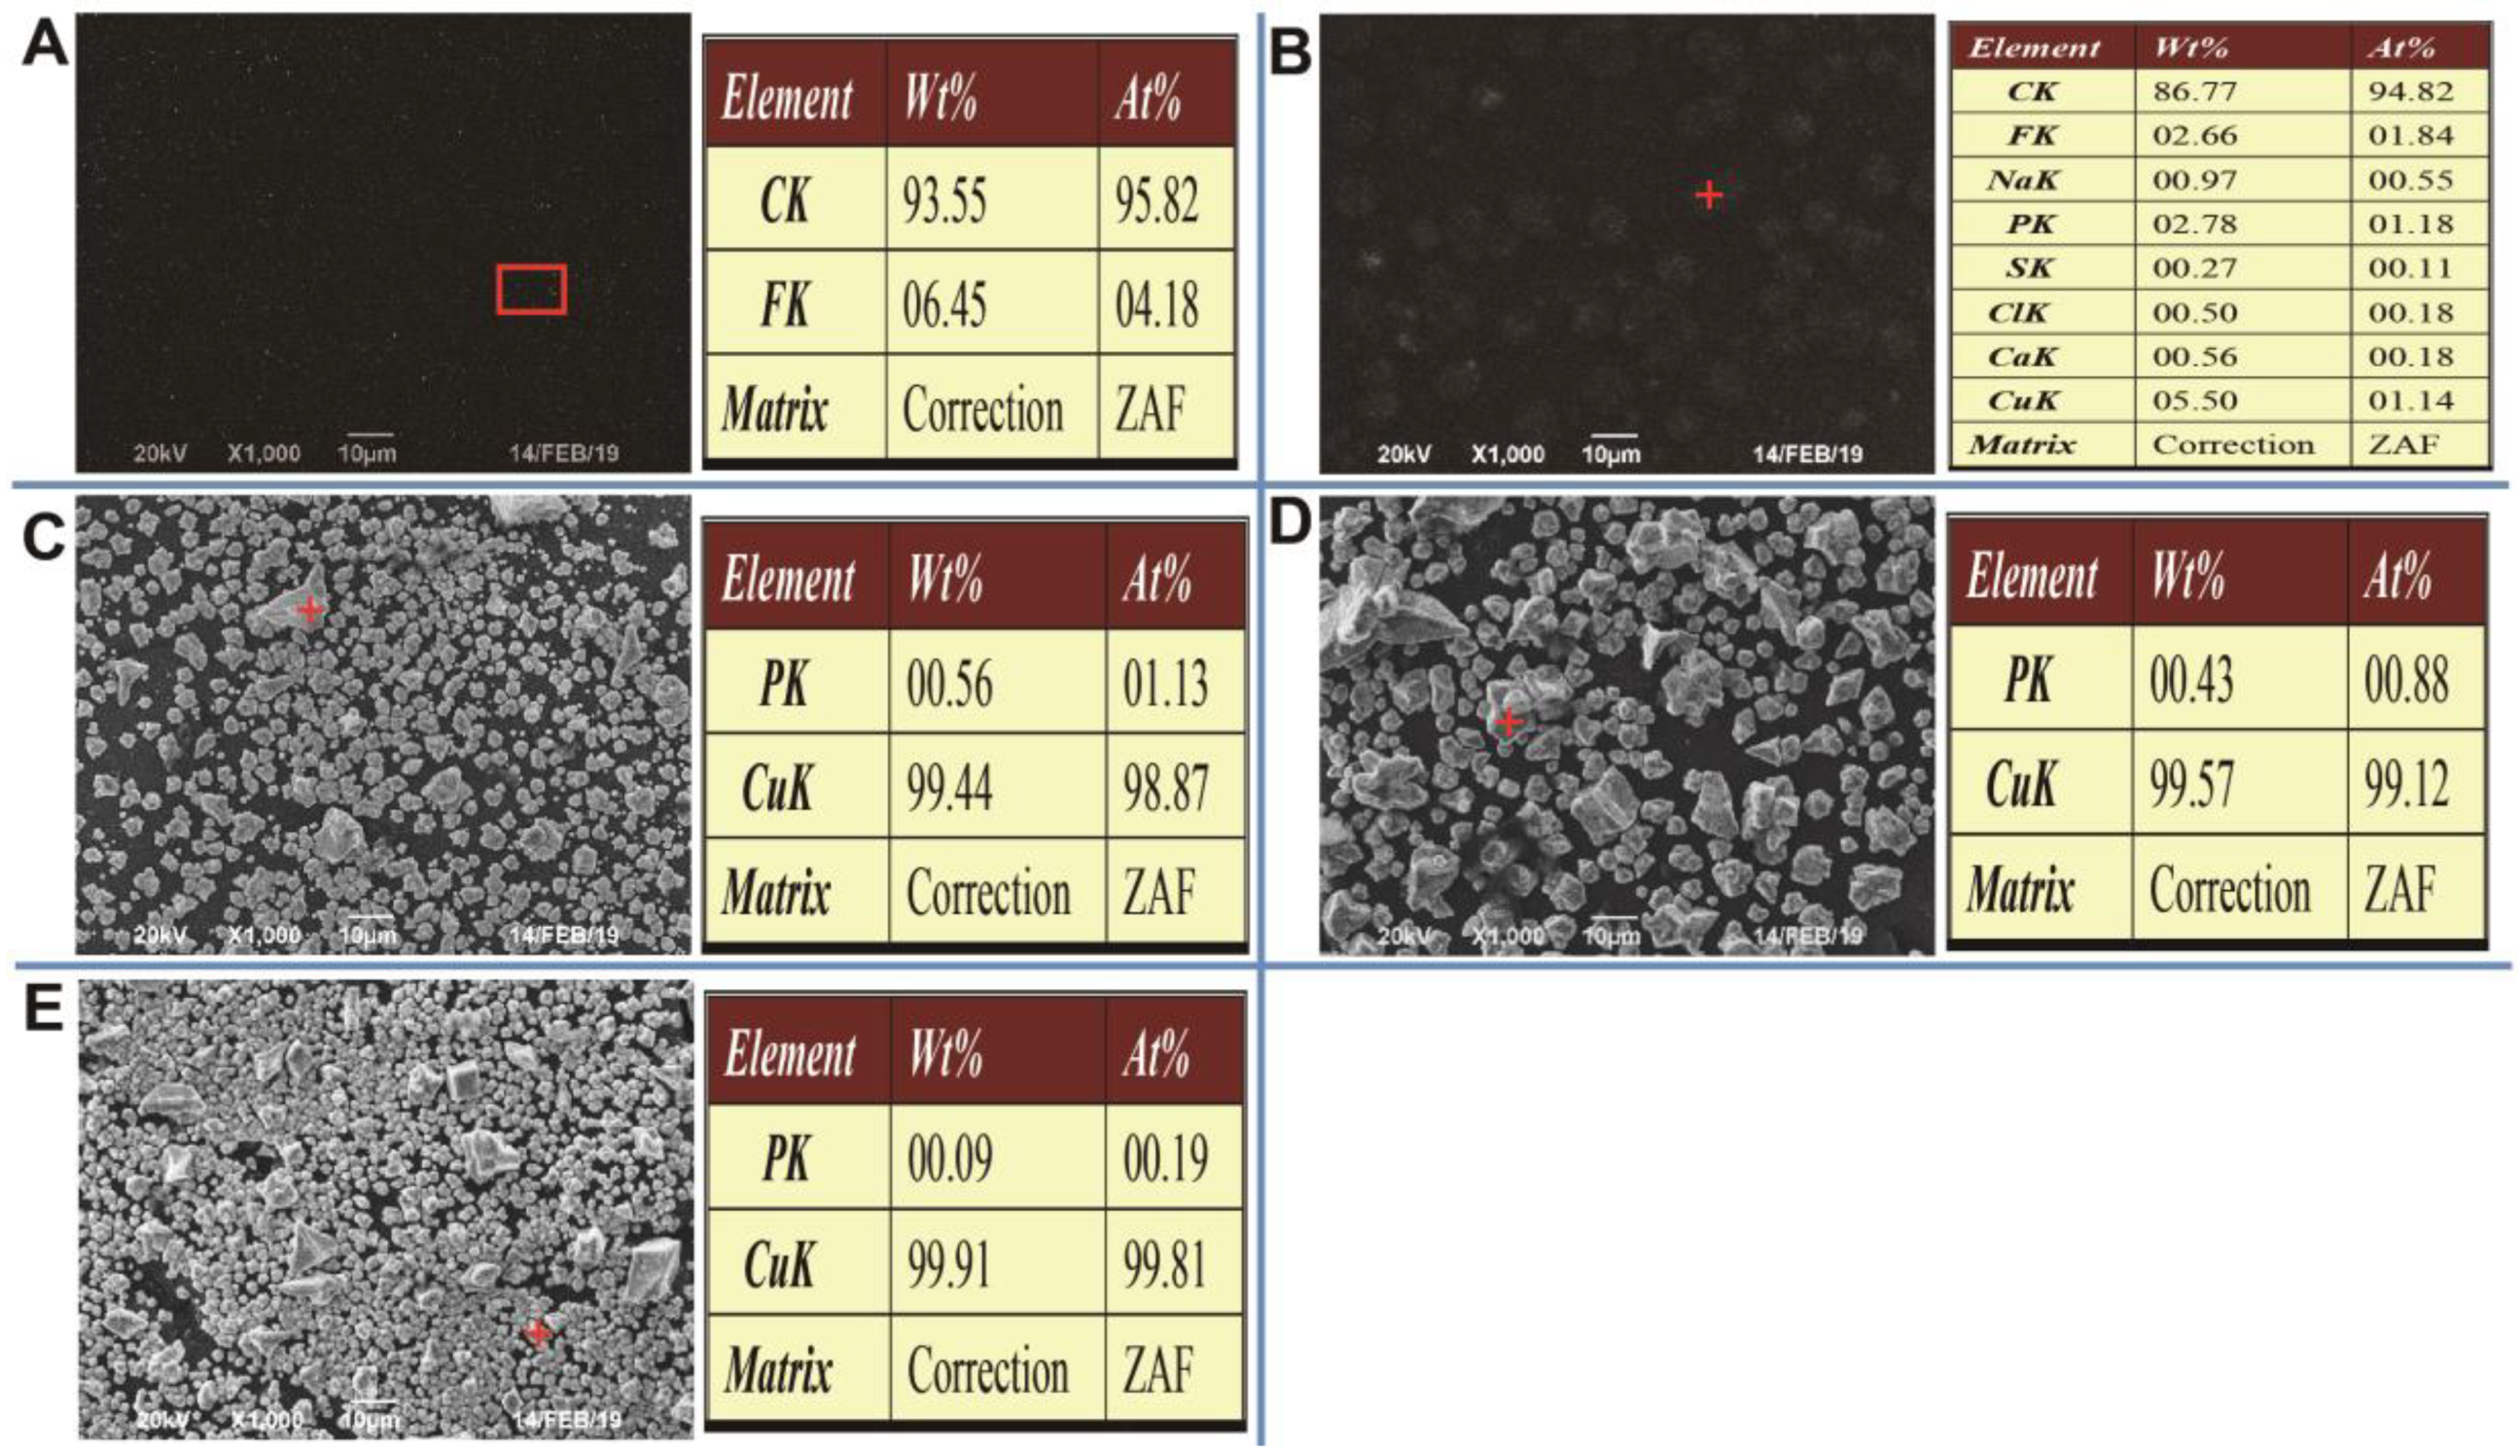
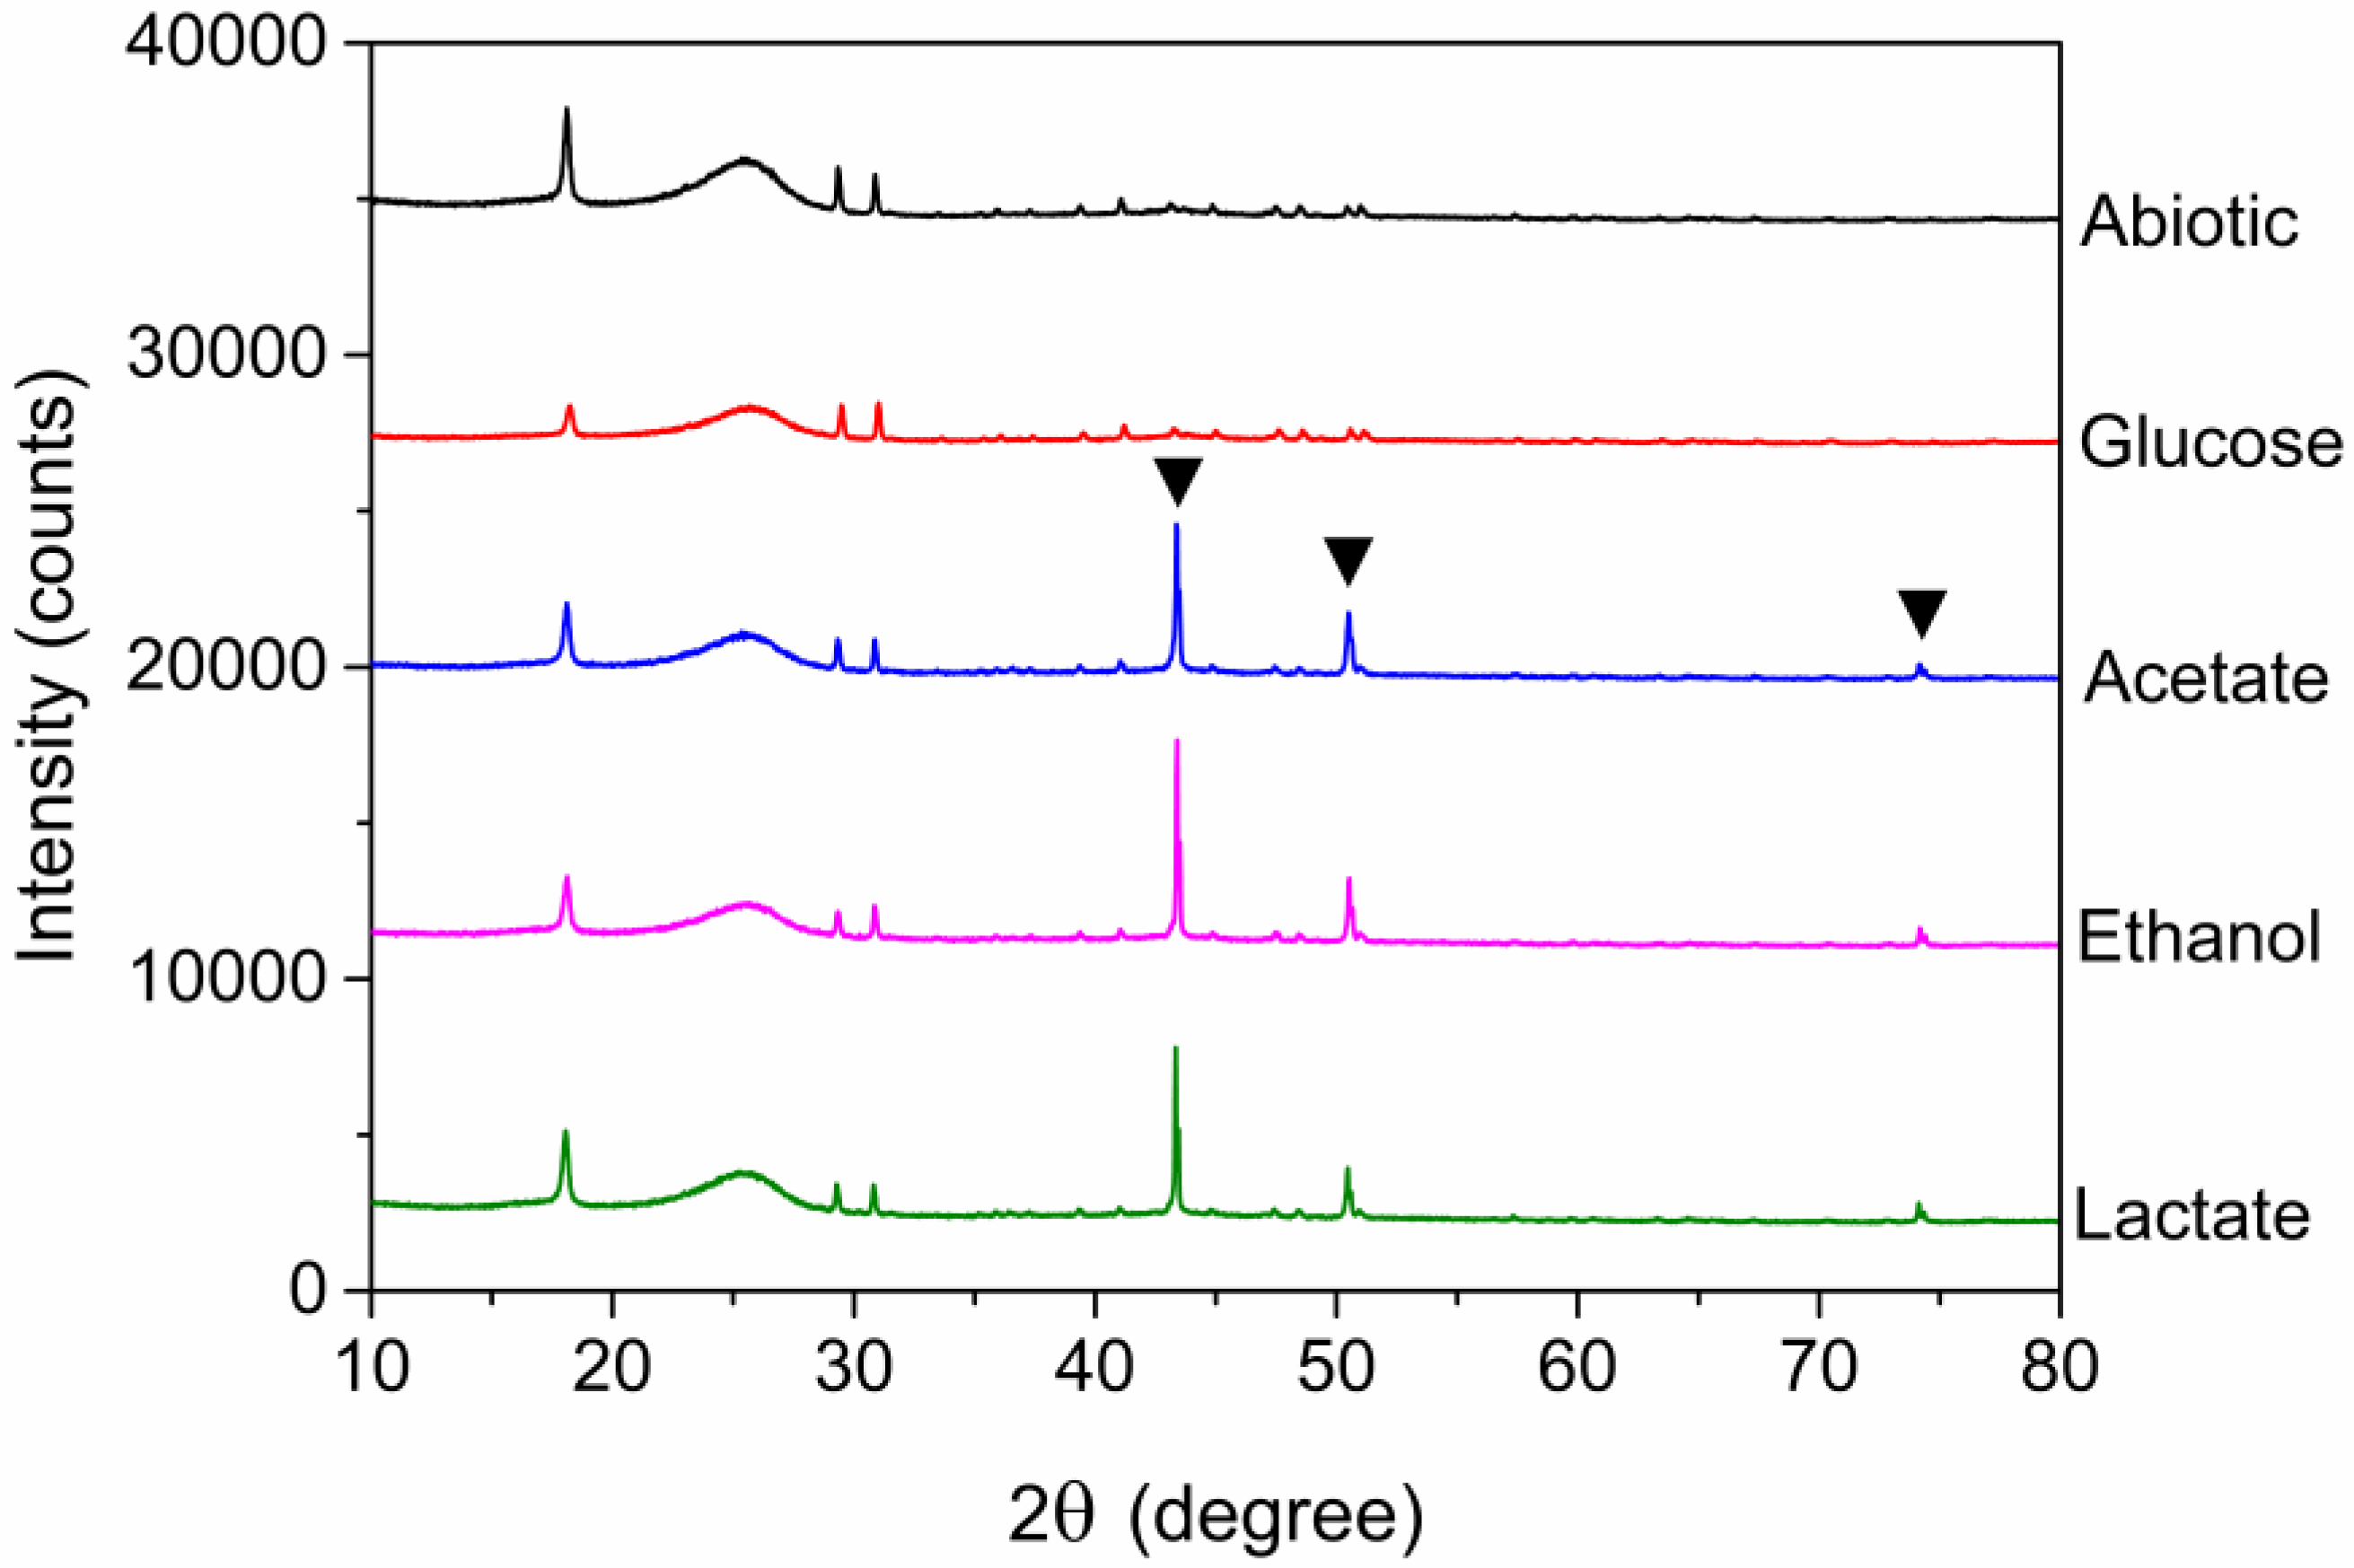
3.4. Morphologies of Electrode and XRD Analysis

The color of cathodes of dual-chamber MFCs containing the electroactive biofilms enriched with acetate, ethanol, or lactate, respectively, turned from black to brown after 53 h of treatment of AMD (Figure 8). This phenomenon indicated the bioelectrochemical reduction of copper on the surface of the cathode. However, the color of the cathode of abiotic control and MFCs containing electroactive biofilms fed with glucose remained as black (Figure 8).
In order to better understand the copper recovery mechanism, the cathodes of dual-chamber MFCs after the treatment of AMD for 53 h were analyzed with SEM and XRD. The SEM micrographs of cathode surfaces of these MFCs containing the electroactive biofilms enriched with acetate, ethanol, or lactate were similar in terms of structure and morphology, which were different from that of the cathodes of abiotic control and the glucose-fed-MFCs (Figure 9). No deposit was observed on the cathodic surface of abiotic MFCs, which was further confirmed by the EDS analysis (Figure 9A). There were many thin segregates on the surface of cathodes of glucose-fed MFCs. Further, EDS analysis of the composition of these segregates clearly showed the characteristic peaks of Cu signals at 0.98, 8.06, and 8.87 KeVs, which confirmed the formation of Cu products (Figure 9B). Besides the Cu, many other elements (i.e., P, S, Cl, Na and Ca) were detected as compared with the surface of cathodes of abiotic control MFCs. This indicated that part of the cupric ion was precipitated with other anions and cations on the surface of the cathode, which was not observed in previous studies. The EDS analysis showed that the deposits on the cathodic surface of MFCs containing the electroactive biofilms enriched with acetate, ethanol, or lactate mainly contained the element of Cu (Figure 9C–E).
The XRD patterns of the cathodic surface of MFCs containing the electroactive biofilms enriched with acetate, ethanol, or lactate clearly demonstrated the metal copper (Cu0) with characteristic peaks at 43.3, 50.4, and 74.1 degrees in 2-Theta (Figure 10). However, these characteristic peaks for metal copper (Cu0) were absent for the cathode from the abiotic control MFCs and the MFCs fed with glucose. This further indicated that no copper was deposited on the cathodic surface of these MFCs. The decrease of copper in the catholyte of the abiotic control MFCs and the MFCs fed with glucose was probably ascribed to the precipitation with other anions or cations.

3.5. Comparison of this Study with Previous Studies

The organic wastewater (individually simulated by four typical pure chemicals) and simulated AMD were simultaneously treated in dual-chamber MFCs in this study. The effect of different energy substrates on anodic electroactive biofilms enrichment, bioelectrochemical activity, microbial communities, and AMD treatment was compared. For the scale-up of the BESs to treat the real industrial AMD in mining sites, these pure organic chemicals should be replaced by the real organic wastewater available near the pollution site in order to greatly reduce the costs. Different sources of real organic wastewater usually contain different predominant organic chemicals (such as these typical chemicals used in this study). Therefore, it is necessary to evaluate the effects of different energy substrates on anodic electroactive biofilms enrichment (both bioelectrochemical activity and microbial communities) and AMD treatment.
It is a fact that various organics (either pure chemical or real organic wastewater) have been studied as an energy substrate for MFCs [36]. However, only some studies have focused on the comparison of the electrochemical performance of MFCs enriched with different organic substrates (Table 3). On comparing our study with these studies, we found out the following differences: (1). The organic substrates used were generally different in other studies; (2). The microbial community structure of the anodic electroactive biofilms enriched with different energy substrates was studied with high throughput sequencing technique in this study. However, two other studies analyzed the anodic electroactive biofilms with traditional culture-dependent technique or denaturing gradient gel electrophoresis (DGGE) [12,37]. In addition, simultaneous treatment of different organic wastewater and simulated AMD was analyzed in this study.
MFCs have been adopted to recover some heavy metals from wastewater [38,39]. In order to be consistent with the target heavy metal in our study, the studies that focused on treatment with Cu2+ were selected and compared (Table 3). On comparing our study with these studies, we found out the following differences: (1). Only a single energy substrate was used in these studies; (2). The microbial community structures of the anodic electroactive biofilm in these studies were scarcely studied. There is a study that analyzed the microbial community structure of the anodic electroactive biofilm under the stress of different concentrations of Cu2+ in municipal wastewater in single-chamber MFC [14]. However, the simulated AMD was treated in the cathode chamber, while the electroactive biofilm was in the anode chamber in this study (two chambers were separated by an anion exchange membrane). Therefore, the stress of the electroactive biofilm should be negligible. Collectively, results obtained in this study are insightful for the enrichment of electroactive biofilms for AMD treatment.
Table 3. Comparison of this study with other related studies.
Energy SubstratesResearch FocusesReference
Microbial Community of Anodic BiofilmWastewater (Containing Cu2+)
acetate, lactate, ethanol, glucoseYes, high throughput sequencing technique.YesThis study
acetate, butyrate, propionate, glucoseYes, using the culture-dependent technique.No[12]
acetate, ethanol, glucoseNoNo[40]
acetate, butyrate, glucoseYes, using denaturing gradient gel electrophoresis. No[37]
glucose, methanol, propyl alcoholYes, high throughput sequencing technique.No[13]
acetate, glucose, starch, dextran, butyrateNoNo[41]
glucose, lactose, cheeseNoNo[42]
glucose, acetate, xyloseNoNo[43]
acetateNoYes[44]
acetateNoYes[45]
glucoseNoYes[46]
acetateNoYes[47]
acetateNoYes[48]
acetateNoYes[17]
acetateNoYes[49]
acetateNoYes[50]
acetateNoYes[51]
acetateYes, high throughput sequencing technique; anodic biofilm was directly exposed to Cu2+.Yes[14]

4. Conclusions

This study showed that different energy substrates affected the startup, maximum voltage output, power density, coulombic efficiency, ohmic resistance, and the charge transfer resistance of MFC. The microbial community structures of these electroactive biofilms were modulated by energy substrates during the enrichment. The abundance of classic exoelectrogens Geobacter species correlated with the electricity-generation capacities of different electroactive biofilms. Geobacter species constituted as the predominant components of the electroactive biofilms enriched with acetate, ethanol, or lactate, which existed as minor species in glucose-fed electroactive biofilms (0.63%). The MFCs containing the glucose-fed electroactive biofilms were deficient in the extraction of copper from AMD. On the contrary, the MFCs containing the electroactive biofilms enriched with acetate, ethanol, or lactate recovered almost all the Cu2+ from the AMD by electrochemical reduction as metal copper (Cu0) on the surface of the cathode. These results indicated that the effects of organic chemical (that is usually contained in organic wastewater) on the enrichment of electroactive biofilm should be first evaluated in order to obtain an efficient simultaneous treatment of organic wastewater and AMD. Further research works are needed to assess the technical feasibility of the bioelectrochemical system to treat AMD, such as scale-up the reactor and run in continuous mode.

Author Contributions

Data curation, Z.Z.; Formal analysis, C.A. (Chenbing Ai); Investigation, C.A. (Chenbing Ai), Z.Y., S.H., X.Z., and C.A. (Charles Amanze); Methodology, Z.Y.; Project administration, G.Q.; Resources, Z.D.; Supervision, W.Z.; Writing—original draft, C.A. (Chenbing Ai); Writing—review and editing, L.C., G.Q., and W.Z. All authors have read and agreed to the published version of the manuscript.

Funding

This work was supported by the postdoctoral research funding of Central South University (Grant No. 207154), the National Natural Science Foundation of China (Grant No. 31470230, 51320105006, 51604308), the Youth Talent Foundation of Hunan Province of China (No.2017RS3003), Natural Science Foundation of Hunan Province of China (No.2018JJ2486), Key Research and Development Projects in Hunan Province (2018WK2012).

Conflicts of Interest

The authors declare no conflict of interest.

References

  1. Ai, C.; Liang, Y.; Miao, B.; Chen, M.; Zeng, W.; Qiu, G. Identification and analysis of a novel gene cluster involves in Fe2+ oxidation in Acidithiobacillus ferrooxidans ATCC 23270, a typical biomining acidophile. Curr. Microbiol. 2018, 75, 818–826. [Google Scholar] [CrossRef] [PubMed]
  2. Park, I.; Tabelin, C.B.; Jeon, S.; Li, X.; Seno, K.; Ito, M.; Hiroyoshi, N. A review of recent strategies for acid mine drainage prevention and mine tailings recycling. Chemosphere 2019, 219, 588–606. [Google Scholar] [CrossRef] [PubMed]
  3. Igarashi, T.; Herrera, P.S.; Uchiyama, H.; Miyamae, H.; Iyatomi, N.; Hashimoto, K.; Tabelin, C.B. The two-step neutralization ferrite-formation process for sustainable acid mine drainage treatment: Removal of copper, zinc and arsenic, and the influence of coexisting ions on ferritization. Sci. Total Environ. 2020, 715, 136877. [Google Scholar] [CrossRef] [PubMed]
  4. Simate, G.S.; Ndlovu, S. Acid mine drainage: Challenges and opportunities. J. Environ. Chem. Eng. 2014, 2, 1785–1803. [Google Scholar] [CrossRef]
  5. Tolonen, E.T.; Sarpola, A.; Hu, T.; Ramo, J.; Lassi, U. Acid mine drainage treatment using by-products from quicklime manufacturing as neutralization chemicals. Chemosphere 2014, 117, 419–424. [Google Scholar] [CrossRef] [PubMed]
  6. Logan Bruce, E.; Rabaey, K. Conversion of wastes into bioelectricity and chemicals by using microbial electrochemical technologies. Science 2012, 337, 686–690. [Google Scholar] [CrossRef] [Green Version]
  7. Ai, C.; Hou, S.; Yan, Z.; Zheng, X.; Amanze, C.; Chai, L.; Qiu, G.; Zeng, W. Recovery of metals from acid mine drainage by bioelectrochemical system inoculated with a novel exoelectrogen, Pseudomonas sp. E8. Microorganisms 2020, 8, 41. [Google Scholar] [CrossRef] [Green Version]
  8. Santoro, C.; Arbizzani, C.; Erable, B.; Ieropoulos, I. Microbial fuel cells: From fundamentals to applications. A review. J. Power Sources 2017, 356, 225–244. [Google Scholar] [CrossRef]
  9. Wang, H.; Ren, Z.J. A comprehensive review of microbial electrochemical systems as a platform technology. Biotechnol. Adv. 2013, 31, 1796–1807. [Google Scholar] [CrossRef]
  10. Logan, B.E.; Regan, J.M. Electricity-producing bacterial communities in microbial fuel cells. Trends Microbiol. 2006, 14, 512–518. [Google Scholar] [CrossRef]
  11. Kiely, P.D.; Regan, J.M.; Logan, B.E. The electric picnic: Synergistic requirements for exoelectrogenic microbial communities. Curr. Opin. Biotech. 2011, 22, 378–385. [Google Scholar] [CrossRef] [PubMed]
  12. Chae, K.J.; Choi, M.J.; Lee, J.W.; Kim, K.Y.; Kim, I.S. Effect of different substrates on the performance, bacterial diversity, and bacterial viability in microbial fuel cells. Bioresour. Technol. 2009, 100, 3518–3525. [Google Scholar] [CrossRef] [PubMed]
  13. Zhang, S.H.; Qiu, C.H.; Fang, C.F.; Ge, Q.L.; Hui, Y.X.; Han, B.; Pang, S. Characterization of bacterial communities in anode microbial fuel cells fed with glucose, propyl alcohol and methanol. Appl. Biochem. Micro. 2017, 53, 250–257. [Google Scholar] [CrossRef]
  14. Wu, Y.; Zhao, X.; Jin, M.; Li, Y.; Li, S.; Kong, F.; Nan, J.; Wang, A. Copper removal and microbial community analysis in single-chamber microbial fuel cell. Bioresour. Technol. 2018, 253, 372–377. [Google Scholar] [CrossRef]
  15. Shehab, N.; Li, D.; Amy, G.L.; Logan, B.E.; Saikaly, P.E. Characterization of bacterial and archaeal communities in air-cathode microbial fuel cells, open circuit and sealed-off reactors. Appl. Microbiol. Biot. 2013, 97, 9885–9895. [Google Scholar] [CrossRef]
  16. Ai, C.; Yan, Z.; Chai, H.; Gu, T.; Wang, J.; Chai, L.; Qiu, G.; Zeng, W. Increased chalcopyrite bioleaching capabilities of extremely thermoacidophilic Metallosphaera sedula inocula by mixotrophic propagation. J. Ind. Microbiol. Biotechnol. 2019, 46, 1113–1127. [Google Scholar] [CrossRef]
  17. Cheng, S.A.; Wang, B.S.; Wang, Y.H. Increasing efficiencies of microbial fuel cells for collaborative treatment of copper and organic wastewater by designing reactor and selecting operating parameters. Bioresour. Technol. 2013, 147, 332–337. [Google Scholar] [CrossRef]
  18. Logan B., E.; Hamelers, B.; Rozendal, R.; Schröder, U.; Keller, J.; Freguia, S.; Aelterman, P.; Verstraete, W.; Rabaey, K. Microbial fuel cells methodology and technology. Environ. Sci. Technol. 2006, 40, 5181–5192. [Google Scholar] [CrossRef]
  19. Herrera, L.; Ruiz, P.; Aguillon, J.C.; Fehrmann, A. A new spectrophotometric method for the determination of ferrous iron in the presence of ferric iron. J. Chem. Technol. Biotechnol. 1989, 44, 171–181. [Google Scholar] [CrossRef]
  20. Wetlesen, C.U. Rapid spectrophotometric determination of copper in iron, steel and ferrous alloys. Anal. Chim. Acta 1957, 16, 268–270. [Google Scholar] [CrossRef]
  21. Magoc, T.; Salzberg, S.L. FLASH: Fast length adjustment of short reads to improve genome assemblies. Bioinformatics 2011, 27, 2957–2963. [Google Scholar] [CrossRef] [PubMed]
  22. Edgar, R.C.; Haas, B.J.; Clemente, J.C.; Quince, C.; Knight, R. UCHIME improves sensitivity and speed of chimera detection. Bioinformatics 2011, 27, 2194–2200. [Google Scholar] [CrossRef] [Green Version]
  23. Edgar, R.C. UPARSE: Highly accurate OTU sequences from microbial amplicon reads. Nat. Methods 2013, 10, 996–998. [Google Scholar] [CrossRef] [PubMed]
  24. Wang, Q.; Garrity, G.M.; Tiedje, J.M.; Cole, J.R. Naive Bayesian classifier for rapid assignment of rRNA sequences into the new bacterial taxonomy. Appl. Environ. Microb. 2007, 73, 5261–5267. [Google Scholar] [CrossRef] [Green Version]
  25. Schloss, P.D.; Gevers, D.; Westcott, S.L. Reducing the effects of PCR amplification and sequencing artifacts on 16S rRNA-based studies. PLoS ONE 2011, 6, e27310. [Google Scholar] [CrossRef] [PubMed] [Green Version]
  26. Christwardana, M.; Frattini, D.; Accardo, G.; Yoon, S.P.; Kwon, Y. Early-stage performance evaluation of flowing microbial fuel cells using chemically treated carbon felt and yeast biocatalyst. Appl. Energy 2018, 222, 369–382. [Google Scholar] [CrossRef]
  27. He, Z.; Mansfeld, F. Exploring the use of electrochemical impedance spectroscopy (EIS) in microbial fuel cell studies. Energy Environ. Sci. 2009, 2, 215–219. [Google Scholar] [CrossRef]
  28. Paitier, A.; Godain, A.; Lyon, D.; Haddour, N.; Vogel, T.M.; Monier, J.M. Microbial fuel cell anodic microbial population dynamics during MFC start-up. Biosens. Bioelectron. 2017, 92, 357–363. [Google Scholar] [CrossRef]
  29. Cai, W.; Zhang, Z.; Ren, G.; Shen, Q.; Hou, Y.; Ma, A.; Deng, Y.; Wang, A.; Liu, W. Quorum sensing alters the microbial community of electrode-respiring bacteria and hydrogen scavengers toward improving hydrogen yield in microbial electrolysis cells. Appl. Energy 2016, 183, 1133–1141. [Google Scholar] [CrossRef] [Green Version]
  30. Christwardana, M.; Frattini, D.; Duarte, K.D.Z.; Accardo, G.; Kwon, Y. Carbon felt molecular modification and biofilm augmentation via quorum sensing approach in yeast-based microbial fuel cells. Appl. Energy 2019, 238, 239–248. [Google Scholar] [CrossRef]
  31. Ai, C.; McCarthy, S.; Eckrich, V.; Rudrappa, D.; Qiu, G.; Blum, P. Increased acid resistance of the archaeon, Metallosphaera sedula by adaptive laboratory evolution. J. Ind. Microbiol. Biotechnol. 2016, 43, 1455–1465. [Google Scholar] [CrossRef] [PubMed]
  32. Peng, T.; Zhou, D.; Liu, Y.; Yu, R.; Qiu, G.; Zeng, W. Effects of pH value on the expression of key iron/sulfur oxidation genes during bioleaching of chalcopyrite on thermophilic condition. Ann. Microbiol. 2019, 69, 627–635. [Google Scholar] [CrossRef]
  33. Ai, C.; Yan, Z.; Zhou, H.; Hou, S.; Chai, L.; Qiu, G.; Zeng, W. Metagenomic Insights into the Effects of seasonal temperature variation on the activities of activated sludge. Microorganisms 2019, 7, 713. [Google Scholar] [CrossRef] [PubMed] [Green Version]
  34. Stöckl, M.; Teubner, N.C.; Holtmann, D.; Mangold, K.M.; Sand, W. Extracellular polymeric substances from Geobacter sulfurreducens biofilms in microbial fuel cells. Acs Appl. Mater. Interfaces 2019, 11, 8961–8968. [Google Scholar] [CrossRef]
  35. Reguera, G.; McCarthy, K.D.; Mehta, T.; Nicoll, J.S.; Tuominen, M.T.; Lovley, D.R. Extracellular electron transfer via microbial nanowires. Nature 2005, 435, 1098–1101. [Google Scholar] [CrossRef]
  36. Pant, D.; Van Bogaert, G.; Diels, L.; Vanbroekhoven, K. A review of the substrates used in microbial fuel cells (MFCs) for sustainable energy production. Bioresour. Technol. 2010, 101, 1533–1543. [Google Scholar] [CrossRef]
  37. Zhang, Y.; Min, B.; Huang, L.; Angelidaki, I. Electricity generation and microbial community response to substrate changes in microbial fuel cell. Bioresour. Technol. 2011, 102, 1166–1173. [Google Scholar] [CrossRef]
  38. Nancharaiah, Y.V.; Venkata Mohan, S.; Lens, P.N. Metals removal and recovery in bioelectrochemical systems: A review. Bioresour. Technol. 2015, 195, 102–114. [Google Scholar] [CrossRef]
  39. Mathuriya, A.S.; Yakhmi, J.V. Microbial fuel cells to recover heavy metals. Environ. Chem. Lett. 2014, 12, 483–494. [Google Scholar] [CrossRef]
  40. Sharma, Y.; Li, B. The variation of power generation with organic substrates in single-chamber microbial fuel cells (SCMFCs). Bioresour. Technol. 2010, 101, 1844–1850. [Google Scholar] [CrossRef]
  41. Min, B.; Logan, B.E. Continuous electricity generation from domestic wastewater and organic substrates in a flat plate microbial fuel cell. Environ. Sci. Technol. 2004, 38, 5809–5814. [Google Scholar] [CrossRef] [PubMed]
  42. Antonopoulou, G.; Stamatelatou, K.; Bebelis, S.; Lyberatos, G. Electricity generation from synthetic substrates and cheese whey using a two chamber microbial fuel cell. Biochem. Eng. J. 2010, 50, 10–15. [Google Scholar] [CrossRef]
  43. Thygesen, A.; Poulsen, F.W.; Min, B.; Angelidaki, I.; Thomsen, A.B. The effect of different substrates and humic acid on power generation. Bioresour. Technol. 2009, 100, 1186–1191. [Google Scholar] [CrossRef]
  44. Heijne, A.T.; Liu, F.; van der Weijden, R.; Weijma, J.; Buisman, C.J.N.; Hamelers, H.V.M. Copper recovery combined with electricity production in a microbial fuel cell. Environ. Sci. Technol. 2010, 44, 4376–4381. [Google Scholar] [CrossRef] [PubMed]
  45. Tao, H.C.; Zhang, L.J.; Gao, Z.Y.; Wu, W.M. Copper reduction in a pilot-scale membrane-free bioelectrochemical reactor. Bioresour. Technol. 2011, 102, 10334–10339. [Google Scholar] [CrossRef] [PubMed]
  46. Tao, H.C.; Liang, M.; Li, W.; Zhang, L.J.; Ni, J.R.; Wu, W.M. Removal of copper from aqueous solution by electrodeposition in cathode chamber of microbial fuel cell. J. Hazard. Mater. 2011, 189, 186–192. [Google Scholar] [CrossRef] [PubMed]
  47. Wu, D.; Huang, L.; Quan, X.; Li Puma, G. Electricity generation and bivalent copper reduction as a function of operation time and cathode electrode material in microbial fuel cells. J. Power Sources 2016, 307, 705–714. [Google Scholar] [CrossRef] [Green Version]
  48. Zhang, L.; Tao, H.; Wei, X.; Lei, T.; Li, J.; Wang, A.; Wu, W. Bioelectrochemical recovery of ammonia–copper(II) complexes from wastewater using a dual chamber microbial fuel cell. Chemosphere 2012, 89, 1177–1182. [Google Scholar] [CrossRef]
  49. Rodenas Motos, P.; Ter Heijne, A.; van der Weijden, R.; Saakes, M.; Buisman, C.J.; Sleutels, T.H. High rate copper and energy recovery in microbial fuel cells. Front. Microbiol. 2015, 6, 527. [Google Scholar] [CrossRef] [Green Version]
  50. Zhang, Y.; Yu, L.; Wu, D.; Huang, L.; Zhou, P.; Quan, X.; Chen, G. Dependency of simultaneous Cr(VI), Cu(II) and Cd(II) reduction on the cathodes of microbial electrolysis cells self-driven by microbial fuel cells. J. Power Sources 2015, 273, 1103–1113. [Google Scholar] [CrossRef]
  51. Luo, H.; Liu, G.; Zhang, R.; Bai, Y.; Fu, S.; Hou, Y. Heavy metal recovery combined with H2 production from artificial acid mine drainage using the microbial electrolysis cell. J. Hazard. Mater. 2014, 270, 153–159. [Google Scholar] [CrossRef] [PubMed]
Figure 1. The single-chamber (A) and double-chamber (B) microbial fuel cell (MFC) reactors.
Minerals 10 00443 g001
Figure 2. The output voltage (A), power density (B), and polarization curve (C) of MFCs containing bioelectroactive biofilms enriched with different energy substrates.
Minerals 10 00443 g002
Figure 3. Electrochemical impedance spectroscopy (EIS) analysis of the MFCs containing the bioelectroactive biofilms enriched with different energy substrates.
Minerals 10 00443 g003
Figure 4. SEM of the bioelectroactive biofilms enriched with different energy substrates. (A: abiotic control; B: glucose; C: acetate; D: ethanol; E: lactate).
Minerals 10 00443 g004
Figure 5. The number (A) and Venn diagram analysis (B) of the operational taxonomic unit (OTU) of these bioelectroactive biofilms enriched with different energy substrates.
Minerals 10 00443 g005
Figure 6. Microbial community of the bioelectroactive biofilms enriched with different energy substrates at phylum (A), class (B), and genus (C) levels.
Minerals 10 00443 g006
Figure 7. The changes in chemical oxygen demand (COD) in anode chamber (A), and cupric ion (B), ferric iron (C), ferrous iron (D), and pH value (E) of cathode chamber of the MFCs containing electroactive biofilms enriched with different energy substrates.
Minerals 10 00443 g007
Figure 8. The cathodes of the MFCs after the treatment of simulated AMD. (1: abiotic; 2: glucose; 3: acetate; 4: ethanol; 5: lactate).
Minerals 10 00443 g008
Figure 9. SEM pictures and EDS analysis of the cathodes of MFCs after the treatment of simulated AMD. (A: abiotic; B: glucose; C: acetate; D: ethanol; E: lactate).
Minerals 10 00443 g009
Figure 10. XRD analysis of the cathodes of MFCs after the treatment of simulated AMD (▼indicates characteristic peaks of Cu0).
Minerals 10 00443 g010
Table 1. The α-diversity of enriched bioelectroactive biofilms.
SampleReadsSobsShannonSimpsonAceChaoCoverage
Inoculum408187105.20690.0138732.31735.020.9988
Glucose977012050.79310.7633363.79347.380.9993
Acetate459855902.98480.2534670.25672.180.9975
Ethanol438752862.74120.1233428.09371.000.9981
Lactate324304822.96940.2130589.26586.790.9963
Table 2. The ratio of archaea species in the bioelectroactive biofilms enriched with different energy substrates.
Archaeal GenusPercentage in Anode Biofilm (%)
InoculumGlucoseAcetateEthanolLactate
Methanobacterium0 0.01 0 0.04 0.15
Methanobrevibacter0 1.82 0 23.70 5.23
Methanosaeta0 0 0.02 0 0.05
Methanosarcina0 0 0.19 0 0
Methanomassiliicoccus0 0 0.25 0 0.02

