Abstract
We have studied damage zones of two active faults, Baza and Padul faults in Guadix-Baza and Granada basins, respectively, in South Spain. Mineral and microstructural characterization by X-ray diffraction and field emission electron microscopy studies have been combined with structural fieldwork and in situ measurements of rock properties (permeability and Young’s modulus) to find out the relation between deformation behavior, mineral processes, and changes in the soft rock and sediment properties produced by fluid flow during seismic cycles. Our results show that microsealing produced by precipitation of dolomite and aragonite along fractures in the damage zone of Baza Fault reduces the permeability and increases the Young’s modulus. In addition, deformation bands formed in sediments richer in detrital silicates involved cataclasis as deformation mechanism, which hamper permeability of the sediments. In the Granada Basin, the calcarenitic rocks rich in calcite and clays in the damage zone of faults associated to the Padul Fault are characterized by the presence of stylolites without any carbonate cement. On the other hand, marly lithofacies affected by faults are characterized by the presence of disaggregation bands that involve cracking and granular flow, as well as clay smear. The presence of stylolites and deformation bands in these rocks reduces permeability.
1. Introduction
Faults are localized deformation structures that form in different rock types, sediments, and tectonic settings. Faulting processes produce deformation, dissolution, and crystallization of minerals that generate microtextures which usually affect petrophysical properties and fluid flow within the deformed rocks [1,2,3,4,5,6,7]. Faulted rocks are divided into fault core and damage zone based on the deformation intensity (e.g., [8]). Fault core may contain the main slip surface, fractures, fault gouge, cataclasite, lenses of deformed and undeformed rocks, breccia, clay or sand smear and diagenetic features [9,10,11,12,13]. The damage zone surrounding the fault core may include small faults, fractures, and/or deformation bands, and sometimes drag fold [3,14,15,16,17]. The complexity of the internal structure of fault core and damage zone affect strongly the fluid flow during the seismic cycle. Outcrops are commonly used to study the details of fault core and damage zone, which gives only a snapshot of the faulting process and sometimes the most mature stage. However, studying active faults and syn-sedimentary deformation can contribute to the understanding of dynamic process of faulting and changes in sediment properties at different stages of faulting [18,19,20,21]. These changes are usually combined with diagenetic features and mineralization that could be attributed to different seismic cycles during the fault life [7,22].
The process of fracturing, fluid flow, and earthquake nucleation across sedimentary carbonate strata has received great attention (e.g., [23,24,25,26,27,28]). Vein formation due to pressure solution is a relevant aseismic process that dissipates strain energy during the seismic cycle. Moreover, veins also record stress cycles produced by earthquakes along faults [29,30]. The vein formation process involves an initial fracture aperture that is subsequently sealed by crystallization of cement [31]. Therefore, veins represent old fluid pathways controlling flow of fluid and heat in rocks (e.g., [32,33]). However, veins can have a strong effect on the host rock features, affecting the later brittle deformation of rocks [34,35,36,37], and the flow of fluids [38]. Seismic or aseismic fault slip behavior can be controlled by these features [39,40,41,42]. When carbonate pressure solution is not able to dissipate the energy, the development of seismic faults is favored by fragments of unmodified materials (asperities) acting as brittle nuclei. After nucleation, propagation of fractures occurs by seismic rupture (e.g., [23,25,27,28]). Mineral and microtextural characterization of the rocks provide significant information on the fluid flow processes of the rocks associated to the seismic cycle of faults. The main objectives of the present study are: (i) To investigate the changes in the deformation pattern and mineralogy of carbonate sediments in the fault damage zone during the aseismic cycle of faulting; (ii) to study the effect of these changes on the petrophysical and mechanical properties of the deformed sediments; (iii) to understand the effect of active faulting on fluid flow.
Therefore, we have studied damage zones of two active faults, Baza and Padul in Guadix-Baza and Granada basins, respectively, in South Spain. We have combined mineral and microstructural characterization by X-ray diffraction (XRD) and field emission electron microscopy (FE-SEM) studies with structural fieldwork and in situ measurements of rock properties (permeability and Young’s modulus) to finally find out the relation between deformation frequency, mineral processes, and changes in the soft-rock and sediment properties.
2. Geological Setting
The most active tectonic zone of the Iberian Peninsula with the highest seismic hazard and instrumental seismicity rate is the central Betic Cordillera (see e.g., [43,44]), especially in the Guadix-Baza and Granada basins. Furthermore, the 1884 Andalusia earthquake (magnitude Mw = 6.5) and the 1531 Baza earthquake (magnitude ca. 6.0) [44,45,46] are two of the major historical earthquakes recorded in this area.
A regional geodynamic setting with NNW–SSE compression is responsible of this seismicity [47,48,49,50,51] due to several NW–SE normal faults, Granada Fault system and Baza Fault, that accommodate a regional ENE–WSW extension [52,53,54,55].
2.1. The Baza Fault
The Baza Fault is located in the Guadix-Baza basin (central Betic Cordillera, Figure 1). In this region, convergence between Nubia and Eurasia has a rate of approximately 4 to 6 mm/yr [56]. The main tectonic feature of the area is an ENE–WSW extension that has produced dip normal faults since the Miocene [47]. The main active structure of the Guadix-Baza basin is the Baza Fault (Figure 1b), one of the most important active normal faults of the Betic Cordillera with 37 km of extension, a N–S to NW–SE strike and 45°–65° dipping to the east [55,57]. In the northern part of the fault, it has one main strand and fault zone is ca. 0.2 km width. However, more than 13 strands can be observed in the southern part of the fault zone, with a width of ca. 7 km. Since the late Miocene, accumulated total fault throw is around 2 km [55]. The estimations of the slip rate of the fault vary between 0.12 [44,55] to 0.49 mm/yr [57].
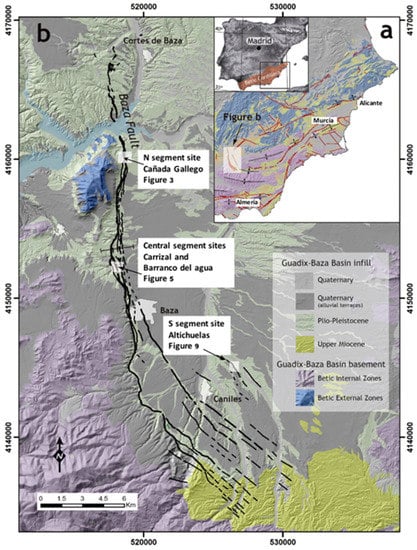
Figure 1.
(a) Geological sketch map of the eastern part of the Betic Cordillera (legend as in Figure 1b). (b) General geological map of the Baza Fault. The studied sections belong to the Plio-Pleistocene Benamaurel Unit. Modified from Castro and collaborators [63].
The geological, sedimentological, and geomorphological evolution of the Guadix-Baza basin was controlled by the Baza Fault. The maximum thickness of sediments (around 2200 m) can be found near the fault [58]. Sedimentary marine rocks (upper Miocene) and fluvial and lacustrine rocks (Pliocene/Pleistocene) fill this basin [59]. The transition from marine to continental environment was produced by the regional uplift of the surrounding relief of the Betic Cordillera which promoted a process of differential subsidence with endorheic continental sedimentation during the Plio-Pleistocene [59,60,61]. The stratigraphic study and facies mapping by Gibert and collaborators [61] includes three gradational lithologic zones (inner, intermediate and marginal). The studied samples in the present paper belong to the “Benamaurel Unit”, which includes the sedimentary deposits of the inner and the intermediate lithologic zones of the basin. The Benamaurel Unit comprises subhorizontal lacustrine deposits rich in carbonate, marls, gypsum, and dark claystones bearing native sulphur nodules. The basin changed to exorheic in the middle Pleistocene because of large sedimentation, after the drainage of the basin was captured by a tributary of the Guadalquivir river and underwent erosive incision with local deposition of alluvial fans, piedmont deposits, fluvial terraces and valley-bottom deposits. A flat geomorphic surface (glacis) of this period, frequently used as marker of recent deformation, was partially preserved [57]. After the change to exorheic conditions in the basin, many topographic escarpments along the trace of the Baza Fault and a major mountain front nearly 30-km long were created [57,62].
2.2. The Granada Fault System: Padul Fault
The Granada Basin is a late orogenic intramontane basin located in the central sector of the Betic Cordillera, southern Spain (Figure 2) [54,64]. The most remarkable normal fault of this region from a geomorphic point of view is the Padul Fault, located in the Internal Zone of the Betic Cordillera. The Sierra Nevada highest reliefs and the Granada basin are separated by this active normal fault [65]. Footwall metamorphic marbles (Alpujarride complex) show the great mountain front created by the fault [66,67]. A northern segment is 5.25-km long and a southern segment is 7-km long can be identified. Fault strike is predominantly NW–SE, its throw is around 800 m in its central part [68] and dip ranges from 65°–20° to the SW. Well-preserved scarps can be observed in the contact with the footwall basement. Since the end of the Miocene, a graben filled by Late Tortonian bioclastic grainstones and Messinian marls was formed in the hanging wall block (Padul graben), which received alluvial fans during the Pliocene and the Quaternary [69,70].
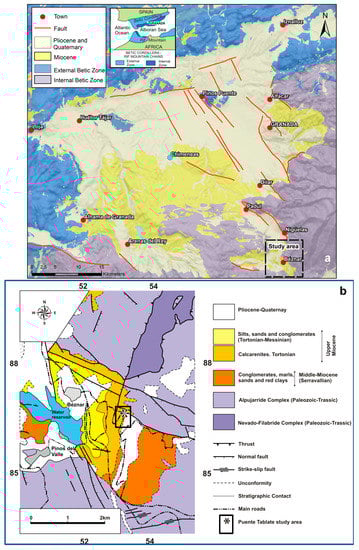
Figure 2.
(a) Geological sketch of the Granada Basin and the Betic Cordillera, southern Spain. (b) Geological map of the study area. Location of the area is indicated in (a). Modified from Sanz de Galdeano [71].
The study area, named Tablate area [71,72,73], is located less than 3 km to South of the Padul Fault, in the southeastern edge of the Granada Basin where a tectonically poorly consolidated sedimentary succession, up to 250 m thick, made up of middle Miocene to Quaternary siliciclastic and carbonate rocks unconformably overly a Paleozoic to Triassic metamorphic basement strongly deformed during the Alpine orogenesis [74,75]. In the study area, Agosta and collaborators [72] indicated that the sedimentary beds dip about 10° SW, and are crosscut by three different sets of normal faults which activity is associated to the Padul Fault. Strikes of these faults are ∼N–S (set 1), ∼E–W (set 2), and ∼NW–SE (set 3). The first fault set contains strands of individual segments that dip either E or W, while the second set contains strands that dip either N or S. Both sets 1 and 2 consist of faults up to −3 km-long with throws up to 100 m (set 1) and 80 m (set 2). Faults of set 3 mainly dip SW with throws up to 100 m.
3. Methods
We conducted structural studies, in situ field measurements and regular sampling at outcrops. 1D scanlines were conducted at the base of each outcrop to position faults and fractures in cm length scale for further in situ measurements. We first identified the core of the main fault and its boundaries with the damage zone in each locality following the method described by Torabi et al. [17]. The fault-core thickness is defined as the total thickness of fault rocks, which in our studied localities include the major slip surface, crushed material, and clay smear incorporated between slip surfaces in the fault core. The damage zone statistical boundaries with host rock are identified using the slop changes in the cumulative plots [17]. The structural measurements in the field include registering the position of all deformation features along the scanline, orientations of faults (using lower-hemisphere projection on Schmidt Stereonet), fractures, and bedding along with a description of the studied sections.
A TinyPermII and a Schmidt Hammer were used in the field for in situ permeability and hardness measurements at regular distances along the scanlines, avoiding measurements on fractures. The measurements were conducted almost perpendicular to the main fault orientation in each section (locality). The in situ measurements were performed on fresh rock surfaces to avoid the surface erosion effect [76]. In order to reduce the measurement errors, several measurements were performed at the same location and average values are provided in the plots presented in this paper. The in situ measurements from TinyPermII () were converted to permeability () values using the empirical relation established by the manufacturer (New England Research), Equation (1):
TP = −0.8206log(k) + 12.8737
The Schmidt Hammer measurements were converted to Young’s modulus using the following empirical relation [76,77].
where HR is the Schmidt Hammer measurements and E is the Young’s modulus.
ln(E) = −8.967 + 3.091ln(HR) ± 0.1, R2 = 0.99
Small samples were taken at the same location where the in situ measurements of permeability and hardness were performed along each scanline for each locality. The samples were also analyzed through X-ray diffraction (XRD) and field emission scanning electron microscopy (FE-SEM) to establish the mineral assemblages and to characterize the texture at micrometer scale. XRD data were obtained from random powders and oriented aggregates after washing with distilled water to remove salts. Oriented aggregates were prepared by sedimentation on glass slides and the <2 µm fraction was separated by centrifugation. Ethylene glycol treatment was carried out to permit the identification of expandable clay minerals (smectite, interstratified layers, etc.).
X-ray diffractograms were obtained in a PANalytical Empyrean diffractometer equipped with a θ/θ goniometer. The CuKα radiation with a voltage of 45 kV and a current of 40 mA was used with a step size of 0.01° 2θ and a count time of 40 s per step. Samples were scanned from 4° to 64° 2θ (Centro de Instrumentación Científico-Técnica, CICT, University of Jaén). Factors proposed by Dinelli and Tateo [78] and Vazquez and Jimenez-Millan [79] were used for the estimation of the relative abundances of minerals. Following the XRD, microstructural investigation has been done by FE-SEM. Carbon-coated polished thin sections were examined using back-scattered electron (BSE) imaging in atomic number contrast mode and energy-dispersive X-ray (EDX) analysis to characterize the textural and mineralogy. These observations were carried out with a Merlin Carl Zeiss SEM at the Centro de Instrumentación Científico-Técnica, CICT (University of Jaén).
4. Results
4.1. Damage Zone of the Baza Fault
Five outcrops were studied along Baza Fault, covering damage zones made of Plio/Pleistocene soft rocks from the intermediate zone of the Benamaurel unit and developed at the northern, central, and southern segments of this major fault. In the following details of outcrop studies and in situ measurements are provided.
4.1.1. Northern Segment: Cañada Gallego Site
The Cañada Gallego site is located between the Baza and Cortes the Baza villages, in the northern part of the Baza Fault (UTM 30S 518679, 4160143, Figure 1b). In this area, the width of the fault zone is around 0.2 km, with several parallel closely spaced splays merging into a main fault (Figure 3 and Figure 4), which leaves a high morphological scarp. At the northern end, a gradual decrease of the throw is observed, practically on one single superficial fracture, with a progressively steeper dip. At the surface, the majority of fault planes have NE–SW orientation dipping SE (Figure 4d) with dip-slip displacement in Pliocene–Pleistocene soft rocks. In this site, the Cañada Gallego gully runs from east to west (Figure 3b), sub-perpendicular to the fault zone. The scanline was carried out on the hanging wall of a normal fault with approximately 50 m displacement cutting through carbonate rocks (Figure 4). The carbonate rocks belong to the intermediate zone of the Benamaurel unit described by Gibert and collaborators [61] that they occur intercalated with lutite layers, as well as fine- to coarse-grained siliciclastics beds, and chert. This fault includes well-developed clay smear in the fault core, which is around 60 cm thick at the base of the outcrop.
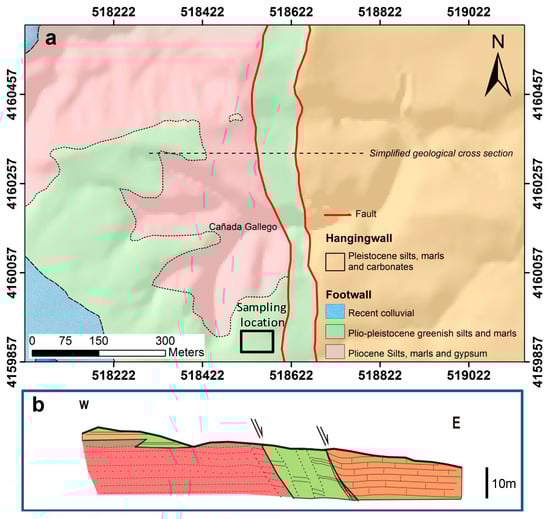
Figure 3.
(a) Geological–geomorphological map of the northern sector. Location in Figure 1. (b) Geological cross section along the northern sector of the Baza Fault.
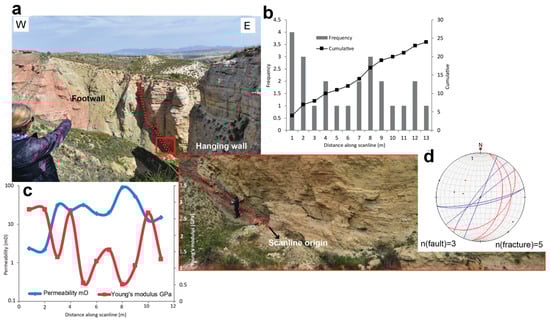
Figure 4.
(a) A photo of the northern segment of the Baza Fault (Cañada Gallego site). Note that the scanline measurements were conducted in the hanging wall of this fault. (b) Frequency and cumulative distribution of fractures. (c) Permeability and Young’s modulus measurements along the scanline. (d) Stereoplot of the fault (red) and fracture (blue) orientations.
A series of samples were taken along the scanline at different distances from the fault. XRD analyses of rocks from the scanline conducted in the hanging wall reveal a dolomite-rich composition (up to 64%) of the mineral content (Table 1). Several samples are enriched in quartz and feldspars, representing around 40% of the mineral composition. Clay mineral content varies between 8% and 14%. Illite is always present in the mineral assemblage, whereas kaolinite, smectite, or chlorite appear only in some samples.

Table 1.
X-ray diffraction (XRD) analysis of the samples from the northern segment of the Baza Fault (Cañada Gallego site). The distance corresponds to the distance from fault, which is also shown on the x-axes of the plots in Figure 4.
Frequency of fractures is higher close to the fault (up to 9 fractures per meter, Figure 4b) and drops out away from the fault in the hanging wall, where the damage zone ends due to inaccessibility (1 fracture per meter at 21 m of the scanline). Therefore, the cumulative plot does not flatten out along the scanline. There are some local increase that could be related to the changes in the mineralogy as we did not observe any minor faults in the damage zone. Permeability changes between ~2 mD close to the fault core and ~90 mD away from the fault, which in total changes one order of magnitude. Young’s modulus measurements range between ~0.5 GPa and ~2.7 GPa, with the highest value located close to the fault core (Figure 4c).
The permeability and Young’s modulus measurements show a negative correlation, with increasing permeability, the Young’s modulus decreases and vice versa. The higher dolomite content for the samples at 0.8 m and 6 m distances from the fault (Table 1), corresponds approximately to lower permeability and higher Young’s modulus values on the plot in Figure 4c.
4.1.2. Central Segment: Carrizal and Barranco Del Agua Sites (East and West Sections)
The outcrops studied in the central part of the Baza Fault occur in the damage zone of a 1-km wide fault zone, which includes several NNW–SSE striking strands. Offsets of the Pleistocene units indicate that most of the Baza Fault cumulative slip concentrates along two main strands. This area is characterized by a vertical sequence of different flat landforms (Figure 5). The highest landform (surface A) is an extensive, flat surface, gently dipping toward the center of the basin (to the east) corresponding to the glacis of the Guadix-Baza Basin. Erosive incision in this sector developed two main gullies (Carrizal and Barranco del Agua) running perpendicular to the Baza Fault, which join in a creek to the east. We focused our analysis in this central segment on three outcrops, namely, the Carrizal outcrop and the Barranco del Agua east and west outcrops, located on two fault strands. The fault strands cropping out in this sector are responsible for a ca. 20 m offset of the glacis (surface A, Figure 5).

Figure 5.
(a) Geological–geomorphological map of the central sector. Location in Figure 1. (b) Geological cross section along the central sector of the Baza Fault. Modified from Castro and collaborators [63].
Carrizal Site
In this outcrop a normal fault is exposed, which is associated to the westernmost of the two main strands of this sector. This scanline was placed at the hanging wall of this fault (UTM 30S 518200E, 4152500N, Figure 6). The fault is made of several splays and clay smear, which totally encompasses 1.4-m thick fault core at the base of the outcrop (ground level). This outcrop is characterized by the presence of marly beds, which are predominant over the carbonate beds. Thin beds of dark lutites rich in organic matter are associated with the carbonate and marly beds. Scanline was conducted on marly levels with significant amounts of carbonate, quartz, and clay minerals, which were identified and measured on samples (Table 2). Dolomite content (up to 54%) prevails over calcite (<8%). The amount of phyllosilicates is high (>27%). Samples near the origin of the scanline are enriched in clay minerals (39%, illite and paragonite as main minerals) quartz (25%), and feldspars (11%). Small amounts of gypsum can also be observed in these sediments. Since the sediments were very fragile, we just conducted permeability measurements with no Schmidt hammer measurement. Number of fractures is 3 per meter around the fault but increases within the damage zone away from the fault (Figure 6b). The rest of damage zone was covered, therefore, the cumulative plot does not show any flattening. Permeability changes between 47 and 105 mD, increasing away from the fault core (Figure 6c), which agrees with the changes in the fracture frequency (Figure 6b) and the clay content in the rock samples (Table 2).
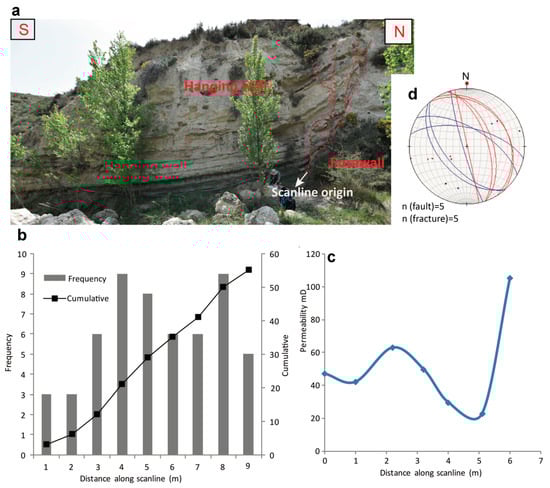
Figure 6.
(a) Photo of the outcrop exposed in the Carrizal site (central segment of the Baza Fault). The main fault includes clay smear in the fault core and small synthetic faults and fractures in the damage zone. (b) Frequency and cumulative distribution of fractures along the scanline. (c) Permeability and Young’s modulus measurements along the scanline. (d) Stereoplot of the fault (red) and fracture (blue) orientations.
Table 2.
XRD analysis of the samples from the central segment of the Baza Fault at the Carrizal site. The distance corresponds to the distance from fault, which is also shown on the x-axes of the plots in Figure 6.
Barranco Del Agua Gully (West Section)
This outcrop is located between the two main strands of the fault in this locality (UTM 30S 518290E 4152650N, Figure 5). The studied outcrop includes a large normal fault, in which it had no measurable displacement due to lack of markers. The origin of the scanline (0 point) was set up in the hanging wall of the fault and then continued into the footwall after crossing the fault between 5.7 and 9.5 m along the scanline (Figure 7a). White lacustrine carbonate beds up to 50 cm thick appear intercalated with thin grey lutite and silt layers. These lithofacies are very carbonate rich (up to 83%) (Table 3), predominating dolomite over calcite. The amount of quartz, feldspars, phyllosilicates, and gypsum is very low (<10%). Sampling for mineralogical study and permeability and Young’s modulus measurements were also carried mainly along a carbonate-rich level.
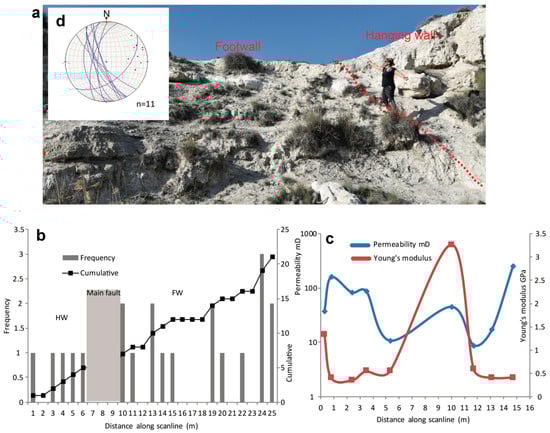
Figure 7.
(a) Photo of the outcrop exposed in Barranco del Agua gully (west section) in the central segment of the Baza Fault. The person on the picture is standing along the fault between the hanging wall (behind her) and footwall. The origin of the scanline (0 point) was set up in the hanging wall of the fault and then continued into the footwall up to 25 m as far as the damage zone was accessible. (b) Frequency and cumulative distribution of fractures along the scanline. (c) Permeability and Young’s modulus measurements along the scanline. (d) Stereoplot of the fracture’s orientations.
Table 3.
XRD analysis of the samples from the central segment of the Baza Fault at the Barranco del Agua gully (west section). The distance corresponds to the distance from fault, which is also plotted on the x-axes of the plots in Figure 7.
The fault core thickness is estimated to be around 3.8 m at the scanline. The fracture frequency is steady (1 fracture per meter) in the hanging wall until it reaches the fault, in which the number of fractures increases to 2 in the fault zone and then it drops out in the footwall before it increases again at 24 m along the scanline (Figure 7b). The scanline was stopped at 25 m because of the inaccessibility of the rest of footwall damage zone therefore the cumulative curve does not flatten out. Permeability changes between ~9 mD to ~230 mD, indicating two orders of magnitude change along the damage zone (Figure 7c). Permeability increases in the fault core to around 160 mD. Young’s modulus measurements are between ~0.4 GPa and ~3.2 GPa, which show a sudden increase at 10 m of the scanline (Figure 7c). The low permeability values in the scanline (corresponding to high Young’s modulus values) could be related to the high calcite/dolomite content (Table 3).
Barranco Del Agua Gully (East Section)
This outcrop is located at the east of the eastern strand of the fault zone in this sector (UTM 30S 518420E 4152730N, Figure 5). We studied a small part (6 m) of the damage zone of a normal fault exposed in this locality (Figure 8a). Measurements and sampling were carried out on carbonate lithofacies occurring at the footwall of the normal fault. These rocks are enriched in calcite and contain very low quartz, feldspars, and clay minerals (illite) (<6%) (Table 4).
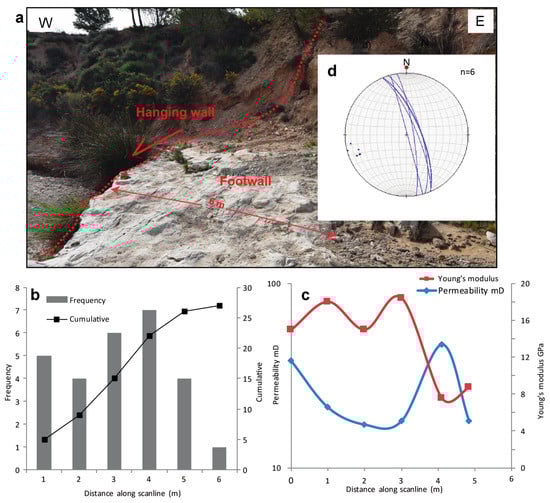
Figure 8.
(a) Photo of the outcrop exposed in Barranco del Agua gully (east section) in the central segment of the Baza Fault. The outcrop includes a small part of a normal fault damage zone, which was studied along a scanline. (b) Frequency and cumulative distribution of fractures. (c) Permeability and Young’s modulus measurements along the scanline. (d) Stereoplot of fracture orientations.
Table 4.
XRD analysis of the samples from the central segment of the Baza Fault at the Barranco del Agua gully (west section). The distance corresponds to the distance from fault, which is also plotted on the x-axes of the plots in Figure 7.
The fracture frequency ranges from 1 to 7 per meter (Figure 8b). The cumulative curve flatten out, which might indicate the statistical boundary of damage zone with host rock. Permeability changes between 17 and 46 mD. While Young’s modulus changes between 4 and 18 GPa, which is higher than similar measurements in the previous outcrops (Figure 8c). There is a clear negative correlation between the permeability and Young’s modulus measurements, in which when permeability increases, Young’s modulus decreases and vice versa. The changes in the permeability and Young’s modulus are also consistent with the changes in the fracture frequency (Figure 8).
4.1.3. Southern Segment: Altichuelas Site
The Altichuelas locality is located 2.5 km NE of Caniles village, in the southern part of the Baza Fault (UTM 30S 526630 4144887, Figure 9). In this sector, the 7-km-wide fault zone splits into several NW–SE-slipping fault strands and the Rambla de Valcabra ephemeral river flows from south to north, sub-parallel to the fault zone (Figure 9). This river is dry for long periods of time and only experiences flow after it has rained enough in the catchment area. Structural measurements and sampling were conducted on the bedrock units, which are Plio-Pleistocene well-bedded carbonate lithofacies intercalated with silts, clays, and fine sands belonging to the intermediate zone of the Benamaurel unit described by Gibert and collaborators [61]. Thin and thick carbonate beds are mainly massive, but also can include laminated and nodulose micritic mudstones. The lutites of this unit are affected by minor but common erosional surfaces. The carbonate beds may contain variable amounts of gypsum. A normal fault located in the north corner of this outcrop is considered as the main fault in this locality. This fault has a minimum displacement of 20 m and a fault core thickness around 0.5 m. The shaley layer in the hanging wall has been smeared out along the fault core and cavities/dissolution features are observed both around the main fault and along the two studied sections (Figure 10 and Figure 11).
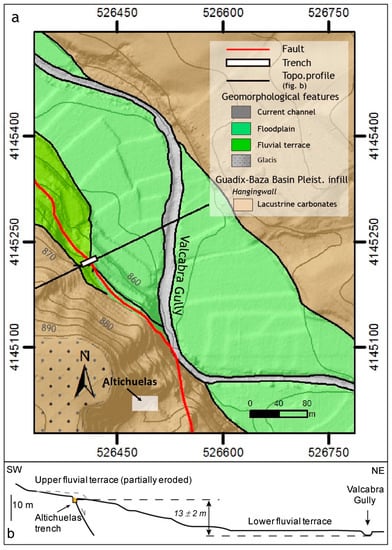
Figure 9.
(a) Geological–geomorphological map of the central sector of the Baza Fault. Location in Figure 1. (b) Geological cross section along the southern sector. Modified from Castro and collaborators [63].
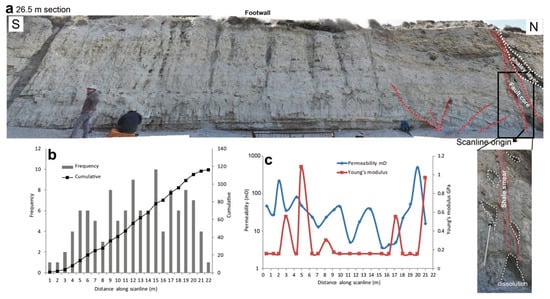
Figure 10.
(a) Section 1 in Altichuelas site (southern segment of the Baza Fault), where the first scanline was conducted at the base of the outcrop. Note the fault in the northern corner of this outcrop with a clay smear and many cavities/dissolution features around the fault. The scanlines were conducted in the footwall damage zone of this fault. There are several small faults, illustrated with red dashed lines that are either synthetic or antithetic to the orientation of the main fault. (b) Frequency and cumulative distribution of fractures along the scanline. (c) Permeability and Young’s modulus estimations along the scanline.
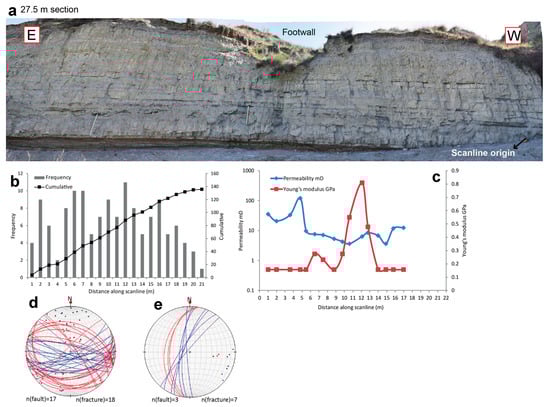
Figure 11.
(a) Section 2 in Altichuelas site (southern segment of the Baza Fault), where the second scanline was conducted at the base of the outcrop. Note that there are only fractures observed in this section, which is part of the main fault footwall damage zone. (b) Frequency and cumulative distribution of fractures along the scanline. (c) Permeability and Young’s modulus estimations along the scanline. (d) and (e) stereoplots of faults (red) and fractures (blue) in Sections 1 and 2, respectively.
The two studied sections (scanlines) are perpendicular and include the footwall damage zone of the main fault. In addition, there are several small faults in the footwall damage (Section 1, Figure 10), which are both synthetic and antithetic to the main fault. Small fractures are observed all over the outcrop in both sections.
Sampling for mineralogical study and in situ permeability and Young’s modulus measurements were carried mainly along a carbonate level. XRD analyses showed similar mineral associations along both scanlines, that mainly consist of calcite, dolomite, aragonite, quartz, clay minerals, and feldspars (Table 5). The main mineralogical characteristic of these sediments is the large amount of carbonate, which oscillate between 42 and 63%. Calcite is commonly the predominant carbonate (Figure 12a) in the non-deformed lithotypes, although in the samples richest in carbonate, the amount of dolomite plus aragonite frequently predominates over calcite. The quartz content varies between 7% and 34%. In addition, significant clay mineral contents were found (around 15%) with illite as predominant phyllosilicate. The proportion of feldspars and gypsum is in general very low (frequently <10%).
Table 5.
XRD analysis of the samples along the scanline 1 in Altichuelas site in the southern segment of the Baza Fault. The distance corresponds to the distance from fault, which is also plotted on the x-axes of the plots in Figure 10.
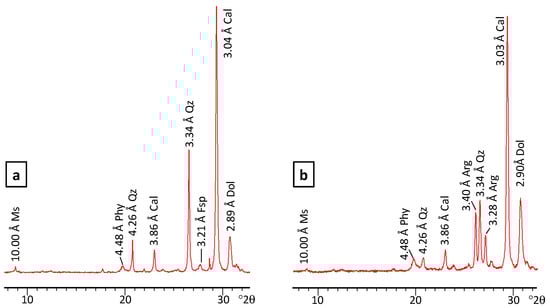
Figure 12.
Representative XRD patterns of samples from the damage zones of the Baza Fault (Altichuelas site). (a) Calcite-rich samples from portions of non-deformed lithotypes. (b) Aragonite and dolomite-rich samples with low permeability values. Cal: Calcite, Dol: Dolomite, Arg: Aragonite, Qz: Quartz, Fsp: Feldspars, Phy: Phyllosilicates, Ms: Muscovite. Mineral abbreviations according to Whitney and Evans [80].
Fracture frequency is low close to the main fault (1 per meter as background frequency), and increases in the damage zone along the scanline, where there are several fault splays (Figure 10b and Figure 11b). Further away from the main fault, the fracture frequency shows some fluctuations, that could be related to the mineralogical changes or diagenetic features or strain partitioning in this multilayer sequence. The cumulative plots flatten out toward the end of both sections indicating the statistical boundaries of damage zone with the host rock around 21 m of the scanlines (Figure 10b and Figure 11b). Both permeability and Young’s modulus measurements also show similar changes and fluctuations along the two scanlines. Permeability ranges from ~15 mD up to ~490 mD in Section 1 (Figure 10c) and from ~14 mD to ~120 mD in Section 2 (Figure 11c), indicating an order of magnitude change along the damage zone. Young’s modulus measurements range between ~0.15 GPa and ~1 GPa in Section 1 and between ~0.15 GPa and ~0.8 GPa in Section 2 (Figure 10c and Figure 11c). Orientations of faults (red) and fractures (blue) in Sections 1 and 2 are shown in the stereoplots of Figure 11d,e. The lower permeability values (correspond to higher Young’s modulus) along the scanlines could be related to the presence of higher dolomite/calcite and partly aragonite content (Table 5 and Figure 12b).
4.1.4. Petrography: Outcrops in the Damage Zones of the Baza Fault
Carbonatic lithofacies consist of a very fine sized micritic matrix (1–2 µm) (Figure 13) predominantly made of calcite (Barranco del Agua east), dolomite (Cañada Gallego and Barranco del Agua), and mixtures of calcite, dolomite, quartz, feldspars, and phyllosilicates (Altichuelas and Carrizal).
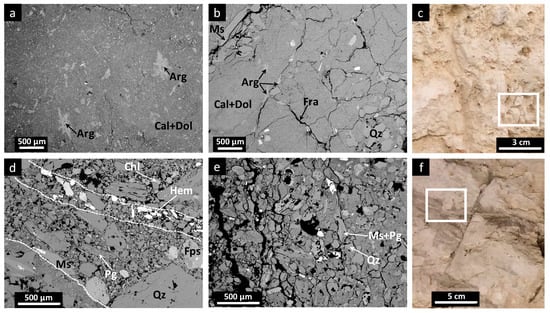
Figure 13.
Petrography of samples from the damage zones of the Baza Fault. (a,b): Carbonatic lithofacies made of a micritic matrix of dolomite and calcite with a disconnected fracture network filled by aragonite (Altichuelas site). (c) Outcrop picture showing the macroscopic fractures of the sample; square indicates the area of the SEM images (a) and (b). (d,e) Detrital silicate deformation bands made of quartz, alkali feldspars, Fe oxides/hydroxides and phyllosilicates (muscovite, paragonite, chlorite) (Carrizal site). (f) Outcrop picture showing the macroscopic fractures of the sample; square indicates the area of the SEM images (d) and (e). Cal: Calcite, Dol: Dolomite, Arg: Aragonite, Qz: Quartz, Ms: Muscovite, Pg: Paragonite, Chl: Chlorite, Hem: Hematite, Fps: Feldspar, Fra: Fractures. Mineral abbreviations according to Whitney and Evans [80].
Micrograins from matrix are anhedral, and they do not show preferred elongation or crystal orientation (Figure 13a,b), their boundaries are irregular, resulting in an isotropic, compact microstructure. Figure 13c shows an outcrop picture with the macroscopic fractures of the sample. Coarser calcite has been found only within fossils. Grain size is broadly constant in all the site samples, except for those richer in detrital silicates (Altichuelas and Carrizal, Figure 13d,e) where massive matrix hosts irregular bands made of irregular quartz clasts, alkali feldspars and detrital crystalline phyllosilicate lamellae, up to 200 μm in size (muscovite, paragonite, chlorite). These bands are deformation band (cataclastic bands) formed during the faulting process of poorly consolidated sediments and involve cataclasis or grain breakage (e.g., [81,82]). Euhedral crystals or perfectly rounded clusters of Fe oxides/hydroxides and sulphides, from submicrometre to 20 μm in size can also be found. Figure 13e shows an outcrop picture with the macroscopic fractures of the sample. A pattern of disconnected fracture network is developed in many of the carbonatic lithofacies samples, suggesting preferential flow through the fractures. Microsealing by precipitation of aragonite (Altichuelas site) or dolomite (Barranco del Agua W) filling fractures occur through this vein network associated to deformation bands (Figure 13a,b).
4.2. Outcrops Studied along the Southeastern Edge of the Granada Basin
Two localities were studied along the southeastern edge of the Granada Basin, Tablate A and Tablate B. In the following, details of the in situ measurements of each outcrop are presented.
4.2.1. Tablate A Locality
This area is located near the Tablate bridge on the Torrente river, at the hanging wall block of the Padul Fault (UTM coordinates 30S 453058E, 4086362N). The sediments belong to the Padul graben formed since the end of the Miocene, and filled in this sector by Late Tortonian shallow marine yellow calcarenite lithofacies (shallow-marine skeletal grainstones and rudstones including bryozoans, bivalves, red algae, echinoids and barnacles) intercalated with grey fine-sized sands deposited within the Granada Basin [74]. The thicknesses of the individual layers range from 20 cm to 12 m. Extensional faults striking ~N–S and ~E–W occur in this outcrop. Around the fault zones, the rocks from the damage zone are pervasively crosscut by bed-perpendicular joints and veins, arranged in two orthogonal sets striking ~N–S and ~E–W (Figure 14).
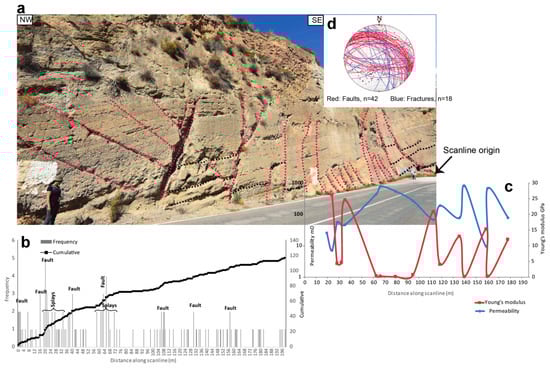
Figure 14.
(a) Section in the Tablate A locality in the southeastern edge of the Granada Basin. Several small normal faults (red dashed lines) located in the damage zone of a segment to the S of the Padul Fault have been measured along the scanline. Layering is shown in black dashed lines. (b) The fracture frequency and cumulative distribution shows an increase in the number of fractures from an average background fractures (1 fracture per meter) where the small faults are located. (c) Permeability and Young’s modulus measurements along the scanline. (d) Stereoplots showing the orientation of faults and fractures in this locality.
XRD data (Table 6 and Figure 15) reveal that calcarenite beds are calcite rich (62–90%), although some samples show significant quartz (up to 24%) and illite contents (up to 11%). Grey sands are characterized by high quartz content (up to 88%) and the significant presence of illite (<18%).
Table 6.
XRD analysis of the samples from Tablate A locality in the southeastern edge of the Granada Basin. The distance corresponds to the distance from fault, which is also plotted on the x-axes of the plots in Figure 13.
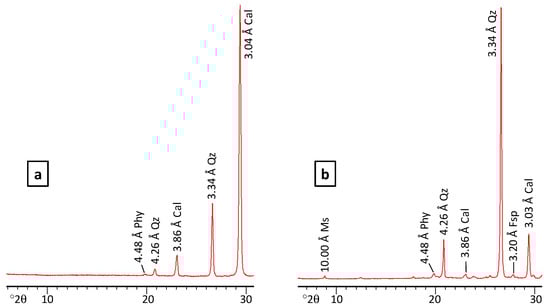
Figure 15.
Representative XRD patterns of samples from the Tablate area in the southeastern edge of the Granada Basin. (a) Calcite-rich samples from calcarenite beds. (b) Quartz-rich grey sands. Cal: Calcite, Qz: Quartz, Fsp: Feldspars, Phy: Phyllosilicates, Ms: Muscovite. Mineral abbreviations according to Whitney and Evans [80].
A long scanline (196 m) was conducted along the hanging wall damage zone of a segment to the south of the Padul Fault. Many small normal faults were observed and measured along the scanline. Displacement on these faults ranges from a few centimeters up to 3 m. Fault core thickness of these small faults in this damage zone section ranges from a few cm up to 0.7 m. The background fracturing increases from 1 fracture per meter to up to 5 fractures in meter close to the faults (Figure 14b). Cumulative curve is gradually flattening out after the last fault and toward the end of section, approximately around 160 m along the scanline (Figure 14b). Permeability changes from ~7 to ~800 mD along the scanline and it increases close to the faults. Young’s modulus measurements vary between 0.1 GPa and ~26 GPa with the lowest values close to the faults (Figure 14c). The changes in the permeability and Young’s modulus correspond to the fracture frequency (Figure 14). The higher permeability values (corresponding to low Young’s modulus values) along the scanline (Figure 14c) could be related to high calcite and low quartz, illite, and smectite contents in the samples (Table 6).
4.2.2. Tablate B Locality
This area is located 1 km to the SW of Tablate A on a road to Pinos del Valle village (UTM coordinates 30S 452695E, 4086485N). The outcrop is situated in the hanging wall damage zone outcropping to south of the Padul Fault and is made of Messinian marl lithofacies intercalated with lutite beds. The small faults outcropped in this locality are mainly normal faults with only two reverse faults (Figure 16a). Displacement varies between 5 cm to 50 cm. Fault core thickness ranges between a few cm to 15 cm. Samples characterized from this outcrop show a significant amount of calcite (35–56%), quartz (12–27%), and phyllosilicates (15–31%) (Table 7). Since the outcrop was very fractured, no fracture frequency measurement was performed on this outcrop. Permeability changes substantially (up to 4 orders of magnitude) along the scanline, from 0.6 mD to 1.9 mD (Figure 16b) with the highest values close to the faults, where the samples have lower phyllosilicate contents (Table 7). While Young’s modulus measurements vary between 0.4 GPa and 1.4 GPa with the lowest values close to the faults. The permeability and Young’s modulus measurements show a negative correlation, with increasing permeability the Young’s modulus decreases and vice versa.
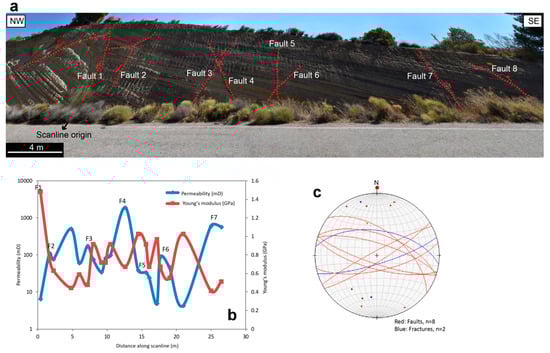
Figure 16.
(a) Section in the Tablate B locality in the southeastern edge of the Granada Basin. Several small normal faults located in the damage zone of a segment to the south of the Padul Fault have been measured along the scanline. (b) Permeability and Young’s modulus measurements along the scanline. (c) Stereoplot showing the orientation of faults and fractures.
Table 7.
XRD analysis of the samples from Tablate B locality in the southeastern edge of the Granada Basin. The distance corresponds to the distance from fault, which is also plotted on the x-axes of the plots in Figure 14.
4.2.3. Petrography: Outcrops in the Damage Zones of the Southeastern Edge of the Granada Basin
BSE images reveal that the studied carbonate lithofacies (Tablate A) are made of carbonate skeletal bioclasts (mainly bryozoan fragments with minor amounts of red algae and thick-shelled, bivalve fragments) and few terrigenous grains (quartzites, schists and rare phyllites and marbles) (Figure 17a–c). Some of these rocks show thin discontinuous stylolitic surfaces following the stress orientation (Figure 17d,e). Pressure solution seams are not homogeneously distributed within the rock, leaving large rounded portions of massive carbonate grainstones almost unaffected. The stylolite-filling material is invariably formed by an ultrafine smectite matrix that encloses relic detrital grains of illite and quartz (Figure 17e). On the other hand, marly lithofacies affected by faults (Tablate B) are characterized by the presence of disaggregation bands up to 500 µm thick made of coarse grains (50–200 µm) of quartz, calcite, and feldspars affected by grain cracking and granular flow processes such as grain rolling and grain boundary sliding (Figure 18). In these bands phyllosilicate alignment and local clay smearing were also observed.
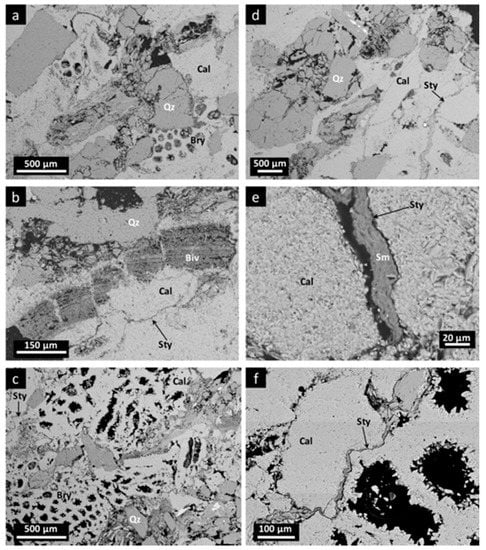
Figure 17.
BSE images from samples in the damage zones in the Tablate A locality (S of the Padul Fault). (a–c) Carbonate lithofacies containing carbonate skeletal bioclasts (bryozoan fragments, a and c, and bivalve fragments, b) and terrigenous grains (quartz and schists). (d–f) Thin discontinuous stylolitic surfaces formed by an ultrafine smectite matrix that encloses relic detrital grains of illite and quartz. Sm: Smectite, Sty: Stylolitic surfaces, Bry: Bryozoan fragments, Biv: Bivalve fragments. Rest of abbreviations as in Figure 13.
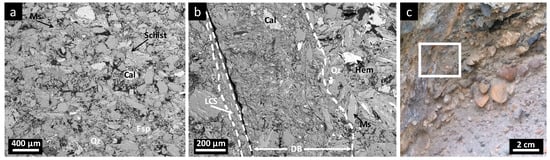
Figure 18.
BSE images of samples from the damage zones in the Tablate B locality (S of the Padul Fault). (a) Marly lithofacies made of quartz, phyllosilicates, calcite, feldspars and terrigenous grains (e.g., schists). (b) Deformation band (DB) in the form of a disaggregation band with phyllosilicate alignment and local clay smearing (LCS) along the band. (c) outcrop picture showing the macroscopic fractures of the sample; square indicates the area of the SEM images (a) and (b). Mineral abbreviations as in Figure 13.
5. Discussion
There are several factors affecting the deformation behavior (brittle versus non-brittle) and intensity (fracture frequency) in a fault damage zone. These factors include strain localization during the faulting process, host rock mineralogy, and secondary mineralization or cementation during faulting. In the following, these factors are discussed in the light of our results.
5.1. Deformation Pattern, Mineral Changes, and Petrophysical Properties
In general, our observations confirm that the number of fractures increases close to the faults with at least two exceptions in Altichuelas and Carrizal localities, in which the number of fractures around the main fault is low (1 fracture per meter). In these two outcrops, there are several splays of the main fault, which continue around a few meters away from the main fault and could accumulate the strain and compensate for the missing fractures. In addition, the mineralogy of host rock affects the deformation behavior of the sediments both in the fault core and damage zone contributing to the non-brittle deformation during the process of faulting and clay smear observed in several cases (e.g., in Altichuelas and Carrizal localities) in this study. Furthermore, secondary mineralization during active deformation of saturated sediments has resulted in the formation of dolomite and aragonite along the damage zone in Baza Fault localities.
The cementation affects the mechanical and petrophysical rock properties. Our measurements show an increase in Young’s modulus and a decrease in permeability wherever there is a high content of dolomite. According to the XRD data this occurs in all localities of the Baza Fault: Cañada Gallego (up to 64% dolomite), Carrizal (up to 54% dolomite), Barranco del agua gully (up to 61% dolomite), and Altichuelas localities (up to 40% dolomite plus aragonite).
5.2. Fluid Flow and Mineral Processes
The cement fabrics reveal fluid flow and dissolution-crystallization processes during fault activity possibly related to the seismic cycle. Sediments in the Baza Fault localities include microfractures, probably produced during the seismic behavior of the fault, that are filled by sparitic infills of aragonite or anhedral dolomite, probably precipitated during the aseismic cycle. Whereas the calcarenitic rocks affected by the faults associated to the Padul Fault are characterized by the presence of stylolites without any carbonate cement. This could be attributed to the higher calcite and clay content in these sediments.
The origin of aragonite and dolomite in the Baza Fault localities can be related to the existence of fractures as preferential flow paths, together with fracture-pore interactions in these sediments and different geochemical processes related to fluid-pore composition. Fractures can act as preferential flow paths; flow conditions and fluid-pore composition can have a strong influence on the precipitation and dissolution processes during deformation. Samples far from the damage zone of the Baza fault are characterized by the absence of cataclastic textures and cementing minerals associated with deformation such as aragonite [83,84], which suggests that fluids especially channeled through the damage-zone fault zone.
The chemical conditions that affect the precipitation of aragonite are well-known by experimental research (e.g., [85]). The increase of Mg/Ca ratios can promote the precipitation of aragonite instead of other carbonate minerals [86,87,88]. Aragonite may precipitate from circulating solutions bearing suspended carbonates [89]. Previous experimental studies revealed that the precipitation of calcite and dolomite in natural environments occurs under Mg/Ca ratios of 2/12 [83,88], but aragonite only crystallizes in Mg-rich solutions (Mg/Ca > 50) [90,91,92,93]. The precipitation of aragonite, a mineral with low Mg content, in a high Mg/Ca ratio environment can be explained taking into account some crystal chemical considerations. The crystallization of Mg-calcite and dolomite is successively favored as the fluids become Mg-richer.
The presence of relevant amounts of Mg2+ can generate an inhibitory effect on the carbonate crystallization if a critical Mg2+/Ca2+ ratio is exceeded [94,95]. The smaller size of Mg2+ (larger hydration sphere) compared to Ca2+ do not favor the dehydration processes required to fix it on the mineral surface [96], promoting the development of aragonite grains instead of other carbonate minerals. Singurindy and Berkowitz [97] observed that the amount of precipitated aragonite was largest in fractures where the concentration of Mg2+ in solution is higher. Therefore, the formation of CaCO3 polymorphs is strongly controlled by the presence of dissolved Mg2+, given that the crystallization of aragonite is clearly favored by Mg2+, partially avoiding the precipitation of calcite as the more stable phase. Furthermore, the process of aragonite to calcite transformation by dissolution-precipitation reactions is also inhibited by Mg2+, since this cation can avoid the nucleation and growth of calcite favoring the stabilization of the quickly crystallized aragonite [98].
In these cases, aragonite precipitation first occurs in veins and fractures. In later stages, sustained precipitation of aragonite or dolomite (depending on the Mg2+/Ca2+ fluid composition) can produce a reduction of the rock permeability because of the total or partial microsealing of flow in the fractures.
In the Baza Basin, the precipitation of gypsum in the inner part of the lacustrine system can produce residual brines with high Mg2+/Ca2+ ratio circulating through the porous sediments. Overpressure produced during seismic cycle can promote fracture dissolution in the sediments closer to the active fault splays and later sealing by precipitation of aragonite and/or dolomite from the Mg-rich hypersaline brine circulating through pore and microfractures, depending on the Mg2+/Ca2+ of the solution, during the aseismic behavior of the fault.
On the other hand, in rocks from the damage zone of the Tablate A locality in the Granada Basin, the lowest permeability values are found in samples with high density of pressure solution seams (stylolite) filled with smectite. We, therefore, propose that stylolite mineralogy can affect permeability and mechanical properties of the rocks in the damage zone of the fault. SEM observations showed that clay minerals (smectite and illite/muscovite) are predominant forming the pressure solution seams. The progressive calcite dissolution during stylolite seams formation produced the accumulation of detrital micas occurring within pressure solution seams. The origin of part of the smectite filling the stylolite seams can also be associated to the starting grainstones, because the occurrence of smectite in these rocks can be observed around calcite grains or inside the skeletal bioclasts. However, some smectite crystals could have been formed as well by precipitation from late fluids that were circulating along pressure solution surfaces during the deformation process or later. In fault zones, the permeability and fluid flow through the damage area can be decreased by the presence of clay-mineral layers that act as barriers (e.g., [3,99,100]). In the Tablate B samples, we propose that pressure solution seams formed by interconnected clay-rich levels decrease the permeability of the original carbonate lithofacies, sealing fluid flow thorough the damage zone and favoring occasional seismic fluid overpressure events. On the other hand, the presence of smectite in the stylolite seams would favor later aseismic frictional sliding behavior of the fault and damage zone due to its extremely low friction coefficient (e.g., [42]).
6. Conclusions
The following conclusions could be made out of this study:
- The changes in the permeability and Young’s modulus are consistent with the changes in the fracture frequency. This means that for open fractures, permeability increases, while the Young’s modulus decreases with increasing the number of fractures close to the fault. However, there are some exceptions, for example, where there is a clay smear along the fault or if the strain is distributed along several fault splays, in which the fractures are less or absent close to the fault.
- The precipitation of dolomite and aragonite along the fractures in the damage zone of Baza Fault during its aseismic behavior, controlled by the Mg-rich nature of the fluids circulating by fractures and veins, has reduced permeability and increased Young’s modulus of the sediments.
- The presence of abundant clay in calcite rich sediments around faults associated to the Padul Fault resulted in the formation of stylolites that act as barrier to fluid flow.
- Cataclastic and disaggregation bands involving clay smear are observed in the sediments rich in detrital silicates in the damage zone of both Baza and Padul faults, respectively. These bands are expected to reduce permeability in these sediments and favor later aseismic frictional sliding behavior of the fault and damage zone.
Author Contributions
A.T., F.J.G.-T., T.S.S.E., J.J.-M., and R.J.-E. conducted field observations and sampling. A.T. is responsible for the permeability and Young’s modulus analysis and interpretation. T.E. is responsible for orientation measurements and stereoplots. J.J.-M., I.A., R.J.-E. performed SEM microscopic observations and interpreted the X-ray diffractograms. All the authors discussed the analytical results and prepared the manuscript. All authors have read and agreed to the published version of the manuscript.
Funding
The first author is grateful to the sponsors of the project “Quantification of fault-related leakage risk” under project number 294719. She also acknowledges the University of Oslo equality program for the qualification scholarship (kvalifiseringsstipend). This work has been financed by the Spanish research projects PGC2018-094573-B-I00 and TASCUB (RTI2018-100737-B-I00) from the MCIU-AEI-FEDER, and the research group RNM-325 of the Junta de Andalucía.
Acknowledgments
We would like to acknowledge to three anonymous reviewers for their suggestions and comments that helped to improve the manuscript.
Conflicts of Interest
The authors declare no conflict of interest. The funders had no role in the design of the study; in the collection, analyses, or interpretation of data; in the writing of the manuscript, or in the decision to publish the results.
References
- Gabrielsen, R.H.; Færseth, R.B.; Jensen, L.N.; Kalheim, J.E.; Riis, F. Structural elements of the Norwegian continental shelf. Part I: The Barents Sea Region. NPD Bull. 1990, 6. [Google Scholar]
- Fisher, Q.; Knipe, R. The permeability of faults within siliciclastic petroleum reservoirs of the North Sea and Norwegian Continental Shelf. Mar. Pet. Geol. 2001, 18, 1063–1081. [Google Scholar] [CrossRef]
- Faulkner, D.; Jackson, C.; Lunn, R.J.; Schlische, R.; Shipton, Z.K.; Wibberley, C.; Withjack, M. A review of recent developments concerning the structure, mechanics and fluid flow properties of fault zones. J. Struct. Geol. 2010, 32, 1557–1575. [Google Scholar] [CrossRef]
- Cappa, F.; Rutqvist, J. Impact of CO2 geological sequestration on the nucleation of earthquakes. Geophys. Res. Lett. 2011, 38. [Google Scholar] [CrossRef]
- Torabi, A.; Fossen, H.; Braathen, A. Insight into petrophysical properties of deformed sandstone reservoirs. AAPG Bull. 2013, 97, 619–637. [Google Scholar] [CrossRef]
- Rohmer, J.; Nguyen, K.; Torabi, A. Off-fault shear failure potential enhanced by high stiff/low permeable damage zone during fluid injection in porous reservoirs. Geophys. J. Int. 2015, 202, 1566–1580. [Google Scholar] [CrossRef]
- Jimenez-Millan, J.; Abad, I.; Hernández-Puentes, P.; Jiménez-Espinosa, R. Influence of phyllosilicates and fluid–rock interaction on the deformation style and mechanical behaviour of quartz-rich rocks in the Carboneras and Palomares fault areas (SE Spain). Clay Min. 2015, 50, 619–638. [Google Scholar] [CrossRef]
- Caine, J.S.; Evans, J.; Forster, C.B. Fault zone architecture and permeability structure. Geology 1996, 24, 1025. [Google Scholar] [CrossRef]
- Childs, C.; Nicol, A.; Walsh, J.; Watterson, J. Growth of vertically segmented normal faults. J. Struct. Geol. 1996, 18, 1389–1397. [Google Scholar] [CrossRef]
- Wibberley, C.A.J.; Yielding, G.; Di Toro, G. Recent advances in the understanding of fault zone internal structure: A review. Geol. Soc. Lond. Spec. Publ. 2008, 299, 5–33. [Google Scholar] [CrossRef]
- Bastesen, E.; Braathen, A.; Nøttveit, H.; Gabrielsen, R.H.; Skar, T. Extensional fault cores in micritic carbonate—Case studies from the Gulf of Corinth, Greece. J. Struct. Geol. 2009, 31, 403–420. [Google Scholar] [CrossRef]
- Braathen, A.; Tveranger, J.; Fossen, H.; Skar, T.; Cardozo, N.; Semshaug, S.E.; Bastesen, E.; Sverdrup, E. Fault facies and its application to sandstone reservoirs. AAPG Bull. 2009, 93, 891–917. [Google Scholar] [CrossRef]
- Torabi, A.; Johannessen, M.U.; Ellingsen, T.S.S. Fault Core Thickness: Insights from Siliciclastic and Carbonate Rocks. Geofluids 2019, 2019, 1–24. [Google Scholar] [CrossRef]
- Billi, A.; Salvini, F.; Storti, F. The damage zone-fault core transition in carbonate rocks: Implications for fault growth, structure and permeability. J. Struct. Geol. 2003, 25, 1779–1794. [Google Scholar] [CrossRef]
- Berg, S.S.; Skar, T. Controls on damage zone asymmetry of a normal fault zone: Outcrop analyses of a segment of the Moab fault, SE Utah. J. Struct. Geol. 2005, 27, 1803–1822. [Google Scholar] [CrossRef]
- Torabi, A.; Berg, S.S. Scaling of fault attributes: A review. Mar. Pet. Geol. 2011, 28, 1444–1460. [Google Scholar] [CrossRef]
- Torabi, A.; Ellingsen, T.S.S.; Johannessen, M.U.; Alaei, B.; Rotevatn, A.; Chiarella, D. Fault zone architecture and its scaling laws: Where does the damage zone start and stop? Geol. Soc. Lond. Spec. Publ. 2019, 496. SP496-2018-151. [Google Scholar] [CrossRef]
- Alfaro, P.; Gibert, L.; Moretti, M.; De Galdeano, C.S.; García, P.A.; Galindo-Zaldivar, J.; López-Garrido, Á.C. The significance of giant seismites in the Plio-Pleistocene Baza palaeo-lake (S Spain). Terra Nova 2010, 22, 172–179. [Google Scholar] [CrossRef]
- Shanmugam, G. Global case studies of soft-sediment deformation structures (SSDS): Definitions, classifications, advances, origins, and problems. J. Palaeogeogr. 2017, 6, 251–320. [Google Scholar] [CrossRef]
- Mittempergher, S.; Cerchiari, A.; Remitti, F.; Festa, A. From soft sediment deformation to fluid assisted faulting in the shallow part of a subduction megathrust analogue: The Sestola Vidiciatico tectonic Unit (Northern Apennines, Italy). Geol. Mag. 2017, 155, 438–450. [Google Scholar] [CrossRef]
- Wu, G.; Xie, E.; Zhang, Y.; Qing, H.; Luo, X.; Sun, C. Structural Diagenesis in Carbonate Rocks as Identified in Fault Damage Zones in the Northern Tarim Basin, NW China. Minerals 2019, 9, 360. [Google Scholar] [CrossRef]
- Abad, I.; Jiménez-Millán, J.; Sánchez-Roa, C.; Nieto, F.; Velilla, N. Neo-crystallization of clay minerals in the Alhama de Murcia Fault (SE Spain): Implications for fault mechanics. Clay Min. 2019, 54, 1–13. [Google Scholar] [CrossRef]
- Gratier, J.P.; Gamond, J.F. Transition between seismic and aseismic deformation in the upper crust. Geol. Soc. Lond. Spec. Publ. 1990, 54, 461–473. [Google Scholar] [CrossRef]
- Gratier, J.-P.; Renard, F.; Labaume, P. How pressure solution creep and fracturing processes interact in the upper crust to make it behave in both a brittle and viscous manner. J. Struct. Geol. 1999, 21, 1189–1197. [Google Scholar] [CrossRef]
- Gratier, J.-P.; Thouvenot, F.; Jenatton, L.; Tourette, A.; Doan, M.-L.; Renard, F. Geological control of the partitioning between seismic and aseismic sliding behaviours in active faults: Evidence from the Western Alps, France. Tectonophysics 2013, 600, 226–242. [Google Scholar] [CrossRef]
- Gratier, J.-P.; Renard, F.; Vial, B. Postseismic pressure solution creep: Evidence and time-dependent change from dynamic indenting experiments. J. Geophys. Res. Solid Earth 2014, 119, 2764–2779. [Google Scholar] [CrossRef]
- Gratier, J.-P.; Dysthe, D.K.; Renard, F. The Role of Pressure Solution Creep in the Ductility of the Earth’s Upper Crust. Adv. Geophys. 2013, 54, 47–179. [Google Scholar] [CrossRef]
- Tesei, T.; Collettini, C.; Viti, C.; Barchi, M.R. Fault architecture and deformation mechanisms in exhumed analogues of seismogenic carbonate-bearing thrusts. J. Struct. Geol. 2013, 55, 167–181. [Google Scholar] [CrossRef]
- Nüchter, J.-A.; Stöckhert, B. Vein quartz microfabrics indicating progressive evolution of fractures into cavities during postseismic creep in the middle crust. J. Struct. Geol. 2007, 29, 1445–1462. [Google Scholar] [CrossRef]
- Nüchter, J.-A.; Stöckhert, B. Coupled stress and pore fluid pressure changes in the middle crust: Vein record of coseismic loading and postseismic stress relaxation. Tectonics 2008, 27, TC1007. [Google Scholar] [CrossRef]
- Durney, D.W.; Ramsay, J.G. Incremental strains measured by syntectonic crystal growth. In Gravity and Tectonics; de Jong, K.A., Scholten, R., Eds.; Wiley: New York, NY, USA, 1973; pp. 67–96. [Google Scholar]
- Hilgers, C.; Dilg-Gruschinski, K.; Urai, J.L. Microstructural evolution of syntaxial veins formed by advective flow. Geology 2004, 32, 261. [Google Scholar] [CrossRef]
- Oliver, N.H.S.; Bons, P.D. Mechanisms of fluid flow and fluid-rock interaction in fossil metamorphic hydrothermal systems inferred from vein-wallrock patterns, geometry and microstructure. Geofluids 2001, 1, 137–162. [Google Scholar] [CrossRef]
- Graham, B.; Antonellini, M.; Aydin, A. Formation and growth of normal faults in carbonates within a compressive environment. Geology 2003, 31, 11. [Google Scholar] [CrossRef]
- Storti, F.; Salvini, F.T. The evolution of a model trap in the central Apennines, Italy: Fracture patterns, fault reactivation and development of cataclastic rocks in carbonates at the Narni anticline. J. Pet. Geol. 2001, 24, 171–190. [Google Scholar] [CrossRef]
- Tavani, S.; Storti, F.; Lacombe, O.; Corradetti, A.; Muñoz, J.; Mazzoli, S. A review of deformation pattern templates in foreland basin systems and fold-and-thrust belts: Implications for the state of stress in the frontal regions of thrust wedges. Earth-Sci. Rev. 2015, 141, 82–104. [Google Scholar] [CrossRef]
- Tavani, S.; Storti, F.; Salvini, F.; Toscano, C. Stratigraphic versus structural control on the deformation pattern associated with the evolution of the Mt. Catria anticline, Italy. J. Struct. Geol. 2008, 30, 664–681. [Google Scholar] [CrossRef]
- Heap, M.; Baud, P.; Reuschlé, T.; Meredith, P.G. Stylolites in limestones: Barriers to fluid flow? Geology 2014, 42, 51–54. [Google Scholar] [CrossRef]
- Fagereng, A.; Remitti, F.; Sibson, R.H. Shear veins observed within anisotropic fabric at high angles to the maximum compressive stress. Nat. Geosci. 2010, 3, 482–485. [Google Scholar] [CrossRef]
- Petracchini, L.; Antonellini, M.; Billi, A.; Scrocca, D.; Trippetta, F.; Mollo, S. Pressure solution inhibition in a limestone–chert composite multilayer: Implications for the seismic cycle and fluid flow. Tectonophysics 2015, 646, 96–105. [Google Scholar] [CrossRef]
- Petracchini, L.; Antonellini, M.; Billi, A.; Scrocca, D. Fault development through fractured pelagic carbonates of the Cingoli anticline, Italy: Possible analog for subsurface fluid-conductive fractures. J. Struct. Geol. 2012, 45, 21–37. [Google Scholar] [CrossRef]
- Viti, C.; Collettini, C.; Tesei, T. Pressure solution seams in carbonatic fault rocks: Mineralogy, micro/nanostructures and deformation mechanism. Contrib. Miner. Pet. 2014, 167, 970. [Google Scholar] [CrossRef]
- Sanz de Galdeano, C.; Peláez, J.A. Fallas activas en la Cordillera Bética. In Una Aproximación a Partir de la Información Tectónica y Sísmica; Editorial Universidad de Granada: Granada, Spain, 2011; 287p. [Google Scholar]
- De Galdeano, C.S.; García, P.A.; Peláez, J.; Alfaro, P.; Azañón, J.; Galindo-Zaldivar, J.; Casado, C.L.; López-Garrido, A.; Rodríguez-Fernández, J.; Ruano, P. Main active faults in the Granada and Guadix-Baza Basins (Betic Cordillera). J. Iber. Geol. 2012, 38, 209–223. [Google Scholar] [CrossRef]
- Muñoz, D.; Udías, A. Three large historical earthquakes in Southern Spain. In Seismicity, Seismotectonicsand Seismic Risk of the Ibero-Maghrebian Region; Mézcua, J., Udías, A., Eds.; Publ. Inst. Geogr. Nac.: Madrid, Spain, 1991; Volume 8, pp. 175–182. [Google Scholar]
- Martínez-Solares, J.M.; Mezcua, J. Catálogo sísmico de la Península Ibérica (880 AC–1900). In Monografía; Instituto Geográfico Nacional: Madrid, Spain, 2003; Volume 18, pp. 1–254. [Google Scholar]
- Galindo-Zaldivar, J.; Lodeiro, F.G.; Jabaloy, A. Stress and palaeostress in the Betic-Rif cordilleras (Miocene to the present). Tectonophysics 1993, 227, 105–126. [Google Scholar] [CrossRef]
- Herraiz, M.; De Vicente, G.; Simon, J.L.; Vadillo, O.; Cicuéndez, J.I.; Cabanas, L.; Lucini, M.; Lindo-Ñaupari, R.; González-Casado, J.M.; Pascua, M.; et al. The recent (upper Miocene to Quaternary) and present tectonic stress distributions in the Iberian Peninsula. Tectonics 2000, 19, 762–786. [Google Scholar] [CrossRef]
- Stich, D.; Serpelloni, E.; Mancilla, F.D.L.; Morales, J. Kinematics of the Iberia–Maghreb plate contact from seismic moment tensors and GPS observations. Tectonophysics 2006, 426, 295–317. [Google Scholar] [CrossRef]
- De Vicente, G.; Cloetingh, S.; Olaiz, A.; Stich, D.; Vegas, R.; Muñoz-Martin, A.; Galindo-Zaldivar, J.; Fernández-Lozano, J. Inversion of moment tensor focal mechanisms for active stresses around the microcontinent Iberia: Tectonic implications. Tectonics 2008, 27, TC1009. [Google Scholar] [CrossRef]
- Martín, R.; Stich, D.; Morales, J.; Mancilla, F. Moment tensor solutions for the Iberian-Maghreb region during the IberArray deployment (2009–2013). Tectonophysics 2015, 663, 261–274. [Google Scholar] [CrossRef]
- Gil, A.J.; Rodríguez-Caderot, G.; Lacy, M.C.; Ruiz, A.M.; De Galdeano, C.S.; Alfaro, P. Establishment of a Non-Permanent GPS Network to Monitor the Recent NE-SW Deformation in the Granada Basin (Betic Cordillera, Southern Spain). Stud. Geophys. Geod. 2002, 46, 395–410. [Google Scholar] [CrossRef]
- Ruiz, A.M.; Ferhat, G.; Alfaro, P.; Sanz de Galdeano, C.; Lacy, M.C.; Rodríguez-Caderot, G.; Gil, A.J. Geodetic measurement of crustal deformation on NW-SE faults of the Betic Cordillera, Southern Spain, 1999–2001. J. Geodyn. 2003, 35, 259–272. [Google Scholar] [CrossRef]
- Rodríguez-Fernández, J.; De Galdeano, C.S. Late orogenic intramontane basin development: The Granada basin, Betics (southern Spain). Basin Res. 2006, 18, 85–102. [Google Scholar] [CrossRef]
- Alfaro, P.; Delgado, J.; De Galdeano, C.S.; Galindo-Zaldivar, J.; García, P.A.; Lopez-Garrido, A.C.; Casado, C.L.; Marín-Lechado, C.; Gil, A.J.; Borque, M.J. The Baza Fault: A major active extensional fault in the central Betic Cordillera (south Spain). Acta Diabetol. 2007, 97, 1353–1365. [Google Scholar] [CrossRef]
- Nocquet, J.-M. Present-day kinematics of the Mediterranean: A comprehensive overview of GPS results. Tectonophysics 2012, 579, 220–242. [Google Scholar] [CrossRef]
- García, P.A.; Alfaro, P.; De Galdeano, C.S.; Galindo-Zaldivar, J. Glacis geometry as a geomorphic marker of recent tectonics: The Guadix–Baza basin (South Spain). Geomorphology 2011, 125, 517–529. [Google Scholar] [CrossRef]
- Haberland, C.; Gibert, L.; Jurado, M.J.; Stiller, M.; Baumann-Wilke, M.; Scott, G.; Mertz, D.F. Architecture and tectono-stratigraphic evolution of the intramontane Baza Basin (Bétics, SE-Spain): Constraints from seismic imaging. Tectonophysics 2017, 709, 69–84. [Google Scholar] [CrossRef]
- Vera, J.A. Estudio estratigráfico de la depresión de Guadix–Baza. Bol. Geol. Min. 1970, 91, 429–462. [Google Scholar]
- Peña, J.A. La depresión de Guadix-Baza. Estudios Geológicos 1985, 41, 33–46. [Google Scholar] [CrossRef]
- Gibert, L.; Ortí, F.; Rosell, L. Plio-Pleistocene lacustrine evaporites of the Baza Basin (Betic Chain, SE Spain). Sediment. Geol. 2007, 200, 89–116. [Google Scholar] [CrossRef]
- García, P.A.; Alfaro, P.; Galindo-Zaldivar, J.; Gibert, L.; López-Garrido, A.; De Galdeano, C.S.; Ureña, M. Geomorphologic evidence of the active Baza Fault (Betic Cordillera, South Spain). Geomorphology 2008, 97, 374–391. [Google Scholar] [CrossRef]
- Castro, J.; Martin-Rojas, I.; Medina-Cascales, I.; García, P.A.; Alfaro, P.; Insua-Arévalo, J.M. Active faulting in the central Betic Cordillera (Spain): Palaeoseismological constraint of the surface-rupturing history of the Baza Fault (Central Betic Cordillera, Iberian Peninsula). Tectonophysics 2018, 736, 15–30. [Google Scholar] [CrossRef]
- De Galdeano, C.S.; Montilla, J.A.P.; Casado, C.L. Seismic potential of the main active faults in the Granada Basin (southern Spain). Pure Appl. Geophys. PAGEOPH 2003, 160, 1537–1556. [Google Scholar] [CrossRef]
- De Galdeano, C.S.; Alfaro, P. Tectonic significance of the present relief of the Betic Cordillera. Geomorphology 2004, 63, 175–190. [Google Scholar] [CrossRef]
- Lhénaff, R. Néotectonique quaternaire sur le bord occidental de la Sierra Nevada (province de Grenade, Espagne). Rev. Géogr. Phys. Géol. Dyn. 1965, 2, 205–207. [Google Scholar]
- Calvache, M.L.; Viseras, C.; Ferndéz, J. Controls on fan development—Evidence from fan morphometry and sedimentology; Sierra Nevada, SE Spain. Geomorphology 1997, 21, 69–84. [Google Scholar] [CrossRef]
- Santanach, P.; Sanz de Galdeano, C.; Bousquet, J. Neotectónica de las regiones mediterráneas de España (Cataluña y Cordilleras Béticas). Bol. Geol. Min. 1980, 91, 417–440. [Google Scholar]
- Domingo-García, M.; Fernández-Rubio, R.; López, J.D.; González, C. Aportación al conocimiento de la Neotectónica de la Depresión de Padul (Granada). Tecniterrae 1983, 53, 6–16. [Google Scholar]
- Delgado, J.; Alfaro, P.; Galindo-Zaldívar, J.; Jabaloy, A.; López-Garrido, A.C.; Sanz de Galdeano, C. Structure of the Padul-Nigüelas basin (S Spain) from H/V spectral ratios of ambient noise: Analysis of the applicability of the method to study coarse sediments. Pure Appl. Geophys. 2002, 159, 2733–2749. [Google Scholar] [CrossRef]
- Sanz de Galdeano, C. Controles de la fracturación en Tablate (Lecrín, Provincia de Granada, Cadena Bética). Estud. Geol. 2008, 64, 123–133. [Google Scholar]
- Agosta, F.; Ruano, P.; Rustichelli, A.; Tondi, E.; Galindo-Zaldivar, J.; De Galdeano, C.S. Inner structure and deformation mechanisms of normal faults in conglomerates and carbonate grainstones (Granada Basin, Betic Cordillera, Spain): Inferences on fault permeability. J. Struct. Geol. 2012, 45, 4–20. [Google Scholar] [CrossRef]
- Rustichelli, A. Mechanical Stratigraphy of Carbonate Rocks: Examples from the Maiella Mountain (Central Italy) and the Granada Basin (Southern Spain). Ph.D. Thesis, University of Camerino, Camerino, Italy, 2010. [Google Scholar]
- Rustichelli, A.; Agosta, F.; Tondi, E.; Galindo-Zaldivar, J.; Di Celma, C.; Spina, V. Fault growth as a key control on the sedimentary architecture and depositional environments of extensional basins: The case study of the Tablate area (Granada Basin, Spain). Ital. J. Geosci. 2013, 132, 422–442. [Google Scholar] [CrossRef]
- De Galdeano, C.S.; López-Garrido, A.C. Nature and impact of the Neotectonic deformation in the western Sierra Nevada (Spain). Geomorphology 1999, 30, 259–272. [Google Scholar] [CrossRef]
- Alikarami, R.; Torabi, A.; Kolyukhin, D.R.; Skurtveit, E. Geostatistical relationships between mechanical and petrophysical properties of deformed sandstone. Int. J. Rock Mech. Min. Sci. 2013, 63, 27–38. [Google Scholar] [CrossRef]
- Katz, O.; Reches, Z.; Roegiers, J.-C. Evaluation of mechanical rock properties using a Schmidt Hammer. Int. J. Rock Mech. Min. Sci. 2000, 37, 723–728. [Google Scholar] [CrossRef]
- Dinelli, E.; Tateo, F. Sheet silicates as effective carriers of heavy metals in the ophiolitic mine area of Vigonzano (northern Italy). Miner. Mag. 2001, 65, 121–132. [Google Scholar] [CrossRef]
- Vázquez, M.; Jiménez Millán, J. Suitability of the Betic Cordillera marly materials for the manufacture of pressed tile. Mat. Constr. 2009, 59, 97–112. [Google Scholar] [CrossRef]
- Whitney, D.L.; Evans, B.W. Abbreviations for names of rock-forming minerals. Am. Miner. 2009, 95, 185–187. [Google Scholar] [CrossRef]
- Torabi, A. Cataclastic bands in immature and poorly lithified sandstone, examples from Corsica, France. Tectonophysics 2014, 630, 91–102. [Google Scholar] [CrossRef]
- Rotevatn, A.; Thorsheim, E.; Bastesen, E.; Fossmark, H.S.; Torabi, A.; Sælen, G. Sequential growth of deformation bands in carbonate grainstones in the hangingwall of an active growth fault: Implications for deformation mechanisms in different tectonic regimes. J. Struct. Geol. 2016, 90, 27–47. [Google Scholar] [CrossRef]
- Jiménez-Millán, J.; Abad, I.; García-Tortosa, F.J.; Nieto, F. Diagénesis salina de arcillas en niveles lacustres plio-pleistocenos ricos en materia orgánica de la Cuenca de Guadix-Baza (Cordillera Bética). Macla 2019, 24, 35. [Google Scholar]
- Jiménez-Millán, J.; Abad, I.; García-Tortosa, F.J.; Nieto, F.; Jiménez-Espinosa, R. Clay saline diagenesis in lake Plio-Pleistocene sediments rich in organic matter from the Guadix-Baza Basin (Betic Cordillera, SE Spain). Appl. Clay Sci. 2020. under review. [Google Scholar]
- Tai, C.Y.; Chen, F.-B. Polymorphism of CaCO3, precipitated in a constant-composition environment. AIChE J. 1998, 44, 1790–1798. [Google Scholar] [CrossRef]
- Prasad, S.; Negendank, J.F.W.; Stein, M. Varve counting reveals high resolution radiocarbon reservoir age variations in palaeolake Lisan. J. Quat. Sci. 2009, 24, 690–696. [Google Scholar] [CrossRef]
- Baioumy, H.; Kayanne, H.; Tada, R. Record of Holocene aridification (6000–7000BP) in Egypt (NE Africa): Authigenic carbonate minerals from laminated sediments in Lake Qarun. Quat. Int. 2011, 245, 170–177. [Google Scholar] [CrossRef]
- Murphy, J.T.; Lowenstein, T.K.; Pietras, J.T. Preservation of primary lake signatures in alkaline earth carbonates of the Eocene Green River Wilkins Peak-Laney Member transition zone. Sediment. Geol. 2014, 314, 75–91. [Google Scholar] [CrossRef]
- Sondi, I.; Juracic, M. Whiting events and the formation of aragonite in Mediterranean Karstic Marine Lakes: New evidence on its biologically induced inorganic origin. Sedimentology 2010, 57, 85–95. [Google Scholar] [CrossRef]
- Xyla, A.G.; Koutsoukos, P.G. Quantitative analysis of calcium carbonate polymorphs by infrared spectroscopy. J. Chem. Soc. Faraday Trans. 1 Phys. Chem. Condens. Phases 1989, 85, 3165. [Google Scholar] [CrossRef]
- Irion, G.; Müller, G.; Förstner, U. Formation and diagenesis of inorganic Ca-Mg carbonates in the lacustrine environment. Naturwissenschaften 1972, 59, 158–164. [Google Scholar] [CrossRef]
- Alonso-Zarza, M.A. Carbonates in Continental Settings-Facies; Elsevier: Amsterdam, Netherlands, 2010. [Google Scholar]
- Ma, J.; Wu, C.; Wang, Y.; Wang, J.; Fang, Y.; Zhu, W.; Zhai, L.; Zhou, T. Paleoenvironmental reconstruction of a saline lake in the Tertiary: Evidence from aragonite laminae in the northern Tibet Plateau. Sediment. Geol. 2017, 353, 1–12. [Google Scholar] [CrossRef]
- Folk, R.L. The natural history of crystalline calcium carbonate: Effect of magnesium content and salinity. J. Sediment. Res. 1974, 44, 40–53. [Google Scholar] [CrossRef]
- Berner, R.A. The role of magnesium in the crystal growth of calcite and aragonite from seawater. Geochim. Cosmochim. Acta 1975, 39, 489–504. [Google Scholar] [CrossRef]
- Reeder, R.J. Crystal chemistry of the rhombohedral carbonates. Rev. Min. Geochem. 1983, 11, 1–47. [Google Scholar]
- Singurindy, O.; Berkowitz, B. Dedolomitization and flow in fractures. Geophys. Res. Lett. 2004, 31. [Google Scholar] [CrossRef]
- Reddy, M.M. Effect of magnesium ions on calcium carbonate nucleation and crystal growth in dilute aqueous solutions at 25 °C. In Studies in Diagenesis; Mumpton, F.A., Ed.; U.S. Geological Survey Bulletin: San Bernardino County, CA, USA, 1986; Volume 1578, pp. 169–182. [Google Scholar]
- Faulkner, D.J.; Rutter, E. Can the maintenance of overpressured fluids in large strike-slip fault zones explain their apparent weakness? Geology 2001, 29, 503–506. [Google Scholar] [CrossRef]
- Takahashi, M.; Mizoguchi, K.; Kitamura, K.; Masuda, K. Effects of clay content on the frictional strength and fluid transport property of faults. J. Geophys. Res. Space Phys. 2007, 112, 08206. [Google Scholar] [CrossRef]
© 2020 by the authors. Licensee MDPI, Basel, Switzerland. This article is an open access article distributed under the terms and conditions of the Creative Commons Attribution (CC BY) license (http://creativecommons.org/licenses/by/4.0/).