Article

Microstructural Evolution of Amphibole Peridotites in Åheim, Norway, and the Implications for Seismic Anisotropy in the Mantle Wedge

1
Tectonophysics Laboratory, School of Earth and Environmental Sciences, Seoul National University, Seoul 08826, Korea
2
The Njord Centre, Department of Geoscience, University of Oslo, Blindern, N-0316 Oslo, Norway
*
Author to whom correspondence should be addressed.
Minerals 2020, 10(4), 345; https://doi.org/10.3390/min10040345
Submission received: 26 March 2020 / Revised: 9 April 2020 / Accepted: 10 April 2020 / Published: 12 April 2020

Abstract

:
The microstructure of amphibole peridotites from Åheim, Norway were analyzed to understand the evolution of the lattice-preferred orientation (LPO) of olivine throughout the Scandian Orogeny and its implication for the seismic anisotropy of the subduction zone. The Åheim peridotites had a porphyroclastic texture and some samples contained an abundant amount of hydrous minerals such as tremolite. Detailed microstructural analysis on the Åheim peridotites revealed multiple stages of deformation. The coarse grains showed an A-type LPO of olivine, which can be interpreted as the initial stage of deformation. The spinel-bearing samples showed a mixture of B-type and C-type LPOs of olivine, which is considered to represent the deformation under water-rich conditions. The recrystallized fine-grained olivine displays a B-type LPO, which can be interpreted as the final stage of deformation. Microstructures and water content of olivine indicate that the dominant deformation mechanism of olivine showing a B-type LPO is a dislocation creep under water-rich condition. The observation of the B-type LPO of olivine is important for an interpretation of trench-parallel seismic anisotropy in the mantle wedge. The calculated seismic anisotropy of the tremolite showed that tremolite can contribute to the trench-parallel seismic anisotropy in the mantle wedge.

1. Introduction

The deformation behavior of olivine is key to understanding the mantle flow and seismic anisotropy in the upper mantle [1,2,3,4,5]. Many experimental studies concerning the deformation of olivine have reported that it has various types of lattice-preferred orientations (LPOs), depending on the physicochemical conditions during its deformation, and that the different LPOs of olivine may influence the seismic anisotropy of the upper mantle [3,6,7,8,9,10,11]. For example, the fabric transition of olivine in the mantle wedge from an A-type to a B-type LPO of olivine is proposed as a possible mechanism for the change in the shear wave splitting pattern observed in the subduction zone [3,7,8,12,13,14]. Many studies have proposed a hypothesis for this change in fabric: a deformation under water-rich conditions [7,8], a deformation under high pressure [10,15,16], an enhancement of grain boundary sliding [17,18,19], a diffusional creep [20], or the presence of partial melt [21,22]. There have been many reports of such fabric transitions recorded in naturally deformed peridotites from various localities: The Bergen Arc, Norway [23], the Ronda massif, Spain [19], Lien, Almklovdalen, Norway [24], the Navajo volcanic field, USA [25], and the Calatrava volcanic field, Spain [26]. However, the exact mechanism for the fabric transition of olivine in the mantle wedge is still under debate.
In subduction zones, various hydrous minerals such as serpentines, chlorites, and amphiboles can be produced via chemical reactions that take place in the presence of fluid released from the subducting slab [27,28,29,30]. Hydrous minerals in and near the subducting slab are elastically highly anisotropic [31,32,33,34], and thus very important for understanding seismic anisotropy at a subduction zone. Many studies have suggested that the trench-parallel shear wave anisotropy observed at various subduction zones [35,36,37] can be induced by the LPO of hydrous minerals such as serpentine [38,39,40], chlorite [24,33,41], and amphibole [41,42,43,44]. Amphibole can be present in the mantle wedge above the subducting slab as a product of the hydration reaction of pyroxene [45,46]. However, studies on the influence of the amphibole fabric on seismic anisotropy in the mantle wedge is still very limited.
In this study, a detailed microstructural analysis of several samples of amphibole peridotite from Åheim, Norway, was performed to understand the evolution of its microstructures during the orogenic event and the subsequent exhumation processes. The LPO of the olivine in the Åheim amphibole peridotites was analyzed to study the mechanism underlying the fabric transition of the olivine in nature and its implication for seismic anisotropy at a subduction zone. The water content was measured using Fourier transform infrared (FTIR) analysis, and the dislocation microstructures in the olivine were observed to identify a possible mechanism leading to its deformation. In addition, the LPO of the amphibole was analyzed to estimate the influence of amphibole fabric on seismic anisotropy in a subduction zone.

2. Geological Setting and Sample Description

The Western Gneiss Region (WGR) in Norway is located between Bergen and Trondheim, with 25,000 km2 of dominantly gneissic rocks representing the crustal root zone of the Caledonian mountain belt [47,48]. The Caledonian mountain belt was originated during the collision between Laurentia and Baltica [49,50,51]. The Scandian Orogenic event resulted in a series of high-pressure to ultra-high pressure (HP to UHP) metamorphism events in the WGR. Many orogenic peridotite bodies were emplaced into the crustal rocks of the WGR, which experienced multiple stages of metamorphism and deformation over the course of the Scandian Orogeny and the subsequent uplift [52,53,54,55,56,57,58,59]. During exhumation, many peridotite bodies were infiltrated by fluid and retrograded to amphibole peridotite or chlorite peridotite.
The WGR is predominantly composed of orthogneisses and paragneisses with abundant emplaced peridotite or eclogite bodies (Figure 1). The Proterozoic protolith, dated to 1654 ± 1 Ma, underwent UHP metamorphism and subsequent retrogression associated with the Scandian Orogenic event [60,61]. A continent–continent collision between Baltica and Laurentia from 425–400 Ma resulted in HP–UHP metamorphism at P = 1.8–3.6 GPa and T = 600–800 °C [52,59,62]. Following this collision (400–380 Ma), the WGR was uplifted to a depth of 15–20 km, where it underwent amphibolite facies retrogression at P = 0.5–1.5 GPa and T = 650–850 °C [48,57,63]. The orogenic peridotite bodies within the Nordfjord–Stadlandet UHP domains include garnet lherzolite and dunite trapped during the uplift stage. During the uplifting, these peridotites experienced multiple stages of deformation and associated recrystallization in the granulite facies (ol + opx + cpx + sp) and amphibolite facies (ol + opx + amp + chl) conditions [53,54,55,56,64]. The amphibole peridotite samples (426, 429, 443, 445, 446, 447, and 448) were collected from Gusdal quarry in Åheim, Western Norway (Figure 1) for a detailed study of their microstructures.

3. Materials and Methods

3.1. The Chemical Composition of Minerals

The chemical compositions of the representative minerals were analyzed using a Shimadzu 1600 electron probe micro-analyzer (EPMA), with an accelerating voltage of 15 kV and a beam size of 1 μm, at the Korea Basic Science Institute in Jeonju. The chemical composition of the minerals was obtained from their cores. No chemical zoning was detected within the samples. The temperature of the spinel peridotite was estimated using an olivine–spinel geothermometer [65] and Al in an orthopyroxene geothermometer [66]. As there was an absence of garnet among the samples, and given the wide range in which amphibole peridotite is stable [27,33], it was difficult to precisely determine the pressure of these samples. However, it can be expected to have been lower than 1.6 GPa, the point at which the spinel–garnet peridotite boundary occurs at 800 °C [67].

3.2. Measurement of LPO and Seismic Anisotropy

The foliation of the samples was determined from the compositional layering of the olivine, amphibole, and chlorite. Lineation was determined by examining the shape-preferred orientation of the elongated olivines in the foliation plane using the projection-function method [68]. To study the LPO of the olivine and tremolite, a thin section was prepared in the x–z plane (x: lineation, z: normal to foliation). An electron backscattered diffraction (EBSD) detector attached to a scanning electron microscope (SEM) (JEOL JSM-6380) housed at the School of Earth and Environmental Sciences (SEES) at Seoul National University (SNU) was used to determine the LPO of each mineral. An HKL system with Channel 5 software was used for the EBSD analysis. The accelerating voltage and working distance in the SEM observation were 20 kV and 15 mm, respectively. To ensure an accurate solution, each EBSD pattern of the individual grains was analyzed manually. The fabric strength of the LPO of the olivine and tremolite was calculated using the M-index [69] and J-index [70].
To estimate the impact that the multiple stages of deformation and presence of hydrous minerals had on the seismic anisotropy, the seismic velocity and anisotropy of the Åheim amphibole peridotites were calculated using the software ANIS2k and VpG [71], on the basis of the LPO data. The ambient condition elastic constants for a single crystal of olivine [72], tremolite [73], and antigorite [74] were used for the crystallographic data. The thickness of the anisotropic layer (TA) for a given delay time was estimated from the shear wave splitting via the following equation [75]: T A = ( 100 × δ × < V S > ) / AV S , where δ is the delay time of the S-wave, <VS> is the average velocity of the fast and slow shear waves (VS1 and VS2), and AVS is the seismic anisotropy of the S-wave expressed as a percentage.

3.3. Measurement of Water Content in Olivine

The water content of the olivine was measured using FTIR spectroscopy. The FTIR specimens were thinned to a thickness of 100 μm and polished on both sides. Each sample was then heated at a temperature of T = 120 °C for 24 h to eliminate water from the surface and the grain boundary. The FTIR analysis was performed using a Nicolet 6700 FTIR spectrometer with a continuum IR microscope housed at the Tectonophysics laboratory in the SEES at SNU. Unpolarized transmitted light with an aperture size of 50 μm × 50 μm was used to obtain the FTIR spectra. For each sample, FTIR spectra were collected from 10 different olivine grains without any cracks or inclusions, to avoid interference, and averaged. To identify the constituents of the inclusions in the olivine, additional FTIR analyses were performed on the olivines with inclusions. A series of 128 scans were averaged for each spectrum to improve the quality of the spectra at a resolution of 4 cm−1. The water content of the olivine was calculated at the wave numbers in the range 3400–3750 cm−1 using the calibration method described by Paterson [76].

3.4. Dislocation Microstructure

An oxygen decoration technique [77,78,79] was applied to allow observation of the dislocation microstructures in the olivine. The peridotite samples were polished on a single side and were then heated in the oven for 1 h at T = 800 °C. Each sample was polished with colloidal silica after oxidation in order to remove the thin layer of oxide from its surface. The polished samples were then coated with carbon to prevent charging during the SEM observation (JEOL JSM-6380). To observe the dislocation microstructures in the olivine, backscattered electron images (BEI) were taken with an accelerating voltage of 15 kV and at a working distance of 10 mm [77].

4. Results

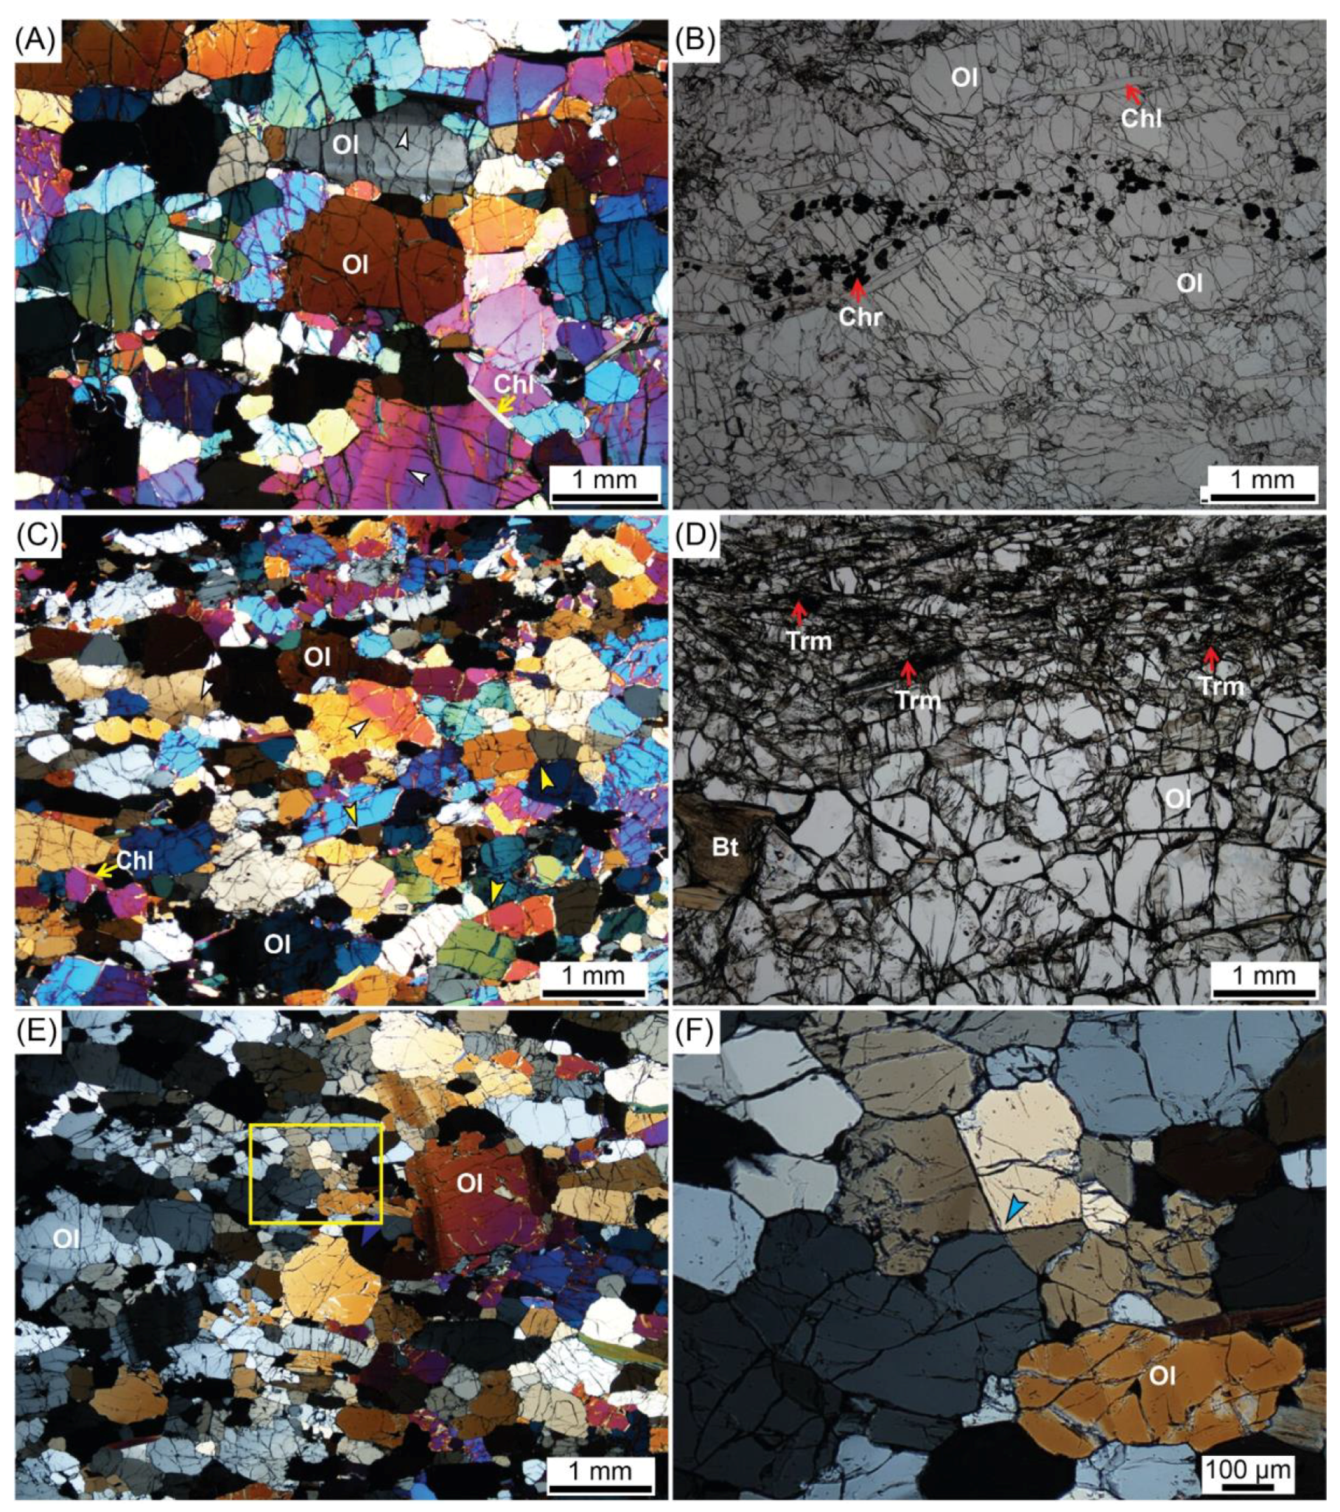
4.1. Microstructures

The majority of the samples had a porphyroclastic texture and contained primarily olivine (>90%) with minor amounts of amphibole, orthopyroxene, chlorite, biotite, and chromite (Figure 2A–D). However, some samples showed different mineral assemblages and modal compositions. For example, some samples (429 and 445) included layers of Cr-rich spinel (Figure 2B), and one sample (443) included a tremolite-rich layer with an approximately 50% modal composition of tremolite (Figure 2D).
The average grain size of each sample was measured using the linear intercept method [80] and the range was found to be 0.32–1.2 mm (Table 1) with an average of 0.51 mm. The average size of the grains in sample 448, with its clear porphyroclastic texture, was 0.35 mm for the recrystallized fine grains and 1.2 mm for the coarse grains including the porphyroclasts (Table 1). The olivine porphyroclasts had curvy grain boundaries, indicating a recrystallization process that occurred via grain boundary migration (Figure 2A,C). Straight grain boundaries and triple junctions were often observed in the recrystallized small grains, which indicated that annealing occurred during exhumation (Figure 2C). A few four-grain junctions were also observed in the area of the recrystallized olivine grains (Figure 2E,F). Undulose extinction and subgrain boundaries were frequently observed in all samples (Figure 2A,C). Microstructures such as porphyroclastic texture, undulose extinction, subgrain boundaries, and abundant inclusions or fractures coincided with those of the grey peridotite described by Kostenko et al. [64].

4.2. Chemical Compositions of Minerals

The representative chemical compositions of the minerals obtained via the EPMA analysis are presented in Table 2. A high content of magnesium was found in the olivine and orthopyroxene, with an Mg# of 94 for the olivine and 93–95 for the orthopyroxene. No significant chemical difference was found between the coarse porphyroclasts and fine recrystallized grains. Spinel had a high concentration of chromium (Cr2O3 = 58.98 wt. %; Table 2) and can be classified as chromite. Amphiboles can be classified as tremolite with a very low aluminum concentration (Al2O3 = 1.1 wt. %; Table 2). The temperature of the Åheim amphibole peridotite was estimated at 586 ± 50 °C using the Ol–Sp geothermometer [65] and at 640 ± 50 °C using the Al in the orthopyroxene geothermometer [66].

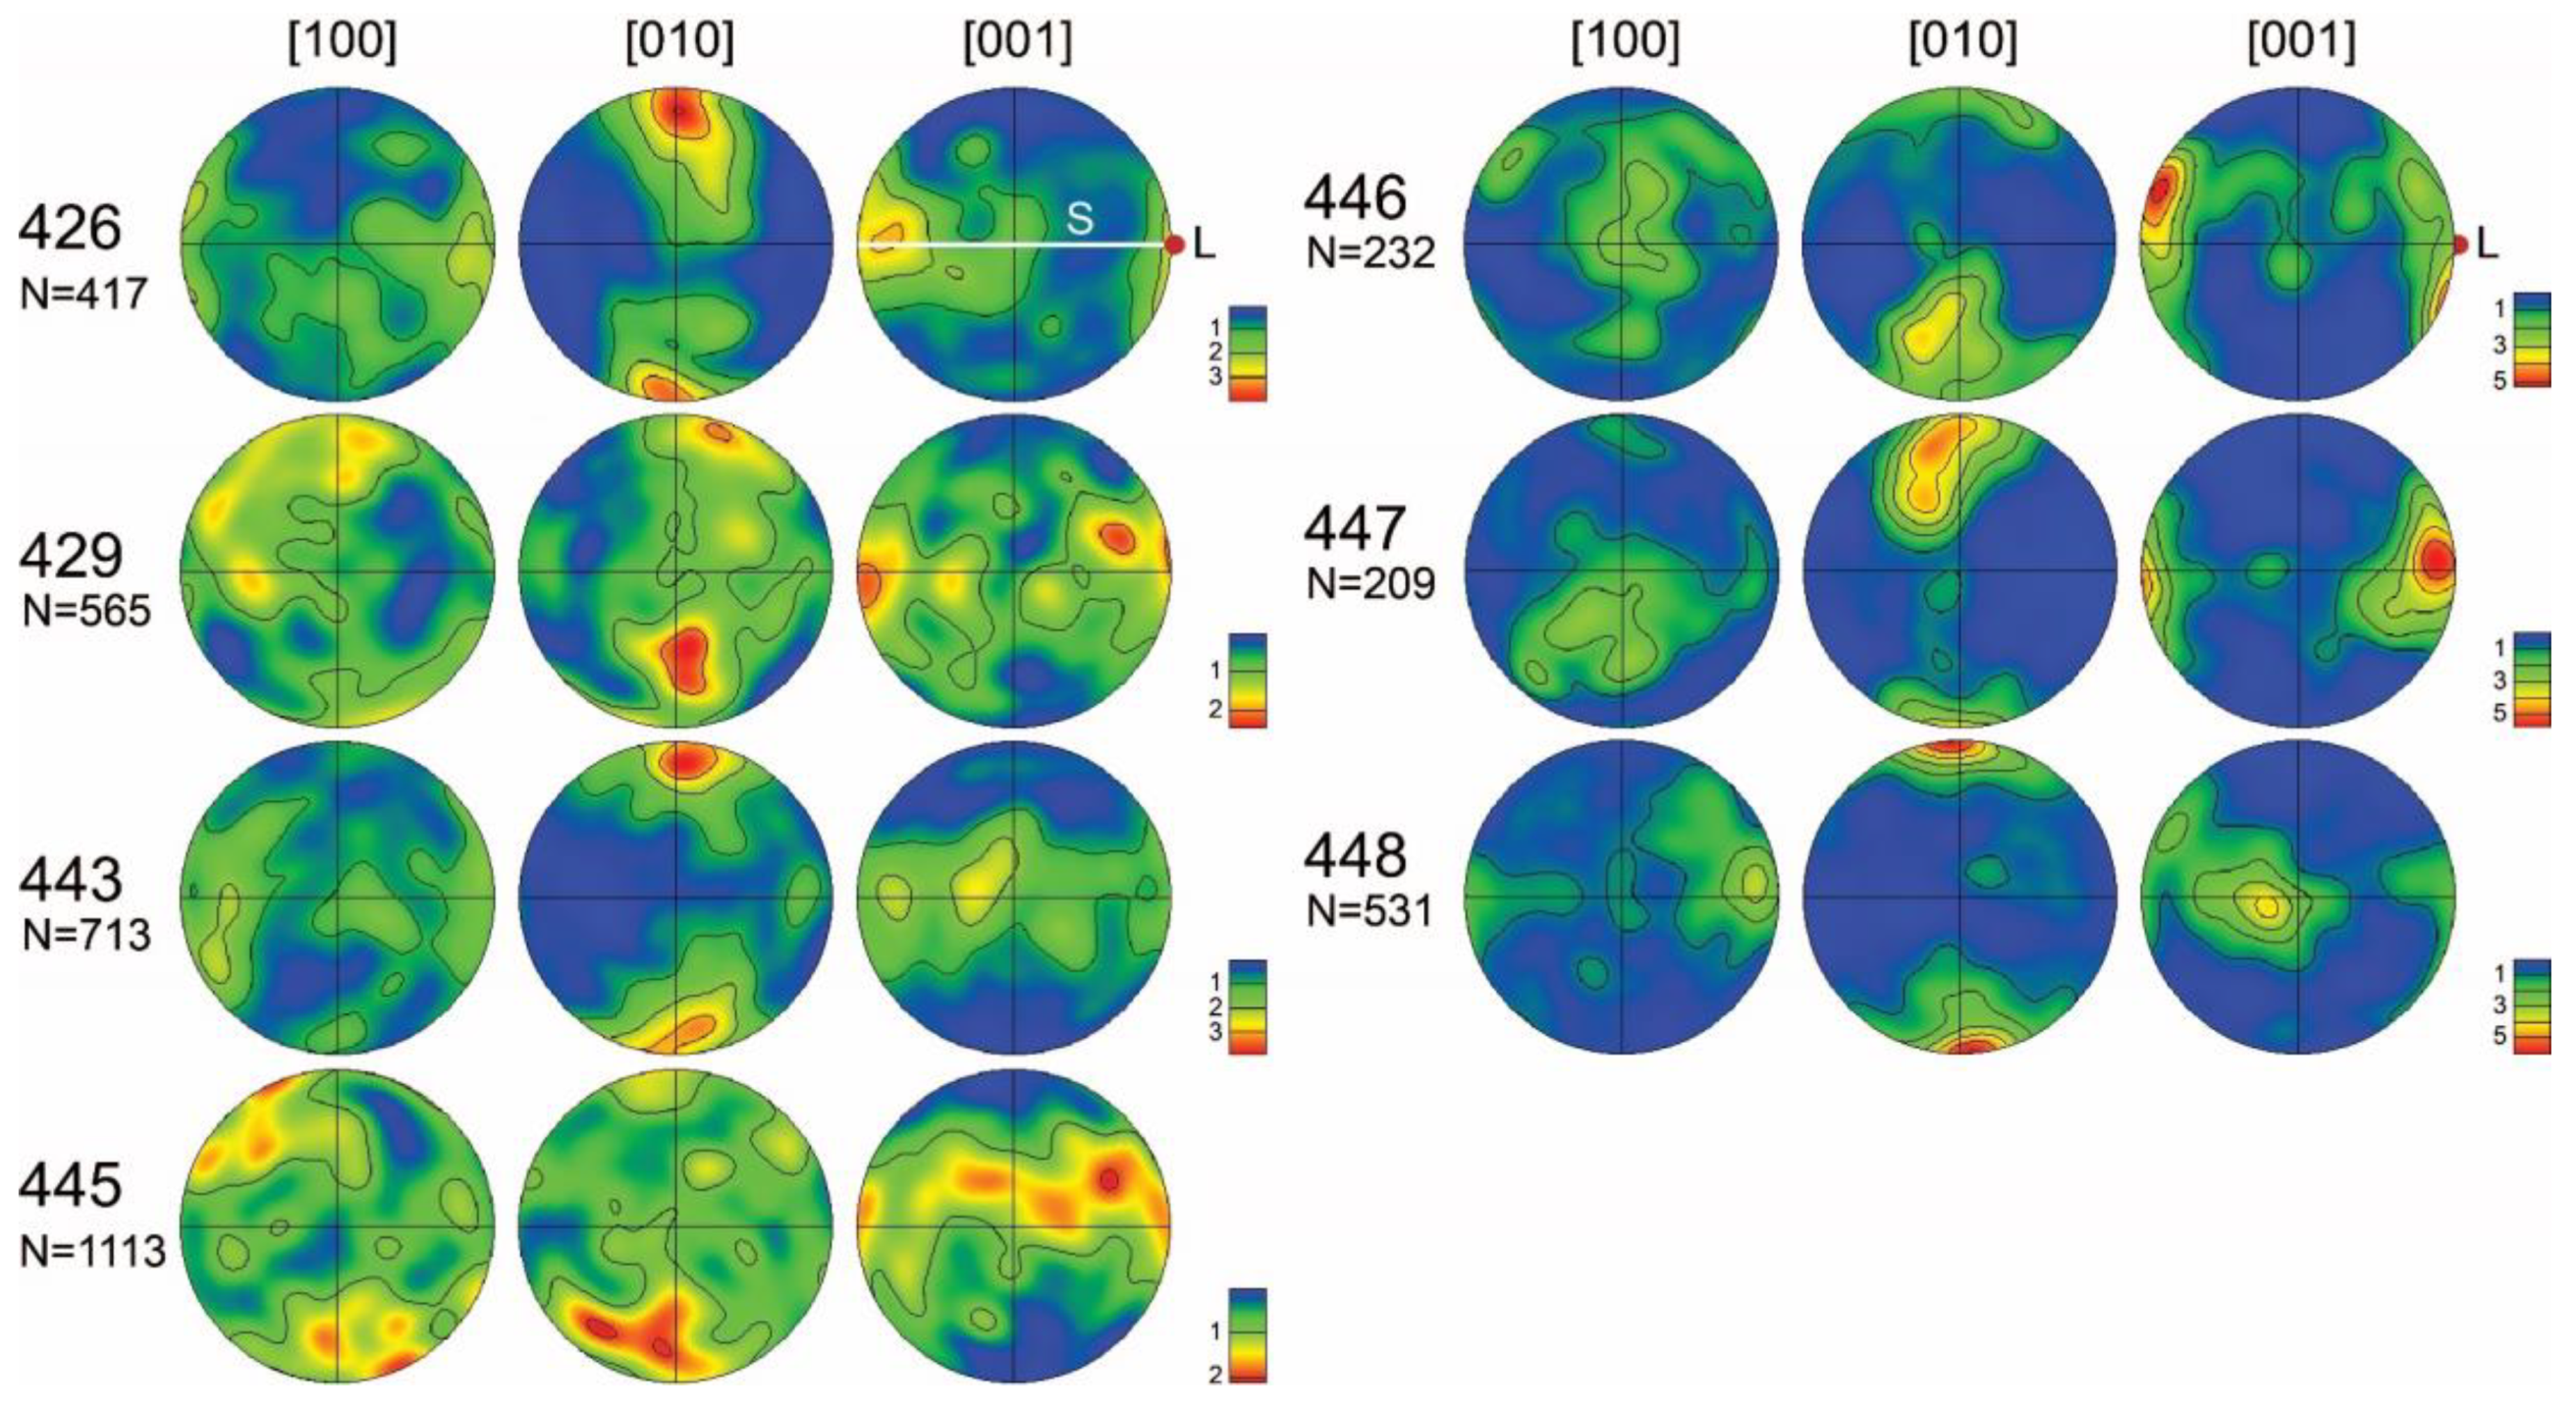
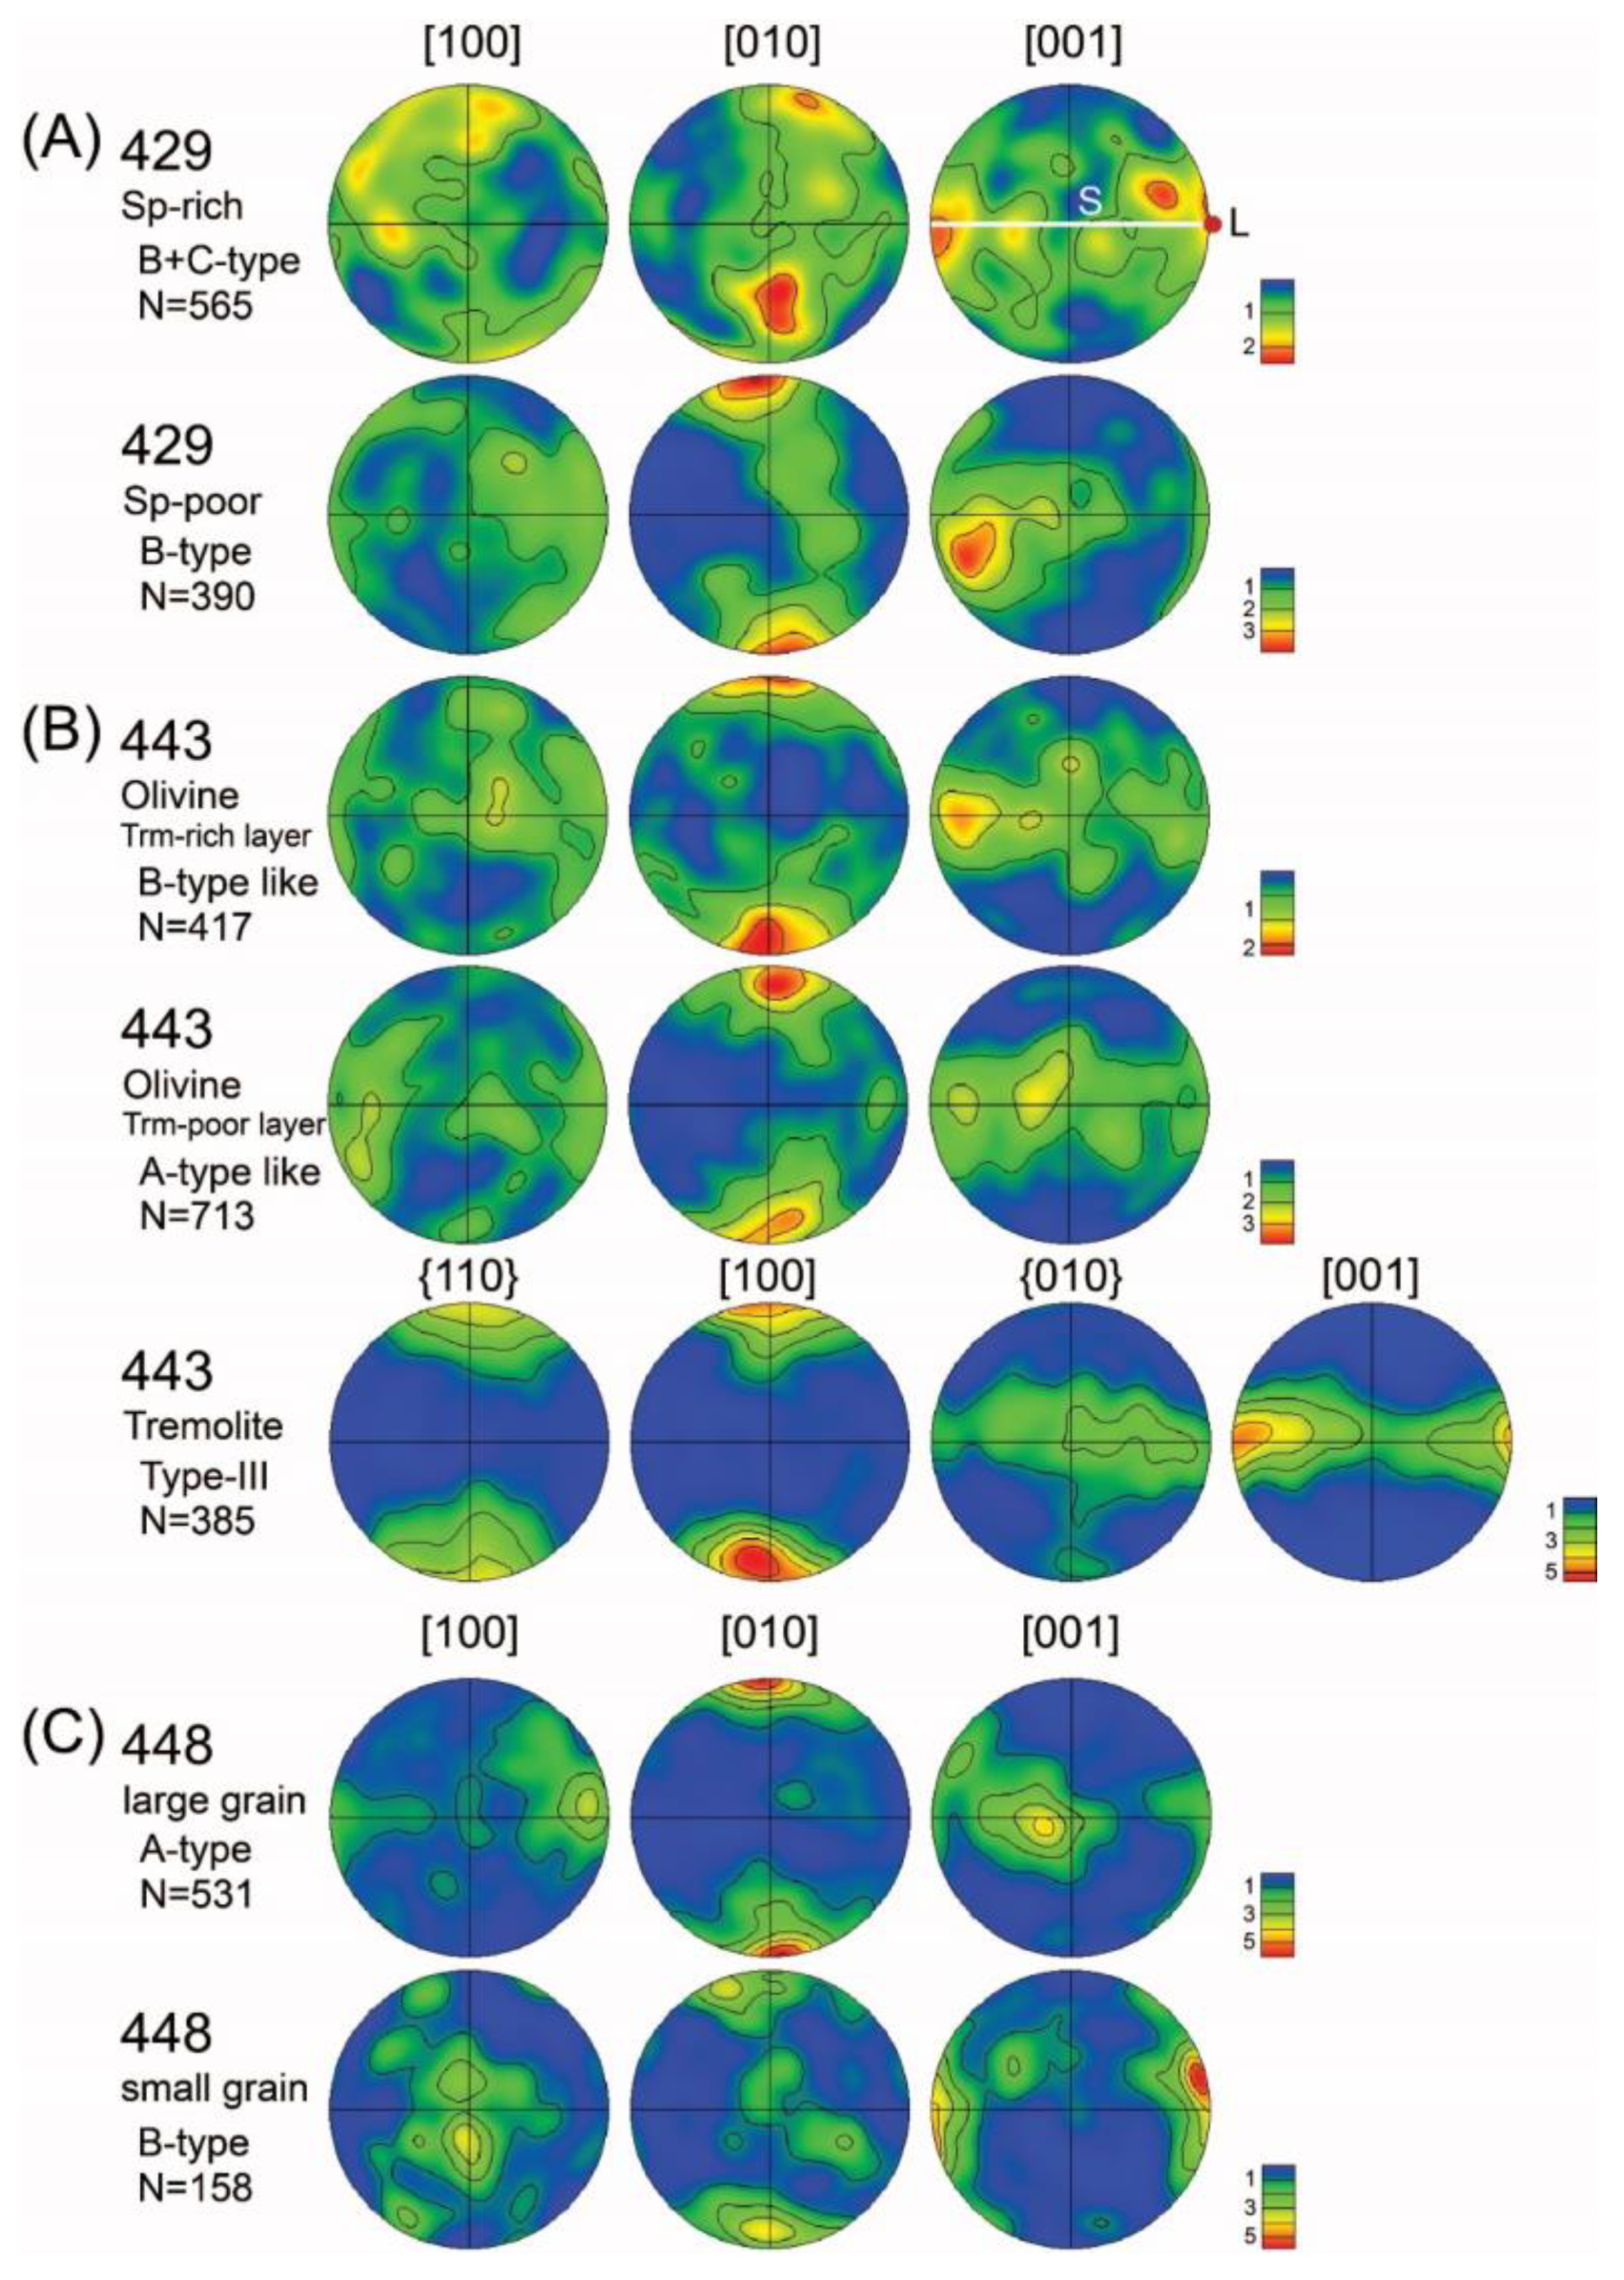
4.3. LPO of Minerals

The LPOs of the olivine in the amphibole peridotite samples are illustrated in Figure 3. In samples 443 and 448, it is apparent that the [100] axes of the olivine are aligned subparallel to the lineation and the [010] axes are aligned subnormal to the foliation, which is known as an A-type LPO [7]. In samples 446 and 447, the [001] axes of the olivine are aligned subparallel to the lineation and the [010] axes are aligned subnormal to the foliation, which is a B-type LPO [7,8]. Some samples showed a combination of the two different types of LPOs. In sample 426, both the [100] and [001] axes of the olivine are aligned subparallel to the lineation and the [010] axes are aligned subnormal to the foliation; this is an A + B-type LPO [19,23,81]. In samples 429 and 445, the [001] axes of the olivine are aligned subparallel to the lineation and both the [100] and [010] axes are aligned subnormal to the foliation; this is known as a mixed B- and C-type LPO (B + C-type LPO). This B + C-type LPO of olivine is quite similar to the type III LPO of olivine which is reported by Prelicz (2005) [82]. The fabric strength of the samples, which was calculated as both the M-index and J-index values from the LPO of the olivine and tremolite, is listed in Table 1. Both the M- and J-index values tend to be slightly lower in the samples with a mixed olivine LPO, such as A + B or B + C (samples 426, 429, and 445; Table 1). The fabric strength of the tremolite was much higher than that of the olivine (Table 1).
To understand the effects of grain size and mineral assemblage on the LPO of olivine, an additional EBSD analysis was performed for three samples: sample 429, 443, and 448. Sample 429 was divided into the spinel-rich layer (Figure 2B) and the spinel-poor layer. In the case of sample 443, the LPOs of the olivine in the tremolite-rich and tremolite-poor layers were determined separately (Figure 2D). Sample 448 was divided into the porphyroclasts and fine-grained recrystallized grains (Table 1). A detailed EBSD analysis of the samples (429, 443, and 448) revealed that the LPO of olivine has a tendency to be varied within the mineral assemblage of the layer and the grain size of the samples (Figure 4). In sample 429, the LPO of the olivine that was obtained from the spinel-rich layer (429 Sp-rich) was a B + C-type, but the LPO of the olivine obtained from the spinel-poor layer (429 Sp-poor) was a B-type (Figure 4A). In sample 443, the LPO of the olivine obtained from the tremolite-rich layer (443 Tr-rich) was a B-type, but the LPO of olivine obtained from the tremolite-poor layer (443 Tr-poor) was an A-type (Figure 4B). In sample 448, the LPO of the olivine observed from the coarse grains that included porphyroclasts (448 large grain) was an A-type, but the LPO of the olivine in the recrystallized fine grains (448 small grain) was a B-type (Figure 4C).
The LPO of the tremolite in the tremolite-rich layer from sample 443 is also shown in Figure 4B. The tremolite LPO exhibits the [001] axes and {010} poles forming a girdle distribution along the foliation with the [100] axes that are aligned subnormal to the foliation; this is known as a type-III LPO of amphibole [44].

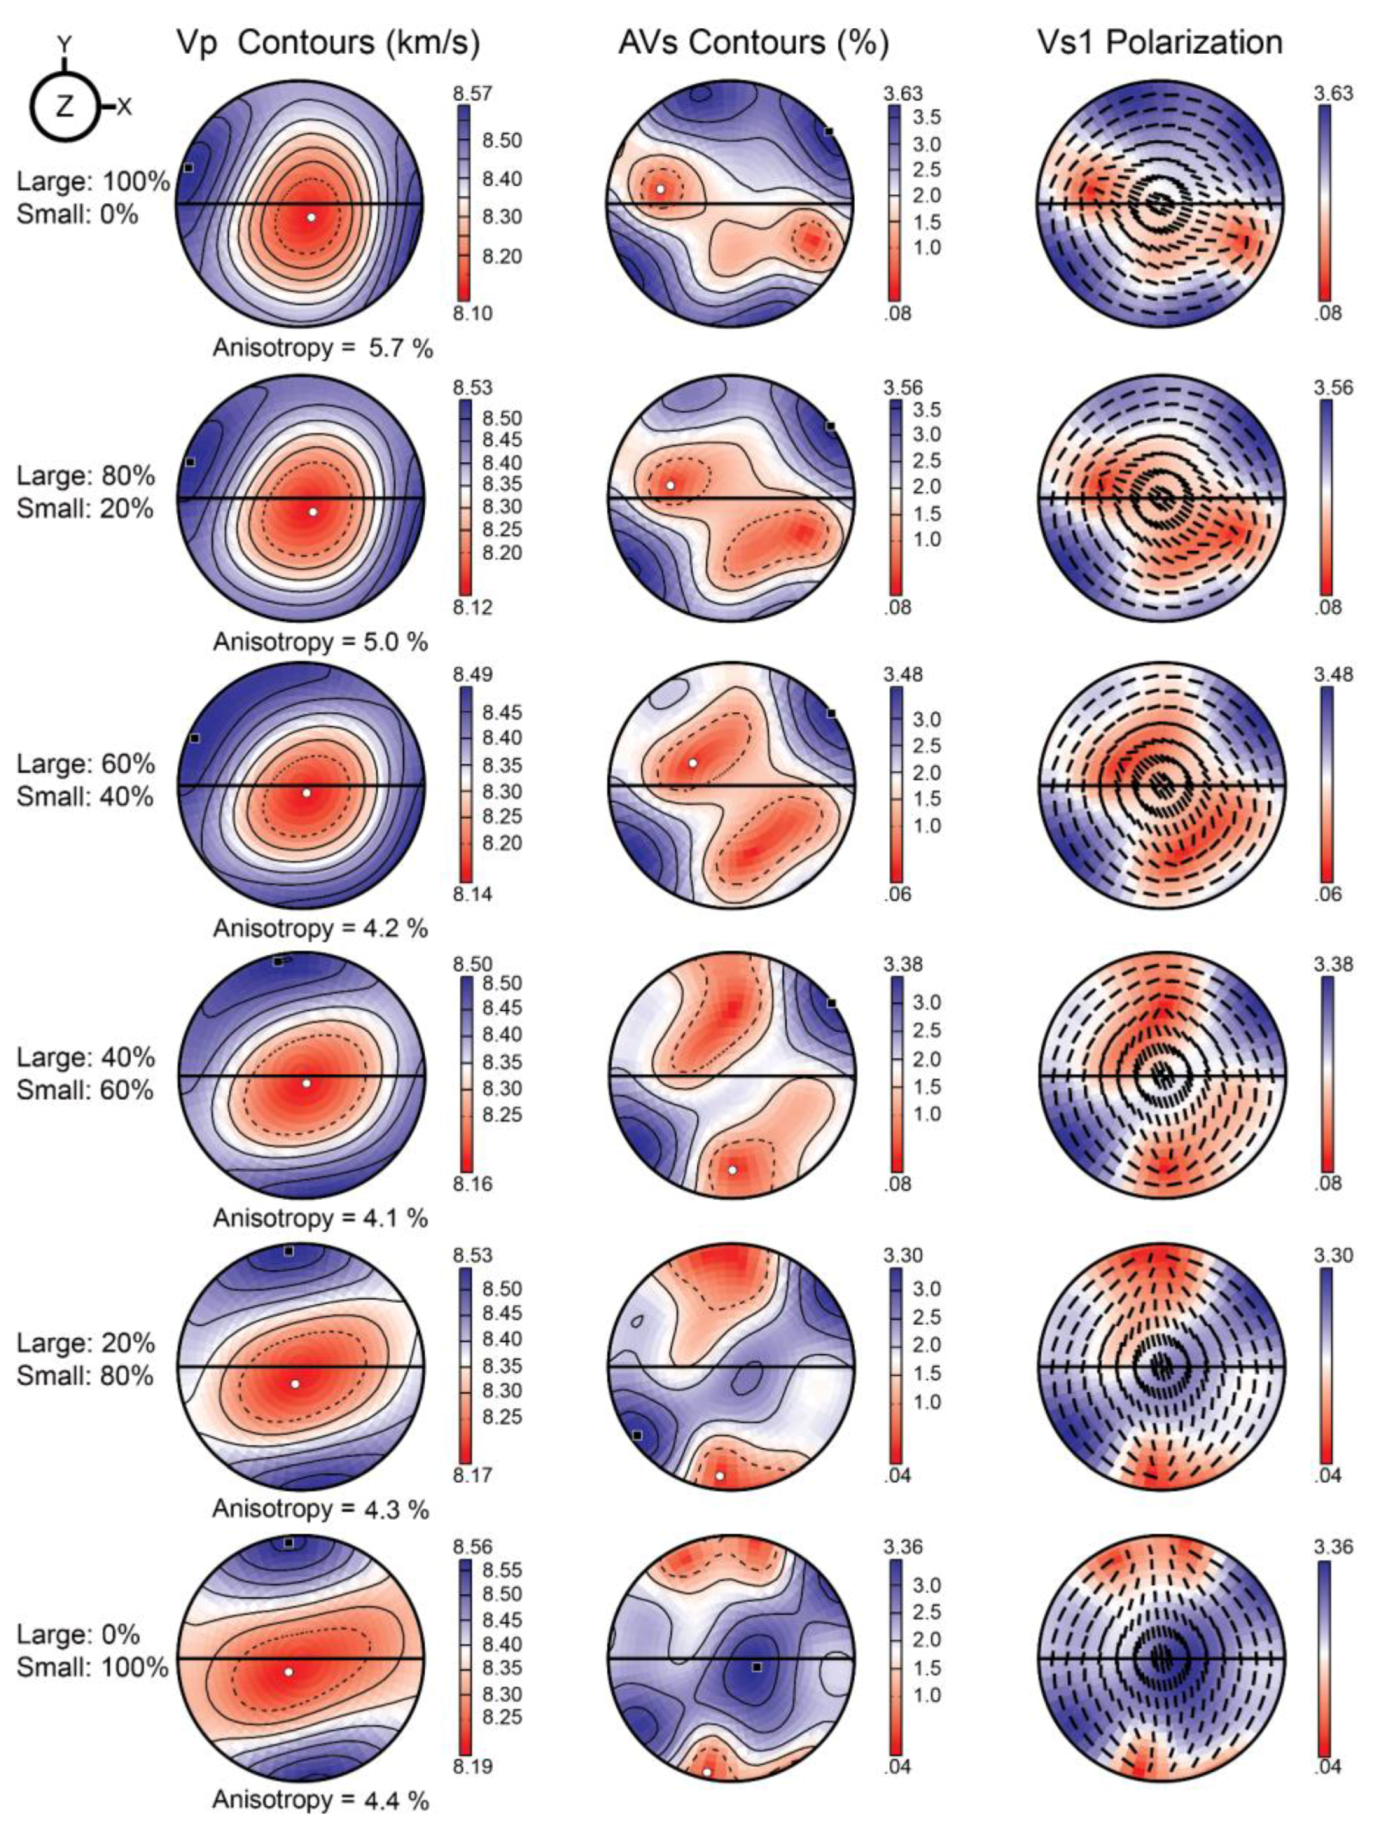
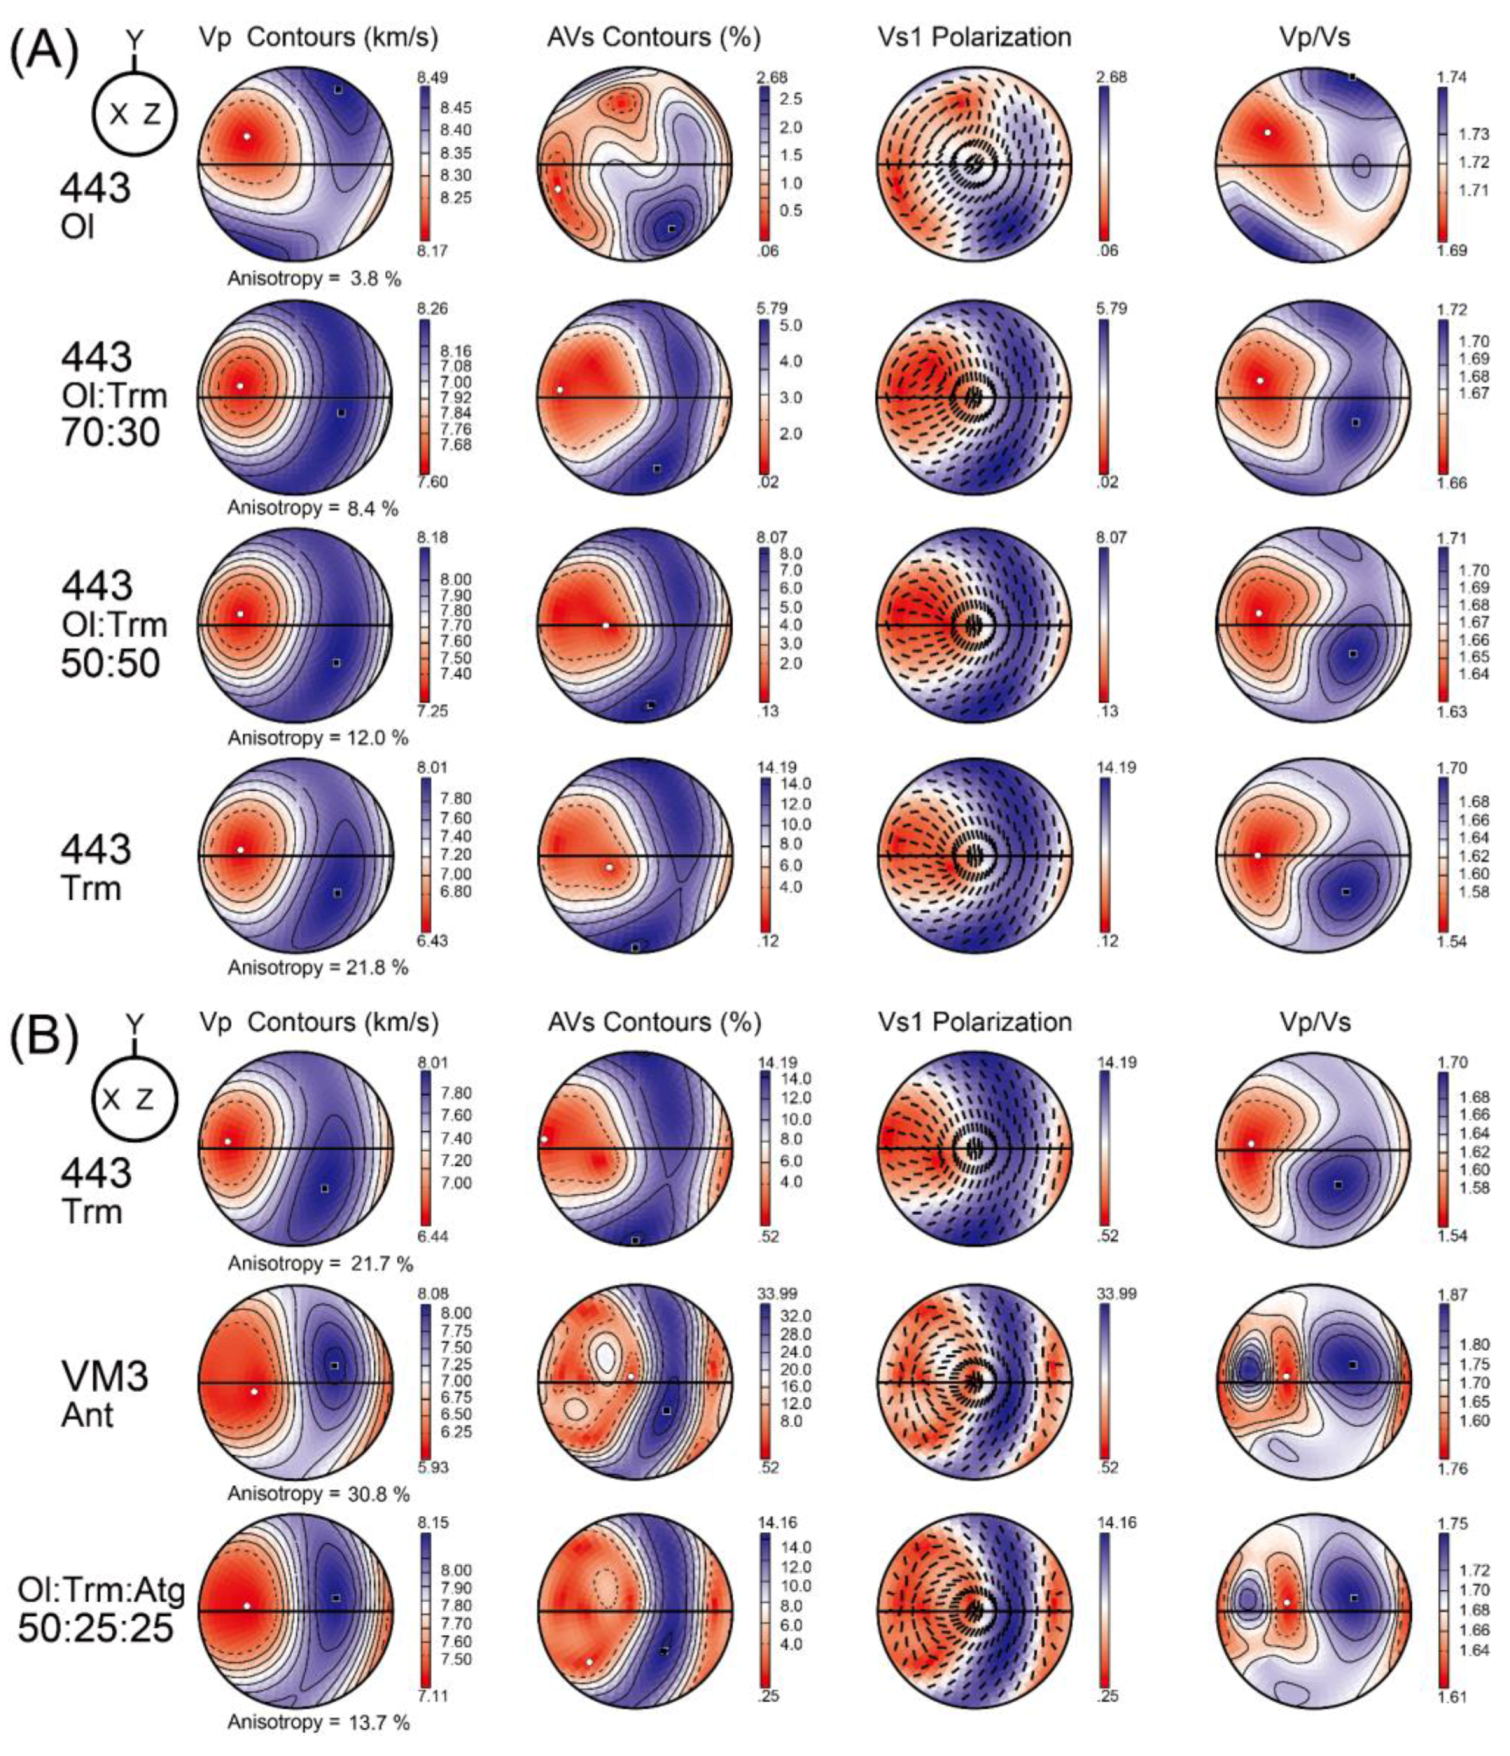
4.4. Seismic Velocity and Anisotropy

To simulate the changes in the seismic properties from the degree of the recrystallization, the LPO data from the large porphyroclasts and fine-grained recrystallized grains were mixed with six different mixing ratios: 100:0, 80:20, 40:60, 60:40, 20:80, and 0:100. The LPO of the olivine in sample 448 was chosen as the original raw data because of its clear porphyroclastic texture (Figure 2A). Due to sample 448 mainly consisting of olivine (more than 90%), only the LPO of olivine was considered for the calculation. The seismic velocity and anisotropy of sample 448 are illustrated in Figure 5. In the large grains of sample 448 (100%), the P-wave anisotropy (AVP) was found to be 5.7%, and the maximum S-wave anisotropy (AVS) was 3.63%. The calculated AVP and maximum AVS values were similar to or slightly higher than those from the previous studies on the Almklovdalen chlorite peridotites; that is, 2.4–8.2% and 0.9–4.3% from Prelicz (2005) [82], 5.3–6.0% and 3.72–4.46% from Wang et al. (2013) [16], and 1.8–3.8% and 1.66–2.68% from Kim & Jung (2015) [24]. For large grains of sample 448, the polarization direction of the fast shear wave at the center of the stereonet was subparallel to the direction of flow (X-direction; Figure 5). With the increasing ratio of small grains, the polarization direction of the fast shear wave started tilting and became subnormal to the flow direction at the large grains (40%) and small grains (60%) (Figure 5). This result indicates that with the 60% of recrystallization rate, a trench-parallel shear wave anisotropy is expected at the mantle wedge, assuming a 2D corner flow of the upper mantle. The estimated thickness of the anisotropic layer for the given delay time is noted in Table 3.
The LPOs of the olivine and tremolite in the tremolite-rich layer of sample 443 (Figure 2D) were chosen to estimate the influence that the amphibole had on the seismic anisotropy of the mantle wedge. The LPO data of the olivine and tremolite in the tremolite-rich layer were mixed in 70:30 and 50:50 ratios and were rotated with a dipping angle of 45° to simulate the effect of flow dipping along the subducting slab in the mantle wedge. The seismic velocity and anisotropy of the tremolite-rich layer of sample 443 is shown in Figure 6. In the case of the olivine (443 Ol), the AVP is 3.8%, the maximum AVS is 2.68%, and the polarization direction of the fast shear wave at the center is oblique to the flow direction (Figure 6A). The tremolite of this sample (443 Trm) demonstrates an AVP of 21.8%, a maximum AVS of 14.19%, and the polarization direction of the fast shear wave at the center is aligned subnormal to the flow direction (Figure 6A). When the olivine and tremolite are mixed with the 70:30 ratio, the AVP is 8.4%, the maximum AVS is 5.79%, and the polarization direction of the fast shear wave at the center is aligned subnormal to the flow direction (Figure 6A). With the 50:50 mixing ratio, the AVP is 12.0%, the maximum AVS is 8.07%, and the polarization direction of the fast shear wave at the center is aligned subnormal to the flow direction (Figure 6A). This result suggests that the presence of amphibole may significantly contribute to the trench-parallel S-wave anisotropy, assuming that the flow dips along the subducting slab in the mantle wedge. In addition, the P- to S-wave velocity ratio (VP/VS) of the tremolite was smaller than that of the olivine (Figure 6A). The maximum VP/VS for the olivine, amphibole, and olivine–amphibole mixture (50:50) was 1.74, 1.70, and 1.71, respectively.
In addition, the LPO data of the serpentine was mixed with the LPO of the olivine and tremolite in the tremolite-rich layer of sample 443 in order to compare the influence of amphibole and serpentine on the seismic anisotropy in subduction zones. The LPO data of the antigorite from Val Malenco, Italy (sample VM3), reported by Jung [38], was mixed with the LPO data of the olivine and tremolite in the tremolite-rich layer of sample 443 in a 50:25:25 (olivine–tremolite–antigorite) ratio. Because serpentine requires a high dipping angle to produce trench-parallel seismic anisotropy [36], the calculated data was rotated with a dipping angle of 55° in order to make a proper comparison. The calculated seismic velocity and anisotropy of the olivine, tremolite, and antigorite mixture are shown in Figure 6B. The mixing ratio of olivine, tremolite, and antigorite was 50:25:25. The AVP is 13.7%, the maximum AVS is 14.16%, and the polarization direction of the fast shear wave at the center is aligned subnormal to the flow direction (Figure 6B). In addition, the pattern of the seismic velocity and anisotropy was similar to that of the antigorite (VM3; [38]), which indicates that the seismic anisotropy of the overall mixture is governed by the antigorite.

4.5. Water Content of Olivine

The representative FTIR spectra of the olivines are illustrated in Figure 7. In the case of the olivine grain without any inclusions or cracks, small absorption peaks were observed (Figure 7A). The average water content of the olivine calculated using the IR bands between 3400 and 3750 cm−1 was 370 ± 50 ppm H/Si (Table 1), which is above the boundary between the A-type and B-type LPO illustrated by the fabric diagram for the olivine [8]. The average water content of the olivine from this study was higher than that from previous studies on the Almklovdalen chlorite peridotites; that is, 7–115 ppm H/Si from Wang et al. (2013) [16] and 170–310 ppm H/Si from Kim & Jung (2015) [24]. No significant difference was apparent in the FTIR spectrum related to the grain size of the olivine or the mineral assemblage of the sample, and therefore all the FTIR spectra were averaged. Additional FTIR analyses were performed for the olivine grains with visible inclusions to study the components of these samples. The resulting FTIR spectra showed strong absorption bands in the range 3400–3750 cm−1 (Figure 7B,C). IR peaks were found at the wave numbers of 3689, 3684, 3649, and 3630 cm−1, which indicates the presence of serpentine as a hydrous inclusion in the olivine [83,84,85].

4.6. Dislocation Microstructure of Olivine

Backscattered electron images of the dislocation microstructure of the olivine are shown in Figure 8. All samples showed a homogeneous distribution of the dislocations, and there was no significant difference between the samples with different LPOs of olivine. In many cases, the dislocations were observed to be curved (Figure 8A) or looped (Figure 8C), suggesting the strong influence that obstacles have on the dislocation glide. Abundant subgrain boundaries were observed in the olivine grains (Figure 8A–C), which were similar to those observed with the optical microscope (Figure 2A,C).

5. Discussion

5.1. Development of LPO of Olivine

Previous studies on the Almklovdalen chlorite peridotites located at a distance of 3 km from the Åheim peridotites, reported both A- and B-type LPOs of olivine [16], A-, B-, C-, and E-type LPOs of olivine [24], and an A-, B + C-type, and axial [010] pattern LPOs of olivine [82]. Wang et al. [16] interpreted that the A-type and B-type LPOs of olivine were formed under dry conditions (7–115 ppm H/Si) and the B-type LPO of olivine was developed under conditions of high stress and high strain. On the other hand, Kim and Jung [24] reported that the A-type LPO was a result of deformation under dry conditions (170 ± 30 ppm H/Si), whereas the B-type LPO was developed due to the deformation of olivine under wet conditions (210–310 ± 30 ppm H/Si). Prelicz (2005) [82] reported that the B + C-type (type-III) LPO of olivine developed in a mantle peridotite under water-rich retrograde conditions possible during the emplacement in crustal rock.
In this study, we observed that the LPO of the olivine in the Åheim amphibole peridotites has a close relationship with the grain size of the olivine and the mineral assemblage of the peridotite (Table 1, Figure 4). The A-type LPO of olivine was observed in the coarse grains of sample 448 (with an average grain size of 1.2 mm, Table 1, Figure 2A) and the tremolite-poor layer of sample 443 (with an average grain size of 0.7 mm, Table 1, Figure 2D). On the other hand, the B-type LPO was observed from the recrystallized fine grains of the olivine in sample 448 (with an average grain size of 0.35 mm, Table 1, Figure 2A) and in the tremolite-rich layer of sample 443 (with an average grain size of 0.35 mm, Table 1, Figure 2D). One possible mechanism for this fabric transition from an A-type to B-type LPO observed in the olivine from the Åheim amphibole peridotites is an olivine deformation under water-rich conditions. The water content of the olivine measured via the FTIR spectroscopy was in the range of 230–500 ± 50 ppm H/Si, which indicates that the olivine was deformed under water-rich conditions [7,8]. The presence of hydrous minerals such as amphibole and chlorite (Figure 2D), and the abundant hydrous inclusions observed in the olivine (Figure 7B,C) suggest that the deformation of the recrystallized olivine grains occurred in the presence of a fluid. In addition, numerous dislocations were observed in the olivine samples (Figure 8). These results indicate that the dominant deformation mechanism of olivine showing a B-type LPO in the Åheim peridotites is a dislocation creep under water-rich conditions.
The other possible mechanism for a fabric change from an A-type to B-type LPO of olivine is an enhancement of dislocation-accommodated grain boundary sliding (DisGBS) [17,18,19,86]. Precigout and Hirth [19] proposed that a fabric transition from an A-type to B-type LPO in olivine that was observed in the Ronda massif, Spain could have resulted from the enhancement of GBS as the grain size decreased. The average grain size of the olivine in the Ronda peridotite was ~1 mm in the tectonites and 0.05–0.3 mm in the upper mylonite [19], which is similar to that of the Åheim amphibole peridotite (448 fine: 0.35 mm, and 448 coarse: 1.2 mm; Table 1). In addition, the few four-grain junctions (Figure 2E,F) observed from the recrystallization of the olivine grains with a B-type olivine fabric (Figure 3) could be further evidence for a minor contribution from deformation via GBS [87,88].
A B + C-type LPO of olivine was observed in the olivine of sample 445 and the spinel-rich layer of sample 429. A C-type LPO of olivine is known to be produced under conditions of low stress and water-rich conditions [7,8,89]. Water may have been lost from the olivine during exhumation. A high water content (up to 500 ± 50 ppm H/Si; Table 1) and the presence of hydrous inclusions such as serpentine in the olivine (Figure 7C) indicate that the B + C-type LPO of olivine observed in samples 429 and 445 can be related to deformation under water-rich conditions. In addition, numerous dislocations were observed in the olivine samples (Figure 8B). These results indicate that the dominant deformation mechanism of olivine demonstrating the C-type LPO in the Åheim peridotites is a dislocation creep under water-rich conditions. A C-type LPO of olivine was also reported in the other previous studies where peridotites were deformed in water-rich conditions at various localities such as Cima di Gagnone in the Central Alps [90], Otrøy Island in Western Norway [91], the North Quidam UHP belt, NW China [92], and the Rio Grande rift, USA [93].

5.2. The Deformation History of Åheim Peridotite

The LPO of the olivine in the Åheim amphibole peridotites showed four different types of olivine fabric: A-, B-, A + B-, and B + C-type LPOs of olivine (Figure 3 and Figure 4). The Åheim peridotite bodies represent the mantle wedge where it was entrapped in the crust during the uplift process [53,54]. An A-type LPO of olivine was observed in the coarse olivine grains including the porphyroclasts (Figure 4B,C, Table 1), which can, therefore, be interpreted as the original mantle fabric prior to uplift. Deformation was localized in the fine recrystallized grain area of the samples (Figure 2B–D). Considering that a significant amount of strain is required to alter the LPO of olivine [6,94], the strain of the deformation during the exhumation process is considered insufficient to change the pre-existing LPO of olivine porphyroclasts. During the uplift process, fluid infiltrated the samples in the amphibole peridotite stability field [53,64], enhancing the recrystallization of the olivine under water-rich conditions [77], which is considered to have resulted in the fabric transition of the olivine from an A-type to a C- and B-type.
The secondary olivine fabric which was developed in the Åheim peridotites is considered to be the C-type LPO of olivine, which is preserved as the B + C-type LPO of olivine in sample 445 and the spinel-rich layer of sample 429 (Figure 4A). The C-type fabric in the Åheim amphibole peridotite can be correlated with the spinel bearing assemblage (Figure 2B and Figure 4A), which is related to the granulite facies (ol + opx + cpx + sp) condition during the process of exhumation [53,54,58]. After the granulite facies condition, a localized deformation associated with the fluid infiltration may have resulted in the fabric transition to the C-type LPO of olivine (Figure 7C). As granulite facies metamorphism was recorded in the Åheim amphibole peridotite prior to amphibolite facies [53,54,58], this C-type LPO can be regarded as a secondary olivine fabric.
The last olivine fabric which was developed in the Åheim peridotites is considered to be as the B-type LPO of olivine observed in the small recrystallized olivine grains (Figure 4B,C). Samples with the B-type LPO of olivine were of the smallest grain size. The B-type LPO of olivine can be related to the deformation of samples during amphibolite facies (ol + opx + amp + chl) conditions, following the granulite facies [53,54,58]. Fluid infiltration and the enhanced recrystallization of olivine at the amphibolite facies condition could lead to the fine-grained olivine grains that were deformed under water-rich conditions, resulting in the B-type LPO of olivine in the small recrystallized olivine grains. Both the A + B-type or B + C-type LPO of the olivine observed in samples 426, 429, and 445 (Figure 3) can be interpreted as a B-type LPO of olivine overprinting a preexisting A- or C-type LPO of the olivine. These mixed LPOs of olivine are believed to be the last olivine fabrics preserved in the Åheim amphibole peridotites.

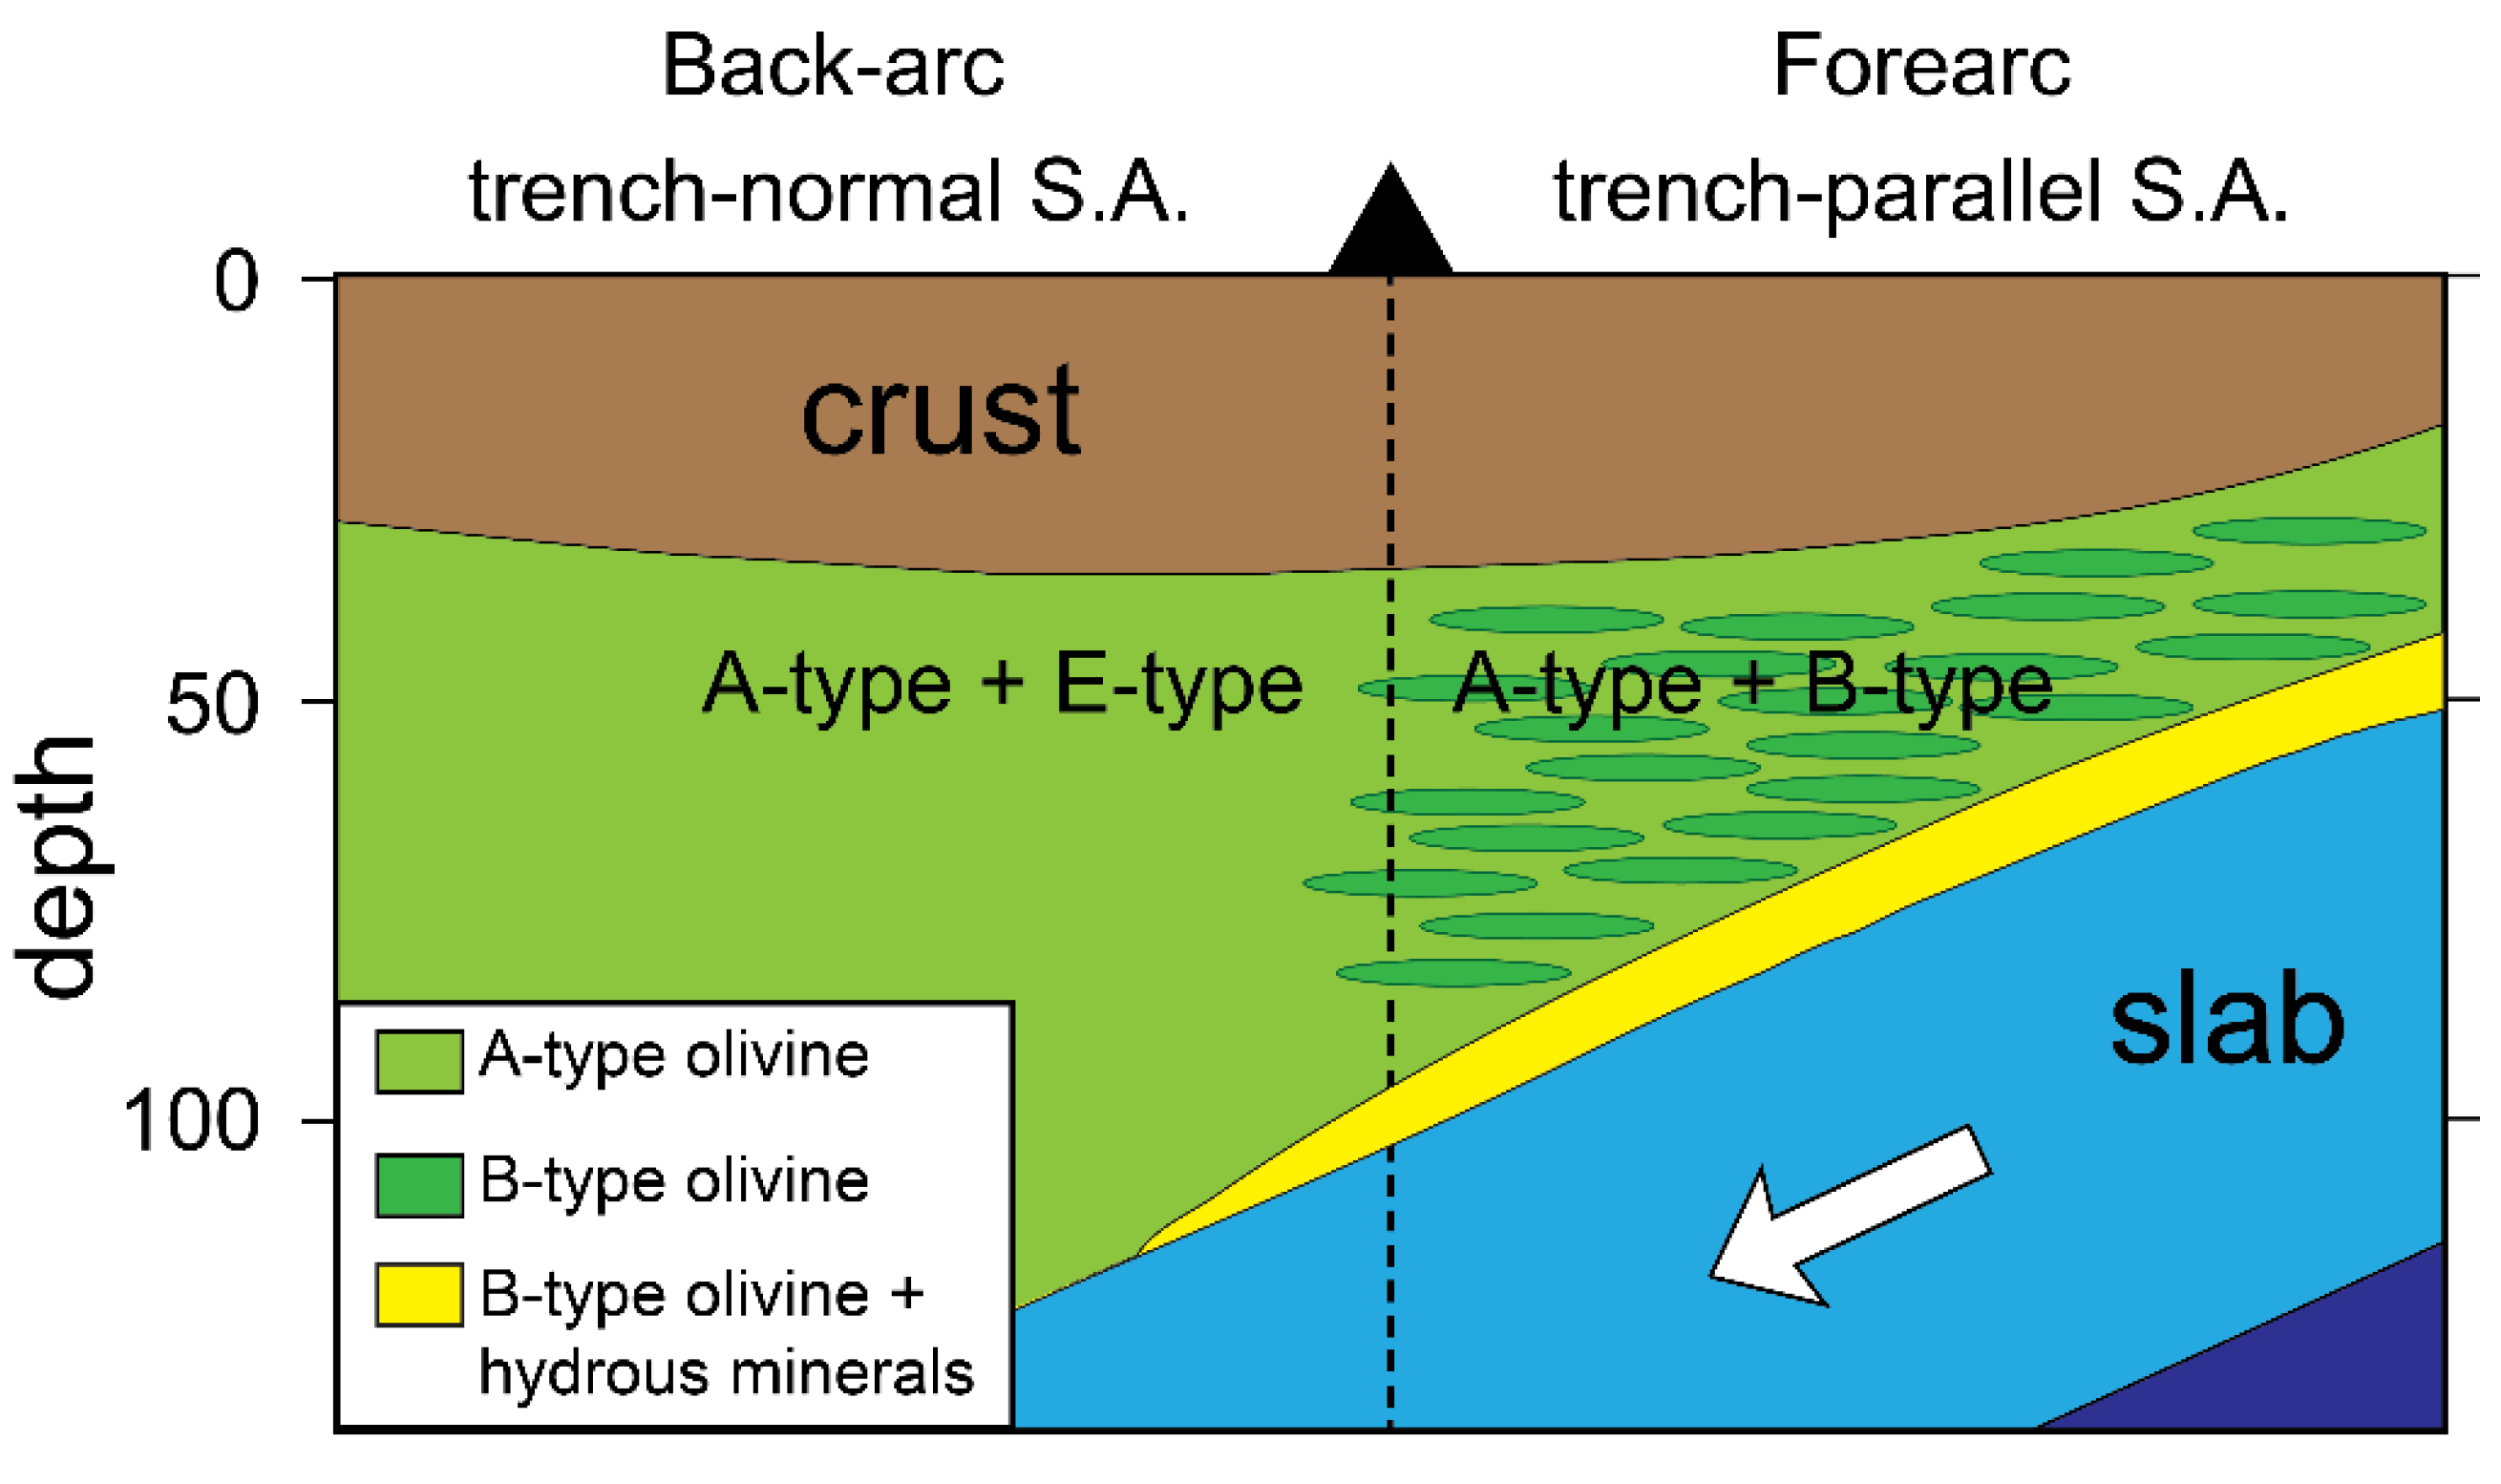
5.3. Implications for the Seismic Anisotropy

Trench-parallel seismic anisotropy has been observed at various subduction zones around the world [13,37,95,96,97,98]. After experiments concerning the deformation of olivine under wet conditions at high pressures, a water-induced fabric change of the olivine in the subduction zone was suggested as one of the possible mechanisms for this phenomenon [7,8]. As the fabric transition from an A-type to B-type LPO of the olivine in the Åheim amphibole peridotite was driven by the fluid infiltration associated with the exhumation process during/after the Scandian orogeny, the olivine fabric data from this study cannot be directly applied to the current mantle wedge above the subducting slab. However, the olivine fabric transition observed from the Åheim amphibole peridotites could be a good example of water-induced fabric change to olivine in naturally deformed peridotites.
Prelicz (2005) reported the ultrasound velocities of the P- and S-waves measured on the cores obtained from the Almklovdalen chlorite peridotites [82]. The mean VP and VS1 at a confining pressure of 400 MPa were around 7.9–8.2 km/s and 4.76–5.1 km/s, respectively [82], The seismic velocities calculated from the LPO of olivine in sample 448 showed that the VP was slightly higher (8.1–8.57 km/s; Figure 5) and the <VS> was similar to the ultrasound velocity data (4.78–4.8 km/s; Table 3). There are several explanations for these differences in seismic velocities: (1) Since sample 448 mainly consisted of olivine, only the LPO of olivine was considered for the calculation. Therefore, the effect of secondary minerals was excluded in this case, especially for the effect of hydrous minerals such as tremolite and chlrotite. (2) In this study, the elastic constant of a single crystal olivine at an ambient condition was used for calculation. Since the elastic constant of olivine is dependent on the pressure and temperature [72], there may be minor errors related to the elastic constant because of the low pressure and temperature conditions of the rocks. (3) As the calculated seismic anisotropy only consider the volume fraction, density, elastic constants, and the LPO of the mineral [71], the effects of thermal cracks or pores on the seismic velocities were neglected.
As S-wave anisotropies in the A- and B-type LPOs of olivine are negatively interfered with [7,8], the mixing of these two olivine fabrics may result in a significant weakening of the seismic anisotropy [99] or change in the S-wave anisotropy [14]. In the case of sample 448, large grains (i.e., porphyroclasts) showed an A-type LPO of olivine and the small recrystallized grains (448 small grain) showed a B-type LPO of olivine (Figure 4C). The seismic velocity and anisotropy calculated from the LPOs of the olivine in sample 448 showed that with more than 60% of fabric transition from an A-type to B-type LPO of olivine, the polarization direction of the fast shear wave at the center of the stereonet (vertical propagation of S-wave) changed, to become subnormal to the flow direction (trench-parallel; Figure 5). Comparing the seismic anisotropy of the 60% fabric transition (60:40) with that of the 100% fabric transition to a B-type LPO (0:100), the S-wave anisotropy (AVS) at the center of the stereonet was decreased to ~42%, and the estimated thickness of the anisotropic layer for a given delay time was increased to ~80% (Table 3). Assuming that the olivine fabric is partially changed from an A- to B-type LPO of olivine in the forearc mantle wedge (Figure 9), the shear wave seismic anisotropy of the olivine in the forearc mantle wedge would be significantly decreased (Table 3). This mixed olivine fabric in the mantle wedge could be a possible explanation for the relatively small delay time (~0.2 s) observed at various subduction zones such as in NE Japan or Mexico [99,100,101,102].
To understand trench-parallel seismic anisotropy in subduction zones and assuming a mantle flow that is dipping alongside the slab, it is important to consider the effect that hydrous minerals are expected to have on the seismic anisotropy of a subduction zone [2,33], such as the formation of serpentine [38,39] and chlorite [24]. Under a slab dipping angle of approximately 45°, the polarization direction of the fast shear wave was oblique to the lineation (flow) direction when only the LPO of the olivine of sample 443 was considered (Figure 6A). However, the polarization direction of the fast shear wave became subnormal to the flow direction when the tremolite LPO was mixed with the LPO of the olivine in sample 443 (Figure 6A). Comparing the seismic anisotropy of the Ol–Trm mixture (50:50) with that of the olivine, the AVS was increased to ~79%, and the estimated thickness of the anisotropic layer for the given delay time was decreased to ~47% (Table 3). This result suggested that the amphibole can have a similar effect on the trench-parallel shear wave splitting as other hydrous minerals such as serpentine and chlorite in the mantle wedge (Figure 9).
Due to the strong seismic anisotropy of the antigorite, the overall seismic velocity and anisotropy of the olivine, antigorite, and tremolite mixture were governed by the LPO of antigorite (Figure 6B). The maximum AVS of the antigorite was 2.4 times larger than that of the tremoloite, and the pattern of the seismic velocity and anisotropy of Ol–Atg–Trm mixture mostly followed that of the antigorite. However, the AVS values of the tremolite (Tremolite 443) for the vertically propagating seismic wave (at the center of the stereonet) was 3.75 times higher than that of antigorite (VM3) with a slab dipping angle of 55° (Table 3). In addition, amphibole can produce trench-parallel seismic anisotropy (Figure 6A) in a relatively lower slab dipping angle (45°) than that of the serpentine [38].
The maximum VP/VS values of the olivine, tremolite, and olivine–tremolite mixture were 1.74, 1.70, and 1.71, respectively (Figure 6A). The calculated maximum VP/VS value of the tremolite (1.70) was close to the isotropic VP/VS value (β0 = 1.718) in the amphibolite reported by Ji et al. [42]. The seismic velocity and anisotropy calculated from the LPOs of the olivine and tremolite in the tremolite-rich layer of sample 443 showed that the VP/VS ratio of the tremolite was smaller than that of the olivine (Figure 6A). The VP/VS ratio of the mixed olivine–tremolite layer was also smaller than that of the olivine. High VP/VS zones have been observed at various subduction zones such as those near Cascadia, Nankai, and in Central Mexico [103,104,105,106,107]. These high VP/VS zones are usually interpreted as being the result of a regionally high pore fluid pressure [103,105] or presence of talc [108]. Our result indicates that, unlike talc or serpentine, amphiboles do not contribute much to the formation of the high VP/VS zones.

6. Conclusions

The microstructures of the amphibole peridotites from the Gusdal quarry in Åheim, Norway were studied and evidence for the multiple stages of deformation during the Scandian Orogeny and subsequent exhumation was found. The Åheim amphibole peridotites showed a porphyroclastic texture with abundant undulose extinctions and subgrain boundaries in the olivine. The LPOs of the olivine in the Åheim amphibole peridotites were closely related to the grain size of the olivine and mineral assemblage of the samples. The coarse grains including porphyroclasts showed an A-type LPO of the olivine, which corresponds to the initial stage of deformation in the mantle. During the exhumation process, deformation was associated with the infiltration of fluid and enhanced dynamic recrystallization under water-rich conditions that resulted in the fabric transition of the olivine from an A-type to C- or B-type LPO. Olivines in the spinel-bearing assemblage showed a C-type LPO of olivine which can be interpreted as a result of deformation under water-rich conditions after granulite facies metamorphism. The small recrystallized olivine grains showed a B-type LPO of olivine, which represents the deformation in amphibolite facies. A high water content (370 ± 50 ppm H/Si) and abundant dislocations in the olivine suggest that the B-type LPOs of olivine that were observed in the recrystallized olivine grains were developed via deformation by a dislocation creep under water-rich conditions. In addition, the existence of small recrystallized grains and four-grain junctions indicate that the fabric transition from A-type to B-type was also influenced by the DisGBS process related to the grain size reduction. The microstructural evolution of the Åheim amphibole peridotites can be a good example of the fabric change of the olivine from an A- to B-type that is observed in naturally deformed peridotites. Seismic anisotropy of the olivine in the Åheim amphibole peridotite calculated with a different ratio of coarse grains (showing an A-type LPO) and the fine recrystallized grains (showing a B-type LPO) of olivine indicates that with the 60% recrystallization rate, a trench-parallel S-wave anisotropy is expected from the mantle wedge. Tremolites from the tremolite-rich layer showed a type-III LPO of amphibole. A stronger fabric strength was observed in the tremolite than that in the olivine, and the resultant seismic anisotropy of the tremolite implies that amphibole can perform a similar role to other hydrous minerals such as serpentine and chlorite on the formation of trench-parallel seismic anisotropy.

Author Contributions

Conceptualization, H.J.; methodology, H.J.; software, S.J.; validation, S.J., H.J. and H.A.; formal analysis, S.J.; investigation, S.J.; resources, S.J. and H.A.; data curation, S.J.; writing—original draft preparation, S.J.; writing—review and editing, S.J., H.J. and H.A.; visualization, S.J.; supervision, H.J.; project administration, H.J.; funding acquisition, H.J. All authors have read and agreed to the published version of the manuscript.

Funding

This research was funded by the Mid-career Research Program through National Research Foundation of Korea (NRF: 2017R1A2B2004688 and 2020R1A2C2003765) to Haemyeong Jung.

Acknowledgments

The authors are grateful to the anonymous reviewers for constructive comments and corrections.

Conflicts of Interest

The authors declare no conflict of interest.

References

  1. Ben Ismail, W.; Mainprice, D. An olivine fabric database: An overview of upper mantle fabrics and seismic anisotropy. Tectonophysics 1998, 296, 145–157. [Google Scholar] [CrossRef]
  2. Jung, H. Crystal preferred orientations of olivine, orthopyroxene, serpentine, chlorite, and amphibole, and implications for seismic anisotropy in subduction zones: A review. Geosci. J. 2017, 21, 985–1011. [Google Scholar] [CrossRef]
  3. Karato, S.; Jung, H.; Katayama, I.; Skemer, P. Geodynamic significance of seismic anisotropy of the upper mantle: New insights from laboratory studies. Annu. Rev. Earth Planet. Sci. 2008, 36, 59–95. [Google Scholar] [CrossRef] [Green Version]
  4. Nicolas, A.; Christensen, N.I. Formation of anisotropy in upper mantle peridotites: A review. Geodyn. Ser. 1987, 16, 111–123. [Google Scholar] [CrossRef]
  5. Skemer, P.; Hansen, L.N. Inferring upper-mantle flow from seismic anisotropy: An experimental perspective. Tectonophysics 2016, 668, 1–14. [Google Scholar] [CrossRef] [Green Version]
  6. Boneh, Y.; Skemer, P. The effect of deformation history on the evolution of olivine CPO. Earth Planet. Sci. Lett. 2014, 406, 213–222. [Google Scholar] [CrossRef]
  7. Jung, H.; Karato, S. Water-induced fabric transitions in olivine. Science 2001, 293, 1460–1463. [Google Scholar] [CrossRef] [Green Version]
  8. Jung, H.; Katayama, I.; Jiang, Z.; Hiraga, T.; Karato, S. Effect of water and stress on the lattice-preferred orientation of olivine. Tectonophysics 2006, 421, 1–22. [Google Scholar] [CrossRef]
  9. Katayama, I.; Jung, H.; Karato, S. New type of olivine fabric from deformation experiments at modest water content and low stress. Geology 2004, 32, 1045–1048. [Google Scholar] [CrossRef] [Green Version]
  10. Ohuchi, T.; Kawazoe, T.; Nishihara, Y.; Nishiyama, N.; Irifune, T. High pressure and temperature fabric transitions in olivine and variations in upper mantle seismic anisotropy. Earth Planet. Sci. Lett. 2011, 304, 55–63. [Google Scholar] [CrossRef]
  11. Soustelle, V.; Manthilake, G. Deformation of olivine-orthopyroxene aggregates at high pressure and temperature: Implications for the seismic properties of the asthenosphere. Tectonophysics 2017, 694, 385–399. [Google Scholar] [CrossRef]
  12. Long, M.D.; van der Hilst, R.D. Shear wave splitting from local events beneath the Ryukyu arc: Trench-parallel anisotropy in the mantle wedge. Phys. Earth Planet. Inter. 2006, 155, 300–312. [Google Scholar] [CrossRef] [Green Version]
  13. Nakajima, J.; Hasegawa, A. Shear-wave polarization anisotropy and subduction-induced flow in the mantle wedge of northeastern Japan. Earth Planet. Sci. Lett. 2004, 225, 365–377. [Google Scholar] [CrossRef]
  14. Precigout, J.; Almqvist, B.S.G. The Ronda peridotite (Spain): A natural template for seismic anisotropy in subduction wedges. Geophys. Res. Lett. 2014, 41, 8752–8758. [Google Scholar] [CrossRef] [Green Version]
  15. Jung, H.; Mo, W.; Green, H.W. Upper mantle seismic anisotropy resulting from pressure-induced slip transition in olivine. Nat. Geosci. 2009, 2, 73–77. [Google Scholar] [CrossRef]
  16. Wang, Q.; Xia, Q.K.; O’Reilly, S.Y.; Griffin, W.L.; Beyer, E.E.; Brueckner, H.K. Pressure- and stress-induced fabric transition in olivine from peridotites in the Western Gneiss Region (Norway): Implications for mantle seismic anisotropy. J. Metamorph. Geol. 2013, 31, 93–111. [Google Scholar] [CrossRef] [Green Version]
  17. Cao, Y.; Jung, H.; Song, S.G. Olivine fabrics and tectonic evolution of fore-arc mantles: A natural perspective from the Songshugou dunite and harzburgite in the Qinling orogenic belt, central China. Geochem. Geophys. Geosyst. 2017, 18, 907–934. [Google Scholar] [CrossRef]
  18. Hansen, L.N.; Zimmerman, M.E.; Kohlstedt, D.L. Grain boundary sliding in San Carlos olivine: Flow law parameters and crystallographic-preferred orientation. J. Geophys. Res. Solid Earth 2011, 116, 16. [Google Scholar] [CrossRef]
  19. Precigout, J.; Hirth, G. B-type olivine fabric induced by grain boundary sliding. Earth Planet. Sci. Lett. 2014, 395, 231–240. [Google Scholar] [CrossRef] [Green Version]
  20. Sundberg, M.; Cooper, R.F. Crystallographic preferred orientation produced by diffusional creep of harzburgite: Effects of chemical interactions among phases during plastic flow. J. Geophys. Res. Solid Earth 2008, 113, 16. [Google Scholar] [CrossRef]
  21. Holtzman, B.K.; Kohlstedt, D.L.; Zimmerman, M.E.; Heidelbach, F.; Hiraga, T.; Hustoft, J. Melt segregation and strain partitioning: Implications for seismic anisotropy and mantle flow. Science 2003, 301, 1227–1230. [Google Scholar] [CrossRef] [Green Version]
  22. Qi, C.; Hansen, L.N.; Wallis, D.; Holtzman, B.K.; Kohlstedt, D.L. Crystallographic preferred orientation of olivine in sheared partially molten rocks: The source of the“ a-c Switch”. Geochem. Geophys. Geosyst. 2018, 19, 316–336. [Google Scholar] [CrossRef]
  23. Jung, S.; Jung, H.; Austrheim, H. Characterization of olivine fabrics and mylonite in the presence of fluid and implications for seismic anisotropy and shear localization. Earth Planets Space 2014, 66, 21. [Google Scholar] [CrossRef] [Green Version]
  24. Kim, D.; Jung, H. Deformation microstructures of olivine and chlorite in chlorite peridotites from Almklovdalen in the Western Gneiss Region, southwest Norway, and implications for seismic anisotropy. Int. Geol. Rev. 2015, 57, 650–668. [Google Scholar] [CrossRef]
  25. Behr, W.M.; Smith, D. Deformation in the mantle wedge associated with Laramide flat-slab subduction. Geochem. Geophys. Geosyst. 2016, 17, 2643–2660. [Google Scholar] [CrossRef] [Green Version]
  26. Puelles, P.; Abalos, B.; Ibarguchi, J.I.G.; Sarrionandia, F.; Carracedo, M.; Fernandez-Armas, S. Petrofabric and seismic properties of lithospheric mantle xenoliths from the Calatrava volcanic field (Central Spain). Tectonophysics 2016, 683, 200–215. [Google Scholar] [CrossRef]
  27. Fumagalli, P.; Poli, S. Experimentally determined phase relations in hydrous peridotites to 6.5 GPa and their consequences on the dynamics of subduction zones. J. Petrol. 2005, 46, 555–578. [Google Scholar] [CrossRef]
  28. Hacker, B.R.; Abers, G.A.; Peacock, S.M. Subduction factory 1. Theoretical mineralogy, densities, seismic wave speeds, and H2O contents. J. Geophys. Res. Solid Earth 2003, 108, 26. [Google Scholar] [CrossRef]
  29. Ohtani, E. Water in the mantle. Elements 2005, 1, 25–30. [Google Scholar] [CrossRef]
  30. Wada, I.; Behn, M.D.; Shaw, A.M. Effects of heterogeneous hydration in the incoming plate, slab rehydration, and mantle wedge hydration on slab-derived H2O flux in subduction zones. Earth Planet. Sci. Lett. 2012, 353, 60–71. [Google Scholar] [CrossRef]
  31. Almqvist, B.S.G.; Mainprice, D. Seismic properties and anisotropy of the continental crust: Predictions based on mineral texture and rock microstructure. Rev. Geophys. 2017, 55, 367–433. [Google Scholar] [CrossRef] [Green Version]
  32. Lee, J.; Jung, H.; Klemd, R.; Tarling, M.S.; Konopelko, D. Lattice preferred orientation of talc and implications for seismic anisotropy in subduction zones. Earth Planet. Sci. Lett. 2020, 537, 1–11. [Google Scholar] [CrossRef]
  33. Mainprice, D.; Ildefonse, B. Seismic anisotropy of subduction zone minerals–contribution of hydrous phases. In Subduction Zone Geodynamics; Springer: Berlin, Germany, 2009; pp. 63–84. [Google Scholar]
  34. Mookherjee, M.; Mainprice, D. Unusually large shear wave anisotropy for chlorite in subduction zone settings. Geophys. Res. Lett. 2014, 41, 1506–1513. [Google Scholar] [CrossRef] [Green Version]
  35. Walpole, J.; Wookey, J.; Kendall, J.M.; Masters, T.G. Seismic anisotropy and mantle flow below subducting slabs. Earth Planet. Sci. Lett. 2017, 465, 155–167. [Google Scholar] [CrossRef] [Green Version]
  36. Liu, X.; Zhao, D.P. Depth-varying azimuthal anisotropy in the Tohoku subduction channel. Earth Planet. Sci. Lett. 2017, 473, 33–43. [Google Scholar] [CrossRef]
  37. Long, M.D. Constraints on subduction geodynamics from seismic anisotropy. Rev. Geophys. 2013, 51, 76–112. [Google Scholar] [CrossRef]
  38. Jung, H. Seismic anisotropy produced by serpentine in mantle wedge. Earth Planet. Sci. Lett. 2011, 307, 535–543. [Google Scholar] [CrossRef]
  39. Katayama, I.; Hirauchi, H.; Michibayashi, K.; Ando, J. Trench-parallel anisotropy produced by serpentine deformation in the hydrated mantle wedge. Nature 2009, 461, 1114–1117. [Google Scholar] [CrossRef] [Green Version]
  40. Nagaya, T.; Walker, A.M.; Wookey, J.; Wallis, S.R.; Ishii, K.; Kendall, J.M. Seismic evidence for flow in the hydrated mantle wedge of the Ryukyu subduction zone. Sci. Rep. 2016, 6, 13. [Google Scholar] [CrossRef] [Green Version]
  41. Kang, H.; Jung, H. Lattice-preferred orientation of amphibole, chlorite, and olivine found in hydrated mantle peridotites from Bjørkedalen, southwestern Norway, and implications for seismic anisotropy. Tectonophysics 2019, 750, 137–152. [Google Scholar] [CrossRef]
  42. Ji, S.C.; Shao, T.B.; Michibayashi, K.; Long, C.X.; Wang, Q.; Kondo, Y.; Zhao, W.H.; Wang, H.C.; Salisbury, M.H. A new calibration of seismic velocities, anisotropy, fabrics, and elastic moduli of amphibole-rich rocks. J. Geophys. Res. Solid Earth 2013, 118, 4699–4728. [Google Scholar] [CrossRef]
  43. Kim, J.; Jung, H. New crystal preferred orientation of amphibole experimentally found in simple shear. Geophys. Res. Lett. 2019, 46, 12996–13005. [Google Scholar] [CrossRef] [Green Version]
  44. Ko, B.; Jung, H. Crystal preferred orientation of an amphibole experimentally deformed by simple shear. Nat. Commun. 2015, 6, 10. [Google Scholar] [CrossRef] [Green Version]
  45. Cao, Y.; Song, S.G.; Su, L.; Jung, H.; Niu, Y.L. Highly refractory peridotites in Songshugou, Qinling orogen: Insights into partial melting and melt/fluid-rock reactions in forearc mantle. Lithos 2016, 252, 234–254. [Google Scholar] [CrossRef]
  46. Evans, B.W. Metamorphism of alpine metaperidotite and serpentinite. Annu. Rev. Earth Planet. Sci. 1977, 5, 397–447. [Google Scholar] [CrossRef]
  47. Austrheim, H. Fluid and deformation induced metamorphic processes around Moho beneath continent collision zones: Examples from the exposed root zone of the Caledonian mountain belt, W-Norway. Tectonophysics 2013, 609, 620–635. [Google Scholar] [CrossRef]
  48. Hacker, B.R.; Andersen, T.B.; Johnston, S.; Kylander-Clark, A.R.C.; Peterman, E.M.; Walsh, E.O.; Young, D. High-temperature deformation during continental-margin subduction & exhumation: The ultrahigh-pressure Western Gneiss Region of Norway. Tectonophysics 2010, 480, 149. [Google Scholar] [CrossRef] [Green Version]
  49. Soper, N.J.; Strachan, R.A.; Holdsworth, R.E.; Gayer, R.A.; Greiling, R.O. Sinistral transpression and the closure of Iapetus. J. Geol. Soc. 1992, 149, 871–880. [Google Scholar] [CrossRef]
  50. Gee, D.G. Tectonic model for central part of Scandinavian Caledonides. Am. J. Sci. 1975, A275, 468–515. [Google Scholar]
  51. Roberts, D. The Scandinavian Caledonides: Event chronology, palaeogeographic settings and likely, modern analogues. Tectonophysics 2003, 365, 283–299. [Google Scholar] [CrossRef]
  52. Beyer, E.E.; Brueckner, H.K.; Griffin, W.L.; O’Reilly, S.Y. Laurentian provenance of archean mantle fragments in the proterozoic baltic crust of the Norwegian Caledonides. J. Petrol. 2012, 53, 1357–1383. [Google Scholar] [CrossRef] [Green Version]
  53. Brueckner, H.K.; Carswell, D.A.; Griffin, W.L.; Medaris, L.G.; Van Roermund, H.L.M.; Cuthbert, S.J. The mantle and crustal evolution of two garnet peridotite suites from the Western Gneiss Region, Norwegian Caledonides: An isotopic investigation. Lithos 2010, 117, 1–19. [Google Scholar] [CrossRef]
  54. Carswell, D.A. The metamorphic evolution of Mg-Cr type Norwegian garnet peridotites. Lithos 1986, 19, 279–297. [Google Scholar] [CrossRef]
  55. Cordellier, F.; Boudier, F.; Boullier, A.M. Structural study of the Almklovdalen peridotite massif (southern-Norway). Tectonophysics 1981, 77, 257–281. [Google Scholar] [CrossRef]
  56. Jamtveit, B.; Carswell, D.A.; Mearns, E.W. Chronology of the high-pressure metamorphism of Norwegian garnet peridotites pyroxenites. J. Metamorph. Geol. 1991, 9, 125–139. [Google Scholar] [CrossRef]
  57. Kylander-Clark, A.R.C.; Hacker, B.R.; Mattinson, J.M. Slow exhumation of UHP terranes: Titanite and rutile ages of the Western Gneiss Region, Norway. Earth Planet. Sci. Lett. 2008, 272, 531–540. [Google Scholar] [CrossRef]
  58. Lapen, T.J.; Medaris, L.G.; Beard, B.L.; Johnson, C.M. The Sandvik peridotite, Gurskoy, Norway: Three billion years of mantle evolution in the Baltica lithosphere. Lithos 2009, 109, 145–154. [Google Scholar] [CrossRef]
  59. Vrijmoed, J.C.; Van Roermund, H.L.M.; Davies, G.R. Evidence for diamond-grade ultra-high pressure metamorphism and fluid interaction in the Svartberget Fe-Ti garnet peridotite-websterite body, Western Gneiss Region, Norway. Mineral. Petrol. 2006, 88, 381–405. [Google Scholar] [CrossRef] [Green Version]
  60. Austrheim, H.; Corfu, F.; Bryhni, I.; Andersen, T.B. The Proterozoic Hustad igneous complex: A low strain enclave with a key to the history of the Western Gneiss Region of Norway. Precambrian Res. 2003, 120, 149–175. [Google Scholar] [CrossRef]
  61. Hacker, B.R. Ascent of the ultrahigh-pressure Western Gneiss Region, Norway. Geol. Soc. Am. Spec. Pap. 2007, 419, 171–184. [Google Scholar] [CrossRef] [Green Version]
  62. Dobrzhinetskaya, L.F.; Eide, E.A.; Larsen, R.B.; Sturt, B.A.; Tronnes, R.G.; Smith, D.C.; Taylor, W.R.; Posukhova, T.V. Microdiamond in high-grade metamorhic rocks of the Western Gneiss Region, Norway. Geology 1995, 23, 597–600. [Google Scholar] [CrossRef]
  63. Root, D.B.; Hacker, B.R.; Gans, P.B.; Ducea, M.N.; Eide, E.A.; Mosenfelder, J.L. Discrete ultrahigh-pressure domains in the Western Gneiss Region, Norway: Implications for formation and exhumation. J. Metamorph. Geol. 2005, 23, 45–61. [Google Scholar] [CrossRef]
  64. Kostenko, O.; Jamtveit, B.; Austrheim, H.; Pollok, K.; Putnis, C. The mechanism of fluid infiltration in peridotites at Almklovdalen, western Norway. Geofluids 2002, 2, 203–215. [Google Scholar] [CrossRef]
  65. O’Neill, H.S.C.; Wall, V.J. The olivine-orthopyroxene-spinel oxygen geobarometer, the nickel precipitation curve, and the oxygen fugacity of the Earth’s upper mantle. J. Petrol. 1987, 28, 1169–1191. [Google Scholar] [CrossRef]
  66. Witteickschen, G.; Seck, H.A. Solubility of Ca and Al in orthopyroxene from spinel peridotite—An improved version of an empirical geothermometer. Contrib. Mineral. Petrol. 1991, 106, 431–439. [Google Scholar] [CrossRef]
  67. O’Neill, H.S.C. The transition between spinel lherzolite and garnet lherzolite, and its use as a geobarometer. Contrib. Mineral. Petrol. 1981, 77, 185–194. [Google Scholar] [CrossRef]
  68. Panozzo, R. Two-dimensional strain from the orientation of lines in a plane. J. Struct. Geol. 1984, 6, 215–221. [Google Scholar] [CrossRef]
  69. Skemer, P.; Katayama, I.; Jiang, Z.; Karato, S. The misorientation index: Development of a new method for calculating the strength of lattice-preferred orientation. Tectonophysics 2005, 411, 157–167. [Google Scholar] [CrossRef]
  70. Bunge, H.-J. Texture Analysis in Materials Science: Mathematical Models; Butterworths: London, UK, 1982. [Google Scholar]
  71. Mainprice, D. A fortran program to calculate seismic anisotropy from the lattice preferred orientation of minerals. Comput. Geosci. 1990, 16, 385–393. [Google Scholar] [CrossRef]
  72. Abramson, E.H.; Brown, J.M.; Slutsky, L.J.; Zaug, J. The elastic constants of San Carlos olivine to 17 GPa. J. Geophys. Res. 1997, 102, 12253–12263. [Google Scholar] [CrossRef]
  73. Brown, J.M.; Abramson, E.H. Elasticity of calcium and calcium-sodium amphiboles. Phys. Earth Planet. Inter. 2016, 261, 161–171. [Google Scholar] [CrossRef]
  74. Bezacier, L.; Reynard, B.; Bass, J.D.; Sanchez-Valle, C.; Van de Moortele, B.V. Elasticity of antigorite, seismic detection of serpentinites, and anisotropy in subduction zones. Earth Planet. Sci. Lett. 2010, 289, 198–208. [Google Scholar] [CrossRef]
  75. Pera, E.; Mainprice, D.; Burlini, L. Anisotropic seismic properties of the upper mantle beneath the Torre Alfina area (Northern Appennines, Central Italy). Tectonophysics 2003, 370, 11–30. [Google Scholar] [CrossRef]
  76. Paterson, M.S. The determination of hydroxyl by infrared-absorption in quartz, silicate-glasses and similar materials. Bull. Mineral. 1982, 105, 20–29. [Google Scholar] [CrossRef]
  77. Jung, H.; Karato, S. Effects of water on dynamically recrystallized grain-size of olivine. J. Struct. Geol. 2001, 23, 1337–1344. [Google Scholar] [CrossRef]
  78. Karato, S. Scanning electron microscope observation of dislocations in olivine. Phys. Chem. Miner. 1987, 14, 245–248. [Google Scholar] [CrossRef]
  79. Kohlstedt, D.L.; Goetze, C.; Durham, W.B.; Vandersande, J. New technique for decorating dislocations in olivine. Science 1976, 191, 1045–1046. [Google Scholar] [CrossRef]
  80. Gifkins, R.C. Optical Microscopy of Metals; Elsevier: New York, NY, USA, 1970. [Google Scholar]
  81. Chatzaras, V.; Kruckenberg, S.C.; Cohen, S.M.; Medaris, L.G.; Withers, A.C.; Bagley, B. Axial-type olivine crystallographic preferred orientations: The effect of strain geometry on mantle texture. J. Geophys. Res. Solid Earth 2016, 121, 4895–4922. [Google Scholar] [CrossRef] [Green Version]
  82. Prelicz, R.M. Seismic Anisotropy in Peridotites from the Western Gneiss Region (Norway) Laboratory Measurements at High PT Conditions and Fabric Based Model Predictions. Ph.D. Thesis, ETH Zürich, Zürich, Switzerland, 2005. [Google Scholar]
  83. Jung, H. Deformation fabrics of olivine in Val Malenco peridotite found in Italy and implications for the seismic anisotropy in the upper mantle. Lithos 2009, 109, 341–349. [Google Scholar] [CrossRef]
  84. Khisina, N.R.; Wirth, R.; Andrut, M.; Ukhanov, A.V. Extinction and intrinsic mode of hydrogen occurrence in natural olivine: FTIR and TEM investigation. Phys. Chem. Miner. 2001, 28, 291–301. [Google Scholar]
  85. Miller, G.H.; Rossman, G.R.; Harlow, G.E. The natural occurrence of hydroxide in olivine. Phys. Chem. Miner. 1987, 14, 461–472. [Google Scholar] [CrossRef]
  86. Hirth, G.; Kohlstedt, D. Rheology of the upper mantle and the mantle wedge: A view from the experimentalists. Geophys. Monogr. 2003, 138, 83–105. [Google Scholar] [CrossRef]
  87. Ashby, M.F.; Verral, R.A. Diffusion accommodated flow and superplasticity. Acta Metall. 1973, 21, 149–163. [Google Scholar] [CrossRef]
  88. Goldsby, D.L.; Kohlstedt, D.L. Superplastic deformation of ice: Experimental observations. J. Geophys. Res. Solid Earth 2001, 106, 11017–11030. [Google Scholar] [CrossRef]
  89. Katayama, I.; Karato, S. Effect of temperature on the B- to C-type olivine fabric transition and implication for flow pattern in subduction zones. Phys. Earth Planet. Inter. 2006, 157, 33–45. [Google Scholar] [CrossRef]
  90. Frese, K.; Trommsdorff, V.; Kunze, K. Olivine 100 normal to foliation: Lattice preferred orientation in prograde garnet peridotite formed at high H2O activity, Cima di Gagnone (Central Alps). Contrib. Mineral. Petrol. 2003, 145, 75–86. [Google Scholar] [CrossRef]
  91. Katayama, I.; Karato, S.; Brandon, M. Evidence of high water content in the deep upper mantle inferred from deformation microstructures. Geology 2005, 33, 613–616. [Google Scholar] [CrossRef]
  92. Jung, H.; Lee, J.; Ko, B.; Jung, S.; Park, M.; Cao, Y.; Song, S.G. Natural type-C olivine fabrics in garnet peridotites in North Qaidam UHP collision belt, NW China. Tectonophysics 2013, 594, 91–102. [Google Scholar] [CrossRef] [Green Version]
  93. Park, M.; Jung, H.; Kil, Y. Petrofabrics of olivine in a rift axis and rift shoulder and their implications for seismic anisotropy beneath the Rio Grande rift. Isl. Arc. 2014, 23, 299–311. [Google Scholar] [CrossRef]
  94. Boneh, Y.; Morales, L.F.G.; Kaminski, E.; Skemer, P. Modeling olivine CPO evolution with complex deformation histories: Implications for the interpretation of seismic anisotropy in the mantle. Geochem. Geophys. Geosyst. 2015, 16, 3436–3455. [Google Scholar] [CrossRef] [Green Version]
  95. Long, M.D.; Silver, P.G. The subduction zone flow field from seismic anisotropy: A global view. Science 2008, 319, 315–318. [Google Scholar] [CrossRef] [PubMed] [Green Version]
  96. Mehl, L.; Hacker, B.R.; Hirth, G.; Kelemen, P.B. Arc-parallel flow within the mantle wedge: Evidence from the accreted Talkeetna arc, south central Alaska. J. Geophys. Res. Solid Earth 2003, 108, 18. [Google Scholar] [CrossRef] [Green Version]
  97. Savage, M.K. Seismic anisotropy and mantle deformation: What have we learned from shear wave splitting? Rev. Geophys. 1999, 37, 65–106. [Google Scholar] [CrossRef]
  98. Smith, G.P.; Wiens, D.A.; Fischer, K.M.; Dorman, L.M.; Webb, S.C.; Hildebrand, J.A. A complex pattern of mantle flow in the Lau backarc. Science 2001, 292, 713–716. [Google Scholar] [CrossRef] [Green Version]
  99. Cao, Y.; Jung, H.; Song, S.G.; Park, M.; Jung, S.; Lee, J. Plastic deformation and seismic properties in fore-arc mantles: A petrofabric analysis of the Yushigou Harzburgites, North Qilian Suture Zone, NW China. J. Petrol. 2015, 56, 1897–1943. [Google Scholar] [CrossRef] [Green Version]
  100. Huang, Z.C.; Zhao, D.P.; Wang, L.S. Shear wave anisotropy in the crust, mantle wedge, and subducting Pacific slab under northeast Japan. Geochem. Geophys. Geosyst. 2011, 12, 17. [Google Scholar] [CrossRef]
  101. Long, M.D.; Wirth, E.A. Mantle flow in subduction systems: The mantle wedge flow field and implications for wedge processes. J. Geophys. Res. Solid Earth 2013, 118, 583–606. [Google Scholar] [CrossRef]
  102. Soto, G.L.; Ni, J.F.; Grand, S.P.; Sandvol, E.; Valenzuela, R.W.; Speziale, M.G.; Gonzalez, J.M.G.; Reyes, T.D. Mantle flow in the Rivera-Cocos subduction zone. Geophys. J. Int. 2009, 179, 1004–1012. [Google Scholar] [CrossRef] [Green Version]
  103. Audet, P.; Bostock, M.G.; Christensen, N.I.; Peacock, S.M. Seismic evidence for overpressured subducted oceanic crust and megathrust fault sealing. Nature 2009, 457, 76–78. [Google Scholar] [CrossRef]
  104. Kim, Y.; Clayton, R.W.; Jackson, J.M. Geometry and seismic properties of the subducting Cocos plate in central Mexico. J. Geophys. Res. Solid Earth 2010, 115, 22. [Google Scholar] [CrossRef] [Green Version]
  105. Kodaira, S.; Iidaka, T.; Kato, A.; Park, J.O.; Iwasaki, T.; Kaneda, Y. High pore fluid pressure may cause silent slip in the Nankai Trough. Science 2004, 304, 1295–1298. [Google Scholar] [CrossRef] [PubMed]
  106. Peacock, S.M.; Christensen, N.I.; Bostock, M.G.; Audet, P. High pore pressures and porosity at 35 km depth in the Cascadia subduction zone. Geology 2011, 39, 471–474. [Google Scholar] [CrossRef]
  107. Shelly, D.R.; Beroza, G.C.; Ide, S.; Nakamula, S. Low-frequency earthquakes in Shikoku, Japan, and their relationship to episodic tremor and slip. Nature 2006, 442, 188–191. [Google Scholar] [CrossRef] [PubMed]
  108. Kim, Y.; Clayton, R.W.; Asimow, P.D.; Jackson, J.M. Generation of talc in the mantle wedge and its role in subduction dynamics in central Mexico. Earth Planet. Sci. Lett. 2013, 384, 81–87. [Google Scholar] [CrossRef]
Figure 1. Simplified geological map and the distribution of peridotite bodies in the Western Gneiss Region, Norway (modified after Austrheim [47], Brueckner etl al. [53], Root et al. [63], and Wang et al. [16]). Samples are from Gusdal quarry in Åheim (larger green circle). The green lines indicate the approximate peak metamorphic temperature [57]. Locations of chlorite peridotite and a garnet peridotite body are marked with a green and red circle, respectively. Two UHP domains, Nordfjord-Stadlandet and Sorøyane, are marked by a dotted blue line.
Minerals 10 00345 g001
Figure 2. Optical photomicrographs of the samples in transmitted light. (A) Representative wide-view images of sample 448. White arrows mark the olivine crystals that show clear subgrain boundaries. Olivine and chlorite grain is indicated as Ol and Chl, respectively. (B) Spinel-rich layer observed in sample 429. Chromite and chlorite grains are indicated as Chr and Chl, respectively. (C) Representative wide-view images of sample 447. White arrows mark the olivine crystals showing clear subgrain boundaries. The yellow arrows mark the location of the tripple junctions. Olivine and chlorite grains are indicated as Ol and Chl, respectively. (D) Tremolite-rich layer observed from sample 443. Tremolite and biotite grains are indicated as Trm and Bt, respectively. (E) Wide view image of sample 447. The yellow rectangle indicates the location of Figure 2F. (F) Four-grain junction is observed in sample 447. The blue arrow marks the location of the four-grain junction.
Minerals 10 00345 g002
Figure 3. Pole figures of the olivine presented in the lower hemisphere using equal-area projection. The white line (S) represents foliation and the red dot (L) represents lineation. A half-scatter width of 20° was used. “N” represents the number of grains. The color-coding indicates the density of the data points. The numbers in the legend correspond to multiples of uniform distribution.
Minerals 10 00345 g003
Figure 4. Pole figures of olivine presented in the lower hemisphere using an equal-area projection obtained from (A) the spinel-rich layer and a spinel-poor layer of sample 429, (B) the tremolite-poor layer and tremolite-rich layer of sample 443, and (C) large grains including the porphyroclasts and recrystallized small grains of sample 448. The pole figure of the tremolite from the tremolite-rich layer of sample 443 is also included in (B). The white line (S) represents foliation and the red dot (L) represents lineation. A half-scatter width of 20° was used. “N” represents the number of grains. The color-coding indicates the density of data points. The numbers in the legend correspond to multiples of uniform distribution.
Minerals 10 00345 g004
Figure 5. Effects of multiple stages of deformation on seismic velocity and anisotropy. LPO data of olivine from 448 large grains and 448 small grains (Figure 4C) was mixed with 6 different mixing ratios: 100:0, 80:20, 40:60, 60:40, 20:80, and 0:100. Seismic velocity and anisotropy are calculated from the mixed LPO data to estimate the effect that the secondary deformation event had on the seismic anisotropy. The P-wave velocity (VP), the amplitude of the shear-wave anisotropy (AVS), and the polarization direction of the faster shear wave (Vs1) are plotted in the lower hemisphere using an equal-area projection. The center of the stereonet corresponds to the direction normal to the foliation (Z), and the east-west direction corresponds to lineation (X).
Minerals 10 00345 g005
Figure 6. (A) Effect of amphibole on seismic velocity and anisotropy. LPO data of the olivine and tremolite in the tremolite-rich layer in sample 443 (Figure 4B) was used. (B) Effect of amphibole and serpentine on seismic velocity and anisotropy. LPO data of the olivine and tremolite in the tremolite-rich layer in sample 443 (Figure 4B) and LPO data of antigorite (VM3) reported by Jung [36] was used. The P-wave velocity (VP), the amplitude of the shear-wave anisotropy (AVS), the polarization direction of the faster shear wave (VS1), and the P- to S-wave velocity ratio (VP/VS) are plotted in the lower hemisphere using an equal-area projection. The x direction and the z direction correspond to the lineation and the direction normal to the foliation, respectively. Ol: olivine, Trm: tremolite, Atg: antigorite.
Minerals 10 00345 g006
Figure 7. A representative unpolarized FTIR spectra of the olivine. (A) FTIR spectrum of olivine in sample 429 without any inclusions or grain boundaries. (B) FTIR spectrum of olivine in sample 447 where hydrous inclusions are found, and the optical micrograph image of the location from which the FTIR spectra are taken. (C) FTIR spectrum of olivine in sample 429 where a hydrous inclusion is found, and optical micrograph image of the location from which the FTIR spectra are taken.
Minerals 10 00345 g007
Figure 8. Backscattered electron images showing dislocation microstructures of olivine from (A) sample 426, (B) sample 429, (C) sample 447, and (D) sample 448. Dislocations are shown as white dots and lines.
Minerals 10 00345 g008
Figure 9. Schematic diagram of the proposed olivine fabrics in the mantle wedge of a cold subduction zone. Hydrous minerals: serpentine, chlorite, tremolite, etc. S.A.: Seismic anisotropy.
Minerals 10 00345 g009
Table 1. The lattice-preferred orientations (LPO), water content, and fabric strength of olivine.
SampleLPO Type
of Olivine
Water Content of Olivine 1
(ppm H/Si)
Average Grain
Size 2 (mm)
M-Index 3J-Index 4
426 A + B-type500 ± 500.480.092.98
429Spinel-richB + C-type320 ± 500.360.052.00
Spinel-poorB-type0.320.082.86
443Tremolite-richB-type230 ± 500.350.05
0.13 *
2.34
5.89 *
Tremolite-poorA-type0.70.082.66
445 B + C-type500 ± 500.510.051.89
446 B-type310 ± 500.460.093.61
447 B-type430 ± 500.380.194.55
448Large grainA-type300 ± 501.20.13.25
Small grainB-type0.350.084.46
1 Water content of olivine was measured from the inclusion-free area. Paterson calibration was used to calculate water content [76]. 2 Average grain size was measured using the linear intercept method [80]. 3 Fabric strength of the LPO of olivine calculated using the M-index [69]. 4 Fabric strength of the LPO of olivine calculated using the J-index [70]. * Fabric strength of the LPO of tremolite.
Table 2. The chemical compositions of the representative minerals in the specimen.
Sample447448
Mineralol-1ol-2opx-1amp-1bt-1ol-1ol-2opx-1chl-1sp-1
SiO241.1041.6157.8556.3342.6841.4941.6058.2231.330.00
TiO20.030.010.000.010.060.010.010.000.020.01
Al2O30.010.000.101.1012.180.000.000.0813.363.03
Cr2O30.020.010.020.250.680.010.000.013.7958.98
FeO6.176.174.471.461.776.306.464.141.9325.70
MnO0.090.080.130.060.000.070.120.140.020.49
MgO51.3951.4336.1123.6927.0651.7951.9336.8434.535.85
CaO0.010.020.1212.740.240.000.000.080.010.01
Na2O0.000.000.000.531.090.000.000.010.000.00
K2O0.000.000.000.096.930.000.000.010.000.00
NiO0.400.410.080.000.180.320.400.110.000.03
Total99.2199.7598.8896.2692.8699.99100.5299.6284.9794.10
wt. % oxides, ol: olivine, opx: orthopyroxene, amp: amphibole, bt: bitotite, chl: chlorite, sp: spinel.
Table 3. Estimated seismic anisotropy and the thickness of the anisotropic layer for the given delay time calculated from the LPOs of the olivine, amphibole, and serpentine.
The Mixing Ratio of
448 Large Grain and
448 Small Grain
Horizontal AVS (%) 1<VS> (km/s) 1The Thickness of Anisotropic Layer for the
Given Delay Time Calculated from the
Seismic Anisotropy (km)
dt = 0.1 sdt = 0.2 sdt = 0.3 s
100:01.84.780275380
80:201.44.7853468103
60:401.54.790326496
40:601.84.790275380
20:802.44.795204060
0:1003.14.800153146
Mineral Assemblage
Olivine (443) 21.44.8133469103
Olivine + tremolite 2
(70%) (30%)
1.74.665275582
Olivine + tremolite 2
(50%) (50%)
2.54.595183755
Tremolite (443) 25.54.34081624
Antigorite (VM3) 3 [38]1.63.735234770
Tremolite (443) 36.03.97571320
Ol + Atg + Trm 3
(50%) (25%) (25%)
3.24.450142842
1 Horizontal AVS and <VS> were determined at the center of the stereonet (vertical S-wave propagation direction; Figure 5; Figure 6); 2 The LPO data was rotated with a dipping angle of 45° to simulate the effect of flow dipping along the subducting slab; 3 The LPO data was rotated with a dipping angle of 55° to simulate the effect of flow dipping along the subducting slab; AVs: anisotropy of S-wave velocity, <Vs>: the average velocity of the fast and slow shear waves (VS1 and VS2), dt: delay time of S-wave, Ol; olivine, Atg: antigorite, Trm: tremolite.

