Article

Seismic Properties of a Unique Olivine-Rich Eclogite in the Western Gneiss Region, Norway

1
State Key Laboratory of Geological Processes and Mineral Resources, School of Earth Sciences, China University of Geosciences, Wuhan 430074, China
2
Tectonophysics Laboratory, School of Earth and Environmental Sciences, Seoul National University, Seoul 08826, Korea
*
Author to whom correspondence should be addressed.
Minerals 2020, 10(9), 774; https://doi.org/10.3390/min10090774
Submission received: 24 July 2020 / Revised: 22 August 2020 / Accepted: 29 August 2020 / Published: 31 August 2020

Abstract

:
Investigating the seismic properties of natural eclogite is crucial for identifying the composition, density, and mechanical structure of the Earth’s deep crust and mantle. For this purpose, numerous studies have addressed the seismic properties of various types of eclogite, except for a rare eclogite type that contains abundant olivine and orthopyroxene. In this contribution, we calculated the ambient-condition seismic velocities and seismic anisotropies of this eclogite type using an olivine-rich eclogite from northwestern Flemsøya in the Nordøyane ultrahigh-pressure (UHP) domain of the Western Gneiss Region in Norway. Detailed analyses of the seismic properties data suggest that patterns of seismic anisotropy of the Flem eclogite were largely controlled by the strength of the crystal-preferred orientation (CPO) and characterized by significant destructive effects of the CPO interactions, which together, resulted in very weak bulk rock seismic anisotropies (AVp = 1.0–2.5%, max. AVs = 0.6–2.0%). The magnitudes of the seismic anisotropies of the Flem eclogite were similar to those of dry eclogite but much lower than those of gabbro, peridotite, hydrous-phase-bearing eclogite, and blueschist. Furthermore, we found that amphibole CPOs were the main contributors to the higher seismic anisotropies in some amphibole-rich samples. The average seismic velocities of Flem eclogite were greatly affected by the relative volume proportions of omphacite and amphibole. The Vp (8.00–8.33 km/s) and Vs (4.55–4.72 km/s) were remarkably larger than the hydrous-phase-bearing eclogite, blueschist, and gabbro, but lower than dry eclogite and peridotite. The Vp/Vs ratio was almost constant (avg. ≈ 1.765) among Flem eclogite, slightly larger than olivine-free dry eclogite, but similar to peridotite, indicating that an abundance of olivine is the source of their high Vp/Vs ratios. The Vp/Vs ratios of Flem eclogite were also higher than other (non-)retrograded eclogite and significantly lower than those of gabbro. The seismic features derived from the Flem eclogite can thus be used to distinguish olivine-rich eclogite from other common rock types (especially gabbro) in the deep continental crust or subduction channel when high-resolution seismic wave data are available.

1. Introduction

Eclogite is a unique high-pressure to ultrahigh-pressure (HP–UHP) metamorphic rock that commonly originates from the subduction of an oceanic or continental crust or derives from the thickening of an orogenic crust during a continental collision [1,2,3,4]. A typical eclogite consists of a mainly bi-mineralic assemblage (i.e., garnet and omphacite), which is metamorphosed from mafic components, such as gabbro, diabase, and basalt [4]. Hydrous minerals, such as amphibole (e.g., glaucophane and hornblende), epidote, lawsonite, and mica (e.g., phengite and biotite) are also common in the eclogite and indicate different equilibrated pressure–temperature (P–T) conditions and hydrous states of the eclogite facies’ metamorphisms [5,6,7]. Magnesium-rich minerals, such as olivine and orthopyroxene, can also be sporadically abundant in the eclogite when its protolith is rich in olivine (i.e., olivine gabbro or troctolite) [8].
Investigating the seismic properties (i.e., P- and S-wave velocities and their anisotropies) of eclogite is crucial for constraining the presence of eclogite in the deep crust and upper mantle, which has profound implications for interpreting the composition, density, and thermal and mechanical structures of the subducted crust, continental lithosphere, and upper mantle, as well as for reconstructing the geodynamic evolutions of the subduction and collision zones [9,10,11,12,13,14,15,16,17,18,19]. For this purpose, numerous previous studies have addressed the seismic properties of dry eclogite (i.e., bi-mineralic eclogite), e.g., [20,21,22,23,24,25,26,27]; retrograded eclogite (i.e., amphibolized eclogite), e.g., [16,19,23,28,29,30,31]; epidote/glaucophane eclogite [12,14,28]; lawsonite eclogite [13,32]. However, because of the sample rarity, the seismic properties of the olivine and orthopyroxene rich eclogite have not been studied yet.
The eclogite in the Flem Gabbro from Flemsøya in the Western Gneiss Region (WGR), Norway, is exceptional due to its peculiar mineral assemblage of olivine and orthopyroxene, which were inherited from an olivine gabbro protolith [8,33]. This eclogite body may once have been situated in a continental subduction channel (the interface between the subducted slab and the wedge of an overlying crust and mantle) or a continental root zone (around Moho) owing to continental subduction and collision [2]. In this context, it can provide a valuable opportunity to examine the seismic properties of this rare type of eclogite and its implications for the detectability of eclogite bodies in the deep crust.

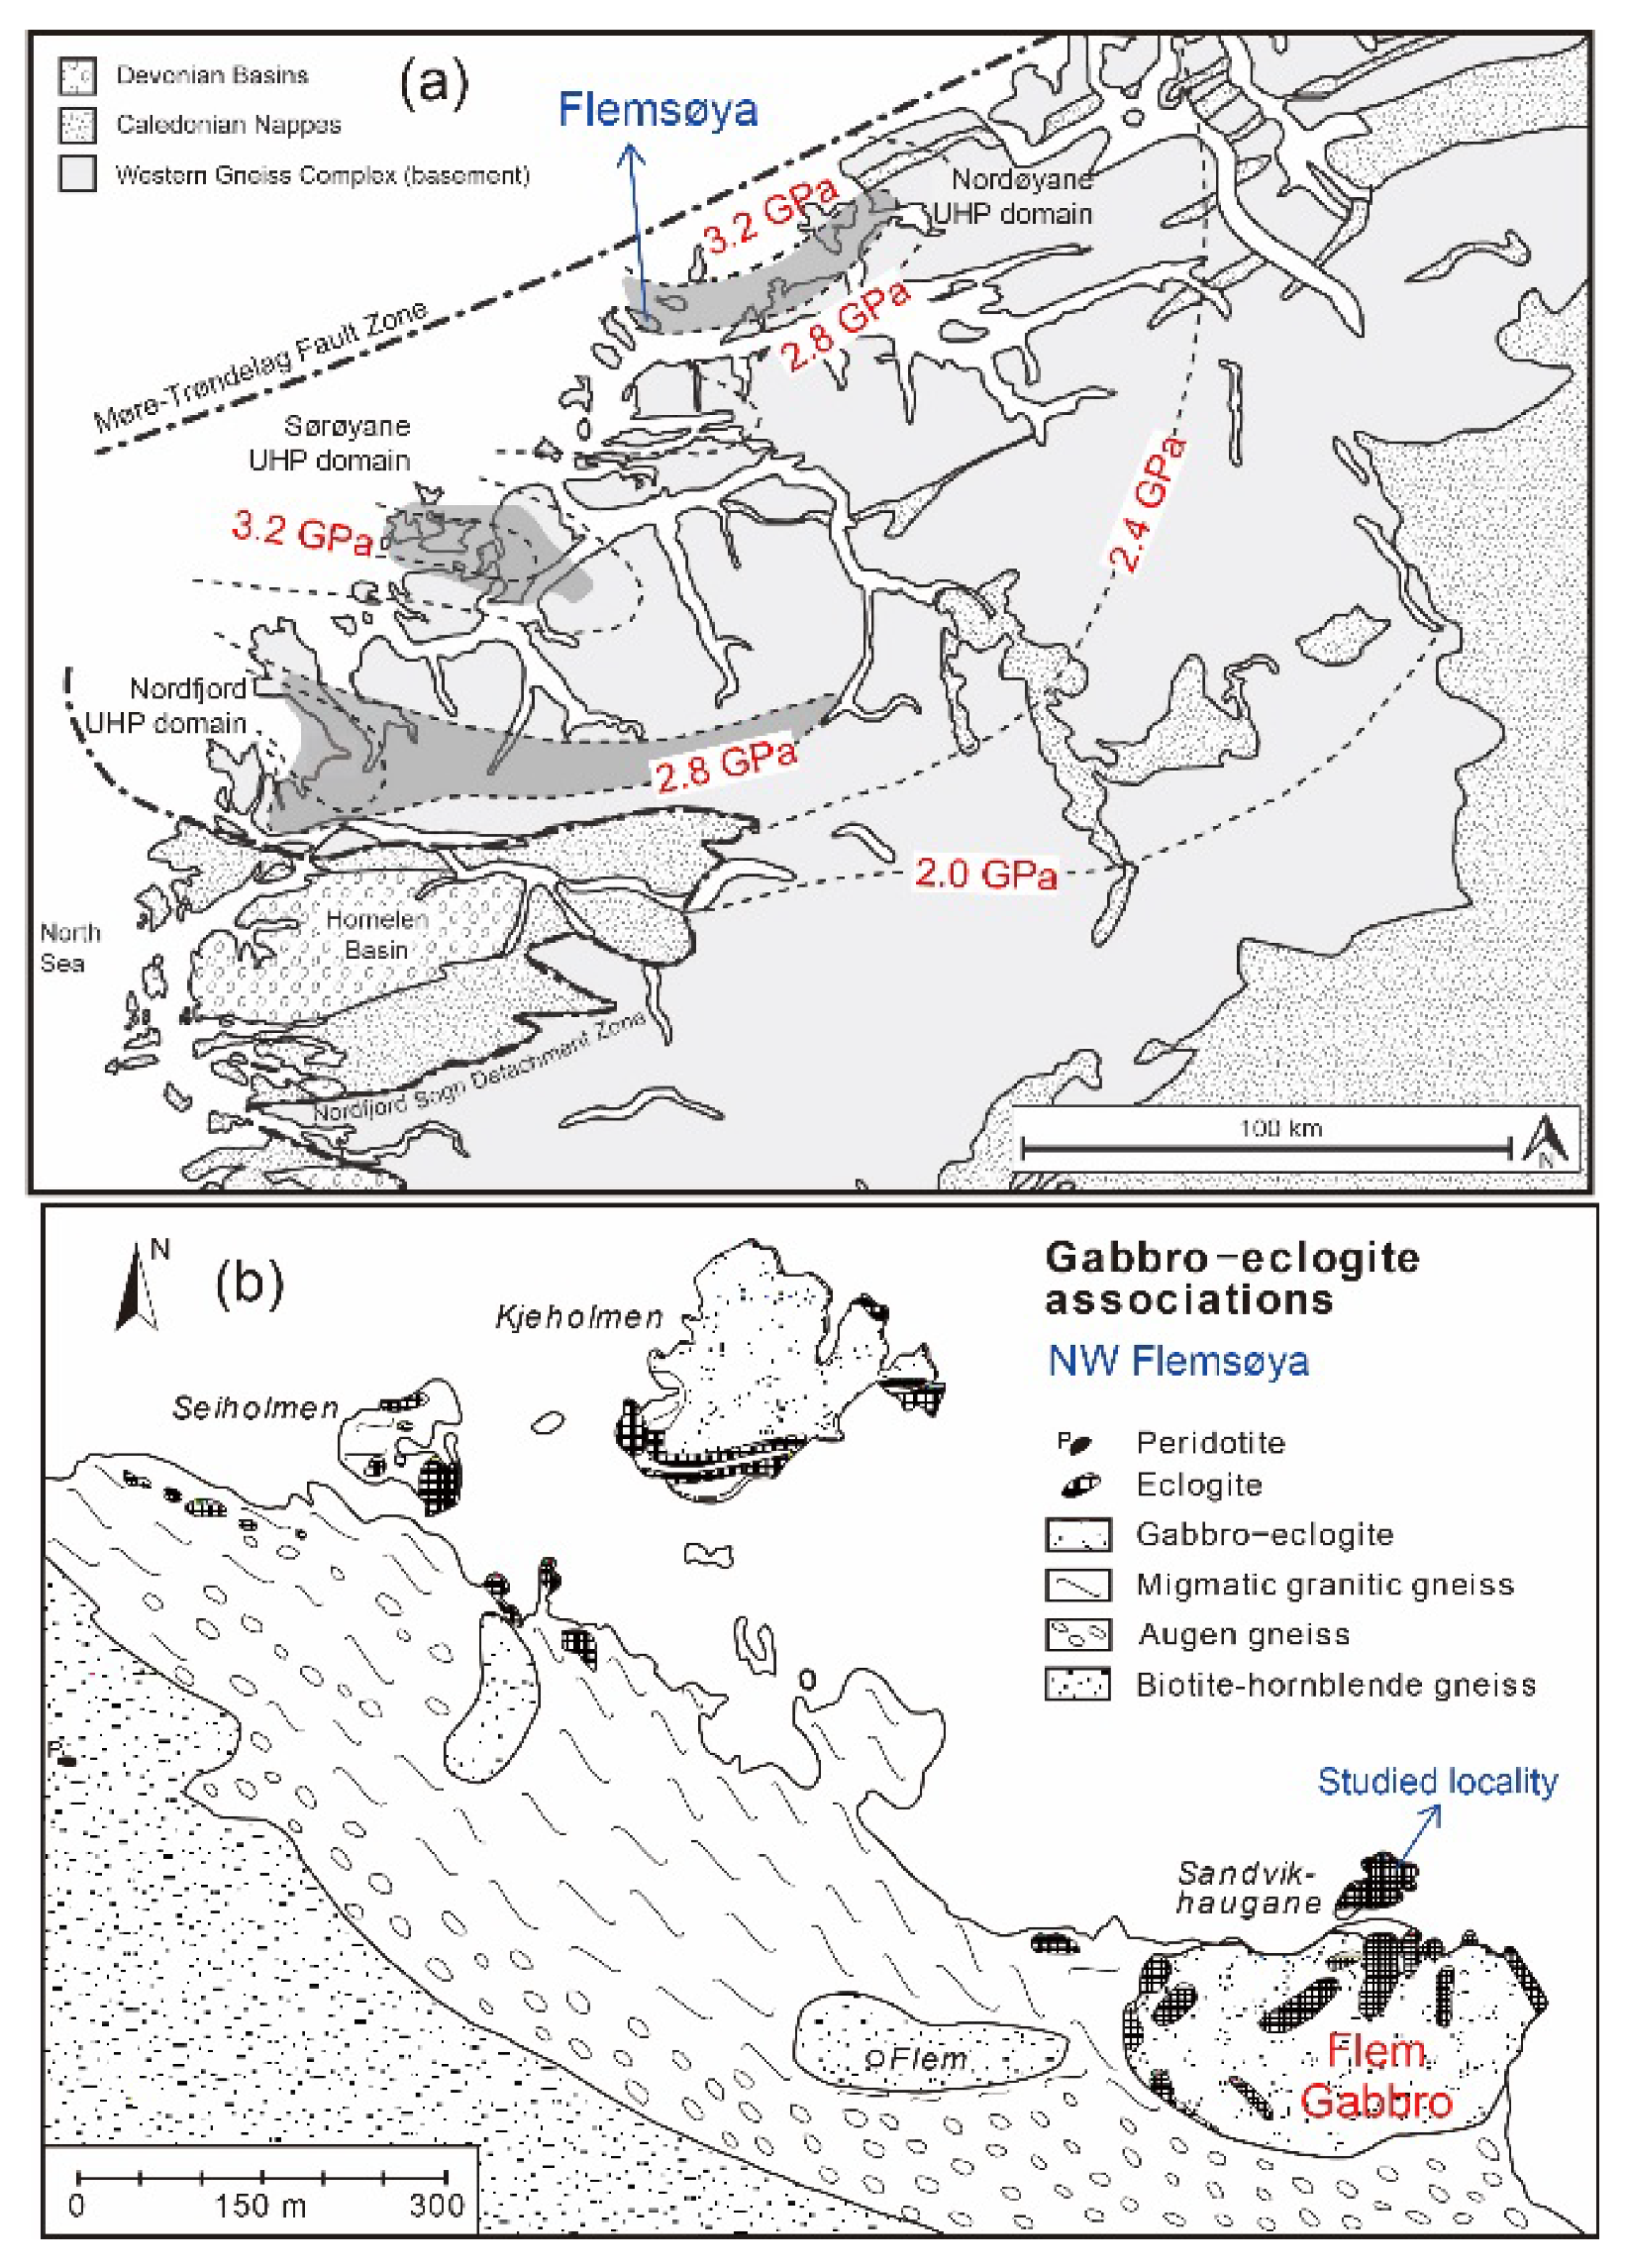
2. Geological Background

The Western Gneiss Region (WGR) in Norway is one of the largest, best-exposed, and most studied HP–UHP terranes in the world. It resulted from the deep subduction of the Baltica basement and subsequent collision with the Laurentia continent ≈425–400 Ma [34,35,36,37,38]. The peak metamorphic pressure and temperature (P–T) conditions increase from SE to NW with the highest P–T estimates preserved in three UHP domains (Nordfjord, Sørøyane, and Nordøyane) along the west Norwegian coast (Figure 1a). The Flemsøya is located in the Nordøyane UHP domain, which has the highest peak P–T condition (>800 °C and 3.0–4.0 GPa; see Terry et al. [39], Carswell et al. [40], and Butler et al. [41]) among the three UHP domains. The eclogite samples analyzed in this study were collected from northwestern Flemsøya in the Nordøyane UHP domain (Figure 1b). The Flem Gabbro (or Sandvikhaugane Gabbro) is the largest gabbro block that experienced heterogeneous eclogitization [33]. The studied eclogite (named as Flem eclogite hereafter) is located in the northernmost margin of the Flem gabbro. It is almost completely eclogitized and features variously deformed structures (massive and foliated structures) in the outcrop [42]. Our recent petrological work proposed that the Flem eclogite experienced UHP metamorphism at ≈2.7–3.7 GPa and ≈700–820 °C, in accordance with the previous P–T estimates in the Nordøyane UHP domain [42].

3. Samples and Methods

3.1. Sample Descriptions

Based on the field occurrences and deformation microstructures, the Flem eclogite could be divided into massive eclogite (MEC) and foliated eclogite (FEC). In the hand specimen, MEC hardly shows discernable foliation and lineation, whereas FEC developed these structural frameworks conspicuously. The MEC was mainly composed of olivine (Ol), garnet (Grt), omphacite (Omp), orthopyroxene (Opx), phlogopite (Phl), ilmenite (Ilm), amphibole (Amp), minor spinel (Sp), and plagioclase (Pl) (Table 1). The Ol crystals were mostly (sub)euhedral and often rimmed with small Opx and Omp grains (Figure 2a). The Ol crystals lacked a shape-preferred orientation (SPO) and presented as an irregularly shaped Grt matrix (Figure 2a). In contrast, the FEC often displayed a pronounced foliation characterized by mineral layering, Grt bands, and elongated Ol porphyroclasts (Figure 2b). The mineral assemblage of FEC was similar to but had relatively higher proportions of Omp, Grt, and Amp, but lower Ol content, than the MEC (Table 1).

3.2. Crystal-Preferred Orientation (CPO) Measurement and Analysis

The CPOs of the Flem eclogite were measured by investigating finely polished thin sections using an electron backscatter diffraction (EBSD) system. The thin sections, parallel to the lineation and perpendicular to the foliation (i.e., XZ plane), were used for the FEC, whereas the thin sections, parallel to the foliation of the neighboring FEC in the outcrop (named the apparent XY plane or X’Y’ plane), were used for the MEC owing to its vague foliation and lineation. The EBSD system we used was installed in a Quanta 450 Field Emission Scanning Electron Microscope (FESEM) at the State Key Laboratory of Geological Processes and Mineral Resources in the China University of Geosciences (Wuhan), China. The operational settings of the EBSD system were: an acceleration voltage of 20 kV, a working distance of 25 mm, and a spot size of 60 in a low-vacuum mode. The CPOs were presented in the pole figures with marked foliation and/or lineation, and their strengths were quantified using the J-index (ranging from 1 to infinity; see [44]) and the M-index (ranging from 0 to 1; see [45]). The CPO analyses were completed using the MTEX toolbox (ver. 5.2.beta2) in MATLAB (ver. 2017b) (http://mtex-toolbox.github.io/) [46,47]. More details about the EBSD measurement and data treatment of studied samples are available in Cao et al. [42].

3.3. Seismic Property Calculation

To calculate the seismic property (velocity and anisotropy) of the MEC and FEC, the elastic stiffness, CPOs, densities, and volume proportions of their constituent minerals are required before inserting them into the Christoffel equation to solve for the seismic velocities (i.e., Vp, Vs1, and Vs2) along every direction in 3D space [48]. The volume proportions of the constituent minerals were obtained directly from the EBSD phase maps (Table 1). The densities of the bulk rock were averaged from the densities of each mineral weighted by their volume proportions. The elastic stiffness of the single-crystal (Cij) Amp (kataphorite), Opx (enstatite80), Phl, Pl (albite), and Sp were adopted from Brown and Abramson [49], Webb and Jackson [50], Alexandrov and Ryzhova [51], Brown et al. [52], and Duan et al. [53], respectively. Because Omp in MEC and FEC has the composition of Jd20-40Di50-75 [42], the (Cij) of the Omp that has a similar composition (Jd30Di70) recently reported by Hao et al. [54] is used. The elastic stiffness of single-crystal Ol (avg. Fo# ≈ 68) was estimated using the (Cij) of their forsterite [55] and fayalite [56] endmembers, which were linearly averaged by their molar proportions. Likewise, the elastic stiffness of single-crystal Grt (Grs10–15, Prp40–45, and Alm+Sps45) was calculated using the (Cij) of grossular [57], pyrope [58], and alamdine-spessartite [59] endmembers. Since the single-crystal elastic stiffness of ilmenite (FeTiO3) was not reported, we constructed a fictive isotropic tensor using the bulk and shear modulus of ilmenite (MgTiO3) [60]. A list of single-crystal elastic stiffness tensors for common minerals was recently provided by Almqvist and Mainprice [61]. The elastic stiffness tensors <Cij> of mono-mineralic polycrystal and bulk rock were calculated by integrating the elastic stiffness tensor (Cij) of all grains (and phases) over their individual orientations using the Vogit-Reuss-Hill (VRH) averaging scheme. In this study, the calculation was accomplished using the MTEX toolbox (ver. 5.2.beta2) in MATLAB (ver. 2017b) [47,62]. Since this calculation method yields seismic velocities along discrete orientations in 3D space, we could derive the average Vp and Vs by simply averaging their maximum and minimum values (Table 2).
To understand the contributions of different mineral phases and/or their CPOs to the bulk rock seismic properties, we also calculated the seismic properties of major mono-mineralic aggregates (e.g., olivine, orthopyroxene, garnet, omphacite, and amphibole). These results were compared with the seismic properties of bulk rock, providing a straightforward approach to characterizing the constructive and destructive effects among different mineral aggregates.

4. Results

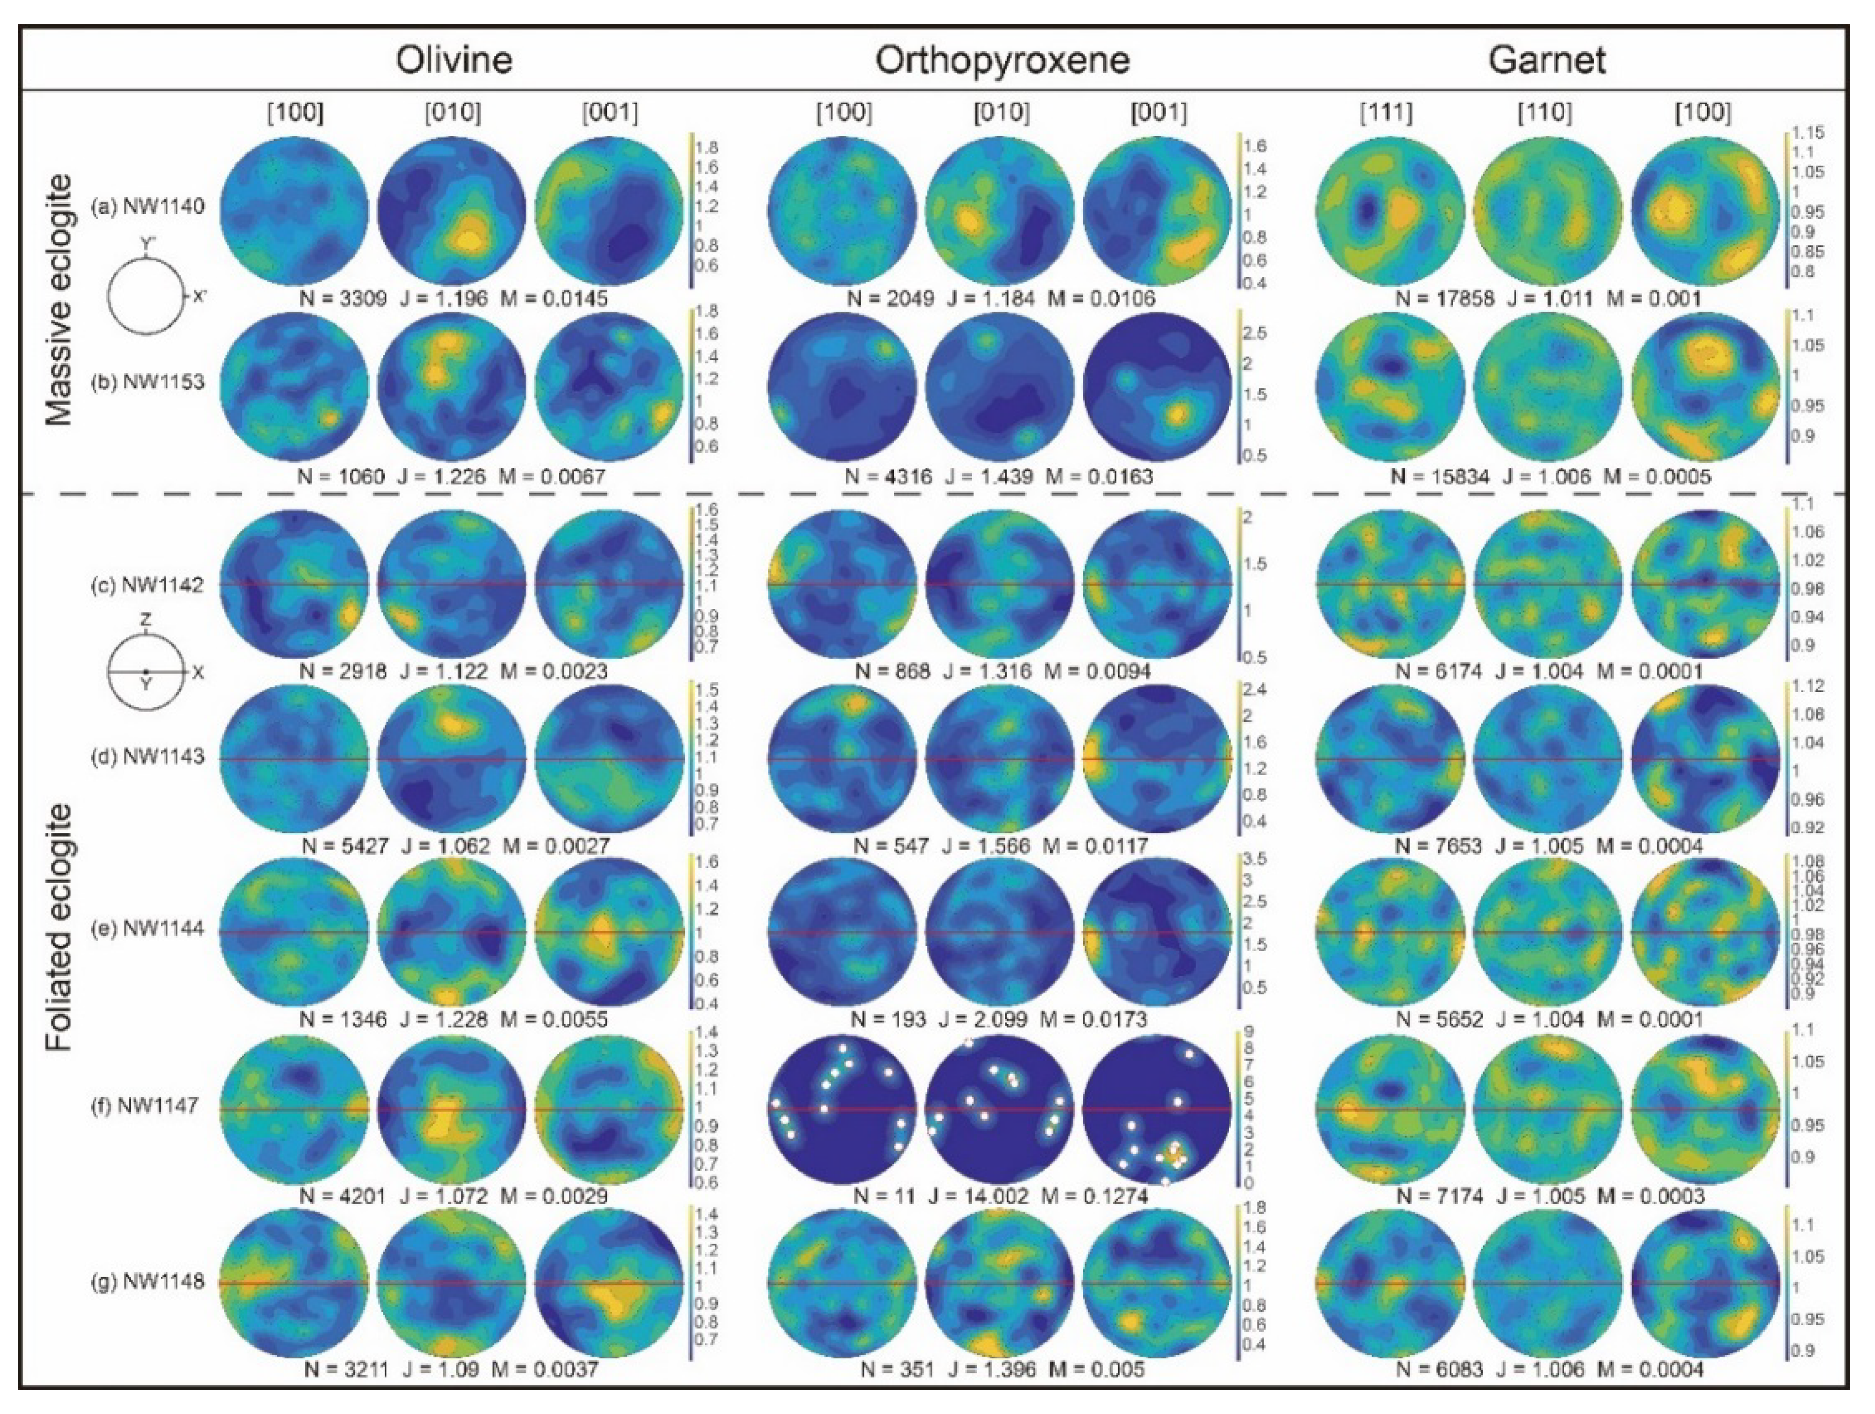
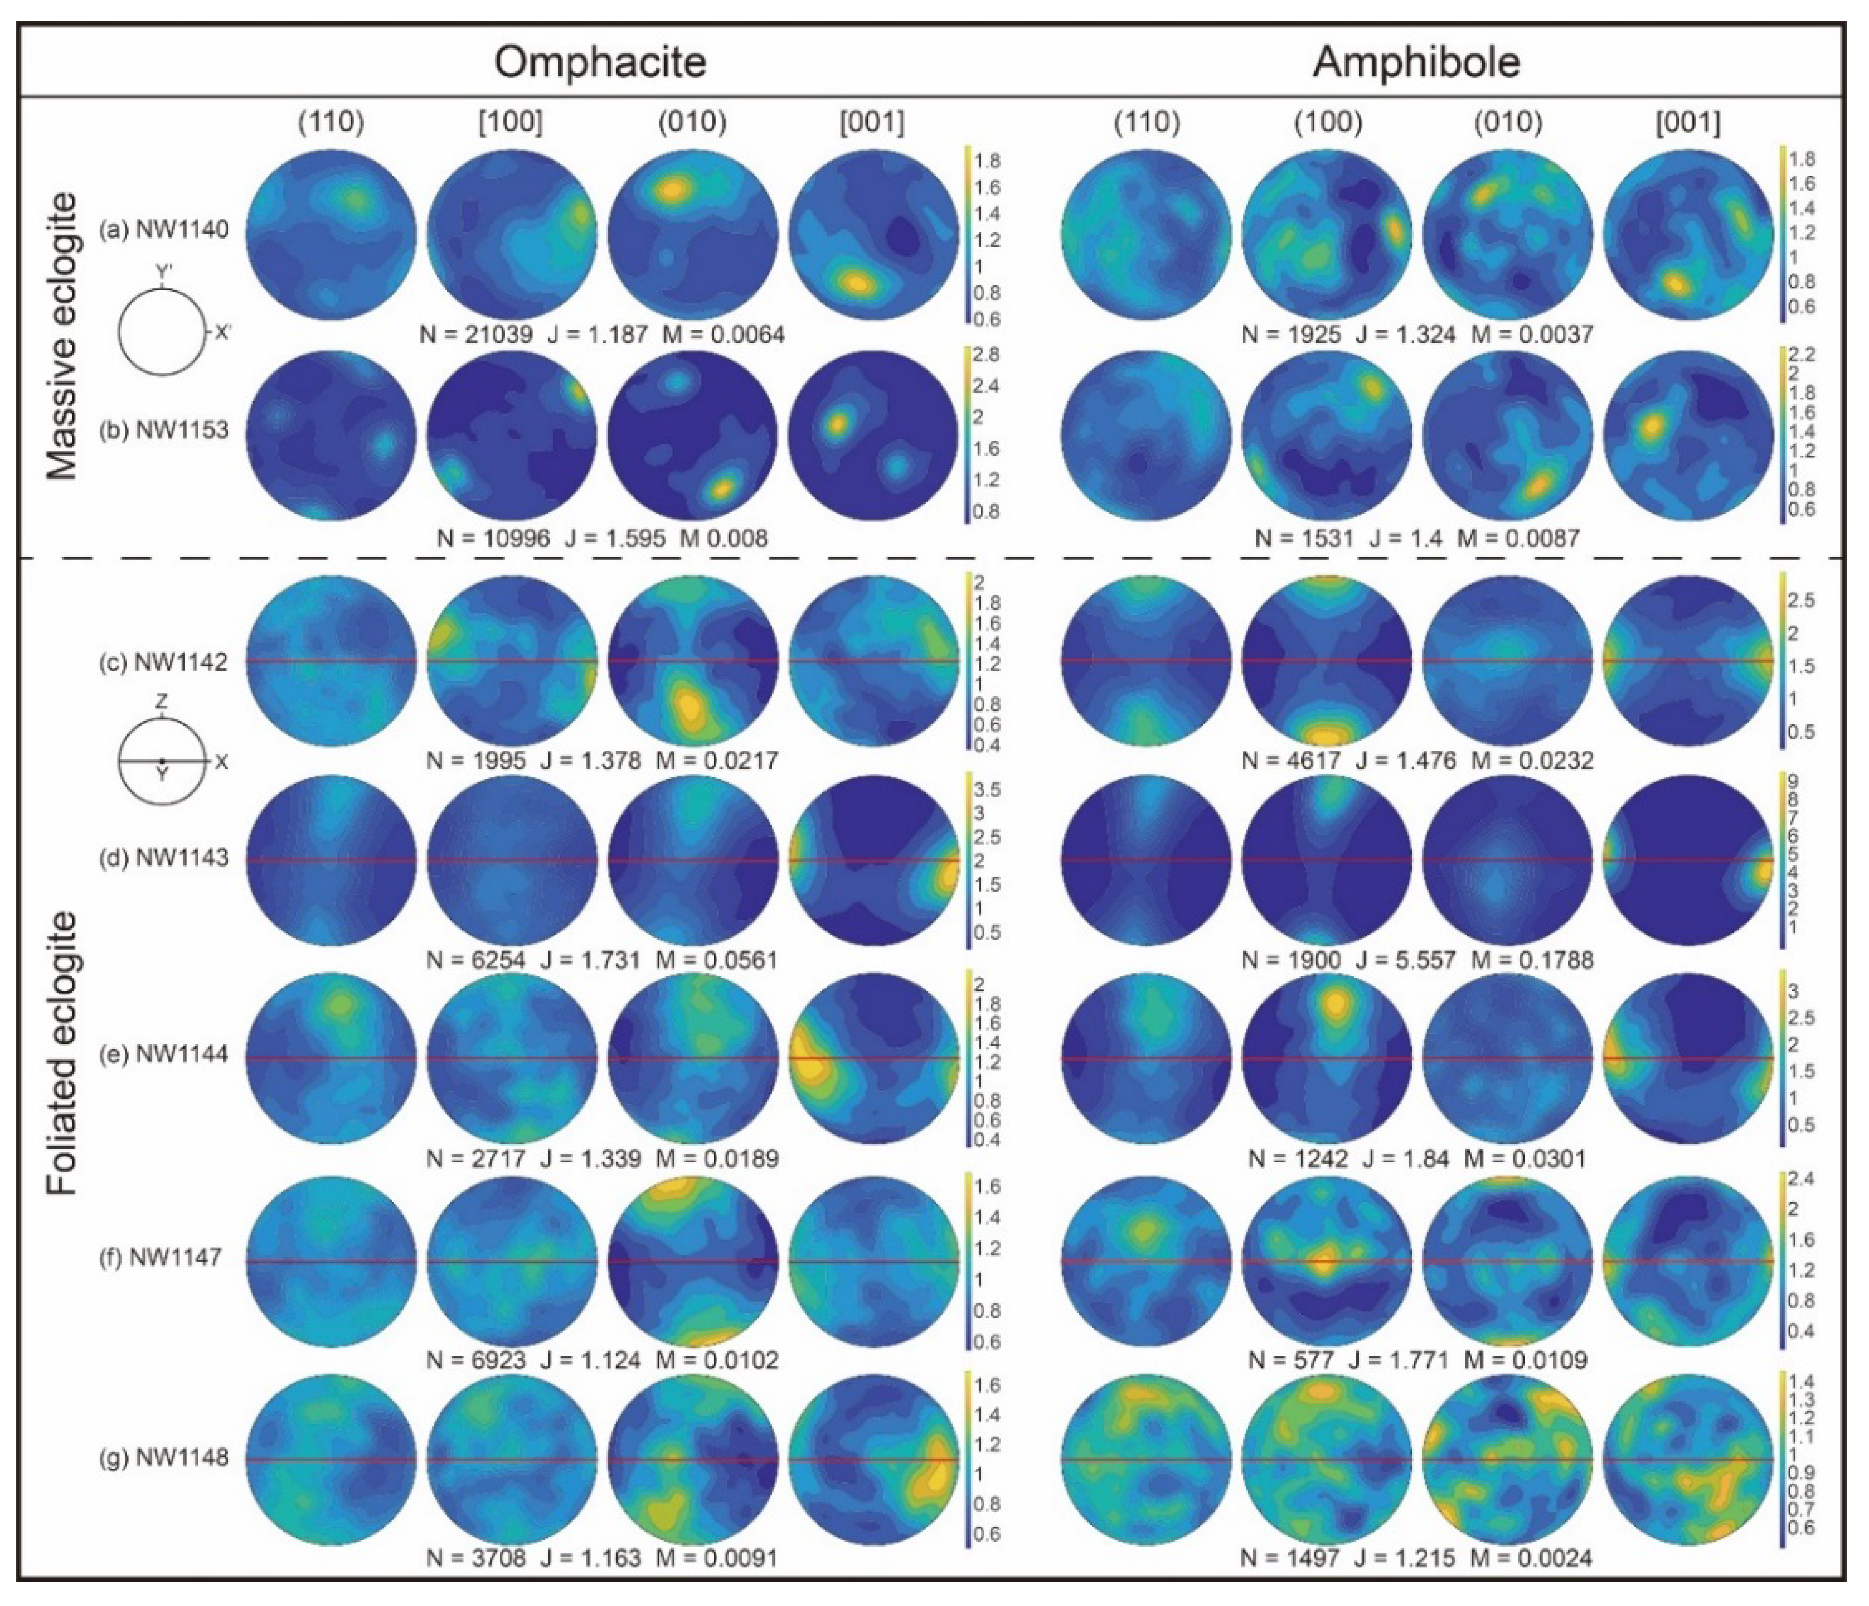
4.1. Crystal-Preferred Orientation

Both MEC and FEC exhibited obvious but weak CPOs for most of their constituent minerals (Figure 3 and Figure 4). Notably, in most FEC samples, Opx, Omp, and Amp tended to align the maximum of their [001] axes subparallel to the lineation and the maximum of the [010] or [100] axes sub-perpendicular to the foliation (Figure 3 and Figure 4). These CPO patterns are common and are also observed in many other deformed Opx, Omp, and Amp bearing rocks. The weak CPO strengths agreed with their fairly low J- (<2.5) and M-indices (<0.06). For more details of the EBSD analytical method, descriptions of the microstructures and CPOs in the studied MEC and FEC samples, readers are referred to Cao et al. [42].

4.2. Seismic Properties

4.2.1. Olivine Polycrystals

The Ol polycrystals in the MEC showed the maxima of Vp at low angles to the apparent foliation, subparallel either to the X’ or Y’ direction, while the Vp was low when a seismic ray propagated at moderate to high angles to the apparent foliation (Figure S1a,b). The degree of shear wave splitting or S-wave polarization anisotropy and velocities of the fast shear wave (Vs1) displayed no regular patterns among MEC samples. In the FEC, the Vp, AVs, and Vs1 all lacked consistent distributions between the samples (Figure S1c–g). Regardless of the MEC and FEC samples, both the fast P-wave and the polarization direction of the fast shear wave (S1) tended to align parallel to the maxima of the [100] axes of the Ol CPOs (Figure 3). Notably, the P-wave anisotropy (AVp) and maximum polarization anisotropy of the S-wave (max. AVs) were higher in the MEC (AVp = 2.04–3.42%, max. AVs = 1.69–2.53%) than the FEC (AVp = 0.86–1.65%, max. AVs = 0.84–1.28%), which is in agreement with the stronger Ol CPO strength in the MEC than the FEC (Figure 3).

4.2.2. Orthopyroxene Polycrystals

The Vp, AVs, and Vs1 patterns of Opx polycrystals were irregular in the MEC, but they were more consistent in the FEC (Figure S2). Except for one FEC sample (Figure S2f), the max. Vp was aligned subparallel to the lineation and the low Vp tended to distribute in a girdle perpendicular to the lineation with their minima mostly subnormal to the foliation (Figure S2c–e,g). Despite the lack of consistency in the distributions of AVs and Vs1 in the FEC, the fast S-wave always tended to polarize parallel to the lineation just like the fast P-wave (Figure S2c–g). The magnitudes of the AVp and max. AVs were low and varied in similar ranges for both the MEC (AVp = 1.30%, max. AVs = 1.20–1.72%) and FEC (AVp = 0.84–1.52%, max. AVs = 0.82–1.70%).

4.2.3. Garnet Polycrystals

In both the MEC and FEC, the Grt polycrystals displayed orthogonal patterns for the max. and min. Vp (Figure S3). The max. Vp mainly corresponded to the <100> axes in the Grt CPO (Figure 3), which were the fastest P-wave directions for the Grt single crystal. The AVs and Vs1 also displayed some regular clustering and girdling without consistent spatial correlation with the foliation and lineation. The AVp and max. AVs were very low in both the MEC (AVp = 0.03–0.04%, max. AVs = 0.06–0.09%) and FEC (AVp = 0.01–0.03%, max. AVs = 0.03–0.05%).

4.2.4. Omphacite Polycrystals

The Omp polycrystals exhibited disparate and irregular Vp, AVs, and Vs1 patterns in the MEC, whereas they were more consistent and regular in the FEC (Figure S4). Specifically, the max. Vp was always subparallel to the lineation, complying with the maxima of the Omp [001] axes in the FEC (Figure 4). In contrast, the slow P-wave was perpendicular to the lineation with minima mainly at high angles to the foliation, matching the distribution of the Omp [010] pole (Figure 4). The fast S-wave tended to polarize subparallel to the lineation when the seismic ray traveled at high angles to the lineation. The intensities of the AVp and max. AVs were also larger in the MEC (AVp = 3.09–4.98%, max. AVs = 2.09–5.29%) than in the FEC (AVp = 1.87–2.69%, max. AVs = 0.83–2.12%).

4.2.5. Amphibole Polycrystals
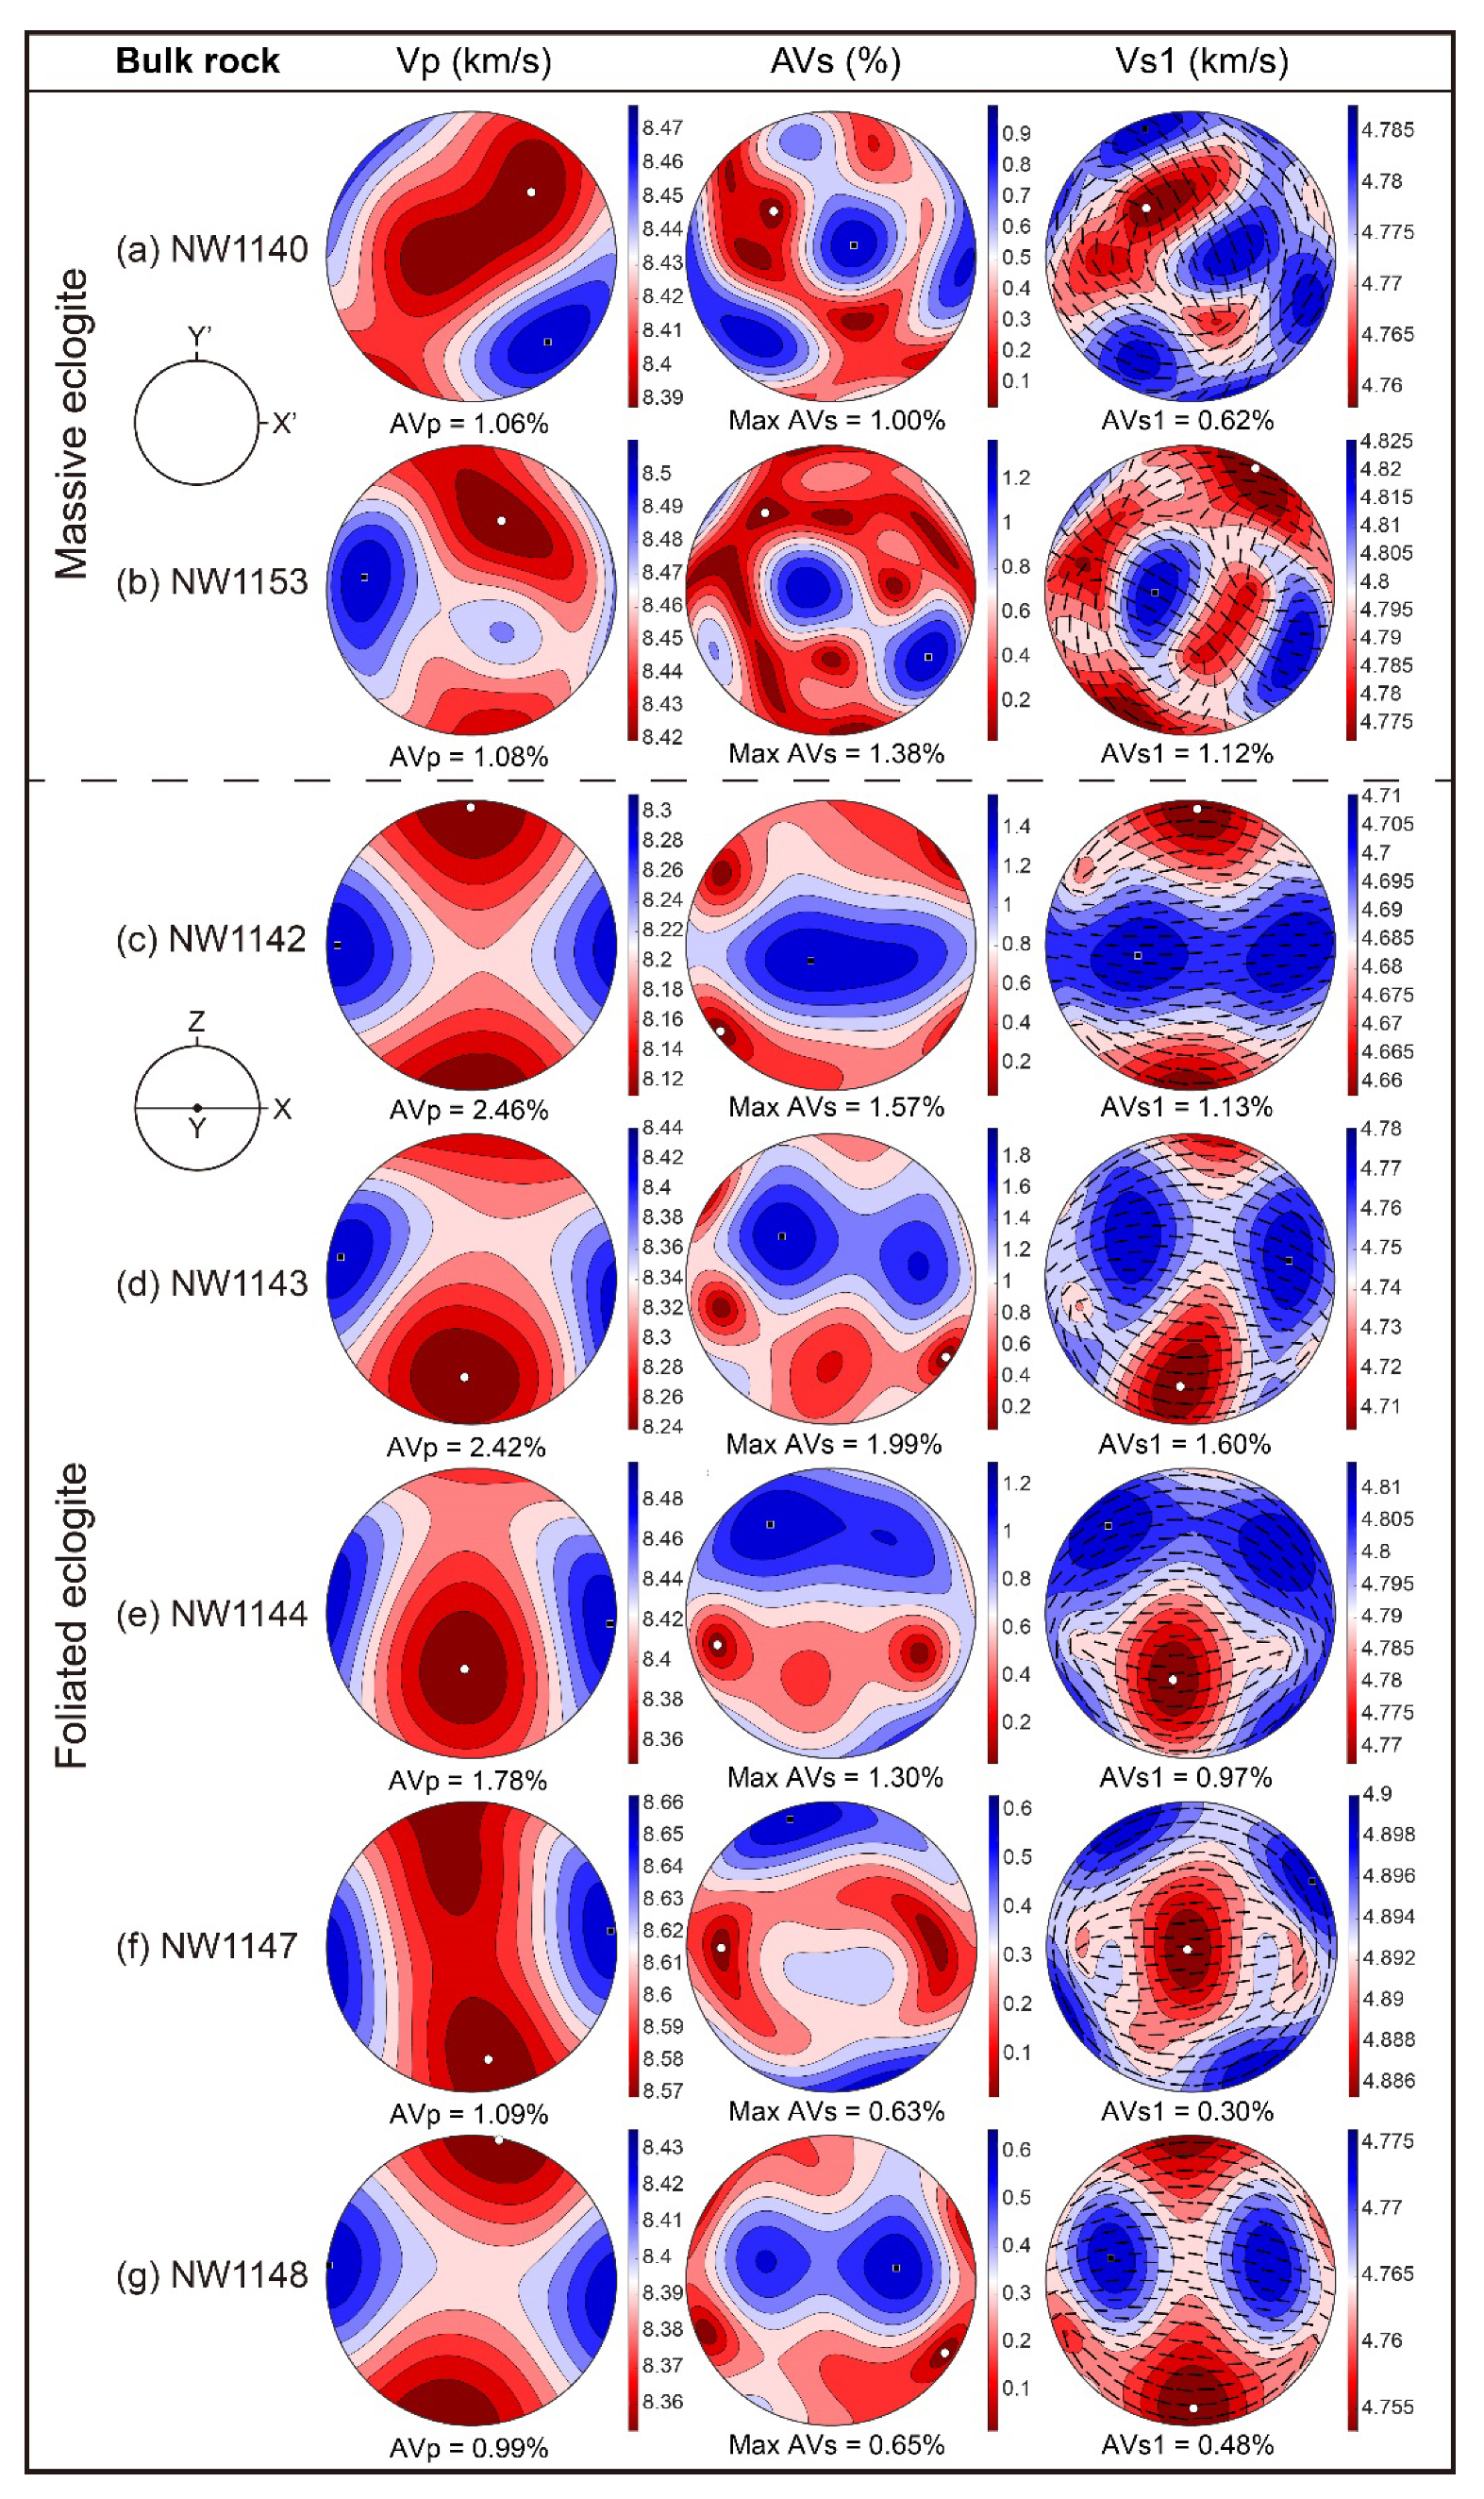
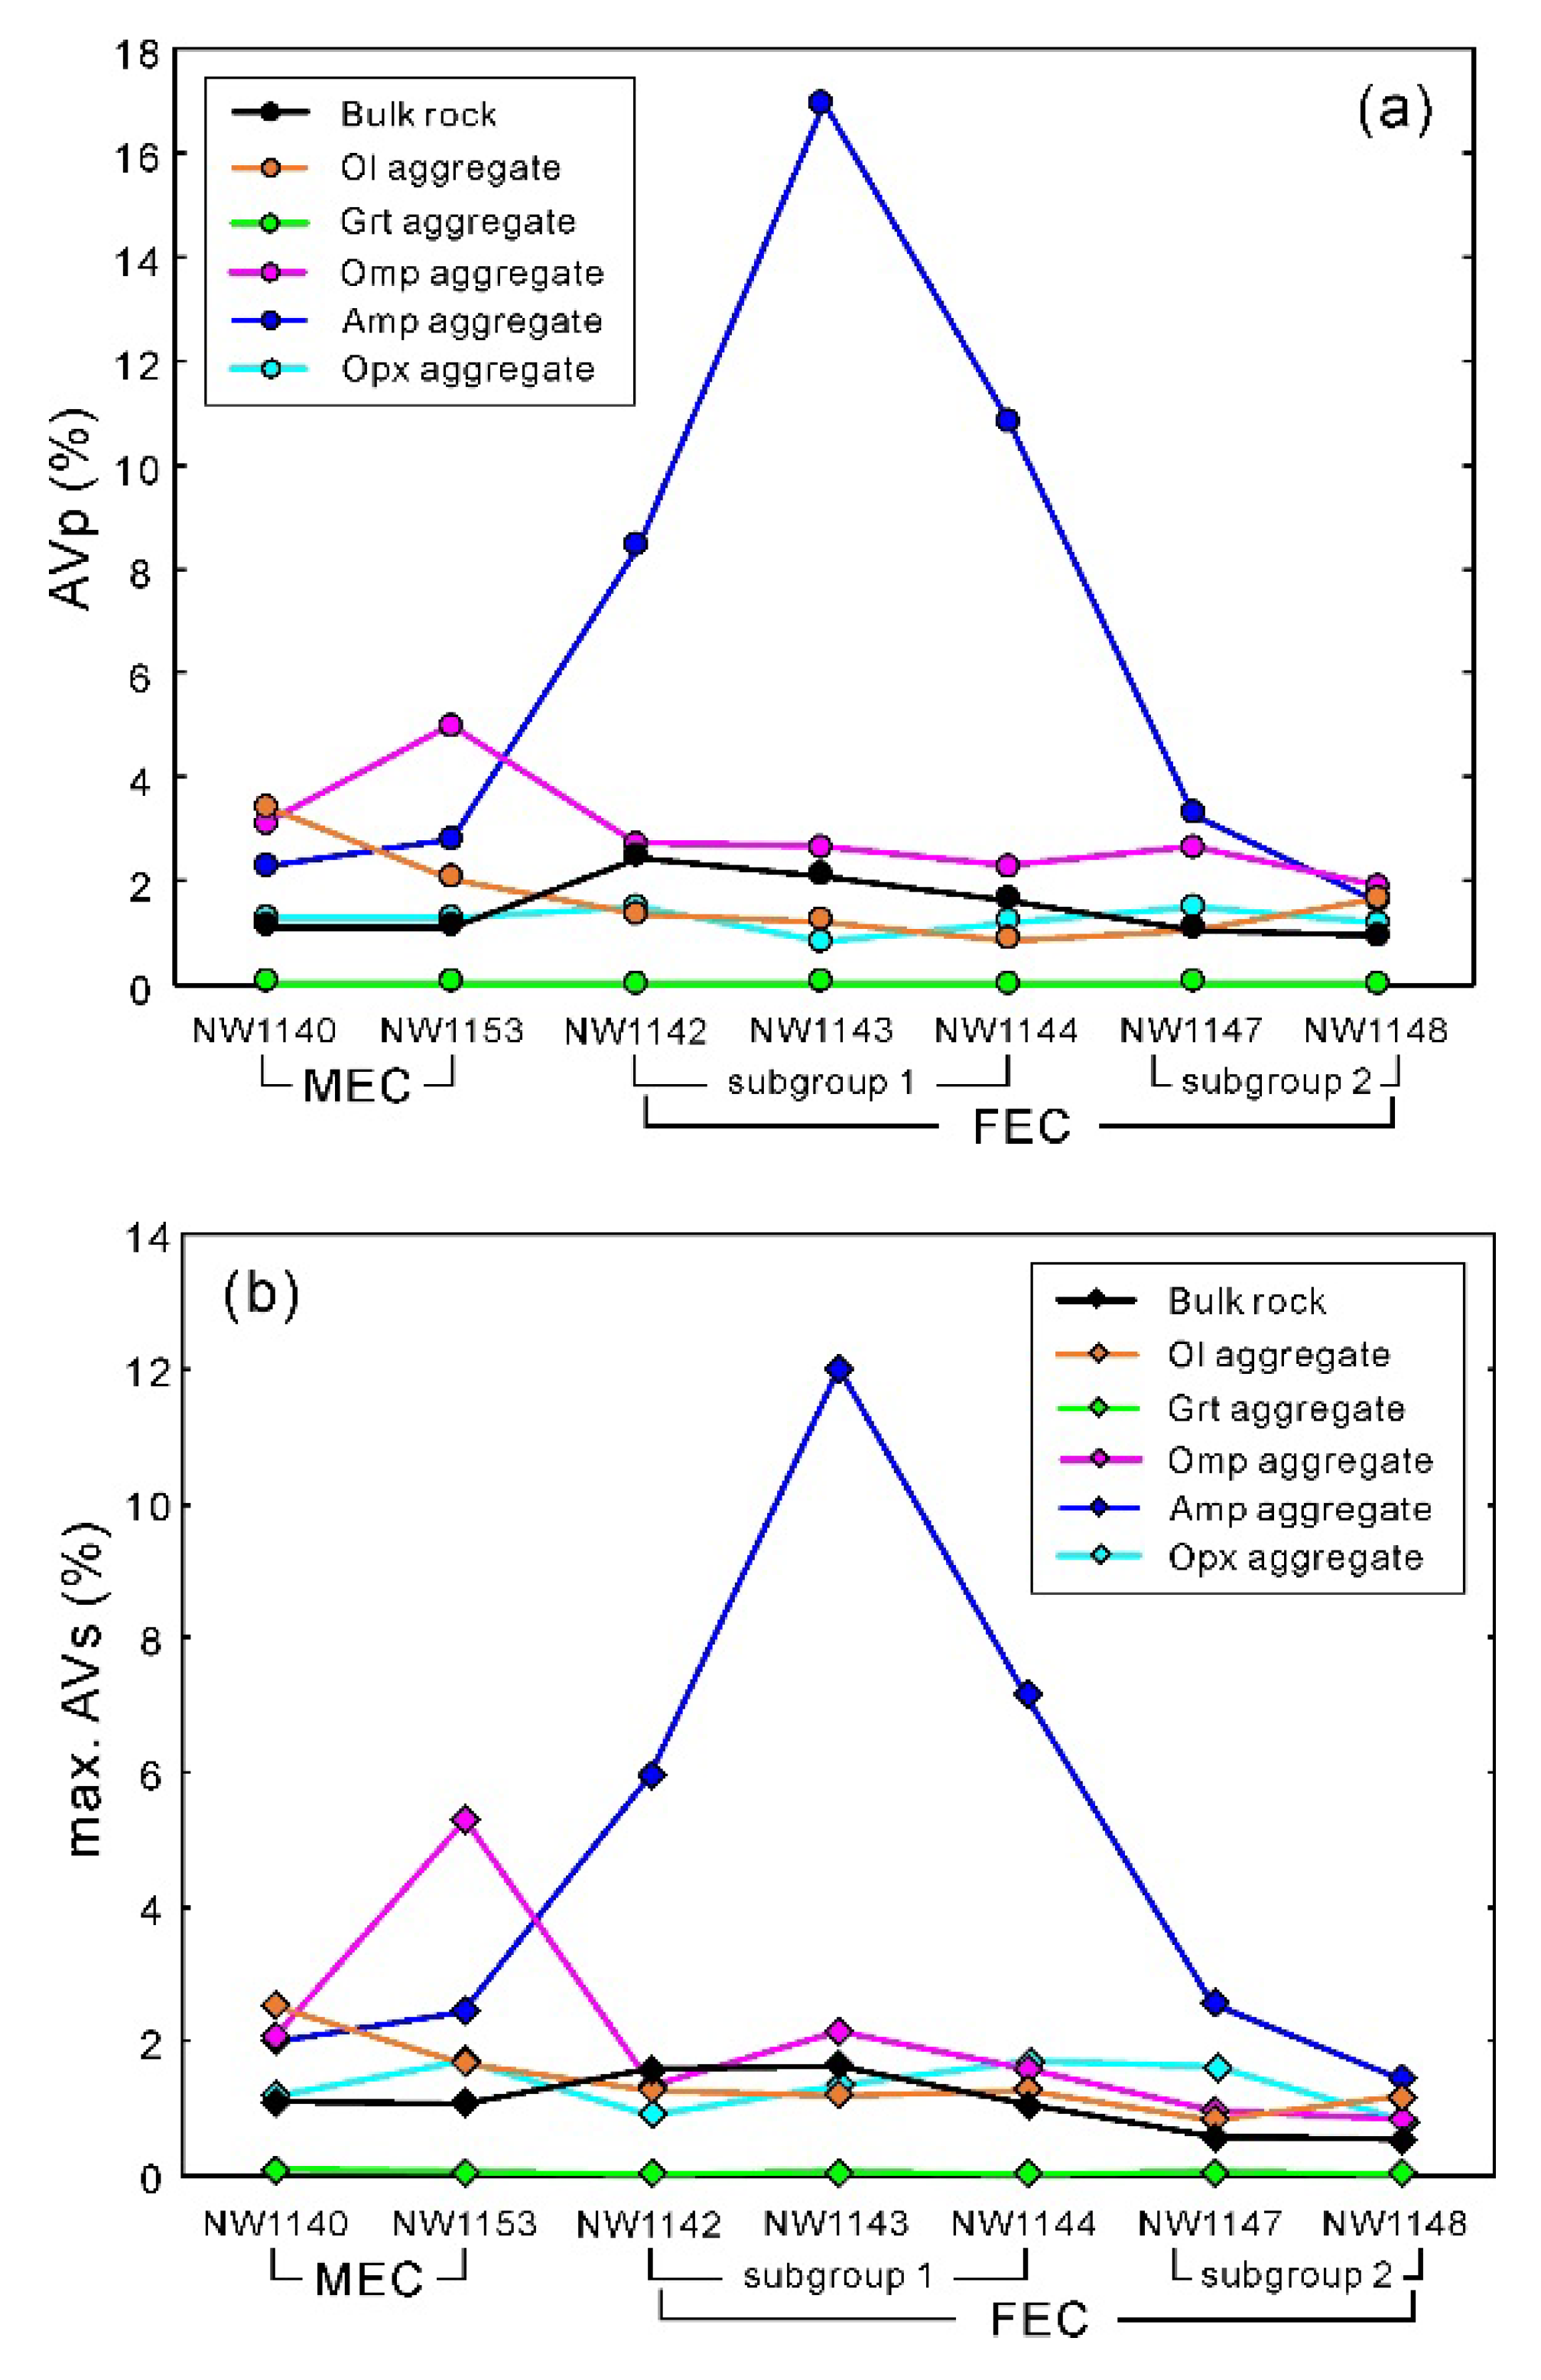
No consistent Vp, AVs, and Vs1 patterns were observed in the Amp polycrystals in the MEC (Figure S5a,b). In contrast, these patterns were more regular in the FEC (Figure S5). Excluding two FEC samples that showed XZ-girdled (Figure S5f) and off-lineation clustering (Figure S5g) of the fast Vp, the max. Vp was aligned subparallel to the lineation in the other FEC samples (Figure S5c–e). Furthermore, the min. Vp was always found in the plane sub-perpendicular to the lineation. Notably, the max. and min. Vps were well correlated with the distributions of the [001] and [100] axes of Amp, respectively (Figure 4). The AVs was large when the seismic ray propagated along the moderate Vp directions and with S1 polarizing parallel to the max. Vp directions. Except for one FEC sample that had the lowest AVp (1.58%) and max. AVs (1.45%) (Figure S5g), the seismic anisotropies of the FEC samples (AVp = 3.29–16.95%, max. AVs = 2.56–12.00%) were much higher than those of the MEC (AVp = 2.29–2.80%, max. AVs = 2.00–2.44%).

4.2.6. Bulk Rocks

Overall, the bulk rock Vp distribution patterns of the MEC were similar to those of the Omp polycrystals (cf. Figures S4a,b and Figure 5a,b). In contrast, three FEC samples (subgroup 1) presented Vp, AVs and Vs1 patterns resembling those of the Amp polycrystals (cf. Figures S5c–e and Figure 5c–e); the other two FEC samples (subgroup 2) showed similar Vp, AVs, and Vs1 patterns to those of the Omp or Ol polycrystals (Figures S1f,g, S4f,g and Figure 5f,g). Apart from one MEC sample (Figure 5a), the max. Vp and polarization direction of the fast S-wave were aligned subparallel (occasionally oblique) to the (apparent) lineation in other eclogite samples (Figure 5b–g). The two MEC samples showed an intermediate AVp (1.06–1.08%) and max. AVs (1.00–1.38%) between the subgroup 1 FECs (Figure 5c–e, Figure 6 and Figure 7), which display the highest AVp (1.78–2.46%) and max. AVs (1.30–1.99%), and the subgroup 2 FECs (Figure 5f,g, Figure 6 and Figure 7), which exhibit the lowest AVp (0.99–1.09%) and max. AVs (0.63–0.65%) (Table 2). Taking all samples together, the intensities of the AVp and max. AVs increased markedly with the volume proportion of Amp (Figure 8) and CPO strength (Figure 9).

5. Discussion and Implications

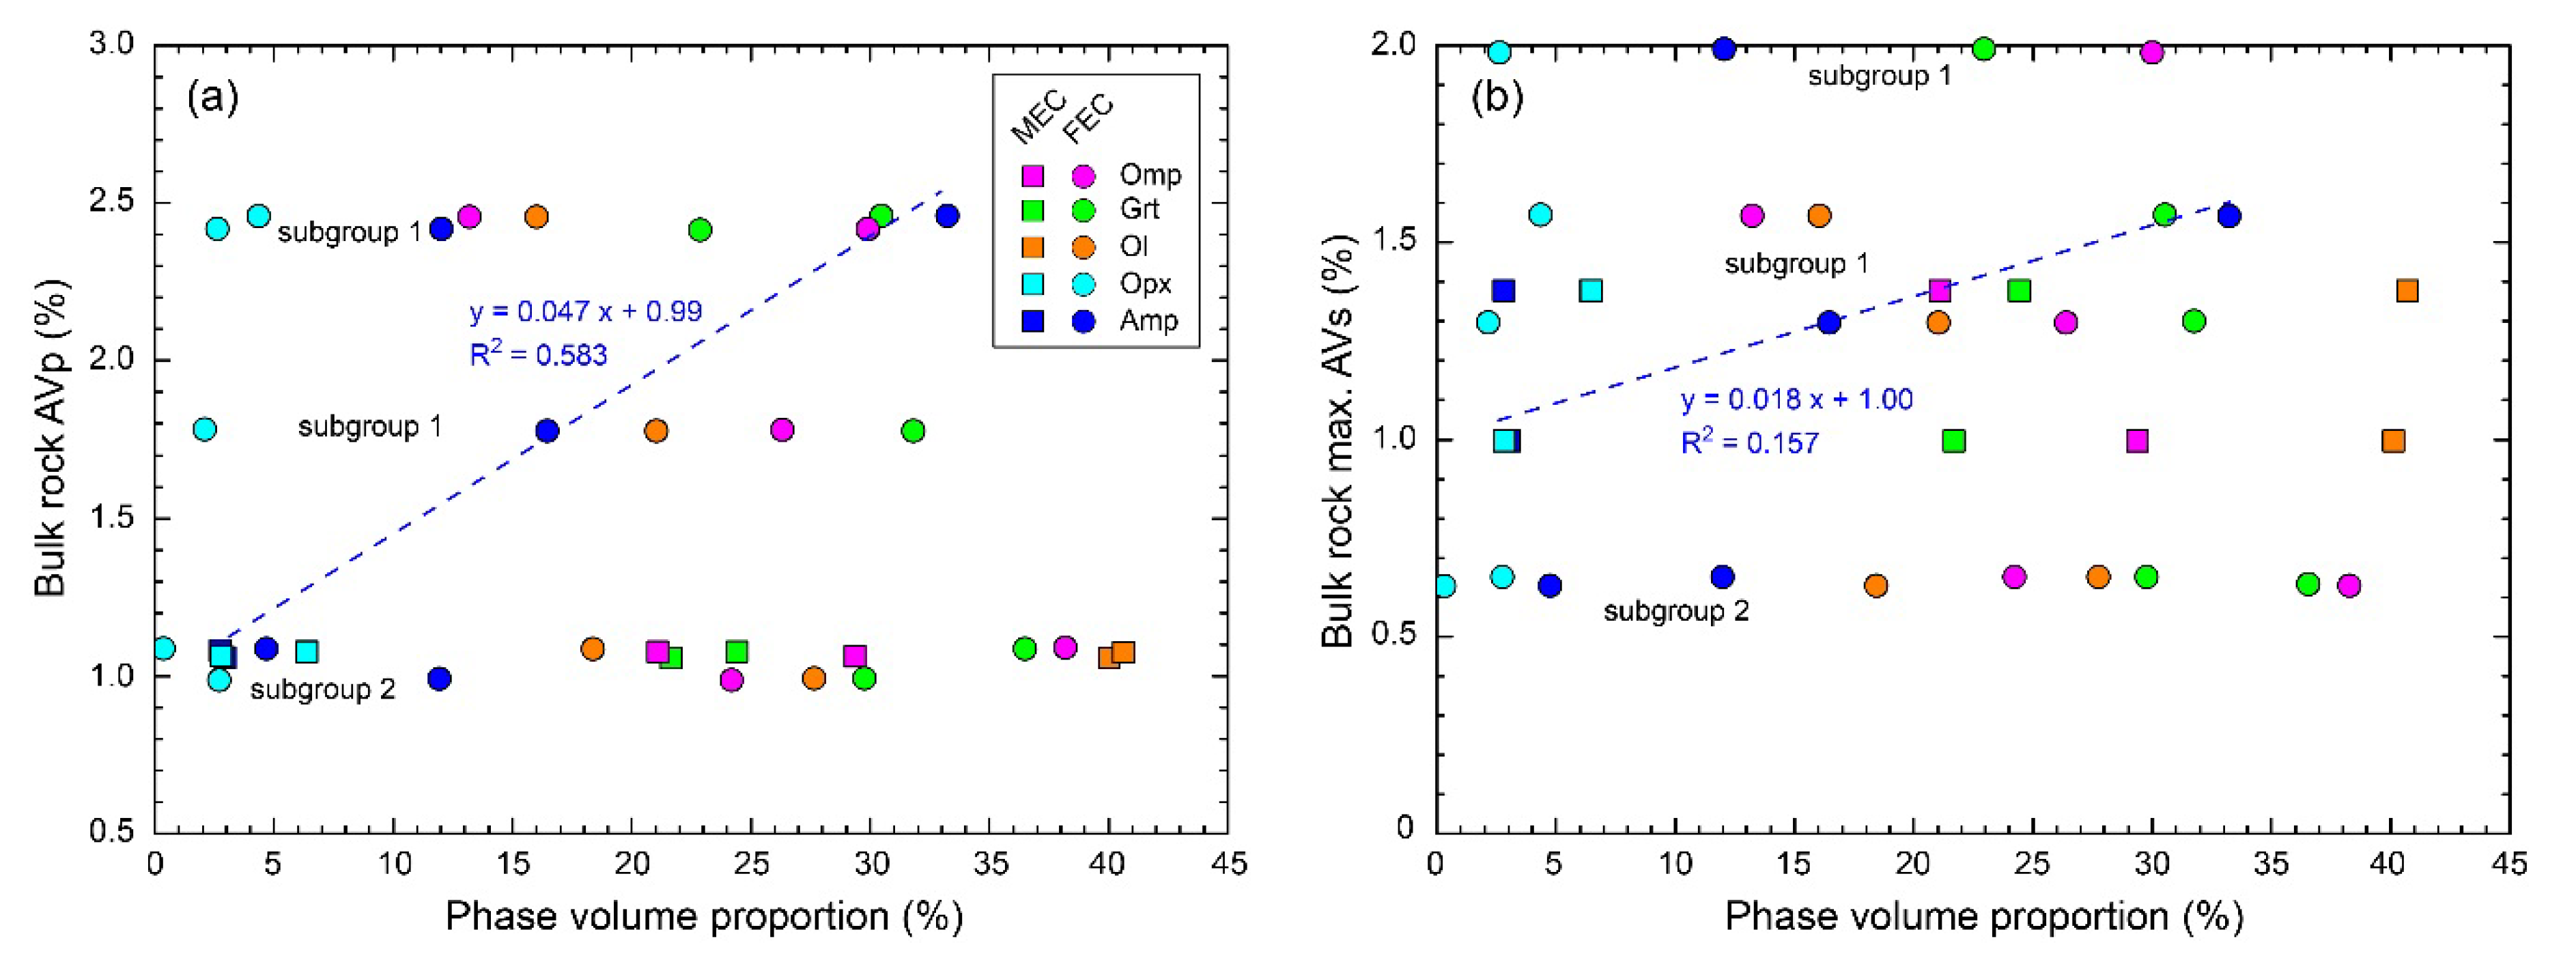
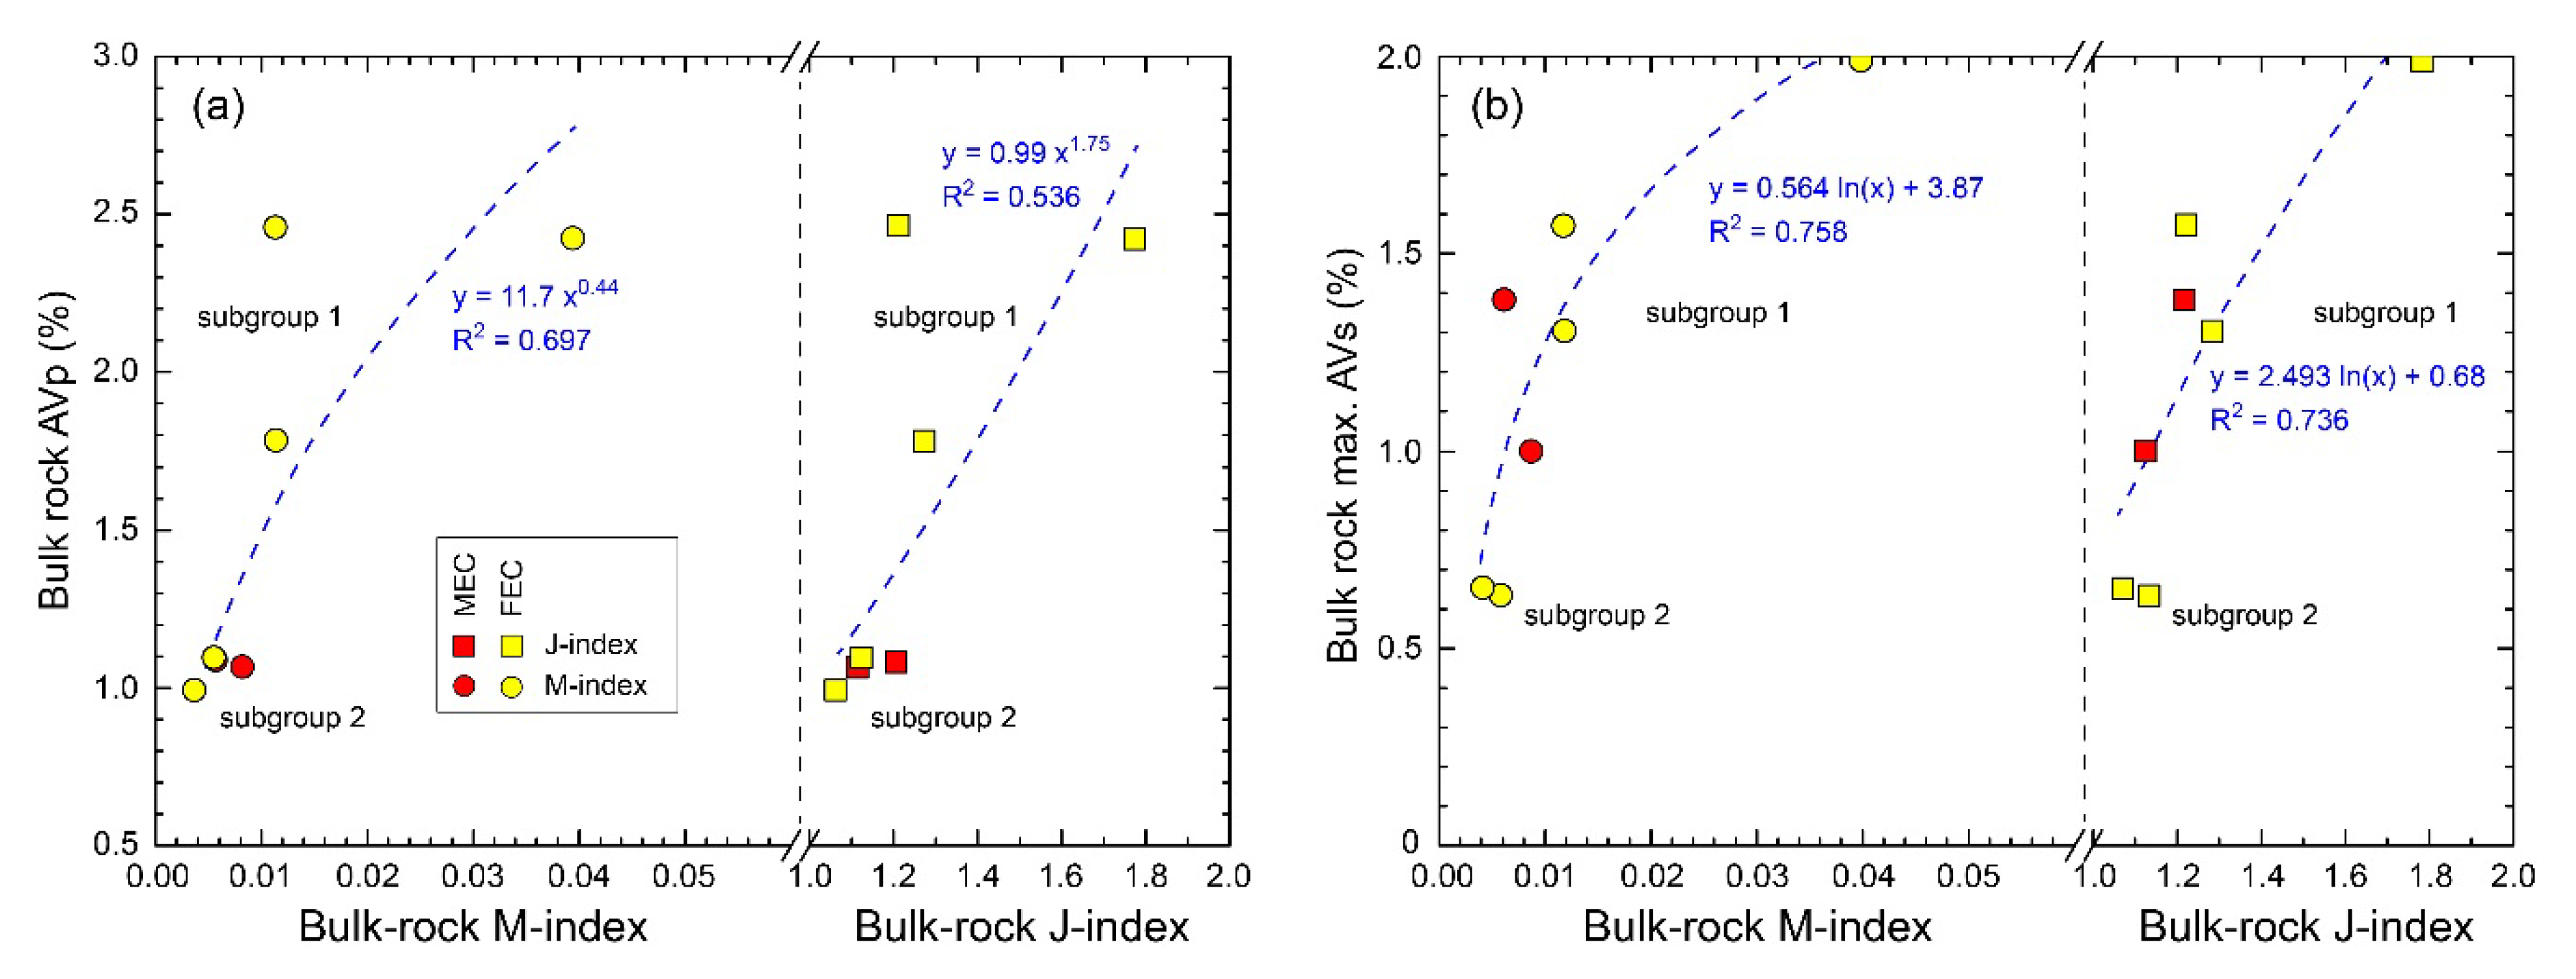
5.1. Factors Controlling the Seismic Anisotropy of Flem Eclogite

Several factors can affect the seismic anisotropy of a natural rock, including microcracks, mineral assemblage, and the strength of CPOs and their interactions [13,19,63,64,65,66]. The role of microcracks is nontrivial in natural rocks; however, its contribution to seismic anisotropy decreases dramatically with depth, where the effect is negligible at pressures above ≈300 MPa (≈10 km in depth) owing to the fast closure of cracks under an increasing confining pressure [20,21,23], though a few studies suggest that some spherical micropores may still exist up to 1 GPa [67,68]. Nevertheless, these pressures are much lower than the case of our high-pressure MEC and FEC that were formed at ≈1.0–3.7 GPa or ≈30–110 km depths [42], where the effect of microcrack should be minimized. Because the single-crystal seismic anisotropies can be highly different between minerals, their volume proportions can tremendously influence the seismic anisotropies of the bulk rock that they constitute. This factor is generally the main contributor to the disparate seismic anisotropies between different rock types, such as blueschist and eclogite [12,13,14]. However, the bulk rock seismic anisotropies (AVp and max. AVs) of Flem eclogite show no obvious correlations with the volume proportions of major phases, except for Amp (Figure 8), indicating that bulk rock seismic anisotropies are not mainly controlled by the mineral assemblage. The weak positive relations between the seismic anisotropies and the volume proportions of Amp, which is relatively stronger for AVp (R2 = 0.583) than max. AVs (R2 = 0.157), reveal that the high Amp content can partly account for the higher seismic anisotropies in the Amp-rich FEC subgroup 1 (Figure 8).
The stronger CPO strength (denoted by larger J- and M-indices) means that the crystal lattices were aligned more toward a similar orientation, resulting in greater seismic anisotropies. Despite a weak CPO strength, positive correlations between the bulk rock seismic anisotropies and the bulk rock CPO strength were still recognizable in the MEC and FEC (Figure 9). This result suggests that the variations of bulk rock seismic anisotropies in the Flem eclogite were largely affected by their CPO strength, which is also corroborated by previous studies, especially the variations of seismic anisotropies in the same rock type [13,14].
The interactions of CPO can either reinforce or weaken the bulk rock seismic anisotropies, depending on the distribution patterns of the constituent mono-mineralic polycrystals. If the fast velocities (Vp or Vs) of different mono-mineralic polycrystals are aligned in similar orientations (same for the slow velocities), the CPOs are thus thought to coherently contribute to the bulk rock seismic anisotropies (i.e., the constructive effect of CPO interactions). Otherwise, the seismic anisotropies of bulk rock are much weaker than those of mono-mineralic polycrystals, when the fast and slow velocities are subparallel and thus counteract with each other (i.e., destructive effect of CPO interactions) [13,69,70]. In the FEC subgroup 1, the Omp, Amp, and Opx polycrystals presented overall similar distribution patterns for Vp (constructive effect; Figures S2c–e, S4c–e and S5c–e), thus partly contributing to the highest bulk rock seismic anisotropies for the FEC subgroup 1. In contrast, the Vp distribution patterns were less consistent in the FEC subgroup 2 (destructive effect; Figures S2f,g, S4f,g and S5f,g), hence leading to the lowest bulk rock seismic anisotropies in collaboration with the lowest bulk rock CPO strength (Figure 9). The Vp patterns of Ol polycrystals mostly differed from those of Omp, Amp, and Opx (Figure S1), which is indicative of the destructive effect of Ol CPO. The Grt polycrystals showed almost negligible seismic anisotropies (Figure S3) and thus weakened the bulk rock seismic anisotropies. A comparison of the seismic anisotropies between bulk rock and constituent mono-mineralic polycrystals illustrated that the bulk rock seismic anisotropies were indeed the combined results of each of the mono-mineralic polycrystals (Figure 6). Especially for the FEC subgroup 1, their highest seismic anisotropies were mainly due to the Amp polycrystals. The calculated seismic anisotropies were all smaller than the arithmetically averaged seismic anisotropies that approximated the purely constructive contributions of all constituent mono-mineralic polycrystals (Figure 7). This result clearly reflects the existence of destructive effects of CPOs on weakening the bulk rock seismic anisotropies [14]. The degree of deviations (calculated using 100 × ( AVp a v g AVp c a l ) / AVp c a l and 100 × ( max .   AVs a v g max .   AVs c a l ) / max .   AVs c a l ) from the dividing line (k = 1) were much larger for the MEC (90–126% for AVp and 45–74% for max. AVs) and FEC subgroup 1 (34–45% for AVp and 25–54% for max. AVs) than FEC subgroup 2 (15–26% for AVp and 6–13% for max. AVs), implying that the destructive effects of the CPOs were not constant in the Flem eclogite, i.e., they were more remarkable in the MEC and FEC subgroup 1 than in FEC subgroup 2 (Figure 7).
It is noteworthy that the three factors above are probably not mutually exclusive. The highest seismic anisotropies in FEC subgroup 1 were contributed jointly by their higher Amp contents, larger bulk rock CPO strength, and constructive CPO interactions. The enrichment of Amp in the FEC subgroup 1 may favor the development of a stronger Amp CPO (especially in the Amp-rich layers where strain is likely more localized) and result in a larger bulk rock CPO strength (combined consequences of stronger Amp CPO and higher Amp volume proportion). The stronger CPOs of Amp, Omp, and Opx in FEC subgroup 1 may also imply that more coherent CPO developments and resultant constructive CPO interactions reinforce the seismic anisotropies.

5.2. Seismic Properties and the Implications of Flem Eclogite

The Flem eclogite is a unique type of eclogite because of its uncommon mineral assemblage of abundant Ol and Opx. FEC subgroup 1 showed an AVp (1.78–2.46%) and max. AVs (1.30–1.99%) similar to previously reported dry eclogite that consisted of dominantly bi-mineralic Omp and Grt (AVp = 1.2–2.9%, max. AVs = 0.74–2.02%; Bascou et al. [22]), while the seismic anisotropies of the MEC (AVp = 1.06–1.08%, max. AVs = 1.00–1.38%) and FEC subgroup 2 (AVp = 0.99–1.09%, max. AVs = 0.63–0.65%) were even lower (Figure 10). The seismic anisotropies of the Flem eclogite were also strikingly lower than the seismic anisotropies of other types of eclogite that bear hydrous phases, such as epidote (Ep), glaucophane (Gln), and lawsonite (Lws) (AVp = 1.4–10.2%, max. AVs = 1.35–8.09%; Figure 10). Therefore, compared to the eclogite free of Ol and Opx, and despite the large strain and high Amp content (as reflected by the Amp-rich FEC), the presence of Ol and Opx actually weakened the bulk rock seismic anisotropies, mainly by reducing the mineral CPO strength (Figure 9) through non-dislocation creep mechanisms, such as diffusion creep, grain or phase boundary sliding, and rigid-body-like rotations [42]. The Ep- and Lws-bearing blueschist, which is the hydrous precursor of eclogite, displayed the highest seismic anisotropies, implying a gradual decrease of the elastic anisotropies in the subducted oceanic crust with increasing depth [12,13,14]. Peridotite is the rock that is typically enriched with Ol and Opx. However, peridotite had a higher AVp and max. AVs (Figure 10), indicating that it can be distinguished from Flem eclogite and dry eclogite, but not Ep-, Gln-, and Lws-bearing eclogite, in terms of the magnitudes of seismic anisotropies [71]. The Flem eclogite is surrounded by non- or weakly metamorphosed gabbro (Figure 1b; see Mørk [33]). Although the seismic anisotropies of the surrounding gabbro are unknown, an examination of the seismic anisotropies of the gabbro from other localities revealed similar intensities to the peridotite [72] (Figure 10). This fact thus raises the feasibility of using the intensities of seismic anisotropies to distinguish Flem eclogite and dry eclogite from their gabbroic country rocks in the deep continental crust.
Unlike the seismic anisotropies, the average seismic velocities (approximating the isotropic seismic velocities) and Vp/Vs ratio of Flem eclogite were controlled only by the mineral assemblage. Specifically, both Vp and Vs correlated positively and negatively with the volume proportions of Omp and Amp, respectively (Figure 11a,b). These salient relations were the manifestation of the faster seismic velocities of Omp than the Amp single crystal and the formation of Amp by replacing mainly Omp and Ol. As suggested by Cao et al. [42], the Amp in MEC and FEM has both low- and high-pressure origins, where the high-pressure Amp is the most abundant and is formed by deformation-enhanced hydration reactions under peak-to-early-retrograde UHP metamorphic conditions. Furthermore, despite narrow ranges of seismic velocities and densities, weak positive correlations between Vp, Vs, and bulk rock densities were still displayed (Figure 12), which obeyed Birch’s law [9,29,80]. The seismic velocities of Flem eclogite were lower than those of peridotites and dry eclogite; larger than those of Ep-, Gln-, and Lws-eclogite; much greater than those of blueschist and gabbro (Figure 13). The Vp and Vs of Flem eclogite were plotted in a straight line, yielding an average Vp/Vs ratio of 1.765, which was lower and higher than the Ep-/Gln- and Lws-bearing eclogites, respectively (Figure 13). Despite the narrow range of the Vp/Vs ratio (≈1.758–1.770; see Table 2), a strong positive correlation (R2 = 0.922) between the Vp/Vs ratio and Ol volume proportion suggested that Ol could significantly increase the Vp/Vs ratio of eclogite, whereas Amp and Grt decreased the bulk rock Vp/Vs ratio, as indicated by the negative correlations between the Vp/Vs ratio and their volume proportions (Figure 11c). The Vp/Vs ratio of the Flem eclogite was much larger than the non-retrograded eclogite (1.69–1.71) and slightly larger than the retrograded eclogites (1.73–1.77) that contain appreciable amounts of retrograde Amp and Pl [12,28]. This Vp/Vs ratio was also slightly higher than the dry eclogites (1.73–1.75) that are free of Ol and Opx and similar to those of peridotite [81], further indicating that Ol was the source of high Vp/Vs ratio in the Flem eclogite (Figure 13). Owing to the abundance of Gln, which was characterized by the low Vp/Vs ratio, Ep-blueschist mostly had lower Vp/Vs ratios (1.70–1.73) than the Flem eclogite. However, the occurrence of a high-Vp/Vs-ratio Lws can increased the Vp/Vs ratio of Lws-blueschist to a wide range (1.71–1.81). The enrichment of high Vp/Vs ratio Pl caused the Vp/Vs ratios of gabbro (1.75–1.85) to be higher than the Flem eclogite. Therefore, we propose that the much larger Vp and Vs and relatively smaller Vp/Vs ratios of the olivine-rich eclogite (e.g., Flem eclogite) can be used to differentiate them from the country rocks (e.g., metastable and non-eclogized gabbro) in the deep continental crust or subduction channel when high-resolution seismic waves data are available since the detectable body size depends on the resolution (i.e., a wavelength that is determined by velocity and frequency) of seismic waves at different depths.

6. Conclusions

The Flem eclogite from NW Flemsøya in the Nordøyane UHP domain of the Western Gneiss Region in Norway is a unique type of eclogite that was enriched with olivine and orthopyroxene. Based on the detailed examinations on their seismic properties, several main findings were as follows.
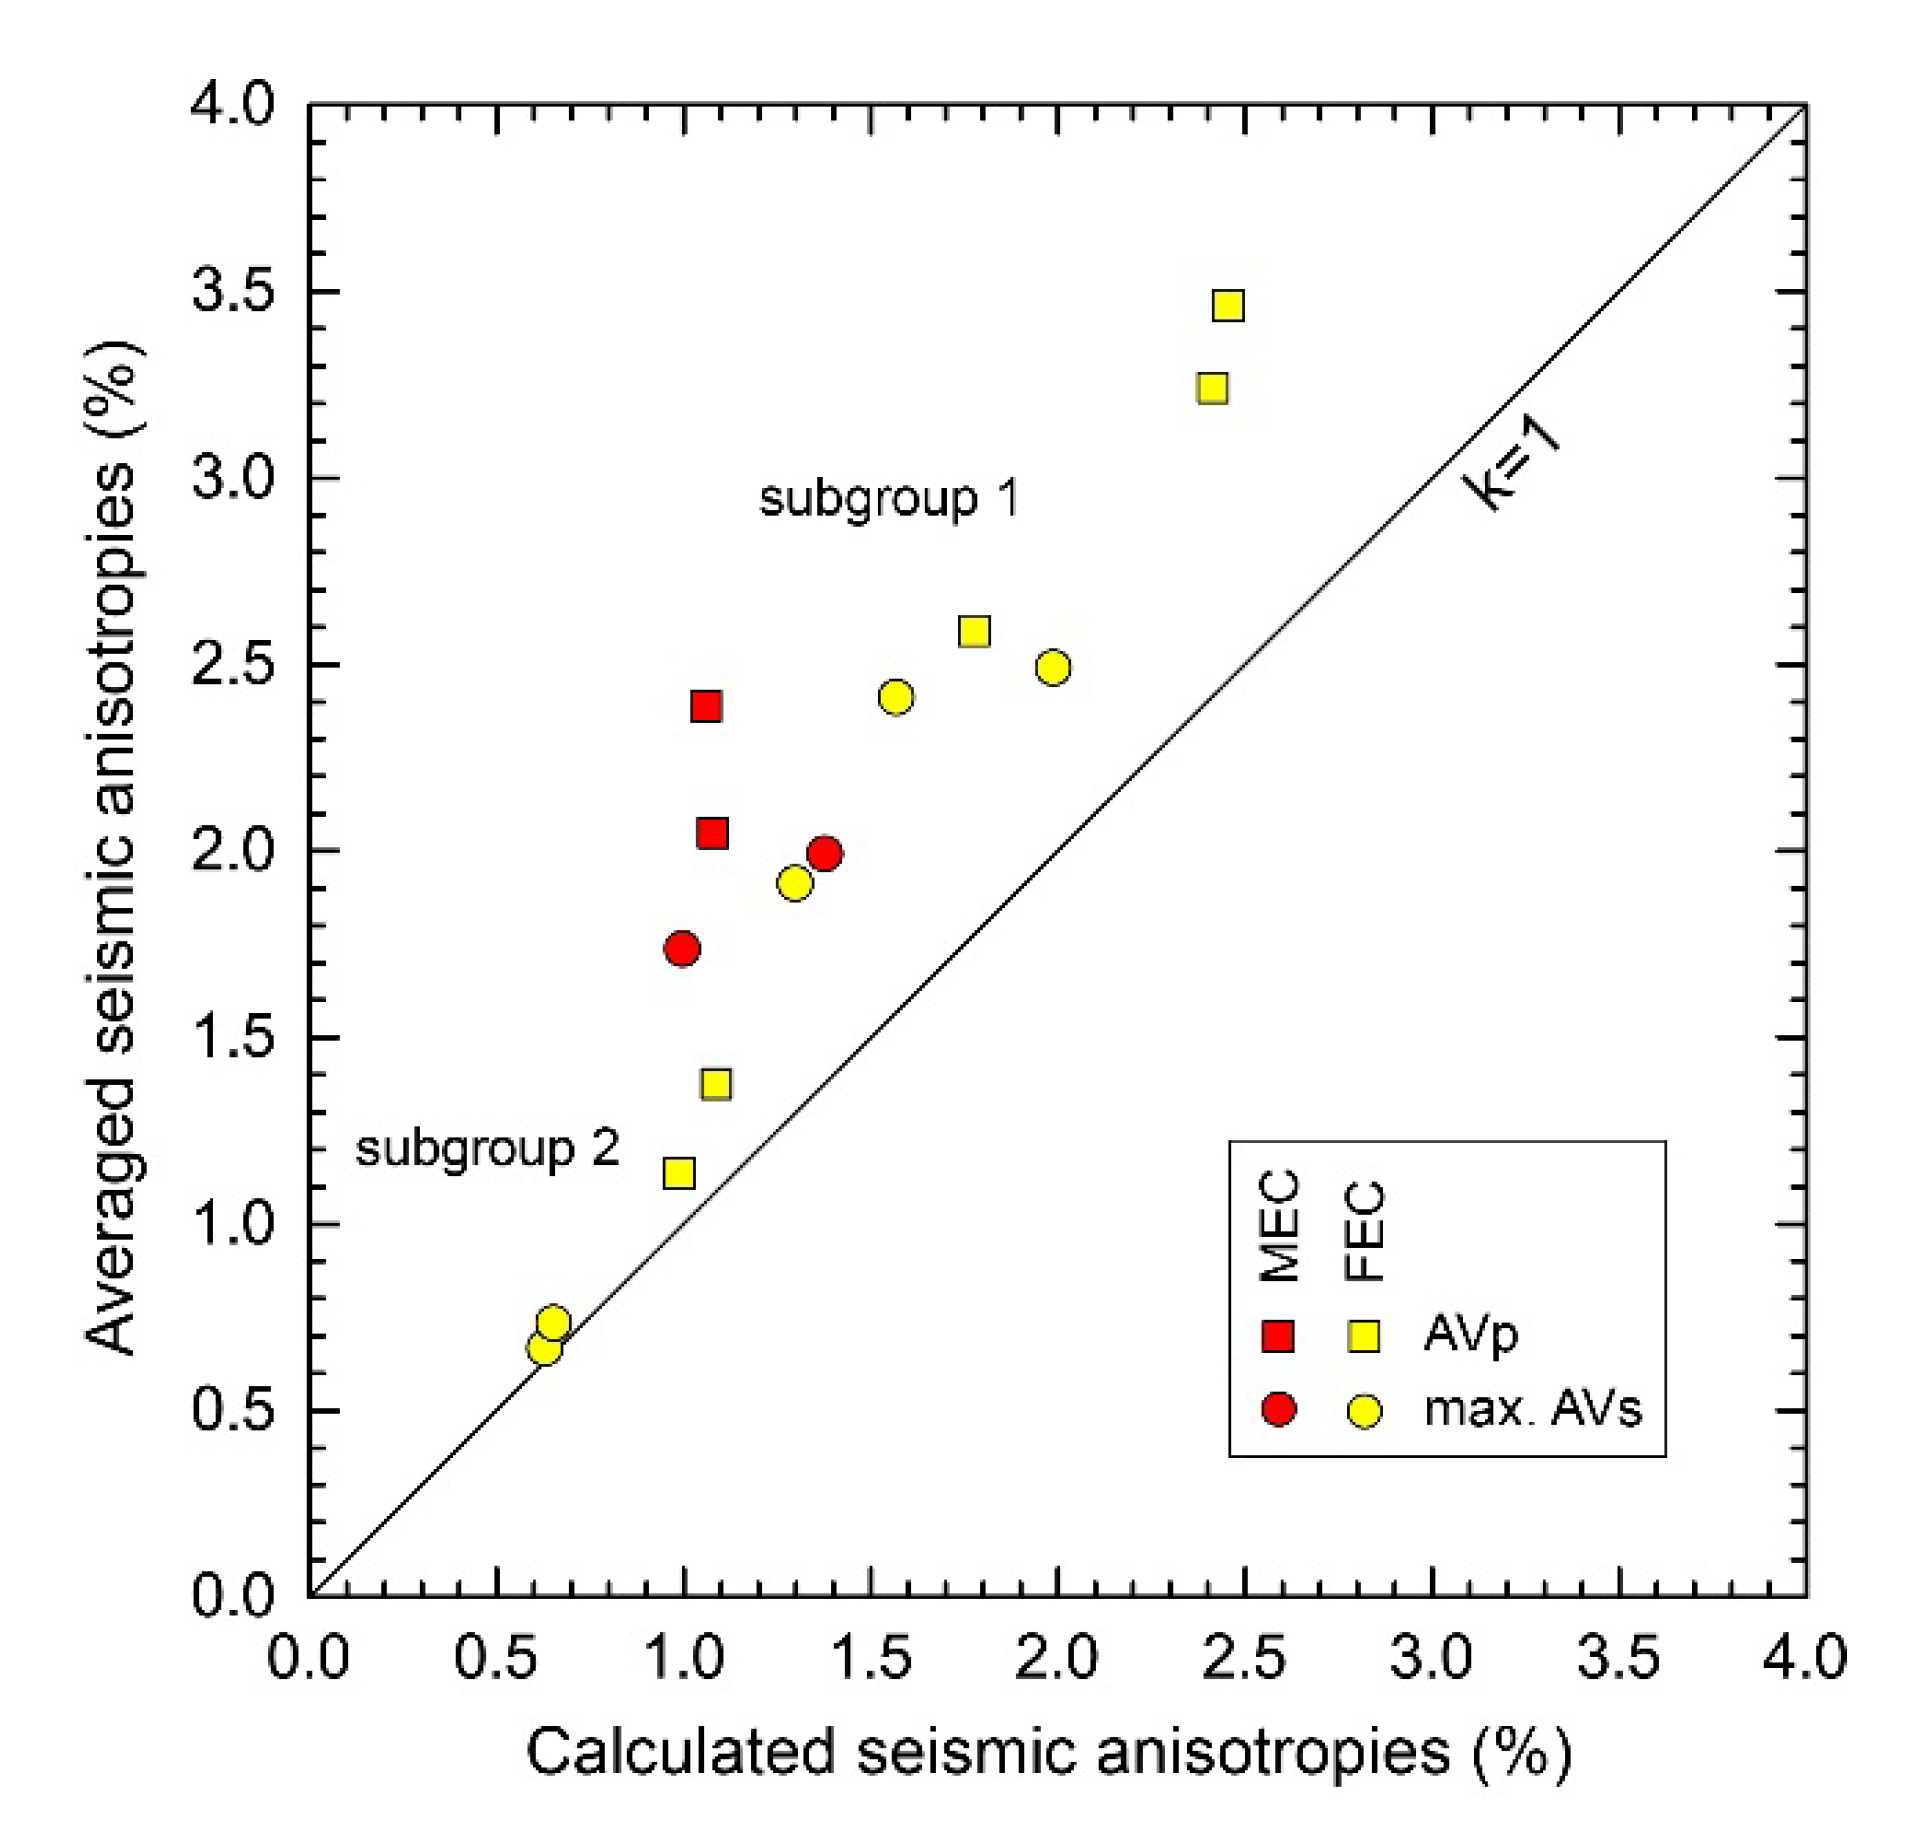
  • The seismic anisotropies of the Flem eclogite were largely controlled by the CPO strength and significant destructive effects of CPO interactions on weakening the seismic anisotropies were manifested in both weakly and strongly foliated eclogite. Amphibole CPOs were the main contributors to the higher seismic anisotropies in some amphibole-rich and strongly foliated eclogite.
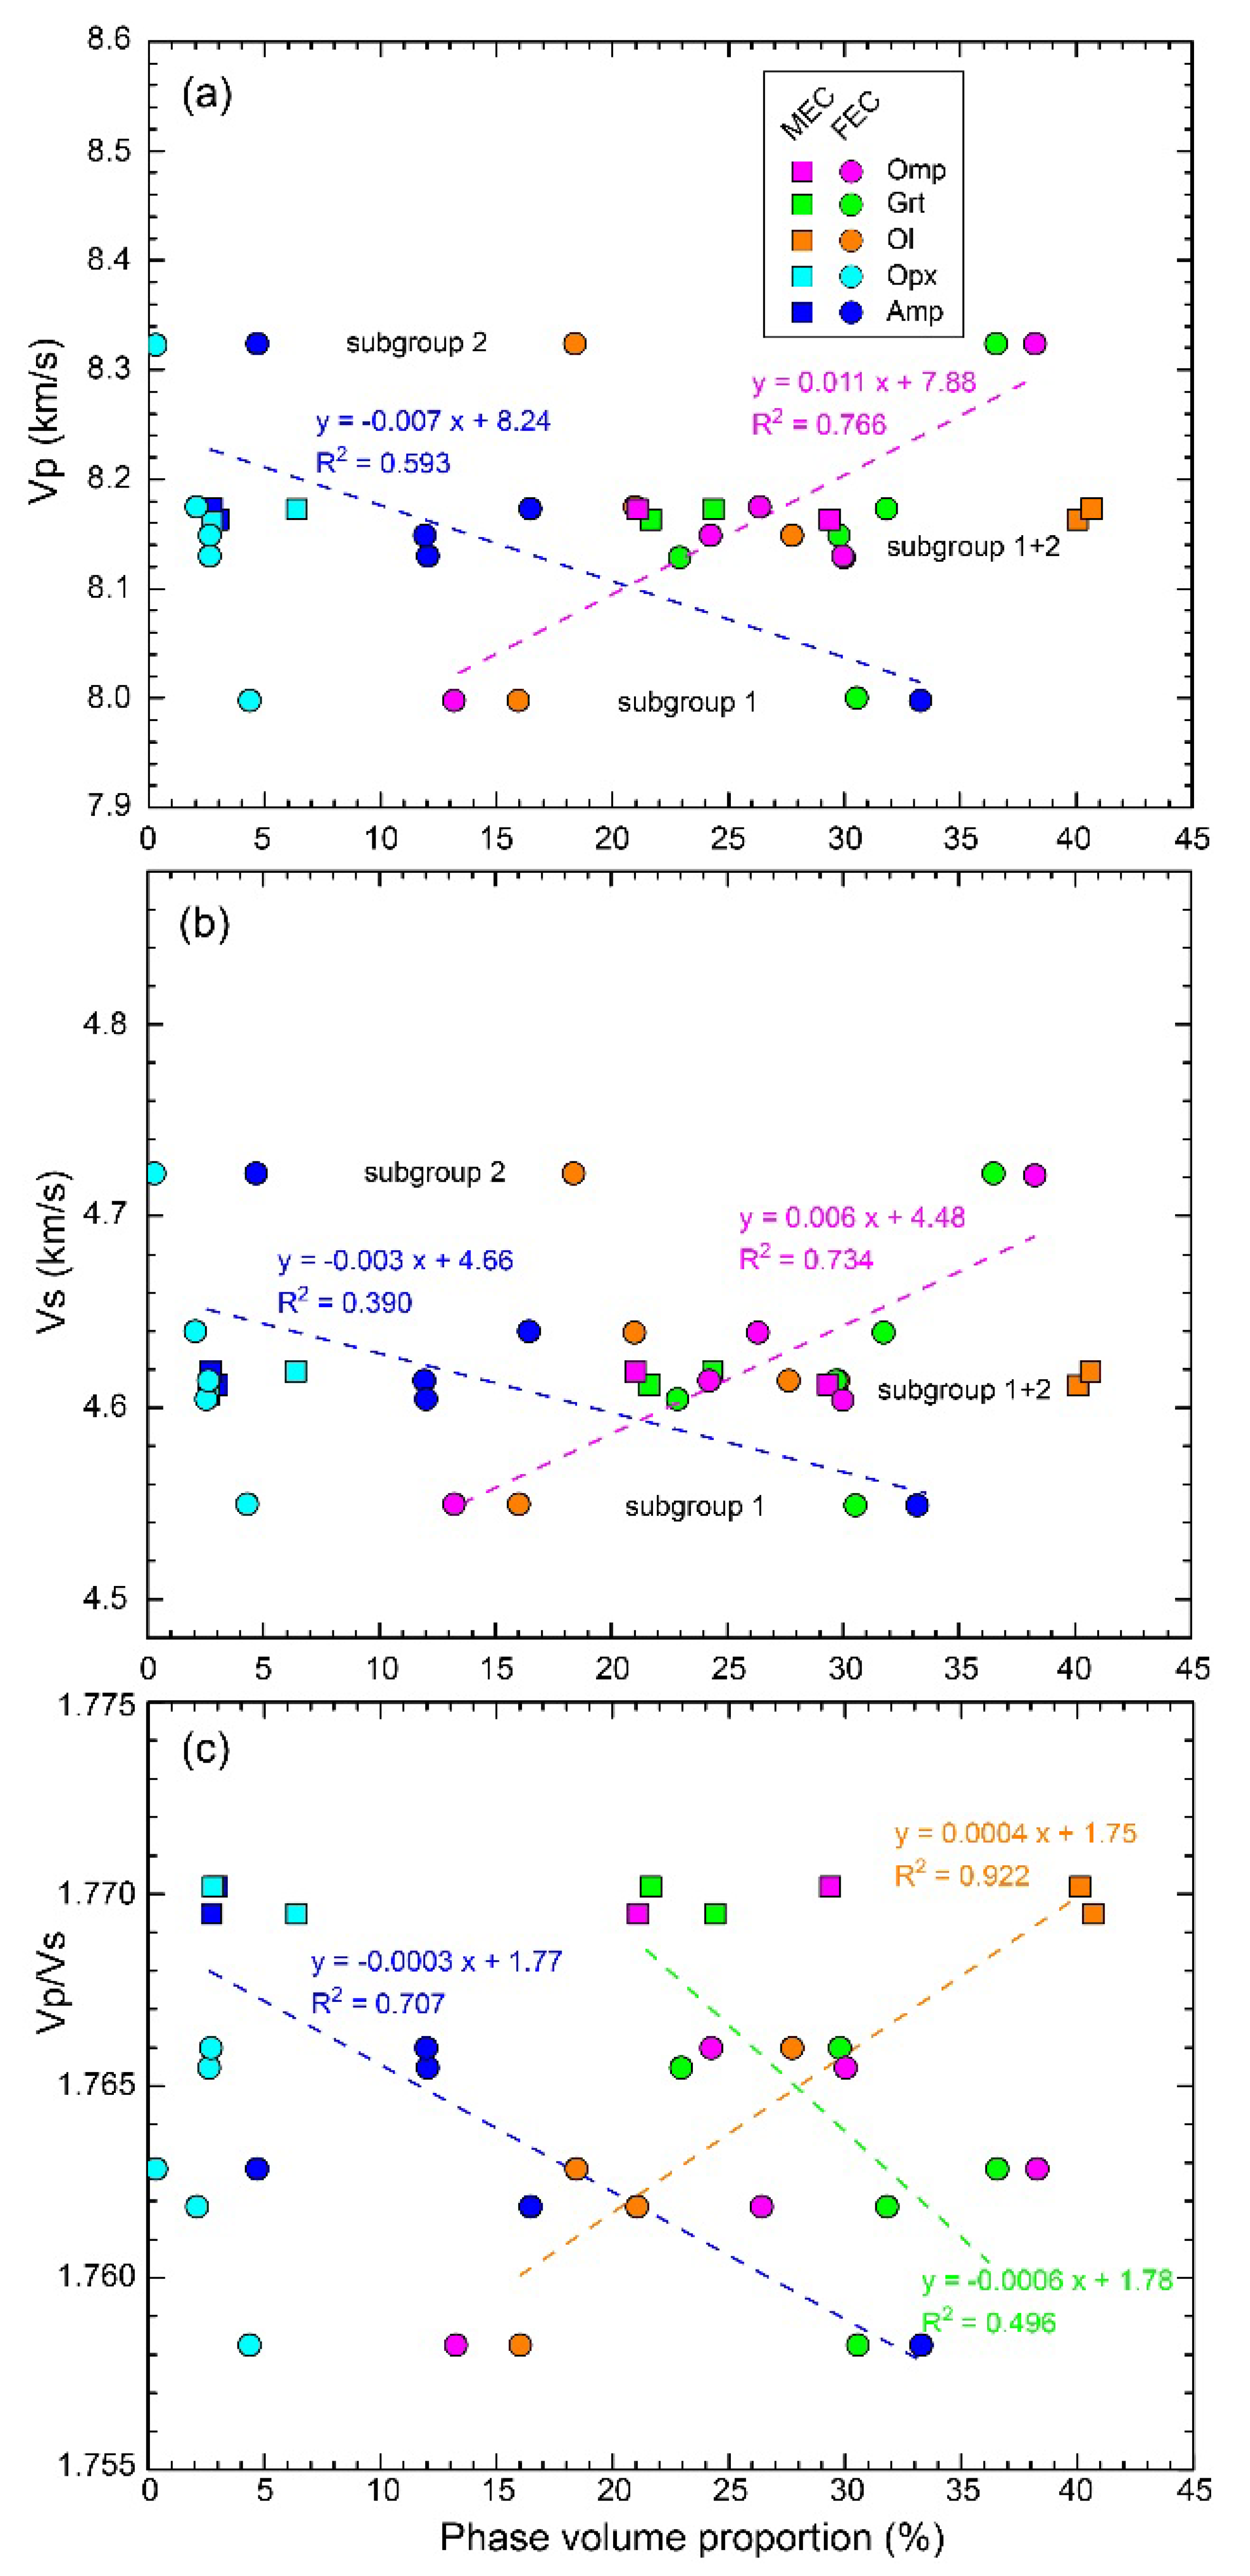
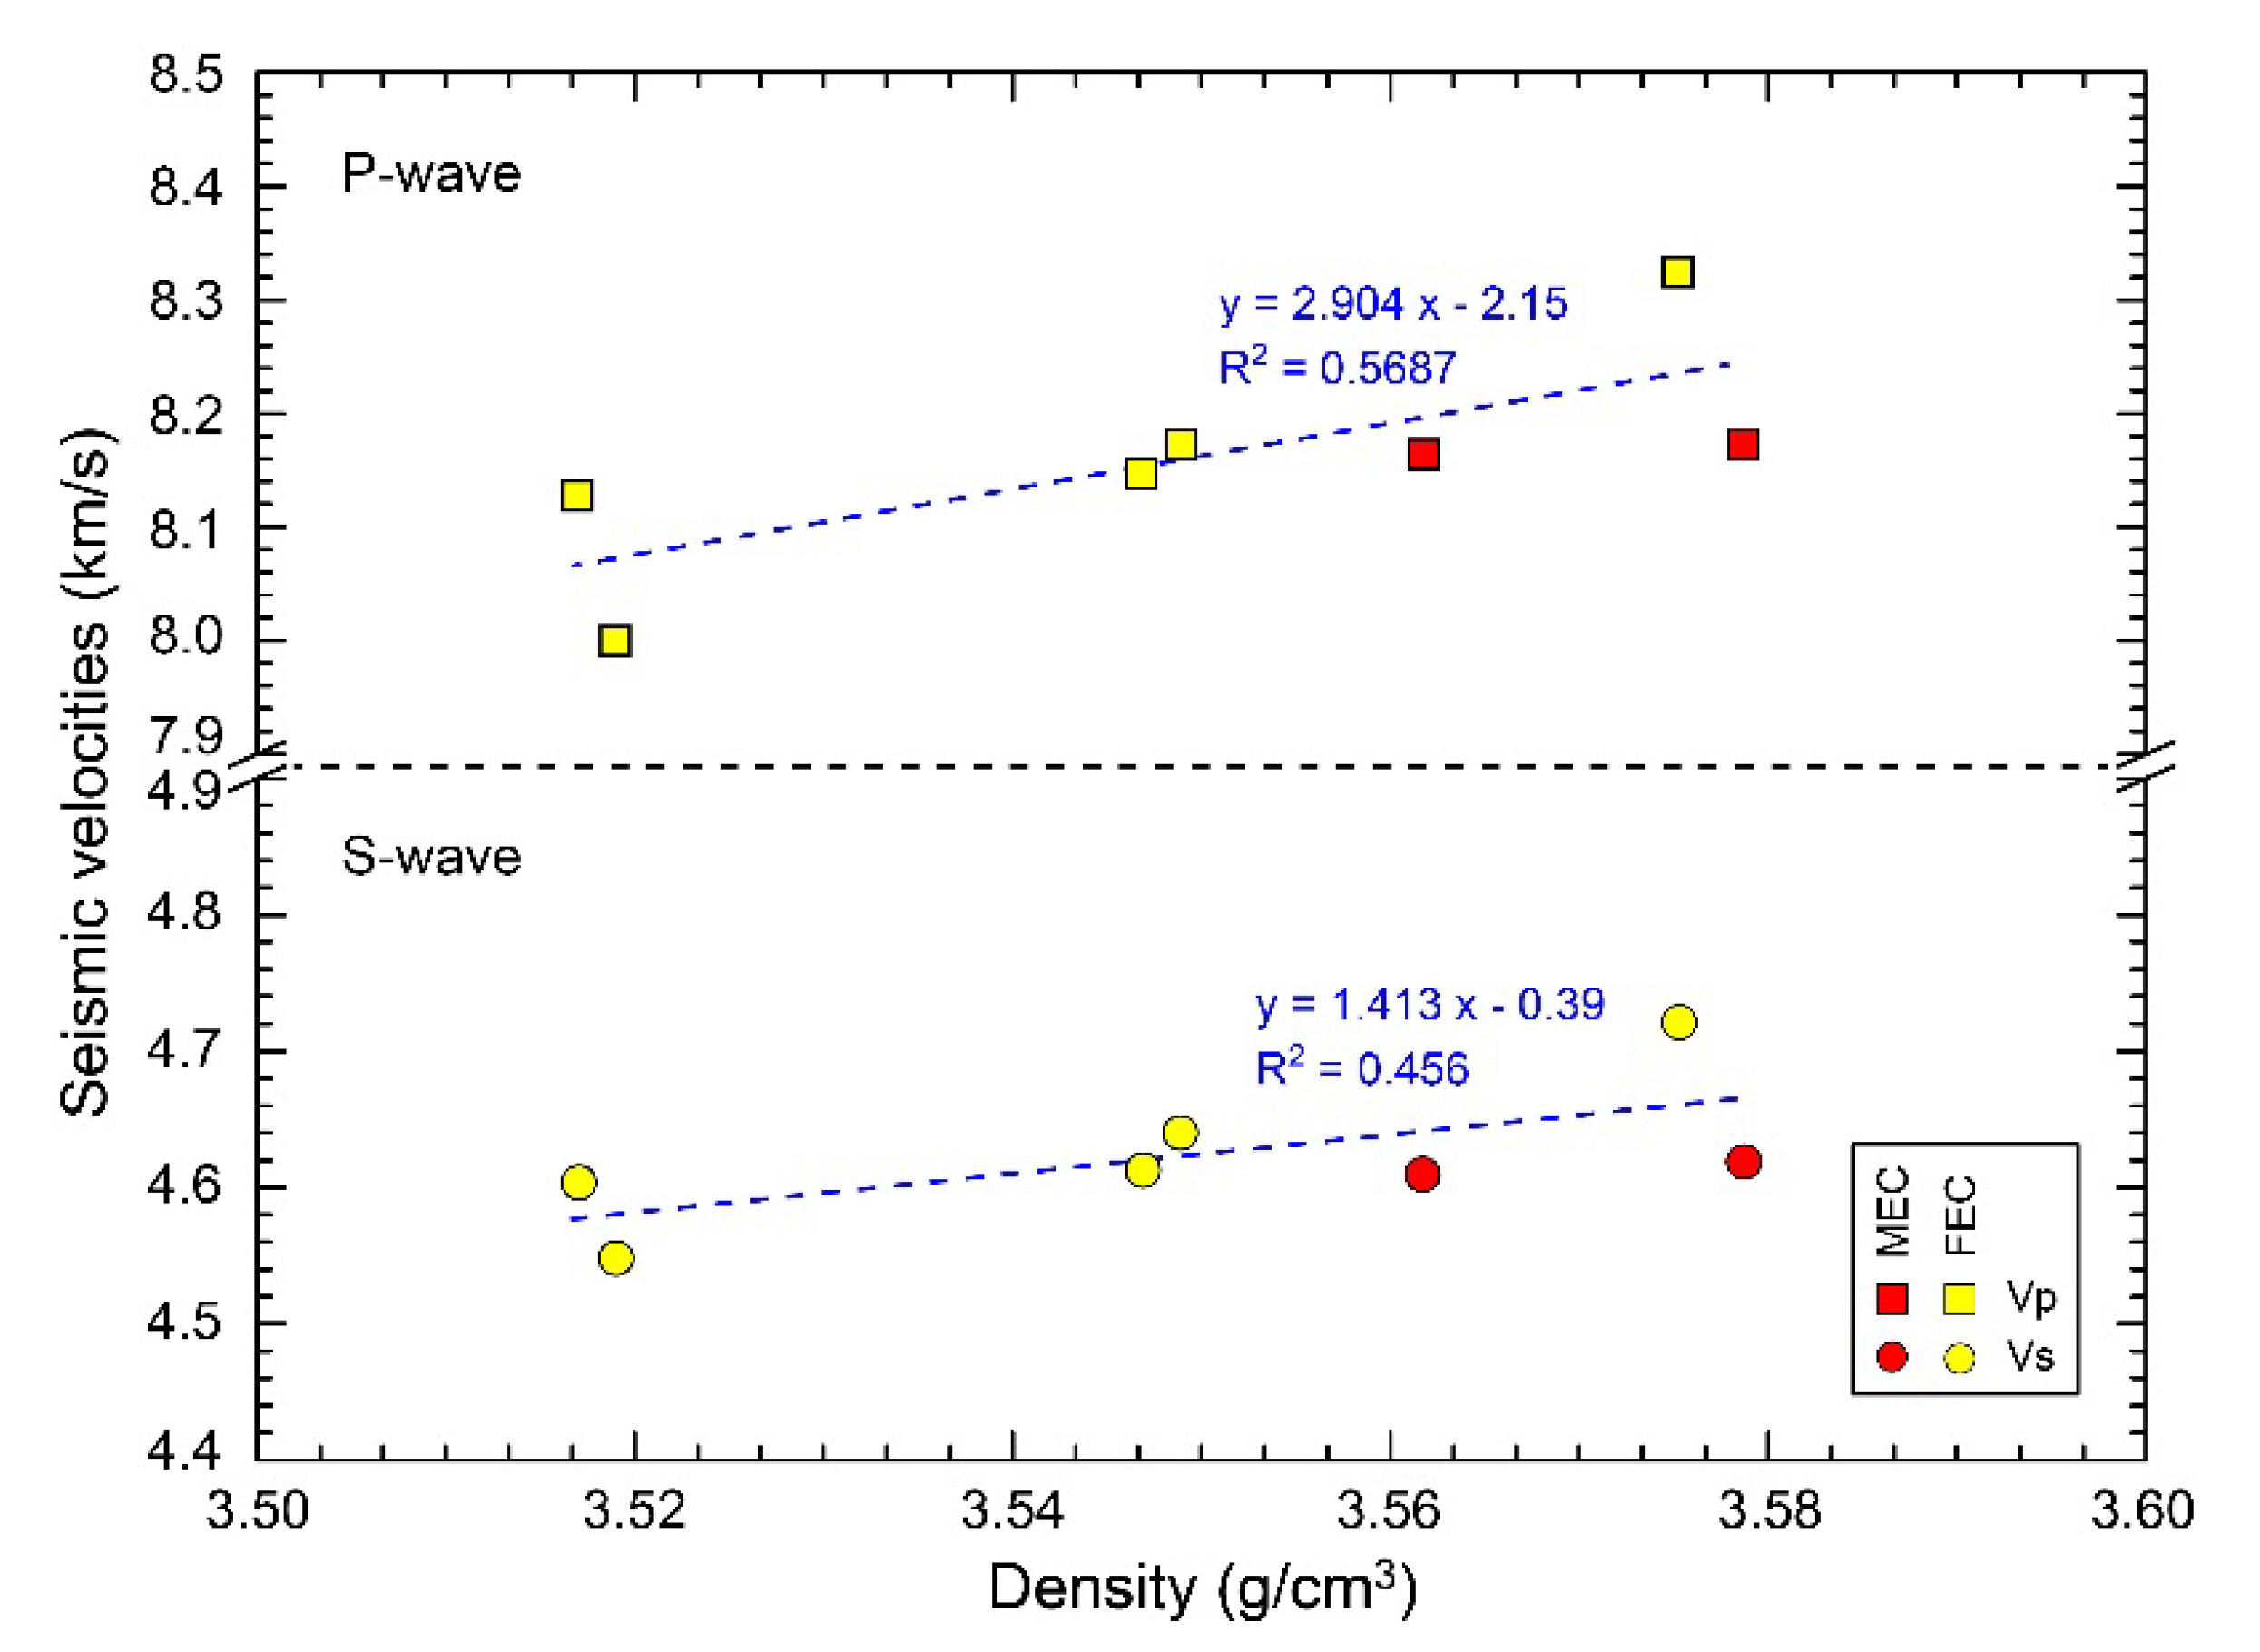
  • The average seismic velocities correlated positively with the rock density and omphacite content, but negatively with the amphibole volume proportion, which is indicative of the dominant role of a mineral assemblage in governing the bulk rock seismic velocities.
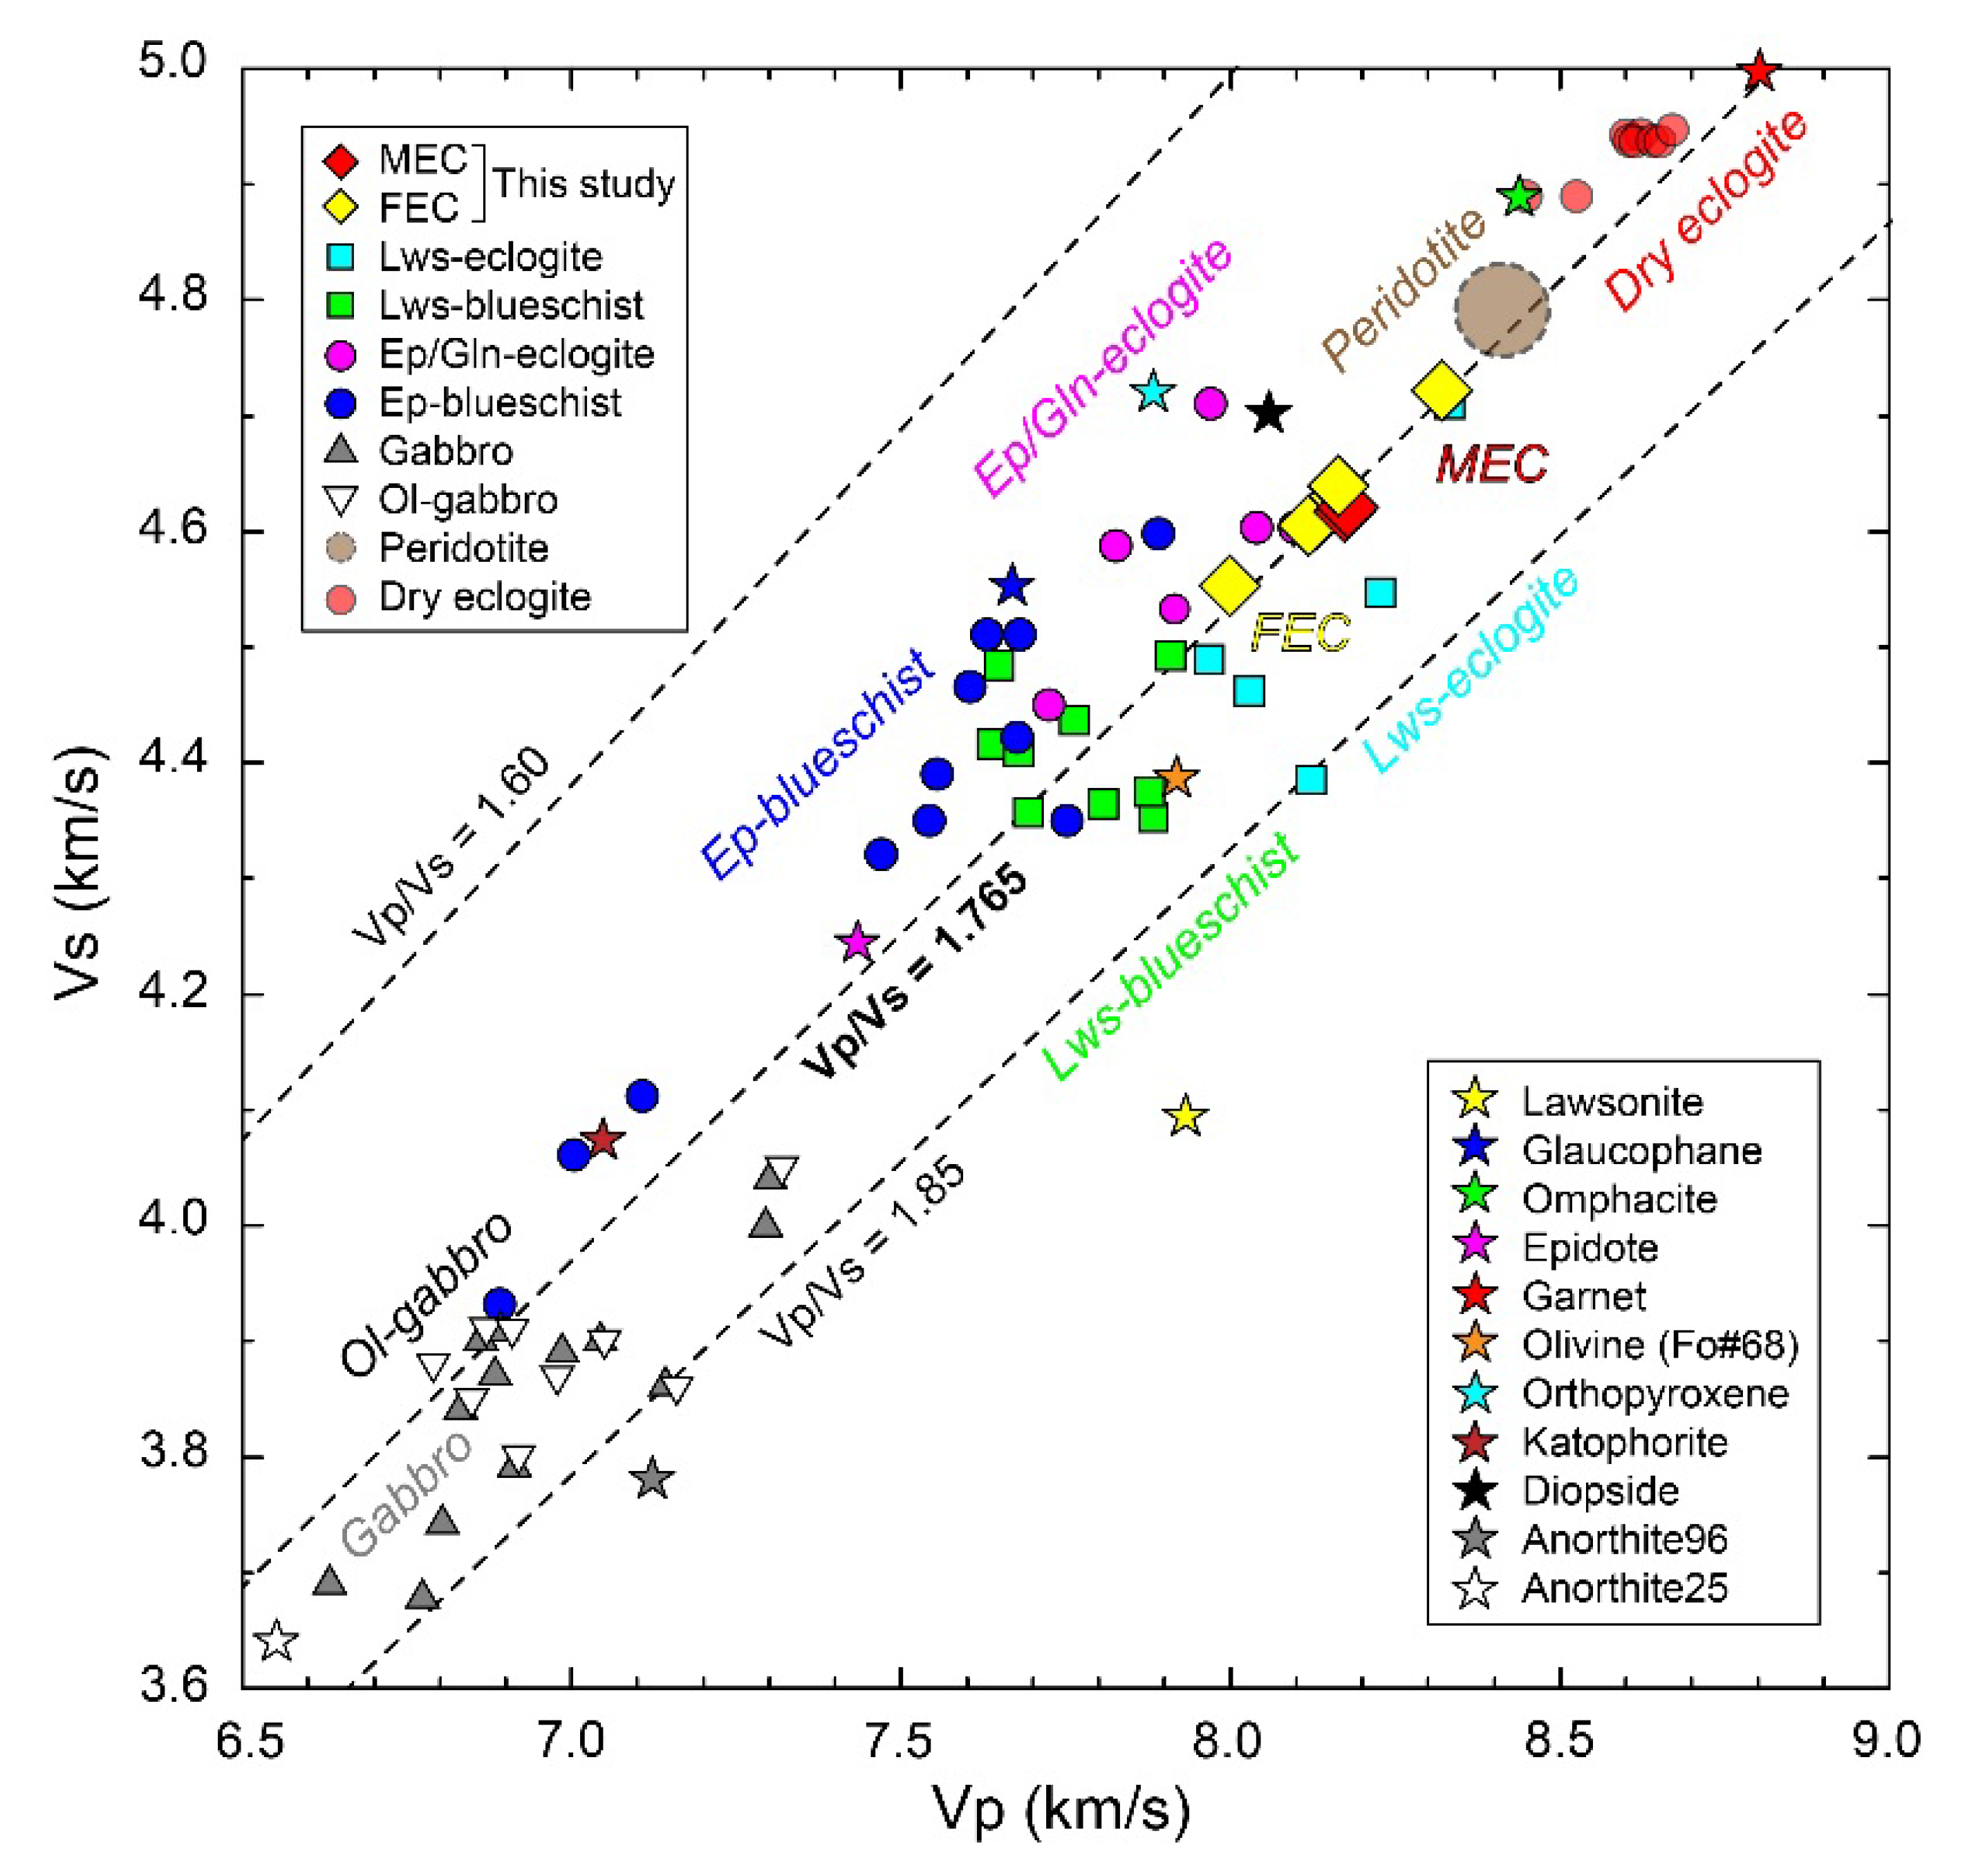
  • The Vp/Vs ratios were almost constant (≈1.765) between the Flem eclogite samples. These values were similar to the Vp/Vs ratios of peridotite and slightly higher than the dry eclogite that was free of olivine, suggesting that the abundance of olivine was the source of their high Vp/Vs ratios.
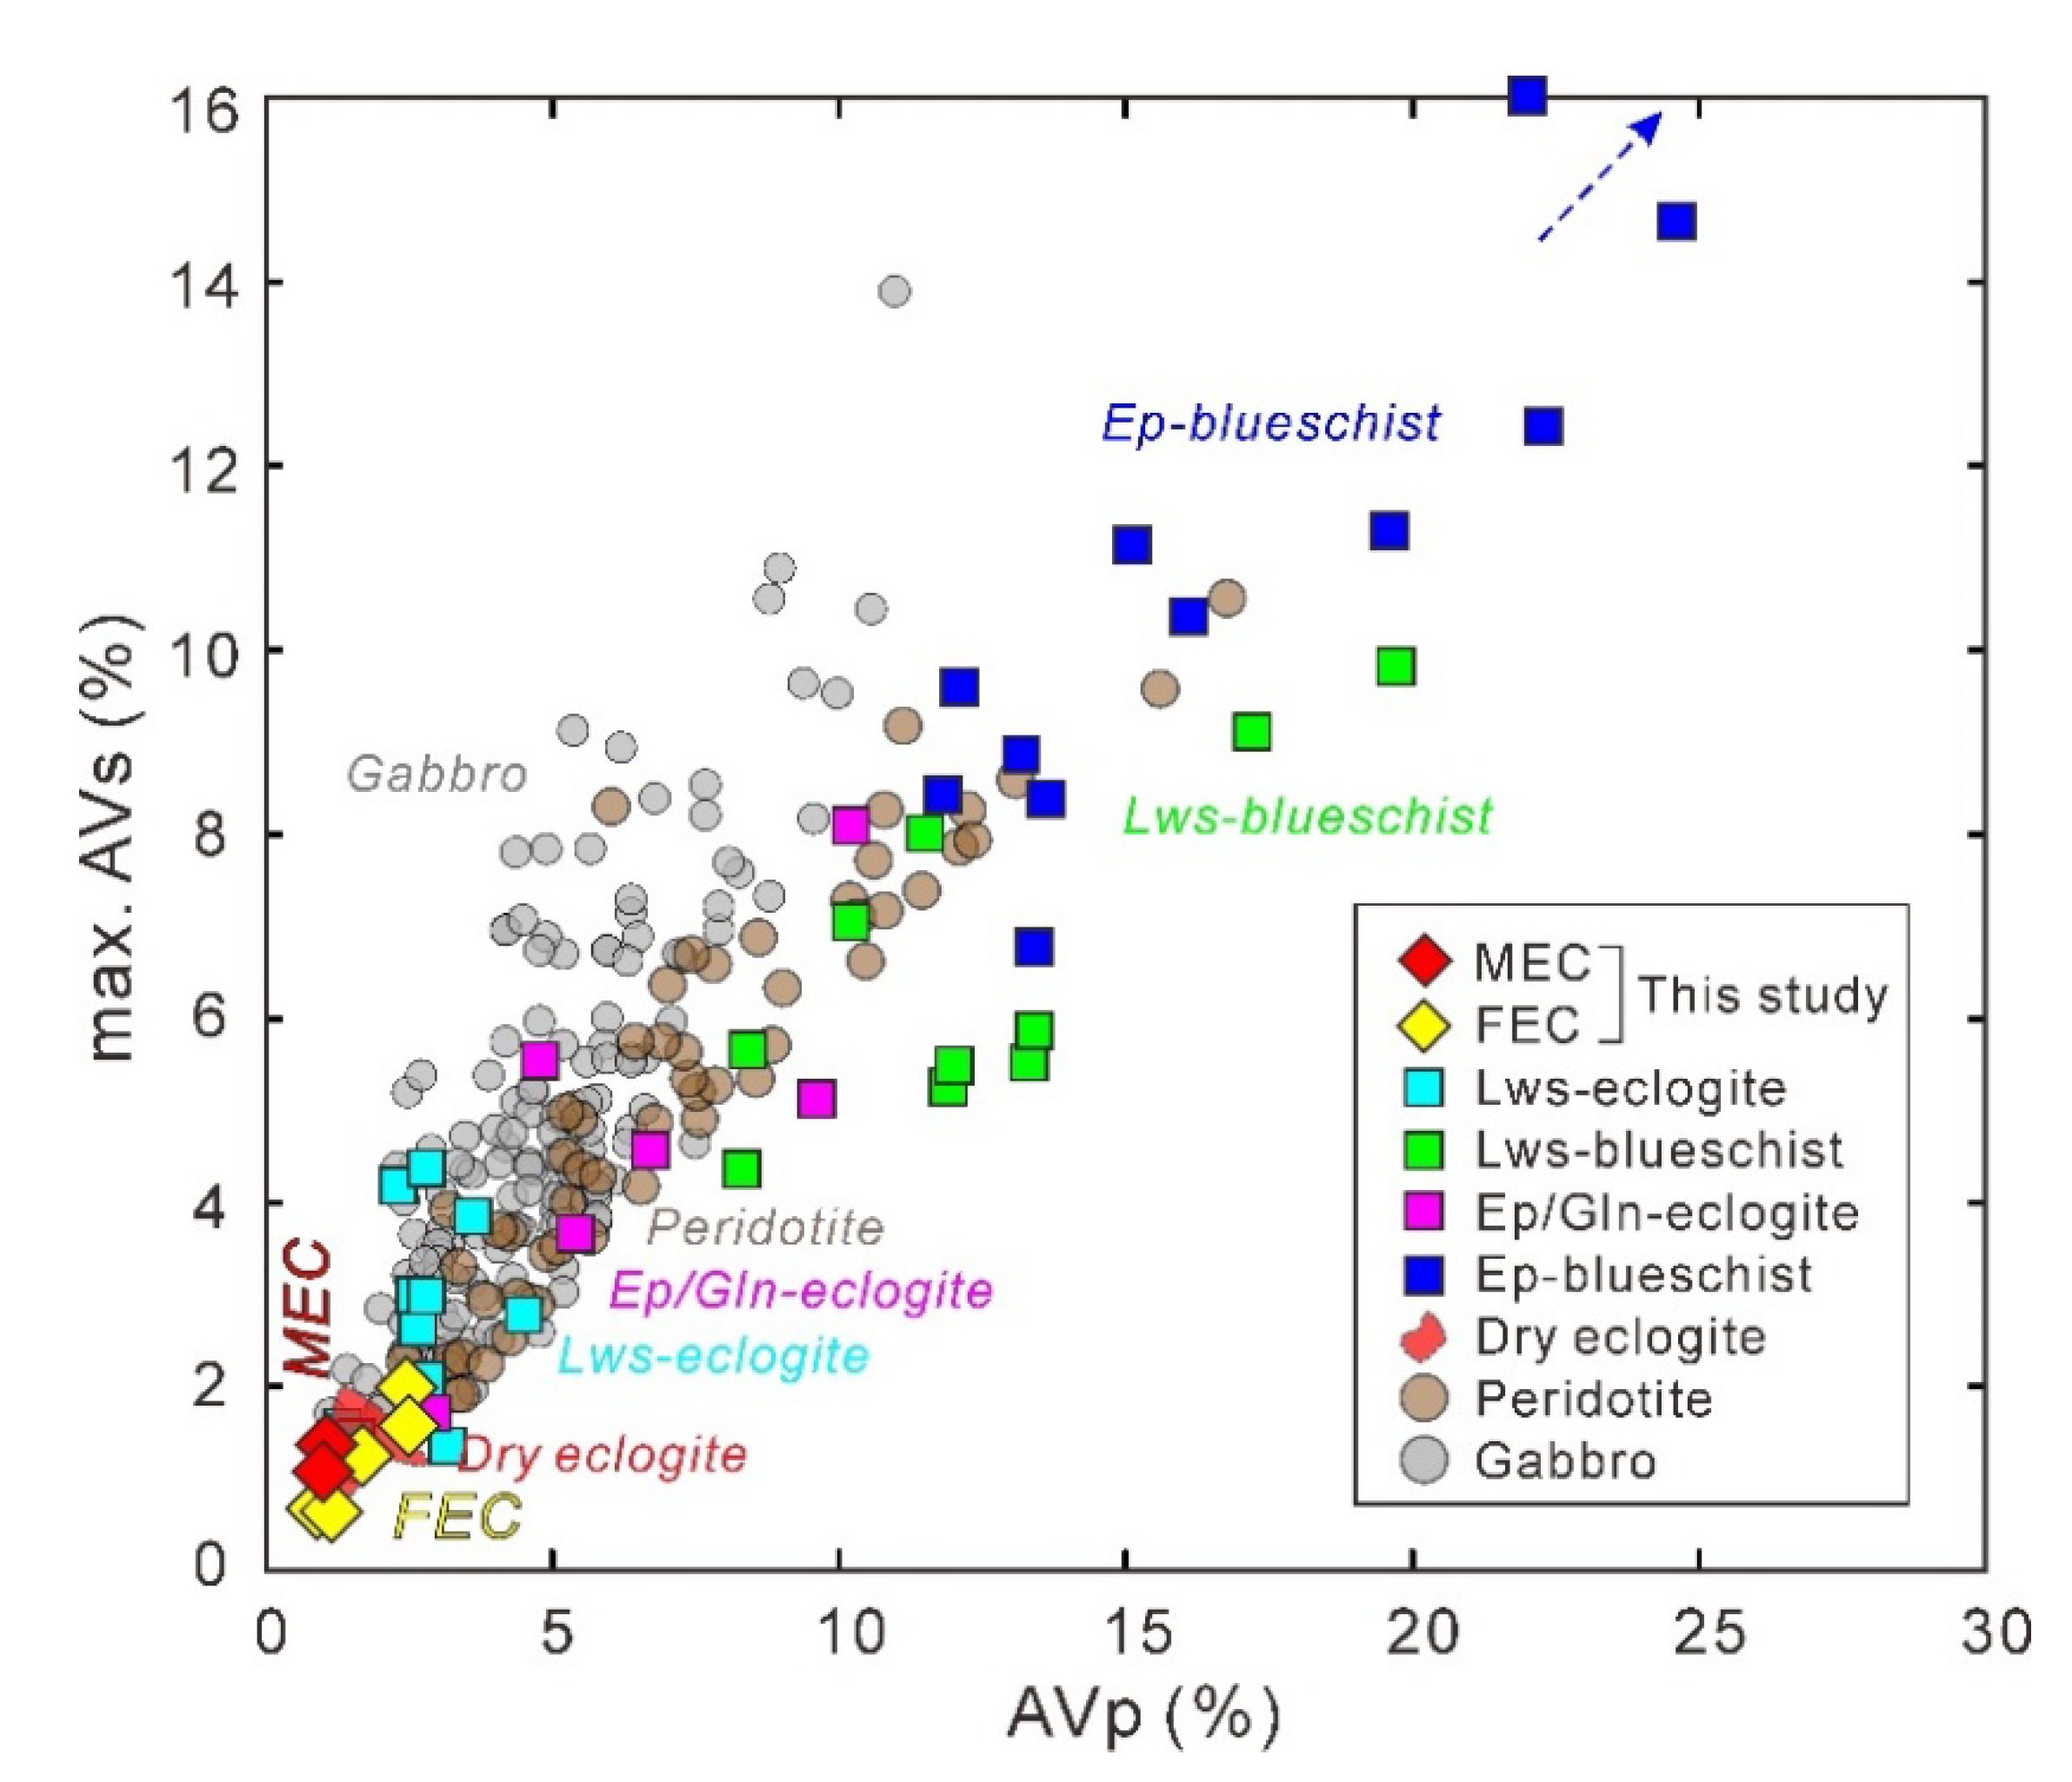
  • Compared to other common rock types, including hydrous-phase-bearing eclogite, blueschist, peridotite, and gabbro, the AVp and max. AVs of Flem eclogite were very low and similar to those of dry eclogite. In contrast, the average Vp and Vs of the Flem eclogite were remarkably larger than the hydrous-phase-bearing eclogite, blueschist, and gabbro, but lower than the dry eclogite and peridotite. The Vp/Vs ratios of the Flem eclogite were relatively higher than those of dry, non-retrograded, and retrograded eclogite, but significantly lower than gabbro. These results thus highlight the feasibilities of utilizing seismic anisotropies, velocities, and Vp/Vs ratios for differentiating olivine-rich eclogite (e.g., Flem eclogite) bodies from their country rocks (e.g., gabbro) in the deep continental crust or subduction channel when high-resolution seismic wave data are available.

Supplementary Materials

The following are available online at https://www.mdpi.com/2075-163X/10/9/774/s1, Figure S1: Seismic properties of the olivine aggregates in the MEC and FEC and olivine single crystal at ambient condition; Figure S2: Seismic properties of the orthopyroxene aggregates in the MEC and FEC and orthopyroxene single crystal at ambient condition; Figure S3: Seismic properties of the garnet aggregates in the MEC and FEC and garnet single crystals in MEC and FEC at ambient condition; Figure S4: Seismic properties of the omphacite aggregates in the MEC and FEC and omphacite single crystal at ambient condition; Figure S5: Seismic properties of the amphibole aggregates in the MEC and FEC and amphibole single crystal at ambient condition.

Author Contributions

Conceptualization, Y.C.; methodology, Y.C.; formal analysis, Y.C.; investigation, Y.C. and J.M.; resources, H.J.; data curation, Y.C.; writing—original draft preparation, Y.C.; writing—review and editing, H.J. and J.M.; visualization, Y.C.; funding acquisition, Y.C. and H.J. All authors have read and agreed to the published version of the manuscript.

Funding

This research was funded by the National Natural Science Foundation of China (grant no. 41902222 to Y.C.), National Research Foundation of Korea (grant no. 2020R1A2CZ003765 to H.J.), and 111 Project of China (grant no. BP0719022).

Acknowledgments

The authors thank Håkon Austrheim for his assistance in collecting eclogite samples for this study. The authors are also grateful to Ruth Keppler and three anonymous reviewers for their helpful comments.

Conflicts of Interest

The authors declare no conflict of interest.

References

  1. Godard, G. Eclogites and their geodynamic interpretation: A history. J. Geodyn. 2001, 32, 165–203. [Google Scholar] [CrossRef]
  2. Austrheim, H. Fluid and deformation induced metamorphic processes around Moho beneath continent collision zones: Examples from the exposed root zone of the Caledonian mountain belt, W-Norway. Tectonophysics 2013, 609, 620–635. [Google Scholar] [CrossRef]
  3. Peacock, S.M. The importance of blueschist—Eclogite dehydration reactions in subducting oceanic crust. Geol. Soc. Am. Bull. 1993, 105, 684–694. [Google Scholar] [CrossRef]
  4. Carswell, D.A. Eclogite Facies Rocks; Springer: Heidelberg, The Netherlands, 1990. [Google Scholar]
  5. Liou, J.G.; Zhang, R.Y.; Ernst, W.G.; Rumble, D.; Maruyama, S. High-pressure minerals from deeply subducted metamorphic rocks. Rev. Mineral. Geochem. 1998, 37, 33–96. [Google Scholar]
  6. Wei, C.J.; Yang, Y.; Su, X.L.; Song, S.G.; Zhang, L.F. Metamorphic evolution of low-T eclogite from the North Qilian orogen, NW China: Evidence from petrology and calculated phase equilibria in the system NCKFMASHO. J. Metamorph. Geol. 2009, 27, 55–70. [Google Scholar] [CrossRef]
  7. Hacker, B.R.; Abers, G.A.; Peacock, S.M. Subduction factory 1. Theoretical mineralogy, densities, seismic wave speeds, and H2O contents. J. Geophys. Res. Solid Earth 2003, 108, 1–26. [Google Scholar] [CrossRef]
  8. Mørk, M.B.E. Coronite and eclogite formation in olivine gabbro (Western Norway): Reaction paths and garnet zoning. Mineral. Mag. 1986, 50, 417–426. [Google Scholar] [CrossRef]
  9. Christensen, N.I.; Mooney, W.D. Seismic velocity structure and composition of the continental crust: A global view. J. Geophys. Res. 1995, 100, 9761–9788. [Google Scholar] [CrossRef]
  10. Fountain, D.M.; Boundy, T.M.; Austrheim, H.; Rey, P. Eclogite-facies shear zones--deep crustal reflectors? Tectonophysics 1994, 232, 411–424. [Google Scholar] [CrossRef] [Green Version]
  11. Warner, M.; McGeary, S. Seismic reflection coefficients from mantle fault zones. Geophys. J. R. Astron. Soc. 1987, 89, 223–230. [Google Scholar] [CrossRef]
  12. Keppler, R.; Behrmann, J.H.; Stipp, M. Textures of eclogites and blueschists from Syros island, Greece: Inferences for elastic anisotropy of subducted oceanic crust. J. Geophys. Res. Solid Earth 2017, 122, 5306–5324. [Google Scholar] [CrossRef]
  13. Cao, Y.; Jung, H. Seismic properties of subducting oceanic crust: Constraints from natural lawsonite-bearing blueschist and eclogite in Sivrihisar Massif, Turkey. Phys. Earth Planet. Inter. 2016, 250, 12–30. [Google Scholar] [CrossRef]
  14. Cao, Y.; Jung, H.; Song, S.G. Petro-fabrics and seismic properties of blueschist and eclogite in the North Qilian suture zone, NW China: Implications for the low-velocity upper layer in subducting slab, trench-parallel seismic anisotropy, and eclogite detectability in the subduction zone. J. Geophys. Res. Solid Earth 2013, 118, 3037–3058. [Google Scholar] [CrossRef]
  15. Garber, J.M.; Maurya, S.; Hernandez, J.-A.; Duncan, M.S.; Zeng, L.; Zhang, H.L.; Faul, U.; McCammon, C.; Montagner, J.-P.; Moresi, L.; et al. Multidisciplinary constraints on the abundance of diamond and eclogite in the cratonic lithosphere. Geochem. Geophys. Geosyst. 2018, 19, 2062–2086. [Google Scholar] [CrossRef]
  16. Puelles, P.; Beranoaguirre, A.; Ábalos, B.; Gil Ibarguchi, J.I.; García de Madinabeitia, S.; Rodríguez, J.; Fernández-Armas, S. Eclogite inclusions from subducted metaigneous continental crust (Malpica-Tui Allochthonous Complex, NW Spain): Petrofabric, geochronology, and calculated seismic properties. Tectonics 2017, 36, 1376–1406. [Google Scholar] [CrossRef]
  17. Brownlee, S.J.; Hacker, B.R.; Salisbury, M.; Seward, G.; Little, T.A.; Baldwin, S.L.; Abers, G.A. Predicted velocity and density structure of the exhuming Papua New Guinea ultrahigh-pressure terrane. J. Geophys. Res. Solid Earth 2011, 116. [Google Scholar] [CrossRef]
  18. Haugland, S.M.; Ritsema, J.; Kaneshima, S.; Thorne, M.S. Estimate of the rigidity of eclogite in the lower mantle from waveform modeling of broadband S-to-P wave conversions. Geophys. Res. Lett. Geophys. Res. Lett. 2017, 44, 11778–11784. [Google Scholar] [CrossRef] [Green Version]
  19. Park, M.; Jung, H. Relationships between eclogite-facies mineral assemblages, deformation microstructures, and seismic properties in the Yuka terrane, North Qaidam ultrahigh-pressure metamorphic belt, NW China. J. Geophys. Res. Solid Earth 2019, 124, 13168–13191. [Google Scholar] [CrossRef]
  20. Abalos, B.; Fountain, D.M.; Ibarguchi, J.I.G.; Puelles, P. Eclogite as a seismic marker in subduction channels: Seismic velocities, anisotropy, and petrofabric of Cabo Ortegal eclogite tectonites (Spain). Geol. Soc. Am. Bull. 2011, 123, 439–456. [Google Scholar] [CrossRef]
  21. Sun, S.S.; Ji, S.C.; Wang, Q.; Xu, Z.Q.; Salisbury, M.; Long, C.X. Seismic velocities and anisotropy of core samples from the Chinese Continental Scientific Drilling borehole in the Sulu UHP terrane, eastern China. J. Geophys. Res. Solid Earth 2012, 117, 1–24. [Google Scholar] [CrossRef]
  22. Bascou, J.; Barruol, G.; Vauchez, A.; Mainprice, D.; Egydio-Silva, M. EBSD-measured lattice-preferred orientations and seismic properties of eclogites. Tectonophysics 2001, 342, 61–80. [Google Scholar] [CrossRef] [Green Version]
  23. Wang, Q.; Ji, S.; Salisbury, M.H.; Xia, B.; Pan, M.; Xu, Z. Shear wave properties and Poisson’s ratios of ultrahigh-pressure metamorphic rocks from the Dabie-Sulu orogenic belt, China: Implications for crustal composition. J. Geophys. Res. 2005, 110, B08208. [Google Scholar] [CrossRef]
  24. Llana-Funez, S.; Brown, D. Contribution of crystallographic preferred orientation to seismic anisotropy across a surface analog of the continental Moho at Cabo Ortegal, Spain. Geol. Soc. Am. Bull. 2012, 124, 1495–1513. [Google Scholar] [CrossRef]
  25. Wang, Q.; Burlini, L.; Mainprice, D.; Xu, Z.Q. Geochemistry, petrofabrics and seismic properties of eclogites from the Chinese Continental Scientific Drilling boreholes in the Sulu UHP terrane, eastern China. Tectonophysics 2009, 475, 251–266. [Google Scholar] [CrossRef]
  26. Kim, D.; Kim, T.; Lee, J.; Kim, Y.; Kim, H.; Lee, J.I. Microfabrics of omphacite and garnet in eclogite from the Lanterman Range, northern Victoria Land, Antarctica. Geosci. J. 2018, 22, 939–953. [Google Scholar] [CrossRef]
  27. Zhang, J.F.; Wang, Y.F.; Jin, Z.M. CPO-induced seismic anisotropy in UHP eclogites. Sci. China Ser. D 2008, 51, 11–21. [Google Scholar] [CrossRef]
  28. Keppler, R.; Ullemeyer, K.; Behrmann, J.H.; Stipp, M.; Kurzawski, R.M.; Lokajíček, T. Crystallographic preferred orientations of exhumed subduction channel rocks from the Eclogite Zone of the Tauern Window (Eastern Alps, Austria), and implications on rock elastic anisotropies at great depths. Tectonophysics 2015, 647–648, 89–104. [Google Scholar] [CrossRef] [Green Version]
  29. Kern, H.; Jin, Z.; Gao, S.; Popp, T.; Xu, Z. Physical properties of ultrahigh-pressure metamorphic rocks from the Sulu terrain, eastern central China: Implications for the seismic structure at the Donghai (CCSD) drilling site. Tectonophysics 2002, 354, 315–330. [Google Scholar] [CrossRef]
  30. Kern, H.; Gao, S.; Jin, Z.M.; Popp, T.; Jin, S.Y. Petrophysical studies on rocks from the Dabie ultrahigh-pressure (UHP) metamorphic belt, Central China: Implications for the composition and delamination of the lower crust. Tectonophysics 1999, 301, 191–215. [Google Scholar] [CrossRef]
  31. Brown, D.; Llana-Funez, S.; Carbonell, R.; Alvarez-Marron, J.; Marti, D.; Salisbury, M. Laboratory measurements of P-wave and S-wave velocities across a surface analog of the continental crust-mantle boundary: Cabo Ortegal, Spain. Earth Planet. Sci. Lett. 2009, 285, 27–38. [Google Scholar] [CrossRef]
  32. Kim, D.; Wallis, S.; Endo, S.; Ree, J.-H. Seismic properties of lawsonite eclogites from the southern Motagua fault zone, Guatemala. Tectonophysics 2016, 677–678, 88–98. [Google Scholar] [CrossRef]
  33. Mørk, M.B.E. A gabbro to eclogite transition on Flemsøy, Sunnmøre, western Norway. Chem. Geol. 1985, 50, 283–310. [Google Scholar] [CrossRef]
  34. Hacker, B.R.; Gans, P.B. Continental collisions and the creation of ultrahigh-pressure terranes: Petrology and thermochronology of nappes in the central Scandinavian Caledonides. Geol. Soc. Am. Bull. 2005, 117, 117–134. [Google Scholar] [CrossRef]
  35. Andersen, T.B.; Jamtveit, B.; Dewey, J.F.; Swensson, E. Subduction and eduction of continental crust: Major mechanisms during continent-continent collision and orogenic extensional collapse, a model based on the south Norwegian Caledonides. Terra Nova 1991, 3, 303–310. [Google Scholar] [CrossRef]
  36. Hacker, B.R.; Andersen, T.B.; Johnston, S.; Kylander-Clark, A.R.C.; Peterman, E.M.; Walsh, E.O.; Young, D. High-temperature deformation during continental-margin subduction & exhumation: The ultrahigh-pressure Western Gneiss Region of Norway. Tectonophysics 2010, 480, 149–171. [Google Scholar] [CrossRef] [Green Version]
  37. Kylander-Clark, A.R.C.; Hacker, B.R.; Johnson, C.M.; Beard, B.L.; Mahlen, N.J.; Lapen, T.J. Coupled Lu–Hf and Sm–Nd geochronology constrains prograde and exhumation histories of high- and ultrahigh-pressure eclogites from western Norway. Chem. Geol. 2007, 242, 137–154. [Google Scholar] [CrossRef]
  38. Terry, M.P.; Robinson, P. Geometry of eclogite-facies structural features: Implications for production and exhumation of ultrahigh-pressure and high-pressure rocks, Western Gneiss Region, Norway. Tectonics 2004, 23, 1–23. [Google Scholar] [CrossRef]
  39. Terry, M.P.; Robinson, P.; Ravna, E.J.K. Kyanite eclogite thermobarometry and evidence for thrusting of UHP over HP metamorphic rocks, Nordøyane, Western Gneiss Region, Norway. Am. Mineral. 2000, 85, 1637–1650. [Google Scholar] [CrossRef]
  40. Carswell, D.A.; Van Roermund, H.L.M.; De Vries, D.F.W. Scandian ultrahigh-pressure metamorphism of Proterozoic basement rocks on Fjørtoft and Otrøy, Western Gneiss Region, Norway. Int. Geol. Rev. 2006, 48, 957–977. [Google Scholar] [CrossRef]
  41. Butler, J.P.; Jamieson, R.A.; Steenkamp, H.M.; Robinson, P. Discovery of coesite–eclogite from the Nordøyane UHP domain, Western Gneiss Region, Norway: Field relations, metamorphic history, and tectonic significance. J. Metamorph. Geol. 2013, 31, 147–163. [Google Scholar] [CrossRef]
  42. Cao, Y.; Du, J.; Park, M.; Jung, S.; Park, Y.; Kim, D.; Choi, S.; Jung, H.; Austrheim, H. Metastability and nondislocation-based deformation mechanisms of the Flem eclogite in the Western Gneiss Region, Norway. J. Geophys. Res. Solid Earth 2020, 125, e2020JB019375. [Google Scholar] [CrossRef]
  43. Renedo, R.N.; Nachlas, W.O.; Whitney, D.L.; Teyssier, C.; Piazolo, S.; Gordon, S.M.; Fossen, H. Fabric development during exhumation from ultrahigh-pressure in an eclogite-bearing shear zone, Western Gneiss Region, Norway. J. Struct. Geol. 2015, 71, 58–70. [Google Scholar] [CrossRef]
  44. Bunge, H. Texture Analysis in Materials Science: Mathematical Models; Butterworths: London, UK, 1982. [Google Scholar]
  45. Skemer, P.; Katayama, B.; Jiang, Z.T.; Karato, S. The misorientation index: Development of a new method for calculating the strength of lattice-preferred orientation. Tectonophysics 2005, 411, 157–167. [Google Scholar] [CrossRef]
  46. Hielscher, R.; Schaeben, H. A novel pole figure inversion method: Specification of the MTEX algorithm. J. Appl. Crystallogr. 2008, 41, 1024–1037. [Google Scholar] [CrossRef]
  47. Bachmann, F.; Hielscher, R.; Schaeben, H. Texture Analysis with MTEX–Free and Open Source Software Toolbox. Solid State Phenom. 2010, 160, 63–68. [Google Scholar] [CrossRef] [Green Version]
  48. Mainprice, D. A FORTRAN program to calculate seismic anisotropy from the lattice preferred orientation of minerals. Comput. Geosci. 1990, 16, 385–393. [Google Scholar] [CrossRef]
  49. Brown, J.M.; Abramson, E.H. Elasticity of calcium and calcium-sodium amphiboles. Phys. Earth Planet. Inter. 2016, 261, 161–171. [Google Scholar] [CrossRef]
  50. Webb, S.L.; Jackson, I. The pressure dependence of the elastic moduli of single-crystal orthopyroxene (Mg0.8Fe0.2)SiO3. Eur. J. Mineral. 1993, 5, 1111–1120. [Google Scholar] [CrossRef]
  51. Alexandrov, K.S.; Ryzhova, T.V. Elastic properties of rock-forming minerals. II. Layered silicates. Bull. Acad. Sci. USSR Geophys. Ser. 1961, 9, 1165–1168. [Google Scholar]
  52. Brown, J.M.; Angel, R.J.; Ross, N.L. Elasticity of plagioclase feldspars. J. Geophys. Res. Solid Earth 2016, 121, 663–675. [Google Scholar] [CrossRef]
  53. Duan, Y.; Li, X.; Sun, N.; Ni, H.; Tkachev, S.N.; Mao, Z. Single-crystal elasticity of MgAl2O4-spinel up to 10.9 GPa and 1000 K: Implication for the velocity structure of the top upper mantle. Earth Planet. Sci. Lett. 2018, 481, 41–47. [Google Scholar] [CrossRef]
  54. Hao, M.; Zhang, J.S.; Pierotti, C.E.; Ren, Z.; Zhang, D. High-pressure single-crystal elasticity and thermal equation of state of omphacite and their implications for the seismic properties of eclogite in the Earth’s interior. J. Geophys. Res. Solid Earth 2019, 124, 2368–2377. [Google Scholar] [CrossRef]
  55. Isaak, D.G.; Anderson, O.L.; Goto, T.; Suzuki, I. Elasticity of single-crystal forsterite measured to 1700 K. J. Geophys. Res. Solid Earth 1989, 94, 5895–5906. [Google Scholar] [CrossRef]
  56. Speziale, S.; Duffy, T.S.; Angel, R.J. Single-crystal elasticity of fayalite to 12 GPa. J. Geophys. Res. Solid Earth 2004, 109. [Google Scholar] [CrossRef] [Green Version]
  57. Jiang, F.; Speziale, S.; Duffy, T.S. Single-crystal elasticity of grossular- and almandine-rich garnets to 11 GPa by Brillouin scattering. J. Geophys. Res. Solid Earth 2004, 109, 1–10. [Google Scholar] [CrossRef]
  58. Chai, M.; Brown, J.M.; Slutsky, L.J. The elastic constants of a pyrope-grossular-almandine garnet to 20 GPa. Geophys. Res. Lett. 1997, 24, 523–526. [Google Scholar] [CrossRef]
  59. Wang, H.; Simmons, G. Elasticity of some mantle crystal structures 3. spessartite-almandine garnet. J. Geophys. Res. Solid Earth 1974, 79, 2607–2613. [Google Scholar] [CrossRef]
  60. Liebermann, R.C. Elasticity of ilmenites. Phys. Earth Planet. Inter. 1976, 12, 5–10. [Google Scholar] [CrossRef]
  61. Almqvist, B.S.G.; Mainprice, D. Seismic properties and anisotropy of the continental crust: Predictions based on mineral texture and rock microstructure. Rev. Geophys. 2017, 55, 367–433. [Google Scholar] [CrossRef] [Green Version]
  62. Mainprice, D.; Hielscher, R.; Schaeben, H. Calculating anisotropic physical properties from texture data using the MTEX open-source package. Geol. Soc. Spec. Publ. 2011, 360, 175–192. [Google Scholar] [CrossRef] [Green Version]
  63. Vasin, R.N.; Kern, H.; Lokajíček, T.; Svitek, T.; Lehmann, E.; Mannes, D.C.; Chaouche, M.; Wenk, H.R. Elastic anisotropy of Tambo gneiss from Promontogno, Switzerland: A comparison of crystal orientation and microstructure-based modelling and experimental measurements. Geophys. J. Int. 2017, 209, 1–20. [Google Scholar] [CrossRef] [Green Version]
  64. Kern, H.; Ivankina, T.I.; Nikitin, A.N.; Lokajíček, T.; Pros, Z. The effect of oriented microcracks and crystallographic and shape preferred orientation on bulk elastic anisotropy of a foliated biotite gneiss from Outokumpu. Tectonophysics 2008, 457, 143–149. [Google Scholar] [CrossRef]
  65. Ullemeyer, K.; Siegesmund, S.; Rasolofosaon, P.N.J.; Behrmann, J.H. Experimental and texture-derived P-wave anisotropy of principal rocks from the TRANSALP traverse: An aid for the interpretation of seismic field data. Tectonophysics 2006, 414, 97–116. [Google Scholar] [CrossRef]
  66. Ivankina, T.I.; Kern, H.M.; Nikitin, A.N. Directional dependence of P- and S-wave propagation and polarization in foliated rocks from the Kola superdeep well: Evidence from laboratory measurements and calculations based on TOF neutron diffraction. Tectonophysics 2005, 407, 25–42. [Google Scholar] [CrossRef]
  67. Ullemeyer, K.; Lokajíček, T.; Vasin, R.N.; Keppler, R.; Behrmann, J.H. Extrapolation of bulk rock elastic moduli of different rock types to high pressure conditions and comparison with texture-derived elastic moduli. Phys. Earth Planet. Inter. 2018, 275, 32–43. [Google Scholar] [CrossRef]
  68. Ullemeyer, K.; Nikolayev, D.I.; Christensen, N.I.; Behrmann, J.H. Evaluation of intrinsic velocity—Pressure trends from low-pressure P-wave velocity measurements in rocks containing microcracks. Geophys. J. Int. 2011, 185, 1312–1320. [Google Scholar] [CrossRef] [Green Version]
  69. Cao, Y.; Jung, H.; Song, S.G. Microstructures and petro-fabrics of lawsonite blueschist in the North Qilian suture zone, NW China: Implications for seismic anisotropy of subducting oceanic crust. Tectonophysics 2014, 628, 140–157. [Google Scholar] [CrossRef]
  70. Kim, D.; Katayama, I.; Michibayashi, K.; Tsujimori, T. Deformation fabrics of natural blueschists and implications for seismic anisotropy in subducting oceanic crust. Phys. Earth Planet. Inter. 2013, 222, 8–21. [Google Scholar] [CrossRef]
  71. Worthington, J.R.; Hacker, B.R.; Zandt, G. Distinguishing eclogite from peridotite: EBSD-based calculations of seismic velocities. Geophys. J. Int. 2013. [Google Scholar] [CrossRef] [Green Version]
  72. Ji, S.; Shao, T.; Salisbury, M.H.; Sun, S.; Michibayashi, K.; Zhao, W.; Long, C.; Liang, F.; Satsukawa, T. Plagioclase preferred orientation and induced seismic anisotropy in mafic igneous rocks. J. Geophys. Res. Solid Earth 2014. [Google Scholar] [CrossRef]
  73. Ha, Y.; Jung, H.; Raymond, L.A. Deformation fabrics of glaucophane schists and implications for seismic anisotropy: The importance of lattice preferred orientation of phengite. Int. Geol. Rev. 2018, 61, 720–737. [Google Scholar] [CrossRef]
  74. Bezacier, L.; Reynard, B.; Bass, J.D.; Wang, J.; Mainprice, D. Elasticity of glaucophane, seismic velocities and anisotropy of the subducted oceanic crust. Tectonophysics 2010, 494, 201–210. [Google Scholar] [CrossRef]
  75. Kang, H.; Jung, H. Lattice-preferred orientation of amphibole, chlorite, and olivine found in hydrated mantle peridotites from Bjørkedalen, southwestern Norway, and implications for seismic anisotropy. Tectonophysics 2019, 750, 137–152. [Google Scholar] [CrossRef]
  76. Kourim, F.; Beinlich, A.; Wang, K.-L.; Michibayashi, K.; O’Reilly, S.Y.; Pearson, N.J. Feedback of mantle metasomatism on olivine micro–fabric and seismic properties of the deep lithosphere. Lithos 2019, 328–329, 43–57. [Google Scholar] [CrossRef]
  77. Demouchy, S.; Tommasi, A.; Ionov, D.; Higgie, K.; Carlson, R.W. Microstructures, water contents, and seismic properties of the mantle lithosphere beneath the northern limit of the Hangay Dome, Mongolia. Geochem. Geophys. Geosyst. 2019, 20, 183–207. [Google Scholar] [CrossRef] [Green Version]
  78. Tommasi, A.; Baptiste, V.; Vauchez, A.; Holtzman, B. Deformation, annealing, reactive melt percolation, and seismic anisotropy in the lithospheric mantle beneath the southeastern Ethiopian rift: Constraints from mantle xenoliths from Mega. Tectonophysics 2016, 682, 186–205. [Google Scholar] [CrossRef]
  79. Satsukawa, T.; Ildefonse, B.; Mainprice, D.; Morales, L.F.G.; Michibayashi, K.; Barou, F. A database of plagioclase crystal preferred orientations (CPO) and microstructures-implications for CPO origin, strength, symmetry and seismic anisotropy in gabbroic rocks. Solid Earth 2013, 4, 511–542. [Google Scholar] [CrossRef] [Green Version]
  80. Birch, F. The velocity of compressional waves in rocks to 10 kilobars: Part 2. J. Geophys. Res. 1961, 66, 2199–2224. [Google Scholar] [CrossRef]
  81. Pera, E.; Mainprice, D.; Burlini, L. Anisotropic seismic properties of the upper mantle beneath the Torre Alfina area (Northern Appennines, Central Italy). Tectonophysics 2003, 370, 11–30. [Google Scholar] [CrossRef]
  82. Iturrino, G.; Christensen, N.I.; Kirby, S.; Salisbury, M.H. Seismic velocities and elastic properties of oceanic gabbroic rocks from Hole 735B. PANGAEA 1991, 118. [Google Scholar] [CrossRef]
Figure 1. (a) Geological map showing the Western Gneiss Region (WGR) (modified from Renedo et al. [43]). The dark gray shaded area includes three ultrahigh-pressure (UHP) domains (Nordfjord, Sørøyane, and Nordøyane) along the western coast of the WGR. The dashed lines are isobars of peak metamorphic pressures. The blue arrow indicates the Flemsøya region where our eclogite samples were collected. (b) Geological map of the NW part of Flemsøya showing the distributions of eclogite (modified from Mørk [33] and Terry and Robinson [38]). The blue arrow indicates the locality where our eclogite samples were collected.
Minerals 10 00774 g001
Figure 2. Optical photomicrographs under crossed polarizers showing the microstructures of (a) massive eclogite (MEC) and (b) foliated eclogite (FEC). Mineral abbreviations: olivine (Ol), garnet (Grt), amphibole (Amp), and orthopyroxene (Opx).
Minerals 10 00774 g002
Figure 3. Crystal-preferred orientations (CPOs) of Ol (left column), Opx (middle column), and Grt (right column) in the MEC and FEC (modified from Cao et al. [42]). The pole figures are presented with an equal area, in the lower hemisphere, and contoured with a resolution of 1°. The superimposed circles in (f) are scattered orientations of Opx grains. X, Y, and Z denote the lineation, direction perpendicular to the lineation and parallel to the foliation, and foliation-normal direction, respectively. X’ and Y’ are the apparent lineation and the direction perpendicular to the lineation on the apparent foliation (X’Y’ plane). N: number of grains, M: M-index [45], and J: J-index [44].
Minerals 10 00774 g003
Figure 4. CPOs of the Omp (left column) and Amp (right column) in the MEC and FEC (modified from Cao et al. [42]). The method used to plot the pole figures and the associated parameters were the same as those used in Figure 3.
Minerals 10 00774 g004
Figure 5. Bulk rock seismic properties of the MEC and FEC in ambient conditions. (a,b) MEC, (cg) FEC. Data are presented using equal area and upper hemisphere stereonets. First column: P-wave velocity (Vp) and its anisotropy (AVp); second column: shear wave splitting or S-wave polarization anisotropy (AVs) and its maximum (max. AVs); third column: fast S-wave velocity (Vs1) and its anisotropy (AVs1). The black bars in the Vs1 stereonets indicate the polarization directions of the fast shear wave. The structural references (X, Y, Z, X’, and Y’) are the same as in Figure 3.
Minerals 10 00774 g005
Figure 6. (a) AVp and (b) max. AVs of the bulk rock and mono-mineralic polycrystals in the MEC and FEC.
Minerals 10 00774 g006
Figure 7. Comparisons of the bulk rock AVp and max. AVs between the directly calculated values (AVpcal and max. AVscal) and the indirectly averaged values (AVpavg and max. AVsavg). The former were calculated conventionally using CPOs and volume proportions of all constituent minerals. The latter were estimated from the seismic anisotropies of all mono-mineralic polycrystals weighted by their volume proportions. The six and four yellow symbols in the upper and lower parts denote the FEC subgroups 1 and 2, respectively.
Minerals 10 00774 g007
Figure 8. Relations between the phase volume proportions and the bulk rock (a) P-wave anisotropy (AVp) and (b) maximum S-wave polarization anisotropy (max. AVs) in the MEC and FEC. The blue dashed lines are the best-fitting curves along with their fitting functions for Amp.
Minerals 10 00774 g008
Figure 9. Relations between the bulk rock CPO strength (J- and M-index) and bulk rock (a) AVp and (b) max. AVs in the MEC and FEC. The bulk rock J- and M-index were averaged J- and M-index of the constituent minerals weighted by their volume proportions. The six and four yellow symbols in the upper and lower parts of each diagram are the FEC subgroups 1 and 2, respectively. The blue dashed lines are the best-fitting curves along with their fitting functions.
Minerals 10 00774 g009
Figure 10. Seismic anisotropies (AVp and max. AVs) of the Flem eclogite (MEC and FEC) and other rock types in ambient conditions. The blue dashed arrow indicates the trend of even higher seismic anisotropies of the epidote bluseschist, which are outside the diagram. Data source: lawsonite eclogite [13,32], lawsonite blueschist [13,69,70], epidote/glaucophane eclogite [14,73,74], epidote blueschist [14,70,73,74], dry eclogite [22], peridotite [75,76,77,78], and gabbro [79].
Minerals 10 00774 g010
Figure 11. Relations between the phase volume proportions and the bulk rock (a) Vp, (b) Vs, and (c) Vp/Vs ratio in the MEC and FEC. The blue, magenta, orange, and green dashed lines are the best-fitting curves, along with their fitting functions, for Amp, Omp, Ol, and Grt, respectively.
Minerals 10 00774 g011
Figure 12. Relations between the bulk rock averaged seismic velocities (Vp and Vs) and density.
Minerals 10 00774 g012
Figure 13. Seismic velocities (Vp and Vs) of the Flem eclogite (MEC and FEC) and other rock types in ambient conditions. The star symbols denote the seismic velocities of isotropic mono-mineralic polycrystals. Data source:s lawsonite eclogite [13], lawsonite blueschsit [13,69,70], epidote/glaucophane eclogite [14,73,74], epidote blueschsit [14,70,73,74], dry eclogite [22], peridotite [81], (olivine) gabbro [82].
Minerals 10 00774 g013
Table 1. Normalized phase volume proportions (vol.%) based on electron backscatter diffraction (EBSD) mapping.
SampleRock TypeGrtOmpOlOpxAmpPhlIlmPlSp
NW1140MEC21.6429.3740.122.782.971.291.400.400.03
NW1153MEC24.4121.1040.686.392.731.192.111.030.34
NW1142FEC (subgroup 1)30.5513.2516.034.3733.281.150.980.370.02
NW1143FEC (subgroup 1)22.9530.0330.002.6312.051.000.820.500.02
NW1144FEC (subgroup 1)31.8226.4221.062.1016.471.000.930.170.02
NW1147FEC (subgroup 2)36.5638.2918.450.364.710.880.550.190.03
NW1148FEC (subgroup 2)29.7924.2527.742.7111.992.250.770.460.04
Mineral abbreviations: garnet (Grt), omphacite (Omp), olivine (Ol), orthopyroxene (Opx), amphibole (Amp), phlogopite (Phl), ilmenite (Ilm), plagioclase (Pl), and spinel (Sp).
Table 2. Calculated seismic properties of the studied MEC and FEC samples.
SampleRock TypeDensity (g/cm3)Vp (km/s) 1Vs (km/s) 1Vp/VsAVp (%) 2max. AVs (%) 2AVs1 (%) 3AVs2 (%) 3A(Vp/Vs1) (%) 4A(Vp/Vs2) (%) 4
NW1140MEC3.5628.174.611.7701.061.000.620.911.221.19
NW1153MEC3.5798.184.621.7691.081.381.120.951.561.60
NW1142FEC (subgroup 1)3.5198.004.551.7582.461.571.131.081.591.96
NW1143FEC (subgroup 1)3.5178.134.611.7652.421.991.601.261.952.06
NW1144FEC (subgroup 1)3.5498.184.641.7621.781.300.970.861.201.41
NW1147FEC (subgroup 2)3.5758.334.721.7631.090.630.300.491.110.91
NW1148FEC (subgroup 2)3.5478.154.621.7660.990.650.480.420.880.75
1 Vp = ( Vp m a x + Vp m i n ) / 2 and Vs = ( Vs 1 m a x + Vs 1 m i n + Vs 2 m a x + Vs 2 m i n ) / 4 ; 2 AVp = 200 × ( Vp m a x Vp m i n ) / ( Vp m a x + Vp m i n ) and AVs = 200 × ( Vs 1 Vs 2 ) / ( Vs 1 + Vs 2 ) ; 3 AVs 1 = 200 × ( Vs 1 m a x Vs 1 m i n ) / ( Vs 1 m a x + Vs 1 m i n ) and AVs 2 = 200 × ( Vs 2 m a x Vs 2 m i n ) / ( Vs 2 m a x + Vs 2 m i n ) ; 4 A ( Vp / Vs 1 ) = 200 × ( Vp / Vs 1 m a x Vp / Vs 1 m i n ) / ( Vp / Vs 1 m a x + Vp / Vs 1 m i n ) and A ( Vp / Vs 2 ) = 200 × ( Vp / Vs 2 m a x Vp / Vs 2 m i n ) / ( Vp / Vs 2 m a x + Vp / Vs 2 m i n ) .

