1. Introduction
The purpose of academic evaluation is to communicate the level of academic achievement that a student has reached to the student, parents, and other teachers so that informed decisions can be made about the student’s future [
1]. For this reason, the evaluation of academic achievement should be as valid as possible. In the field of education, evaluation is classified as either ‘norm referenced’ or ‘criterion referenced’ [
2]. A norm referenced evaluation is a type of evaluation that yields an estimate of the position of the tested individual in a predefined population with respect to the trait being measured [
3]. On the other hand, a criterion referenced evaluation is one that provides for translating test scores into a statement about the behavior to be expected of a person with that score or their relationship to a specified subject matter. There are considerable advantages and disadvantages to each evaluation depending on the intended purpose of the evaluation. In this respect, it is reasonable that academic achievement be conducted by a criterion referenced evaluation to judge whether students have achieved the expected learning outcomes related to educational objectives and goals. Therefore, it is necessary for test standards to be realistic in order for them to be accepted by all stakeholders.
Since standard setting is so critical for evaluation, in the field of education standard setting methods such as Angoff, Bookmark, Jaeger, etc. are generally being used by education expert groups [
4]. Standard setting methods by expert groups, however, is time-consuming and expensive. Moreover, in order to conduct standard setting, item parameters (discrimination, difficulty, etc.) must be obtained through a preliminary examination. Therefore, it is necessary to save costs and time in the process of standard setting.
In past decades, many researchers have attempted to implement computer technologies in education. Data mining among those technologies can be used to extract knowledge by analyzing the information available in the form of data generated by their users [
5]. Especially, clustering is one of the useful techniques for explorative data mining to discover groups or assign a set of objects into clusters [
6]. Since standard setting involves dividing students into groups according to test scores, we can apply clustering to standard setting. However, in order to apply the clustering method to analyze test scores, a proper method for evaluating the results of the clustering is required. The procedure for evaluating the results of a clustering algorithm is known as ‘cluster validity’. However, clustering is perceived as an unsupervised process in that there are no predefined classes and no examples that confirm what kind of desirable relations should be valid among the experimental data. The various clustering evaluation algorithms are based on some assumptions in order to define a partitioning of a data set. As a consequence, they may behave differently depending on the features of the data set and the input parameter values. Since standard setting by the education experts group can be a time-consuming and costly process, it is necessary to seek a way for a general use of standard setting by applying clustering to it. That is, in order to use clustering to determine cut-off scores, it is necessary to choose the most appropriate clustering evaluation method considering item data response.
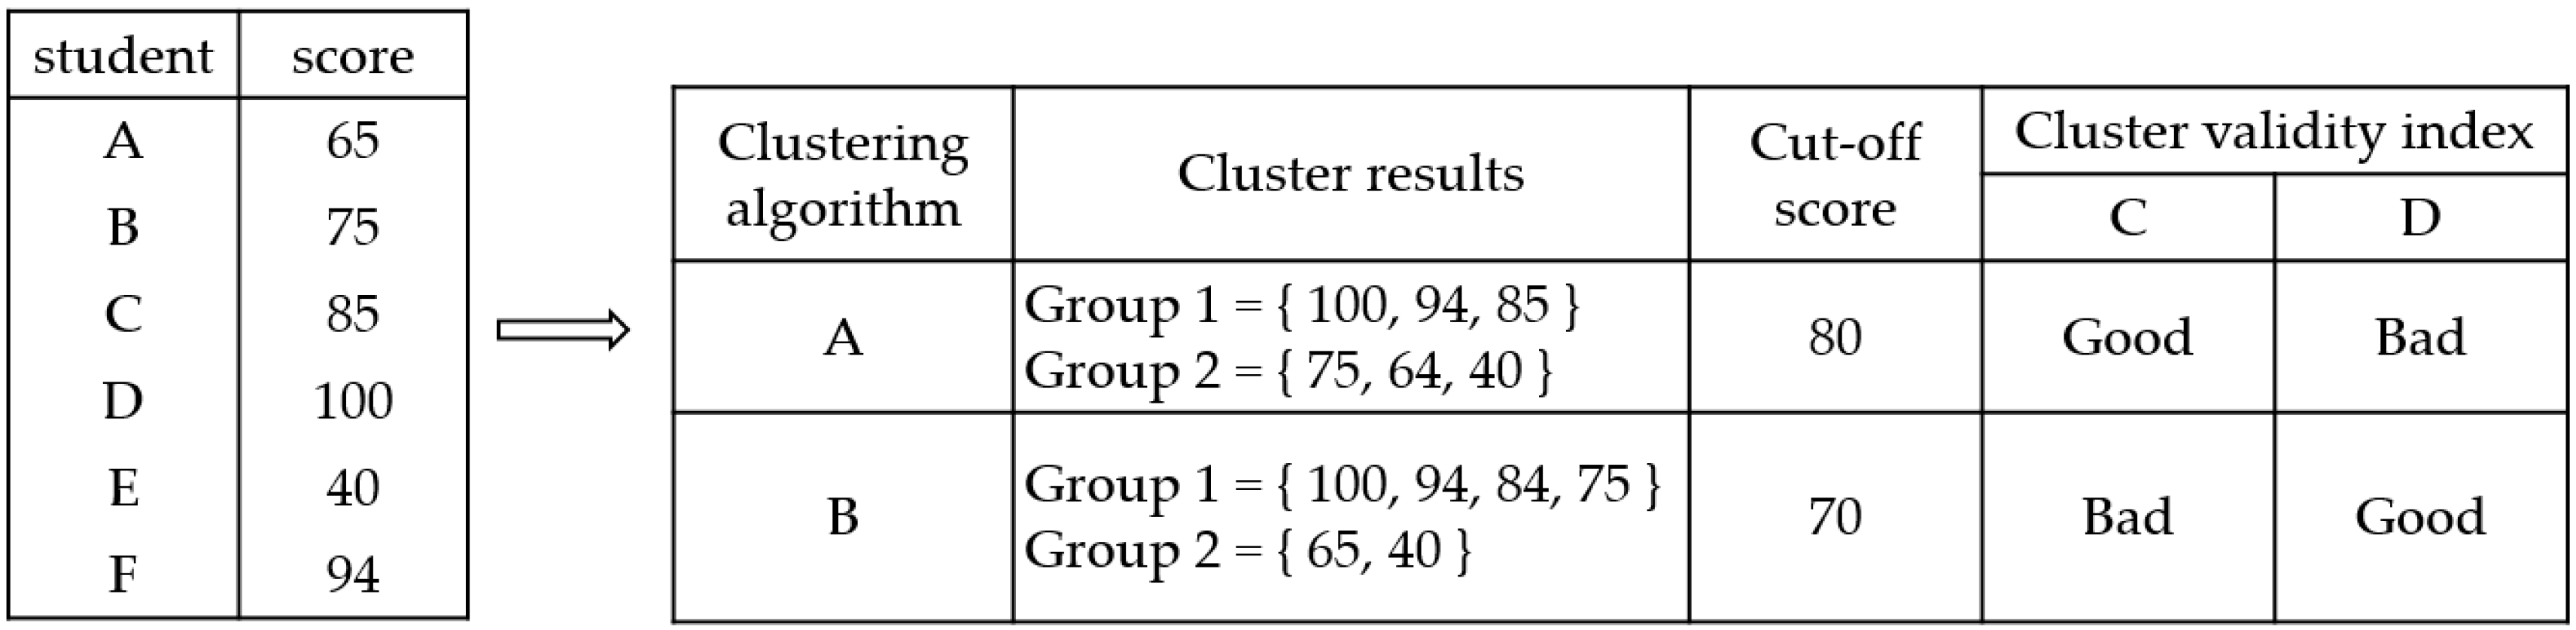
For example, we assume that six students took a test and got their scores individually in
Figure 1. We want to utilize a clustering algorithm for deciding the setting of standards. There are various types of clustering algorithms according to the definition of similarity in a processing of clustering. Given the same data set, clustering results varies since they are obtained by different clustering algorithms. Given six scores, let us suppose that the data analysts use two different clustering algorithms, i.e., A and B. They get two different clustering results and two cut-off scores by each clustering result. However, they do not know which is better cut-off score because clustering analysis is unsupervised learning. Therefore, they have to evaluate each clustering result for selecting the better cut-off score among various clustering results. A method for selecting an appropriate clustering algorithm is to evaluate each result by clustering algorithms after running various clustering algorithms. Cluster validity indices are used to evaluate clustering results. However, there are also many different kinds of cluster validity indices. In this example, we use two cluster validity indices, i.e., C and D. A clustering result by algorithm A is good and one by algorithm B is bad under the cluster validity index C, while a clustering result by algorithm A is bad and one by algorithm B is good under the cluster validity index D. As in this example, choosing a proper cluster validity index is a challenging task.
The purpose of this study is to make a comparative analysis of cut-off scores established by various cluster validity indices considering item parameters. We chose three clustering evaluation methods to compare cut-off scores with those of the expert groups. After clustering, we compared cut-off scores by each cluster validity index to cut-off scores by expert groups using Cohen’s kappa, which evaluates the concordance between the experts and each clustering result.
The contributions of this study are summarized as follows:
We developed the entropy-based cluster validity index, which uses entropy to evaluate clustering results based on item difficulty, i.e., an item characteristic inherent in the item response data.
We founded that domain specific information can be used to improve the quality of feature extraction, similarity computation, grouping, and cluster representation in clustering analysis. It is also important to utilize domain specific information in measuring the validity index to interpret clustering results meaningfully in a specific domain.
We present a usability and applicability of a standard setting method using a clustering algorithm that has been limitedly used for educational purposes in a range of ability tests.
The paper is organized as follows. In
Section 2, we review the related research on item response data analysis using data mining techniques and describe a standard setting process, which is traditionally used by expert groups.
Section 3 outlines cluster validity indices used to compare expert groups.
Section 4 presents clustering evaluation methods for evaluating the results of splitting the class into groups according to their scores, considering a feature of item response data.
Section 5 describes the result of experiment. The analysis and contributions of the study are presented in
Section 6. Finally,
Section 7 concludes with a summary of the key results of this paper and future works.
2. Related Works
2.1. Standard Setting
Criterion referenced evaluation is a tool used in judging an individual’s performance against specific criterion or standards that are predetermined or must be achieved through learning. A criterion referenced test is designed to produce a clear description of what an examinee’s performance on the test actually means [
7]. The term ‘criterion’, ‘standard’, or ‘cut-off’ was regarded as a rule or principle on which a judgment or decision may be based or as an examinee’s level of knowledge or skill to carry out a given task that is assured by the public.
With regard to the criterion-referenced evaluation, students should know the performance standard and the passing score/cut-off score/cut score by which they can know their level of achievement. The performance standard outlines the level of knowledge, skills, or competency that is required for achieving a task, so it is also called the achievement standard. The passing score/cut-off score/cut score is a specified point on a score scale that is related to the performance standard for each achievement level and divides two adjacent scores into two different achievement levels.
To date, a variety of standard setting methods have been developed [
8]. However, many of the methods work best only with a particular item, and thus matching the test format to an appropriate method should help determine which standard setting method should be used or, at the very least, which methods will not be used. Among various standard setting methods, the Angoff method and Bookmark method are commonly used for standard setting [
9].
The Angoff method is one of the longest and most stable standard setting methods among the methods that are used by experts in analyzing the contents of a test tool to set the standard [
8,
9]. In the Angoff method, a group of teachers or evaluation experts evaluate each item and estimate the proportion of minimally competent examinees that would correctly answer the item. The sum of the average rating for each item is set as a cut score. The cut score of multiple levels is one of the modified Angoff methods and is used in dividing the evaluation results into multiple levels. In the large scale assessment, two or more cut scores are set and used in dividing students’ scores into 3 to 5 levels.
While each standard setting method has its own set of unique steps or features, in general ten steps exist in a typical standard setting process. The ten general steps are listed in
Table 1 [
10]. Setting the standard is important not only for large-scale nationwide tests but also for judging students’ achievement levels in school. Teachers in the teaching field need to check if students have achieved the objectives of their respective subjects and units by taking the classes provided in the classroom in order to give students suitable learning opportunities for their achievement levels. Recently, a great deal of research in various courses is being carried out to teach students appropriately with regards to their ability and level of achievement and knowledge. Therefore, it becomes more important to classify according to their test scores for a differentiated curriculum based on the student’s achievement level or selection of excellent students. As the influence of e-learning is increasing in education, standards are needed to group students according to their ability [
11]. Finally, standard setting is becoming more important due to the reform of standards-based education [
12].
As mentioned above, however, dissatisfaction with these standard setting methods by experts has been growing. First, it is time-consuming and too complex to conduct standard setting. Choosing panelists takes time, and most likely the panelists will have to be professionals having ample experience. It will also cost a bit of money to conduct a discussion for setting cut-off scores. Second, there are several drawbacks to using Item Response Theory (IRT) parameter estimates if Bookmark methods are used because calculating parameters for an IRT model is a complicated process and requires a specialized computer program. Third, item parameters such as difficulty, discrimination, and guessing must be obtained in advance through a pre-test [
13].
2.2. Item Response Data Analysis Using Data Mining Techniques
Recently, data mining has been emerging in the field of education to enhance our understanding of learning processes by focusing on identifying, extracting, and evaluating variables related to the learning process of students [
14]. In general, item response data shown in
Table 2 can be obtained as outcome generated through a test. In the item response data, each transaction (i.e., student) has its own score and is considered differently, and ‘1’ means a correct answer, while ‘0’ means wrong. One row has one variable, which is the total score of each student. A wide variety of data mining techniques utilize this item response data as raw data to extract useful information. Research that has analyzed item response data is as follows.
First, researchers have analyzed item response data to extract useful information. Kim and Kwak [
15] proposed information-based pruning for finding interesting association rules in item response data through data mining techniques. Vawter [
16] developed a technique for measuring the entropy state of a student’s exam to interpret a student’s understanding in a multiple choice examination.
Second, researchers have applied the data mining technique in the field of education to analyze students’ achievement result data or to predict students’ performance. Oyelade et al. [
17] implemented a k-mean clustering algorithm for analyzing students’ result data and provided a simple and qualitative methodology to compare the predictive power of a clustering algorithm and the Euclidean distance as a measure of similarity distance. However, the purpose of this research was to monitor the progression of students’ performance in higher institutions not to set cut-off scores.
Ayesha et al. [
18] applied k-means clustering (a data mining technique) to analyze a student’s learning behavior. K-means clustering is used for discovering knowledge that comes from the educational environment. The focus of the research is student evaluation factors like class quizzes, mid-term and final exams, and assignments but not cut-off scores.
Sacin et al. [
19] proposed the use of a recommendation system based on data mining techniques to help students make better decisions regarding their academic pursuits. Shyamala and Rajagopalan [
20] intended to present and justify the capabilities of data mining in higher education by offering a data-mining model for higher educational systems at colleges. It presents an approach to classifying students in order to predict their final grade based on features extracted from educational databases. Sembiring et al. [
21] applied the kernel method as a data mining technique to analyze the relationships between a student’s behavior and their success and to develop a model for student performance predictors.
Many researches try to analyze item response data using data mining techniques, but few studies have determined the cut-off scores for criteria through analysis of item response data. This study presents a method of setting cut-off scores by analyzing item response data using clustering.
Clustering is the most commonly used method of unsupervised learning. It is a data mining technique that partitions a data set into clusters based on similarity and finds the border between two clusters [
11,
14,
18]. For example, customers can be partitioned into a high purchasing power group and a low purchasing power group by analyzing their past purchasing behavior (amount of purchases, frequency of purchases, etc.). Customers in the same cluster have similar purchasing behavior (dependent variable), but they have little similarity in purchasing behavior with customers in other clusters. Clustering the whole data set is not to explain the characteristics of respective objects but to explore the characteristics of a cluster.
The setting of standards for dividing students’ abilities is similar to the clustering method in that it divides students into groups according to their abilities. That is, students are divided into complete learners and incomplete learners according to their scores based on standards set by experts.
Just as clustering divides customers into groups based on a dependent variable such as purchasing behavior, the standards set by experts divide students into groups according to their abilities based on their scores, which is a similar dependent variable. If standards can be set by clustering, students can be divided into groups based on similarity in abilities determined by using their scores as a dependent variable, as customers can be divided into groups based on similarity in purchasing behaviors. Therefore, the use of clustering in setting levels requires less time and cost than the setting of standards by experts.
3. Cluster Validity Index
Data mining techniques can be used to work on large volumes of data to discover hidden patterns and meaningful information for decision making. Cluster analysis is used for partitioning a large set of data into subsets called clusters. Each cluster is a collection of data objects that are similar to one another. The essential principle of all clustering is the choice of a proximity measure. In general, only certain aspects of the characteristic will be relevant, and the choice of these relevant features is one field in which clustering plays a major role [
22].
It is very important to choose the most suitable clustering algorithm for the corresponding area because there are many different algorithms used for clustering, and a clustering algorithm will function differently according to the data distribution. It is also very important and complex to standardize the data and set accurate distance functions or parameter values (e.g., k in the k-means algorithm). Due to these complexities, several clustering algorithms for which different distance functions or parameter values are set are operated to test their accuracy. When clustering a given data set, it is hard, in general, to confirm whether clustering results are accurate or not. Therefore, it is important to evaluate the quality of the clustering results, and it is necessary to choose the proper clustering evaluation method for a cluster of data.
After a set for clustering is found, we need to evaluate the validity of the clusters. The accuracy of clustering is difficult to measure [
23]. Clustering has been evaluated using a wide variety of measurements. Therefore, it is necessary to choose the proper clustering evaluation method for a cluster of data. User inspection, one of the clustering evaluation methods, is a way to evaluate clustering results by calculating the average of the ratings given to clustering results by panelists who are professionals in the area [
23,
24]. User inspection is time-consuming and expensive and may reflect the subjective evaluation of experts. However, in most applications, manual inspection is somewhat required because the quality of clustering results must be judged.
In this study, nine representative cluster validity indexes (sum of squared error [
23], entropy [
23,
25], relaxation error [
26], Davies-Bouldin index, Calinski-Harabasz index, Silhouette statistic, Dunn index, SD validity index, and S_Bbw validity index) were used to evaluate the clustering results. These cluster validity indexes are used to evaluate clustering results generally. In this section, we will briefly describe the cluster validity indexes we used for comparison.
3.1. Sum of Squared Error
K-means clustering is a widely used method for data mining because it is easy and quite simple to understand [
18]. Cluster analysis describes the similarity between different cases by calculating the distance. These cases are divided into different clusters due to their similarity. K-means usually use the sum of squared error (SSE) as the evaluation method [
23]. The sum of squared error is the sum of the squared differences between each observation and its group's mean. It can be used as a measure of variation within a cluster,
where
k is the number of required clusters,
Cj is the
j-th cluster,
mj is the centroid of cluster (the mean vector of all the data points in), and distance (
x,
mj) is the distance between data point
x and the centroid.
In Euclidean space, the mean of a cluster is computed with:
where |
Cj| is the number of data points in cluster
Cj. The distance from a data point to a cluster mean is computed with:
3.2. Entropy
In information theory, entropy deals with a measure of the uncertainty associated with a random variable. In other words, entropy quantifies the expected value of the information contained in a message. We utilize entropy in order to identify sets of scores that are most probably associated. Entropy measures the amount of impurity or disorder in the data. For each cluster, we can measure its entropy as follows:
where
Pi(
cj) is the probability of class
cj in data set
Di. The total entropy of the whole clustering (which considers all clusters) is:
The concept of entropy is being used to measure how much one random value has information on another random value [
23]. In analyzing item response data, entropy can be used to find out how much information clusters contain about items.
3.3. Relaxation Error
Knowledge discovered from data can be used to abstract the data into high level concepts. The discovered concept usually implies a certain context, thus providing more information than the raw data. As a result, the abstraction can be used to characterize the data [
27]. For clustering, two groups of methods can be used; statistical clustering and numerical taxonomy and conceptual clustering [
28]. In statistical clustering and numerical taxonomy, most similar metrics are defined between objects. Objects are clustered in a bottom up manner until all objects are in a single cluster. In conceptual clustering, the goodness measures are usually defined for the overall partitioning of objects.
Clustering methods are designed to maximize the ‘goodness measure’. Most current conceptual clustering systems use exact matches when comparing the values of two attributes. That is, the values are categorical and can only be equal or not equal. For discovering abstraction, the clustering method must consider the frequency and value distribution of the data. For this reason, relaxation error (RE) is preferred when considering the distribution frequency of data because it is concerned with the grouping of values rather than the values themselves.
RE is defined as:
where
xi is the
i-th distinct attribute value,
P(
xi) is the occurring probability of
xi in C, and Δ is the maximum difference between two values. From the standpoint of relaxation, let us define the relaxation error of
C,
RE(
C), as the average difference from
xi to
xj,
j = 1, …,
n.
RE(
C) can be used to measure the quality of an approximate. Summing
RE(
C) over all values
xi in
C, we have:
Thus, RE(P) is the expected error of relaxing any value in C.
3.4. Davies-Bouldin Index
The Davies-Bouldin index (DB index) identifies sets of clusters that are compact and well separated. The DB index is defined according to Equation (8):
where
k denotes the number of clusters,
i and
j are cluster labels, and
d(
ci,
cj) denotes the distance between centers of cluster
ci and
cj. The diameter of a cluster is defined as:
where
ni is the number of points and
zi is the center of cluster
ci.
3.5. Calinski-Harabasz Index
The Calinski-Harabasz index (CH index) evaluates the cluster validity based on the average between clusters and within cluster sum of squares.
where
B denotes the error sum of squares between inter-cluster and
W indicates the squared differences of all objects in a cluster from their respective cluster centers (intra-cluster).
3.6. Silhouette Statistic
The Silhouette statistic is another well-known way of estimating the number of groups in a data set. The Silhouette index (SI) computes for each point a width depending on its membership in any cluster. This silhouette width is then an average over all observations.
where
n is the total number of points,
ai is the average distance between point
i and all other points in its own cluster, and
bi is the minimum of the average dissimilarities between
i and points in other clusters. Finally, the partition with the highest
SI is taken to be optimal.
3.7. Dunn Index
The Dunn index (DU) is the ratio of the smallest distance between observations not in the same cluster to the largest intra-cluster distance. The Dunn index identifies clusters that are well separated and compact. The goal is therefore to maximize the inter-cluster distance while minimizing the intra-cluster distance. The Dunn index for
k clusters is defined by Equation (14):
where
diss(
ci,
cj) is the dissimilarity between clusters
ci and
cj and
diam(
C) is the intra-cluster function (or diameter) of the cluster. If the Dunn index is large, it means that compact and well-separated clusters exist. Therefore, the maximum is observed for
k equal to the most probable number of clusters in the data set.
3.8. SD Validity Index
The bases of the SD validity index are the average scattering of clusters and total separation of clusters. The scattering is calculated by the variance of the clusters and variance of the dataset; thus it can measure the homogeneity and compactness of the clusters. The SD validity index definition is based on the concepts of average scattering for clusters and total separation between clusters. It is computed as follows:
The first term evaluates compactness based on variances of cluster objects, and the second term evaluates separation difference based on distances between cluster centers. The value of this index is the summation of these two terms, and the optimal number of clusters can be obtained by minimizing the value of SD.
where
q is the number of clusters and
is the variance of the data set
X.
The second term
indicates the total separation between the
q clusters (i.e., an indication of inter-cluster distance).
where
= max
vi −
vj||,
is the maximum distance between the centers of clusters and
= min(||
vi −
vj||),
is the minimum distance between the centers of clusters.
3.9. S_Bbw Validity Index
The S_Dbw index takes density into account to measure the inter-cluster separation. The basic idea is that, for each pair of cluster centers, at least one of their densities should be larger than the density of their midpoint. The intra-cluster compactness is the same as it is in SD. The S_Dbw validity index definition is based on the criteria of compactness and separation between clusters. It is computed as follows:
The is the same computed in SD index. The
is the inter-cluster density. It evaluates the average density in the region among clusters in relation to the density of the clusters.
where
and
are the centers of clusters and
the middle point of the line segment defined by the clusters centers
and
.
where
is the number of tuples that belong to the clusters
and
. The
is equal to 0 if
d(
x,
u) > stdev and 1 otherwise. Stdev is the average standard deviation of clusters.
4. Research Methods
This section compares the standard setting methods that use the education experts group and the clustering method. First, the section of data sampling will discuss the data collection procedure. Second, the standing setting methods depending on the experts group and the clustering method are dealt with.
4.1. Data Sampling
This study uses item response data obtained from the basic Information & Communication Technology (ICT) literacy test conducted in 2007 and the basic and advanced ICT literacy tests conducted in 2011 in Korea. The item response data (‘Data Set #1’) obtained from the ICT literacy test conducted in 2007 are scores of 13,611 elementary students (5th~6th grades). The item response data (‘Data Set #2’) obtained from the basic and advanced ICT literacy tests conducted in 2011 combine the basic test scores of 12,497 elementary students (4th~6th grades) with the basic test and the advanced test scores (‘Data Set #3’) of 15,795 middle school students (1st~3rd years). The equal sampling procedure was applied for 2007 and 2011.
First, the nation was divided into 16 areas for sampling students, amounting to 1% of the population of elementary students in Korea. Second, the 16 areas were again divided into large, medium, and small cities. Third, basic ICT literacy test scores for 231 elementary schools for the year 2007 and for 200 elementary for the year 2011 were sampled, as well as advanced ICT literacy test scores for 200 middle schools for the year 2011, to analyze result statistics to create a proportionately rational scale. Fourth, two classes, one from the 5th grade and one from the 6th grade, were randomly selected from the sample of the year 2007 elementary school basic ICT test scores. One class each from the 4th, 5th, and 6th grades was randomly selected from the sample of the year 2011 ICT basic literacy test scores for elementary schools, and one class each from the 1st, 2nd, and 3rd years was randomly selected from the sample of the year 2011 advanced ICT literacy test scores for middle schools.
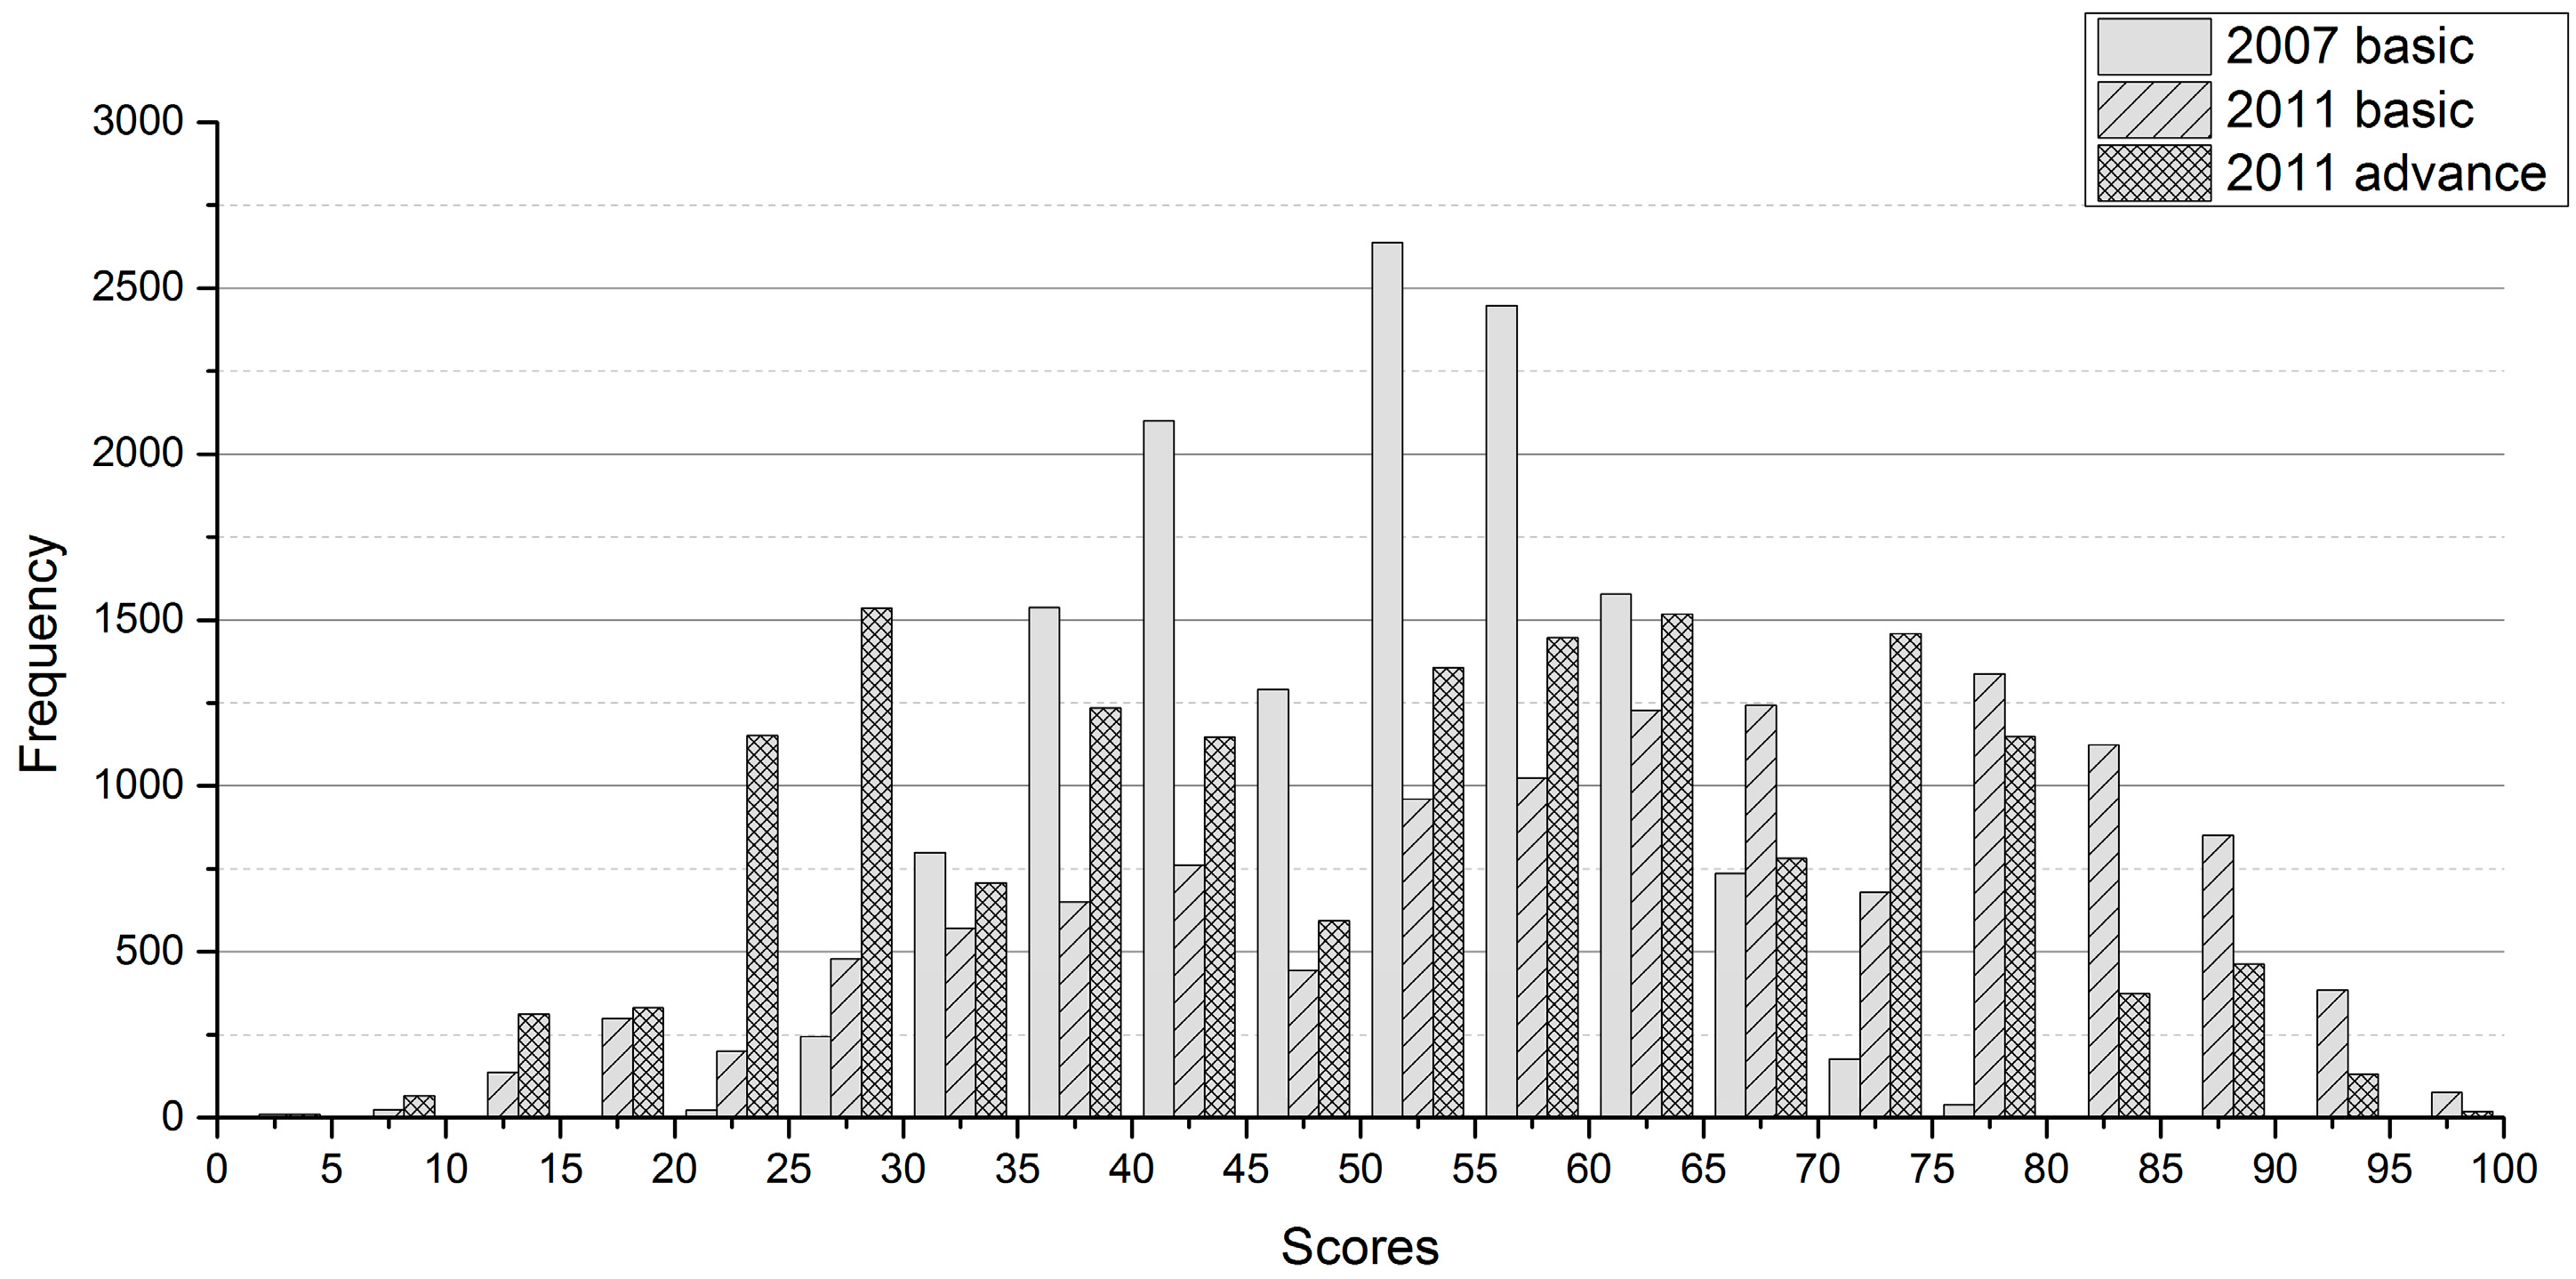
Figure 2 shows a histogram of frequency analysis of test scores of three data sets. In data set #1, raw scores were distributed on a scale from 0 to 23 and T-scores ranged from 20.67 to 81.87. In data set #2 and data set #3, raw scores were distributed on a scale from 0 to 36 and T-scores ranged from 0 to 100. The data was collected according to the stratified random sampling procedure, as explained below.
4.2. Standard Setting
The cut-off scores were set for the data of this study in two ways. The first standard setting method involved the experts group, and the second method used clustering. Details about setting the cut-off scores are provided below.
4.2.1. Experts Group
For the data of this study, the cut-off scores were set to determine students’ levels according to the modified Angoff method involving elementary teachers and computer education professors. For example, in data set #1, two cut-off scores were set to divide students into three levels and used in classifying the ICT literacy level of students into the three advanced, basic, and below basic levels. The modified Angoff method was applied in the following procedure [
29].
A group of experts was formed, including two experts in ICT literacy and eight elementary teachers in computer education and other subjects.
As the first round of the cut-off scores setting procedure, the group of experts recorded their ratings for each item.
The group of experts had a discussion based on their records made in the first round to collect their opinions for setting the cut-off scores.
As the second round of the cut-off scores setting procedure, the group of experts presented item parameters of the ICT literacy test such as discrimination and difficulty, which were found in the preliminary test and set the second cut-off scores.
The group of experts had the second discussion on the cut-off scores that were set in consideration of item parameters.
The group of experts set the third cut-off scores based on the discussion results. When the experts agreed at the standards that were set, the cut-off scores were finalized.
As results of the three-round standard setting procedure using the modified Angoff method, the cut-off scores were set at 51 and 66.4. As shown in
Table 3, scores of 51 and lower were regarded as the below basic level, scores of 66.4 and higher as the advanced level, and scores higher than 51 but lower than 66.4 as the basic level. Students’ scores in the ICT literacy test were divided into the three levels based on the standards set by the group of experts, and it was found that 52.5% of the students fell into the basic level, 3.5% into the advanced level, and 44% into the below basic level. In 2011, Korean elementary and middle school students took the ICT literacy tests for both the basic and advanced levels (respectively), and cut-off scores were set by dividing the ICT literacy level of students into four levels. Accordingly, the students’ ICT literacy test scores were divided into four levels based on standards set by a group of experts. The cut-off scores and the number of students falling into each level are shown in
Table 3.
4.2.2. Clustering Method
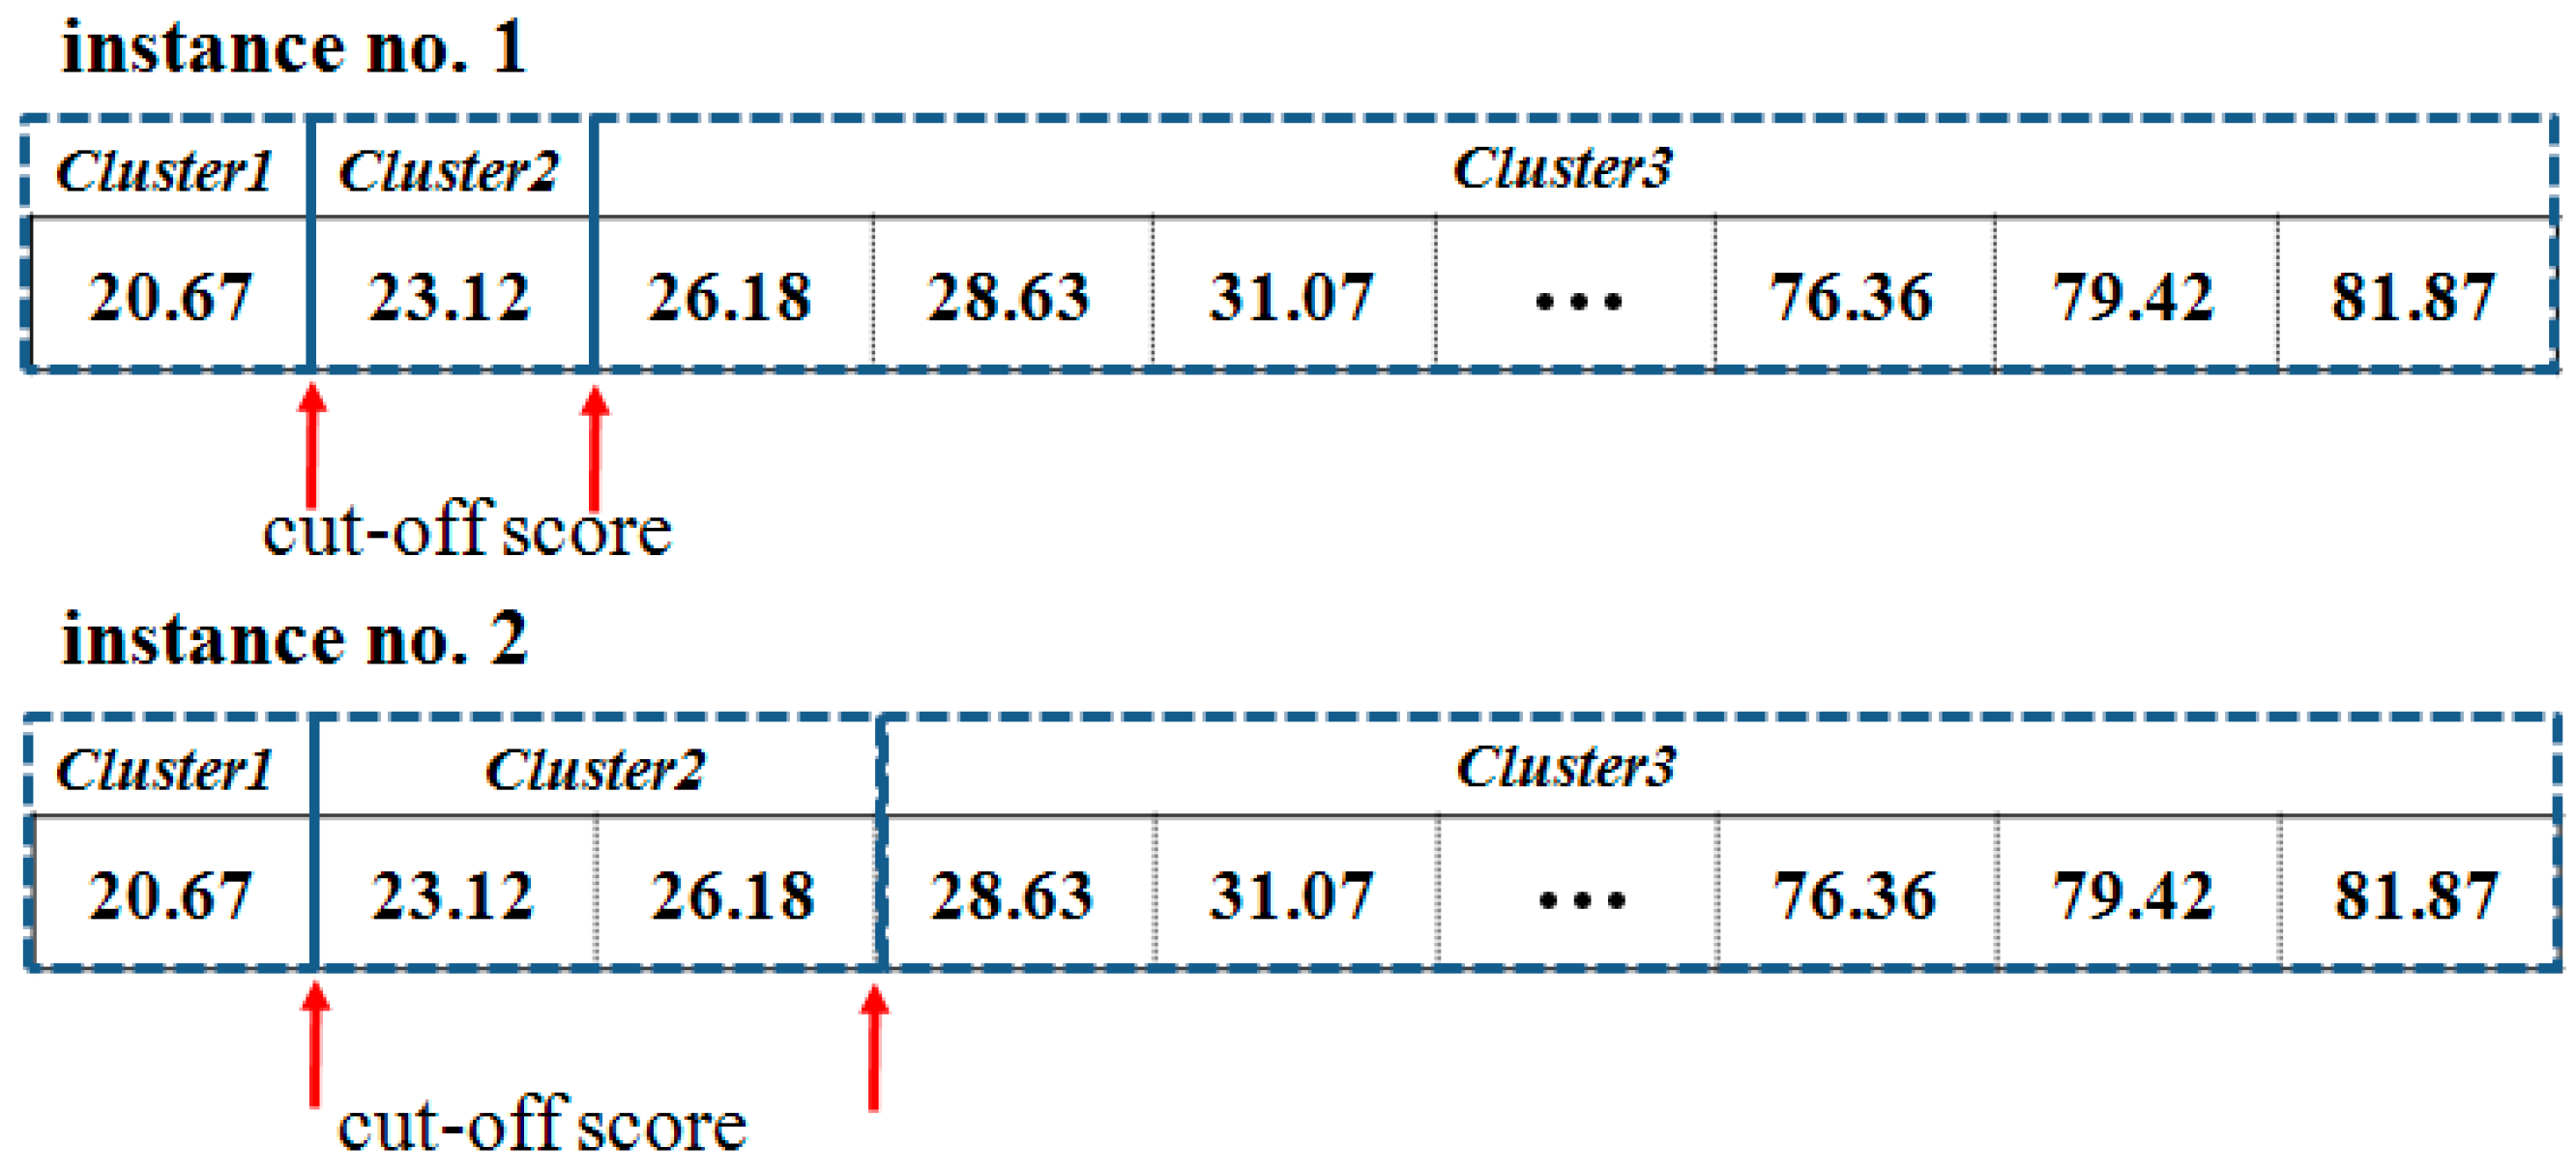
The purpose of this paper is to find a suitable cluster validity index by which we can decide which clustering algorithm is most similar to the group of experts. Therefore, we do not adopt a specific clustering algorithm rather than conduct an experiment in which the number of all possible cases for all cut-off scores that can be separated by clustering algorithms was calculated to compare the cut-off scores obtained by the group of experts and the cut-off scores gained by using clustering. To partition scores in data set #1, we need to determine cut-off scores. For example, in order to partition scores into three clusters, we have to determine two different scores as in
Figure 3.
In this case, the number of all possible ways to partition scores into three groups is m−1Ck, where m is the number of scores in the item response data and k is the number of cut-off scores. In the experiment with data set #1, the number of scores is 24, the test consists of 23 items, and the number of cut-off scores is two. Therefore the number of all possible instances is 253.
First, the instances were divided based on the cut-off scores. For example, the cut-off scores for instance No. 1 are 20.67 and 23.12, based on T-scores. In instance No. 1, scores of 20.67 and lower are regarded as the below basic level, scores higher than 20.67 but lower than 23.12 as the basic level, and scores of 23.12 and higher as the proficient level. In instance No. 2, the below basic, basic, and proficient levels are determined based on the cut-off scores of 20.67 and 26.18. A total of 253 instances were generated. Second, 253 instances divided based on cut-off scores were applied to all cluster validity indexes. Third, the cut-off scores that had the highest accuracy among clustering results were compared to the cut-off scores set by the experts group.
4.2.3. Clustering Evaluation Methods
The purpose of this study is to see if the use of clustering can replace the setting of standards by experts. The results of clustering item response data obtained from basic ICT literacy test scores of 2007 and basic and advanced ICT literacy test scores in 2011 were compared to cut-off scores in the following manner:
First, cut-off scores for the respective tests were determined by a group of experts because levels are determined in education settings based on cut-off scores set by a group of experts. Second, three data sets were divided into clusters. Third, cut-off scores set by the group of experts were used as criteria for evaluating the quality of the clustering results. That is, the user inspection evaluation method was used as a criterion for evaluating the clustering results. Fourth, Cohen’s kappa coefficients were used for comparing the consistency between clusters to attain a goodness measure between the cut-off scores set by the clustering method and the group of experts.
5. Results
In this section, accuracy is estimated by three clustering evaluation methods. To compare the cut-off scores drawn by the clustering evaluation methods and the cut-off scores set by the experts group, consistency was measured using Cohen’s kappa coefficients.
5.1. Entropy-Based Cluster Validity Index
Entropy required two random variables in order to be calculated [
23]. In this study, we take two random variables, which are separated clusters and whether each cluster answers correctly or not. It is easy to use a confusion matrix to introduce these measures.
Table 4 shows a method of clustering a confusion matrix with two random variables that are cluster and probability of being correct. As shown in
Table 4, entropy calculates the accuracy by taking account of item parameters, not by classifying based on the total scores. The confusion matrix shows whether students of each cluster gave a correct or wrong answer to a given item. One item creates one confusion matrix and calculates entropy. The value of entropy for each item is calculated, and the values of all items are added and represent the value of entropy for a given instance.
Table 4 shows the confusion matrix data when items 1 and 23 are instance No. 153 (cut-off scores are 42.09 and 55.55) in data set #1.
In the confusion matrix used for calculating the entropy for the item, item difficulty determines the value of entropy. Item difficulty is the percentage of the total group that got the item correct [
30]. In the classical test theory, item difficulty is calculated using Equation (24). For dichotomously scored items (1 for a correct answer and 0 for an incorrect answer), item difficulty for item
j is defined as
Item difficulty ranges between 0 and 1. The item gets more difficult as the value moves closer to 0, but the item becomes easier as the value moves closer to 1 [
30]. Item difficulty is the percentage of students who answer an item correctly. The entropy gets lower as item difficulty is too high or too low. As the item gets more difficult, the number of students who can answer the item correctly gets more limited. If the item is easier, on the contrary, more students can answer the item correctly. That is, uncertainty about item information decreases and the entropy increases.
For example, in cluster 2 of item No. 23 in
Table 4, 2703 students out of 6363 (2703 + 3660) in cluster 1, divided based on the cut-off scores, answered item No. 23 correctly. The percentage of students in cluster 2 who answered item No. 23 correctly is calculated at 42.5% using Equation (24). As item difficulty gets closer to 0.5, the number of students who answer the item correctly gets similar to the number of students who answer the item incorrectly, and the value of entropy for cluster 2 obtained using Equation (4) becomes higher. This proves the high uncertainty degree of the information that the item has about cluster division.
On the contrary, in cluster 1 for item No. 1 in
Table 4, 483 students out of 3627 (483 + 3144) in cluster 1, divided based on the cut-off scores, answered item No. 1 correctly. Based on the percentage of students in cluster 1 who answered item No. 1 correctly, calculated using Equation (24), the difficulty of item No. 1 is 0.133 (=483/3627). As item difficulty gets closer to 0 or 1, that is as the item is too easy or too difficult, the value of entropy for cluster 1 obtained using Equation (4) becomes lower. This proves the low uncertainty degree of the information that the item has about cluster division. The percentage of students in a given cluster who answer the item determines the value of entropy based on the degree of information that the item has about cluster division. That is, the value of item difficulty has the weight to decide the value of entropy.
5.2. Measurement of Consistency
Cohen’s kappa was used to examine the consistency between the cut-off scores drawn by the three clustering evaluation methods and the cut-off scores by the experts group. Cohen’s kappa measures the agreement between two raters who each classify
N items into C mutually exclusive categories [
31]. Cohen’s kappa is an index of inter-rater reliability that is commonly used to measure the level of agreement between two sets of dichotomous ratings or scores [
32,
33,
34]. Cohen’s kappa is defined by:
where
P0 is the relative observed agreement among raters and
Pe is the hypothetical probability of chance agreement, using the observed data to calculate the probabilities of each observer randomly with each category. If the raters are in complete agreement, then
k = 1. If there is no agreement among the raters other than what would be expected by chance (as defined by
Pe),
k = 0. Cohen’s kappa coefficients are used for measuring consistency between clusters [
24].
Table 5 shows Cohen’s kappa coefficients, which are the consistency between the groups divided based on the cut-off scores set by the experts group and the groups separated by the nine cluster validity indexes. According to the analyses using Cohen’s kappa coefficients, the consistency between the entropy method and the experts group is higher than the consistency between the experts group and the others for all data sets.
6. Discussion
This study aims to find a clustering algorithm that produces similar results to cut-off scores set by experts and to analyze the reasons for selecting the algorithm. This study used nine cluster validity indices for evaluating clustering results and discovered that entropy showed the most similar results to cut-off scores set by the group of experts. The results of the analyses are as follows.
First, a high consistency was found between cut-off scores set by the group of experts and drawn by entropy because both methods use information about item characteristics. The Bookmark and Angoff methods, used for cut-off scores, use the item difficulty drawn from the pre-test. The group of experts determines cut-off scores by estimating the proportion of minimally competent examinees that would correctly answer an item at a hypothetically set level. The group of experts does not divide examinees into ability levels based on the total test scores. They set the range of a level (e.g., level 3 or level 4) and judge whether minimally competent examinees in the level would correctly answer the item with some degree of difficulty. For this judgment, item difficulty, one of the item parameters, is used.
The others, except the entropy-based cluster validity index, use the final scores of examinees as attributes in clustering. While entropy utilizes the concept of item difficulty in the calculation process and calculates values based on respective item parameters, the others cannot use the features of item parameters. The entropy-based method calculates entropy for each item within the set level as the groups of experts do when they calculate cut-off scores and determine cut-off scores by totaling the entropies of all items included in the test. A low entropy value means that the item contains a lot of information necessary for dividing the data into clusters [
35,
36]. That is, the degree of difficulty drawn from each cluster level is used as the amount of information dividing the data into clusters at different levels. The calculation method using entropy is similar to the method that the group of experts use in determining cut-off scores based on item parameters, so it can be interpreted that the cut-off scores drawn by the entropy-based method have the highest consistency with the cut-off scores set by the group of experts.
Second, using plenty of information about item parameters may improve the performance of clustering. According to the findings of this study, the entropy-based method, which used the concept of item difficulty as one of the item parameters, had the highest consistency with the cut-off scores of the group of experts. The item parameters consist of item difficulty, item discrimination, and item guessing. Item discrimination is a statistic that indicates the degree to which an item is able to differentiate between high- and low-ability examinees [
31]. The level of item discrimination is high if most high-ability examinees answer the item correctly, whereas low-ability examinees do not. Item guessing is the percentage of examinees who do not know the correct answer but answer the item correctly by guessing [
33]. Therefore, the performance of the clustering algorithm can be enhanced by raising the weight of item discrimination, which can differentiate between groups of examinees, and minimizing the weight of item guessing, which can cause an overestimation of the ability of examinees.
Third, the clustering algorithm used for this study can be applied to national-level tests and many other tests as well. It could reduce time and cost because it used only the item response data to set the standards. The setting of standards by a group of experts is used for special national-level tests because it is time-consuming and expensive. The clustering method can be applicable to large-scale tests such as the College Scholastic Ability Test and the language ability tests. If it is used for small-scale tests such as the Evaluation of Educational Achievement, conducted at the school level, for which the standards can hardly be set by a group of experts, it is possible to divide test scores into more objective levels.
7. Conclusions and Future Works
The purpose of this paper is to find a suitable clustering method for determining cut-off scores. In this study, we make use of data mining processes in item response data using clustering evaluation methods to setcut-off scores. Three clustering evaluation methods were used, and the item response data collected from three ICT literacy ability tests were analyzed. Cohen’s kappa coefficients were used to measure consistency between the cut-off scores set by the experts group and the cut-off scores drawn by the clustering evaluation methods. According to experimental results, the cut-off scores drawn by the entropy-based method showed the highest consistency with the cut-off scores set by the experts group. This is because the entropy-based method considers item difficulty when determining the cut-off scores. This finding is congruous with the argument that the characteristics of data occurring in a given domain should be considered to identify the most suitable one among many clustering methods.
If the validity of the clustering method for setting the cut-off scores at the national level is reinforced by additional studies, clustering can be a new method that can be used in setting the cut-off scores, reducing time and cost. If the clustering method for standard setting is facilitated by unit schools that can hardly do standard setting, the method might be used as an index for setting students’ levels. This study considers only item difficulty among item parameters. We will study the relation between entropy and item discrimination in future work.
This study presented the use of a clustering algorithm as a method of setting standards based on computing dissimilar general standard setting methods. It can be used in educational settings for sorting students with similar abilities. The significance of this study lies in the presentation of usability and the applicability of a standard setting method that has been limitedly used for educational purposes in a wider range of ability tests.
The result of this research can be influenced by test data feature or data distributions. In future works, firstly we have a plan to find the consistent cluster validity index that best predicts the cut-off score by experts for various data distribution. Secondly, among all the item characteristics available, this study took only difficulty into consideration. However, item characteristics include difficulty and discrimination. Accordingly, if the clustering techniques are used to analyze item data in subsequent studies, both difficulty and discrimination need to be considered together as item characteristics, and reliability, i.e., item goodness-of-fit, needs to be considered as well. That is, consideration of item characteristics and item goodness-of-fit is thought to contribute more to educational experts making meaningful policy decisions.


