Article

Body Composition Asymmetry as a Candidate Marker of Dynamic Movement Imbalance: A Bioelectrical Impedance Analysis Study


1
Department of Sport Science, Chungnam National University, Daejeon 34134, Republic of Korea
2
College of Pharmacy, Chungnam National University, Daejeon 34134, Republic of Korea
3
Department of Physical Education, Yongin University, Yongin 17092, Republic of Korea
4
Daejeon Endo Internal Medicine Clinic, Daejeon 35220, Republic of Korea
*
Author to whom correspondence should be addressed.
Symmetry 2026, 18(9), 1566; https://doi.org/10.3390/sym18091566 (registering DOI)
Submission received: 3 August 2026 / Revised: 11 September 2026 / Accepted: 14 September 2026 / Published: 19 September 2026
(This article belongs to the Special Issue The Studies of Symmetry and Asymmetry in Biomechanics)

Abstract

Bioelectrical impedance analysis (BIA) provides body composition estimates that may complement conventional assessments of dynamic movement asymmetry. This cross-sectional study examined the association between the two in 50 adults aged 20–65 years. Dynamic variables were obtained from gait analysis, electromyography, and isokinetic strength testing, and left–right asymmetry was expressed as an asymmetry index (AI). Spearman correlations were evaluated with Benjamini–Hochberg correction across a pre-specified family of 42 comparisons. Eight associations survived correction, all positive, linking the AIs of leg total body water (TBWleg), intracellular water (ICWleg), and soft lean mass (SLMleg) to stance time and gait speed during dual-task walking and to ankle and knee joint torque, with correlations ranging from 0.376 to 0.476; whole-body indices showed the opposite pattern. Against a composite score derived from these variables, TBWleg AI showed the strongest association (ρ = 0.508) and, in an exploratory analysis, separated participants in the highest tertile from the remainder with an area under the curve of 0.786. These findings support further evaluation of BIA-derived leg water and lean-tissue asymmetry indices as candidate markers of dynamic movement asymmetry; the design does not establish predictive or diagnostic validity.

1. Introduction

Imbalance, asymmetry, and instability in posture and movement are interrelated and directly or indirectly cause injuries. These imbalances can lead to falls, injuries, increased dependency in daily activities, and diminished athletic performance. Previous research indicates that left and right leg asymmetry can result in balance loss during walking and contribute to falls. Particularly, isokinetic muscle strength disparity in the legs is a significant cause of falls in females aged 65 or older [1,2,3]. In sports, postural stability—that is, static and dynamic balance—is a decisive factor in enhancing performance and preventing injury [4], and the importance of evaluating stability while subjects perform various dynamic tasks has been emphasized [5].
The rate of falls is increasing faster than the rate of growth of the elderly population, and a plan to prevent fall accidents must be created [6]. As problems of body imbalance among young and older people have also been reported, efforts are being directed to address these issues via a variety of approaches [7,8,9,10]. As a part of such efforts, various studies on evaluation methods have been carried out. In assessing fall-related imbalances among the elderly, Kang [11] reported that the association with dynamic balance changed significantly with aging, whereas the association with static balance did not. While static balance is maintained relatively well until the 70s, dynamic balance decreases rapidly after the 60s, making appropriate evaluation and action for dynamic balance in aging an urgent matter. Hrysomallis et al. [12] indicated that static balance test performance does not correspond to dynamic balance test outcomes. Additionally, evaluating only static balance is inadequate for tasks demanding diverse balance control [5]. Karadenizli [13] investigated the relationship between the static and dynamic balances of football and handball players and found that there were no significant differences in static balance, but there were significant differences in dynamic balance. These studies indicate that adequate evaluation of dynamic balance is required to accurately determine the condition of balance.
Simple methods for evaluating body imbalance without specialized equipment include the static and Berg balance tests. Body imbalance can be measured in various ways using tools such as the clinical test of sensory interaction and balance (CTSIB), Y-balance, and force platform. Body composition analyzers using the bioelectrical impedance analysis (BIA) method, which is widely used in diverse facilities, can reliably measure muscle and water mass in various body parts. Moreover, it can evaluate left–right imbalances and asymmetry [14]. Although body composition analysis methods using the BIA method are generally simple and can quickly measure the imbalance or asymmetry of the body, they have the disadvantage of providing static balance data because they measure balance in a fixed standing posture.
As an evaluation method for dynamic balance, electromyography (EMG) analysis is performed in relation to muscle activity during walking or other movements [15]. Furthermore, analyses are being conducted for various dynamic imbalance evaluations, including plantar pressure analysis, isokinetic muscle function analysis, and gait analysis [3,16]. However, these dynamic imbalance measurements are time-consuming and costly owing to the complexity of the analysis.
This methodological divide has led static and dynamic balance assessments to be treated as largely separate domains: BIA characterizes the morphological substrate of movement—muscle and water mass and their left–right distribution—at rest, whereas gait, EMG, and isokinetic testing capture imbalance as it is expressed during motion. A growing body of evidence, however, suggests that the two may be mechanistically linked. The intracellular water (ICW) and total body water (TBW) measured by BIA reflect muscle-cell integrity and hydration status, which in turn influence the force-generating capacity and fatigue resistance of skeletal muscle; a higher extracellular-to-intracellular water ratio has been associated with lower muscle strength and slower gait speed in older adults [17,18], and a higher ICW with better functional performance independent of muscle mass [19]. Because the force and timing asymmetries that emerge during dynamic tasks ultimately arise from differences in the contractile and fluid properties of the left and right limbs, a static, side-to-side imbalance in these BIA-derived compartments could plausibly serve as a surrogate indicator of dynamic imbalance. Asymmetry in lower-limb lean mass has indeed been linked to slower gait speed and reduced functional mobility in older adults [20,21]; however, these studies relied on dual-energy X-ray absorptiometry or computed tomography. More recently, segmental BIA has been used to quantify side-to-side differences directly: it has detected limb asymmetry in youth elite athletes [22] and distinguished affected from unaffected limbs in hip osteoarthritis [23], and comparative work has examined how reliably current devices estimate lower-limb muscle mass [24], and, to the best of our knowledge, no study has directly examined whether the left–right imbalance of specific BIA factors corresponds to imbalance observed during dynamic movement.
Most injuries occur when performing dynamic movements; therefore, a dynamic balance condition must be periodically identified to prevent injury. However, measuring dynamic imbalances is complex and costly. Thus, if reliable information on dynamic balance assessment could be obtained using a cost-effective, rapid, and easy-to-measure BIA method, it could save time and cost while supporting earlier identification and management of injury risk [18]. Building on this premise, the present study reframes BIA—conventionally regarded as a purely static tool—as a possible source of information about dynamic imbalance. Rather than treating the static nature of BIA as a limitation, we test whether the left–right imbalance of BIA-derived body composition factors, expressed as an asymmetry index (AI), is correlated with key dynamic imbalance factors derived from gait, EMG, and isokinetic (Cybex) analyses.
Therefore, this study aims to identify the most reliable body composition factors that can be used to evaluate dynamic imbalance, through correlation analysis between body composition factors derived using the BIA method and critical dynamic imbalance factors, and thereby to propose candidate static biomarkers associated with dynamic imbalance.
We hypothesised that the left–right asymmetry of the water and muscle compartments of the lower limbs—specifically TBWleg, ICWleg, and SLMleg—would be positively associated with dynamic imbalance measured during gait, electromyography, and isokinetic testing, whereas whole-body composition indices would show no such positive association. This hypothesis follows from the premise that intracellular water reflects muscle-cell integrity and force-generating capacity, so that a side-to-side difference in these segmental compartments should be expressed as a corresponding asymmetry during movement.

2. Materials and Methods

2.1. Participants

Fifty male and female adults aged 20–65 unaffected by musculoskeletal disorders were recruited in Daejeon and Chungcheongnam-do, Republic of Korea. Participants were excluded if they had a neurological or vestibular disorder, were taking medication known to affect balance, or had sustained a lower-limb injury or surgery within the previous six months. The participants were informed of the purpose and content of the study, as well as the muscle soreness and fatigue that would accompany the experiment, and voluntary consent was obtained. This study was reviewed and approved by the Life Ethics Committee of Chungnam National University and conducted in compliance with the research ethics (202211-SB-163-01). The characteristics of the participants collected in this study are summarized in Table 1.

2.2. Analysis Tools and Factors

2.2.1. Measurement Protocol

All measurements were completed on a single day in a fixed order. Participants attended in the morning after an overnight fast, and body composition was assessed first, with DEXA followed immediately by BIA, so that both static measurements were obtained in the fasted, rested state and before any exercise. The dynamic assessments were then performed in the order of gait analysis followed by isokinetic strength testing, with surface EMG recorded throughout both. A rest period of at least 30 min separated each assessment. This sequence was adopted because hydration status and fluid shifts influence bioelectrical impedance measurements, and performing the body composition assessment in the fasted state and before any physical exertion minimises that source of variability; the rest intervals were intended to limit the carry-over of fatigue between the gait and isokinetic tests.

2.2.2. Body Composition Analysis (BCA)

For measurements of static imbalance variables, body composition was assessed using two independent methods: BIA, with the ACCUNIQ BC 720 (SELVAS Healthcare, Daejeon, Republic of Korea), and dual-energy X-ray absorptiometry (DEXA), with the Discovery WI (HOLOGIC, Marlborough, MA, USA). The DEXA measurements were performed by qualified staff in the hospital. BIA provided all of the segmental and whole-body composition variables used in the subsequent analyses, whereas DEXA served as the reference method for verifying the accuracy of the fat and lean mass values obtained with BIA (Table 2). Because DEXA does not quantify body water, the water-related variables could not be cross-validated in the present study. The participants followed the product development company’s guidelines for body composition analysis, including water and salt intake limitations before testing. The analysis variables consisted of the soft lean mass (SLMleg), fat mass (FMleg), total body water (TBWleg), intracellular water (ICWleg), and extracellular water of the left and right legs (ECWleg), as well as soft lean mass of the body (SLM), fat mass (FM), total body water (TBW), intracellular water (ICW), extracellular water (ECW), skeletal muscle index (SMI, SLM/height2), fat-free mass (FFM), skeletal muscle mass (SMM), and body mass index (BMI). Matias [25] reported that factors related to moisture content such as TBW, ICW, and ECW, obtained using the BIA method were reliable. Mijnarends [26] also reported reliable muscle-mass measurements.

2.2.3. Measuring Tools and Variables Related to Dynamic Imbalance

To extract dynamic imbalance variables, first, the OptoGait Photoelectric Cell System (Opto Gait, Microgate, Bolzano, Italy) was installed on a treadmill, and a two-minute treadmill gait test (normal gait and dual-task gait (natural number subtraction task was assigned) was performed simultaneously with muscle activity analysis using EMG. A warm-up gait was performed for approximately 5 min before the test to select the gait speed that most closely resembled the individual’s normal gait speed. After the normal gait test, the participants took a break for approximately 10 min and performed a two-task gait at the same speed. For the dual-task gait, the participants were given a random natural number (3 digits) and asked to subtract 7 from the given number while walking. Dual-task gait, a method for examining the interplay between walking patterns and cognitive functions, plays a crucial role in predicting injuries. Notably, under dual-task conditions, significant differences exist in cadence, speed, stride and step duration, as well as in the time spent on a support, between individuals who have experienced falls and those who have not [27,28,29]. Thus, dual-task gait is an excellent way to evaluate gait imbalance and is more likely to show imbalance characteristics than normal gait. Therefore, this study assessed dynamic imbalance during dual-task gait. For the analysis variables, the stride time (ST), stride length (SL), double support time (DST), gait speed (GS), stance time (STT), and single support time (SST) were determined. Single support time was defined as the interval during which only one foot was in contact with the ground, corresponding to the swing time of the contralateral limb, and was therefore distinct from double support time. Also, to evaluate muscle activity for each walking section, it was divided into sections A, B, and C. Section A is heel strike—loading response, Section B is loading response—mid stance, and Section C is terminal stance—pre swing.
The most useful factors in gait symmetry evaluation are the step length, swing time, stance time, stance variability, SL, DST, and GS [17,30,31,32,33]. Furthermore, many studies have used EMG analysis as a methodology for analyzing gait asymmetry and dynamic imbalance. The EMG output within individuals is a reliable method with highly reproducible muscle function [34,35]. Therefore, this study analyzed the time-related variables during the gait cycle, along with the variables related to length and speed. Furthermore, the asymmetry of left and right muscle activities was evaluated via EMG analysis.
For muscle strength evaluation, an isokinetic dynamometer (Cybex, CSMi Humac, Stoughton, MA, USA) was used at 60°/s. All other body parts were fixed to prevent external forces other than those of the relevant joint from acting, and the average flexion/extension torque values of the ankle and knee were calculated. After 3 submaximal familiarization trials, participants performed 5 maximal reciprocal concentric contractions for each joint, with 60s of rest between joints. Gravity correction was applied, and the mean torque of the five repetitions was used for analysis. Torque values were normalized to body mass (Nm/kg). In addition, surface EMG (Cometa System, Bareggio, Italy) was used to measure and analyze the mean EMG values of rectus femoris, biceps femoris, tibialis anterior, and gastrocnemius. Surface electrodes were placed according to SENIAM recommendations after the skin was shaved, abraded, and cleaned with alcohol. Signals were sampled at 2000 Hz, band-pass filtered with a fourth-order Butterworth filter (high-pass cut-off 20 Hz, low-pass cut-off 500 Hz), and full-wave rectified. Signal amplitude was then quantified as the root-mean-square (RMS) value, and the RMS amplitude was normalised to the maximal voluntary isometric contraction (MVIC) recorded for each muscle. The mean normalised RMS amplitude was computed for each gait phase (A, B, and C). A study of elderly women found that the asymmetry of muscle strength increased gait asymmetry and that lower limb strength was an important variable associated with falls [36,37]. Cybex is a representative tool for measuring muscle strength, and the reduced force of the ankle dorsiflexor, force of the quadriceps femoris, and power factor asymmetry of the lower limbs have been reported as variables used to predict falls [3,38]. This study also attempted to determine the dynamic imbalance evaluation factors based on previous research findings.

2.3. Asymmetry Index (AI)

The kinematic evaluation of gait is an essential medical tool for evaluating falls in older people, and gait asymmetry is defined as the different behavior of the left and right lower limbs [39,40]. Therefore, the index of the body’s left–right imbalance used in this study produced the asymmetry index (AI) via the following equation for measuring left–right asymmetry [32]:
Asymmetry Index AI = X Y X × 100
where X denotes the larger and Y the smaller of the left- and right-side values, so that the index is always non-negative and is expressed as a percentage. The same definition (Equation (1)) was applied to every body composition and dynamic variable.

2.4. Statistical Analysis

The validity of the ACCUNIQ BC 720 was first examined against DEXA. The distribution of every asymmetry index was assessed with the Shapiro–Wilk test, which indicated departures from normality for 27 of the 34 variables analysed (p < 0.05), including all three primary indices (TBWleg, W = 0.897, p < 0.001; ICWleg, W = 0.931, p = 0.007; SLMleg, W = 0.892, p < 0.001). Associations between the body composition asymmetry indices and the dynamic imbalance variables were therefore quantified with Spearman rank correlation coefficients (ρ). To address multiple comparisons, the asymmetry indices of TBWleg, ICWleg, and SLMleg were pre-specified as primary variables on the basis of the link between intracellular water, muscle-cell integrity, and force generation outlined in the Introduction. Because falls occur predominantly during demanding dynamic tasks, and because dual-task walking reveals gait deterioration more sensitively than unperturbed walking [41], the confirmatory analysis was restricted a priori to the dual-task gait, EMG, and isokinetic variables. The Benjamini–Hochberg procedure was applied within this family of 42 correlations, and associations with q < 0.05 were considered significant; normal-gait correlations and those involving the remaining body composition variables were treated as exploratory. Because the asymmetry index is a relative measure, analyses were performed on the pooled sample. All analyses were performed using IBM SPSS Statistics version 26 (IBM Corp., Armonk, NY, USA).

3. Results

3.1. Analysis of the Accuracy of the Results Produced by ACCUNIQ BC 720, a BIA Method

The validity was evaluated via correlation analysis of the values derived by the DEXA method, which provided the basis for body composition variables, and the values derived from ACCUNIQ BC 720, a BIA method. The validity evaluation results are summarized in Table 2. A statistically significant correlation was observed between the DEXA variables and those measured using the ACCUNIQ BC 720, supporting the concurrent validity of the BIA device.

3.2. Results of the Correlation Analysis Between Body Composition Factors and Dynamic Imbalance Variables

Results of correlation analysis between body composition factors calculated by the BIA method and gait variables.
As shown in Table 3a, few associations reached significance during normal walking. Only the AI of FMleg with stride length (ρ = −0.348, p = 0.014) and the AI of whole-body fat mass with stride length (ρ = 0.298, p = 0.038) were significant at the uncorrected level. The three primary indices showed positive but non-significant associations with double support time, stride time, and gait speed (ρ = 0.162–0.244, all p > 0.05). Normal-gait correlations were exploratory and were not part of the confirmatory family.
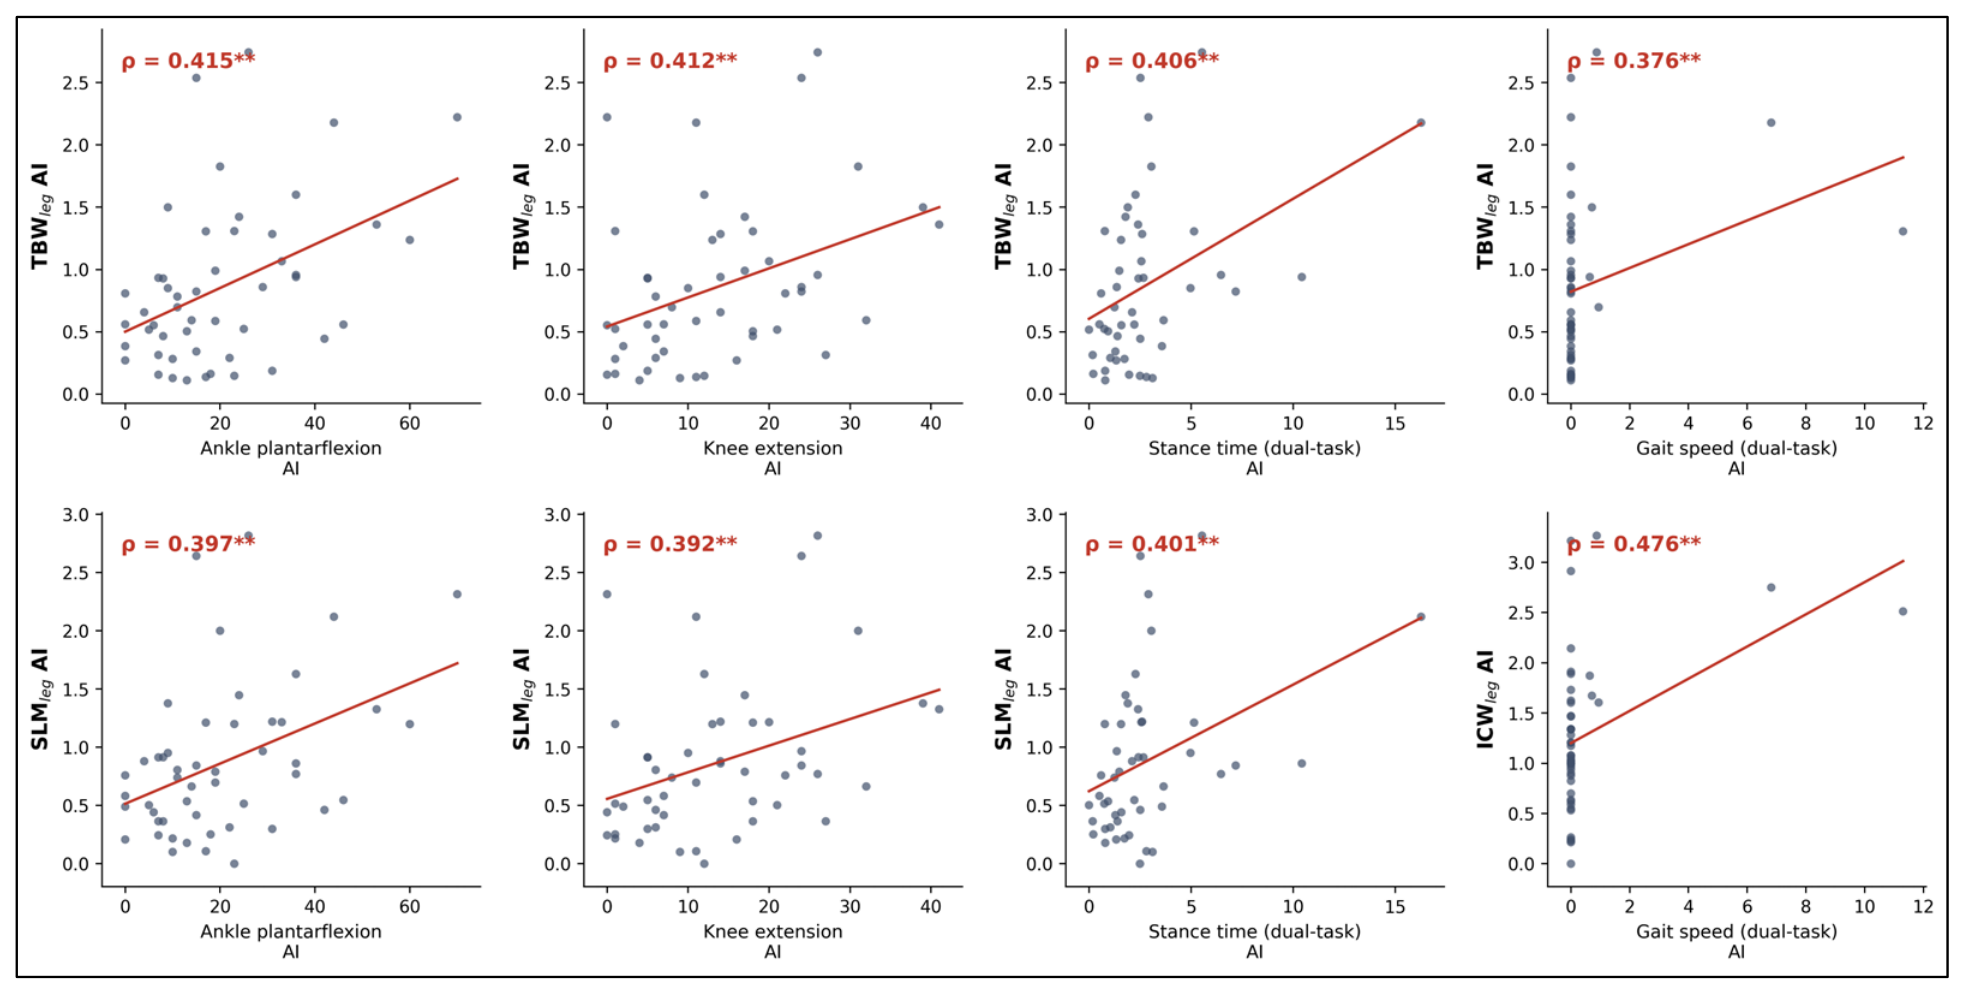
During dual-task gait, the AI of STT was significantly correlated with the AIs of SLMleg (0.401 **), TBWleg (0.406 **), and ICWleg (0.288 *). The AI of GS was correlated with the AIs of TBWleg (0.376 **) and ICWleg (0.476 **). The AI of SST showed no significant correlation with any body composition variable.
As shown in Table 4a, during dual-task gait the AIs of the rectus femoris in phases A and B were negatively correlated with the whole-body composition variables, whereas the AI of the biceps femoris in phase B was negatively correlated with the AIs of the leg composition variables. The AIs of the tibialis anterior and gastrocnemius in phase C showed no statistically significant correlation with the AIs of the three primary leg composition variables.
In the isokinetic analysis, the AI of ankle plantar flexion torque was significantly correlated with the AIs of TBWleg (0.415 **) and SLMleg (0.397 **). The AI of knee extension torque was correlated with the AIs of TBWleg (0.412 **), SLMleg (0.392 **), and ECWleg (0.381 **).
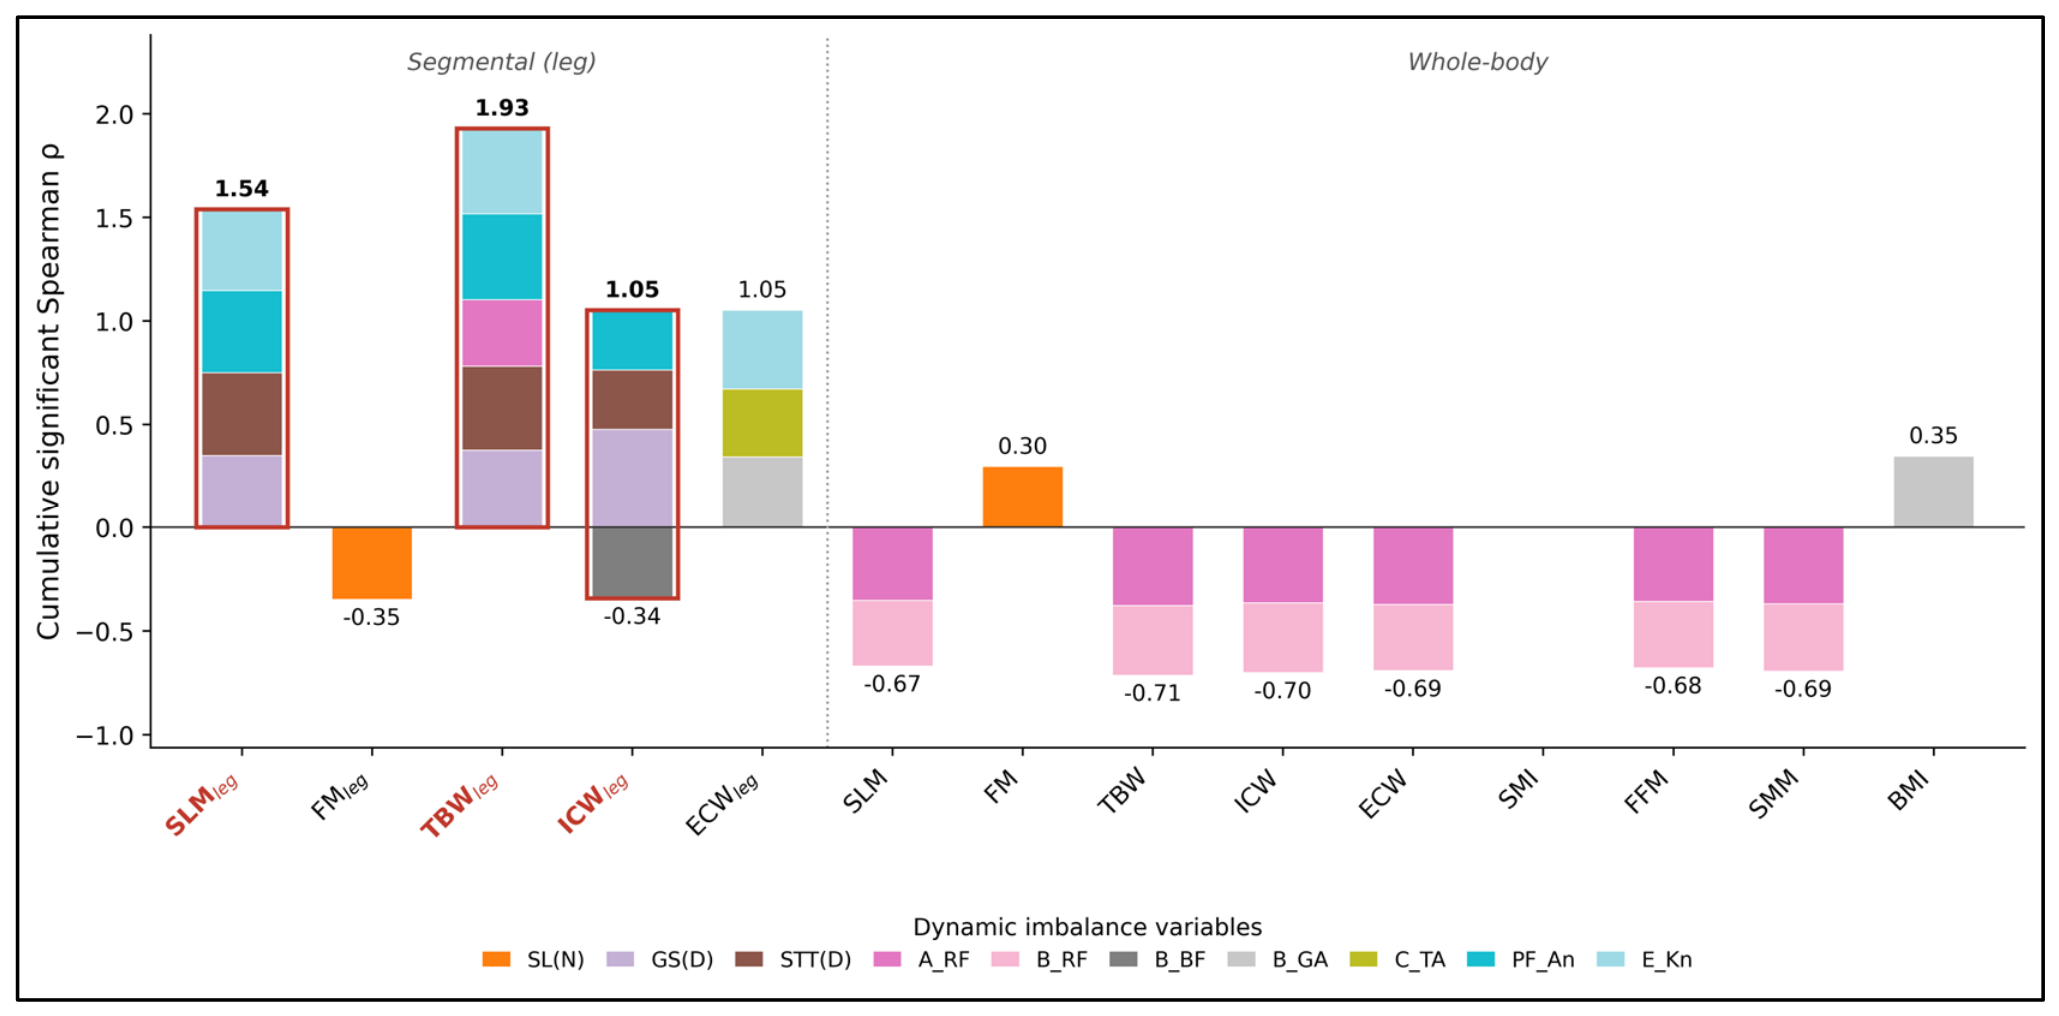
Figure 1 shows the accumulation of significant correlation coefficients (p < 0.05) for each body composition variable. The dynamic imbalance factors related to the AIs of TBWleg, ICWleg, and SLMleg showed positive correlations. The AI of TBWleg showed the largest accumulation of positive correlations at 1.93, followed by those of SLMleg at 1.54 and ICWleg at 1.05. In contrast, the dynamic imbalance factors related to the whole-body variables showed negative correlations; ICW showed the largest accumulation of negative correlations at −0.7, followed by TBW at −0.771 and SMM at −0.758. Figure 2 shows scatter plots of the three pre-specified primary leg-composition AIs against the dynamic imbalance variables with which they remained significantly correlated after Benjamini–Hochberg correction.
Within the confirmatory family of 42 correlations, comprising the dual-task gait, EMG, and isokinetic variables for TBWleg, ICWleg, and SLMleg, 13 reached the uncorrected threshold of p < 0.05 and 8 remained significant after Benjamini–Hochberg correction. In descending order of magnitude these were the AI of ICWleg with gait speed (ρ = 0.476, p < 0.001, q = 0.030), the AI of TBWleg with ankle plantar flexion torque (ρ = 0.415, p = 0.003, q = 0.032), the AI of TBWleg with knee extension torque (ρ = 0.412, p = 0.003, q = 0.032), the AI of TBWleg with stance time (ρ = 0.406, p = 0.005, q = 0.032), the AI of SLMleg with stance time (ρ = 0.401, p = 0.005, q = 0.032), the AI of SLMleg with ankle plantar flexion torque (ρ = 0.397, p = 0.005, q = 0.032), the AI of SLMleg with knee extension torque (ρ = 0.392, p = 0.005, q = 0.032), and the AI of TBWleg with gait speed (ρ = 0.376, p = 0.009, q = 0.048). All eight associations were positive. Correlations obtained during normal gait, together with those involving the remaining body composition variables, were exploratory and are reported in Table 3 and Table 4 without correction. Exact ρ-, p- and q-values for all significant correlations are listed in Appendix A.

3.3. Discriminative Performance of the Primary Indices

To evaluate the three primary indices as candidate markers rather than as isolated correlations, a composite measure of dynamic imbalance was constructed from the four dynamic variables that survived correction: stance time and gait speed during dual-task walking, ankle plantar flexion torque, and knee extension torque. Each was converted to a percentile rank and the four ranks were averaged, giving a single dynamic imbalance score for each participant (n = 47). Against this composite score, the AI of TBWleg showed the strongest association (ρ = 0.508, p < 0.001), followed by SLMleg (ρ = 0.476, p < 0.001) and ICWleg (ρ = 0.417, p = 0.004). Each of these coefficients exceeded the corresponding correlation with any single dynamic variable, indicating that the association is with the overall pattern of dynamic imbalance rather than with one particular measure.
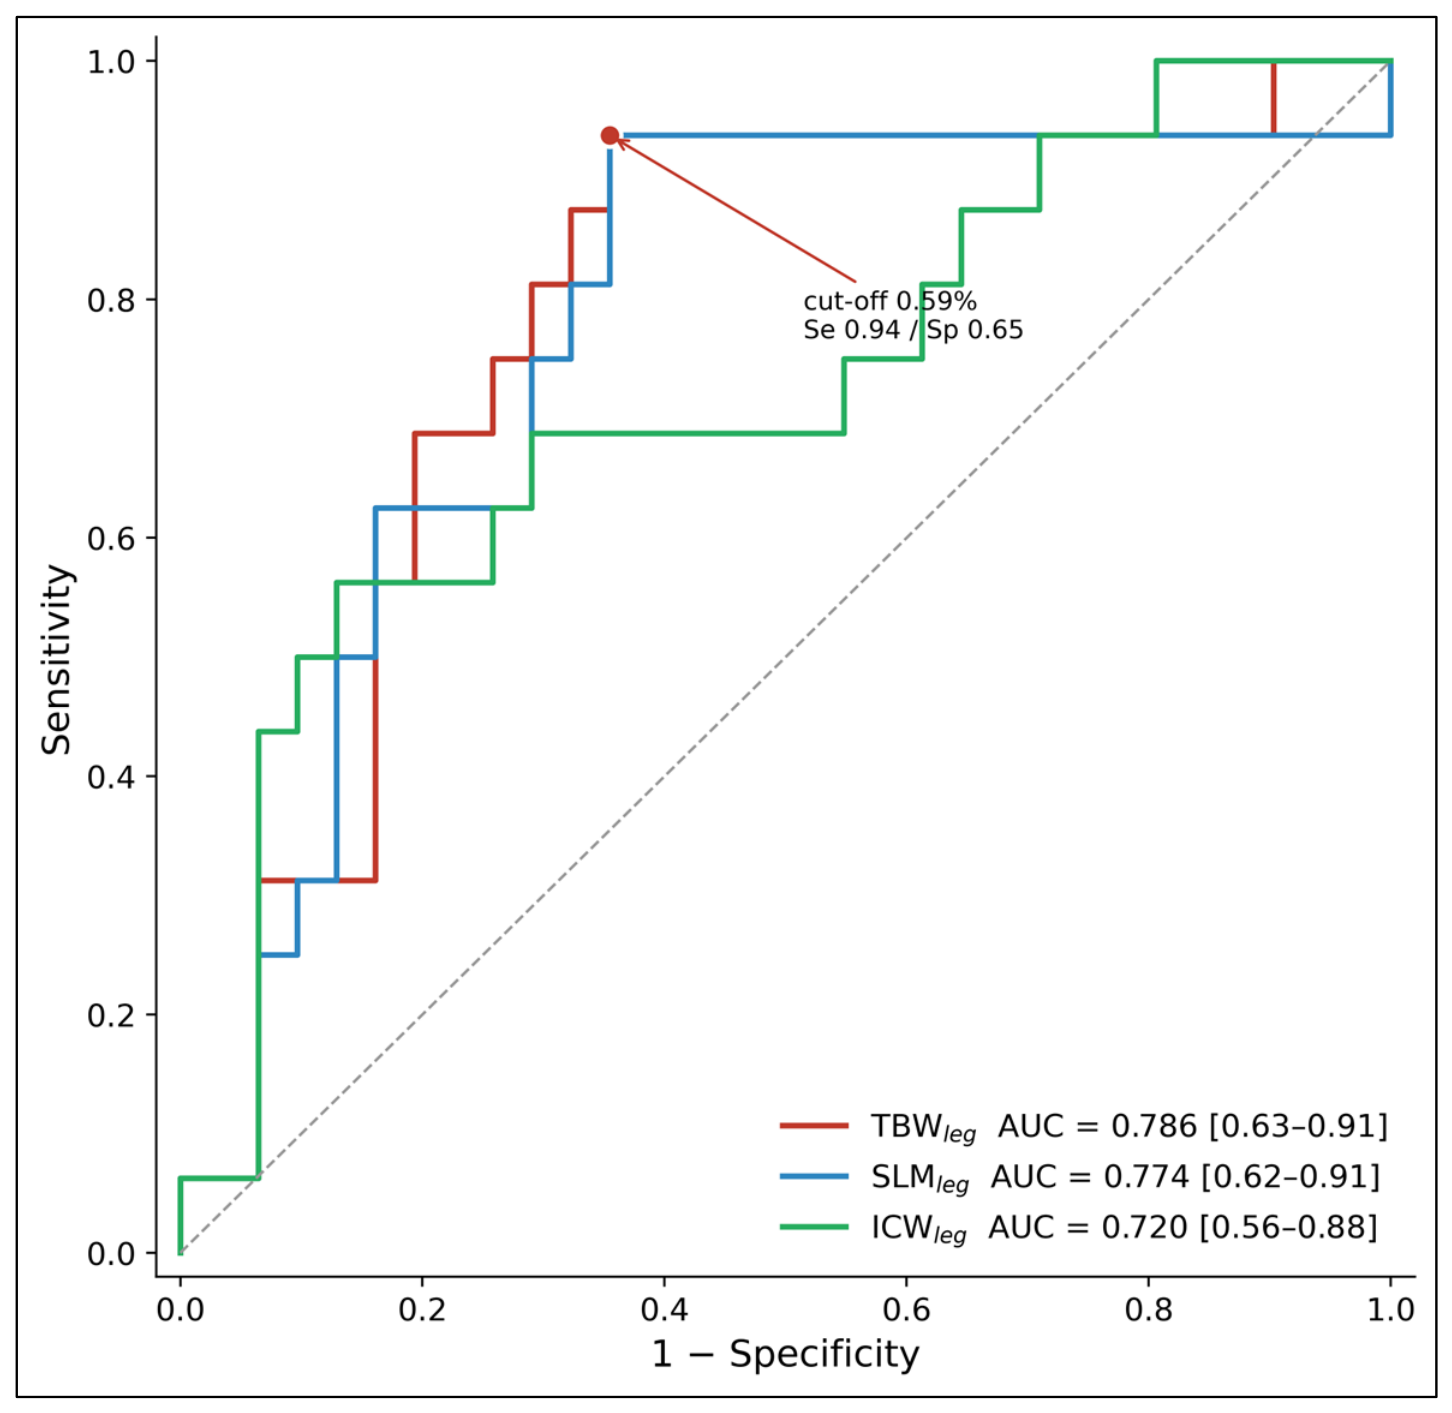
The discriminative performance of each index was then examined by classifying participants in the highest tertile of the composite score as showing marked dynamic imbalance (n = 16). The AI of TBWleg yielded an area under the receiver operating characteristic curve (AUC) of 0.786 (95% CI 0.627–0.913), followed by SLMleg (0.774, 95% CI 0.617–0.912) and ICWleg (0.720, 95% CI 0.556–0.877); the lower confidence limits excluded 0.5 in each case (Figure 3). For the AI of TBWleg, the cut-off maximising the Youden index was 0.59%, giving a sensitivity of 0.94 and a specificity of 0.65. Five-fold cross-validation produced a comparable mean AUC of 0.80, suggesting that the estimate was not driven by overfitting.
In a rank-based regression on the composite score, the AI of TBWleg alone explained 25.8% of the variance (R2 = 0.258, p < 0.001). Adding ICWleg and SLMleg raised this only marginally (R2 = 0.284), and the individual coefficients became unstable, which is consistent with the very high collinearity between TBWleg and SLMleg (ρ = 0.981). The three indices therefore carry largely overlapping information, and the AI of TBWleg alone accounted for most of the shared variance in this sample. Whether one index would suffice in practice cannot be determined from these data.

4. Discussion

Before examining the relationships with static and dynamic imbalance factors, the accuracy of the ACCUNIQ BC 720 product was verified. Table 2 presents the correlation analysis between body composition variables measured via the DEXA method and those measured using the BIA method, revealing statistically significant correlations for most variables. This finding is consistent with Mijnarends’s report [26], which supports the validity of body composition analysis based on the BIA method.
Table 3a,b show the results for variables related to imbalance during normal and dual-task gait. The associations were confined almost entirely to the dual-task condition. There, the asymmetry indices of the water and muscle compartments of the lower limbs were positively correlated with stance time and gait speed asymmetry, indicating that a larger left–right discrepancy in leg water content and muscle mass accompanies a greater dynamic imbalance. During normal walking, the same indices showed positive but non-significant associations, which suggests that the relationship becomes detectable only when the attentional demand of the task increases. Serra-Prat et al. [19] reported that, in older adults with comparable muscle mass, lower TBW and ICW were associated with lower muscle strength and poorer functional performance, which were in turn related to gait speed. Our finding that the AI of ICWleg showed the strongest association with gait speed asymmetry under dual-task conditions (ρ = 0.476) is consistent with that account and extends it from absolute values to the left–right difference. Because dynamic balance is itself related to gait speed [16], an imbalance in the water content of the two legs may therefore be linked, directly or indirectly, to an imbalance in gait motion.
As reported by Scarborough [42], quadriceps muscle strength is directly related to dynamic stability during gait and chair rise. The quadriceps femoris is an important muscle for dynamic stability. In the results of this study, the AI of the mean EMG of the rectus femoris during dual-task gait showed only one significant association with the lower-limb asymmetry indices (with TBWleg in phase A, ρ = 0.321), whereas it showed consistent significant negative correlations with the whole-body variables SLM, TBW, ICW, ECW, FFM, and SMM in both phases A and B. These results show that the left–right imbalance of the rectus femoris, a representative muscle of the quadriceps femoris, has a low correlation with the left–right imbalance of the lower limbs and high correlation with the skeletal muscle mass and water content in the total body, excluding fat. Meanwhile, as reported by Ounpuu [15], the gait asymmetry can be determined via an analysis of ankle plantarflexion EMG activity, and the ankle plantarflexion strength is a predictor of gait speed and stride length (R2 = 0.40). In this case, the gastrocnemius muscle plays a dominant role in gait [43]. The results of this study showed that during dual-task gait, the AI of gastrocnemius EMG activity in phase B was correlated with the AI of the ECWleg at 0.344 * and with the BMI of the entire body at 0.348 *. In phase C, however, the AI of gastrocnemius activity showed no statistically significant correlation with the AIs of the leg composition variables. The association between gastrocnemius activation asymmetry and lower-limb composition asymmetry was therefore confined to the extracellular water compartment during phase B and, unlike the rectus femoris, was not consistently related to whole-body skeletal muscle or water mass. This indicates that the factors contributing to dynamic left–right imbalance differ between the rectus femoris and the gastrocnemius.
The Cybex analysis results showed that the AI of the plantar flexion torque of the ankle had statistically significant positive correlations with the AIs of the muscle mass and water content of the lower limbs. Separately, the AI of knee extension torque was significantly correlated with the AIs of leg soft lean mass, total body water, and extracellular water, suggesting that left–right imbalances in lower-limb composition are mirrored in knee extensor strength asymmetry.
BMI shows statistically significant correlations with static and dynamic balances, and adults with higher BMI have increased gait support intervals and double support times [44,45,46]. Furthermore, Aldhahi [47] reported that an increase in body fat percentage is an essential factor that decreases gait performance and increases instability. In this study, the BMI variable was found to be correlated with the AI of the EMG activity of the gastrocnemius in gait phase B.
The AI of TBWleg, ICWleg, and SLMleg showed the largest accumulations of positive correlations with the dynamic imbalance factors (Figure 1), and these were the associations that survived Benjamini–Hochberg correction within the primary family. A higher extracellular-to-intracellular water ratio (ECW/ICW) has been associated with lower skeletal muscle strength and slower gait speed in older adults, indicating that intracellular water reflects muscle cell integrity and quality rather than merely fluid volume [17,18]. Furthermore, muscle mass is strongly correlated with TBW and ICW, and a larger SLM has been associated with better balance [18,19,48,49,50]. Serra-Prat et al. [19] reported that, in elderly individuals with comparable muscle mass, those with higher ICW exhibited better functional performance, faster gait speed, and lower frailty risk, suggesting a protective effect of cellular hydration that is independent of muscle mass; they also noted that an ECW/ICW ratio increased relative to ICW may serve as a marker of age-related muscle decline. Based on these findings, the positive correlation between the AIs of TBWleg, SLMleg, and ICWleg and dynamic imbalance variables, as observed herein, suggests that although water content is important in terms of muscle strength and muscle quality, a smaller left–right imbalance in lower-limb water content is associated with a smaller dynamic imbalance.
A mechanistic account of why segmental water asymmetry should track these particular variables can be proposed. Intracellular water is contained almost entirely within the muscle cell, and its volume reflects cell size, membrane integrity, and the osmotic environment in which the contractile proteins operate. A side-to-side difference in ICWleg therefore indicates that the two limbs differ not merely in the quantity of lean tissue but in its contractile quality. Because total body water of the leg is dominated by the intracellular compartment in healthy muscle, TBWleg carries much of the same signal, which is consistent with the very high correlation observed between TBWleg and SLMleg in this sample (ρ = 0.981).
This interpretation explains the pattern of associations. Ankle plantar flexion generates the propulsive impulse of late stance, and it is the single largest contributor to forward progression during walking. A limb whose muscle cells hold less water, and which therefore has lower force-generating capacity, produces a weaker push-off; the contralateral limb compensates, and the asymmetry becomes visible as a difference in plantar flexion torque and as a prolonged, unevenly distributed stance time. Under dual-task conditions, the compensation is less well controlled because attentional resources are diverted from gait, which is why the associations emerged in the dual-task rather than the normal-walking condition. The opposite, negative pattern for the whole-body indices is also coherent: absolute whole-body muscle and water mass reflect overall physical capacity rather than side-to-side balance, so greater whole-body mass accompanies lower, not higher, dynamic asymmetry.
A further pattern deserves comment. Within the confirmatory family, the three primary indices were associated with 11 of the 12 gait and isokinetic comparisons but with only 2 of the 18 electromyographic comparisons. This dissociation is informative rather than merely negative. BIA quantifies the distribution of tissue mass and water between the limbs, that is, a structural property, whereas surface EMG quantifies how the nervous system recruits that tissue during a task, a functional property. Two limbs may differ in composition yet be driven by comparable activation strategies, and conversely a person may compensate for a compositional difference by altering activation, which would weaken rather than strengthen any correlation between the two. Gait timing and isokinetic torque, by contrast, are mechanical outputs that depend directly on the amount and quality of contractile tissue available on each side, which is what the composition indices measure. This interpretation is consistent with previous work. Pietrosimone et al. [51] reported that inter-limb differences in isokinetic torque were larger than, and not strongly correlated with, inter-limb differences in voluntary activation, and concluded that the two measures may be evaluating different phenomena within the neuromuscular system. More recently, torque asymmetries have been observed in healthy adults in the absence of any corresponding between-limb difference in electromyographic activity or voluntary activation [52]. More broadly, the magnitude and even the direction of inter-limb asymmetry are known to vary substantially with the measurement modality, so that agreement between metrics is often poor [53]. The present findings therefore suggest that BIA-derived asymmetry tracks the structural substrate of movement asymmetry rather than the neuromuscular control strategy, and that the two should be regarded as complementary rather than interchangeable descriptions of lateral imbalance.
Viewed as a candidate marker rather than as a set of correlations, the AI of TBWleg showed a moderate degree of separation between participants with and without marked dynamic imbalance (AUC 0.786), with a cut-off of 0.59% yielding a sensitivity of 0.94 in this sample. A high sensitivity with modest specificity (0.65) would be the desirable profile for an initial triage step, but the present analysis does not establish that the index can serve this function: the threshold was derived in the same sample in which it was evaluated, and the reference standard was a laboratory measure of movement asymmetry rather than falls, injury, or any other clinical outcome. That a single index performed as well as the three combined, given their collinearity, is practically advantageous, since it suggests that future work evaluating this approach need not require multiple indices. Such an evaluation remains to be carried out.
Based on the findings of this study, although the AIs of TBWleg, SLMleg, and ICWleg are static measures obtained by the BIA method, they can be considered candidate variables associated with dynamic imbalance.

Limitations

Several limitations should be considered when interpreting these findings. First, this study was cross-sectional and correlational; therefore, the associations observed between static body composition asymmetry and dynamic imbalance indicate covariation rather than a causal or predictive relationship, and longitudinal or interventional designs are required to establish predictive validity.
Second, the sample was modest in size (n = 50) and pooled across a wide age range (20–65 years) and both sexes. Although the use of left–right asymmetry indices (Equation (1)) rather than absolute values largely normalizes between-sex differences in body size, the analyses were not stratified or adjusted by sex, and residual sex- or age-related effects cannot be excluded. Sex-specific and age-stratified analyses in larger samples are warranted. In addition, with n = 50, a two-tailed α = 0.05 and power of 0.80, the minimum detectable correlation is r ≈ 0.38, so weaker associations may have gone undetected.
Third, the large number of correlations examined raises the issue of multiple comparisons. To address this, the three theoretically motivated leg-composition variables (TBWleg, ICWleg, and SLMleg) were pre-designated as primary and evaluated with Benjamini–Hochberg correction, whereas the remaining variables were exploratory. Given the modest sample and the number of comparisons, the exploratory associations in particular should be regarded as hypothesis-generating and require independent confirmation.
Fourth, much of the supporting literature was derived from elderly or clinical populations, whereas the present sample comprised community-dwelling adults across a broad age range; extrapolation of the mechanistic interpretations to the general adult population should therefore be made cautiously. Finally, the accuracy of the BIA device was validated against DEXA using correlation analysis; agreement analyses (e.g., Bland–Altman) would provide a more complete assessment of measurement agreement in future work. Moreover, because DEXA does not quantify body water, this comparison covered only the fat and lean mass compartments; the reliability of the water-related indices, which include two of the three pre-specified primary variables, therefore rests on previous reports rather than on direct verification within the present sample. Validation was also performed on absolute values rather than on the asymmetry indices themselves, and future work should examine the measurement properties of the asymmetry indices directly.
Finally, the discriminative analysis reported here should be interpreted with care. The composite dynamic imbalance score and the tertile threshold used to define marked imbalance were defined within this sample and are not established clinical criteria; the cut-off value was derived and evaluated in the same dataset, so its performance is likely to be optimistic, and it requires validation in an independent cohort. Most importantly, the reference standard was a laboratory measure of movement asymmetry rather than a clinical outcome, so the analysis demonstrates that the index tracks measured dynamic imbalance, not that it predicts falls or injury. Prospective studies with incident events as the endpoint are needed before the index could be used for risk stratification.

5. Conclusions

The goal of this study is to extract BIA factors that can easily and quickly evaluate dynamic imbalance indirectly through correlation analysis between body composition factors that can be calculated through BIA and various dynamic imbalance indices.
According to the results, AIs of TBWleg, ICWleg, and SLMleg showed the strongest and most consistent positive associations with the dynamic imbalance factors, and these associations remained significant after Benjamini–Hochberg correction within the confirmatory family (q < 0.05). This consistency indicates that the asymmetry of these leg-composition indices is associated with several measures of dynamic movement asymmetry, and that they merit further evaluation as candidate markers. Meanwhile, whole-body ICW and SLM showed negative associations with rectus femoris activation asymmetry, indicating that this particular form of dynamic imbalance tended to increase as whole-body ICW and SLM decreased; these whole-body associations were part of the exploratory analysis and should be interpreted more cautiously.
Extracting body composition factors using the BIA method can accurately and quickly measure the body’s water content and muscle mass, and several of these factors showed significant associations with dynamic imbalance variables. Accordingly, these findings suggest that the BIA method can provide information related to dynamic imbalance more easily and rapidly than the other evaluation methods examined here.

Author Contributions

M.S.: conceptualization, methodology, software, formal analysis, investigation, writing—original draft, writing—review and editing. Y.M.: conceptualization, resources, writing—review and editing, project administration. S.K.L.: supervision, resources, writing—review and editing. H.-y.Y.: supervision, resources, writing—review and editing. J.S.: supervision, project administration, data curation. J.X.: investigation. Z.D.: investigation. K.S.K.: investigation, validation. S.H.H.: investigation, validation. All authors have read and agreed to the published version of the manuscript.

Funding

This work was supported by the National Research Foundation of Korea (NRF) grant funded by the Korea government (MSIT) (No. RS-2022-NR070856).

Institutional Review Board Statement

The study was conducted in accordance with the Declaration of Helsinki and approved by the Life Ethics Committee (Institutional Review Board) of Chungnam National University (protocol code 202211-SB-163-01, approved on 26 January 2023).

Informed Consent Statement

Written informed consent was obtained from all participants involved in the study. The consent form was reviewed and approved by the Institutional Review Board as part of the study protocol, and was distributed to and signed by every participant before any measurement was taken.

Data Availability Statement

The data presented in this study are available on request from the corresponding author. The data are not publicly available due to privacy restrictions relating to participants’ personal information.

Conflicts of Interest

The authors declare no conflicts of interest. The funders had no role in the design of the study; in the collection, analyses, or interpretation of data; in the writing of the manuscript; or in the decision to publish the results.

Abbreviations

The following abbreviations are used in this manuscript:
AIAsymmetry index
BIABioelectrical impedance analysis
DEXADual-energy X-ray absorptiometry
EMGElectromyography
TBWTotal body water
ICWIntracellular water
ECWExtracellular water
SLMSoft lean mass
FMFat mass
FFMFat-free mass
SMMSkeletal muscle mass
SMISkeletal muscle index
BMIBody mass index
MVCMaximal voluntary contraction
FDRFalse discovery rate

Appendix A

Table A1 lists every correlation that reached statistical significance (p < 0.05) in Table 3 and Table 4, together with its exact p-value and, for the confirmatory family, its Benjamini–Hochberg adjusted q-value (ρ denotes the Spearman coefficient). Non-significant coefficients are given in Table 3 and Table 4 of the main text.
Table A1. Statistically significant Spearman correlations with exact p- and q-values.
Body CompositionAssessmentVariableρpq
SLMlegDual-task gaitGS0.3500.0160.075
SLMlegDual-task gaitSTT0.4010.0050.032
SLMlegIsokineticPF_An0.3970.0050.032
SLMlegIsokineticE_Kn0.3920.0050.032
FMlegNormal gaitSL−0.3480.014
TBWlegDual-task gaitGS0.3760.0090.048
TBWlegDual-task gaitSTT0.4060.0050.032
TBWlegEMG (dual-task)A_RF0.3210.0330.128
TBWlegIsokineticPF_An0.4150.0030.032
TBWlegIsokineticE_Kn0.4120.0030.032
ICWlegDual-task gaitGS0.476<0.0010.030
ICWlegDual-task gaitSTT0.2880.0500.161
ICWlegEMG (dual-task)B_BF−0.3430.0230.095
ICWlegIsokineticPF_An0.2890.0440.154
ECWlegEMG (dual-task)B_GA0.3440.022
ECWlegEMG (dual-task)C_TA0.3280.030
ECWlegIsokineticE_Kn0.3810.007
SLMEMG (dual-task)A_RF−0.3520.019
SLMEMG (dual-task)B_RF−0.3170.036
FMNormal gaitSL0.2980.038
TBWEMG (dual-task)A_RF−0.3770.012
TBWEMG (dual-task)B_RF−0.3360.026
ICWEMG (dual-task)A_RF−0.3640.015
ICWEMG (dual-task)B_RF−0.3370.025
ECWEMG (dual-task)A_RF−0.3720.013
ECWEMG (dual-task)B_RF−0.3190.035
FFMEMG (dual-task)A_RF−0.3570.017
FFMEMG (dual-task)B_RF−0.3200.034
SMMEMG (dual-task)A_RF−0.3690.014
SMMEMG (dual-task)B_RF−0.3250.031
BMIEMG (dual-task)B_GA0.3480.021
Note. ρ, Spearman correlation coefficient; q, Benjamini–Hochberg adjusted p-value. Values in bold remained significant after correction within the confirmatory family (q < 0.05); a dash indicates correlations outside the confirmatory family, for which no q-value was computed.

References

  1. Cheng, P.L.; Pearcy, M. Graphical presentation of the range of hip and knee rotations for clinical evaluation of gait. Clin. Biomech. 2001, 16, 84–86. [Google Scholar] [CrossRef] [Scilit] [PubMed]
  2. Bautmans, I.; Jansen, B.; Van Keymolen, B.; Mets, T. Reliability and clinical correlates of 3D-accelerometry based gait analysis outcomes according to age and fall-risk. Gait Posture 2011, 33, 366–372. [Google Scholar] [CrossRef] [Scilit] [PubMed]
  3. Skelton, D.A.; Kennedy, J.; Rutherford, O.M. Explosive power and asymmetry in leg muscle function in frequent fallers and non-fallers aged over 65. Age Ageing 2002, 31, 119–125. [Google Scholar] [CrossRef] [Scilit] [PubMed]
  4. Sell, T.C.; Tsai, Y.S.; Smoliga, J.M.; Myers, J.B.; Lephart, S.M. Strength, flexibility, and balance characteristics of highly proficient golfers. J. Strength Cond. Res. 2007, 21, 1166–1171. [Google Scholar] [CrossRef] [Scilit] [PubMed]
  5. Karimi, M.T.; Solomonidis, S. The relationship between parameters of static and dynamic stability tests. J. Res. Med. Sci. 2011, 16, 530–535. [Google Scholar] [PubMed]
  6. Kannus, P.; Parkkari, J.; Koskinen, S.; Niemi, S.; Palvanen, M.; Järvinen, M.; Vuori, I. Fall-induced injuries and deaths among older adults. J. Am. Med. Assoc. 1999, 281, 1895–1899. [Google Scholar] [CrossRef] [Scilit] [PubMed]
  7. Reeves, N.P.; Cholewicki, J.; Silfies, S.P. Muscle activation imbalance and low-back injury in varsity athletes. J. Electromyogr. Kinesiol. 2006, 16, 264–272. [Google Scholar] [CrossRef] [Scilit] [PubMed]
  8. Grace, T.G.; Sweetser, E.R.; Nelson, M.A.; Ydens, L.R.; Skipper, B.J. Isokinetic muscle imbalance and knee-joint injuries. A prospective blind study. J. Bone Jt. Surg. 1984, 66, 734–740. [Google Scholar] [CrossRef] [Scilit]
  9. Eagle, S.R.; Keenan, K.A.; Connaboy, C.; Wohleber, M.; Simonson, A.; Nindl, B.C. Bilateral quadriceps strength asymmetry is associated with previous knee injury in military special tactics operators. J. Strength Cond. Res. 2019, 33, 89–94. [Google Scholar] [CrossRef] [Scilit] [PubMed]
  10. Requelo-Rodríguez, I.; Castro-Méndez, A.; Jiménez-Cebrián, A.M.; González-Elena, M.L.; Palomo-Toucedo, I.C.; Pabón-Carrasco, M. Assessment of selected spatio-temporal gait parameters on subjects with pronated foot posture on the basis of measurements using OptoGait. A case-control study. Sensors 2021, 21, 2805. [Google Scholar] [CrossRef] [Scilit] [PubMed]
  11. Kang, K. The effect of aging on static balance and dynamic balance in older adults. Korea J. Phys. Educ. 2001, 40, 591–599. [Google Scholar]
  12. Hrysomallis, C.; McLaughlin, P.; Goodman, C. Relationship between static and dynamic balance tests among elite Australian footballers. J. Sci. Med. Sport 2006, 9, 288–291. [Google Scholar] [CrossRef] [Scilit] [PubMed]
  13. Karadenizli, Z.I.; Erkut, O.; Ramazanoglu, N.; Uzun, S.; Camliguney, A.F.; Bozkurt, S.; Tiryaki, C.; Kucuk, V.; Sirmen, B. Comparison of dynamic and static balance in adolescents handball and soccer players. Turk. J. Sport Exerc. 2014, 16, 47–54. [Google Scholar] [CrossRef] [Scilit]
  14. Shanholtzer, B.A.; Patterson, S.M. Use of bioelectrical impedance in hydration status assessment: Reliability of a new tool in psychophysiology research. Int. J. Psychophysiol. 2003, 49, 217–226. [Google Scholar] [CrossRef] [Scilit] [PubMed]
  15. Ounpuu, S.; Winter, D.A. Bilateral electromyographical analysis of the lower limbs during walking in normal adults. Electroencephalogr. Clin. Neurophysiol. 1989, 72, 429–438. [Google Scholar] [CrossRef] [Scilit] [PubMed]
  16. Langhammer, B.; Lindmark, B.; Stanghelle, J.K. The relation between gait velocity and static and dynamic balance in the early rehabilitation of patients with acute stroke. Adv. Physiother. 2006, 8, 60–65. [Google Scholar] [CrossRef] [Scilit]
  17. Yamada, Y.; Yoshida, T.; Yokoyama, K.; Watanabe, Y.; Miyake, M.; Yamagata, E.; Yamada, M.; Kimura, M.; Kyoto-Kameoka Study. The extracellular to intracellular water ratio in upper legs is negatively associated with skeletal muscle strength and gait speed in older people. J. Gerontol. A Biol. Sci. Med. Sci. 2017, 72, 293–298. [Google Scholar] [CrossRef] [Scilit] [PubMed]
  18. Iwasaka, C.; Yamada, Y.; Nishida, Y.; Hara, M.; Yasukata, J.; Miyoshi, N.; Shimanoe, C.; Nanri, H.; Furukawa, T.; Koga, K.; et al. Association of appendicular extracellular-to-intracellular water ratio with age, muscle strength, and physical activity in 8,018 community-dwelling middle-aged and older adults. Arch. Gerontol. Geriatr. 2023, 108, 104931. [Google Scholar] [CrossRef] [Scilit] [PubMed]
  19. Serra-Prat, M.; Lorenzo, I.; Palomera, E.; Ramírez, S.; Yébenes, J.C. Total body water and intracellular water relationships with muscle strength, frailty and functional performance in an elderly population. A cross-sectional study. J. Nutr. Health Aging 2019, 23, 96–101. [Google Scholar] [CrossRef] [Scilit] [PubMed]
  20. Lee, E.J.; Lee, S.A.; Soh, Y.; Kim, Y.; Won, C.W.; Chon, J. Association between asymmetry in lower extremity lean mass and functional mobility in older adults living in the community: Results from the Korean Frailty and Aging Cohort Study. Medicine 2019, 98, e17882. [Google Scholar] [CrossRef] [Scilit] [PubMed]
  21. Mertz, K.H.; Reitelseder, S.; Jensen, M.; Lindberg, J.; Hjulmand, M.; Schucany, A.; Binder Andersen, S.; Bechshoeft, R.L.; Jakobsen, M.D.; Bieler, T.; et al. Influence of between-limb asymmetry in muscle mass, strength, and power on functional capacity in healthy older adults. Scand. J. Med. Sci. Sports 2019, 29, 1901–1908. [Google Scholar] [CrossRef] [Scilit] [PubMed]
  22. D’Hondt, J.; Chapelle, L.; Van Droogenbroeck, L.; Aerenhouts, D.; Clarys, P.; D’Hondt, E. Bioelectrical impedance analysis as a means of quantifying upper and lower limb asymmetry in youth elite tennis players: An explorative study. Eur. J. Sport Sci. 2022, 22, 1343–1354. [Google Scholar] [CrossRef] [Scilit] [PubMed]
  23. Pinheiro, J.S.; Carlos, F.R.; Caseiro-Filho, L.C.; Picado, C.H.F.; Garcia, F.L.; Guirro, E.C.O.; Guirro, R.R.J. Segmental bioelectrical impedance analysis can detect differences between the affected and non-affected limbs in individuals with hip osteoarthritis. BMC Musculoskelet. Disord. 2023, 24, 419. [Google Scholar] [CrossRef] [Scilit] [PubMed]
  24. Huang, A.C.; Lu, H.K.; Liang, C.W.; Hsieh, K.C.; Tsai, Y.S.; Lai, C.L. Comparison study of bioelectrical impedance analyzers for measuring lower limb muscle mass in middle-aged and elderly adults. Front. Nutr. 2025, 12, 1546499. [Google Scholar] [CrossRef] [Scilit] [PubMed]
  25. Matias, C.N.; Santos, D.A.; Gonçalves, E.M.; Fields, D.A.; Sardinha, L.B.; Silva, A.M. Is bioelectrical impedance spectroscopy accurate in estimating total body water and its compartments in elite athletes? Ann. Hum. Biol. 2013, 40, 152–156. [Google Scholar] [CrossRef] [Scilit] [PubMed]
  26. Mijnarends, D.M.; Meijers, J.M.M.; Halfens, R.J.G.; ter Borg, S.; Luiking, Y.C.; Verlaan, S.; Schoberer, D.; Cruz-Jentoft, A.J.; van Loon, L.J.C.; Schols, J.M.G.A. Validity and reliability of tools to measure muscle mass, strength, and physical performance in community-dwelling older people: A systematic review. J. Am. Med. Dir. Assoc. 2013, 14, 170–178. [Google Scholar] [CrossRef] [Scilit] [PubMed]
  27. Ma, R.; Zhào, H.; Wei, W.; Liu, Y.; Huang, Y. Gait characteristics under single-/dual-task walking conditions in elderly patients with cerebral small vessel disease: Analysis of gait variability, gait asymmetry and bilateral coordination of gait. Gait Posture 2022, 92, 65–70. [Google Scholar] [CrossRef] [Scilit] [PubMed]
  28. Howell, D.R.; Bonnette, S.; Diekfuss, J.A.; Grooms, D.R.; Myer, G.D.; Wilson, J.C.; Meehan, W.P., III. Dual-task gait stability after concussion and subsequent injury: An exploratory investigation. Sensors 2020, 20, 6297. [Google Scholar] [CrossRef] [Scilit] [PubMed]
  29. Toulotte, C.; Thevenon, A.; Watelain, E.; Fabre, C. Identification of healthy elderly fallers and non-fallers by gait analysis under dual-task conditions. Clin. Rehabil. 2006, 20, 269–276. [Google Scholar] [CrossRef] [Scilit] [PubMed]
  30. Patterson, K.K.; Gage, W.H.; Brooks, D.; Black, S.E.; McIlroy, W.E. Evaluation of gait symmetry after stroke: A comparison of current methods and recommendations for standardization. Gait Posture 2010, 31, 241–246. [Google Scholar] [CrossRef] [Scilit] [PubMed]
  31. Marques, N.R.; Spinoso, D.H.; Cardoso, B.C.; Moreno, V.C.; Kuroda, M.H.; Navega, M.T. Is it possible to predict falls in older adults using gait kinematics? Clin. Biomech. 2018, 59, 15–18. [Google Scholar] [CrossRef] [Scilit] [PubMed]
  32. Lauzière, S.; Betschart, M.; Aissaoui, R.; Nadeau, S. Understanding spatial and temporal gait asymmetries in individuals post stroke. Int. J. Phys. Med. Rehabil. 2014, 2, 201. [Google Scholar] [CrossRef]
  33. Sato, R.; Sawaya, Y.; Ishizaka, M.; Shiba, T.; Hirose, T.; Urano, T. Leg skeletal muscle mass asymmetry is independently associated with gait speed in older adults requiring long-term care. Geriatr. Gerontol. Int. 2023, 23, 371–375. [Google Scholar] [CrossRef] [Scilit] [PubMed]
  34. Halim, H.N.A.; Azaman, A.; Manaf, H.; Saidin, S.; Zulkapri, I.; Yahya, A. Gait asymmetry assessment using muscle activity signal: A review of current methods. J. Phys. Conf. Ser. 2019, 1372, 012044. [Google Scholar] [CrossRef] [Scilit]
  35. Arsenault, A.B.; Winter, D.A.; Marteniuk, R.G. Is there a ‘normal’ profile of EMG activity in gait? Med. Biol. Eng. Comput. 1986, 24, 337–343. [Google Scholar] [CrossRef] [Scilit] [PubMed]
  36. Maupas, E.; Paysant, J.; Datie, A.M.; Martinet, N.; André, J.M. Functional asymmetries of the lower limbs. A comparison between clinical assessment of laterality, isokinetic evaluation and electrogoniometric monitoring of knees during walking. Gait Posture 2002, 16, 304–312. [Google Scholar] [CrossRef] [Scilit] [PubMed]
  37. Laroche, D.P.; Cook, S.B.; Mackala, K. Strength asymmetry increases gait asymmetry and variability in older women. Med. Sci. Sports Exerc. 2012, 44, 2172–2181. [Google Scholar] [CrossRef] [Scilit] [PubMed]
  38. Maki, B.E. Gait changes in older adults: Predictors of falls or indicators of fear? J. Am. Geriatr. Soc. 1997, 45, 313–320. [Google Scholar] [CrossRef] [Scilit] [PubMed]
  39. Castagneri, C.; Agostini, V.; Rosati, S.; Balestra, G.; Knaflitz, M. Asymmetry index in muscle activations. IEEE Trans. Neural Syst. Rehabil. Eng. 2019, 27, 772–779. [Google Scholar] [CrossRef] [Scilit] [PubMed]
  40. Chen, C.J.; Chou, L.S. Center of mass position relative to the ankle during walking: A clinically feasible detection method for gait imbalance. Gait Posture 2010, 31, 391–393. [Google Scholar] [CrossRef] [Scilit] [PubMed]
  41. Asai, T.; Yamamoto, J.; Oshima, K.; Minami, C.; Matsumoto, D.; Naruse, F. Dual-task gait test provides limited additional value for fall prediction in care-requiring older adults: A prospective study. Geriatr. Gerontol. Int. 2025, 25, 663–669. [Google Scholar] [CrossRef] [Scilit] [PubMed]
  42. Moxley Scarborough, D.; Krebs, D.E.; Harris, B.A. Quadriceps muscle strength and dynamic stability in elderly persons. Gait Posture 1999, 10, 10–20. [Google Scholar] [CrossRef] [Scilit] [PubMed]
  43. Muehlbauer, T.; Granacher, U.; Borde, R.; Hortobágyi, T. Non-discriminant relationships between leg muscle strength, mass and gait performance in healthy young and old adults. Gerontology 2018, 64, 11–18. [Google Scholar] [CrossRef] [Scilit] [PubMed]
  44. Cancela Carral, J.M.; Ayán, C.; Sturzinger, L.; Gonzalez, G. Relationships between body mass index and static and dynamic balance in active and inactive older adults. J. Geriatr. Phys. Ther. 2019, 42, E85–E90. [Google Scholar] [CrossRef] [Scilit] [PubMed]
  45. Greve, J.; Alonso, A.; Bordini, A.C.; Camanho, G.L. Correlation between body mass index and postural balance. Clinics 2007, 62, 717–720. [Google Scholar] [CrossRef] [Scilit] [PubMed]
  46. Lai, P.P.; Leung, A.K.; Li, A.N.; Zhang, M. Three-dimensional gait analysis of obese adults. Clin. Biomech. 2008, 23, S2–S6. [Google Scholar] [CrossRef] [Scilit] [PubMed]
  47. Aldhahi, M.I. Effect of gait alteration on fatigability during walking in adult women with high body fat composition. Medicina 2022, 59, 85. [Google Scholar] [CrossRef] [Scilit] [PubMed]
  48. Silva, A.M.; Fields, D.A.; Heymsfield, S.B.; Sardinha, L.B. Body composition and power changes in elite judo athletes. Int. J. Sports Med. 2010, 31, 737–741. [Google Scholar] [CrossRef] [Scilit] [PubMed]
  49. Hooper, L.; Bunn, D.; Jimoh, F.O.; Fairweather-Tait, S.J. Water-loss dehydration and aging. Mech. Ageing Dev. 2014, 136–137, 50–58. [Google Scholar] [CrossRef] [Scilit] [PubMed]
  50. Gouveia, É.R.; Ihle, A.; Gouveia, B.R.; Kliegel, M.; Marques, A.; Freitas, D.L. Muscle mass and muscle strength relationships to balance: The role of age and physical activity. J. Aging Phys. Act. 2020, 28, 262–268. [Google Scholar] [CrossRef] [Scilit] [PubMed]
  51. Pietrosimone, B.G.; Park, C.M.; Gribble, P.A.; Pfile, K.R.; Tevald, M.A. Inter-limb differences in quadriceps strength and volitional activation. J. Sports Sci. 2012, 30, 471–477. [Google Scholar] [CrossRef] [Scilit] [PubMed]
  52. Alaux, H.; Barrué-Belou, S.; Matta, P.-M.; Duclay, J. Neuromuscular contributions to inter-limb quadriceps strength asymmetries across contraction types in healthy adults. Eur. J. Appl. Physiol. 2026, 126, 4347–4359. [Google Scholar] [CrossRef] [Scilit] [PubMed]
  53. Boccia, G.; D’Emanuele, S.; Brustio, P.R.; Beratto, L.; Tarperi, C.; Casale, R.; Sciarra, T.; Rainoldi, A. Strength asymmetries are muscle-specific and metric-dependent. Int. J. Environ. Res. Public Health 2022, 19, 8495. [Google Scholar] [CrossRef] [Scilit] [PubMed]
Figure 1. Accumulation of significant Spearman correlations (uncorrected p < 0.05) between body composition asymmetry indices and dynamic imbalance variables. All 14 body composition variables analysed are shown on the horizontal axis. Each bar is the sum of the Spearman coefficients that reached p < 0.05 for that variable, stacked by dynamic variable; positive and negative coefficients are summed separately and plotted above and below zero. The legend lists only the 10 dynamic variables that contributed to at least one bar, and no bar is shown for SMI, for which no correlation reached significance. The three pre-specified primary variables (TBW_leg, ICW_leg, and SLM_leg) are highlighted with a red outline and red axis labels. TBW_leg and SLM_leg show the largest positive accumulations. Among the whole-body variables, the muscle and water compartments accumulate negative correlations, whereas fat mass and body mass index show small positive accumulations. Exact ρ-, p- and q-values are given in Appendix A.
Symmetry 18 01566 g001
Figure 2. Scatter plots of the three pre-specified primary leg-composition asymmetry indices (SLMleg, TBWleg, ICWleg) against the dynamic imbalance variables with which they remained significantly correlated after Benjamini–Hochberg correction within the confirmatory family (q < 0.05). Each panel shows the individual data points, a least-squares trend line included for visual reference only, and the Spearman correlation coefficient (ρ) with its significance marker ( ** p < 0.01). All eight associations shown remained significant after Benjamini–Hochberg correction (q ≤ 0.048); exact values are given in Appendix A. All axes are expressed as asymmetry indices (%).
Symmetry 18 01566 g002
Figure 3. Receiver operating characteristic curves for the three primary leg-composition asymmetry indices in discriminating participants in the highest tertile of the composite dynamic imbalance score. The marker indicates the cut-off maximising the Youden index for the AI of TBWleg. AUC values are shown with 95% confidence intervals obtained from 2000 bootstrap resamples; the diagonal indicates chance performance.
Symmetry 18 01566 g003
Table 1. Participant Characteristics.
Male (n = 25)Female (n = 25)
Age (Years)34 ± 10.337 ± 13.5
Height (cm)173.7 ± 6.2160.8 ± 4.7
Weight (kg)74.1 ± 12.756.8 ± 6.5
Foot length (cm)259.6 ± 9.7236.4 ± 9.1
Gait speed (km/h)4.3 ± 0.74.1 ± 0.8
Table 2. Correlation analysis between body composition variables calculated using the DEXA and BIA methods.
VariableρVariableρ
Left_Arm_Fat0.861 **Trunk_Fat0.919 **
Left_Arm_Lean0.971 **SubTotal_Fat0.923 **
Right_Arm_Fat0.882 **SubTotal_Lean0.983 **
Right_Arm_Lean0.974 **Total_BMC0.840 **
Left_Leg_Fat0.722 **Total_Fat0.927 **
Left_Leg_Lean0.970 **Total_Lean0.986 **
Right_Leg_Fat0.762 **Total_Lean+BMC0.988 **
Right_Leg_Lean0.976 **Total_Total0.999 **
Note. Values are spearman correlation coefficients (ρ) between corresponding measurements obtained by DEXA and BIA. Variable names follow the DEXA output labels: Fat, fat mass; Lean, lean mass; BMC, bone mineral content; SubTotal, sum of both arms, both legs, and the trunk; Total_Total, body mass. ** p < 0.01.
Table 3. (a) Spearman correlations between body composition asymmetry indices and gait variables during normal walking. (b) Spearman correlations between body composition asymmetry indices and gait variables during dual-task walking.
(a)
Body Composition FactorAI in Normal Gait
DSTSTSLGSSTTSST
SLMleg AI0.2280.2010.0970.1880.177−0.117
FMleg AI0.183−0.095−0.348 *−0.0120.2210.047
TBWleg AI0.2440.1620.0930.2380.164−0.089
ICWleg AI0.2050.1690.1020.2310.110−0.047
ECWleg AI0.098−0.1930.161−0.0750.1140.141
SLM−0.1060.0370.1560.100−0.2020.039
FM−0.114−0.0500.298 *−0.112−0.0850.001
TBW−0.1100.0420.1790.097−0.2050.043
ICW−0.1070.0320.1880.105−0.1960.046
ECW−0.1090.0400.1490.104−0.2040.059
SMI−0.085−0.0040.0700.076−0.1800.064
FFM−0.1060.0430.1630.102−0.1970.037
SMM−0.1090.0270.1500.090−0.2090.034
BMI−0.169−0.0170.216−0.059−0.1520.083
(b)
Body Composition FactorAI in Dual-Task Gait
DSTSTSLGSSTTSST
SLMleg AI0.0970.0670.1840.350 *0.401 **0.063
FMleg AI0.090−0.2640.0260.0670.229−0.036
TBWleg AI0.1200.0590.2000.376 **0.406 **0.106
ICWleg AI0.0270.0350.1470.476 **0.288 *−0.018
ECWleg AI0.139−0.110−0.0140.2230.2240.043
SLM−0.068−0.048−0.057−0.061−0.285−0.108
FM−0.0720.168−0.027−0.036−0.091−0.041
TBW−0.061−0.068−0.065−0.060−0.270−0.098
ICW−0.073−0.068−0.052−0.059−0.262−0.089
ECW−0.048−0.046−0.061−0.064−0.276−0.096
SMI−0.046−0.083−0.072−0.024−0.251−0.112
FFM−0.066−0.060−0.059−0.063−0.283−0.111
SMM−0.073−0.058−0.061−0.064−0.282−0.100
BMI0.0720.004−0.074−0.079−0.187−0.155
Note. (a) AI, asymmetry index; DST, double support time; ST, stride time; SL, stride length; GS, gait speed; STT, stance time; SST, single support time. * p < 0.05 (uncorrected). Normal-gait correlations were exploratory and were not part of the confirmatory family (b) Abbreviations as in Table 3a. * p < 0.05; ** p < 0.01 (uncorrected). Values in bold remained significant after Benjamini–Hochberg correction within the confirmatory family (q < 0.05).
Table 4. (a) Spearman correlations between body composition asymmetry indices and electromyographic variables during dual-task walking. (b) Spearman correlations between body composition asymmetry indices and isokinetic strength variables.
(a)
Body Composition FactorAI in Dual-Task (EMG Data)
A_RFB_RFB_BFB_GAC_TAC_GA
SLMleg AI0.2890.234−0.263−0.027−0.012−0.014
FMleg AI0.061−0.0810.269−0.1250.162−0.054
TBWleg AI0.321 *0.242−0.2780.025−0.041−0.041
ICWleg AI0.0710.156−0.343 *0.0890.0180.064
ECWleg AI0..0370.0270.0120.344 *0.328 *0.101
SLM−0.352 *−0.317 *−0.0130.1930.0450.191
FM0.097−0.0440.0250.148−0.1870.070
TBW−0.377 *−0.336 *−0.0150.2000.0240.200
ICW−0.364 *−0.337 *−0.0100.1890.0100.177
ECW−0.372 *−0.319 *0.0010.2040.0410.204
SMI−0.291−0.2890.0500.2090.0490.177
FFM−0.357 *−0.320 *−0.0110.1900.0410.192
SMM−0.369 *−0.325 *−0.0120.1830.0420.188
BMI−0.128−0.2110.0210.348 *−0.0670.210
(b)
Body Composition FactorAI in Isokinetic Strength
PF_AnE_Kn
SLMleg AI0.397 **0.392 **
FMleg AI−0.1510.270
TBWleg AI0.415 **0.412 **
ICWleg AI0.289 *0.234
ECWleg AI0.2700.381 **
SLM−0.178−0.211
FM0.279−0.215
TBW−0.143−0.224
ICW−0.120−0.218
ECW−0.187−0.236
SMI−0.221−0.213
FFM−0.172−0.209
SMM−0.185−0.212
BMI0.090−0.258
Note. (a) A_RF, rectus femoris in phase A (heel strike–loading response); B_RF, rectus femoris in phase B (loading response–mid stance); B_BF, biceps femoris in phase B; B_GA, gastrocnemius in phase B; C_TA, tibialis anterior in phase C (terminal stance–pre-swing); C_GA, gastrocnemius in phase C. * p < 0.05 (uncorrected).(b) PF_An, ankle plantar flexion torque; E_Kn, knee extension torque. ** p < 0.01 (uncorrected). Values in bold remained significant after Benjamini–Hochberg correction (q < 0.05).
Disclaimer/Publisher’s Note: The statements, opinions and data contained in all publications are solely those of the individual author(s) and contributor(s) and not of MDPI and/or the editor(s). MDPI and/or the editor(s) disclaim responsibility for any injury to people or property resulting from any ideas, methods, instructions or products referred to in the content.