Article

Evolutionary Game Analysis of the Mutual Trust Dilemma in Health Data Circulation: A Symmetry Perspective on Supply and Demand


1
School of Economics and Management, Shandong Huayu University of Technology, Dezhou 253034, China
2
School of Business, Henan University of Science and Technology, Luoyang 471023, China
*
Author to whom correspondence should be addressed.
Symmetry 2026, 18(9), 1567; https://doi.org/10.3390/sym18091567 (registering DOI)
Submission received: 19 July 2026 / Revised: 11 September 2026 / Accepted: 16 September 2026 / Published: 19 September 2026
(This article belongs to the Section B: Mathematics)

Abstract

In the circulation of health data, the mutual trust dilemma leads to the symmetric problems of “inadequate supply” on the supply side and “impeded flow” on the demand side, which hinder the realization of data value. This paper analyzes the formation mechanism of this dilemma and its resolution pathways from a symmetry perspective. First, based on a literature review, we extract the manifestations of the mutual trust dilemma and construct a two-stage decision-making “vicious circle” model of mutual trust. Unlike conventional single-stage game models, this framework captures the sequential nature of trust decisions—entry in Stage 1 and compliance in Stage 2. Second, we establish a tripartite evolutionary game model involving data suppliers, demanders, and regulators, and employ MATLAB simulations to examine the impact of key parameters on strategic evolution. The findings reveal that: (1) beneficial data utilization scenarios are the prerequisite for participation; (2) strong regulation is the fundamental guarantee for mutual trust; and (3) while increasing penalties, reducing compliance costs, and enhancing trust-related gains can promote compliance, regulatory measures must be carefully balanced to avoid suppressing participation willingness. Accordingly, we propose a four-step progressive mutual trust mechanism comprising motivation activation, cooperation facilitation, performance guarantee, and trust reinforcement. Policy recommendations are offered regarding high-benefit scenarios, trusted data spaces, incentive policies, and data standardization, with the aim of building a trusted health data circulation ecosystem.

1. Introduction

At present, the world is rapidly entering the era of big data. Cloud computing, big data, artificial intelligence, and blockchain are being applied at scale. These technologies are driving the world into the fourth technological revolution, which is characterized by the digital economy [1]. Human society has entered a critical period of digital development. Data volumes are exhibiting explosive growth and massive aggregation [2]. The strategic and social application value of data has become increasingly prominent. Data has been analogized to gold [3], oil [4], oxygen [5], and sand [6]. In 2017, The Economist published an article describing data as “the world’s most valuable resource [7].” Major countries around the world have accelerated the development and utilization of data resources. Among these resources, health data has become one of the primary types prioritized for development and utilization. This is due to its rapid growth, massive aggregation, and immense medical, social, economic, and scientific value. In China, data has been upgraded from a “resource” to a “factor of production.” It now serves as a new engine driving economic growth. With respect to health data in particular, by the end of 2021, over 80% of tertiary hospitals in 30 provinces across the country had implemented electronic health card applications. These applications covered nearly 70% of the population. Currently, all provinces have established regional population health information platforms [8]. The steady construction of health data centers and the further improvement of urban and rural healthcare systems have accumulated vast amounts of health data. It is estimated that a medium-sized Chinese city with a population of 10 million will generate health data on the scale of 10 petabytes over 50 years. Effective mining and utilization of such data will bring enormous benefits to human health [9,10,11,12]. However, data can only achieve value appreciation through continuous circulation and use. The realization of data factor value is highly dependent on circulation efficiency [13,14,15]. In particular, health data is highly privacy-sensitive. The trust dilemma between data suppliers and demanders leads to data being “inadequate supply” and “impeded flow.” This severely impedes the efficient circulation of health data and constitutes a core obstacle to unlocking the value of data factors.
Domestic and international scholars have identified various concerns on both the supply and demand sides in data circulation. Data suppliers fear that they may lose effective control over their data [16,17]. They are also concerned about opaque usage or potential misuse of data by demanders [18,19]. Data demanders, on the other hand, need assurance that the data they obtain have legitimate sources and guaranteed quality [20,21]. Even if restrictive or prohibitive clauses are stipulated prior to transactions, it remains difficult to establish trust between the two parties and to adapt to diverse application scenarios [22]. As a result, both suppliers and demanders adopt a cautious attitude toward participating in data circulation [23]. Continuous communication is required for both sides to gain a detailed understanding of data products before further cooperation can be achieved [24]. On this basis, scholars have analyzed the essence of trusted data circulation [25] and the causes of trust issues [26,27,28]. They have proposed a PDCA (Participant–Data–Contract–Algorithm) trusted circulation system for data transactions [29]. To break the trust dilemma in data circulation, trusted data spaces underpinned by technologies such as privacy computing and blockchain are regarded as an infrastructure that can facilitate trusted data circulation while ensuring data privacy and security. Scholars have conducted research on the system architecture [30,31], operational models [32], institutional design [33,34], and technological applications [19] of trusted data spaces. Their efforts are devoted to improving the theoretical framework of trusted data spaces so as to support trusted data circulation.
Existing studies have extensively analyzed the manifestations and causes of the trust dilemma between supply and demand sides in data circulation. They have largely focused on technological means and the construction of trusted data spaces to resolve the trust dilemma. Some scholars have also employed evolutionary game methods to analyze multi-agent interactions in health data circulation [35,36]. However, research on the deep-seated causes and promotion mechanisms of mutual trust between data suppliers and demanders remains scarce. Evidently, the behaviors of data suppliers and demanders are subject to deep mutual influences, and trust exerts a significant impact on these behaviors. Against this backdrop, this paper attempts to start from the perspective of bilateral decision-making interaction in data circulation. Under given constraints, we employ evolutionary game methods to analyze the behavioral interactions among health data suppliers, data demanders, and regulators, and to explore strategic approaches to breaking the trust dilemma between the two sides. Specifically, we first analyze the multidimensional decisions faced by both suppliers and demanders in data circulation. On the basis of a two-stage decision-making framework, we construct a “vicious circle” model of mutual trust to explain the deep-seated causes of the mutual trust dilemma. Second, we dissect the decision-making stages and establish a two-stage decision model for both suppliers and demanders, clarifying the basic conditions for entering the stage-2 decision. Third, under the constraints of these basic conditions, we establish a tripartite evolutionary game model involving data suppliers, data demanders, and regulators in the stage-2 decision. We then conduct simulation experiments using MATLAB and discuss the results. Finally, we draw conclusions and put forward policy recommendations.
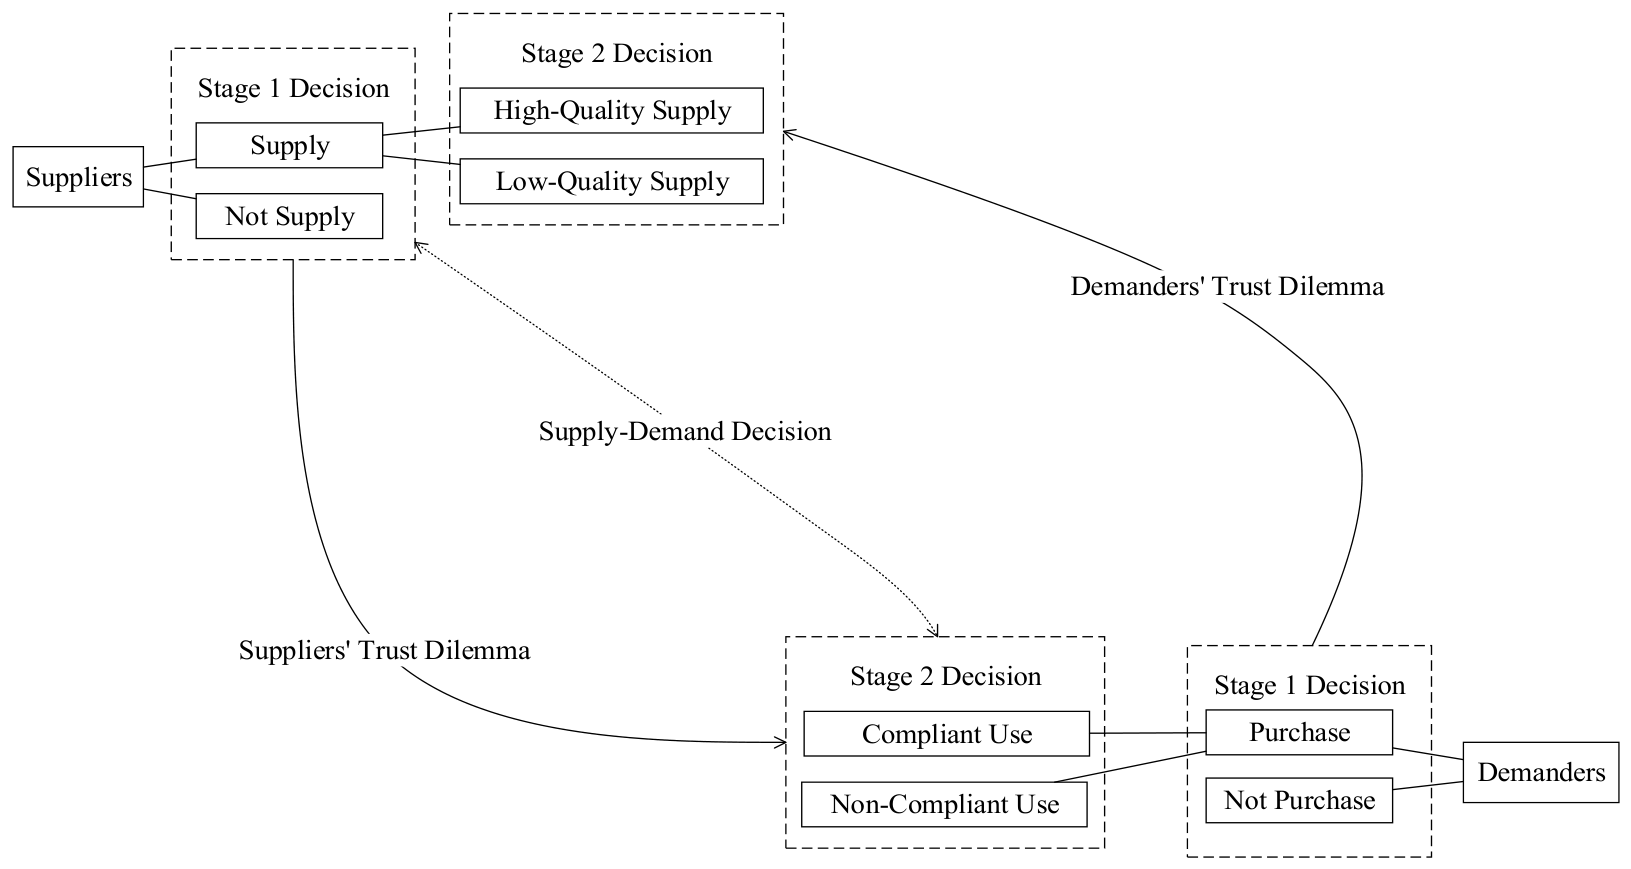
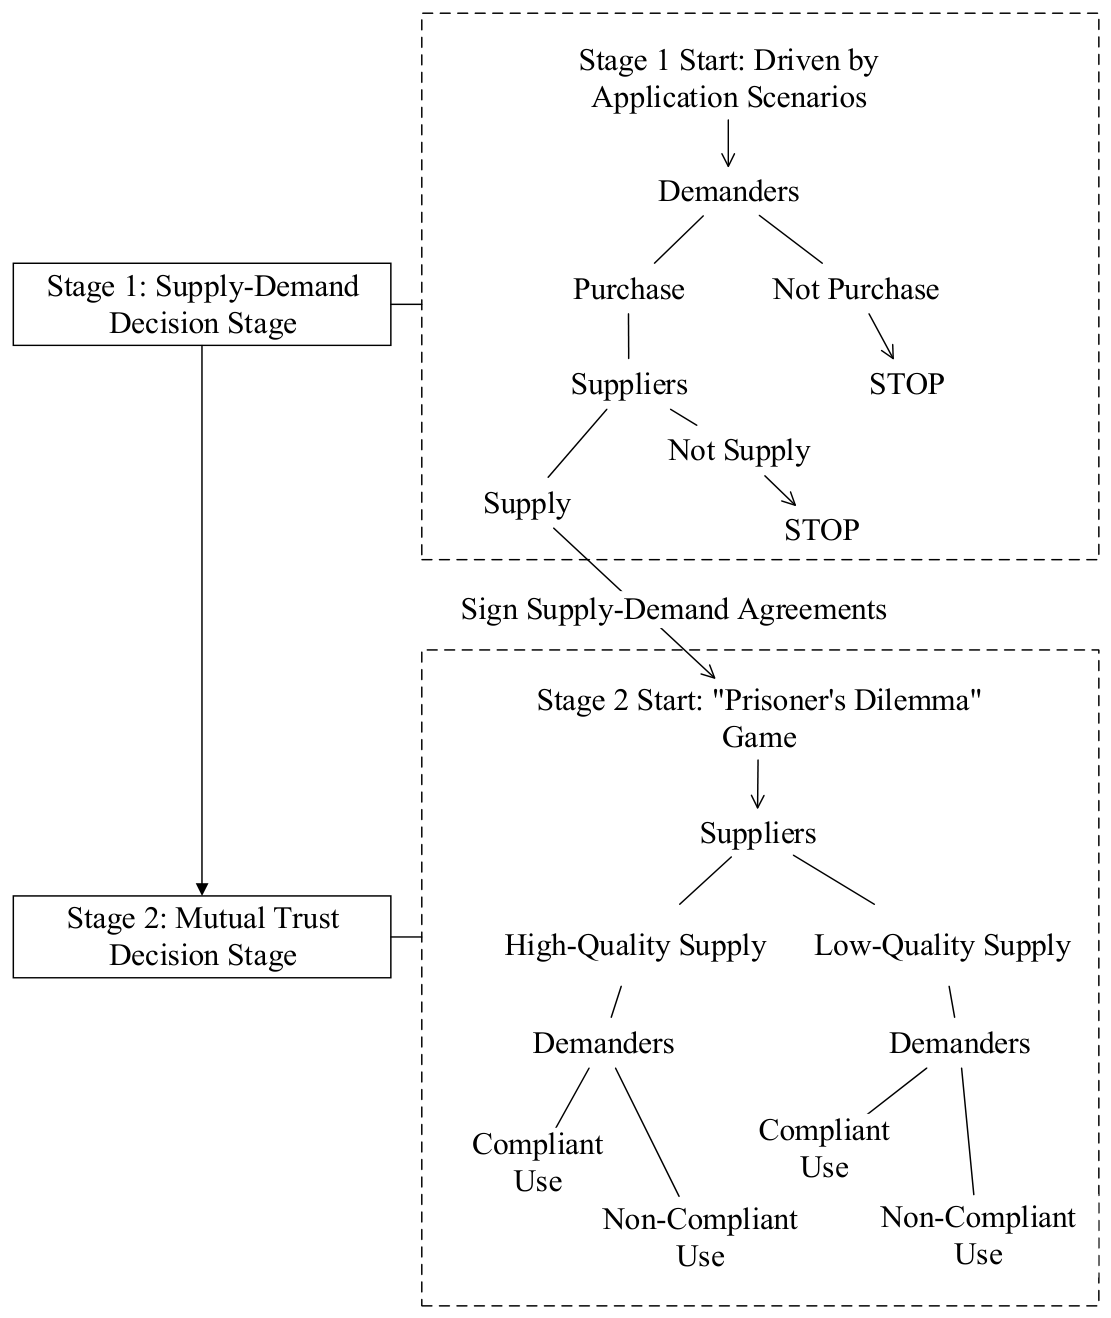
Before proceeding, it is necessary to clarify what we mean by “symmetry” in the context of this study. In this paper, we identify three distinct forms of symmetry that characterize the mutual trust dilemma in health data circulation: (i) Symmetry of distrust. Both suppliers and demanders face symmetric concerns about each other’s future behavior: suppliers fear that demanders will misuse data, while demanders fear that suppliers will provide low-quality data. This symmetric distrust forms the foundation of the ‘vicious circle’ depicted in Figure 1. (ii) Structural symmetry of decision-making. Both parties share an identical two-stage decision structure: Stage 1 involves the participation decision (whether to enter the transaction), and Stage 2 involves the compliance decision (whether to faithfully perform contractual obligations). This structural symmetry is illustrated in Figure 2. (iii) Strategic symmetry in the payoff matrix. Both suppliers and demanders possess symmetric strategy spaces (compliant vs. non-compliant, or high-quality vs. low-quality) and face analogous trade-offs between short-term gains and long-term trust-related payoffs, as formalized in Table 1.
It should be emphasized that this symmetry is analytical rather than structural. The three actors have inherently different strategies, incentives, and payoff structures. Suppliers choose data quality levels; demanders choose usage compliance; regulators choose enforcement intensity. These are fundamentally distinct roles with distinct payoff functions. The symmetry we refer to is not a claim that the actors are identical, but rather an analytical lens that reveals how the trust dilemma exhibits symmetrical properties, particularly in the mutual distrust between the two primary trading parties and in their shared two-stage decision hierarchy. Through this lens, we examine how asymmetric regulatory interventions can break the initial symmetry of distrust and eventually establish a new symmetry of mutual trust and compliance.
The central analytical task of this paper is to examine how this initial symmetry of distrust can be broken and eventually replaced by a new symmetry of mutual trust and compliance through regulatory intervention and incentive design.
To operationalize this analytical task, the key distinction of this study from existing evolutionary game analyses of data circulation lies in its explicit modeling of two sequential decision stages. While prior studies typically model a single-stage game where agents simultaneously decide whether to cooperate, we argue that the mutual trust dilemma in health data circulation involves a deeper layer of uncertainty: both suppliers and demanders must decide whether to enter a transaction (Stage 1) without knowing the other party’s subsequent compliance behavior (Stage 2). This two-stage structure captures the essence of the trust dilemma more faithfully than conventional one-stage models. Furthermore, whereas recent advances in adaptive or Bayesian evolutionary games address uncertainty through probabilistic priors, our setting involves Knightian uncertainty [37], in which neither party can form reliable probability estimates of the other’s default behavior. This makes standard evolutionary game theory a more appropriate and parsimonious modeling choice. To highlight the novelty of our approach, Table 2 provides a concise comparison between this study and representative prior evolutionary game analyses of data circulation across four dimensions: decision stages, actors involved, trust mechanism, and application context. This comparison underscores the distinctive contributions of our study in terms of its two-stage decision structure, explicit trust-related payoff parameters, and contextualization within China’s large-scale decentralized health data ecosystem. To the best of our knowledge, this study is the first to explicitly model the mutual trust dilemma in health data circulation through a two-stage decision framework coupled with a tripartite evolutionary game.

2. Game Model

2.1. Problem Description

Existing literature indicates that the trust dilemma between upstream suppliers and downstream demanders of health data is mainly manifested in the following aspects. Data suppliers fear that they will be held liable for data misuse after supply. Data demanders, on the other hand, find it difficult to verify data quality and worry that the data sources may be non-compliant or that the data quality may fail to meet their requirements. Generally, driven by application scenarios, demanders generate data usage needs and express their purchase or cooperation intentions to suppliers. Since data are often generated alongside suppliers’ actual business operations, they are characterized by concomitance. For example, health data are produced by medical institutions in the process of delivering medical care services. Suppliers therefore store large amounts of data that demanders need. In the long run, the supply–demand transactions between the two parties are by no means one-off deals. They often require long-term cooperation and interaction. Suppliers manage data quality and decide whether to take measures to improve it, while demanders decide how to use the data. The two parties bargain over data quality. However, due to information asymmetry, demanders cannot fully ascertain whether the data quality provided by suppliers meets their usage requirements. This gives rise to the trust dilemma on the demander side. Meanwhile, during transactions, although the data have been anonymized and the applicable scope and manner of use have been agreed upon with the supplier, the data are easy to replicate and carry potential re-identification risks. Suppliers are concerned that after selling the data to demanders, the demanders may use the data in non-compliant ways. This gives rise to the trust dilemma on the supplier side. From the perspective of decision-making by various agents, for data demanders, the motivation to participate in data circulation and utilization stems from the expectation that potential benefits outweigh costs, namely, a profit motive. Driven by this profit motive, downstream data demanders may use data in non-compliant or even abusive ways to obtain greater gains. Similarly, for data suppliers, driven by profit motives and technical barriers, providing high-quality data also entails high costs. They may therefore supply low-quality data while obtaining the same returns.
In a simplified view, the decision-making stages and trust dilemmas faced by both suppliers and demanders in health data circulation can be depicted as shown in Figure 1.
The demander’s decision can be divided into two stages. Stage 1 is the procurement decision. At this stage, the demander generates procurement motivation based on the application scenario but has doubts about the supplier’s data quality. This gives rise to the demander’s trust dilemma. Stage 2 is the usage decision. This stage presupposes that the purchase decision in Stage 1 has been made. At this point, the demander faces the temptation of non-compliant use driven by profit motives. The supplier’s decision is likewise divided into two stages. Stage 1 is the supply decision. After receiving a purchase request from the demander, the supplier must make a supply decision but is concerned about the potential non-compliant use of data by the demander. This gives rise to the supplier’s trust dilemma. Stage 2 is the data quality decision. This stage presupposes that the supply decision in Stage 1 has been made. At this point, the supplier faces the temptation of low-quality supply driven by profit motives. Both parties must make their supply and demand decisions simultaneously in Stage 1. However, each party harbors concerns about the other party’s anticipated behavior in Stage 2. This gives rise to a “vicious circle” dilemma of mutual trust between the two sides, which ultimately impedes data circulation and utilization.
From the above analysis, it can be seen that the root cause of the “vicious circle” dilemma lies in the uncertainty that each party faces in Stage 1 regarding the other party’s subsequent decisions in Stage 2. This two-stage structure reveals a structural symmetry between suppliers and demanders in terms of decision-making hierarchy, yet the payoff parameters governing each party’s choices are not necessarily aligned, reflecting the asymmetric information and risk exposures inherent in health data circulation.

2.2. Basic Assumptions

From the above analysis, it can be seen that there are two stages of decision-making for both suppliers and demanders in health data circulation, arranged in chronological order, as shown in Figure 2. In Stage 1, both parties need to make supply and demand decisions. If either party chooses to withdraw, the transaction ends. Therefore, to promote data circulation, it is necessary first to establish a mechanism that facilitates transactions between the two parties and to achieve the basic conditions for their mutual engagement. From the perspective of market economy, the fundamental motivation for both parties to participate in transactions is profit-driven. Accordingly, it can be argued that the basic condition for the two parties to reach a transaction is that engaging in the transaction can generate economic or social benefits. This highlights the importance of exploring data application scenarios. Therefore, this paper posits that the basic condition for the two parties to reach a transaction in Stage 1 is as follows. There exists a data application scenario in which both the data supplier and the data demander can obtain corresponding economic or social benefits when both parties strictly perform their respective duties in accordance with the contract. This constitutes the basic condition for both parties to enter the Stage 2 game.
Once both parties reach a transaction, they sign a supply and demand agreement and proceed to Stage 2 decision-making. At this stage, on the one hand, suppliers face lower costs when providing low-quality data and thus have incentives to reduce data quality. Moreover, demanders are often unable to make clear judgments about data quality due to information asymmetry and limited professional expertise. On the other hand, driven by the ease of data replication and profit motives, demanders may use data beyond the authorized scope. This increases the risk of data leakage and harms the interests of both data suppliers and data subjects. Consequently, even though both suppliers and demanders are fully aware that they can obtain corresponding benefits by strictly performing their respective duties in accordance with the contract, situations of “Non-Compliant Supply” and “Non-Compliant Use” may still occur. This gives rise to a “Prisoner’s Dilemma” game, as shown in Table 3 (where the payoff values are simulated). Such outcomes severely damage the interests of both parties and lead to the breakdown of trust, which is detrimental to the sustainable development of health data circulation and utilization. Under these circumstances, the involvement of regulators and the establishment of regulatory mechanisms become important means to resolve the mutual trust dilemma.
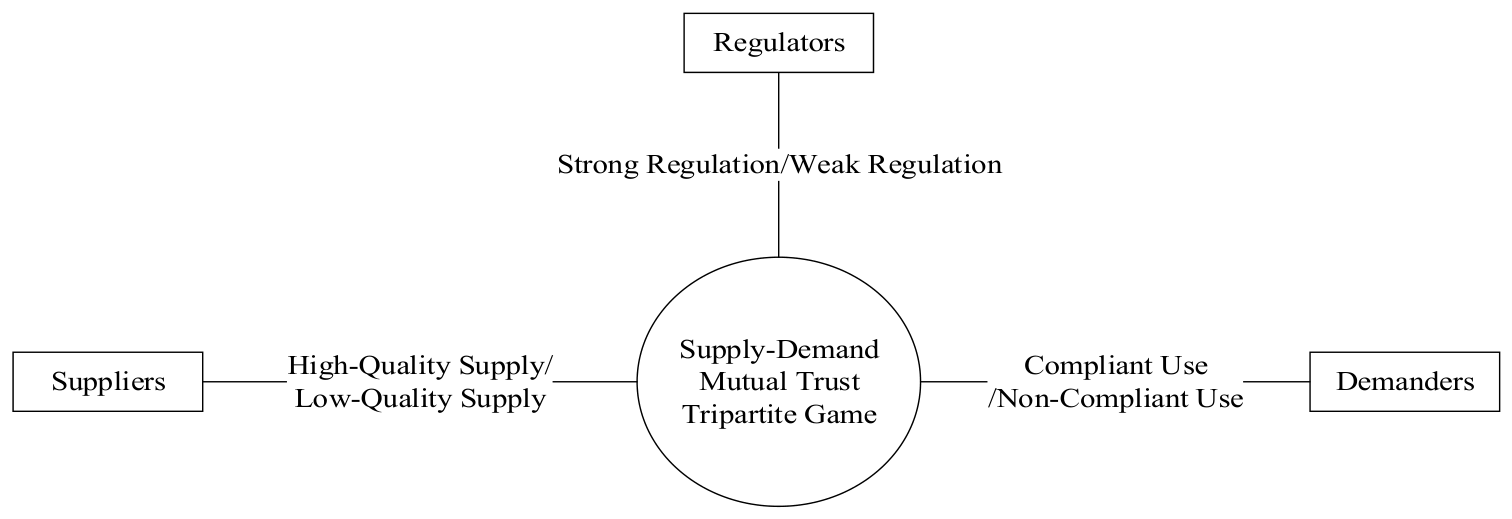
To promote trusted data circulation, platform operators or government agencies often assume the role of regulators. Once the regulator becomes involved in Stage 2, a tripartite game is formed among data suppliers, data demanders, and regulators, as shown in Figure 3.
Before proceeding to the model specification, it is important to clarify both the methodological boundary of our approach and its appropriateness for the specific empirical context of this study. Evolutionary Game Theory (EGT) is employed in this paper to analyze the long-term institutional evolution of trust in the health data circulation ecosystem. In this context, the “population” in our model should be understood as the distribution of strategic tendencies across organizations, which evolves over time as regulatory incentives and institutional conditions change. With this interpretation in mind, this population-based approach is particularly appropriate for the Chinese health data ecosystem. As of 2024, China has 11,754 public hospitals and 26,956 private hospitals, together with over 1.09 million healthcare institutions nationwide [44], each operating with heterogeneous digital systems and varying levels of data governance capacity. On the regulatory side, the development of a national integrated data market is being pursued through provincial-level pilot programs, with oversight distributed across 685 municipal-level administrative units. This institutional architecture generates a large-scale, highly fragmented, and decentralized ecosystem, rather than a small group of centralized actors. While administrative hierarchies, legal mandates, and localized regulatory jurisdictions do exist in practice, China’s health data circulation market remains in a nascent and exploratory stage. Currently, most data transactions occur through off-exchange channels, and regulatory frameworks are still under development. In this context, the “population” in our model should be understood as a characterization of the current market’s fluid and unstructured nature, where institutional boundaries and formal regulatory oversight have not yet fully solidified. This makes the adaptive, trial-and-error logic of EGT a more appropriate modeling choice than a fully rational, forward-looking optimization framework. In such a context, the “large population” assumption of EGT offers a more appropriate representation of the empirical reality.
Similarly, from a long-term perspective, following the approach of Wang Dandan et al. [35], we incorporate the trust-related gains and losses of all parties. Trust loss or gain is defined as the expected actual benefit loss or gain that one party anticipates from the other party when the former perceives that the latter’s competence and goodwill have decreased or increased. The strategy space of data suppliers is {high-quality supply, low-quality supply}. The “high-quality supply” strategy means that the supplier invests substantial human, material, and financial resources to ensure the highest possible data quality. The “low-quality supply” strategy means that the supplier relies on technical barriers and makes no additional investment to improve data quality. The strategy space of data demanders is {compliant use, non-compliant use}. The “compliant use” strategy means that the demander uses the data reasonably and legally in strict accordance with laws, regulations, and contractual terms. The “non-compliant use” strategy means that the demander uses or even abuses data in violation of regulations to obtain greater benefits, which will expose both suppliers and demanders to significant risks. The strategy space of regulators is {strong regulation, weak regulation}. “Strong regulation” means that the regulator strictly follows laws and regulations, invests in data utilization infrastructure, and uses blockchain technology to promptly detect and penalize violations. “Weak regulation” means that the regulator relaxes oversight due to regulatory costs or other reasons.
Assumption 1: The suppliers, the demanders, and the regulators are all bounded rational agents. The regulator emphasizes long-term sustainable development and pays attention to the balance between data circulation and security protection. The regulator considers trust-related gains and losses, which can be regarded as considerations of future benefits or losses. The demander makes a trade-off between short-term and long-term interests. In the short term, non-compliant use of data can bring immediate benefits but entails the risk of trust loss. In the long term, the demander considers trust-related gains and losses, which can also be viewed as considerations of future benefits or losses. Similarly, the supplier makes a trade-off between short-term and long-term interests. In the short term, providing low-quality data can bring immediate benefits but entails the risk of trust loss. In the long term, the supplier considers trust-related gains and losses, which can likewise be viewed as considerations of future benefits or losses.
Assumption 2: Let x denote the proportion of suppliers choosing high-quality supply, and 1 x denote the proportion choosing low-quality supply. Let y denote the proportion of demanders choosing compliant use, and 1 y denote the proportion choosing non-compliant use. Let z denote the proportion of regulators choosing strong regulation, and 1 z denote the proportion choosing weak regulation.
Assumption 3: Costs and benefits of the data suppliers. When the supplier adopts the high-quality supply strategy, the supplier incurs a cost of C 1 , obtains economic benefits of P 1 , and gains trust benefits of T 1 . The probability of data leakage is a when the demander uses the data compliantly, and b when the demander uses the data non-compliantly. When data leakage occurs, the supplier’s compensation base to the data subject (e.g., patients) is E 11 , meaning that the supplier is liable for a × E 11 or b × E 11 . However, when the regulator adopts strong regulation and identifies that the demander’s non-compliant use has caused the data leakage, this compensation amount is borne by the demander. When the supplier adopts the low-quality supply strategy, the supplier incurs a cost of C 2 . Due to the supplier’s technical barriers, the economic benefits remain P 1 . The supplier suffers a trust loss of L 1 for supplying low-quality data. When the regulator adopts strong regulation and identifies that the supplier has supplied low-quality data, the supplier pays a penalty of F 1 to the regulator and pays liquidated damages of E 12 to the demander. The probability of data leakage and the compensation base remain the same as those under the high-quality supply strategy. Due to the high privacy sensitivity of health data, the supplier, as the data custodian, suffers a social reputation loss of L s when a data leakage incident occurs.
Assumption 4: Costs and benefits of the data demanders. When the demander chooses compliant use of data, the demander incurs a cost of P 1 and gains a trust benefit of T 2 . When the supplier provides high-quality data, the demander obtains a basic economic benefit of P 21 . When the supplier provides low-quality data, the demander obtains a basic economic benefit of P 22 , with P 21 > P 22 . When the demander chooses non-compliant use of data, the cost remains P 1 . The demander can obtain additional benefits. Specifically, when the supplier provides high-quality data, the demander’s benefit is P 21 + P 31 . When the supplier provides low-quality data, the demander’s benefit is P 22 + P 32 , with P 31 > P 32 . The probability of data leakage is the same as described above. However, when data leakage occurs, the compensation base that the data demander pays to the data subject is E 21 , and the demander bears greater responsibility, meaning that E 21 > E 11 . Under strong regulation, the regulator can detect non-compliant data use through blockchain-based monitoring. Once detected, the demander pays a penalty of F 2 to the regulator and pays liquidated damages of E 22 to the data supplier. The demander also suffers a trust loss of L 2 and bears the compensation liability to the data subject on behalf of the supplier. If the non-compliant use is not detected, the demander can still obtain the trust benefit of T 2 .
Assumption 5: Costs and benefits of the regulators. When the regulator chooses the strong regulation strategy, it employs technologies such as blockchain to detect non-compliant behaviors and incurs a cost of C 3 , while gaining a trust benefit of T 3 . The regulator collects a penalty of F 1 when the supplier’s low-quality supply is detected, and a penalty of F 2 when the demander’s non-compliant use is detected. When the regulator chooses the weak regulation strategy, it fails to detect any non-compliant behaviors on either side, incurs zero cost, and suffers a trust loss of L 3 .
Based on the above assumptions, we now clarify how the concept of trust is operationalized in our model. Trust is acknowledged as a multidimensional construct in contemporary organizational and social psychology research, encompassing cognitive trust, affective trust, and institutional trust [45,46]. However, in the context of evolutionary game modeling, it is a standard and necessary practice to operationalize such complex behavioral constructs into quantifiable payoff parameters that can enter agents’ utility calculations [47,48]. In our model, the trust benefit parameters ( T 1 , T 2 , T 3 ) capture the long-term cooperative gains that agents expect to receive when the counterparty demonstrates trustworthy behavior, while the trust loss parameters ( L 1 , L 2 , L 3 ) capture the reputational and relational damages agents suffer when trust is breached. Together, they represent the economic consequences of trust (or distrust) in repeated interactions, which is a parsimonious but theoretically grounded way to incorporate trust into the strategic calculus of bounded-rational agents.
The symbols of all parameters and their corresponding meanings are shown in Table 4. The tripartite evolutionary game payoff matrix among the suppliers, the demanders, and the regulators is constructed as shown in Table 1.

2.3. Replicator Dynamics Equations

Based on Table 1, the expected payoffs for the data supplier choosing the “high-quality supply” and “low-quality supply” strategies are denoted as USH and USL, respectively, and the average expected payoff US is given as follows.
USH = y[z(P1C1 + T1a(E11 + LS)) + (1 − z)(P1C1 + T1a(E11 + LS))] + (1 − y)[z(P1C1 + T1bLS + E22) + (1 − z)(P1C1 + T1b(E11 + LS))] = P1C1 + T1b(E11 + LS) + y(ba)(E11 + LS) + (1 − y)z(E22 + bE11)
USL = y[z(P1C2L1a(E11 + LS) − (F1 + E12)) + (1 − z)(P1C2L1a(E11 + LS))] + (1 − y)[z(P1C2L1bLSF1E12) + (1 − z)(P1C2L1b(E11 + LS))] = P1C2L1b(E11 + LS) + (ba)(E11 + LS)yz(F1 + E12)
US = xUSH + (1 − x)USL = P1b(E11 + LS) + y(ba)(E11 + LS) + x(T1 + L1 + C2C1) + z[F1 + E12 + x(1 − y)(E22 + bE11)]
The expected payoffs for the data demander choosing the “compliant use” and “non-compliant use” strategies are denoted as UUC and UUN, respectively, and the average expected payoff UU is given as follows.
UUC = x[z(P21P1 + T2aE21) + (1 − z)(P21P1 + T2aE21)] + (1 − x)[z(P22P1 + T2aE21 + E12) + (1 − z)(P22P1 + T2aE21)] = xP21 + (1 − x)P22P1 + T2aE21 + (1 − x)zE12
UUN = x[z(P21 + P31P1b(E21 + E11) − (F2 + L2 + E22)) + (1 − z)(P21 + P31P1 + T2bE21)] + (1 − x)[z(P22 + P32P1b(E21 + E11) − (F2 + L2 + E22) + E12) + (1 − z)(P22 + P32P1 + T2bE21)] = xP21 + (1 − x)P22 + xP31 + (1 − x)P32P1bE21 + (1 − z)T2z[bE11 + F2 + L2 + E22 − (1 − x)E12]
UU = yUUC + (1 − y)UUN = xP21 + (1 − x)P22P1bE21 + (1 − y)(1 − z)T2 + yT2 + y(1 − x)zE12 + (1 − y)[xP31 + (1 − x)P32z(bE11 + F2 + L2 + E22 − (1 − x)E12)]
The expected payoffs for the data regulator choosing the “strong regulation” and “weak regulation” strategies are denoted as U RS and U RW , respectively, and the average expected payoff U R is given as follows.
URS = x[y(T3C3) + (1 − y)(T3C3 + F2)] + (1 − x)[y(T3C3 + F1) + (1 − y)(T3C3 + F1 + F2)] = T3C3 + (1 − x)F1 + (1 − y)F2
URW = −L3
UR = zURS + (1 − z)URW = z[T3C3 + L3 + (1 − x)F1 + (1 − y)F2] − L3
According to the method for constructing replicator dynamics equations, the replicator dynamics equations for the data supplier, the data demander, and the regulator are, respectively, given as follows.
F(x) = x(1 − x){T1 + L1 + C2C1 + z[F1 + E12 + (1 − y)(E22 + bE11)]}
F(y) = y(1 − y)[zT2 + E21(ba) − xP31 − (1 − x)P32 + z(bE11 + F2 + L2 + E22)]
F(z) = z(1 − z)[T3C3 + L3 + (1 − x)F1 + (1 − y)F2]

2.4. Strategy Stability Analysis

By setting F ( x ) = 0 , F ( y ) = 0 , F ( z ) = 0 , the local equilibrium points of the tripartite game can be obtained. Since the asymptotically stable solutions of the replicator dynamic system in multi-population evolutionary games must be strict Nash equilibria [49], only the eight pure-strategy equilibrium points, denoted as E 1 ( 0 , 0 , 0 ) , E 2 ( 0 , 0 , 1 ) , E 3 ( 0 , 1 , 0 ) , E 4 ( 0 , 1 , 1 ) , E 5 ( 1 , 0 , 0 ) , E 6 ( 1 , 0 , 1 ) , E 7 ( 1 , 1 , 0 ) , E 8 ( 1 , 1 , 1 ) need to be considered. Following Friedman’s method [47], we take the partial derivatives of F ( x ) , F ( y ) , and F ( z ) with respect to x , y , and z , respectively, to obtain the Jacobian matrix J of the replicator dynamic system:
J = ( 1 2 x ) { T 1 + L 1 + C 2 C 1 + z [ F 1 + E 12 + ( 1 y ) ( E 22 + b E 11 ) ] } x ( x 1 ) z ( E 22 + b E 11 ) x ( x 1 ) [ F 1 + E 12 + ( 1 y ) ( E 22 + b E 11 ) ] y ( y 1 ) ( P 32 P 31 ) ( 1 2 y ) [ z T 2 + E 21 ( b a ) x P 31 ( 1 x ) P 32 + z ( b E 11 + F 2 + L 2 + E 22 ) ] y ( y 1 ) ( T 2 + b E 11 + F 2 + L 2 + E 22 ) z F 1 ( z 1 ) z F 2 ( z 1 ) ( 1 2 z ) [ T 3 C 3 + L 3 + ( 1 x ) F 1 + ( 1 y ) F 2 ]
By substituting E 1 through E 8 into the Jacobian matrix sequentially, the eigenvalues of the matrix are calculated, and the results are shown in Table 5. According to Lyapunov’s first method [50], an equilibrium point is asymptotically stable (an ESS) only when all eigenvalues of the Jacobian matrix have negative real parts. When one or more eigenvalues of the Jacobian matrix have positive real parts, the equilibrium point is unstable. When the eigenvalues of the Jacobian matrix consist of both zero real parts and negative real parts, the equilibrium point is in a critical state, and its stability cannot be determined by the signs of the eigenvalues alone. Based on this criterion, it can be concluded that all eight equilibrium points in the above table are evolutionarily stable under certain conditions. That is, each equilibrium point is asymptotically stable when all three corresponding eigenvalues are less than zero.

3. Simulation Analysis

3.1. Initial Values and Simulation Setup

Considering the actual future context of health data circulation and trading in China, we construct the initial simulation data based on the following facts. China has high expectations regarding the social, economic, and scientific value to be generated by future data circulation. However, at present, on-exchange data transactions remain scarce, while off-exchange transactions are relatively more prevalent. Data circulation regulation faces considerable difficulties. The country is vigorously promoting the construction of trusted data spaces and extensively adopting blockchain technology to strengthen the regulation of data circulation processes. Therefore, the initial parameter settings can start from a weak regulation scenario. Through dynamic evolution, we can study the impact of future large-scale investment in infrastructure and enhanced regulation on the outcomes of the system evolution. Furthermore, based on the basic conditions for entering Stage 2 from Stage 1 and the fundamental assumptions of the game model, the following inequalities should remain constant throughout the simulation process: P 1 C 1 + T 1 a ( E 11 + L s ) > 0 (the basic condition for the supplier to make a supply decision in Stage 1), P 21 P 1 + T 2 a E 21 > 0 (the basic condition for the demander to make a purchase decision in Stage 1), P 21 > P 22 , P 31 > P 32 , and E 21 > E 11 .
Further, given the early stage of health data circulation markets in China, publicly available transaction data for systematic parameter calibration remain scarce, and existing literature provides limited guidance on parameter values for this specific context. Therefore, the baseline parameter values in this study were set based on theoretical derivation, practical plausibility, and cross-referencing with similar evolutionary game studies in related fields [35,36]. These parameter settings inherently involve a degree of subjectivity. The specific numerical values are intended for reference purposes only, as the primary focus of this study is on the directional effects of parameter variations on evolutionary outcomes rather than on the precise magnitudes of the parameters themselves. The initial values of the influencing factors are set as shown in Table 6.
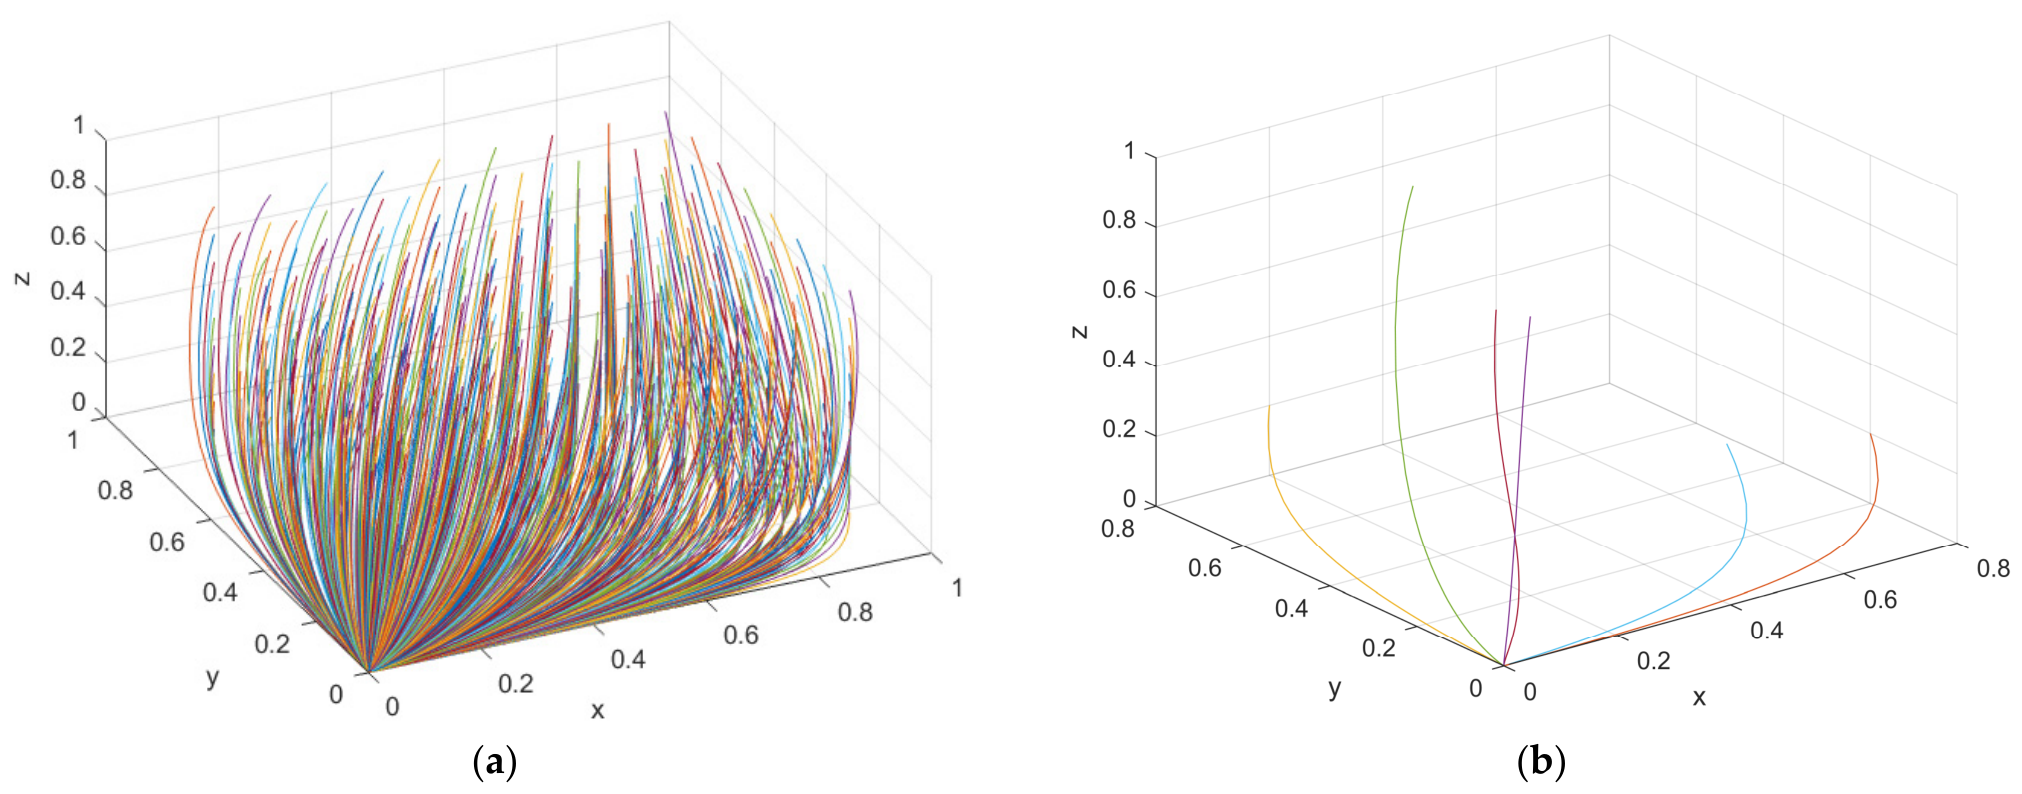
To test the robustness of the simulation results to initial conditions, we systematically varied the initial proportions of the three strategies. First, we set the initial values to x = y = z = 0.1 and then gradually increased them in steps of 0.1, running the simulation for each initial state from 0.1 to 0.9. The evolutionary results for these symmetric initial conditions are shown in Figure 4a. Furthermore, we considered asymmetric initial proportions for the three parties, sequentially assigning the initial strategy combinations (x, y, z) = (0.8, 0.2, 0.2), (0.2, 0.8, 0.2), (0.2, 0.2, 0.8), (0.3, 0.6, 0.9), (0.7, 0.4, 0.1), and (0.6, 0.8, 0.3). The simulation results for these asymmetric initial conditions are illustrated in Figure 4b.
The above analyses indicate that the system converges to the same equilibrium state, namely (low-quality supply, non-compliant use, weak regulation), regardless of the initial conditions, confirming that the qualitative conclusions are robust to such variations.
To facilitate the reproducibility of our simulation results, we provide the following technical details of the numerical implementation. The numerical simulations were conducted using MATLAB R2017b. The replicator dynamics system, consisting of Equations (10)–(12), was solved using the standard fourth-order Runge–Kutta method (ode45) with an adaptive step size. The default relative and absolute error tolerances were set to 1 × 10⁻³ and 1 × 10⁻⁶, respectively. The simulation time horizon was set to t = 10 for all parameter sensitivity analyses (Figure 5, Figure 6, Figure 7, Figure 8, Figure 9, Figure 10, Figure 11, Figure 12, Figure 13, Figure 14 and Figure 15) and t = 1 for the initial condition robustness tests (Figure 4), which was sufficient for all trajectories to converge to their respective equilibria. The initial proportions were set to (x, y, z) = (0.5, 0.5, 0.5) for the baseline analysis, with additional initial conditions for robustness tests as specified in the corresponding subsections. The complete MATLAB source code is provided as Supplementary Material S1.

3.2. Simulation Analysis of Mutual Trust Pathways Between Supply and Demand Sides

To investigate the impact mechanisms of key parameters on the system’s evolutionary outcomes, we adopt a one-variable-at-a-time sensitivity analysis approach. This method is widely used in evolutionary game simulations as an effective exploratory tool to isolate and visualize the marginal effect of each parameter on the system dynamics [35,44]. While more sophisticated approaches such as Monte Carlo simulations or Bayesian uncertainty analysis are valuable for capturing joint parameter uncertainty, they typically require assumptions about parameter distributions or prior information that are not readily available in the absence of empirical data. Given the exploratory nature of our study and the lack of large-scale empirical calibration data for health data circulation in China, the one-variable-at-a-time approach offers a transparent and interpretable baseline for understanding the directional effects of key parameters.
Based on the initial system state of (low-quality supply, non-compliant use, weak regulation), we investigate the impact mechanisms of key parameter changes on the system’s evolution toward the state of (high-quality supply, compliant use, strong regulation). In line with practical considerations, we sequentially examine the following two expected state transitions. First, driven by relevant policies in China, the regulators’ future trust benefit T 3 increases sharply. Second, after T 3 increases to a certain level, we examine the effects of various key parameter changes on the evolutionary outcomes.

3.2.1. The Impact of an Increase in the Regulator’s Trust Benefit T 3 Under Strong Regulation on Evolutionary Outcomes

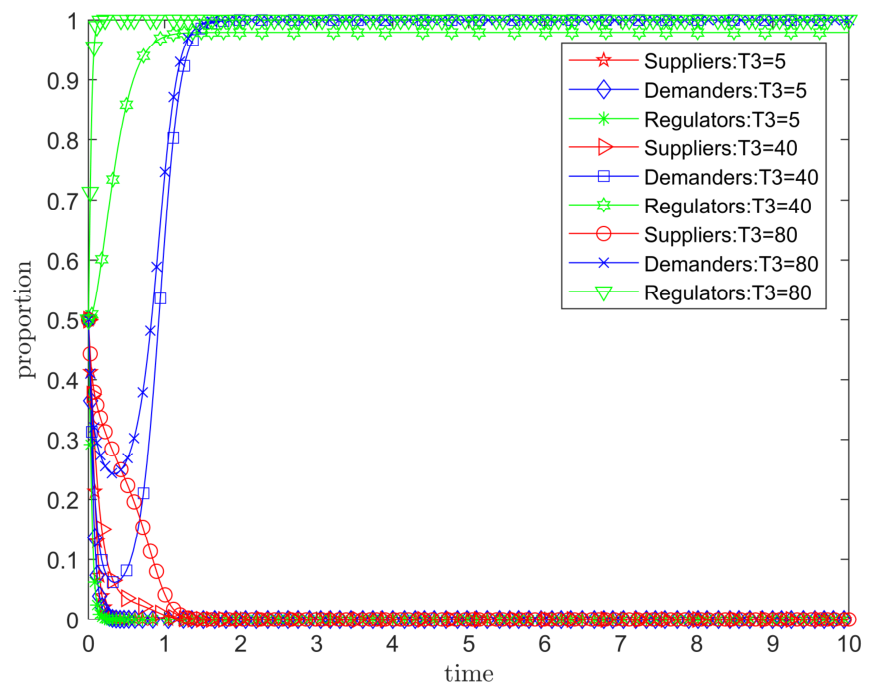
Based on the initial baseline values set above, we increase the value of T 3 to simulate the evolutionary outcomes when the regulators’ expectation of trust benefits rises, driven by policies aimed at promoting data circulation and utilization in China. We sequentially set T 3 = 5, 40, and 80, and the evolutionary results are shown in Figure 5. As T 3 increases, the regulators’ strategy choice gradually shifts from “weak regulation” to “strong regulation.” Moreover, the larger T 3 is, the faster the regulators’ strategy transition occurs. The data demanders’ strategy choice initially tends toward “non-compliant use.” However, as the regulators’ strategy shifts, the demanders’ strategy choice also changes and moves toward “compliant use.” The data suppliers’ strategy choice still tends toward “low-quality supply” due to the high cost of high-quality supply or the low penalty for low-quality supply. Nevertheless, the speed of this choice slows down as T 3 increases. Ultimately, the system reaches an equilibrium state of (low-quality supply, compliant use, strong regulation).

3.2.2. The Impact of an Increase in the Penalty F 1 on Low-Quality Supply by the Data Supplier on Evolutionary Outcomes

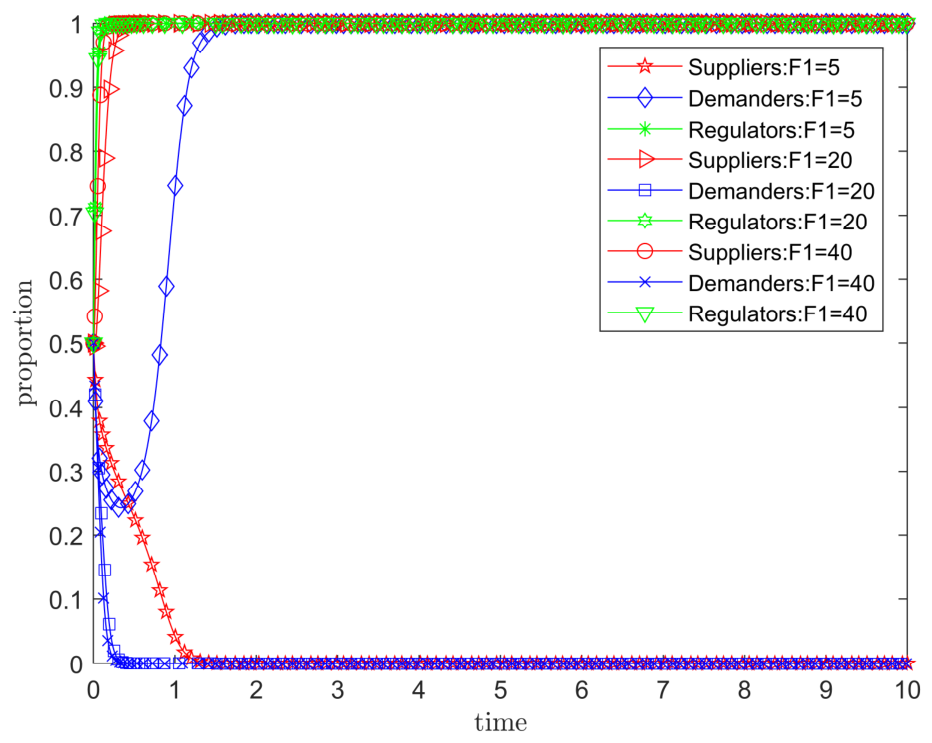
Next, we keep T 3 = 80 unchanged and vary the value of F 1 . We sequentially set F 1 = 5, 20, and 40, while keeping the other initial parameter values unchanged. The evolutionary results are shown in Figure 6. First, due to the regulators’ large trust benefit, the regulators quickly adopt the “strong regulation” strategy. Second, as the penalty F 1 for low-quality data supply by the supplier increases from 5 to 20, the suppliers’ strategy choice gradually shifts from “low-quality supply” to “high-quality supply.” Subsequently, with strong regulation by the regulator and high-quality supply by the supplier, the demanders’ strategy choice paradoxically shifts from “compliant use” to “non-compliant use.” This occurs because the additional benefits from non-compliant use are relatively large or the penalty for such use is relatively low. Ultimately, the system reaches an equilibrium state of (high-quality supply, non-compliant use, strong regulation).

3.2.3. The Impact of an Increase in the Penalty F 2 on Non-Compliant Use by the Data Demander on Evolutionary Outcomes

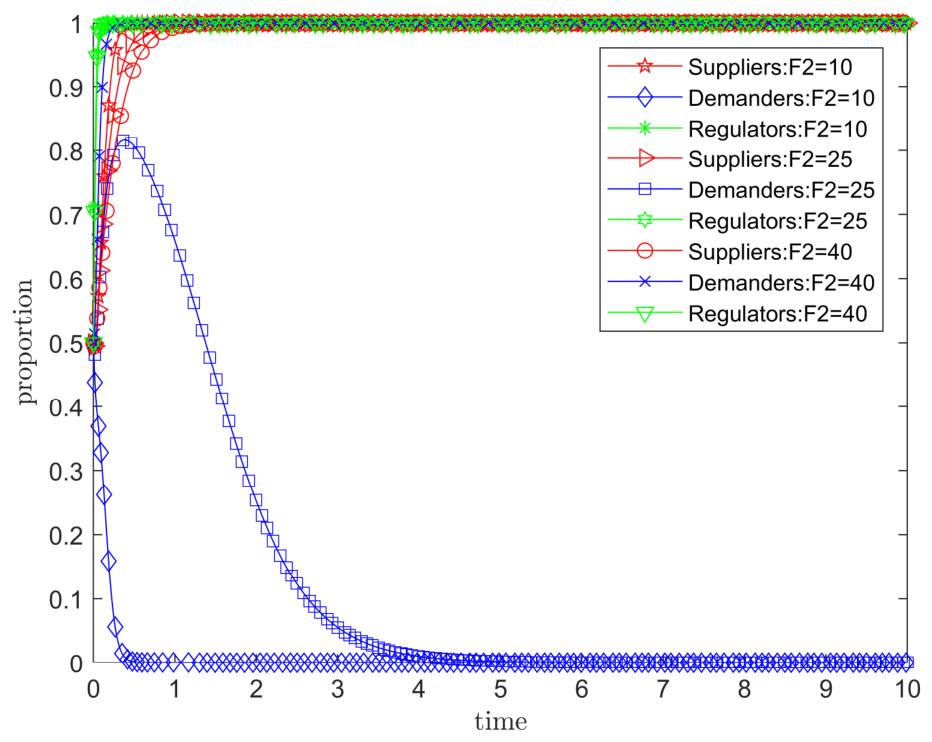
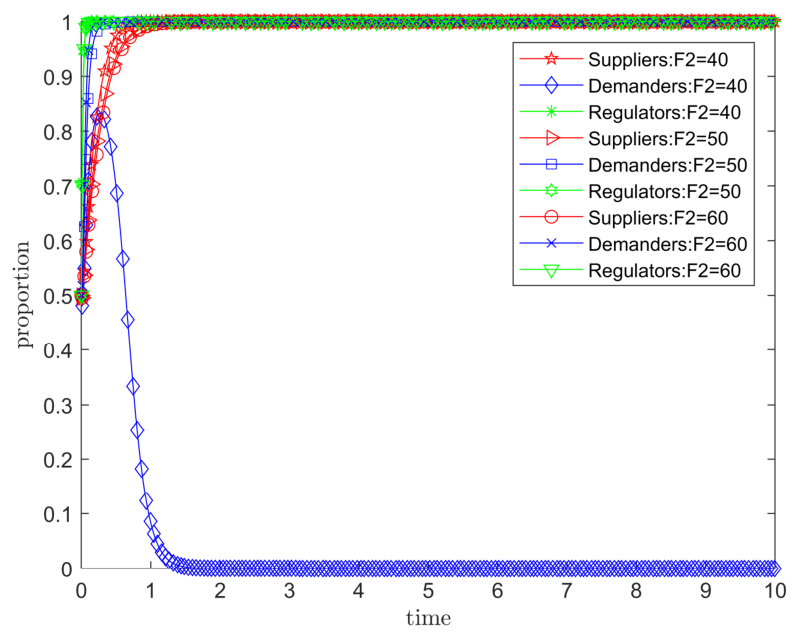
Keeping T 3 = 80 and F 1 = 20 unchanged, we sequentially set F 2 = 10, 25, and 40, while keeping the other initial parameter values unchanged. The evolutionary results are shown in Figure 7. Due to the regulators’ large trust benefit, the regulators still quickly adopt the “strong regulation” strategy. The data suppliers quickly adopt the high-quality supply strategy because of the relatively large penalty F 1 . The increase in F 2 has a significant impact on the data demanders’ strategy choice. As F 2 increases, the demanders gradually shift toward the “compliant use” strategy. Ultimately, the system reaches an equilibrium state of (high-quality supply, compliant use, strong regulation).

3.2.4. The Impact of an Increase in the Additional Benefit P 31 from Non-Compliant Use by the Data Demander on Evolutionary Outcomes

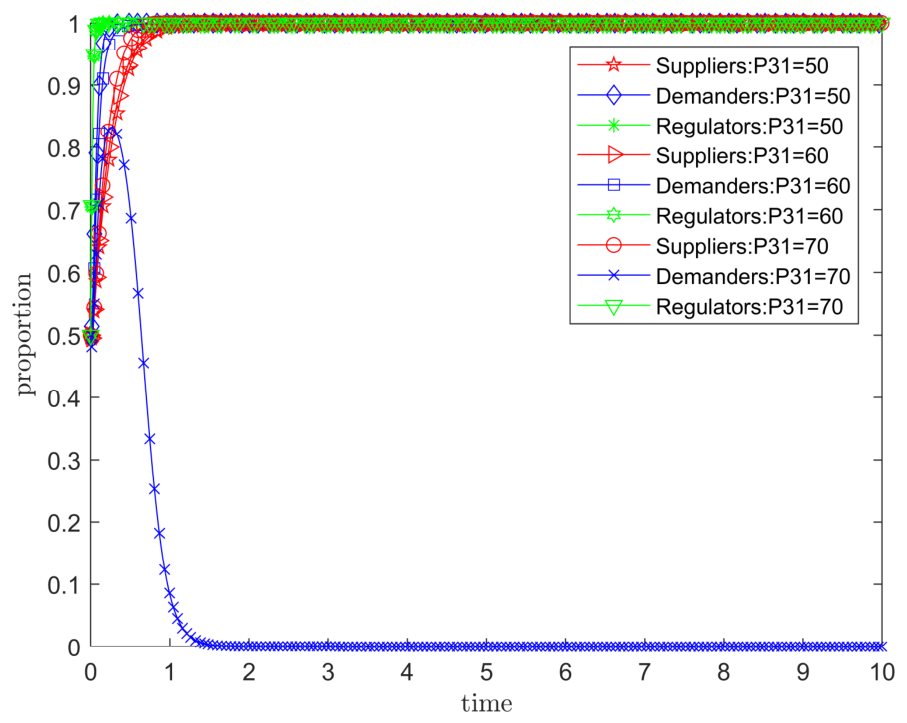
Keeping T 3 = 80, F 1 = 20, and F 2 = 40 unchanged, we sequentially set P 31 = 50, 60, and 70, while keeping the other initial parameter values unchanged. The evolutionary results are shown in Figure 8. The increase in P 31 has a significant impact on the data demanders’ strategy choice, ultimately prompting the demanders to adopt the “non-compliant use” strategy. The system then reaches an equilibrium state of (high-quality supply, non-compliant use, strong regulation). Under this condition, with P 31 held at 70, we further set F 2 = 40, 50, and 60. The evolutionary results show that an increase in the regulators’ penalty F 2 on the data demander can offset the effect of the increase in P 31 , eventually restoring the system to the equilibrium state of (high-quality supply, compliant use, strong regulation), as shown in Figure 9.
These findings reveal a systematic trade-off between the additional benefits of non-compliant use and the penalties designed to deter such behavior. When the potential gains from non-compliant use remain moderate, the existing penalty level is sufficient to maintain compliance. However, as these gains increase to a certain level, the deterrent effect of the penalty is overwhelmed, leading to the widespread adoption of non-compliant strategies by data demanders. In such cases, strengthening the penalty can restore compliance by re-establishing the deterrent effect. This offsetting relationship implies that the effectiveness of regulatory penalties is not absolute but depends critically on the relative magnitude of the benefits that demanders can obtain from non-compliant use. Consequently, regulatory design should adopt a dynamic approach, periodically adjusting penalty levels to keep pace with changes in the potential returns from non-compliant behavior, rather than relying on static penalty schedules.

3.2.5. The Impact of Changes in Other Parameters on Evolutionary Outcomes

Through multiple simulation experiments, it is found that the effects of changes in other parameters on evolutionary outcomes are similar to those caused by certain parameter changes in the above process. The specific explanations are as follows.
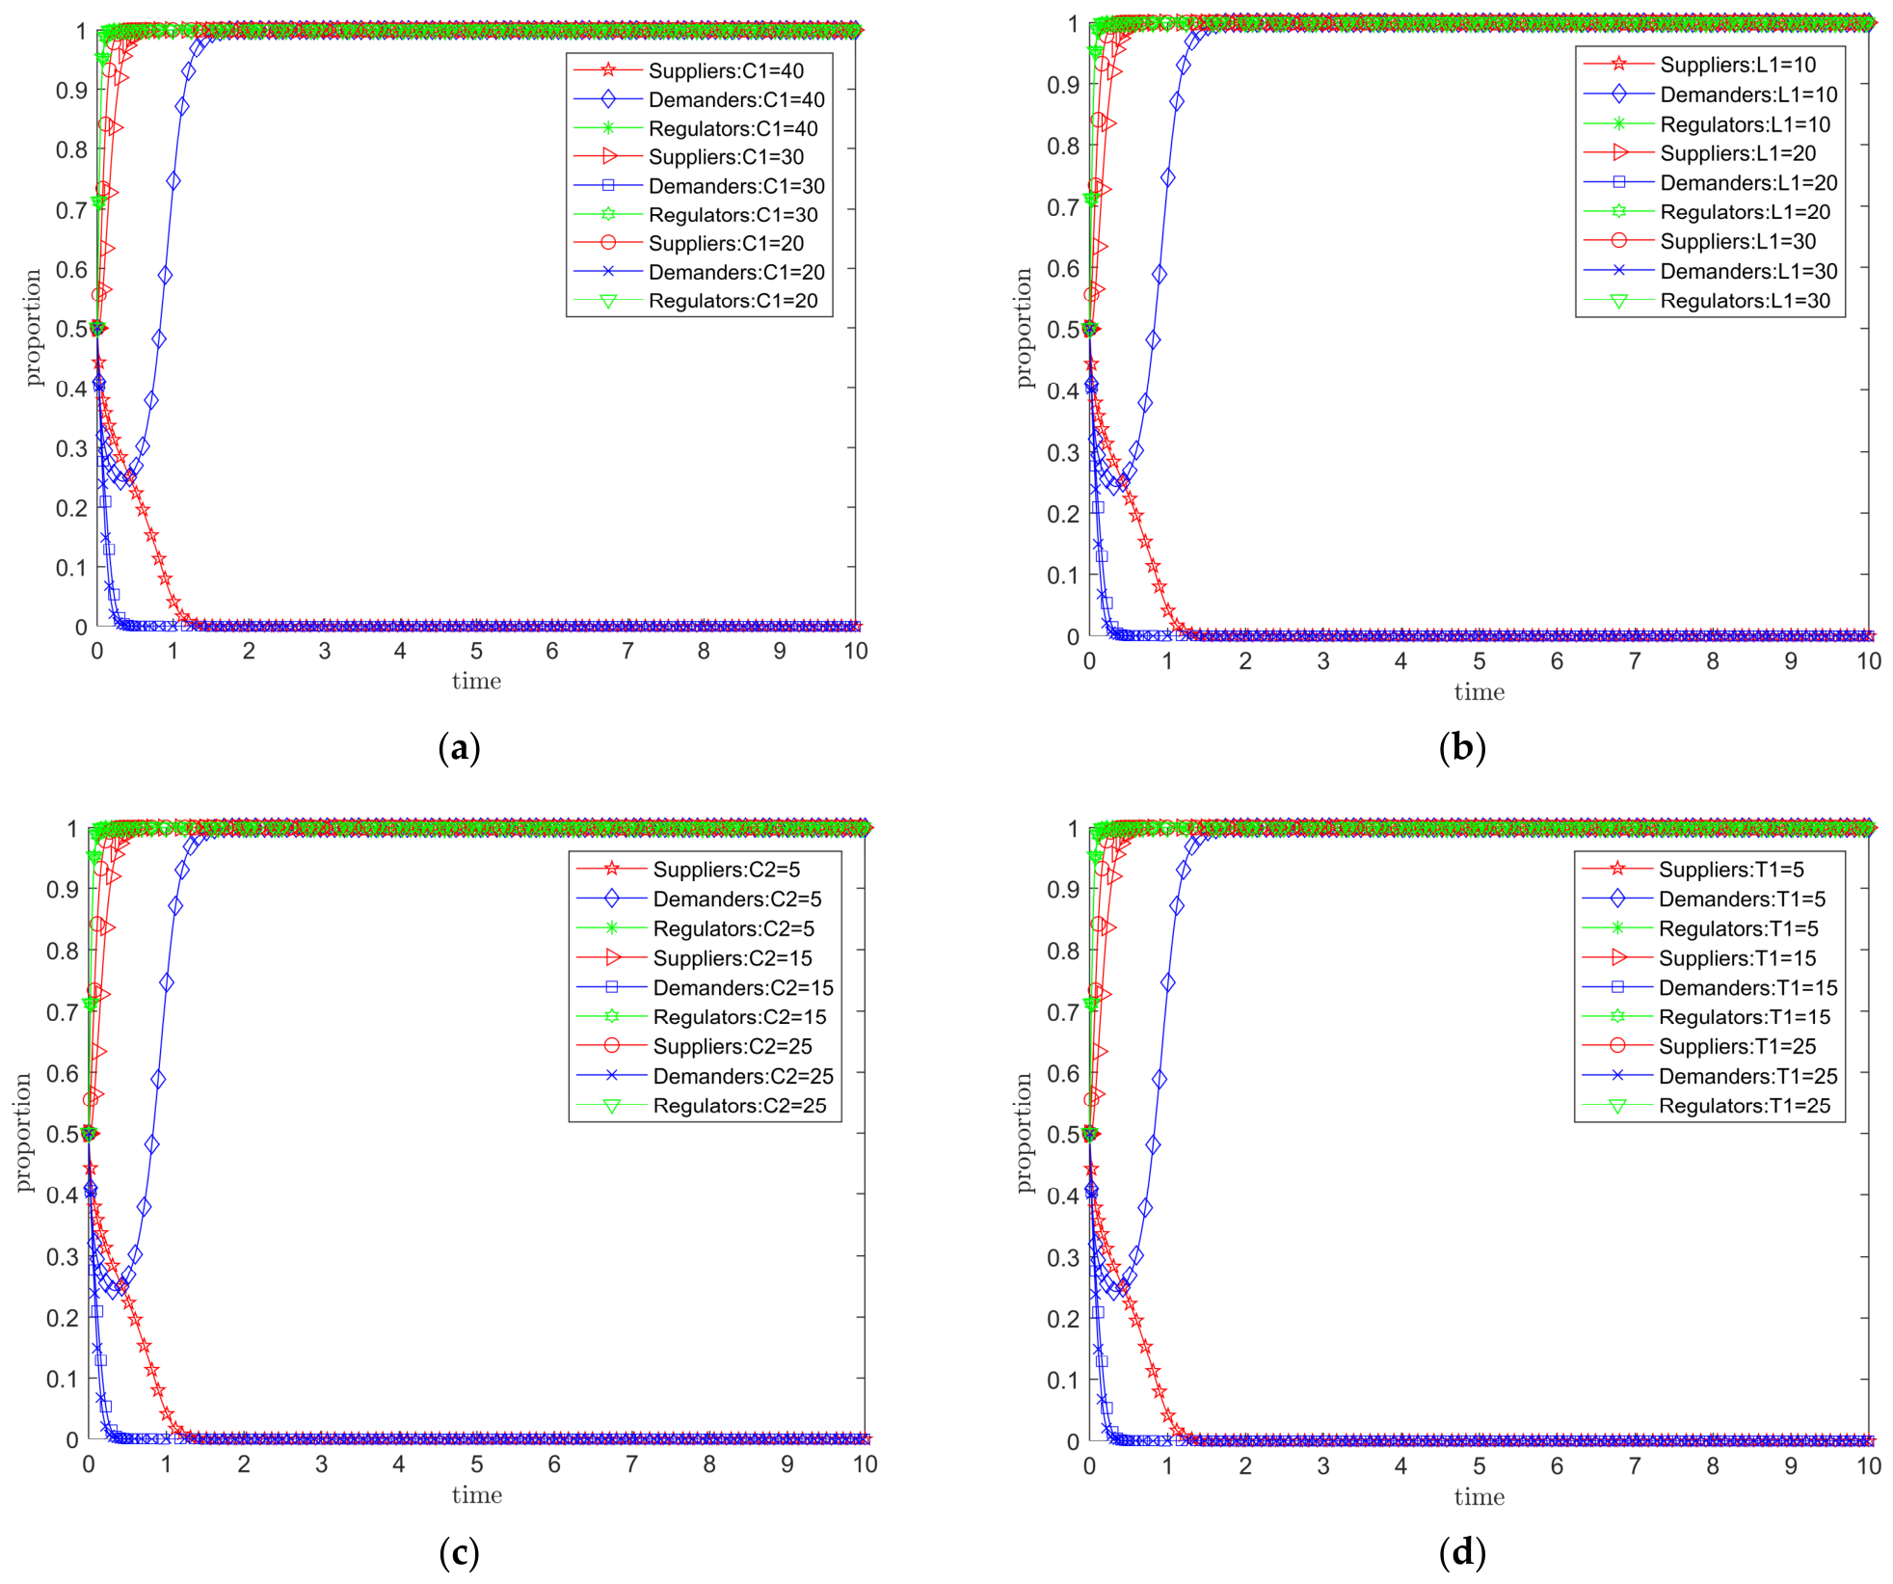
(1) Keeping T 3 = 80 unchanged, we vary only the value of C 1 , sequentially setting C 1 = 40, 30, and 20 while keeping other initial parameter values unchanged. The evolutionary results are shown in Figure 10a. Varying only the value of L 1 , we sequentially set L 1 = 10, 20, and 30 while keeping other initial parameter values unchanged. The evolutionary results are shown in Figure 10b. Varying only the value of C 2 , we sequentially set C 2 = 5, 15, and 25 while keeping other initial parameter values unchanged. The evolutionary results are shown in Figure 10c. Varying only the value of T 1 , we sequentially set T 1 = 5, 15, and 25 while keeping other initial parameter values unchanged. The evolutionary results are shown in Figure 10d. A decrease in C 1 , an increase in L 1 , an increase in C 2 , and an increase in T 1 all produce effects on the system similar to those of an increase in F 1 in Figure 6. These changes prompt the data suppliers to choose the high-quality supply strategy, and ultimately the system reaches an equilibrium state of (high-quality supply, non-compliant use, strong regulation).
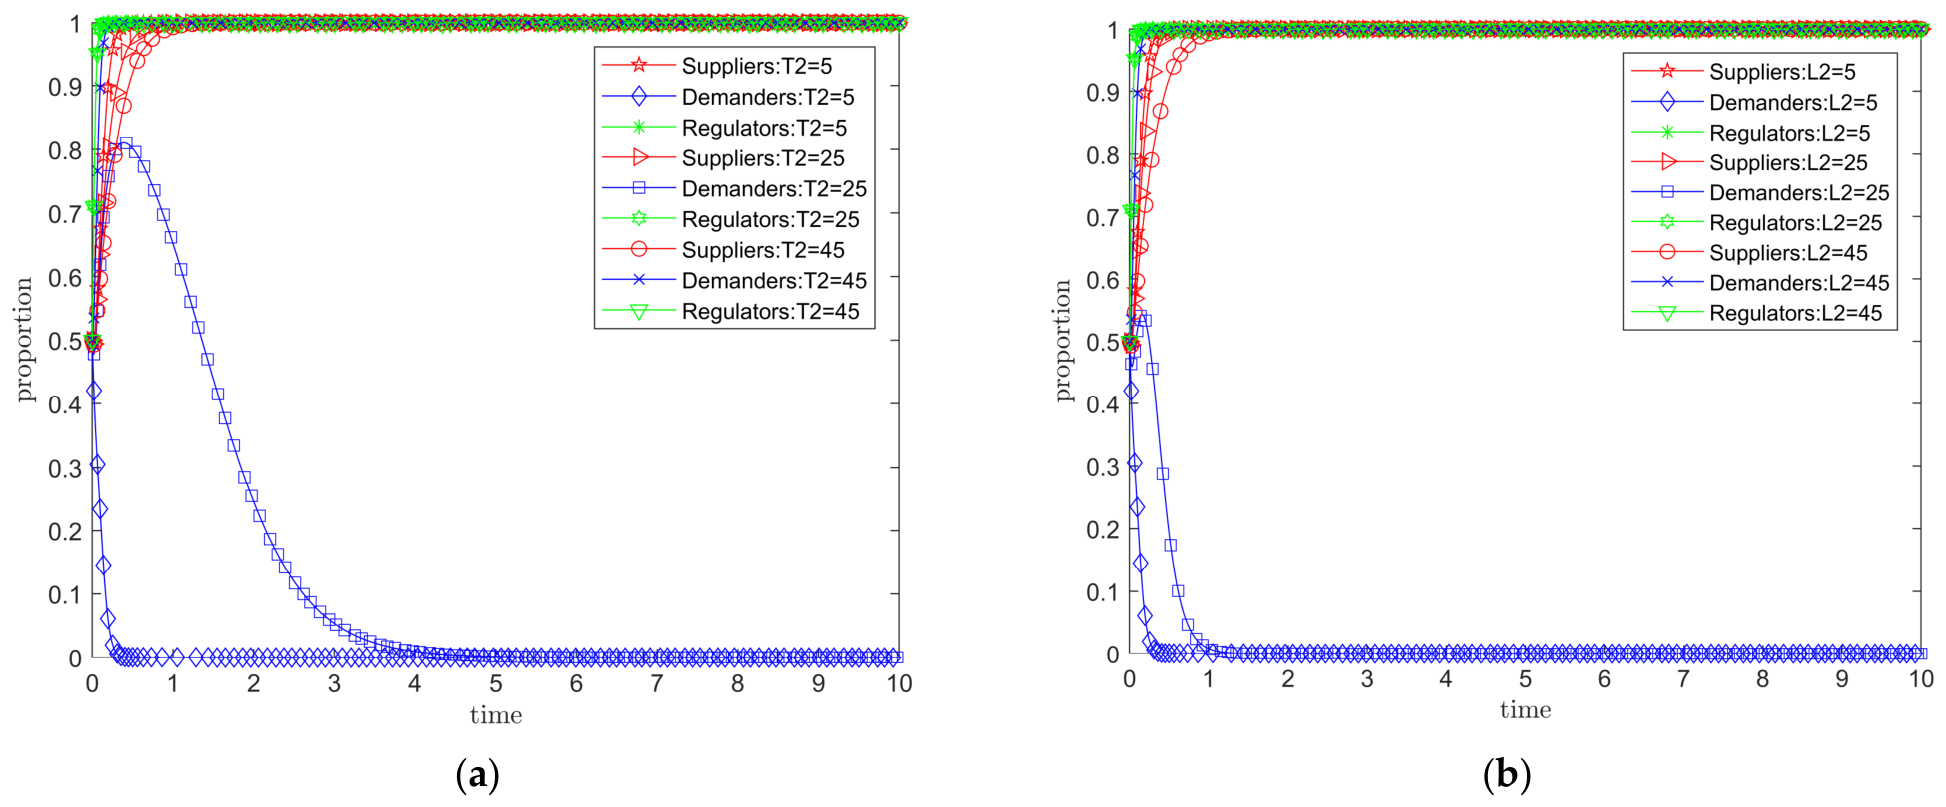
(2) Keeping T 3 = 80 and F 1 = 20 unchanged, we vary only the value of T 2 , sequentially setting T 2 = 5, 25, and 45 while keeping other initial parameter values unchanged. The evolutionary results are shown in Figure 11a. Varying only the value of L 2 , we sequentially set L 2 = 5, 25, and 45 while keeping other initial parameter values unchanged. The evolutionary results are shown in Figure 11b. An increase in T 2 and an increase in L 2 both produce effects on the system similar to those of an increase in F 2 in Figure 7. These changes prompt the data demanders to choose the compliant use strategy, and ultimately the system reaches an equilibrium state of (high-quality supply, compliant use, strong regulation).

3.3. Sensitivity Analysis of Other Parameters

The above analysis has elucidated the basic pathways of mutual trust between supply and demand sides. However, the sensitivity of some important parameters has not yet been addressed. In this section, we conduct joint sensitivity analyses on three key parameter pairs: ( E 11 , E 21 ), ( E 12 , E 22 ), and ( F 1 , F 2 ), with the aim of gaining a more comprehensive understanding of the effects of parameter interactions on the evolutionary outcomes of the system.

3.3.1. The Impact of Changes in E 11 and E 21 on Evolutionary Outcomes

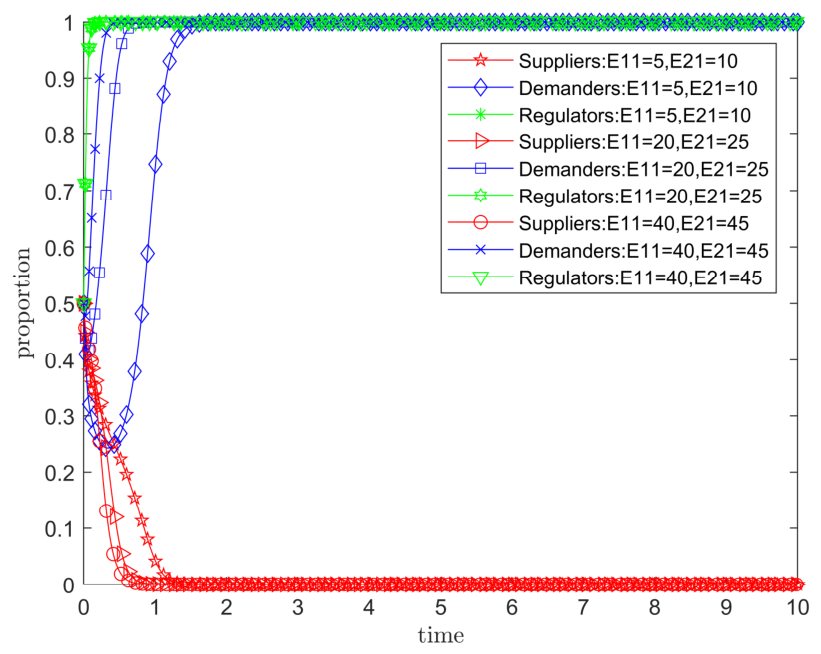
E 11 and E 21 are the base compensation amounts that the data suppliers and the data demanders, respectively, pay to the data subject in the event of data leakage, with E 11 < E 21 . Keeping T 3 = 80 unchanged, we sequentially set the pairs ( E 11 , E 21 ) = (5, 10), (20, 25), and (40, 45), while keeping other initial parameter values unchanged. The evolutionary results are shown in Figure 12. As E 11 and E 21 increase, the data suppliers tend to provide low-quality supply and adopts a negative attitude toward cooperation. This is also evident from the basic condition for entering Stage 1 decision-making ( P 1 C 1 + T 1 a ( E 11 + L s ) > 0), where an increase in E 11 is one of the main obstacles hindering the suppliers’ participation. The increase in E 11 and E 21 also affects the data demanders’ behavior, prompting the demanders to adopt the compliant use strategy more quickly. It can be seen that increasing E 11 and E 21 is conducive to regulating the behavior of data demanders, but it is detrimental to the supply enthusiasm of data suppliers.

3.3.2. The Impact of Changes in E 12 and E 22 on Evolutionary Outcomes

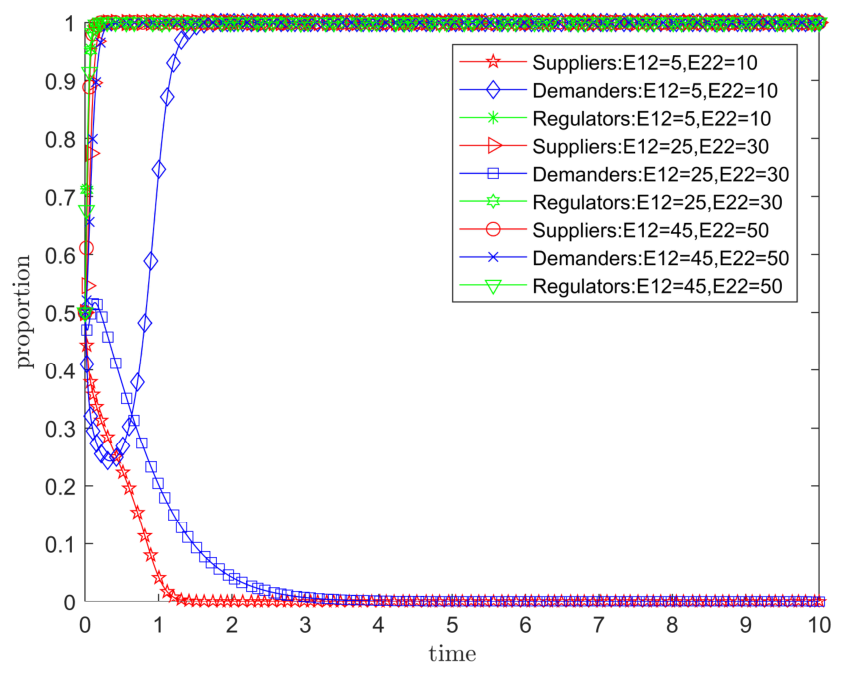
E 12 and E 22 are the liquidated damages that the data suppliers and the data demanders, respectively, pay to the other party in the event of default. Keeping T 3 = 80 unchanged, we sequentially set the pairs ( E 12 , E 22 ) = (5, 10), (25, 30), and (45, 50), while keeping other initial parameter values unchanged. The evolutionary results are shown in Figure 13. As E 12 and E 22 increase, the data suppliers tend to provide high-quality supply. However, the data demanders’ strategy choice exhibits volatility. For instance, when ( E 12 , E 22 ) = (25, 30), the demanders choose the “non-compliant use” strategy. This volatility can be explained by the replicator dynamics equation for the data demander, Equation (11): F(y) = y(1 − y)[zT2 + E21(ba) − xP31 − (1 − x)P32 + z(bE11 + F2 + L2 + E22)]. When E 12 and E 22 increase, the term z(bE11 + F2 + L2 + E22) increases, which directly strengthens the deterrent effect on non-compliant use. However, higher E 12 and E 22 also increase the compensation that suppliers receive when low-quality supply is detected, thereby incentivizing suppliers to provide high-quality data. When suppliers provide high-quality data, demanders can obtain greater additional benefits from non-compliant use, as reflected in the terms −xP31 and −(1 − x)P32. At moderate compensation levels, this indirect effect outweighs the direct deterrent effect, causing the demanders’ strategy to shift toward non-compliant use. At high compensation levels, as shown in the case of ( E 12 , E 22 ) = (45, 50), the direct deterrent effect eventually dominates, restoring the compliant equilibrium. This non-monotonic pattern arises from the interaction between the direct penalty effect and the indirect supplier-quality effect within the replicator dynamics equation.

3.3.3. The Impact of Changes in F 1 and F 2 on Evolutionary Outcomes

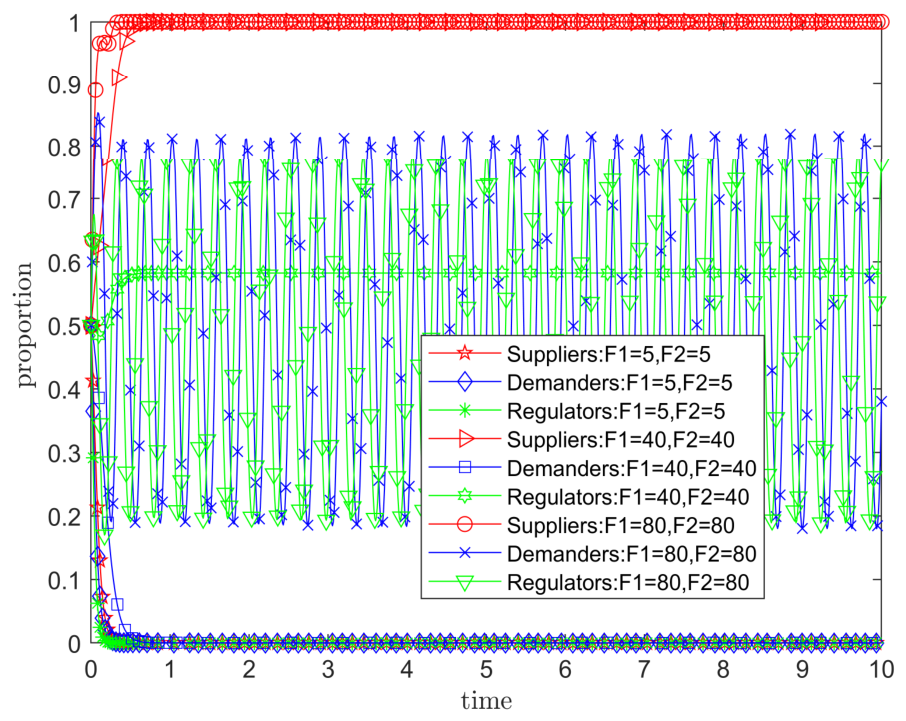
F 1 and F 2 are the penalties imposed on the data supplier for low-quality supply and on the data demander for non-compliant use, respectively. To investigate the joint effect of supply-side and demand-side penalties, we sequentially set the pairs ( F 1 , F 2 ) = (5, 5), (40, 40), and (80, 80), while keeping other initial parameter values unchanged. The evolutionary results are shown in Figure 14. As F 1 and F 2 increase proportionally, data suppliers rapidly choose the high-quality supply strategy. However, the strategy choice of data demanders is profoundly influenced by the regulatory intensity of the regulator. When ( F 1 , F 2 ) = (40, 40), the proportion of regulators choosing the “strong regulation” strategy increases slightly and stabilizes at approximately 0.57, but demanders still rapidly choose the “non-compliant use” strategy. When ( F 1 , F 2 ) = (80, 80), the strategic choices of regulators and demanders exhibit intensified fluctuations, indicating increasing strategic adaptation by demanders in response to regulatory intensity. These results reveal that increasing the regulator’s overall penalties on market participants promotes trust and cooperation on the supply side, but simultaneously intensifies opportunistic behavior on the demand side. In other words, suppliers prefer a market environment with strong enforcement against misconduct, whereas demanders oppose such stringent penalties.
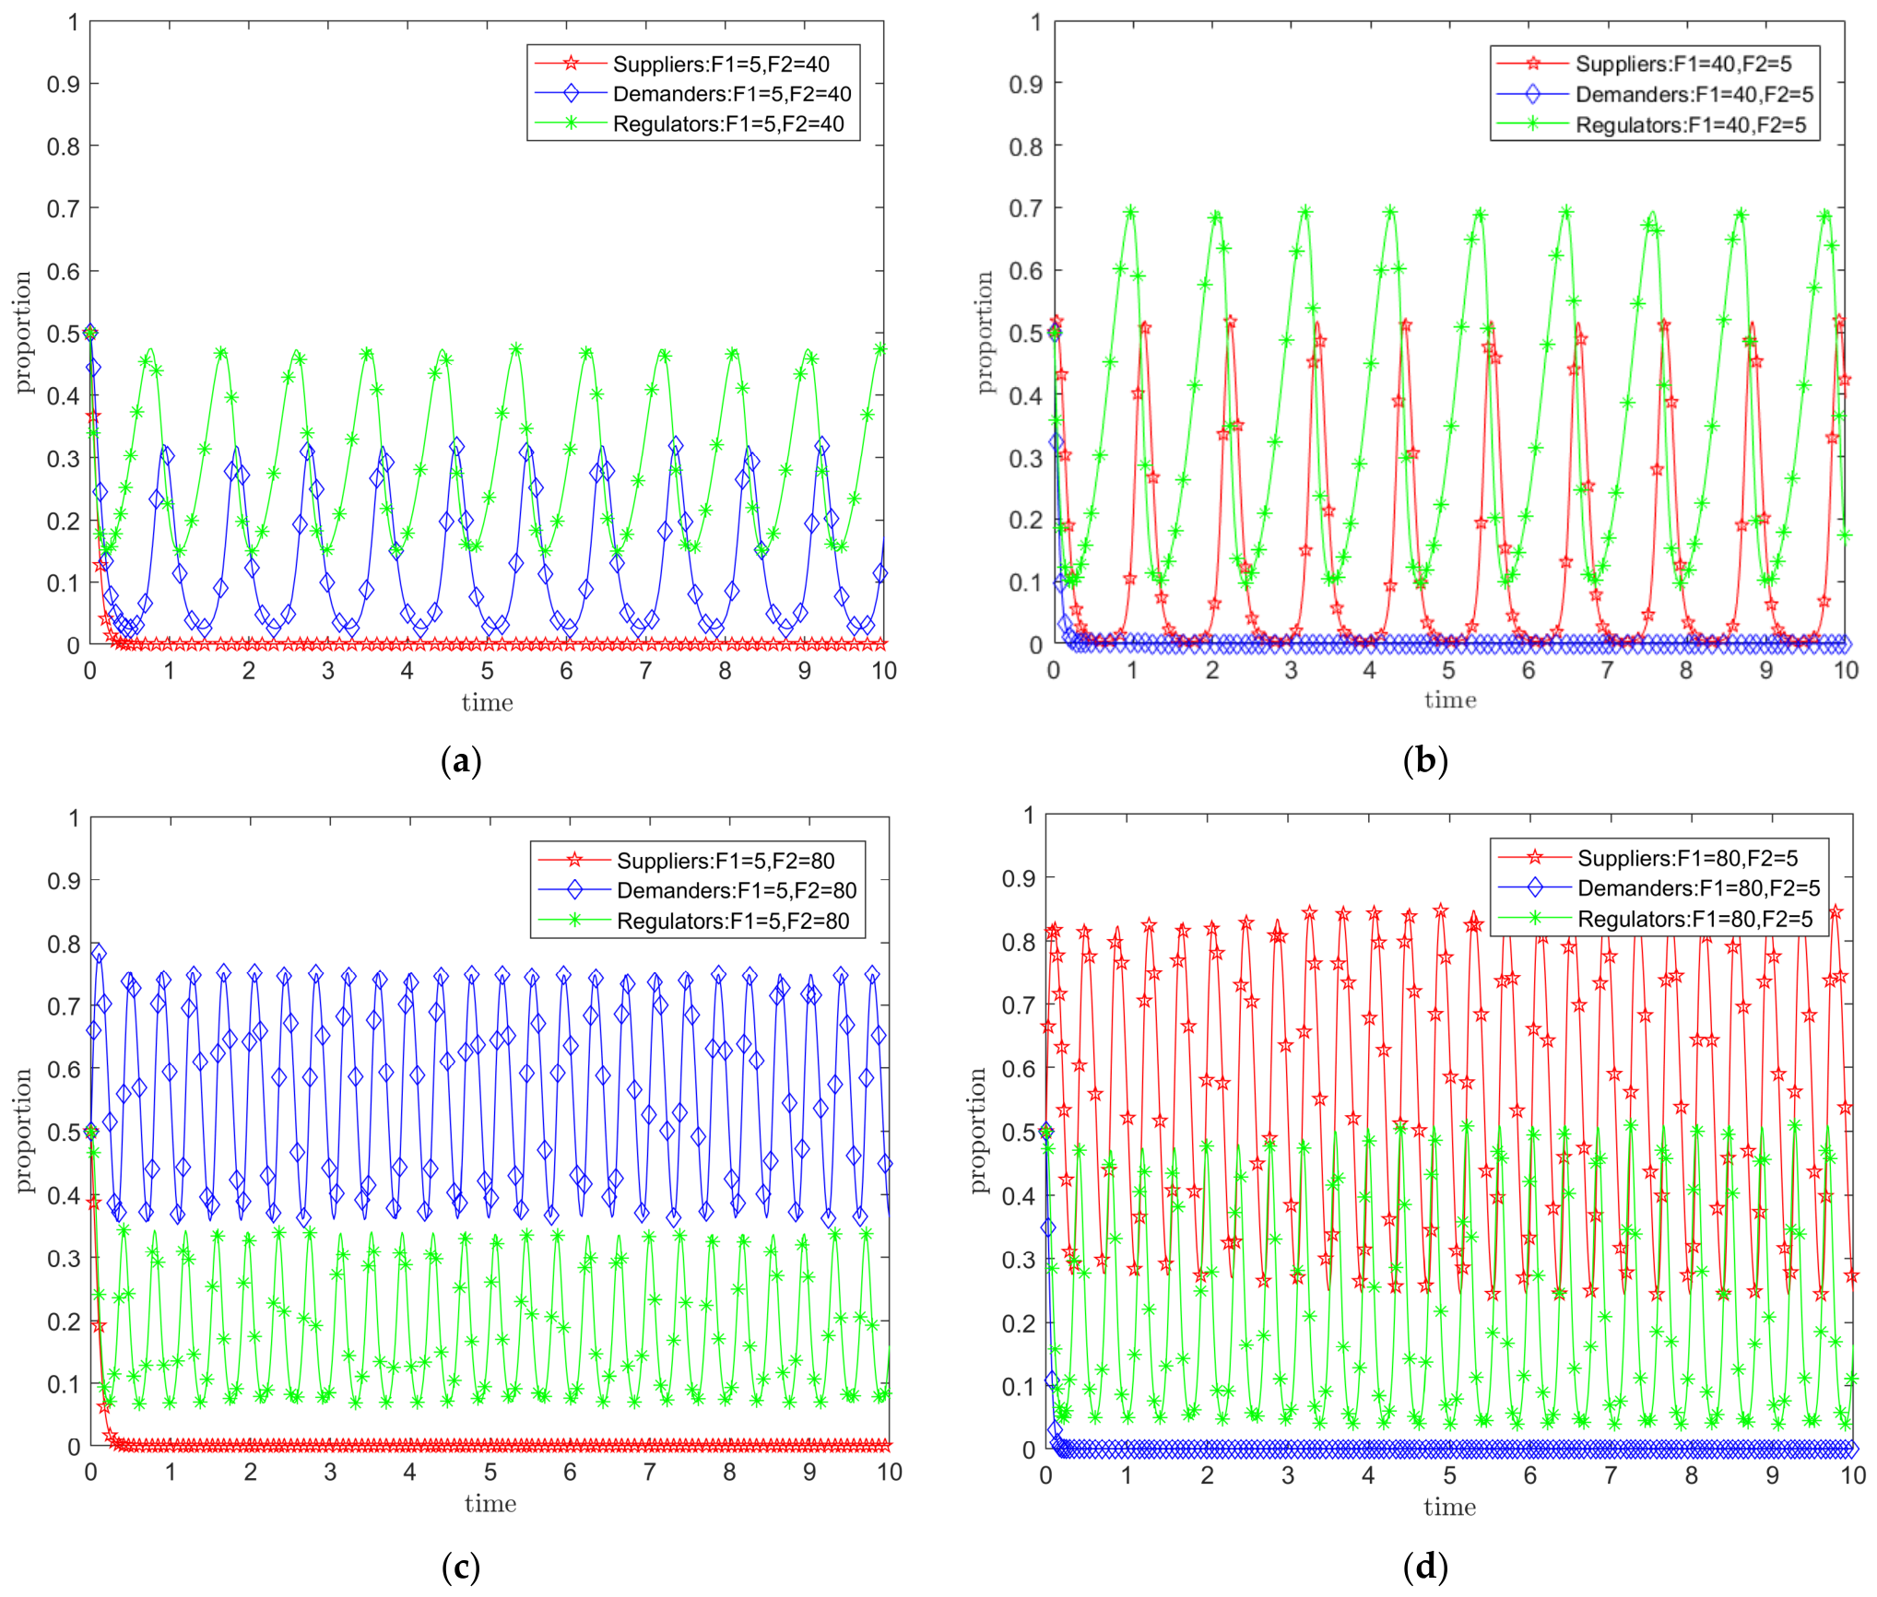
Furthermore, we tested ( F 1 , F 2 ) = (5, 40), (40, 5), (5, 80), and (80, 5), while keeping other parameters at their initial values. The results in Figure 15 show that insufficient penalties on either the supply side or the demand side will lead that party to adopt non-compliant strategies, which in turn destabilizes the strategic choices of the other two parties and generates oscillations across the system. This finding underscores the necessity of maintaining a certain minimum level of penalties on non-compliant behavior for both suppliers and demanders.

3.4. Summary of Sensitivity Analysis Results

For a concise overview of the key sensitivity analysis results, including parameter changes and resulting equilibrium states, see Table 7.

4. Discussion

4.1. Discussion of Simulation Analysis Results

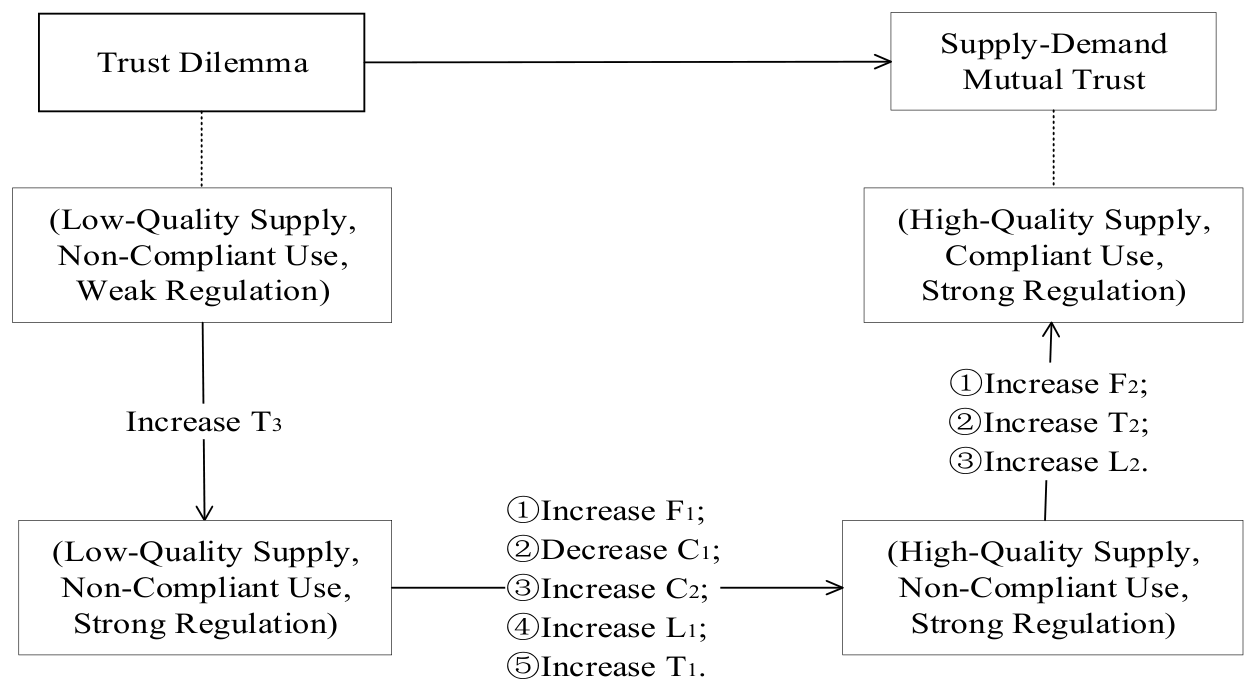
Section 3.2 presents the basic pathways for breaking the mutual trust dilemma between supply and demand sides, as illustrated in Figure 16. The first step is to increase the regulators’ trust benefit, which establishes strong regulation as the fundamental prerequisite. The second step involves measures such as increasing the penalty for low-quality supply by the supplier, reducing the cost of high-quality supply, increasing the cost of low-quality supply, and enhancing the suppliers’ trust-related gains and losses. These measures collectively prompt the suppliers to provide high-quality supply. The third step involves measures such as increasing the penalty for non-compliant use by the demander and enhancing the demanders’ trust-related gains and losses. These measures prompt the demanders to adopt compliant use.
From a symmetry perspective, the evolution from mutual distrust to mutual trust can be understood as a transition from a symmetric equilibrium of defection (low-quality supply + non-compliant use) to a symmetric equilibrium of cooperation (high-quality supply + compliant use), with strong regulation serving as the asymmetric intervention that disrupts the original dysfunctional symmetry and enables the emergence of a new, welfare-enhancing symmetric state. The essence of strong regulation is to promote compliant behavior on both the supply and demand sides. This aligns with scholars’ emphasis on transparency in data circulation [51,52]. Trusted data spaces are also designed to establish a multi-party behavior-controllable platform where the traces of data circulation can be tracked and responsibilities can be clearly defined [19,53]. However, strong regulation entails substantial regulatory costs. Whether through the construction of trusted data spaces or routine administrative regulatory approaches, robust regulation of data circulation and utilization consumes considerable human, material, and financial resources. How to reduce regulatory costs, improve regulatory models, and enhance regulatory efficiency thus remains an important topic worthy of further exploration.
More importantly, the above basic pathways reveal that the compliance costs for both data suppliers and demanders may increase due to the involvement of regulators. This is therefore detrimental to both parties’ willingness to make cooperative decisions in Stage 1. The basic condition for both parties to enter Stage 2 after making cooperative decisions in Stage 1 is that both can benefit by strictly performing their respective duties in accordance with the contract. Increasing their expected costs will undoubtedly hinder the achievement of cooperation in Stage 1. This indicates that strong regulation may impede data circulation and utilization. It also reflects the deep-seated contradiction and trade-off that governments face in promoting data circulation and utilization while ensuring the security and controllability of data circulation.
The results in Section 3.3 also reflect similar issues. The subjects of health data are patients and the general public. Increasing the compensation amounts for both suppliers and demanders in the event of data leakage can promote compliant behavior on both sides. However, it may also heighten the concerns and hesitations of both parties regarding cooperation in Stage 1. Increasing liquidated damages can promote compliant behavior on both sides. Nevertheless, determining whether a breach of contract has occurred often requires the involvement of a third party, which inevitably brings additional costs. All of these factors may pose obstacles to both parties’ cooperative decision-making in Stage 1.
With respect to specific regulatory strategies, Figure 9 demonstrates the offsetting effect of increasing F 2 against the increase in P 31 . This indicates that the penalty imposed on the data demanders should be commensurate with the additional benefits derived from their default uses, so as to play an effective role in regulating their behaviors. In Figure 13, when ( E 12 , E 22 ) = (25, 30), the data demanders choose the “non-compliant use” strategy. This also reflects the same issue. The underlying reason is that when the data suppliers provide high-quality supply, the additional benefits for the data demanders from non-compliant use increase accordingly.
Beyond these individual parameter effects, the simulation analysis reveals systematic non-trivial insights that extend beyond basic economic intuition. First, the two-stage structure of our model uncovers a fundamental tension that is absent from conventional single-stage game models: the conditions that promote compliance in Stage 2 (strong regulation, high penalties) may simultaneously undermine participation in Stage 1 by raising compliance costs. This trade-off implies that strengthening regulation is not monotonically beneficial, a finding that challenges the simplistic policy prescription that ‘more regulation is always better.’ Second, the symmetry perspective reveals that the transition from mutual distrust to mutual trust is not merely a matter of increasing penalties, but requires a coordinated shift across all three strategic dimensions, namely suppliers’ quality decisions, demanders’ usage decisions, and regulators’ enforcement intensity, which cannot be achieved through isolated interventions. Third, the simulation analysis reveals a systematic pattern of strategic interdependence among the three parties. When the regulator increases penalties on one side, the targeted party responds by increasing compliance, but this action simultaneously alters the strategic environment for the other side. For instance, raising F 1 promotes high-quality supply, yet the improved data quality increases the potential gains from non-compliant use, incentivizing demanders to adopt non-compliant strategies—an indirect effect that partially offsets the direct regulatory gain. Similarly, strengthening F 2 promotes compliant use, which in turn reduces suppliers’ risk exposure and reinforces supply-side compliance. These interdependent responses suggest that regulatory interventions targeting a single party may generate unintended spillover effects on other parties, and that effective governance requires a holistic perspective that coordinates regulatory measures across both supply and demand sides.
Beyond these simulation-based insights, it is also worth clarifying the methodological boundary of our approach in relation to the specific institutional context of China’s health data ecosystem. Given the large-scale and decentralized nature of this ecosystem, involving thousands of healthcare institutions with heterogeneous digital systems, a vast number of potential data demanders, and regulatory oversight distributed across 685 municipal-level administrative units, the ‘population’ in our evolutionary game model should be understood as the distribution of strategic tendencies across numerous decentralized actors, rather than a small group of centralized entities. This institutional architecture makes EGT a more appropriate modeling choice than small-number game frameworks such as Principal-Agent or signaling models, which are better suited to analyzing bilateral contract design between a single pair of well-specified parties. Our EGT approach addresses the ecosystem-level question of how regulatory mechanisms can drive the entire system from a low-trust to a high-trust equilibrium, while contract-theoretic approaches would address the complementary question of how individual contracts should be designed to mitigate information asymmetry. Both perspectives are valuable, and future research could fruitfully combine these approaches by embedding contract-theoretic mechanisms within an evolutionary framework.

4.2. Further Discussion

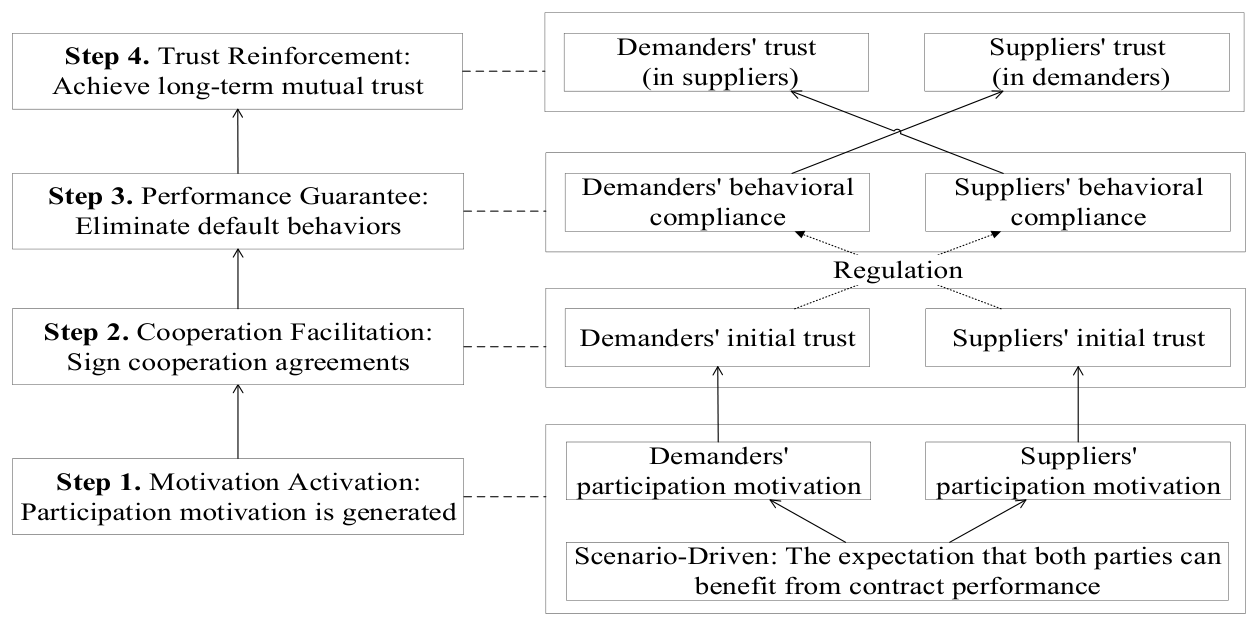
From a long-term cooperation perspective, this paper divides the decision-making of both suppliers and demanders into two stages and proposes a “vicious circle” dilemma of mutual trust between the two sides. It reveals that the root cause of the mutual trust dilemma in data circulation lies in the uncertainty that each party faces in Stage 1 regarding the other party’s subsequent decisions in Stage 2. This is consistent with the basic interpretation in trust theory, which defines trust as a specific behavioral intention resulting from a psychological state based on positive expectations [45,54]. Furthermore, this paper argues that the formation mechanism of mutual trust between suppliers and demanders in data circulation can be divided into four steps, as shown in Figure 17.
This mechanism takes scenario-driven factors as the starting point, regulatory guarantees as the supporting foundation, cost balance as the key element, and long-term compliance as the ultimate goal. It forms a closed-loop logic that leads from initial participation to sustained mutual trust. The specific connotations are as follows.
Step 1: Motivation Activation, namely scenario-driven and interest alignment, constitutes the logical starting point for building mutual trust. The formation of mutual trust is premised on the endogenous motivation of both suppliers and demanders to participate in data circulation and transactions. The core driving force of this motivation stems from clearly defined value scenarios and tangible satisfaction of interests. The fundamental prerequisite for health data transactions and circulation lies in the support of specific application scenarios, within which both suppliers and demanders achieve their respective goals by unlocking the value of data. Profit-oriented entities primarily pursue economic benefits, while public-sector entities focus on the realization of public or national interests. The alignment of these interest appeals serves as the initial impetus for stimulating their willingness to cooperate. In the absence of effective scenario support or in the event of interest misalignment, both suppliers and demanders may refuse to participate due to a lack of profitability or excessively high risks. In such cases, the establishment of mutual trust becomes impossible.
Step 2: Cooperation Facilitation, of which the key lies in the effectiveness of regulatory constraints and the controllability of compliance costs. After the formation of cooperation intentions, the actual realization of cooperation depends on strong regulatory guarantees and reasonable control over participation costs. Given the high sensitivity of health data, both suppliers and demanders naturally adopt a certain defensive posture. In the absence of regulation, suppliers may choose to provide low-quality data due to concerns over privacy leakage risks, while demanders may adopt non-compliant use strategies because of low default costs. This ultimately leads cooperation to an equilibrium state of low trust. Conversely, strong regulation can regulate both parties’ behavioral expectations by establishing a breach detection and punishment mechanism, and by aligning penalty levels with the benefits derived from default. At the same time, care must be taken to avoid excessively increasing participation costs in the pursuit of compliance. Otherwise, both suppliers’ and demanders’ willingness to cooperate at the decision-making stage will be weakened, thereby hindering the ultimate realization of cooperation.
Step 3: Performance Guarantee, with its core lying in regulating both parties’ behaviors and achieving risk sharing. This is the key link to ensuring the smooth realization of performance. After cooperation is established, the standardization of the performance process is a direct pathway to accumulating mutual trust. This needs to be achieved through the establishment of effective default constraints and reasonable cost-sharing mechanisms. On the one hand, a constraint system should be constructed in which the cost of default significantly exceeds the benefits derived from default, such as by increasing default penalties and clarifying trust-related gains and losses, thereby compelling both suppliers and demanders to choose compliant behavior. On the other hand, it is necessary to break free from the fixed mindset that promoting compliance inevitably increases costs. Active efforts should be made to reduce the overall cost of compliant participation through technological empowerment and process optimization, so as to avoid a decline in performance willingness caused by excessive compliance burdens. Only when both suppliers and demanders can achieve compliant performance at affordable costs can the mutual trust dilemma, characterized by the mutual reinforcement of low-quality supply and non-compliant use, be overcome.
Step 4: Trust Reinforcement, manifested as the continuation of long-term compliant behavior and the consolidation of trust relationships. This marks the ultimate formation of the mutual trust mechanism. Sustained compliant performance generates stable behavioral expectations and drives the evolution of the relationship between the two parties from transaction-based trust to long-term stable mutual trust. When both suppliers and demanders strictly fulfill their contractual obligations across multiple interactions, with suppliers consistently providing high-quality data, demanders consistently adhering to compliant use, and regulators promptly penalizing default behaviors while effectively protecting the rights of compliant parties, trust will gradually become consolidated. Suppliers will develop confidence in demanders’ commitment to compliance, and demanders will come to recognize and rely on the quality of suppliers’ data. Ultimately, this builds a trusted circulation ecosystem characterized by traceable data, constrainable behaviors, and preventable risks. At this point, mutual trust no longer depends on the outcomes of single-transaction games, but evolves into an endogenous attribute of the entire data circulation and transaction ecosystem.
In summary, scenario-driven profit motives trigger cooperation intentions. Regulatory constraints and cost control ensure the realization of cooperation. Standardized performance and risk sharing achieve behavioral compliance. Long-term compliant behavior ultimately accumulates into stable mutual trust. The four-step mechanism of “motivation activation → cooperation facilitation → performance guarantee → trust reinforcement” forms a progressive closed loop. This provides a theoretical framework for building mutual trust between suppliers and demanders in the context of health data transaction and circulation.

4.3. Limitations

Although this study has provided an in-depth analysis of the causes and resolution pathways of the mutual trust dilemma between suppliers and demanders in health data circulation by constructing a two-stage decision-making model and a tripartite evolutionary game model, several limitations remain. These limitations also offer valuable directions for future research.
First, this study focuses on the tripartite interactions among data suppliers, demanders, and regulators, while omitting several important stakeholders. The complete ecosystem of health data circulation also involves data subjects (patients and the general public), whose authorization willingness, privacy concerns, and benefit-sharing expectations profoundly influence the decision-making environment. In addition, the regulatory system is treated as a single homogeneous agent, whereas in reality it comprises multiple forces, including government agencies, platforms, industry associations, ethics committees, insurers, and certification bodies. These entities each have different objectives and regulatory efficiencies. Furthermore, while AI (Artificial Intelligence) systems are increasingly deployed in health data ecosystems, our model does not treat AI as an independent strategic agent, as the core of the mutual trust dilemma lies in the strategic interactions among human decision-makers who bear legal and ethical responsibility. Finally, the Stage 1 participation decision is treated as an exogenous precondition rather than being endogenously modeled as a strategic choice, which reflects our primary focus on the long-term institutional evolution of compliance behavior in Stage 2. Future research could incorporate data subjects into a four-party evolutionary game model, construct multi-tiered heterogeneous regulatory game models, or incorporate AI as a factor influencing the information environment. Another promising direction is to employ a sequential game framework with continuation payoffs to endogenize both participation and compliance decisions.
Second, our model operationalizes trust primarily through fixed economic payoff parameters ( T 1 , T 2 , T 3 , L 1 , L 2 , L 3 ), which captures the utility consequences of trust rather than its full multidimensional nature (cognitive, affective, and institutional dimensions) or its dynamic accumulation through repeated interactions. This simplification also extends to the assumption that suppliers and demanders exchange fixed values of benefits, without accounting for the possibility that trust may affect value co-creation beyond mere compliance. In reality, trust can enhance collaboration, foster information sharing, and generate additional value through iterative interactions. While these simplifications are consistent with standard practice in evolutionary game theory, where complex behavioral constructs must be reduced to quantifiable payoffs to enable formal analysis, future research could incorporate multidimensional trust measures, endogenize benefit parameters, or model trust as a dynamic state variable that evolves through reinforcement learning or Bayesian updating based on the history of interactions.
Third, the key parameters in the model, such as costs, benefits, and penalties, are grounded in theoretical derivation and practical plausibility rather than empirical calibration. This reflects the current state of health data circulation in China, which remains at an early stage of development with limited publicly available transaction data. In addition, these parameters are assumed to remain constant throughout the evolutionary process, whereas in reality they may evolve with changes in technology, market conditions, and policy environments. Furthermore, the sensitivity analysis adopts a one-variable-at-a-time approach, which isolates the marginal effect of each parameter but does not fully capture joint parameter interactions or distributional uncertainty. While we have conducted joint sensitivity analyses for selected parameter pairs and extensive single-parameter sensitivity analyses to verify the qualitative robustness of our findings, we acknowledge that empirical calibration and more comprehensive multi-parameter sensitivity analysis would significantly strengthen the practical relevance of the model. Future research could employ Monte Carlo simulations, Bayesian uncertainty analysis, or global sensitivity analysis as health data circulation markets mature and more data become available.
Fourth, our model assumes a simplified learning mechanism (replicator dynamics) rather than modeling fully forward-looking strategic planning by each institution. This simplification is inherent to the EGT framework and is appropriate for analyzing how behavioral norms evolve at the aggregate level under changing institutional incentives. In the Chinese context, where health data policies are rapidly evolving and institutions face considerable uncertainty about future regulatory requirements, the adaptive logic of replicator dynamics may better capture actual decision-making processes in practice than fully rational optimization. Furthermore, the mathematical treatment of the dynamical system remains at a relatively basic level. Specifically, we have not conducted formal bifurcation analyses to characterize the system’s transcritical bifurcations, nor have we presented comprehensive phase portraits with vector fields or delineated basins of attraction. These omissions reflect the applied, policy-oriented nature of this study, which prioritizes the identification of actionable regulatory mechanisms over a complete mathematical taxonomy of the system’s dynamics. Future research could incorporate more sophisticated behavioral assumptions, embed contract-theoretic mechanisms within an evolutionary framework, or conduct comprehensive bifurcation analysis to precisely determine the critical boundaries at which the system undergoes phase transitions.
Fifth, while we have addressed the primary limitations above, we acknowledge that our findings are derived from a simplified model of the health data circulation ecosystem. The generalizability of our conclusions to other institutional contexts, particularly those with different regulatory traditions, market structures, or data governance frameworks, would require further validation through comparative case studies or empirical applications. Future research could extend our framework to other national or regional contexts, or employ empirical data to calibrate and validate the model as health data circulation markets mature.

5. Conclusions and Recommendations

5.1. Summary and Conclusions

This paper starts from the perspective of decision-making interaction between health data suppliers and demanders, analyzes the deep-seated causes of the mutual trust dilemma, and establishes a “vicious circle” model to explain how bilateral uncertainty hinders data circulation. By employing an evolutionary game model involving suppliers, demanders, and regulators, this paper explores strategic approaches to breaking the dilemma. Compared with existing single-stage evolutionary game studies, our two-stage framework reveals a critical insight: the conditions for initiating cooperation (Stage 1) and the conditions for sustaining compliance (Stage 2) are not identical and may even be in tension. This tension, which cannot be captured by single-stage models, constitutes the core theoretical contribution of this study. The following are the key conclusions:
  • No scenario, no circulation. Data utilization scenarios are the fundamental prerequisite for data circulation. The ability of both suppliers and demanders to benefit from these scenarios constitutes their fundamental motivation for participation. The primary scenarios for health data circulation and utilization include medical treatment, scientific research, and public health management. For profit-oriented organizations, the basic starting point for participation is typically economic gain, whereas for public-sector entities, it is generally public interest or even national interest. Respecting the diverse interest appeals of multiple stakeholders and creating corresponding data circulation scenarios is the fundamental precondition for a thriving data circulation ecosystem.
  • No regulation, no trust. Due to the complex characteristics of health data, if regulators adopt weak regulation strategies, suppliers will choose low-quality supply due to technical barriers and privacy leakage risks, while demanders will choose non-compliant use when faced with high-profit temptations and low penalty risks. Under such circumstances, a trusted data circulation ecosystem cannot be established. Therefore, even with the support of technologies such as blockchain and privacy computing, strong regulation remains indispensable. Quick detection and enforcement mechanisms for defaults should be established, and specific regulatory measures, such as the setting of penalty amounts, should be aligned with the default benefits obtained by behavioral agents. However, this strong regulation should not be viewed as an unconditional remedy. As our analysis reveals, stringent regulatory measures may also raise participation costs and reduce the willingness of both suppliers and demanders to engage in data circulation, thereby creating a tension between promoting compliance and maintaining market vitality. This trade-off must be carefully considered in regulatory design, as excessively strict enforcement could paradoxically undermine the very cooperation it seeks to promote. This leads to our third conclusion regarding the balance between compliance promotion and cost control.
  • Compliance and cost control, two sides of the same coin. While increasing default penalties, enhancing trust-related gains and losses, reducing compliance costs, and raising default costs can all regulate the behavior of both parties and promote mutual trust, these measures may also increase participation costs and reduce willingness to cooperate in Stage 1. Therefore, an effective balance must be achieved between “promoting compliance” and “controlling costs.” The participation costs of both parties should not be increased excessively in the pursuit of compliance, as this may reduce their motivation to participate and undermine the vitality of the data circulation ecosystem.

5.2. Policy Recommendations

5.2.1. Actively Explore and Create High-Benefit Health Data Circulation and Utilization Scenarios

Data utilization scenarios are the fundamental driving force for activating the circulation market and attracting participation from both suppliers and demanders. It is recommended that government authorities take the lead, in collaboration with medical institutions, research institutes, and high-tech enterprises, to jointly identify and cultivate benchmark application scenarios with significant social and economic benefits. Pilot demonstrations should be conducted in key areas such as clinical assisted diagnosis, new drug research and development, intelligent epidemic warning, and public health policy simulation. Through successful scenario practices, positive signals can be sent to the market, enabling both suppliers and demanders to clearly foresee the long-term benefits of compliant circulation. This will enhance their willingness to cooperate in Stage 1 decision-making and fundamentally break the initial deadlock of the mutual trust “vicious circle.”

5.2.2. Promote the Construction of Trusted Health Data Spaces and Establish a Comprehensive and Intelligent Regulatory System

Strong regulation is a necessary condition to ensure that both suppliers and demanders adopt compliant behaviors in Stage 2 decision-making. It is recommended to accelerate the construction of national-level infrastructure for trusted health data spaces and to mandatorily deploy key technologies such as blockchain and privacy computing. This will enable full-chain traceability, behavioral auditability, and clear liability attribution throughout the data circulation process. Meanwhile, the regulatory model should shift from passive response to active early warning. Big data analytics and other means should be utilized to intelligently identify potential default risks and to establish rapid detection and enforcement mechanisms. The aim is to achieve robust regulatory effectiveness at sustainable regulatory costs through technological empowerment, thereby providing a solid underlying guarantee for mutual trust and cooperation.

5.2.3. Establish Clear Compliance Standards and Incentive-Compatible Mechanisms to Systematically Reduce Compliance Costs for Multiple Stakeholders

The findings reveal that if regulation merely increases penalties and drives up compliance costs, it will paradoxically suppress the willingness to cooperate in Stage 1. Therefore, policy design must balance “promoting compliance” with “controlling costs.” First, authorities such as the National Health Commission and the Cyberspace Administration of China should collaboratively develop clear and unified standards for data quality and compliant use, so as to reduce the additional compliance burden caused by ambiguous rules. Second, incentive-compatible reward and punishment mechanisms should be designed. For example, institutions with a long-term record of compliance could be granted positive incentives such as trust credits, priority authorization, and tax preferences, allowing their good behavior to earn a market premium. By simultaneously reducing compliance costs and increasing default costs, both suppliers and demanders can be guided from a state of “daring not to default” to one of “unwilling to default,” ultimately fostering a healthy and sustainable new ecosystem for data circulation.

5.2.4. Strengthen the Quality of Data at the Source and Implement Standardized Collection and Cost Constraint Mechanisms

To ensure the initial quality and compliance of circulating data assets, it is recommended that the National Health Commission, in conjunction with standards authorities, take the lead in formulating and mandating unified health data resource catalogs and core metadata standards. This initiative aims to standardize data collection at the source, thereby significantly increasing the implicit costs for data suppliers, particularly medical institutions, of engaging in “low-quality supply.” The costs of data cleansing, governance, and subsequent compliance rectification incurred by non-compliance with these standards should be made substantially higher than the investment required for standardized collection at the outset. By front-loading and making compliance costs more explicit, suppliers can be guided by economic rationality to proactively improve data quality, thereby reducing the incentive for low-quality supply at the source and laying a solid foundation for subsequent trusted data circulation.

5.2.5. Align with International Regulatory Frameworks and Trust Infrastructure Development

While the policy recommendations above are primarily contextualized within China’s health data governance system, their underlying principles resonate with major international regulatory frameworks. For instance, the emphasis on data quality standards and compliant use aligns with the accountability and transparency requirements of the European Union (EU) GDPR (General Data Protection Regulation) and the US HIPAA (Health Insurance Portability and Accountability Act). The recommendation to establish strong regulatory mechanisms with clear penalty structures is consistent with the risk-based approach advocated by the OECD (Organisation for Economic Co-operation and Development) AI Principles. Moreover, the growing international practice of developing trust frameworks and trust scores, such as the EU’s Trusted Data Spaces initiative and various industry-led data trust certification schemes, offers valuable references for operationalizing the trust parameters in our model into measurable indicators. Future research and policy practice could draw on these international experiences to further refine the trust metrics and regulatory benchmarks proposed in this study, while adapting them to local institutional contexts.

Supplementary Materials

The following supporting information can be downloaded at: https://www.mdpi.com/article/10.3390/sym18091567/s1, Supplementary Material S1: MATLAB source code for all numerical simulations presented in Section 3 (Software: MATLAB 2017b version).

Author Contributions

Conceptualization, S.X. and D.W.; methodology, S.X. and D.W.; project administration, D.W.; writing—original draft preparation, S.X.; writing—review and editing, S.X. and D.W. All authors have read and agreed to the published version of the manuscript.

Funding

This research was funded by the Research Center for Digital Economy and Industrial Cluster Upgrading, Shandong Huayu University of Technology, grant number PT2025RWT001, and the National Social Science Foundation of China, grant number 23BTQ068.

Data Availability Statement

The data presented in this study are included in the article. The MATLAB source code used for all numerical simulations is provided as Supplementary Material S1.

Conflicts of Interest

The authors declare no conflicts of interest.

References

  1. Yang, Q.; Wang, C. The Fourth Revolution. UNESCO Courier 2018. Available online: https://courier.unesco.org/en/articles/fourth-revolution (accessed on 19 July 2026).
  2. National Information Technology Standardization Technical Committee Big Data Standards Working Group. White Paper on Data Element Circulation Standardization (2022). Available online: https://www.logclub.com/front/lc_report/get_report_info/1640 (accessed on 19 July 2026).
  3. Shubladze, S. How to Make Use of the New Gold: Data. Forbes, 27 March 2023.
  4. Richards, N.M.; King, J.H. Big Data Ethics. Wake For. Law Rev. 2014, 49, 393–394. [Google Scholar]
  5. Data Is the New Oxygen: Unveiling the Vitality of Information. Available online: https://vinodsblog.com/2020/12/22/data-is-the-new-oxygen-unveiling-the-vitality-of-information/ (accessed on 19 July 2026).
  6. O’Reilly, T. Data Is the New Sand. Available online: https://www.theinformation.com/articles/data-is-the-new-sand?utm_source=ti_app (accessed on 19 July 2026).
  7. The Economist. The World’s Most Valuable Resource Is No Longer Oil, But Data. Available online: https://www.mvnconsultinginc.com/images/document.pdf (accessed on 19 July 2026).
  8. National Health Commission of the People’s Republic of China. Transcript of the Press Conference of the National Health Commission on September 2, 2022. Available online: https://www.nhc.gov.cn/xcs/c100122/202209/1cd723a3fdbb484fb52991ab8c0719ad.shtml (accessed on 19 July 2026).
  9. Xiong, Z.Q.; Zhang, Z.Q.; Zheng, Y.H. Analysis and Protection Strategy of Medical Data Security. China Digit. Med. 2018, 13, 80–81. [Google Scholar]
  10. Shilo, S.; Rossman, H.; Segal, E. Axes of a Revolution: Challenges and Promises of Big Data in Healthcare. Nat. Med. 2020, 26, 29–38. [Google Scholar] [CrossRef] [Scilit] [PubMed]
  11. Hu, Y.L.; Yu, D.L.; Wang, J. Development of Health and Medical Big Data in the Context of ‘Health China’. Soc. Sci. 2022, 299, 79–87. [Google Scholar]
  12. Wu, Y.Q.; Hu, Y.H.; Chen, D.F. Application of Health Big Data in Precision Health Risk Assessment. Chin. J. Prev. Control Chronic Dis. 2020, 28, 226–229. [Google Scholar]
  13. Gao, F.P. Data Circulation Theory: The Basis for the Allocation of Data Resource Rights. Peking Univ. Law J. 2019, 31, 1405–1424. [Google Scholar]
  14. Yang, Q. Data Right Incentives for Data Circulation and Utilization in the Era of Digital Economy. Political Sci. Law 2021, 12, 12–25. [Google Scholar]
  15. Yang, Z.H. Crossing the Barriers of Enterprise Data Property Rights: Data Access Rights. J. Jiangxi Univ. Finance Econ. 2023, 5, 137–148. [Google Scholar]
  16. Hu, F. Flowing Abundance: Theoretical Reflection and Practical Observation on Trusted Data Space Construction. Doc. Inf. Knowl. 2025, 42, 6–18+65. [Google Scholar]
  17. Liu, X.L.; Wang, T.M. A Review on the Property Rights and Regulations in the Data-Factor Market. J. Renmin Univ. China 2022, 36, 92–105. [Google Scholar]
  18. Bao, X.L.; Du, W.L. Institutional Construction of Trusted Data Transaction Systems: From the Perspective of On-Exchange Trading. E-Gov. 2023, 6, 38–50. [Google Scholar]
  19. Bao, X.L. Trusted Data Space: A Co-governance Framework of Technology and Legal Rules. Zhejiang Acad. J. 2024, 1, 89–100+239–240. [Google Scholar]
  20. O’Hara, K. Data Trusts: Ethics, Architecture and Governance for Trustworthy Data Stewardship. Available online: https://www.southampton.ac.uk/assets/imported/transforms/content-block/UsefulDownloads_Download/0326D18DCC9E4BD08816BB5F994FCA76/White%20Papers%20No1.pdf (accessed on 19 July 2026).
  21. Yang, Y.; Lin, L. High-Quality Supply of Data Elements: Connotation Analysis, Dilemmas, and Regulatory Design. E-Gov. 2024, 11, 15–26. [Google Scholar]
  22. Gong, Q.; Ban, M.Y.; Liu, C. The Data Trading Dilemma: The Perspective of Incomplete Contract. Econ. Res. J. 2022, 57, 172–188. [Google Scholar]
  23. Murray, K.B. A Test of Services Marketing Theory: Consumer Information Acquisition Activities. J. Mark. 1991, 55, 10–25. [Google Scholar] [CrossRef] [Scilit]
  24. Cooter, R.D.; Schäfer, H.B. Solomon’s Knot: How Law can End the Poverty of Nations; Princeton University Press: Princeton, NJ, USA, 2011; Available online: https://www.degruyterbrill.com/document/doi/10.1515/9781400839681/html (accessed on 19 July 2026).
  25. Bai, Y. Coordination of Technology and Institutions: Governance Strategies for Trusted Data Circulation. Libr. Dev. 2025, 4, 120–134. [Google Scholar]
  26. Liu, Y.Z.; Zong, L.F.; Jin, D.; Yuan, K. Security risk analysis and countermeasures in the circulation and use of data factors. Big Data Res. 2023, 9, 79–98. [Google Scholar]
  27. Liu, B.W.; Xia, Y.K. Industrial Data Circulation and Utilization Based on Data Spaces: Logical Framework and Technical Implementation. Libr. Inf. 2024, 2, 33–44. [Google Scholar]
  28. Rao, C.P. The Legal Dilemma and Institutional Reshaping of Trust Mechanisms in Data Transactions. Acad. J. Zhongzhou 2025, 2, 73–80. [Google Scholar]
  29. Liu, Y.Z.; Zong, L.F.; Yang, Z.Y.; Qian, Y.; Sun, J.S. The Research Framework and Prospect of Trustworthy Circulation and Transaction of Data Elements. Nankai Bus. Rev. 2025, 28, 158–170. [Google Scholar]
  30. Wang, X.; Xia, Y.K. On the Practical Dilemma and Perfecting Improvement of Data Rights and Interests Protection in the Utilization of Health and Medical Data-Take the European Health Data Space as an Example. Libr. Inf. 2024, 2, 55–68. [Google Scholar]
  31. Lin, Z.Y.; Wu, J.; Zhao, R.; Nie, Y.Y. Analysis of the Construction Path for Long-Term Operational Systems of Data Element Markets from the Perspective of Comprehensive Urban Digital Transformation. E-Gov. 2025, 6, 89–101. [Google Scholar]
  32. Xia, Y.K.; Cheng, S.; Wang, X.; Qian, J.L. Research on Practical Progress and Operation Mode of Data Spaces—Based on Cases of Data Spaces Radar. Libr. Inf. 2024, 2, 18–32. [Google Scholar]
  33. Gao, F.P. A Study on the Data Space Regime: Localized Adaptation of the EU Model in China. J. Gansu Univ. Political Sci. Law 2025, 4, 1–20. [Google Scholar]
  34. Su, Y.; Lu, Y. Trusted Data Element Transaction Circulation: Institutional Shaping of Common Data Spaces. E-Gov. 2024, 12, 53–64. [Google Scholar]
  35. Wang, D.D.; Xie, S.C.; Cheng, Y.Y. Evolutionary Game Analysis of Open Utilization of Healthcare Big Data Considering Trust Gains and Losses. Libr. Inf. Serv. 2024, 68, 54–65. [Google Scholar]
  36. Jin, Y.; Chen, D.J.; Gao, X.N.; Yang, R.X.; Pan, X.M.; Wang, P.F. Dilemma and Relief of Healthcare Data Trading—A Multi-Subject Game Based on Arrow’s Information Paradox. J. Mod. Inf. 2026, 46, 149–161. [Google Scholar]
  37. Al-Najjar, N.I.; Weinstein, J. A Bayesian model of Knightian uncertainty. Theory Decis. 2015, 78, 1–22. [Google Scholar] [CrossRef] [Scilit]
  38. Zhai, Y.K.; Guo, R.F.; Wang, Y. Healthcare Data Sharing Strategy Based on Tripartite Evolutionary Game. J. Syst. Eng. 2025, 40, 374–392. [Google Scholar]
  39. Zhang, M.; Mu, D.M.; Deng, J.; Wang, P.; Li, Y. Research on the Collaborative Mechanism of Medical Data Sharing Stakeholders: Based on Quadripartite Evolutionary Game Analysis. J. China Soc. Sci. Tech. Inf. 2025, 44, 61–74. [Google Scholar]
  40. Mu, D.M.; Zhang, M. Elucidation of Driving Force Mechanism of Medical Data Value Release Based on Data Value Chain. J. China Soc. Sci. Tech. Inf. 2025, 44, 1144–1158. [Google Scholar]
  41. Ding, S.; Wang, Y.F.; Wang, H.; Zhu, L.F.; Fan, X.Q.; Yang, S.L. Cooperation Mechanism for Cross-domain Healthcare Data Governance in the Internet of Healthcare Systems (IHS) Environment. J. Manag. Sci. China 2026, 29, 175–190. [Google Scholar]
  42. Xu, X.; Qi, Y. Evolutionary Game Analysis of Medical Data Sharing Incorporating the Hotelling Model. Inf. Sci. 2026, 44, 148–158. [Google Scholar]
  43. Yao, H.; Liu, Y.L. Evolutionary Game Analysis of Healthcare Data Governance in China’s Experimental Data Trading Pilots. npj Digit. Med. 2025, 8, 562. [Google Scholar] [CrossRef] [Scilit] [PubMed]
  44. National Health Commission of the People’s Republic of China. Statistical Bulletin on the Development of Health Care in China, 2024. Available online: https://www.nhc.gov.cn/guihuaxxs/c100133/202512/f1c3a3c617484a27a1a26a468afbaeee/files/2024%E5%B9%B4%E6%88%91%E5%9B%BD%E5%8D%AB%E7%94%9F%E5%81%A5%E5%BA%B7%E4%BA%8B%E4%B8%9A%E5%8F%91%E5%B1%95%E7%BB%9F%E8%AE%A1%E5%85%AC%E6%8A%A5-20251201161542231.pdf (accessed on 22 August 2026).
  45. Mayer, R.C.; Davis, J.H.; Schoorman, F.D. An Integrative Model of Organizational Trust. Acad. Manag. Rev. 1995, 20, 709–734. [Google Scholar] [CrossRef] [Scilit]
  46. McAllister, D.J. Affect- and cognition-based trust as foundations for interpersonal cooperation in organizations. Acad. Manag. J. 1995, 38, 24–59. [Google Scholar] [CrossRef] [Scilit]
  47. Friedman, D. Evolutionary Games in Economics. Econometrica 1991, 59, 637–666. [Google Scholar] [CrossRef] [Scilit]
  48. Weibull, J.W. Evolutionary Game Theory; MIT Press: Cambridge, MA, USA, 1995. [Google Scholar]
  49. Ritzberger, K.; Weibull, J.W. Evolutionary Selection in Normal-Form Games. Econometrica 1995, 63, 1371–1399. [Google Scholar] [CrossRef] [Scilit]
  50. Zhu, L.L.; Rong, J.M.; Zhang, S.Y. Three-party Evolutionary Game and Simulation Analysis of Drug Quality Supervision under the Government Reward and Punishment Mechanism. Chin. J. Manag. Sci. 2021, 29, 55–67. [Google Scholar]
  51. Ricardo, M.; Marijn, J. Transparency Dimensions of Big and Open Linked Data: Transparency as Being Synonymous with Accountability and Openness. In Open and Big Data Management and Innovation: Proceedings of the 14th IFIP WG 6.11 Conference on e-Business, e-Services, and e-Society (I3E); Springer International Publishing: Dordrecht, The Netherlands, 2015; pp. 236–246. [Google Scholar]
  52. Karrar, N.; Khan, S.K.; Manohar, S.; Quattroni, P.; Seymour, D.; Varma, S.; The UK Health Data Research Alliance. Improving Transparency in the Use of Health Data for Research: Recommendations for a Data Use Register Standard. Available online: https://zenodo.org/record/5902743#.Y19-A2DjzuE (accessed on 19 July 2026).
  53. Zhao, Y.M.; Huang, D.D. The Construction Principles and Development Paths of Trusted Data Spaces in China. J. Mod. Inf. 2025, 45, 126–139. [Google Scholar]
  54. Robinson, S.L. Trust and Breach of the Psychological Contract. Adm. Sci. Q. 1996, 41, 574–599. [Google Scholar] [CrossRef] [Scilit]
Figure 1. The “Vicious Circle” Dilemma Model of Mutual Trust Between Supply and Demand Sides in Health Data Circulation.
Symmetry 18 01567 g001
Figure 2. The Two-Stage Decision-Making Model for Suppliers and Demanders in Health Data Transaction Circulation Scenarios.
Symmetry 18 01567 g002
Figure 3. Tripartite Entities in the Mutual Trust Game.
Symmetry 18 01567 g003
Figure 4. Initial equilibrium state under different initial conditions: (a) symmetric initial conditions with x = y = z ranging from 0.1 to 0.9; (b) asymmetric initial conditions with six representative combinations.
Symmetry 18 01567 g004
Figure 5. Impact of an Increase in T 3 on Evolutionary Results.
Symmetry 18 01567 g005
Figure 6. Impact of an Increase in F 1 on Evolutionary Results.
Symmetry 18 01567 g006
Figure 7. Impact of an Increase in F 2 on Evolutionary Results.
Symmetry 18 01567 g007
Figure 8. Impact of an Increase in P 31 on Evolutionary Results.
Symmetry 18 01567 g008
Figure 9. The Counteracting Effect of an Increase in F 2 on an Increase in P 31 .
Symmetry 18 01567 g009
Figure 10. Impact of Changes in Some Cost and Benefit Parameters of the Supply Side on Evolutionary Results. (a) When only C 1 changes; (b) When only L 1 changes; (c) When only C 2 changes; (d) When only T 1 changes.
Symmetry 18 01567 g010
Figure 11. Impact of Changes in Trust Benefit Parameters of the Demand Side on Evolutionary Results. (a) When only T 2 changes; (b) When only L 2 changes.
Symmetry 18 01567 g011
Figure 12. Impact of Increases in E 11 and E 21 on Evolutionary Results.
Symmetry 18 01567 g012
Figure 13. Impact of Increases in E 12 and E 22 on Evolutionary Results.
Symmetry 18 01567 g013
Figure 14. Impact of Increases in F 1 and F 2 on Evolutionary Results.
Symmetry 18 01567 g014
Figure 15. Impact of Changes in F 1 and F 2 on Evolutionary Results. (a) When ( F 1 , F 2 ) = (5, 40); (b) When ( F 1 , F 2 ) = (40, 5); (c) When ( F 1 , F 2 ) = (5, 80); (d) When ( F 1 , F 2 ) = (80, 5).
Symmetry 18 01567 g015
Figure 16. The Basic Path to Resolving the Mutual Trust Dilemma Between Suppliers and Demanders in Health Data Transaction Circulation Scenarios.
Symmetry 18 01567 g016
Figure 17. Mutual Trust Mechanism Between Supply and Demand Sides in the Context of Health Data Transaction and Circulation.
Symmetry 18 01567 g017
Table 1. Payoff Matrix of the Tripartite Evolutionary Game.
Suppliers/Demanders/RegulatorsSuppliers
DemandersHigh-Quality Supply
x
Low-Quality Supply
1 x
RegulatorsStrong Regulation
z
Compliant Use
y
P 1 C 1 + T 1 a ( E 11 + L s ) ,
P 21 P 1 + T 2 a E 21 ,
T 3 C 3
P 1 C 2 L 1 a ( E 11 + L s ) ( F 1 + E 12 ) ,
P 22 P 1 + T 2 a E 21 + E 12 ,
T 3 C 3 + F 1
Non-Compliant Use
1 y
P 1 C 1 + T 1 b L S + E 22 ,
P 21 + P 31 P 1 b ( E 21 + E 11 )
( F 2 + L 2 + E 22 ) ,
T 3 C 3 + F 2
P 1 C 2 L 1 b L s F 1 E 12 ,
P 22 + P 32 P 1 b ( E 21 + E 11 )
( F 2 + L 2 + E 22 ) + E 12 ,
T 3 C 3 + F 1 + F 2
Weak Regulation
1 z
Compliant Use
y
P 1 C 1 + T 1 a ( E 11 + L s ) ,
P 21 P 1 + T 2 a E 21 ,
L 3
P 1 C 2 L 1 a ( E 11 + L s ) ,
P 22 P 1 + T 2 a E 21 ,
L 3
Non-Compliant Use
1 y
P 1 C 1 + T 1 b ( E 11 + L s ) ,
P 21 + P 31 P 1 + T 2 b E 21 ,
L 3
P 1 C 2 L 1 b ( E 11 + L s ) ,
P 22 + P 32 P 1 + T 2 b E 21 ,
L 3
Table 2. Comparison of Key Features Between This Study and Representative Prior Studies.
StudyDecision StagesActorsTrust MechanismApplication Context
Jin et al. [36] (2026)Single-stageFour parties: data providers, platform operators, government regulators, data demandersImplicit (indirectly reflected through reputation losses and gains)Healthcare data trading (China)
Zhai et al. [38] (2025)Single-stageThree parties: patients, medical institutions, governmentImplicit (no explicit trust parameters)Healthcare data sharing (China)
Zhang et al. [39] (2025)Single-stageFour parties: data-providing medical institutions, data-using medical institutions, government, medical data centersImplicit (no explicit trust parameters)Inter-institutional medical data sharing (China)
Wang et al. [35] (2024)Single-stageThree parties: data platform, data users, patientsExplicit trust gains and losses (L1, L2, L3, T4, T5, T6)Healthcare big data open utilization (China, drawing on UK experience)
Mu et al. [40] (2025)Single-stageThree parties: medical institutions, government, data marketImplicit (indirectly reflected through trust crisis loss S31)Medical data value release (China)
Ding et al. [41] (2026)Single-stageThree parties: lead units, hub member units, basic member unitsExplicit reputation mechanism (reputation gain PI, reputation risks Fm, Fb)Cross-domain healthcare data governance (China)
Xu & Qi [42] (2026)Single-stageTwo parties: general hospitals, local governmentsImplicit (indirectly reflected through patient privacy concerns θ/F)Regional medical data sharing platform construction (China)
Yao & Liu [43] (2025)Single-stageThree parties: Data Management Authorities, Data Operation Departments, Data-related EntitiesExplicit trust mechanism (patient trust I2, government reputation loss I1)Healthcare data factor circulation (China)
This studyTwo-stageThree parties: data suppliers, data demanders, regulatorsExplicit trust gains and losses (T1, T2, T3, L1, L2, L3)China’s Health data circulation ecosystem
Table 3. A Simulated Example of the “Prisoner’s Dilemma” Game Between Suppliers and Demanders in Health Data Transaction Circulation Scenarios.
Suppliers\DemandersDemanders
Compliant UseNon-Compliant Use
SuppliersCompliant Supply(5,5)(2,6)
Non-Compliant Supply(6,2)(3,3)
Table 4. Parameter Symbols and Their Meanings in the Mutual Trust Game.
Parameter SymbolParameter Meaning
C 1 Cost incurred by the data supplier when choosing the high-quality supply strategy
P 1 Payment amount made by the data demander to the data supplier
T 1 Trust benefit gained by the data supplier when choosing the high-quality supply strategy
a Probability of data leakage when the data demander uses data compliantly
b Probability of data leakage when the data demander uses data non-compliantly
E 11 Base compensation amount paid by the data supplier to the data subject in the event of data leakage
C 2 Cost incurred by the data supplier when choosing the low-quality supply strategy
F 1 Penalty collected by the regulator from the data supplier when low-quality supply is detected under strong regulation
E 12 Liquidated damages paid by the data supplier to the data demander when low-quality supply is detected
L 1 Trust loss suffered by the data supplier when low-quality supply is detected
L s Social reputation loss borne by the data supplier when a data leakage incident occurs
T 2 Trust benefit gained by the data demander when choosing the compliant use strategy
P 21 Basic economic benefit obtained by the data demander when the supplier provides high-quality data
P 22 Basic economic benefit obtained by the data demander when the supplier provides low-quality data
P 31 Additional benefit obtained by the data demander from non-compliant use when the supplier provides high-quality data
P 32 Additional benefit obtained by the data demander from non-compliant use when the supplier provides low-quality data
E 21 Base compensation amount paid by the data demander to the data subject in the event of data leakage
F 2 Penalty collected by the regulator from the data demander when non-compliant use is detected under strong regulation
E 22 Liquidated damages paid by the data demander to the data supplier when non-compliant use is detected
L 2 Trust loss suffered by the data demander when non-compliant use is detected
C 3 Cost incurred by the regulator when choosing the strong regulation strategy
T 3 Trust benefit gained by the regulator when choosing the strong regulation strategy
L 3 Trust loss suffered by the regulator when choosing the weak regulation strategy
Table 5. Stability of Equilibrium Points in the Tripartite Evolutionary Game.
Equilibrium PointEigenvalue λ 1 Eigenvalue λ 2 Eigenvalue λ 3
E 1 ( 0 , 0 , 0 ) T1 + L1 + C2C1E21(ba) − P32T3C3 + L3 + F1 + F2
E 2 ( 0 , 0 , 1 ) T1 + L1 + C2C1 + F1 + E12 + E22 + bE11T2 + E21(ba) − P32 + bE11 + F2 + L2 + E22T3 + C3L3F1F2
E 3 ( 0 , 1 , 0 ) T1 + L1 + C2C1E21(ba) + P32T3C3 + L3 + F1
E 4 ( 0 , 1 , 1 ) T1 + L1 + C2C1 + F1 + E12E21(ba) + P32T2bE11F2L2E22T3 + C3L3F1
E 5 ( 1 , 0 , 0 ) T1L1C2 + C1E21(ba) − P31T3C3 + L3 + F2
E 6 ( 1 , 0 , 1 ) T1L1C2 + C1F1E12E22bE11T2 + E21(ba) − P31 + bE11 + F2 + L2 + E22T3 + C3L3F2
E 7 ( 1 , 1 , 0 ) T1L1C2 + C1E21(ba) + P31T3C3 + L3
E 8 ( 1 , 1 , 1 ) T1L1C2 + C1F1E12E21(ba) + P31T2bE11F2L2E22T3 + C3L3
Note: Each equilibrium point is asymptotically stable (an ESS) when all three eigenvalues of the Jacobian matrix have negative real parts.
Table 6. Initial Values for Simulation Experiments.
Initial Values C 1 L 1 C 2 T 1 P 1 E 21 E 11 E 12 L S T 2 P 21 P 22
401055801055555020
P 31 P 32 a b F 1 F 2 E 22 L 2 C 3 T 3 L 3
50200.050.25551055055
Table 7. Summary of Key Sensitivity Analysis Results.
Baseline ParametersParameter(s) ChangedValues TestedEquilibrium State
(x, y, z)
Figure
Initial values T 3 5 → 40 → 80(0, 0, 0) → (0, 1, 1) → (0, 1, 1)Figure 5
Initial values except for T 3 (=80) F 1 5 → 20 → 40(0, 1, 1) → (1, 0, 1) → (1, 0, 1)Figure 6
Initial values except for T 3 (=80) and F 1 (=20) F 2 10 → 25 → 40(1, 0, 1) → (1, 0, 1) → (1, 1, 1)Figure 7
Initial values except for T 3 (=80), F 1 (=20) and F 2 (=40) P 31 50 → 60 → 70(1, 1, 1) → (1, 1, 1) → (1, 0,1)Figure 8
Initial values except for T 3 (=80), F 1 (=20), F 2 (=40) and P 31 (=70) F 2 40 → 50 → 60(1, 0, 1) → (1, 1, 1) → (1, 1, 1)Figure 9
Initial values except for T 3 (=80) C 1 40 → 30 → 20(0, 1, 1) → (1, 0, 1) → (1, 0, 1)Figure 10a
L 1 10 → 20 → 30Figure 10b
C 2 5 → 15 → 25Figure 10c
T 1 5 → 15 → 25Figure 10d
Initial values except for T 3 (=80) and F 1 (=20) T 2 5 → 25 → 45(1, 0, 1) → (1, 0, 1) → (1, 1, 1)Figure 11a
L 2 5 → 25 → 45Figure 11b
Initial values except for T 3 (=80)( E 11 , E 21 )(5, 10) → (20, 25) → (40, 45)(0, 1, 1) → (0, 1, 1) → (0, 1, 1)Figure 12
Initial values except for T 3 (=80)( E 12 , E 22 )(5, 10) → (25, 30) → (45, 50)(0, 1, 1) → (1, 0, 1) → (1, 1, 1)Figure 13
Initial values( F 1 , F 2 )(5, 5) → (40, 40) → (80, 80)(0, 0, 0) → (1, 0, 0.57) →
(1, oscillatory, oscillatory)
Figure 14
Initial values( F 1 , F 2 )(5, 40)(0, oscillatory, oscillatory)Figure 15a
(40, 5)(oscillatory, 0, oscillatory)Figure 15b
(5, 80)(0, oscillatory, oscillatory)Figure 15c
(80, 5)(oscillatory, 0, oscillatory)Figure 15d
Note: Oscillatory indicates that the system exhibits sustained oscillations rather than converging to a fixed equilibrium.
Disclaimer/Publisher’s Note: The statements, opinions and data contained in all publications are solely those of the individual author(s) and contributor(s) and not of MDPI and/or the editor(s). MDPI and/or the editor(s) disclaim responsibility for any injury to people or property resulting from any ideas, methods, instructions or products referred to in the content.