Article

Dual-Band Asymmetry-Guided Long-Range Cat-Eye Recognition with Multi-Scale Fusion

1
State Key Laboratory of Pulsed Power Laser Technology, National University of Defense Technology, Hefei 230037, China
2
Advanced Laser Technology Laboratory of Anhui Province, Hefei 230026, China
3
Xi’an Institute of Applied Optics, Xi’an 710065, China
*
Author to whom correspondence should be addressed.
Symmetry 2026, 18(9), 1560; https://doi.org/10.3390/sym18091560 (registering DOI)
Submission received: 31 July 2026 / Revised: 6 September 2026 / Accepted: 14 September 2026 / Published: 19 September 2026

Abstract

At detection ranges on the order of kilometers, cat-eye echoes degrade into pixel-level spots and exhibit responses similar to those of compact, high-echo false targets, making it difficult for single-band systems to balance weak-target detection rates with false alarm control. To address this, this paper pairs spatially registered and radiometrically calibrated 808 nm and 905 nm images to form a dual-band detection pair, utilizing the cross-band response asymmetry caused by chromatic defocus for discrimination. Experiments show that cat-eye targets exhibit coupled asymmetry in intensity, scale, and energy distribution, whereas the false targets under test generally maintain approximate symmetry; furthermore, the dominant discriminative information shifts from scale differences to intensity differences as distance increases. Based on this pattern, this paper proposes a range-conditioned “detection–reclassification” framework that dynamically matches appropriate models based on target distance. In this framework, a structurally symmetric, two-branch, multi-scale attention-fused YOLO network is used for candidate target detection, while an explicit asymmetric feature classifier further processes challenging samples to retain weak targets and suppress false alarms. Field experiments conducted at distances ranging from 100 to 2100 m achieved an overall mAP50 of 0.907 and an overall mAP50–95 of 0.475, with the mAP50 improving by 17.7 and 10.8 percentage points, respectively, compared to the 808 nm and 905 nm single-band baselines. The results demonstrate that this framework can effectively balance the detection of weak targets at long ranges with the suppression of false targets under the evaluated conditions.

1. Introduction

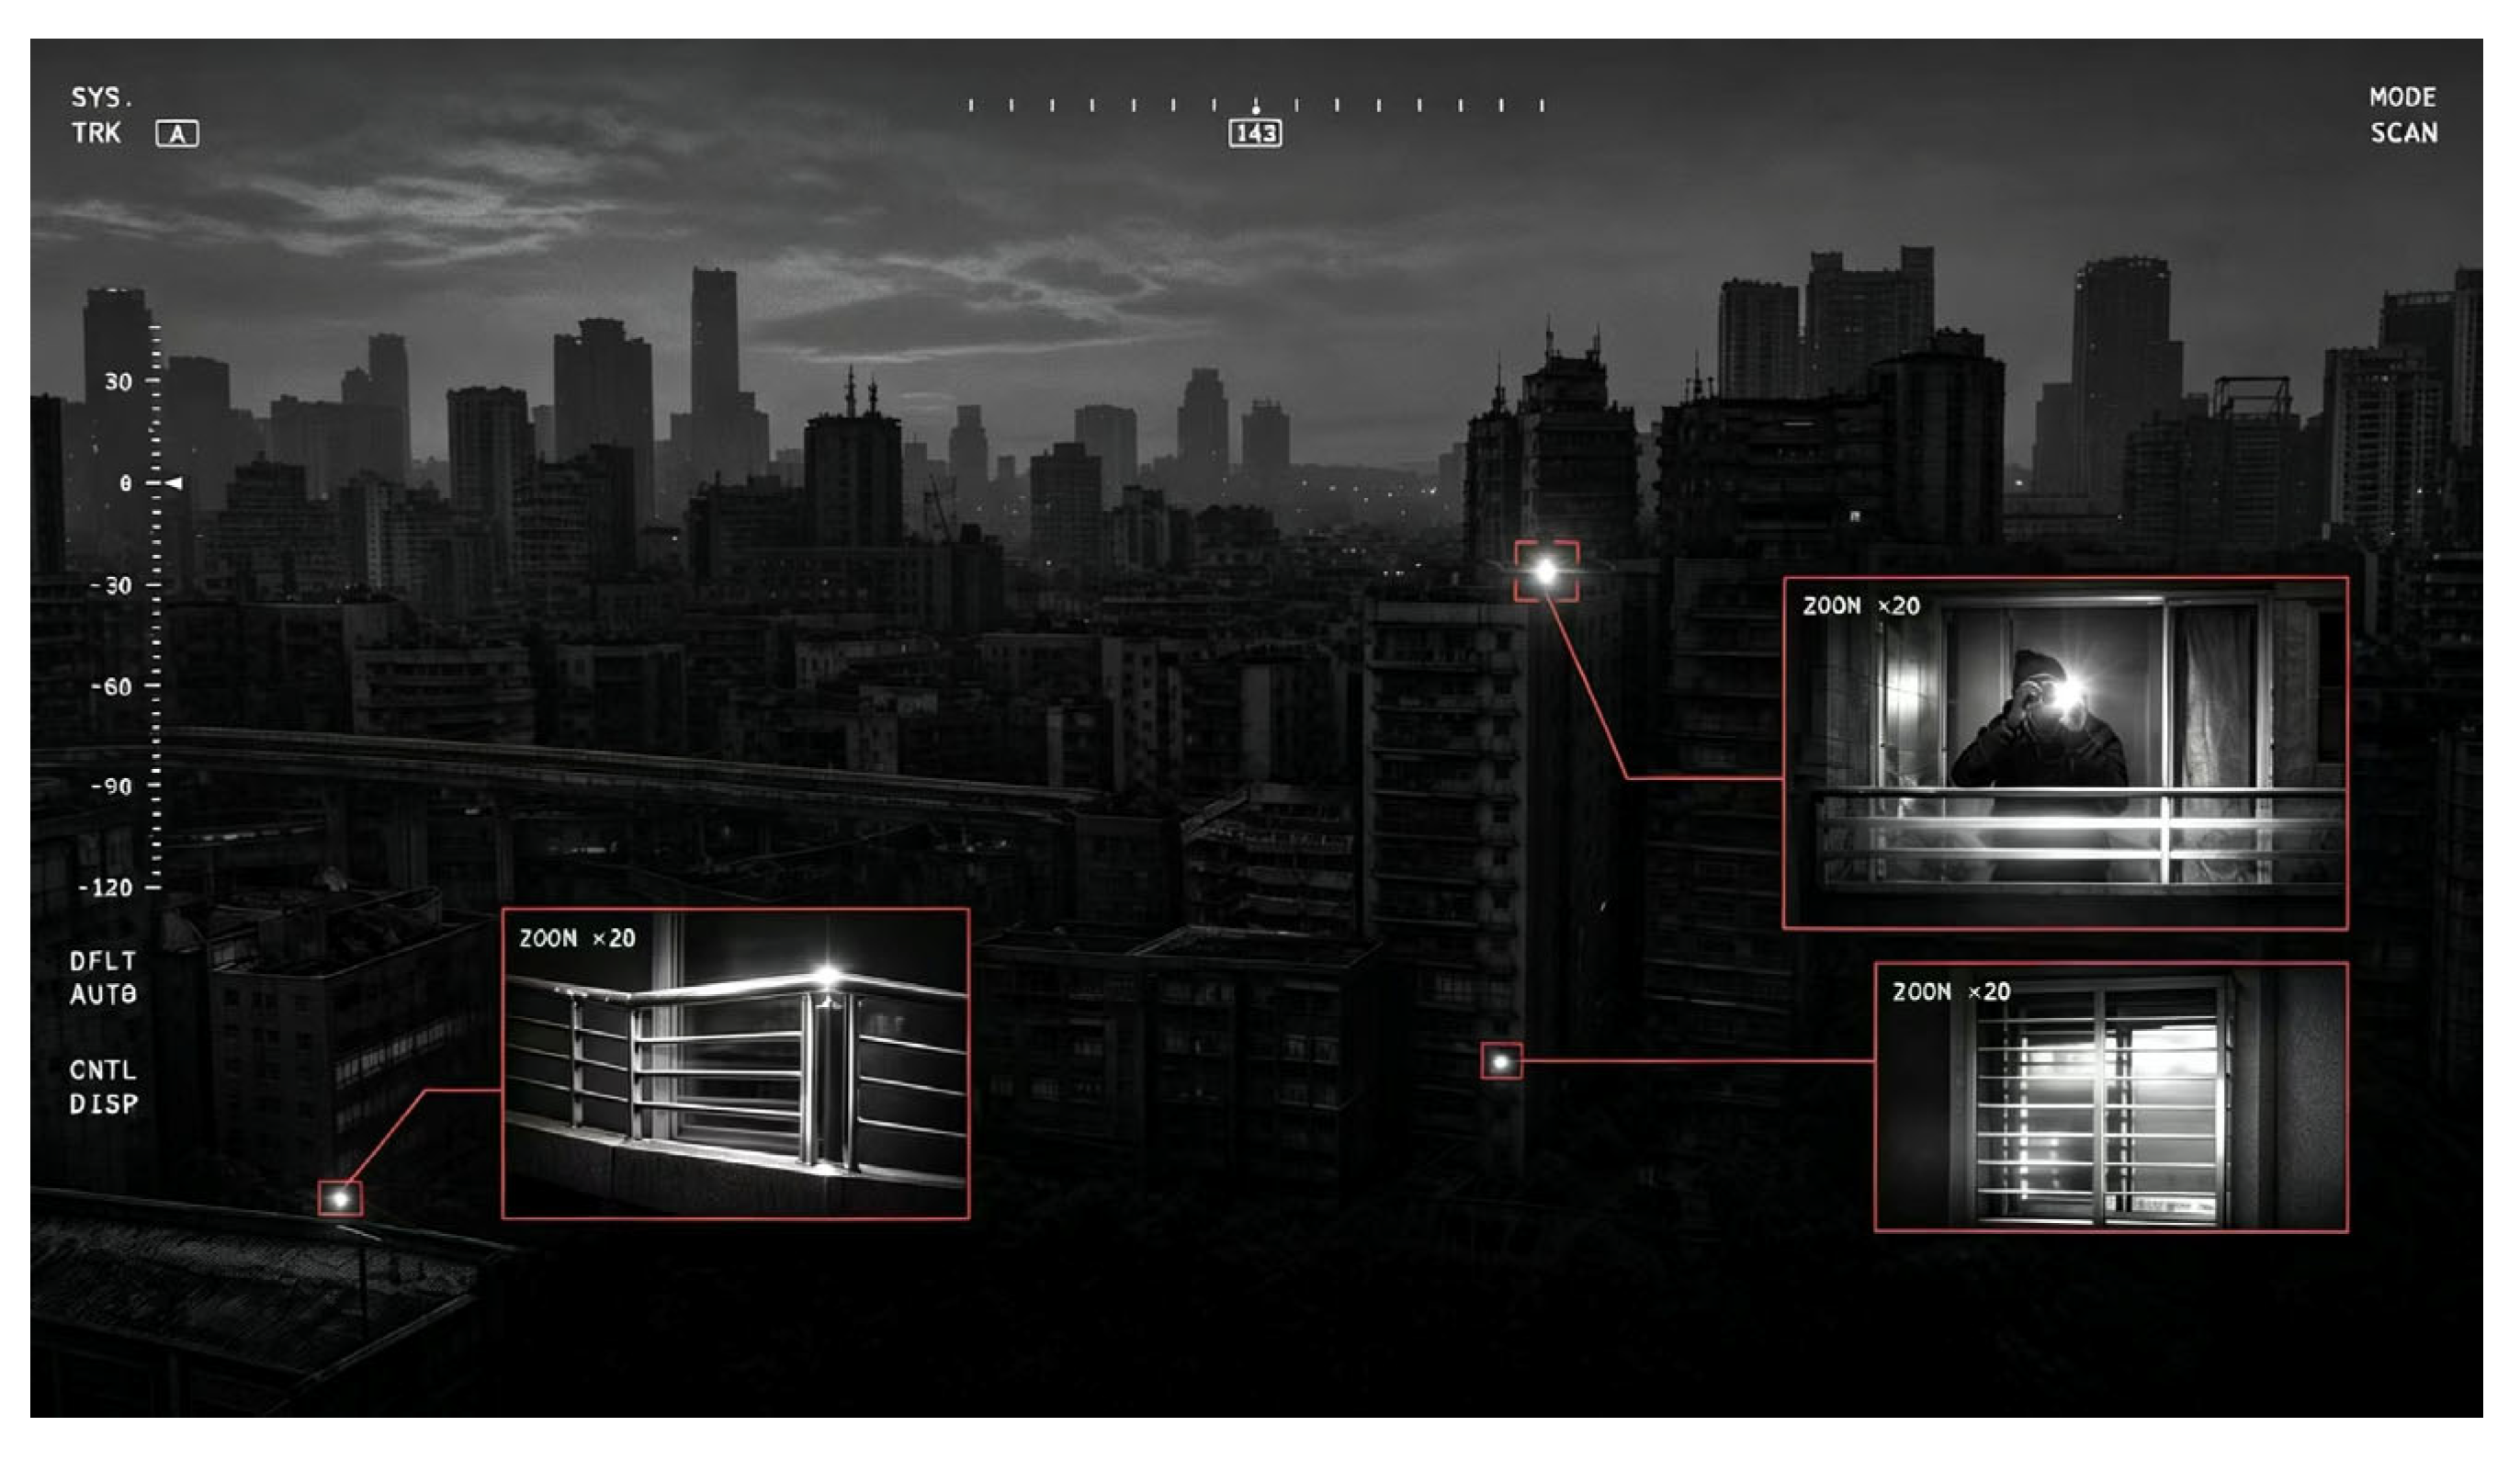
Urban counterterrorism and local security applications increasingly require the accurate identification of potentially threatening optoelectronic devices at long ranges. Active laser detection utilizes the cat-eye effect to detect optical systems containing incident optical elements and reflective or partially reflective surfaces located near their focal plane. This paper collectively refers to such systems as cat-eye targets; typical examples include telescopes and other optical observation devices. From a physical perspective, the incident laser is first collected by the front-end optical element and focused onto the focal plane. When the illumination direction is approximately coaxial with the observation direction, the reflected light passes through this optical element again, forming a relatively narrow outgoing beam centered on the incident direction. This double-pass focusing process produces a quasi-monostatic high-brightness echo that is significantly stronger than the typical diffuse reflection background (Figure 1) [1,2]. The echo intensity is influenced by factors such as the target aperture, focal plane reflectivity, degree of defocus, optical axis alignment, and propagation conditions; therefore, the cat-eye effect is not an inherent response possessed by all optical elements under all conditions.
However, in real-world urban security scenarios, complex backgrounds can cause significant interference with the detection and recognition of cat-eye targets [3]. Potential sources of interference include glass curtain walls, metal structures, and retroreflective road signs; however, the false targets evaluated in the experiments in this paper are limited to the seven types of compact, high-echo targets listed in the dataset description. When illuminated by a laser, the echo spots formed by these false targets may closely resemble small-diameter cat-eye targets in terms of scale and single-band morphology, becoming the primary cause of false alarms generated by the system. This is consistent with the mechanisms of false alarms caused by strong reflections and background clutter commonly reported in small-target detection [4]. At detection ranges on the order of kilometers, the echo power from cat-eye targets attenuates significantly with distance; the targets gradually degrade into pixel-level spots, making it difficult to retain their original morphological information, while highly reflective objects in the background may still produce bright echoes [5]. Consequently, single-band systems struggle to simultaneously maintain long-range detection sensitivity and effectively control the false alarm rate.
To address this issue, previous studies have extended active detection to long ranges [6], investigated propagation, retroreflection, and system-level detection models [7,8,9,10,11], and developed recognition methods based on combined criteria of modulation frequency and shape [12,13], deep convolutional features [14,15,16,17], and handcrafted feature extraction [3,18,19,20,21,22,23,24]. However, when target echoes in complex, variable-range backgrounds degrade to just a few pixels, the information provided by a single wavelength band remains insufficient to reliably distinguish cat-eye targets from compact, high-echo false targets. Dual-band active detection provides a new dimension of physical information to address this issue: the focusing elements inside cat-eye targets and the focal-plane reflectors or photosensitive units exhibit different responses to different wavelengths, thereby creating a systematic response asymmetry between the 808 nm and 905 nm channels. In contrast, non-cat-eye specimens examined in this paper—such as electric torch and “Speed Limit 60” signs—do not possess the same internal focusing–focal-plane return structure as cat-eye targets and typically exhibit approximate cross-band response symmetry after calibration. Previous studies have examined dual-band or multiwavelength echo characteristics and detection methods [25,26,27,28,29,30,31,32], but systematic research is still lacking on how to perform distance-stratified modeling and validation of the cross-band response asymmetry of small targets under complex urban backgrounds and at distances on the order of kilometers.
Given the aforementioned research gaps, this paper investigates whether the cross-band response asymmetry caused by chromatic defocus can provide a physical prior for distinguishing between cat-eye targets and false targets in the 100–2100 m range. These response relationships are incorporated into both the feature learning and candidate target re-classification processes: a dual-branch multiscale network is used to preserve and adaptively fuse band-specific representations, while a range-conditioned explicit feature classifier utilizes interpretable asymmetric features to handle challenging samples. Consequently, dual-band images are no longer treated merely as supplementary inputs but are linked to learned features through a physical response model. Section 2 reviews related research and clarifies the positioning of this study; Section 3 introduces the physical principles, recognition algorithms, dual-band asymmetric features, and experimental setup; Section 4 reports and discusses the experimental results; and Section 5 summarizes the paper.

2. Related Work

2.1. Cat-Eye Target Recognition in Single-Band Active Detection

Early research on active detection using the cat-eye effect established the basic echo models and system architectures upon which subsequent studies relied and demonstrated that the high-intensity echoes generated by photodetectors under laser illumination can be several orders of magnitude stronger than the diffuse reflection background [1,2]. Subsequently, single-band systems extended the detection range to several thousand meters through high-power pulsed illumination and long-focus imaging [6], and related system-level simulations further validated the feasibility of the detection and recognition processes [33]. On CCD- and APD-based imaging platforms, early recognition methods primarily relied on fixed intensity thresholds, morphological operators, and geometric shape priors [20,34]. To improve robustness in complex dynamic backgrounds, researchers further proposed combined shape–modulation frequency and shape–local texture criteria [12,13], as well as texture descriptors [18] and visual salience or visual attention mechanisms [3,21].
In terms of engineering implementation, embedded dual-channel hardware platforms have achieved deployable real-time detection at distances of several hundred meters while reducing the system’s false alarm rate [20,22,34]. Additionally, anti-interference strategies combining M-sequence coding and correlation processing with intelligent sighting platforms have been employed to suppress false target responses under actual field conditions [23]. These studies have enhanced the practicality of single-band active detection systems in complex scenarios; however, their discrimination capabilities still rely primarily on intensity, shape, or texture information within a single band.
In recent years, deep learning methods have gradually been incorporated into the cat-eye target detection process. Convolutional neural networks have been used to classify candidate regions and eliminate interference—such as reflective clutter—during microcamera detection [14,15,17]; fully convolutional residual networks combined with visual saliency have improved the recall rate of small echo spots in complex backgrounds [16]; and differential acquisition strategies have been employed to extract high-dynamic-range, low-contrast targets in complex backgrounds [24]. Although these methods have improved the detection and classification capabilities for candidate targets, their information sources remain limited to a single detection band. When target echoes degrade to just a few pixels at kilometer-scale distances, single-band systems are still constrained by the trade-off between detection sensitivity and false alarm control.

2.2. Multi-Band and Dual-Band Discrimination Strategies

To overcome the information limitations of single-wavelength detection, existing research has begun to explore multi-wavelength and multi-channel active detection. A dual-channel scanning slit system can simultaneously perform target localization and range estimation in outdoor and urban environments while reducing the false alarm rate [29]. By jointly analyzing the spectral, temporal, and turbulence statistical characteristics of the echoes, related methods have achieved the differentiation of cat-eye targets from road signs, rifle scopes, and other reflective clutter [7,35]. Time-gated multi-wavelength retro-reflection methods, on the other hand, identify optical systems by comparing calibration cross-sections at different wavelengths [30]. Studies on matrix optical echo models [31] and multi-wavelength discrimination using micro-cameras [32] have further established quantitative relationships between wavelength, degree of defocus, and echo divergence characteristics.
In terms of learning methods, dual-spectral deep fusion models have attempted to use multiband images for target recognition [28] but have not yet explicitly incorporated response asymmetry features with physical constraints. Dual-band studies on cat-eye optical systems have also analyzed the differences between three-dimensional echo light fields and dual-band echoes [26] and investigated the characteristics of dual-band echo light fields under oblique incidence conditions [27]. Related reviews have further summarized the geometric optics, physical optics, and angular spectrum modeling methods employed in this field [36]. In addition to wavelength information, polarization-based echo discrimination [37], active–passive sub-terahertz imaging [38], and the detection of retro-reflective optical targets for new application scenarios [39] also demonstrate that introducing additional physical observation dimensions is a key research direction for enhancing target discrimination capabilities.

2.3. Research Gap and Positioning of This Work

Active cat-eye target detection has gradually evolved from early single-band correlation detection and image registration methods to deep learning-based recognition and adaptive feature fusion [17,23,40,41]. However, the distances reported in existing studies correspond to different tasks—such as target discovery, detection, or class recognition—and their results are generally not directly comparable [6]. Detecting specific optical targets at long ranges does not necessarily equate to the ability to reliably distinguish between multiple classes of real targets and false targets; false alarm performance is also influenced by target composition, background conditions, acquisition geometry, and the definition of evaluation metrics. Although existing bispectral and dual-band methods provide additional wavelength-related information [26,28], their validation is typically limited to laboratory-scale testing, fails to specify the maximum recognition range, or covers only a limited number of target and interference classes. Therefore, investigating how cross-band discrimination capability and false target suppression performance vary with distance under a unified experimental protocol remains an issue to be addressed. Table 1 summarizes representative studies based on this and outlines the research focus of this paper, which conducts 808/905 nm dual-band evaluations on ten target categories within the 100–2100 m range.
As shown in Table 1, existing research has primarily focused on single-band long-range detection, dual-band light field analysis under laboratory conditions, or dual-spectral image fusion lacking explicit physical criteria; it has not yet simultaneously addressed kilometer-scale distances, multiple types of high-echo false targets, and distance-dependent cross-band response variations. To address this shortcoming, this paper does not merely treat the second band as an additional image input. Instead, it uses the response asymmetry caused by chromatic defocus as a discriminative criterion, integrating band-specific feature learning, cross-band fusion, and explicit feature reclassification into a unified framework. This design is intended to establish a mechanistic link between wavelength-dependent optical responses and the final classification decision and to evaluate its effectiveness in distinguishing cat-eye targets under pixel-level degradation conditions.

3. Materials and Methods

3.1. Principle of Dual-Band Response Symmetry Breaking

In a dual-band active detection configuration, the lidar equation describes the cat-eye target return as follows [42,43,44]:
P r λ = π P t ( λ ) D r 2 4   Ω t ( λ )   R 4   τ t λ τ r λ τ a 2 λ , R   Π λ
where P t ( λ ) denotes the transmitted power, D r the receiver aperture diameter, Ω t ( λ ) the transmitted beam solid angle, R the detection range, τ t ( λ ) , τ r ( λ ) and τ a ( λ , R ) the transmitter link transmittance, receiver link transmittance, and one-way atmospheric transmittance, and Π ( λ ) the equivalent optical cross-section of the target at wavelength λ . For a cat-eye target composed of a converging optical element and a focal-plane reflective unit, the equivalent optical cross-section can be expressed as
Π λ = ρ ( λ ) A Ω c ( λ )
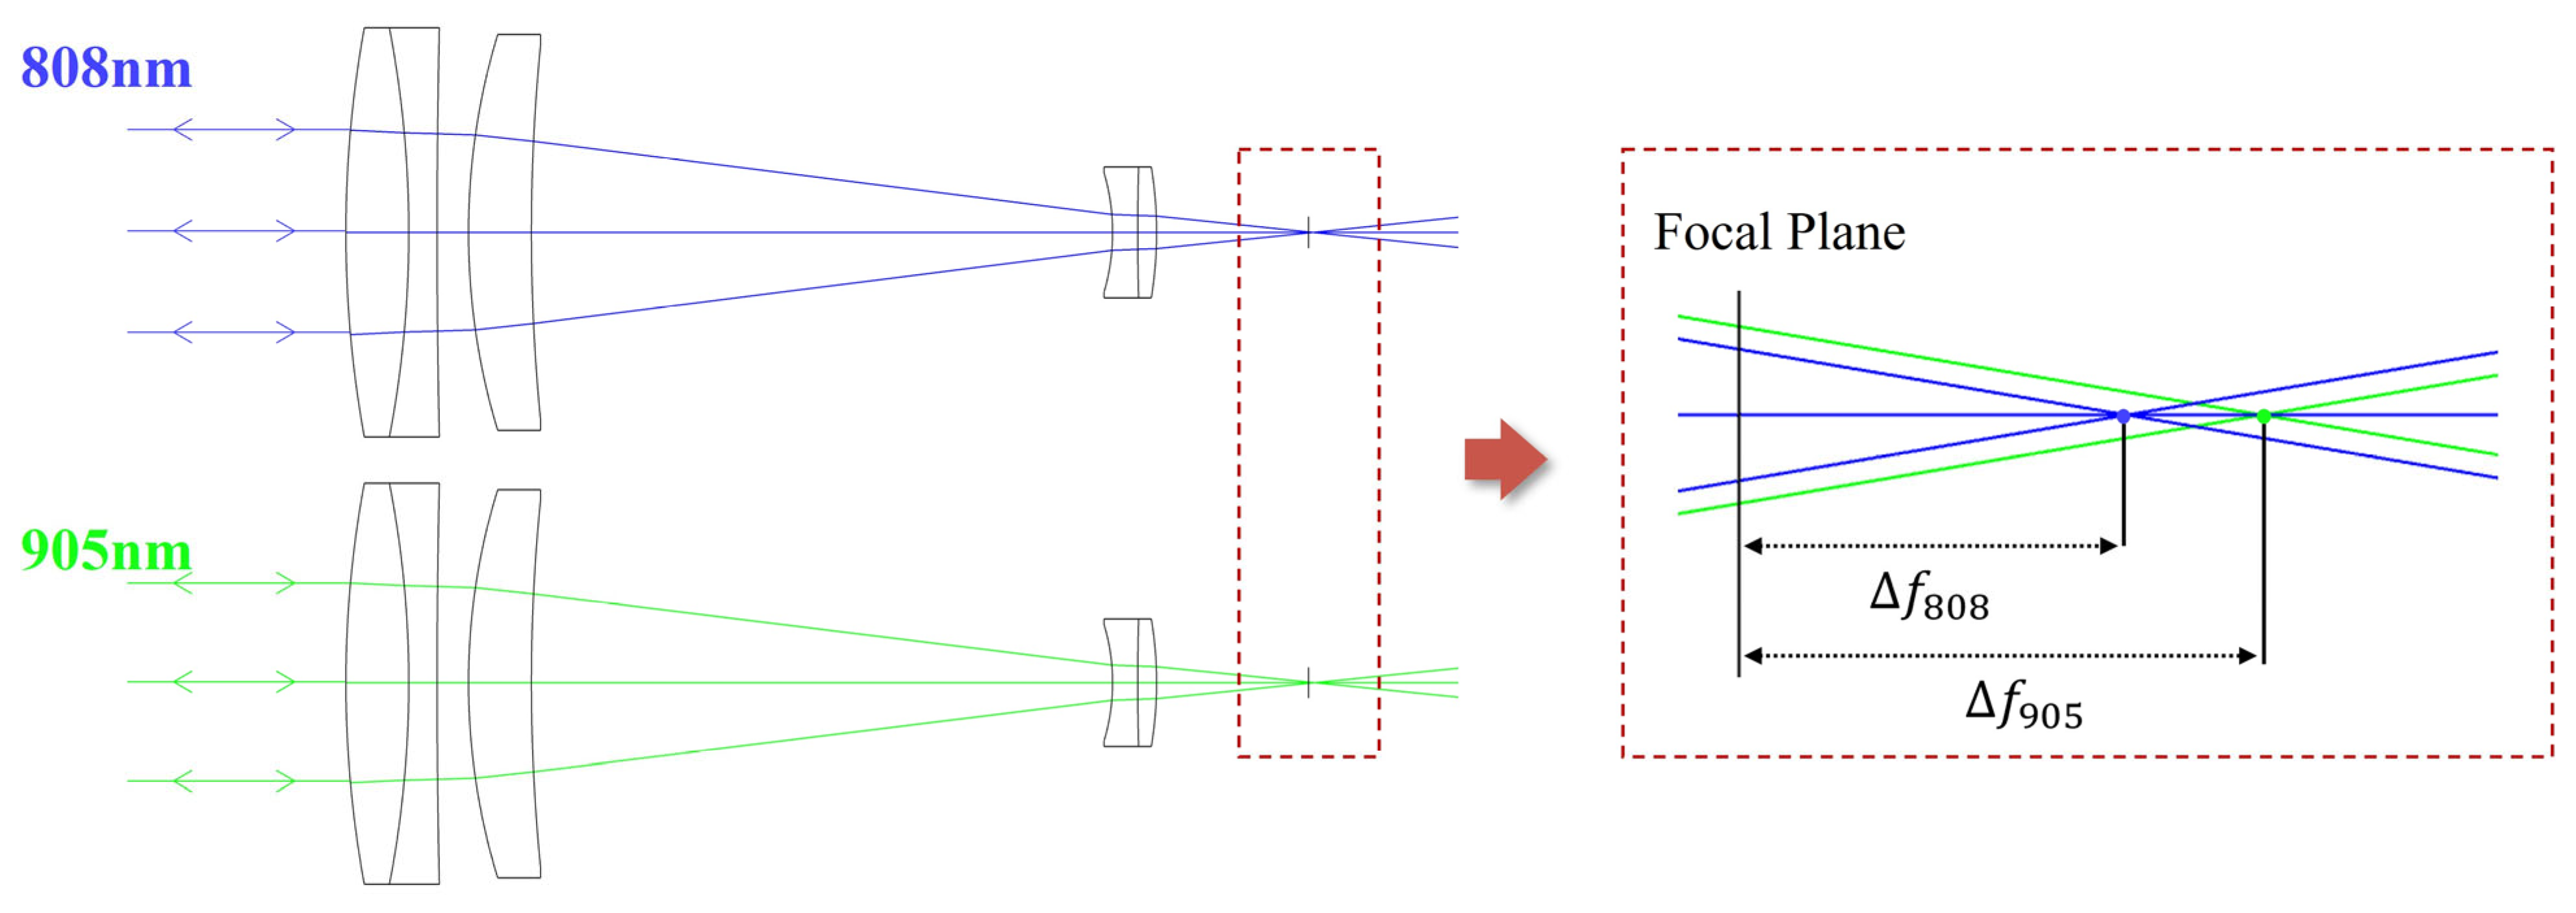
where ρ ( λ ) is the effective reflectance of the focal-plane unit, A the effective reflective area, and Ω c ( λ ) the return beam divergence solid angle. It follows that the target optical cross-section is closely related to the degree of return beam spreading: with all other parameters held constant, an increase in the return beam divergence solid angle leads to a decrease in received return power. The wavelength-dependent defocus mechanism responsible for the dual-band response asymmetry is illustrated in Figure 2.
The fundamental origin of dual-band response asymmetry, or cross-band symmetry breaking, lies in the chromatic aberration of the target optical system. Cat-eye targets such as telescopes are typically color-corrected for one or a few visible wavelengths (e.g., 532 nm), a condition that, in lens-design terms, applies to achromatic and apochromatic designs as well, since exact color correction is achieved only at these discrete wavelengths, with a residual defocus generally persisting elsewhere. When the 808 nm and 905 nm detection wavelengths lie outside the corrected spectral range, they may deviate from the calibration focal plane by different axial defocus amounts, denoted by f 808 and f 905 , respectively. Under paraxial, small-defocus conditions, defocus can be equivalently represented as angular spreading of the retroreflected energy, and the return beam half-angle and divergence solid angle can be approximated as:
θ c λ θ 0 1 + f λ z R 2 , Ω c λ π θ 0 2 1 f λ z R 2
where θ 0 is the minimum divergence half-angle corresponding to the calibrated focal plane, and z R is an effective parameter characterizing the system defocus tolerance. Substituting into the optical cross-section expression yields:
Π λ = Π 0 λ 1 f λ z R 2 1
where Π 0 ( λ ) is the intrinsic optical cross-section under calibrated focal-plane conditions. The received power then follows as:
P r λ , R = K 0 λ τ a 2 λ , R R 4 1 + f λ / z R 2 1
where K 0 λ collects the wavelength-dependent transmitted power density, transmitter and receiver link transmittances, and intrinsic target optical cross-section. The atmospheric transmittance τ a 2 λ , R is retained explicitly in Equation (5) because it may vary with detection range and acquisition conditions. The system-and-target coefficient is defined as:
K 0 λ = π D r 2 / 4 · P t λ / Ω t λ · τ t λ τ r λ Π 0 λ
Accordingly, the return power ratio between the 905 nm and 808 nm bands can be written as:
P r ( 905 , R ) P r ( 808 , R ) = K 0 ( 905 ) K 0 ( 808 ) τ a 2 905 , R τ a 2 808 , R 1 + f 808 / z R 2 1 + f 905 / z R 2
C a R = τ a 2 905 , R τ a 2 808 , R
P r ( 905 , R ) P r ( 808 , R ) = K 0 ( 905 ) K 0 ( 808 ) C a R 1 + f 808 / z R 2 1 + f 905 / z R 2
Taking the ratio of Equation (5) at 905 nm and 808 nm yields Equation (7), in which the common R 4 propagation term cancels exactly. Equation (8) defines the residual atmospheric-transmittance ratio C a R , and Equation (9) explicitly separates this range- and condition-dependent atmospheric factor from the system-side and chromatic-defocus terms. After system-side radiometric calibration, the ratio K 0 ( 905 ) K 0 ( 808 ) is represented by the calibrated reference coefficient ξ. Because atmospheric extinction and near-ground turbulence depend on meteorological conditions and wavelength [7,45,46], Equation (9) retains C a R explicitly. The approximation C a R 1 is a restricted differential approximation for the closely spaced 808/905 nm pair; it does not imply that absolute atmospheric attenuation is absent. When atmospheric conditions become strongly wavelength-selective or time-varying, C a R should be retained as a residual correction and determined from path-transmission measurements or an atmospheric model [47]. Under this restricted differential approximation, Equation (9) reduces to Equation (10).
P r ( 905 , R ) P r ( 808 , R ) ξ 1 + f 808 / z R 2 1 + f 905 / z R 2
Here, ξ represents the calibration reference coefficient. Equation (10) describes the dual-band power relationship under ideal calibration conditions, rather than providing an exact prediction for each field measurement sample. Equations (3)–(10) are merely approximate models for a representative refractive cat-eye structure under near-axis and slightly defocused conditions. The magnitude of the asymmetric response depends on the specific optical structure and the degree of chromatic aberration correction, including simple refractive, achromatic, apochromatic, and catadioptric structures. This model is not intended to quantitatively describe purely reflective systems, nor does it cover all achromatic, apochromatic, and catadioptric designs; for these systems, the response magnitude and its specific wavelength dependence must be determined based on the actual optical structure.
Within the aforementioned scope of applicability, under normal dispersion conditions, the refractive index n decreases monotonically with increasing wavelength, and the focal length f increases accordingly. For representative refractive cat-eye targets, which are typically designed based on the visible light spectrum, both 808 nm and 905 nm produce positive axial defocus. Since λ 905 > λ 808 , it follows that f 905 > f 808 > 0 . Substituting this relationship into Equation (10) yields P r 905 , R < P r 808 , R , indicating that chromatic defocus can produce a directional, systematic response asymmetry between the dual-band echo powers of cat-eye targets. Active detection experiments under different incident angle conditions have also observed this chromatic aberration-related asymmetric response [43]. In contrast, non-cat-eye decoys evaluated in this paper—such as road signs—lack the focusing-focal-plane return structure found within cat-eye targets; therefore, after calibration, they typically do not exhibit the same structure-dependent coupling asymmetry. The “asymmetric–approximately symmetric” qualitative criterion adopted in this paper is consistent with existing experimental results for real commercial optical systems, including aiming and observation optical systems [30] and rifle scopes tested under field conditions [7,35].
In actual measurements, atmospheric transmittance, target-specific spectral response, calibration residuals, detector noise, saturation, registration, and image processing errors may all introduce finite deviations in the observational results relative to Equation (10). This paper mitigates these measurement errors through quantitative atmospheric analysis, radiometric calibration, saturation state recording, and registration quality control, and reduces the confounding effects caused by differences in environmental conditions by comparing cat-eye targets with dummy targets under identical conditions. The experimental results presented below show that, under the evaluation conditions described in this paper, the residual fluctuations resulting from the aforementioned controls are smaller than the systematic response differences between the two target types; therefore, they do not alter the overall stability of target classification. On this basis, when the power ratio in Equation (10) exhibits a systematic deviation from the reference coefficient ξ , accompanied by consistent changes in spot size and energy distribution, this can be interpreted as evidence of the defocusing contribution caused by chromatic aberration in the target’s optical system.

3.2. Dual-Band Response-Aware Target Recognition Algorithm

Under conditions of complex backgrounds and long-range imaging of small targets, scalar features such as single intensity difference ratios are susceptible to the combined effects of noise, registration errors, and energy aliasing, making it difficult to balance the detection of faint targets with the suppression of false alarms. To address this, this paper decomposes the dual-band response differences into multiple computable dimensions—including intensity, scale, energy distribution, and morphology—and uses these to construct a recognition workflow comprising cross-band registration, dual-branch deep-learning-based detection, explicit difference feature discrimination, and result fusion, as shown in Figure 3. First, using the 808 nm image as a reference, the corresponding 905 nm image is registered via translation to establish a unified cross-band target correspondence. Among 2100 matched image pairs, the maximum target-center residual after registration was 1.588 pixels, and 97.1% of the evaluated image pairs had residuals below 1 pixel. After registration is complete, the images enter two complementary information processing paths: a two-branch detection network is used to locate and preliminarily classify candidate targets against a complex background, while an explicit feature classifier utilizes differences in dual-band responses within the candidate regions to provide supplementary discrimination. The outputs from both are ultimately fused to produce the final recognition results.
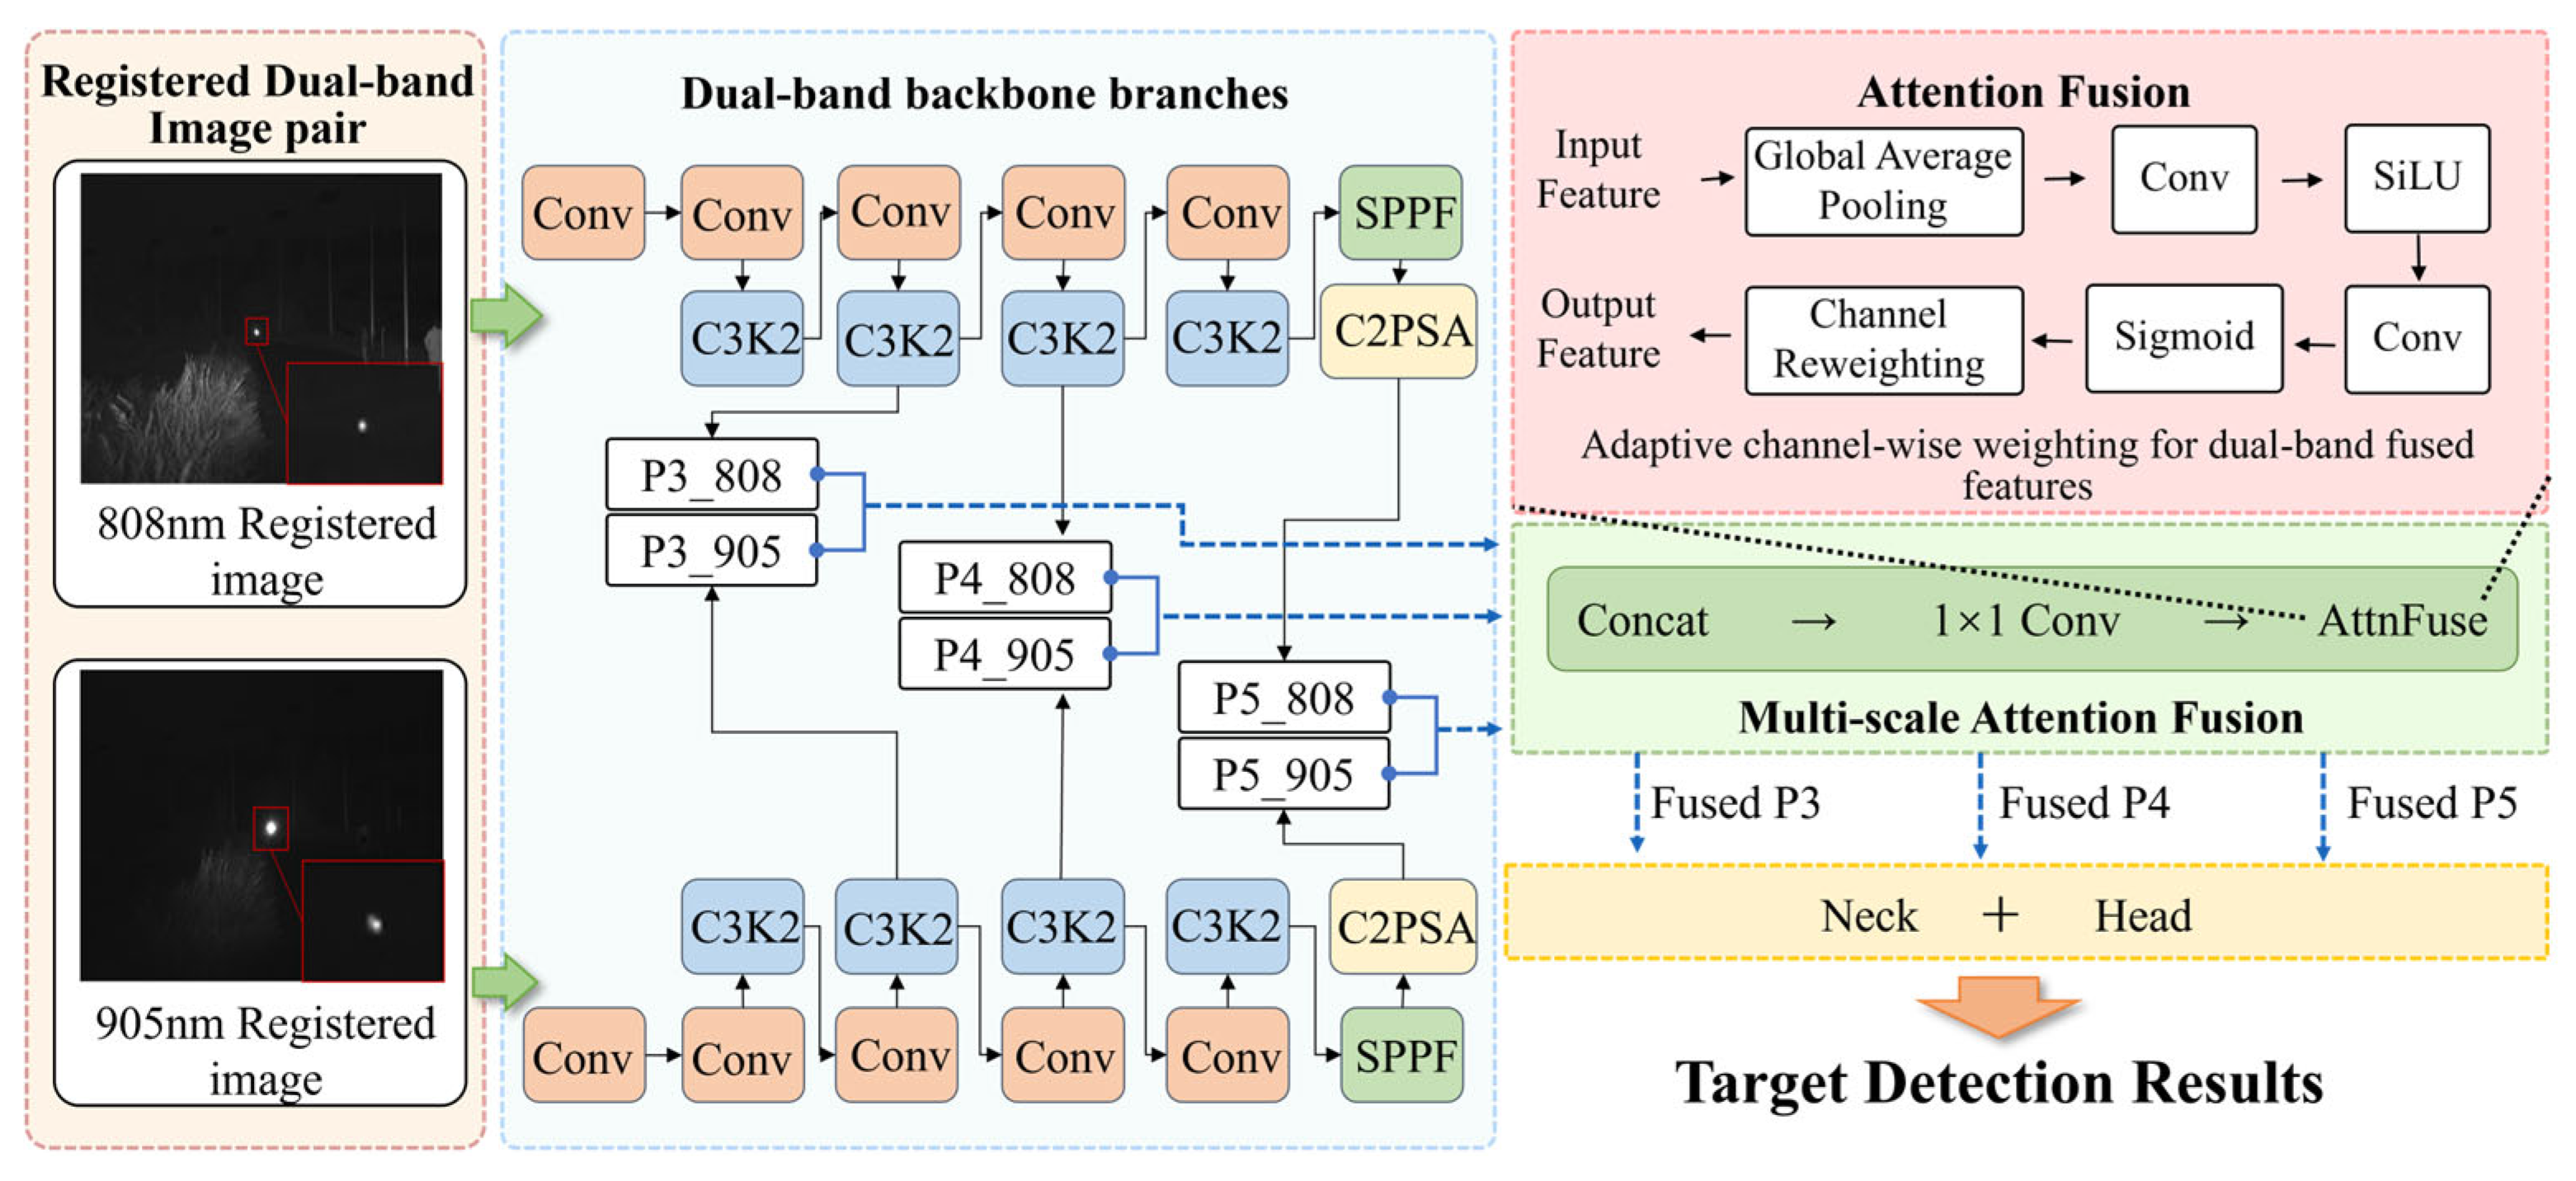
The deep-learning-based detection path uses YOLO11 because its dense, multi-scale grid predictions are suitable for locating sparse, pixel-level echo spots, and its architecture supports the symmetric dual-branch fusion design adopted in this paper. A quantitative comparison of YOLO11 with representative alternative architectures is presented in Section 4.2. Building on this foundation, this paper constructs the dual-branch, multi-scale attention fusion network shown in Figure 4. Unlike early fusion methods that directly concatenate multispectral images at the input and use a single backbone network, this network establishes structurally symmetric and mutually independent backbone branches for the registered 808 nm and 905 nm images. Each branch independently extracts both shallow and deep features from its corresponding wavelength image to reduce premature coupling of statistical distributions across different wavelength bands during the early convolutional stages and to preserve the band-specific characteristics. Each branch outputs feature maps at three scales—P3, P4, and P5—for subsequent multiscale, cross-wavelength interaction.
At each corresponding scale, the feature maps from the two branches are first concatenated along the channel dimension—for example, P3_808 and P3_905—then undergo channel compression and preliminary distribution alignment via a convolution, before being fed into the AttnFuse module for adaptive channel reweighting. Since the response asymmetry caused by chromatic aberration varies with detection distance and target state, the relative reliability of the two bands is not fixed. To accommodate these inter-sample variations, AttnFuse draws on the channel attention mechanism [48] to dynamically generate weights through a sequence of global average pooling, convolution, SiLU activation, and Sigmoid gating. The fused multiscale feature maps FusedP3, FusedP4, and FusedP5 are then fed into the neck network and detection heads of the original YOLO11 to output the positions, classes, and detection confidence scores of candidate targets. The network improvements in this paper focus on the dual-band feature modeling and fusion stages, while the detection head remains unchanged, preserving compatibility with the original framework while incorporating dual-band information. Compared to existing YOLO-based active object detection methods [17], this symmetric dual-branch structure preserves band-specific representations prior to fusion, enabling subsequent modules to utilize information related to the asymmetry of physical responses.
Given that the sampling scale, energy distribution, signal-to-noise ratio, image quality, and background interference of targets vary significantly at different detection distances, this paper further employs a distance-stratified training strategy. Specifically, the dataset is divided into several distance subsets, and a corresponding detector is configured and trained separately for each subset. This design follows the scale-specific training principle in object detection, which states that a single detector covering a wide range of scale variations typically performs worse than models trained for specific scales [49]. Distance stratification thus reduces the difficulty of a single model fitting the data distribution across different distances and improves the model’s stability under corresponding distance conditions. It should be noted that this strategy is an engineering implementation adopted to accommodate differences in target sampling scale, signal-to-noise ratio, and image quality caused by distance variations; it does not imply that the ideal normalized dual-band power ratio in Equation (10) is physically dependent on distance. Since the inference process requires invoking the corresponding detectors and classifiers based on distance information, the specific implementation in this paper falls under the category of range-conditioned methods.
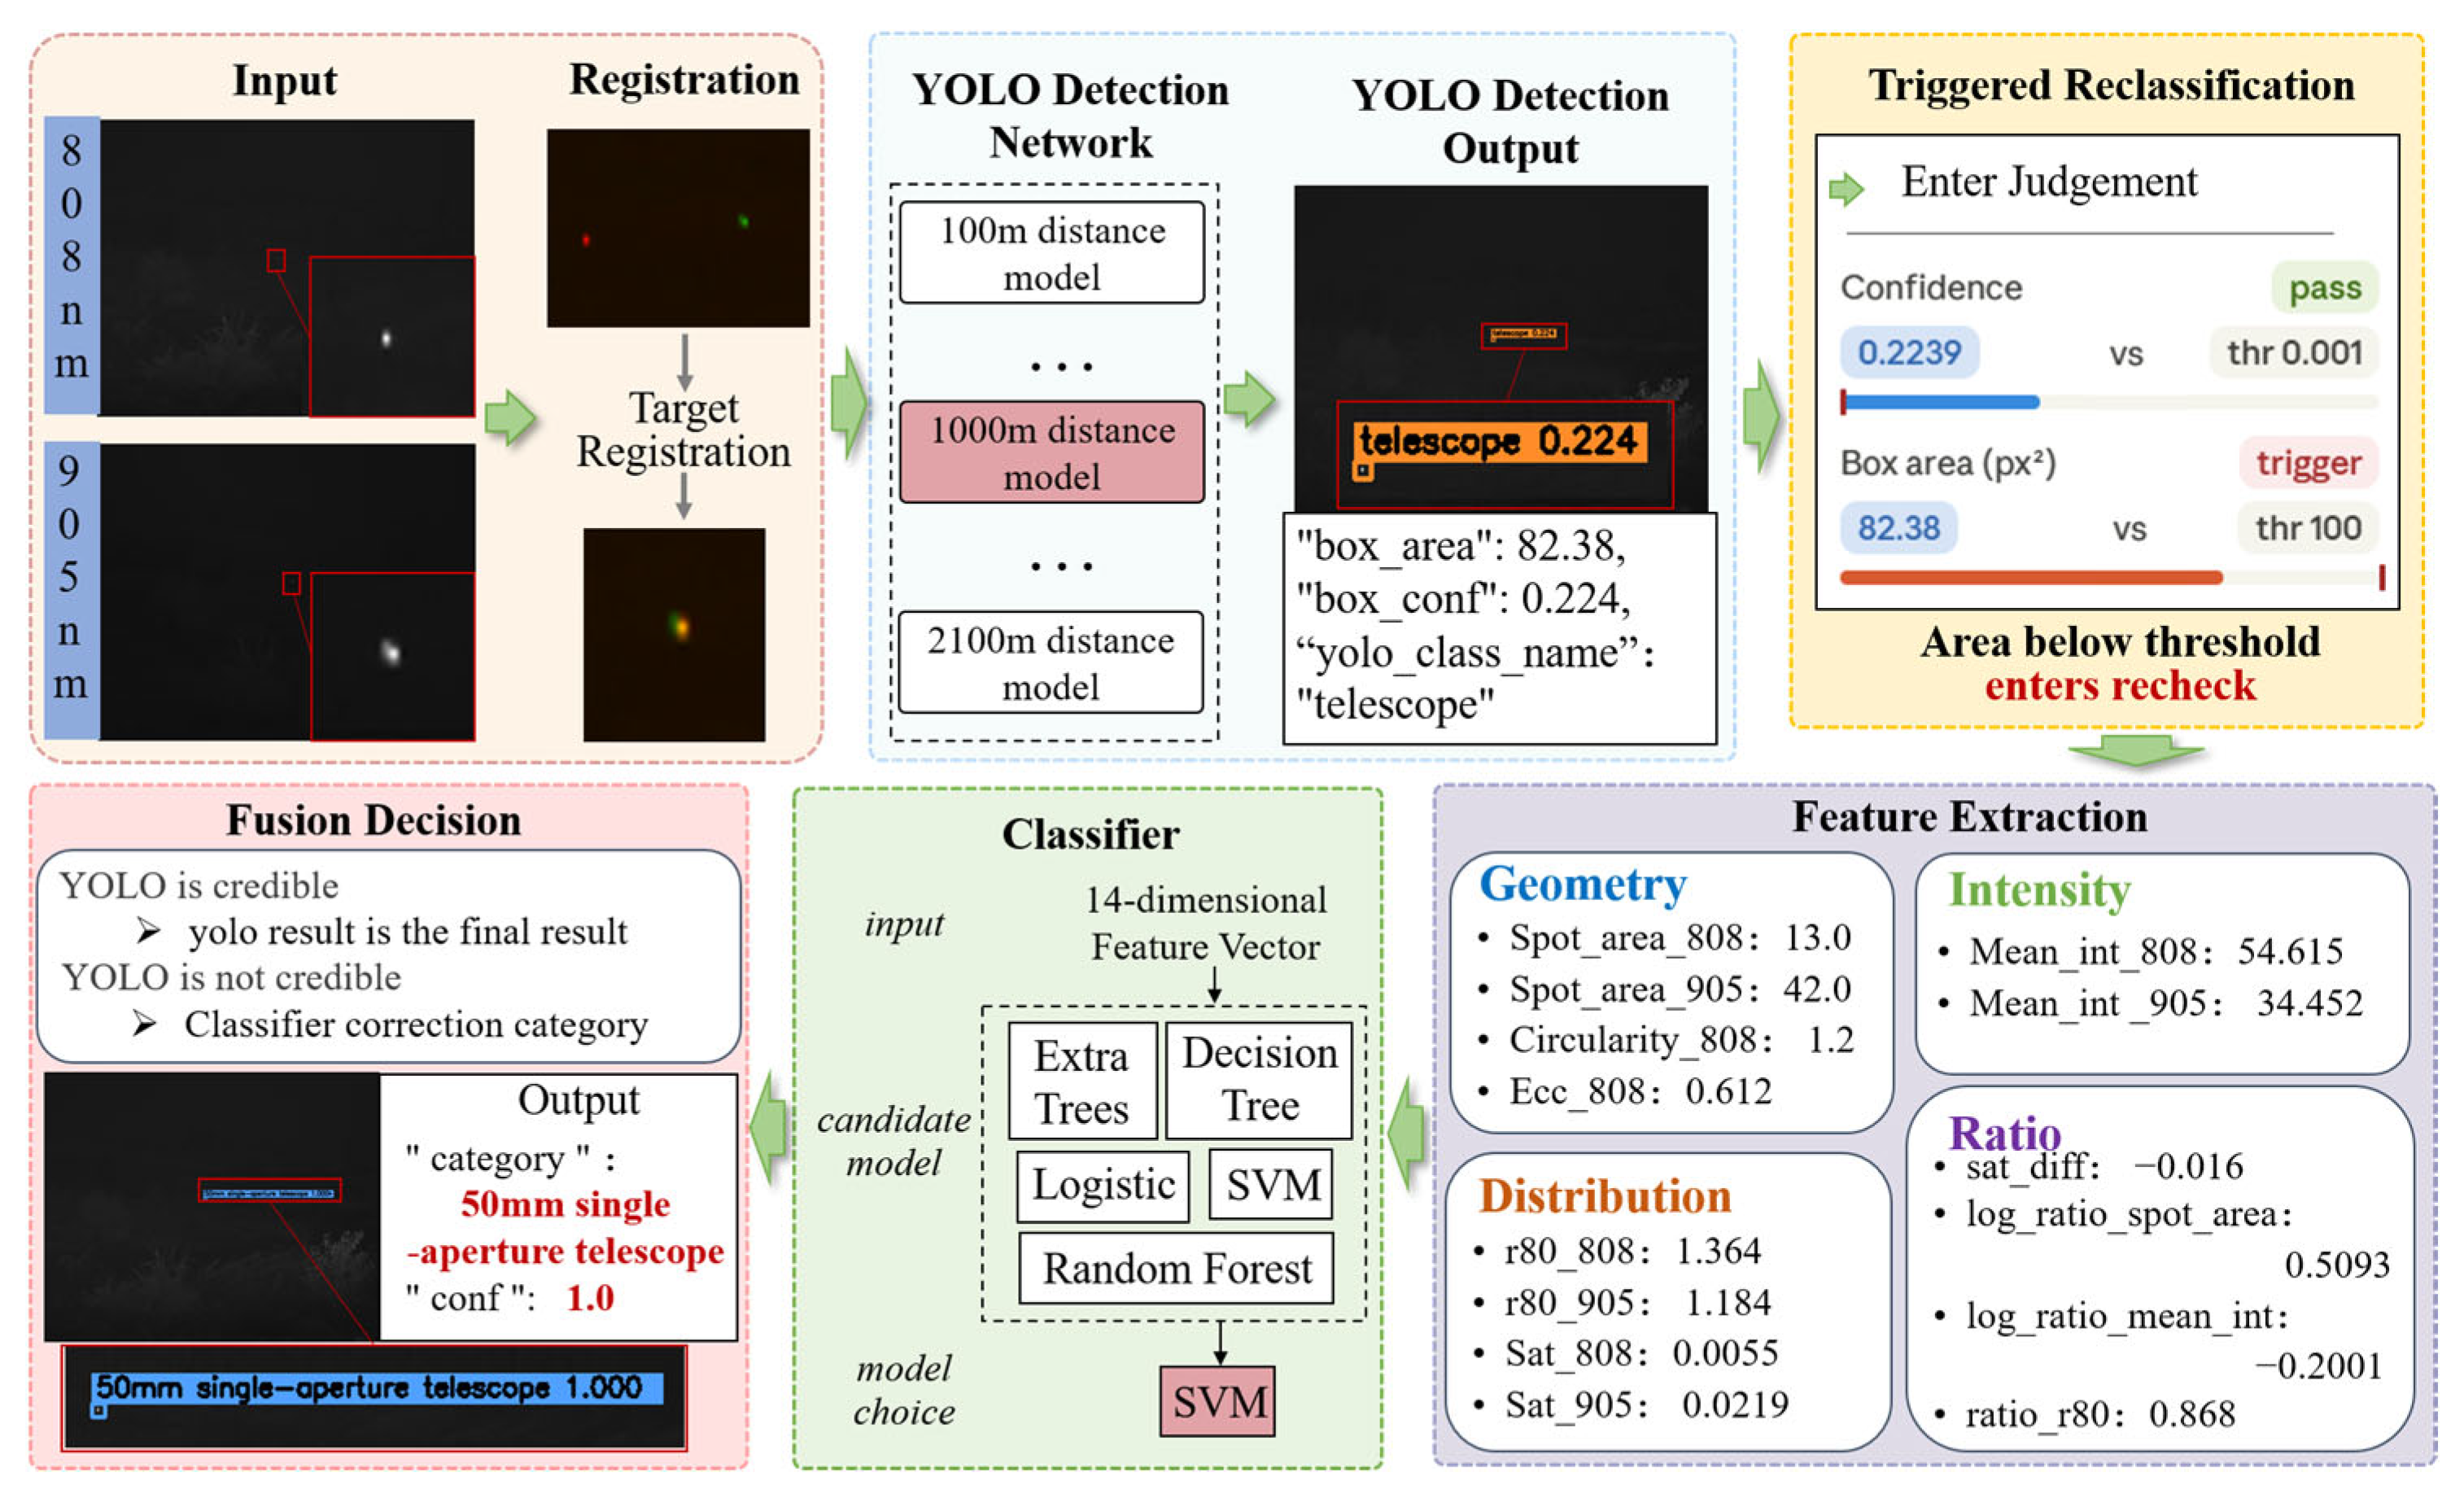
Although the detection network described above is capable of localizing and preliminarily classifying candidate targets, misclassifications may still occur for low-confidence samples, weak-response samples at long distances, and challenging samples near class boundaries when relying solely on the deep detection head. Therefore, this paper introduces the explicit feature reclassification and fusion module shown in Figure 5 following the detection network. For each candidate region output by the detection network, this module constructs a 14-dimensional explicit candidate feature pool within its region of interest (ROI). These include single-band features—such as spot area, average intensity, 80% energy radius, and saturation pixel ratio—extracted from the 808 nm and 905 nm images, respectively; cross-band response asymmetry features—including area ratio, intensity ratio, radius ratio, and saturation difference; and main connected component shape features—such as roundness and eccentricity. These features are derived from the dual-band imaging mechanism and can directly describe the energy distribution and morphological differences of different target classes across the two bands. The approach of using multidimensional explicit features to distinguish target attributes is methodologically consistent with research on optical target reconnaissance and attitude recognition based on active laser jamming [44]; both emphasize the construction of interpretable discriminants under physical a priori constraints.
The explicit feature classifier follows the distance-based stratification method described earlier, establishing separate classifiers for each distance group ranging from 100 to 2100 m. The classifiers only accept numerical features extracted from candidate ROIs and filtered according to the corresponding distances; they do not use full-scene images or global background information. Given that each distance group contains at most a few hundred training samples, this paper employs traditional machine learning methods [50] that typically remain competitive on small-scale tabular data. Candidate models include ExtraTrees, random forests, support vector machines, logistic regression, and decision trees, covering various inductive biases such as ensemble, rule-based, margin-based, and linear approaches.
Within a predefined search space, Bayesian optimization is used to jointly select a subset of 14-dimensional candidate features, the classifier type, related hyperparameters, and class weights. Model selection employs a fixed random seed of 3407 and implements nested stratified cross-validation within the training data of each distance group, with up to 5 outer folds and 3 inner folds. Each search run consists of up to 420 trials; after at least 25 trials have been completed, the search is terminated early if the performance improvement in 20 consecutive trials does not exceed 10 4 . The inner-layer cross-validation is used to select features, models, and hyperparameters, while the outer-layer folds—which are completely independent of the inner-layer search—are used to estimate the generalization ability of the entire selection process, thereby reducing the risk of overfitting to the model selection criteria themselves [51]. Nested cross-validation is performed only within the training sets of each distance group. After determining the optimal model type, feature subset, and hyperparameters, the classifier is refitted on the complete training set of the corresponding distance group, while the independent test set remains isolated until the final evaluation.
During the inference phase, the system invokes the appropriate detectors and classifiers based on distance information. When the detection confidence or the area of a candidate bounding box falls below the trigger threshold for that distance group, a secondary discrimination process is initiated. Subsequently, the range-matched classifier evaluates the candidate ROIs under two preset feature extraction conditions and calculates the product of each branch’s classification confidence and the probability margin relative to the next-highest category, retaining the branch with the higher value of this metric. Given that the cost of missing cat-eye targets is higher, the fusion decision assigns a moderate preference to cat-eye target predictions. Only when both the confidence predicted by the classifier and the classification margin exceed the acceptance threshold for the corresponding distance group does the reclassification result replace the original detection output; otherwise, the detector’s result is retained. The trigger and acceptance thresholds for each distance group are determined independently on the validation set, with selection based on the improvement in mAP50–95 of the full reclassification process relative to the baseline without reclassification. This strategy applies reclassification to difficult candidate regions selected by the triggering conditions. The selected explicit features, range-matched classifier, and triggering and acceptance policies jointly constitute the post-detection reclassification stage.

3.3. Definition of Dual-Band Asymmetry Features

The target’s echo spot has two key physical characteristics: spot area and average intensity. A λ is defined as the total number of valid pixels within the target echo mask after adaptive threshold segmentation and is calculated as follows:
A λ = ( i , j ) R O I Γ ( M λ ( i , j ) = 1 )
where λ denotes the band (808 nm or 905 nm) and Γ ( ) is the indicator function. This feature directly reflects the spatial extent of the target on the image plane.
The mean intensity I λ is the average background-subtracted signal intensity across all pixels within the target mask:
I λ = 1 A λ ( i , j ) M λ [ P λ ( i , j ) B λ ]
where P λ ( i , j ) is the raw pixel intensity and B λ the ROI background intensity, characterizing the net return energy level of the target in the given band. During feature extraction, pixels with grayscale values greater than or equal to 245 were treated as saturated to accommodate small fluctuations caused by dark-current noise and ambient stray light.
As established in Section 3.1, Equation (10) describes an ideal calibrated return-power relationship in which chromatic defocus is the target-related mechanism of primary interest. The mean intensities extracted from the images are measurement-domain proxies for the two band returns and may additionally be affected by saturation, background subtraction, the point-spread function, sampling, registration, and other system and processing errors. In the classifier, the intensity-asymmetry descriptor is defined as
d I = l g ( I 905 I 808 )
where I 808 and I 905 denote the background-subtracted mean intensities of the target ROI in the 808 nm and 905 nm bands, respectively. The common-logarithmic transformation converts the multiplicative band ratio into an additive feature and compresses its dynamic range, thereby facilitating classifier learning. This image-domain descriptor is not assumed to remain numerically invariant across different detection ranges.

3.4. Experimental Setup and Implementation Details

The dual-band active-detection system used in this study was independently developed by the research team of this paper. The field dataset was collected in multiple rounds from August to October 2025, covering three distance categories—near, medium, and far—and the corresponding three scene configurations. It comprises a total of 10 target classes, with each class represented by a single physical sample. The models and manufacturers of the true-target specimens are subject to project confidentiality and therefore cannot be disclosed. The false targets were common objects typically found in urban built environments. To control interference from the scene background on class classification, within each fixed distance group, the imaging position, observation direction, system configuration, and scene background were kept constant; only the cat-eye targets and dummy targets were sequentially swapped within the designated test area. Consequently, different target classes within the same distance group share the same scene background, thereby reducing the likelihood that the model will mistakenly learn background information as class features. To prevent data leakage caused by continuous acquisition sequences, the dataset was partitioned according to the original acquisition blocks. Consecutive raw frames within the same acquisition block and their generated dual-band samples were assigned in their entirety to the same dataset subset, without spanning the training, validation, and test sets. Table 2 shows the training configurations, software and hardware environments, acquisition parameters, and the corresponding dataset compositions for the experimental results in Section 4. During the experiments, considering that the 808 nm and 905 nm near-infrared lasers could cause retinal damage, all data acquisition was conducted within a controlled test area, and the equipment used operated solely as a research prototype. Therefore, the results presented in this paper should not be interpreted as evidence of the device’s inherent ocular safety, compliance with Class 1 laser safety standards, or suitability for use in uncontrolled public environments [52,53,54].

4. Results and Discussion

4.1. Range Evolution of Dual-Band Response Asymmetry

The false-target types examined in Figure 6, Figure 7, Figure 8 and Figure 9 represent the seven compact high-return categories included in the present dataset rather than the full material diversity of an urban background. Architectural glazing and metallic structures are used only as motivating examples and were not included as physical specimens in the present experiments. Accordingly, the following analysis is restricted to the evaluated target categories.
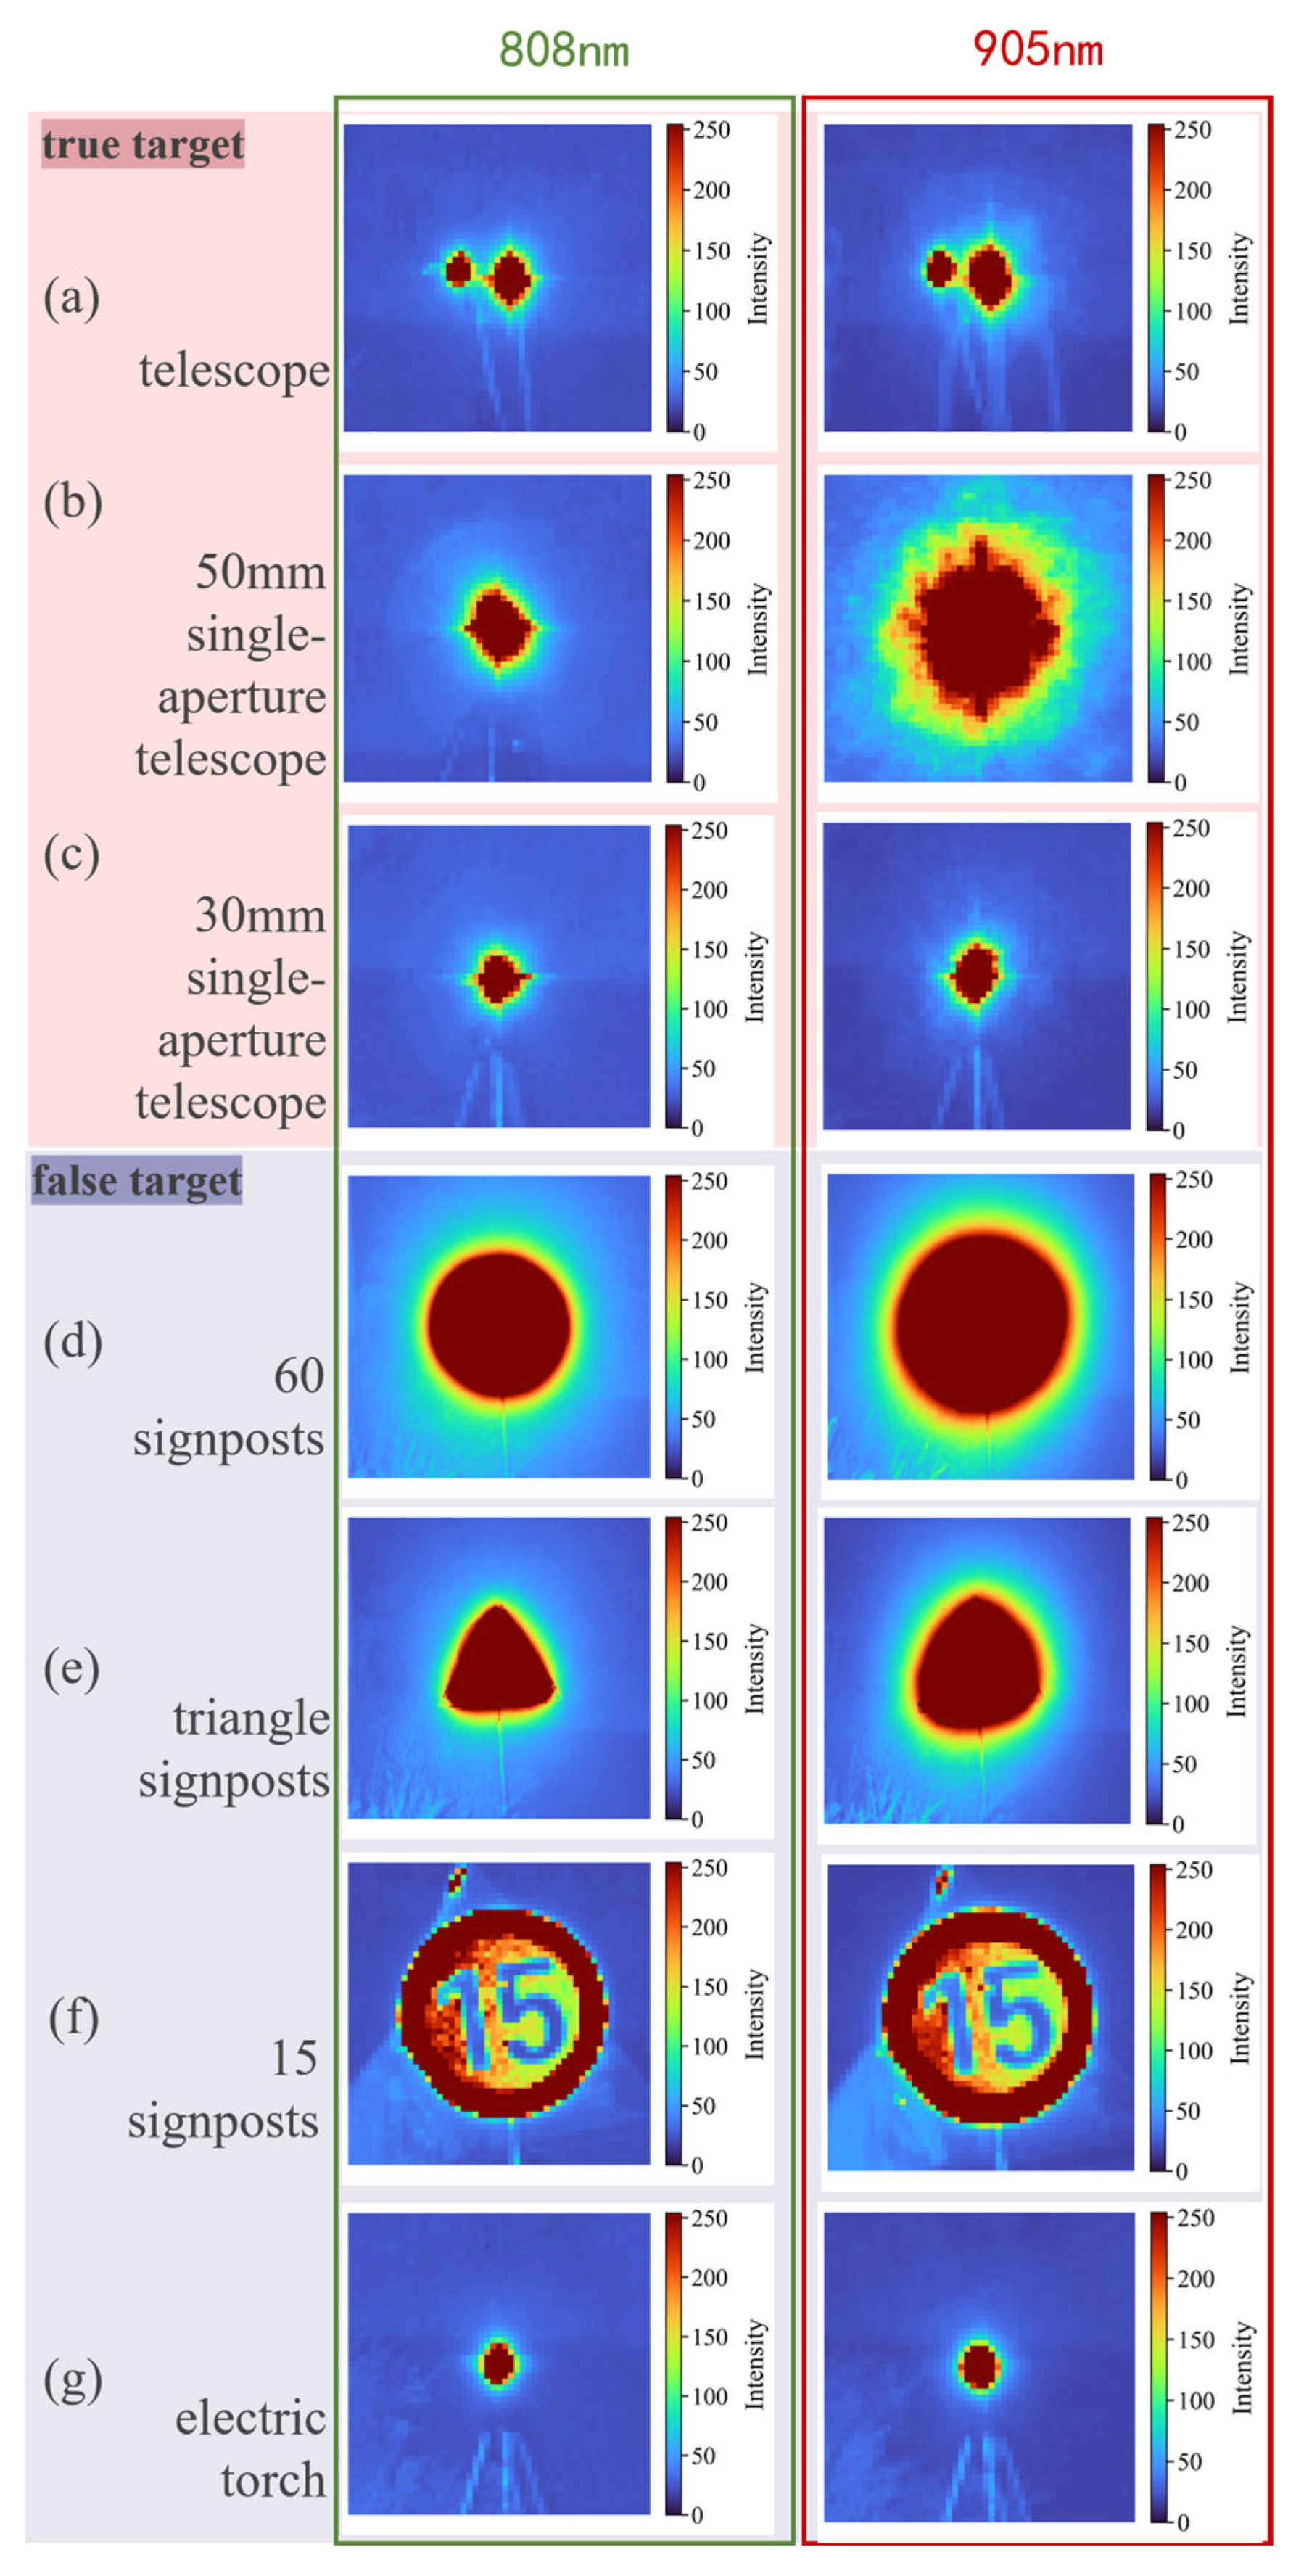
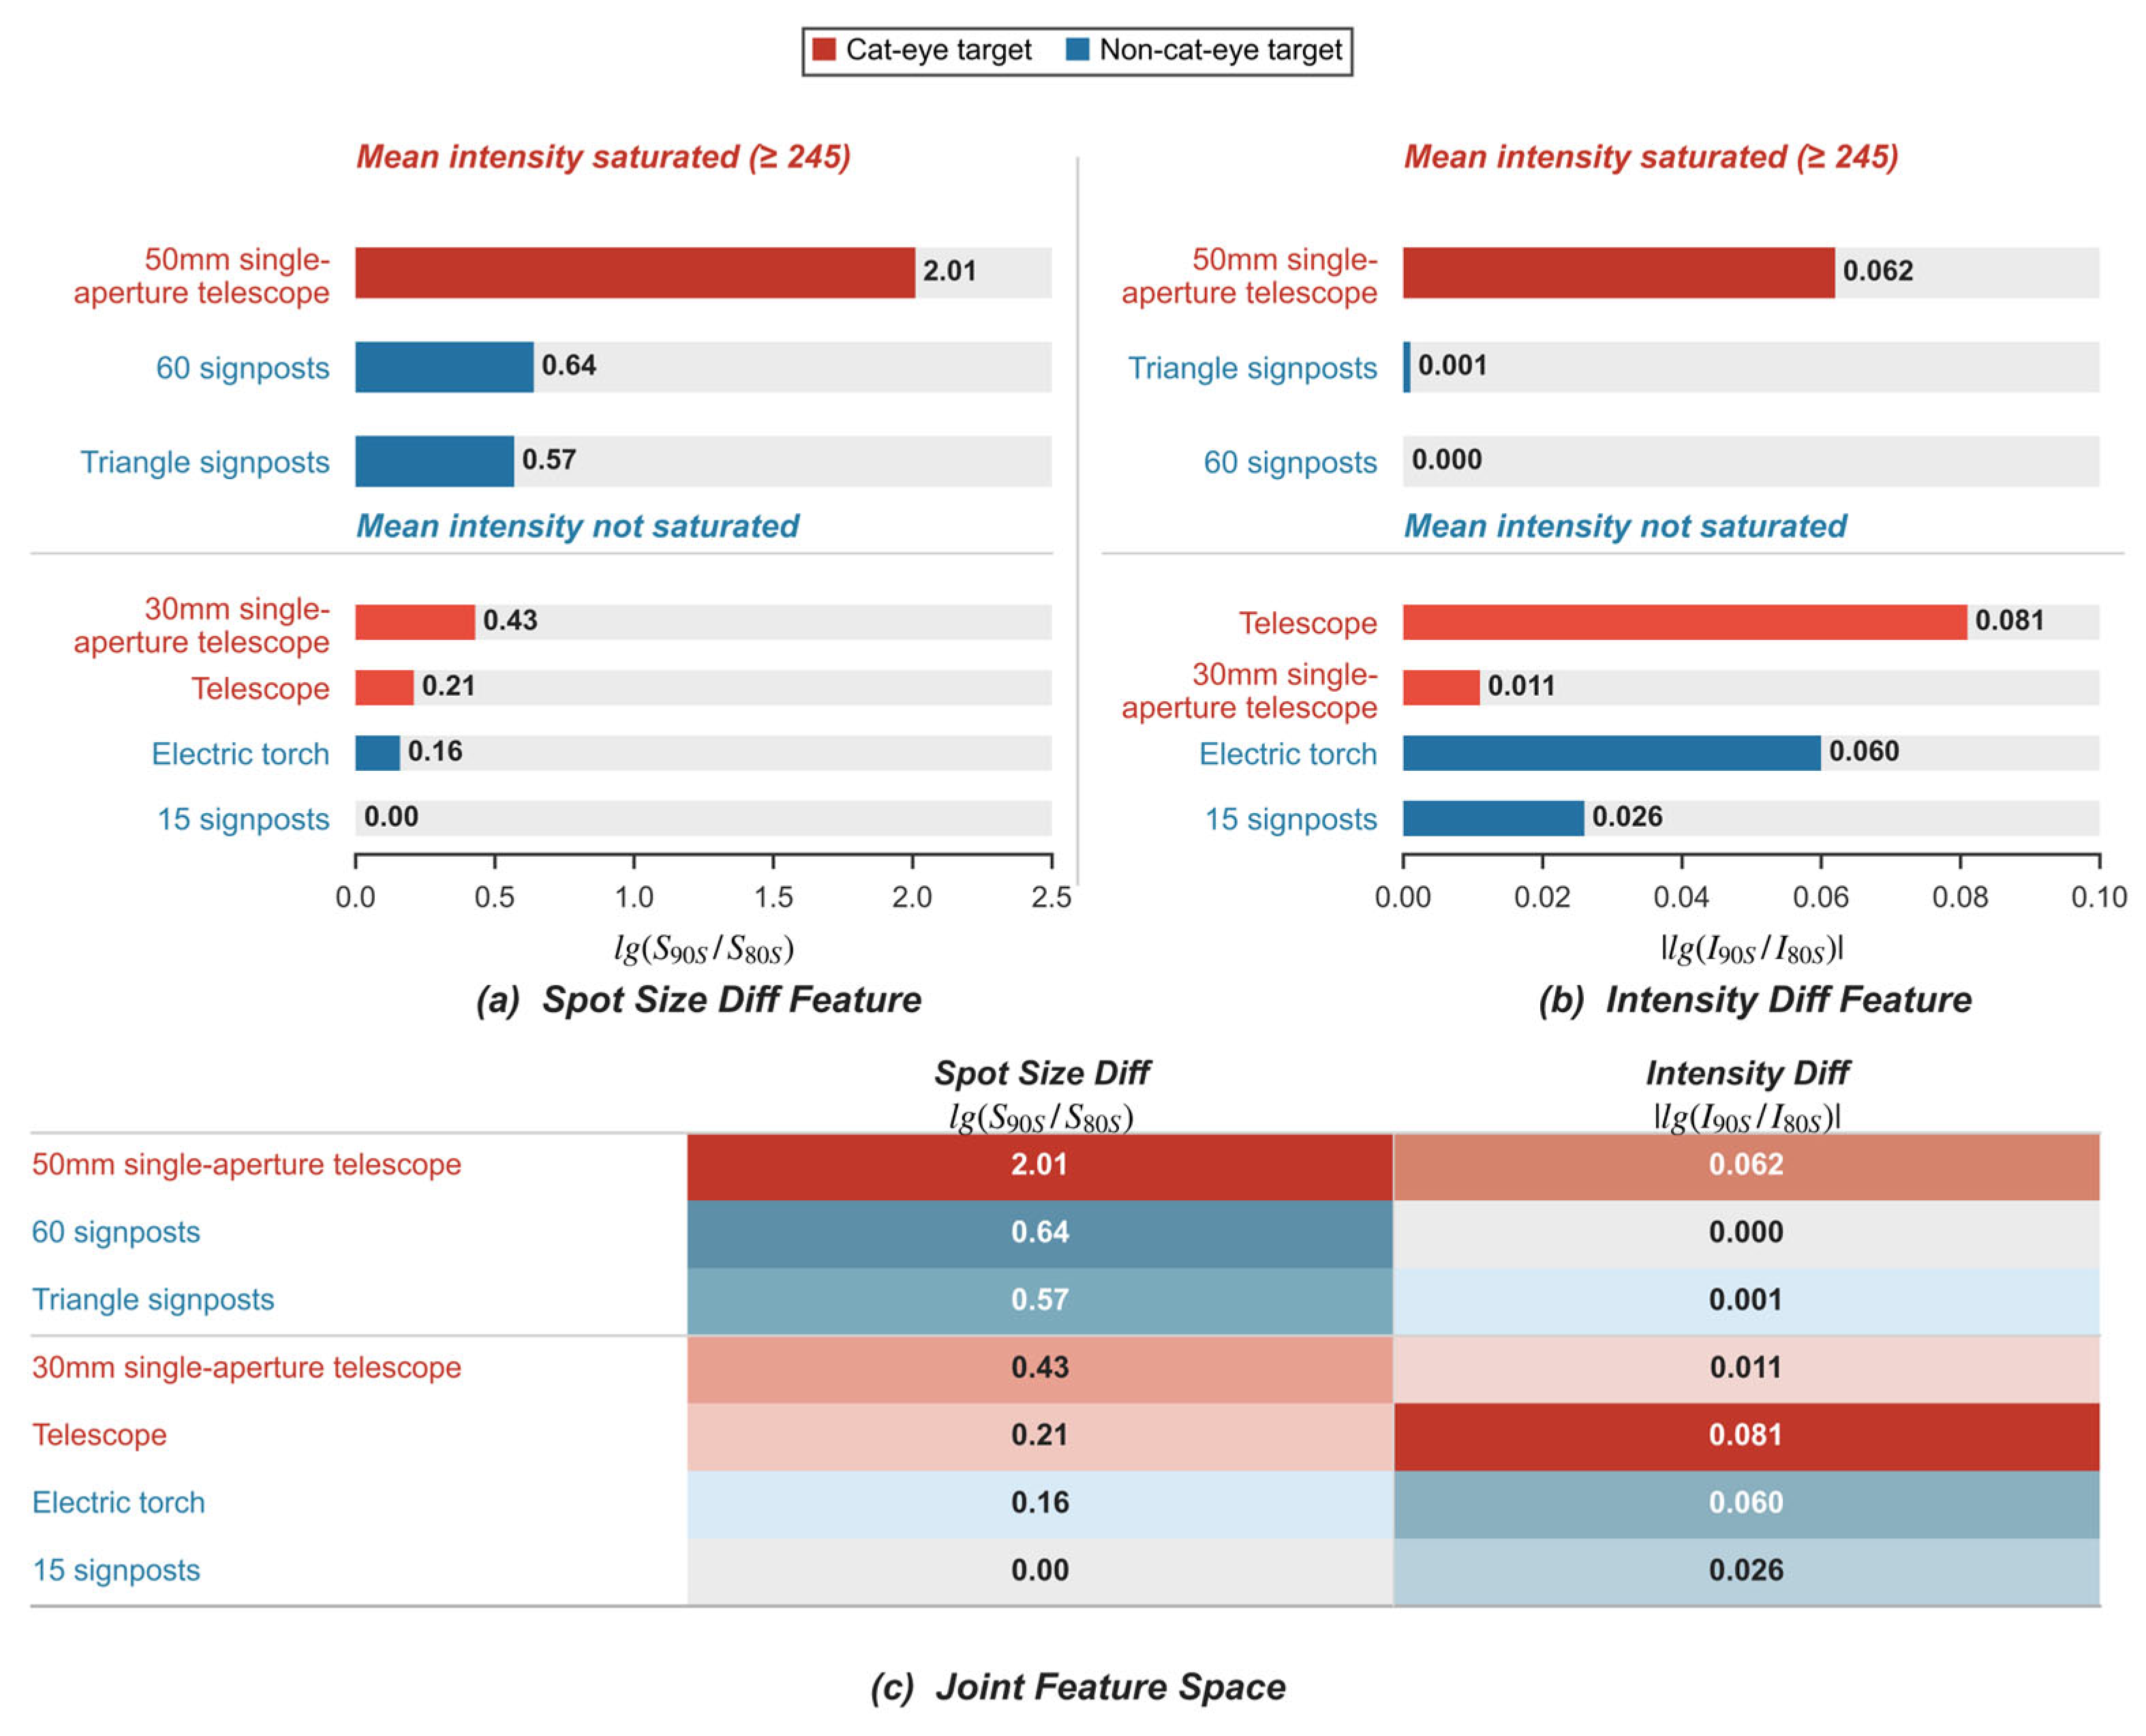
Figure 6 presents qualitative dual-band return-spot examples of different target types at the 100 m near-field range. The visually conspicuous difference of the 50 mm single-aperture telescope in panel (b) is caused by two superimposed effects. Its large aperture and internal focusing structure produce a strong cat-eye return with a wavelength-dependent spatial energy distribution, while the particularly strong 905 nm response also enters a more severe saturation regime. Saturation-related spillover and spatial expansion of clipped pixels further amplify the apparent spot-size difference; thus, panel (b) should not be interpreted as a pure measure of chromatic defocus. The 60 signposts and triangle signposts in panels (d,e) also contain saturated regions, so their two-band spot contours are not perfectly identical. Their residual apparent area and contour differences are primarily associated with saturation spillover and threshold-linked expansion rather than cat-eye-like chromatic defocus. The weaker visual differences of the standard telescope and the 30 mm single-aperture telescope reflect their lower return levels, weaker saturation, and the deliberately small 97 nm separation between the two probing wavelengths. Figure 7a,b quantitatively characterize the scale-difference and intensity-difference features for each target class, respectively, while Figure 7c maps these features into a joint feature space to demonstrate their combined discriminative effect.
As can be observed, Figure 7 distinguishes between saturated (mean intensity ≥ 245) and unsaturated regimes. In the saturated regime, the 50 mm single-aperture telescope exhibits a spot-size difference of 2.01 and a mean-intensity difference of 0.062, both of which deviate significantly from the cross-band symmetric reference state. In contrast, the 60 signposts and triangle signposts display spot-size differences of 0.64 and 0.57, respectively, while their mean-intensity differences remain nearly zero (0.000 and 0.001). The non-zero scale differences of these false targets are mainly associated with saturation-related spillover and threshold-linked spot expansion, rather than with cat-eye-like chromatic defocus. Accordingly, although they show limited spatial-scale variations, their mean-intensity asymmetries remain close to zero and differ from the coupled scale-and-intensity response observed for the cat-eye target.
In the unsaturated regime, the 30 mm single-aperture telescope exhibits a spot-size difference of 0.43 and a mean-intensity difference of 0.011, while the standard telescope shows corresponding values of 0.21 and 0.081. Although the numerical values vary with aperture size due to different optical parameters and defocus amounts, both true targets consistently deviate from the symmetry-reference region in the joint feature space. Meanwhile, the electric torch (spot-size difference 0.16, intensity difference 0.060) and the 15 signposts (spot-size difference 0.00, intensity difference 0.026) represent two typical false-target patterns. The 15 signposts exhibit an almost symmetric spatial response between the two bands, making them clearly separable in the spot-scale dimension. The electric torch represents a more challenging case: its intensity difference (0.060) approaches that of some true targets, such as the 50 mm single-aperture telescope (0.062), but its spot-size difference (0.16) remains below the true-target minimum of 0.21. Therefore, it lies in a marginal but still distinguishable region of the joint feature space.
These observations indicate that true cat-eye targets tend to produce coupled cross-band asymmetry in both spatial scale and intensity, whereas false targets usually preserve approximate symmetry in at least one of these dimensions. This explains why a two-dimensional joint discrimination strategy is necessary rather than relying on a single intensity- or scale-based criterion. Early studies have also shown that combining shape and modulation features can effectively improve the robustness of target recognition under near-field conditions [6]. This paper further extends this idea to a multi-dimensional joint discriminant framework based on dual-band physical response asymmetry.
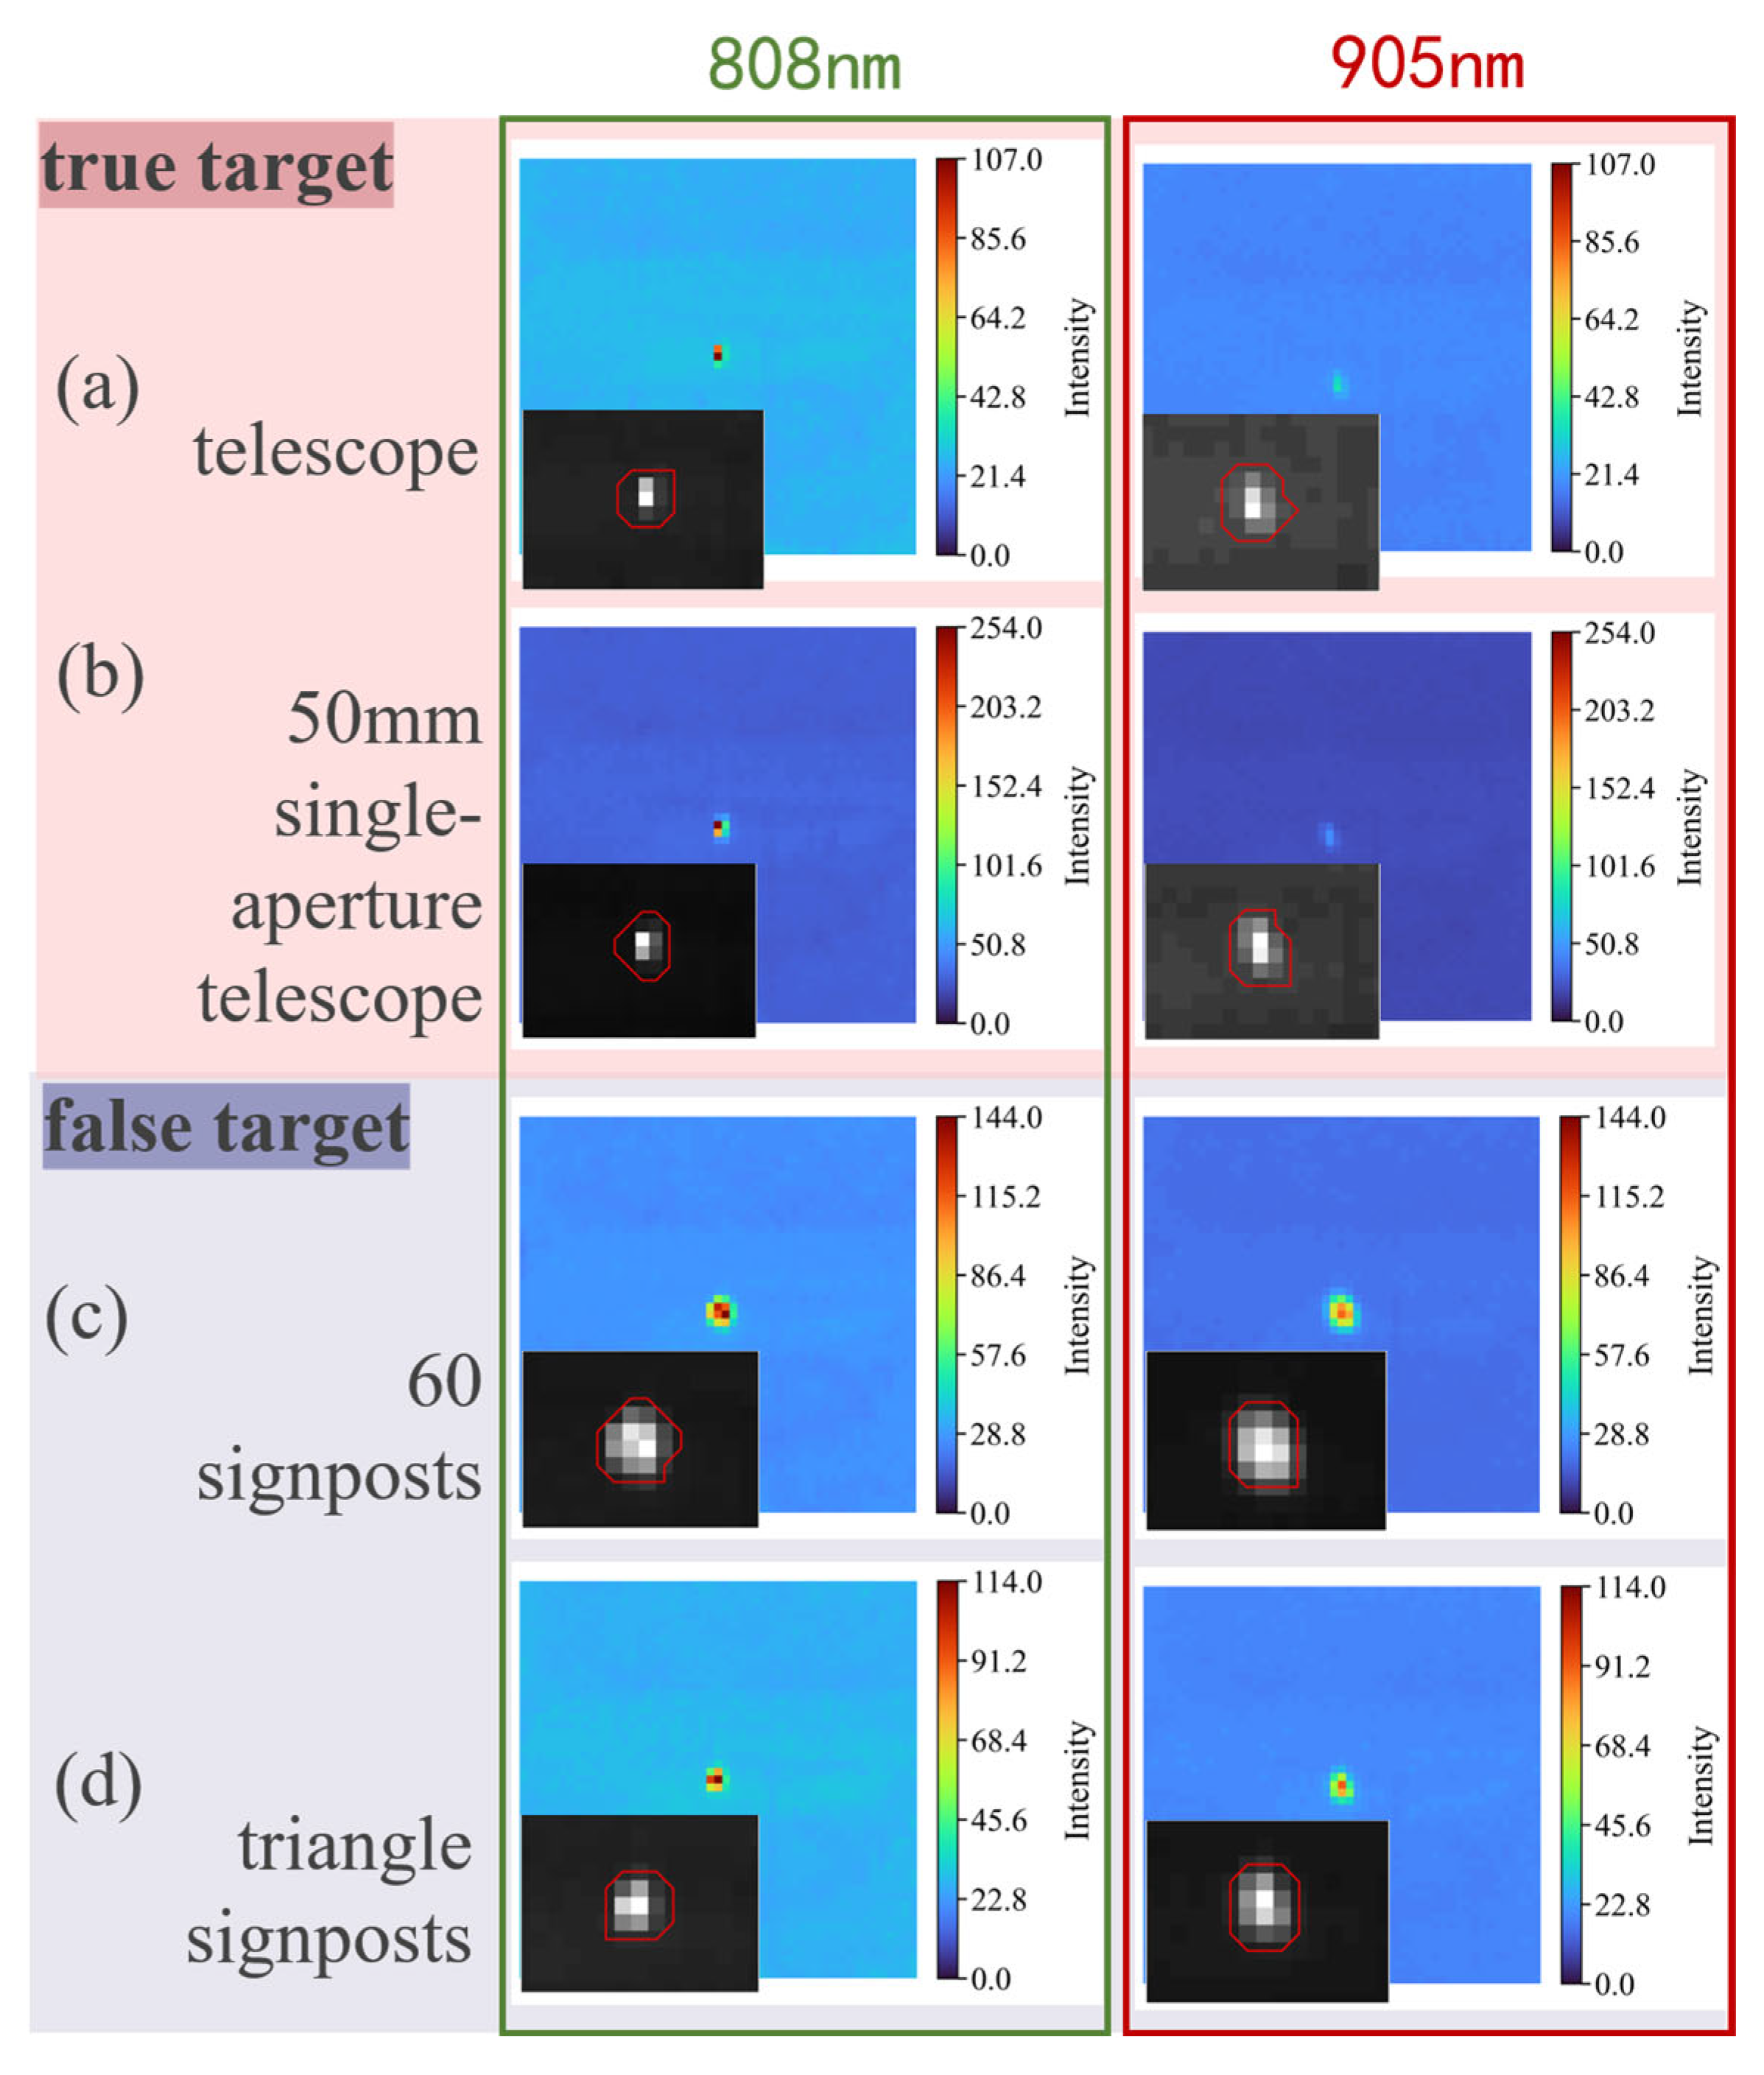
In the ideal dual-band power ratio, the common R 4 term is canceled out, but the residual atmospheric factor C a R and image domain measurement errors may still vary with distance. Therefore, Figure 8 and Figure 9 reflect the actual response characteristics observed at 2100 m under the data acquisition conditions of this study, rather than a direct verification of strict distance invariance of the power ratio. Since the 30 mm single-aperture telescope, the 15 signposts, and the electric torch did not produce usable echoes at this distance, the long-range analysis includes only those target categories that could still be reliably observed.
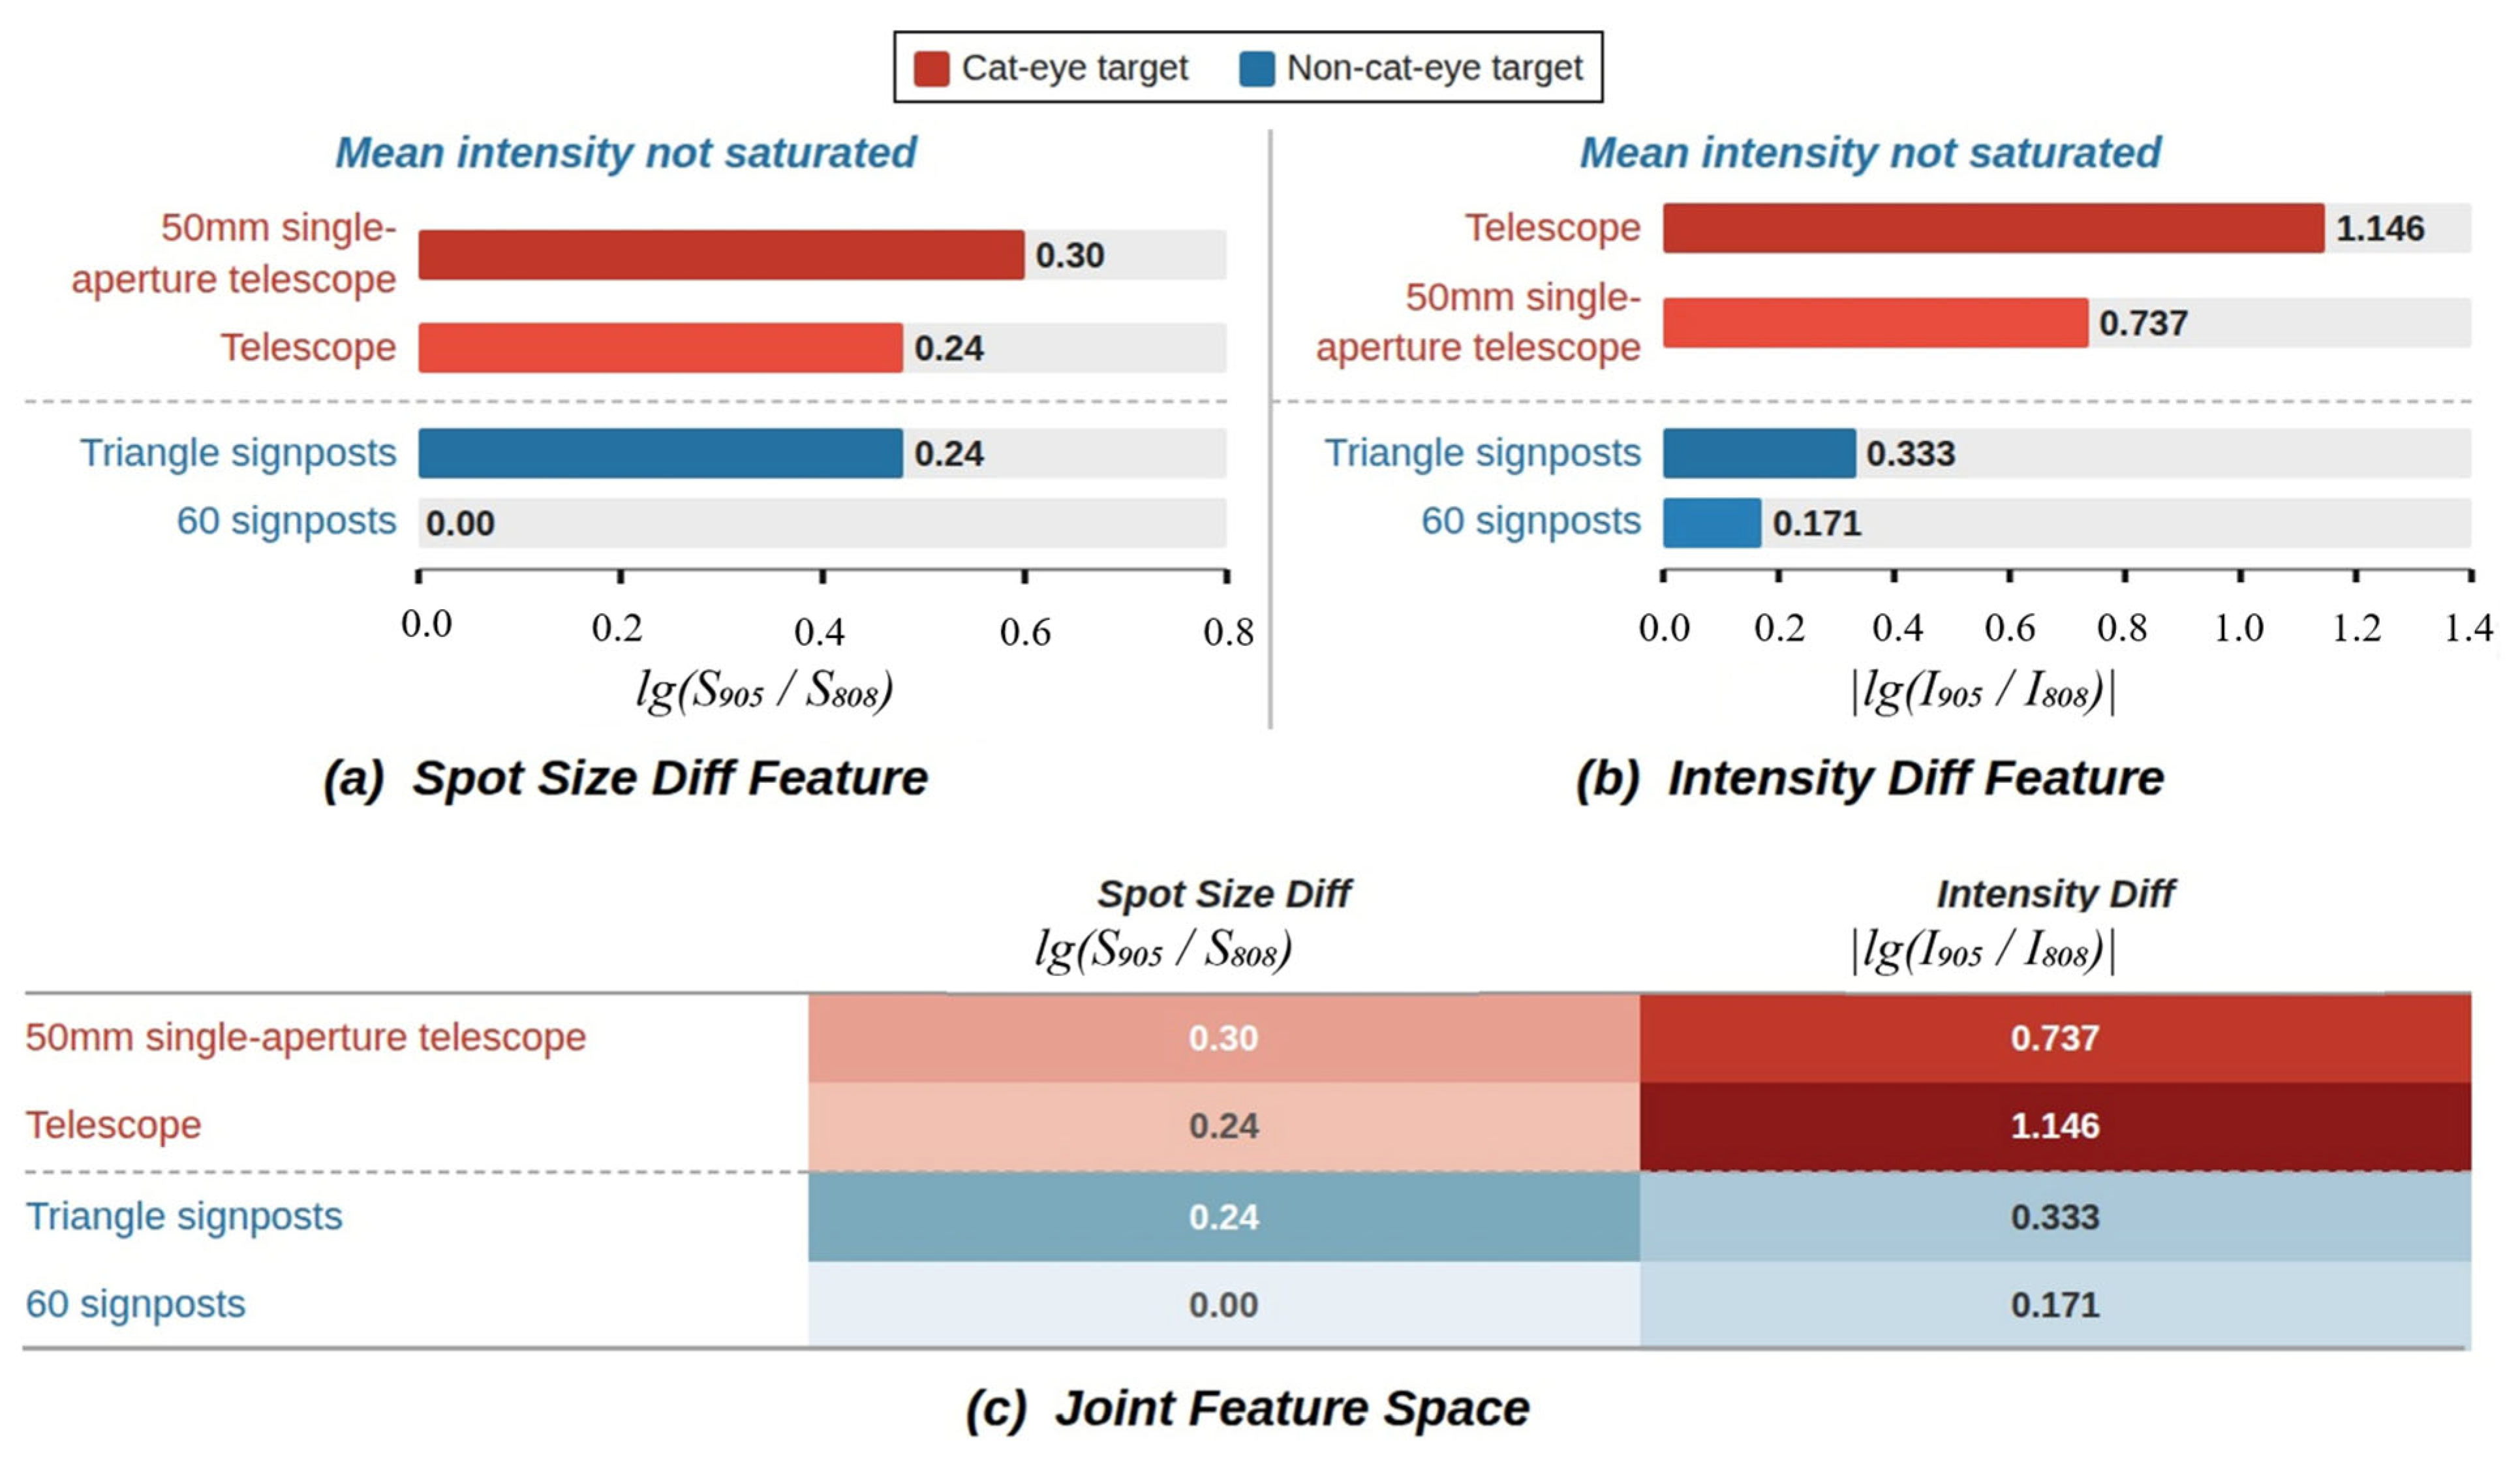
At 2100 m, the scale range of the cat-eye targets narrowed to 0.24–0.30, while false targets were distributed between 0 and 0.24; a narrow boundary between the two target types remained only near 0.24. In contrast, the intensity difference for cat-eye targets reached 0.737–1.146, significantly higher than that of false targets (0.171–0.333). Thus, as the detection distance increases, the primary imaging manifestation of cat-eye response asymmetry gradually shifts from spot-size differences at close range to intensity differences at long range.
This change is consistent with the dual-band propagation and imaging processes. The inter-band response relationship of cat-eye targets is constrained by internal chromatic aberration-induced defocus; when the absolute echo attenuates with distance and degenerates into a small number of pixels, the differences in spot size become more susceptible to sampling and noise effects, while the intensity ratio retains a more pronounced class distinction. Although false targets also exhibit inter-band differences due to material reflectance, atmospheric transmission, detector response, and processing residuals, in the evaluated samples, these factors did not eliminate the overall separation between them and cat-eye targets. Therefore, at long ranges, scale differences serve only as secondary cues, while the asymmetry in intensity response becomes the primary criterion.

4.2. Target Detection and Classification Performance

To evaluate the suitability of YOLO11 as a baseline detector, we further compared representative alternative architectures under the same training conditions (Table 3). RT-DETR [55] differed from YOLO11 by no more than 2 percentage points in mAP50–95 across both wavelength bands. YOLO26 [56] achieves an mAP50 at 808 nm that is approximately 2.5 percentage points higher than that of YOLO11, but its recall at 905 nm and mAP50–95 decrease by approximately 12 and 3 percentage points, respectively. Since the dual-branch fusion approach in this paper requires both wavelengths to provide relatively reliable features, YOLO11’s more balanced performance across both wavelengths makes it a more suitable baseline architecture.
WaveMamba [57] directly takes registered 808/905 nm image pairs as input, but its mAP50 and mAP50–95 are 0.722 and 0.346, respectively—both lower than the two single-band YOLO11 baselines. Its recall is 0.729, slightly higher than the 0.720 of the 808-SB but lower than the 0.840 of the 905-SB. This suggests that cross-modal fusion architectures designed for natural images do not necessarily offer an advantage for pixel-level weak-echo targets.
To validate the effectiveness of the proposed dual-band recognition framework, five model configurations were compared, with the results summarized in Table 4. The five configurations are: 808-SB (808 nm single-band model), 905-SB (905 nm single-band model), DB-Concat (a dual-band detector that preserves separate 808 nm and 905 nm branches and uses direct feature concatenation without attention fusion), DB-MSAF (dual-branch multi-scale fusion detection model without explicit classifier), and DB-MSAF + Cls (joint discrimination algorithm, i.e., the complete proposed framework, hereafter also referred to as “Proposed”). DB-MSAF + Cls combines the DB-MSAF detector with the complete range-conditioned post-detection reclassification stage. Performance does not scale with the volume of input information alone; gains emerge only when the calibrated cross-band relationship and chromatic-defocus-induced response asymmetry are explicitly exploited. This improvement is primarily manifested at three levels: single-band bias correction, structurally symmetric dual-band representation, and explicit symmetry-breaking discriminative compensation for hard samples.
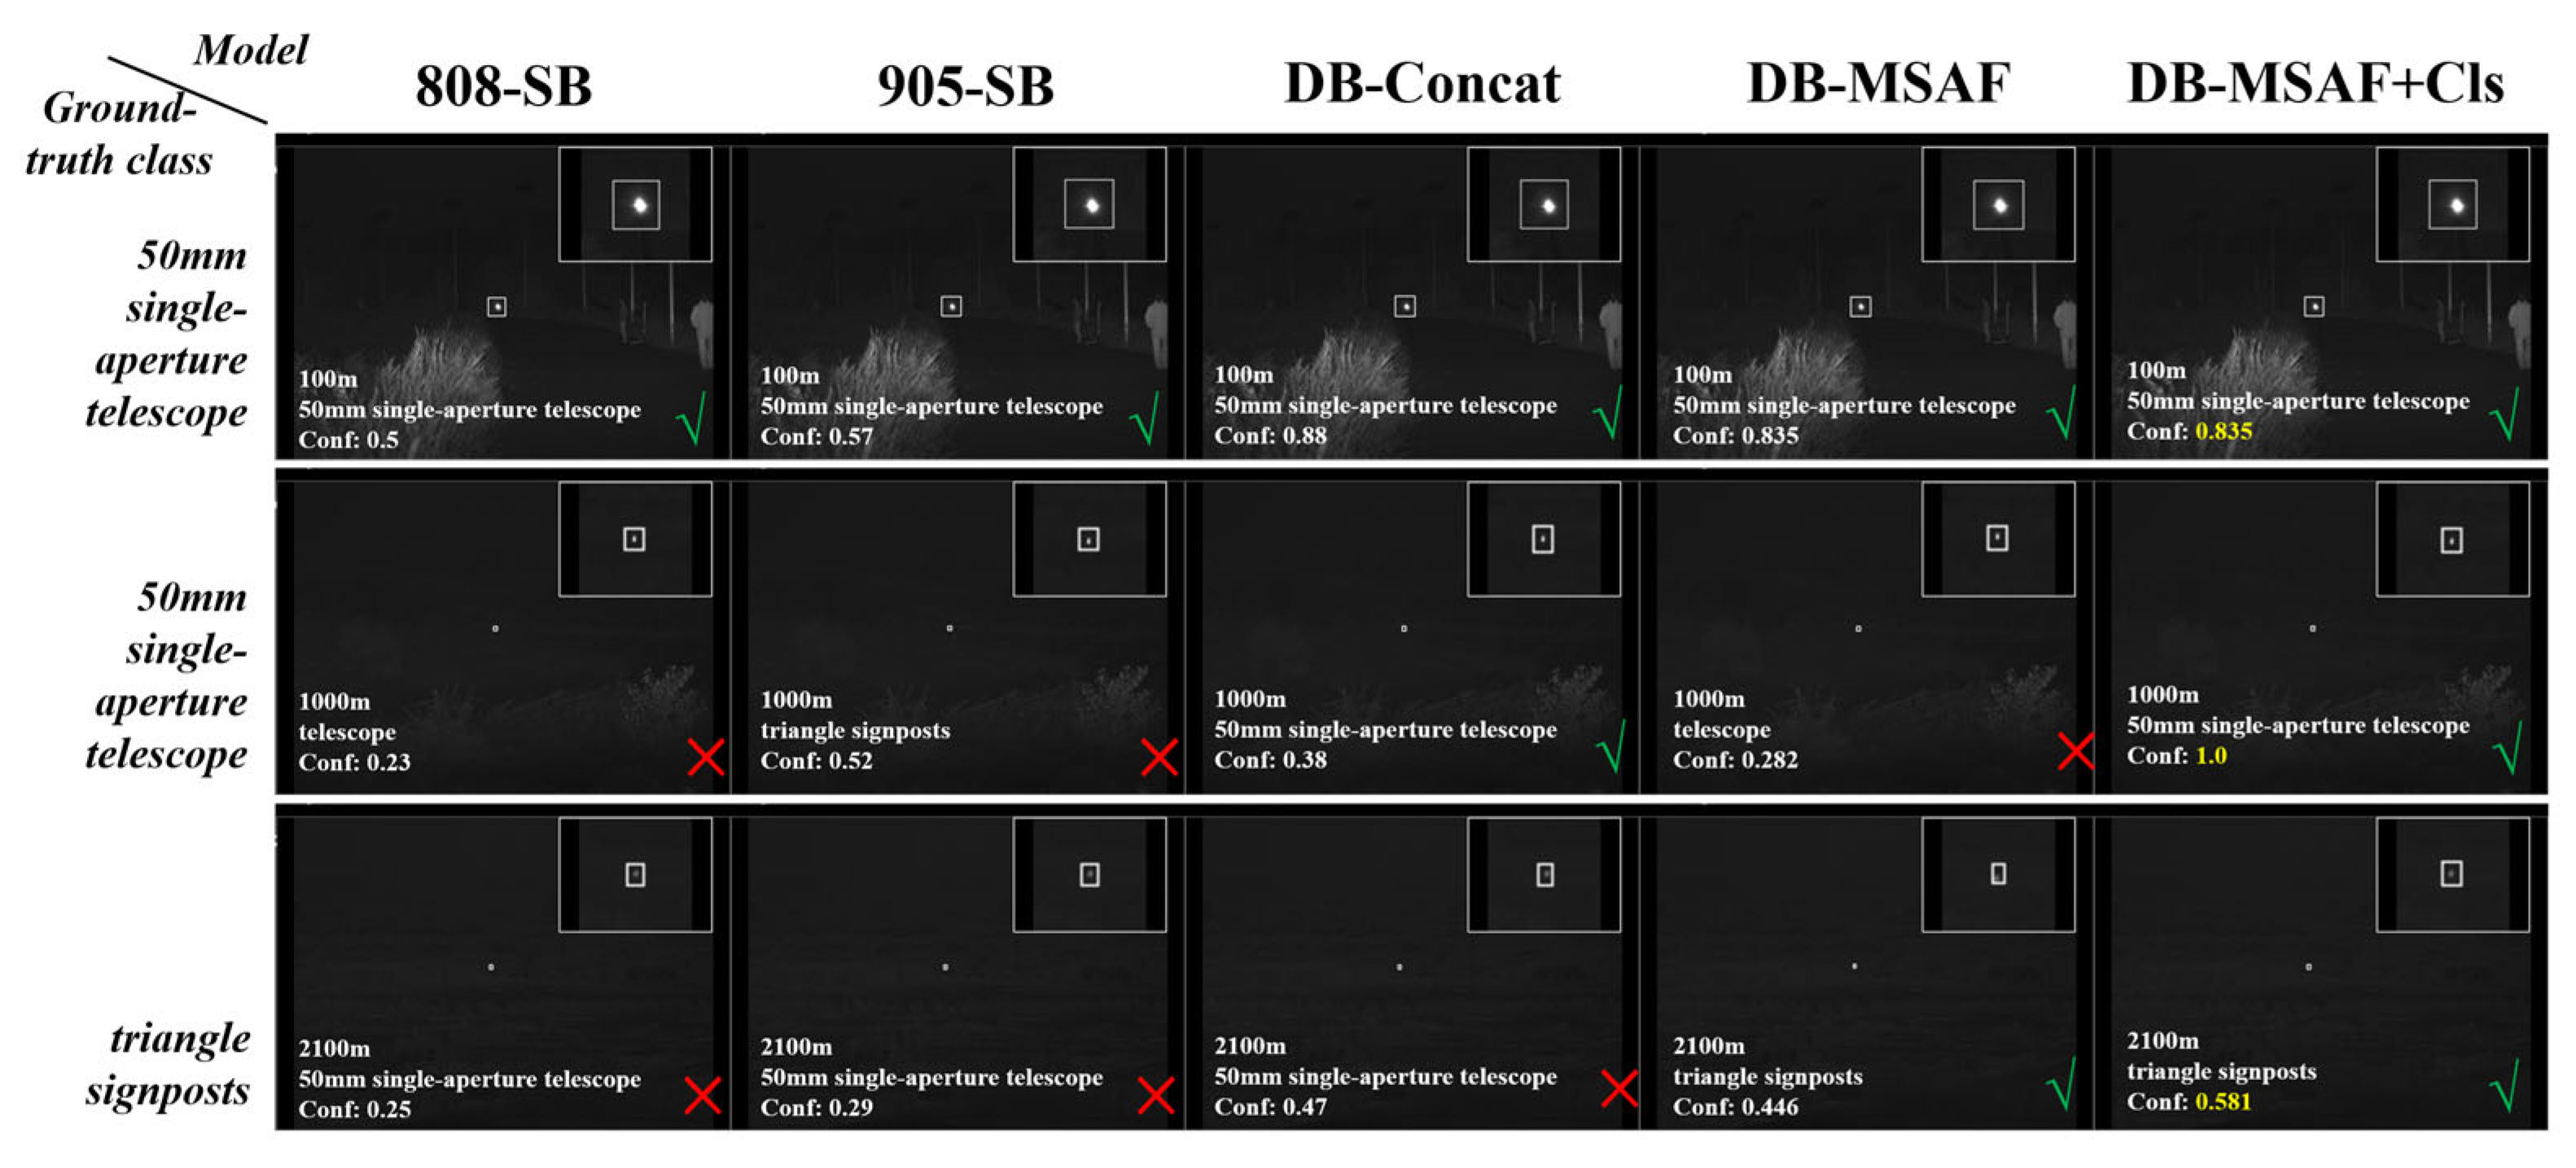
A single-band comparison shows that the 905-SB outperforms the 808-SB overall, but this advantage varies with distance and sample condition. The two models perform similarly at 100 m, but as the distance increases, the 808-SB degrades more rapidly, and the performance gap between them widens to 0.202 at 2100 m. Close-range targets retain relatively rich morphological and scale information, so the single-band model is capable of basic recognition; at medium to long ranges, targets degrade into pixel-level spots, and single-band images cannot capture the asymmetry in cross-band responses. In the representative sample shown in Figure 10, the 905-SB was able to identify the true target at 100 m, but at 1000 m, both it and the 808-SB localized the target but assigned an incorrect category. This example illustrates that a single band struggles to consistently provide sufficient classification criteria across all distance conditions.
Figure 10. Same-sample qualitative decision comparison of 808-SB, 905-SB, DB-Concat, DB-MSAF, and DB-MSAF + Cls at representative ranges. Rows list the true target classes, and columns correspond to the evaluated methods. Green check marks and red cross marks denote correct and incorrect category predictions, respectively. Quantitative comparisons are reported in Table 4 and Figure 11 and Figure 12.
Symmetry 18 01560 g010
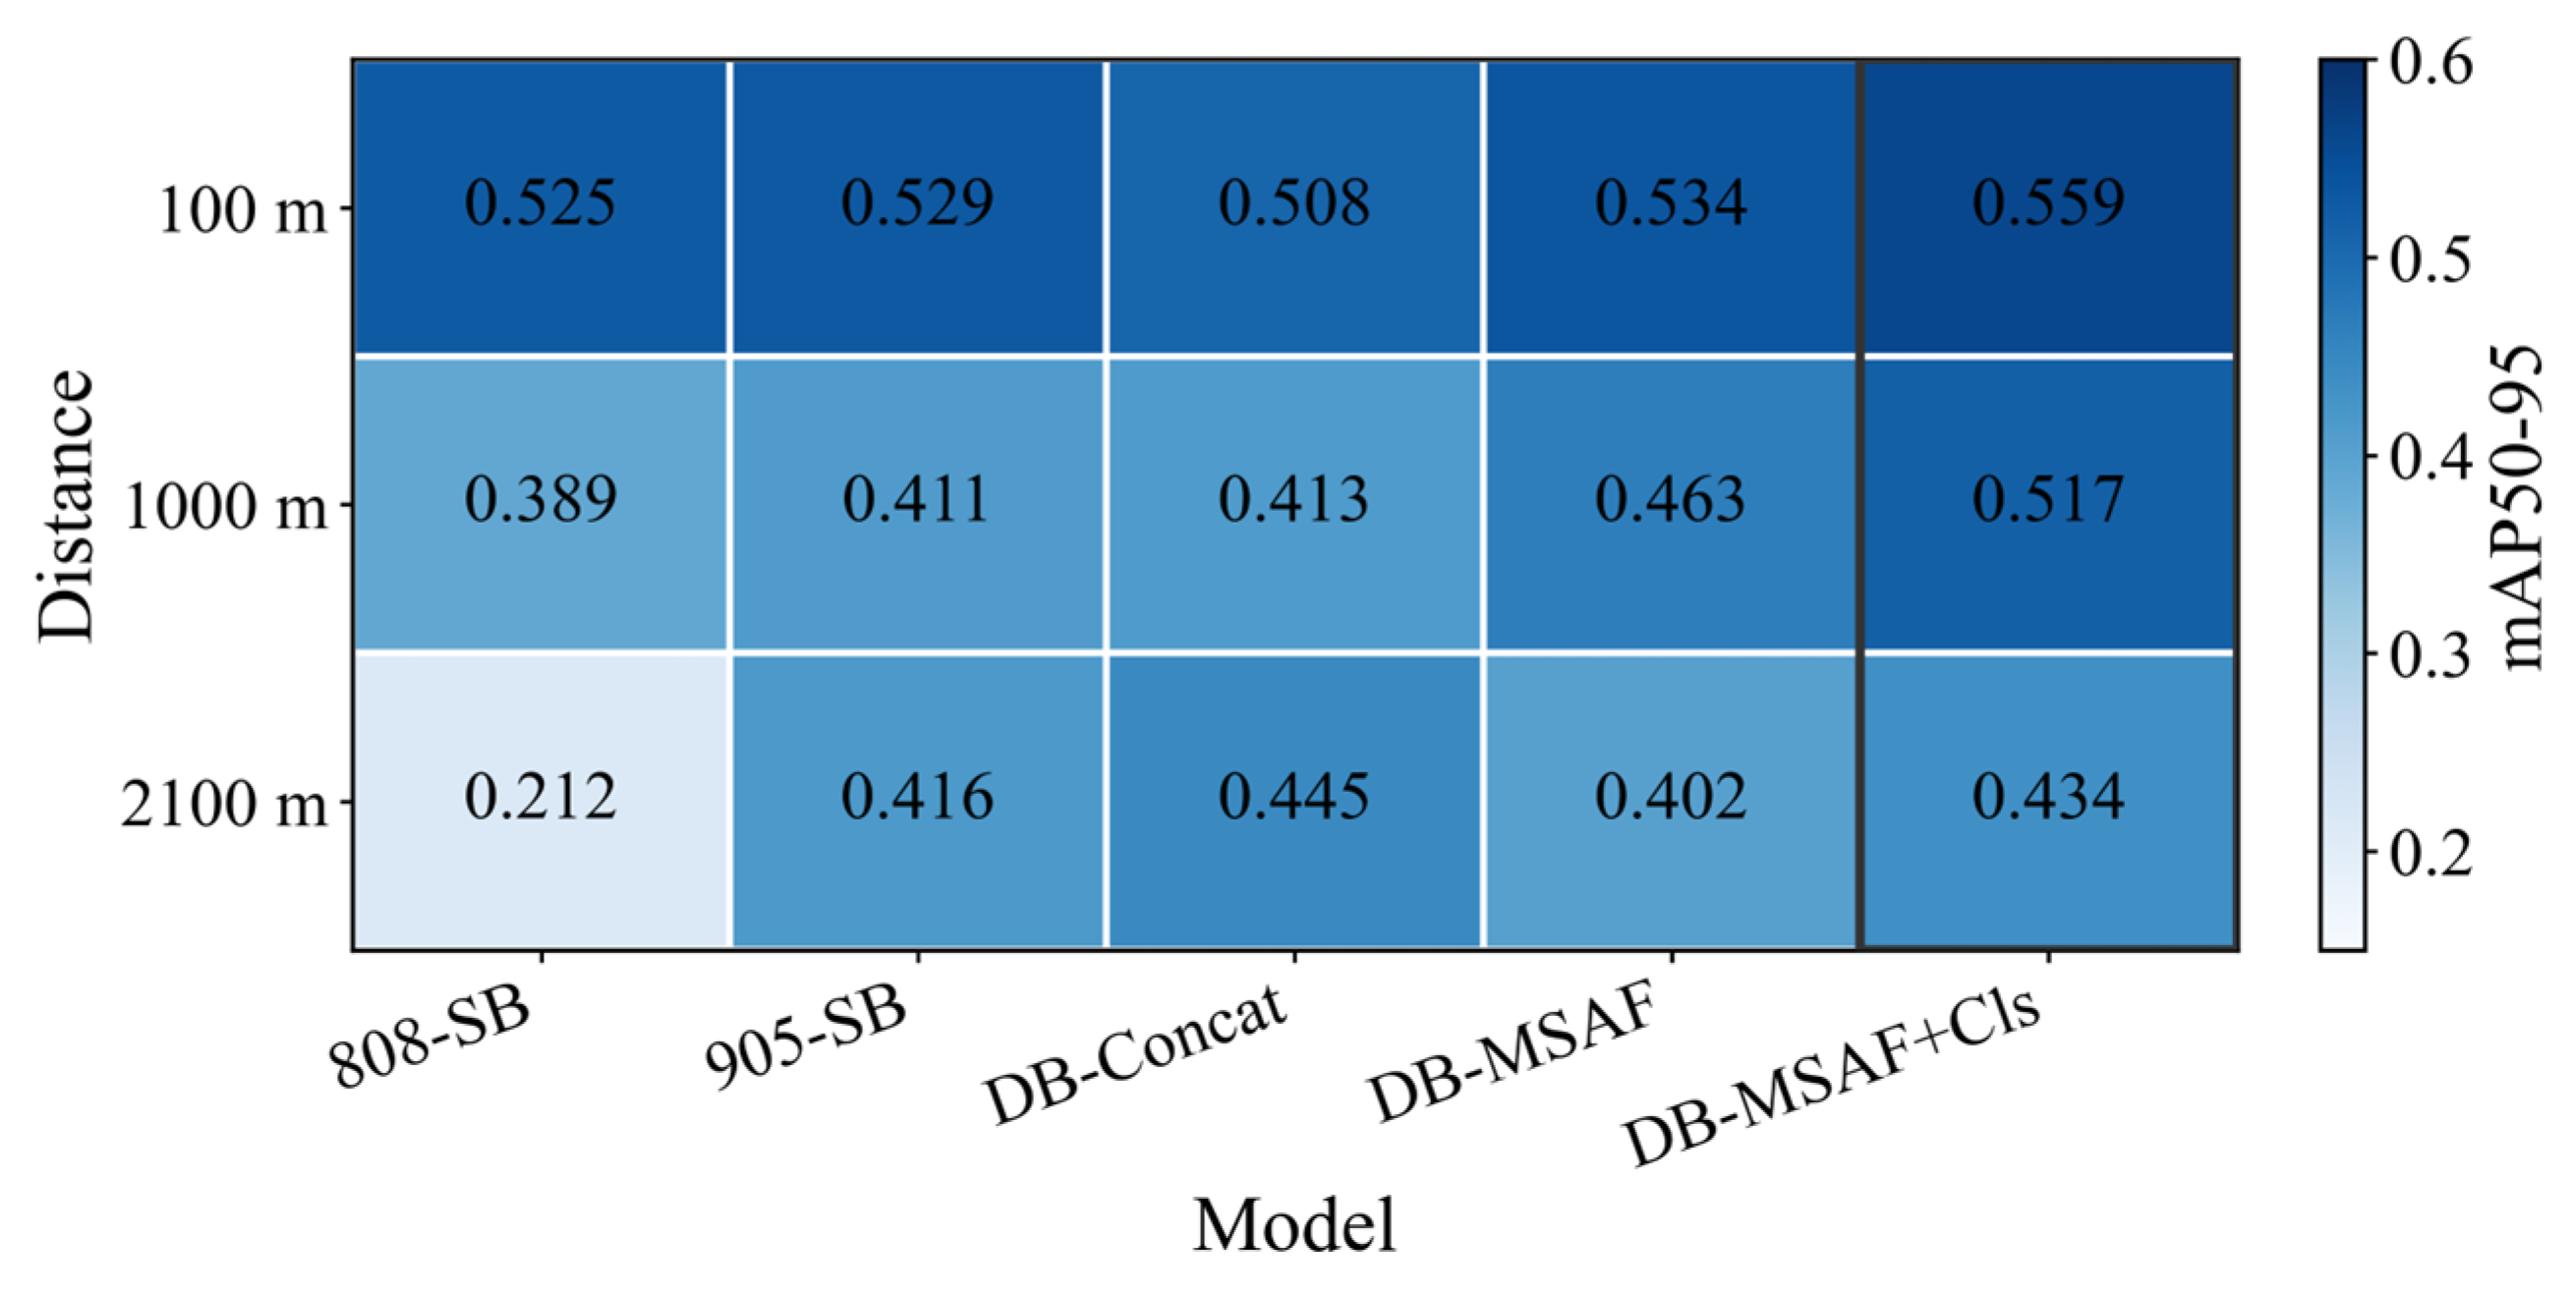
Figure 11. mAP50–95 across models and distances.
Symmetry 18 01560 g011
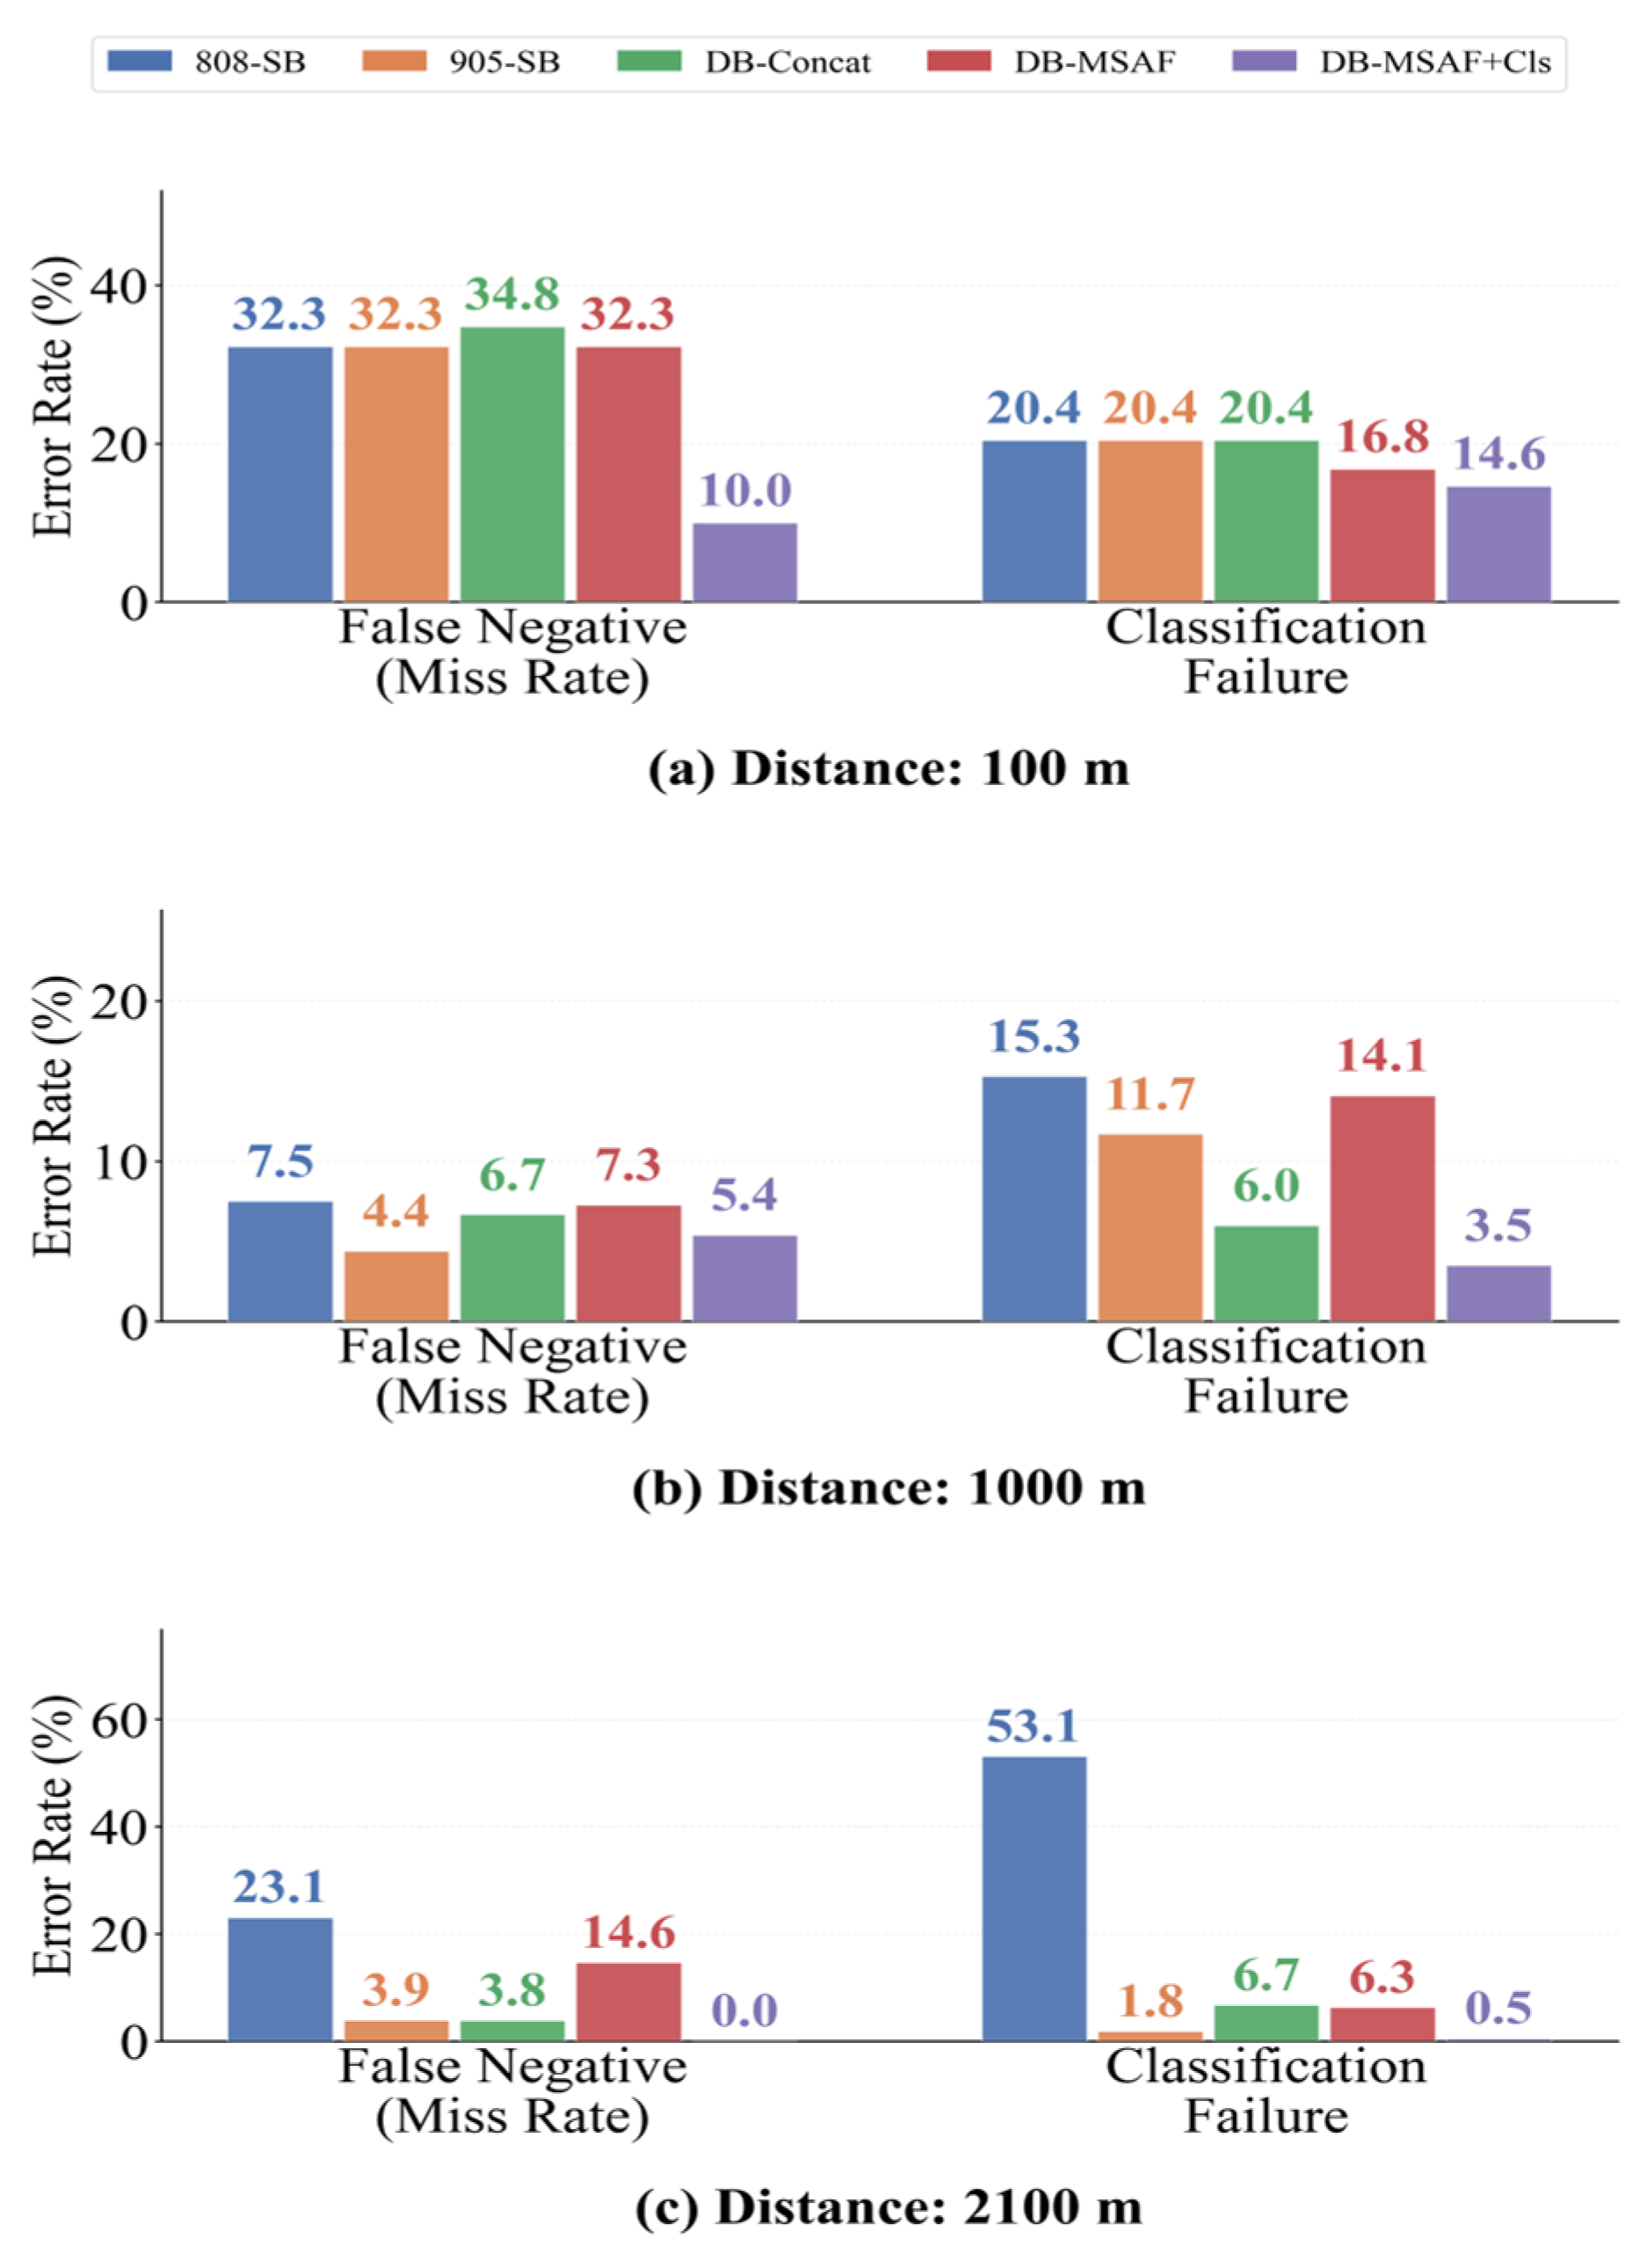
Figure 12. Error type decomposition across models and distances.
Symmetry 18 01560 g012
By retaining independent branches for the two bands, DB-Concat improved the mAP50 from 0.799 for 905-SB to 0.831, demonstrating that dual-band information can provide complementary discriminative cues. However, direct concatenation does not adjust band weights based on differences in channel intensity, noise, and contrast across samples; therefore, it cannot adaptively utilize the corrected cross-band response relationships. The 1000-m sample in Figure 10 further illustrates this limitation: although DB-Concat corrected the class judgment to the correct class, the confidence score was only 0.38.
After replacing the fixed concatenation with multi-scale attention fusion in DB-MSAF, mAP50 increased from 0.831 to 0.870, and mAP50–95 increased from 0.427 to 0.452, while recall decreased slightly from 0.860 to 0.852. These results support the notion that sample-specific channel weighting can improve dual-band feature fusion. Qualitative results also show that DB-MSAF corrected the incorrect class to the correct class for 2100 m false target samples with a confidence level of 0.446; however, it still produced incorrect judgments for 1000 m true target samples with a confidence level of 0.282, indicating that relying solely on deep feature fusion is still insufficient to handle certain weak-response and class-border samples.
Consecutive convolutions and nonlinear transformations may degrade explicit physical information such as intensity ratios and spot-size differences; this effect is particularly pronounced in weak echoes at medium-to-long ranges and in samples at class boundaries. DB-MSAF + Cls reintroduces these response asymmetry cues into the decision-making process via a range-matched explicit feature classifier. Compared to DB-MSAF, the full reclassification stage improves all four overall metrics, with mAP50 increasing from 0.870 to 0.907 and mAP50–95 increasing from 0.452 to 0.475. In the representative sample shown in Figure 10, this module corrected a misclassification by DB-MSAF at 1000 m to the correct class, with a classification confidence of 1.00; in the 2100 m false target sample, the confidence in the correct class increased from 0.446 to 0.581. These results indicate that the reclassification module primarily corrects difficult samples for which the detector has already generated candidate bounding boxes but remains uncertain about the category.
Table 4 compares system configurations rather than isolated component effects. DB-Concat and DB-MSAF both use independent 808 nm and 905 nm backbone branches and differ in their fusion strategy: direct feature concatenation without attention versus multi-scale attention fusion. Comparing either single-band model with DB-Concat changes both the spectral input and the processing structure, so this comparison does not isolate the dual-branch contribution. DB-MSAF + Cls adds a complete range-conditioned post-detection reclassification stage comprising selected explicit features, a range-matched classifier, and triggering and acceptance policies. Its improvement over DB-MSAF therefore reflects the combined stage rather than the independent contribution of a physical feature, classifier, Bayesian feature-selection procedure, range-binning strategy, or threshold policy.
Table 4 presents the average performance on the full test set, while Figure 11 and Figure 12 further illustrate the mAP50–95 and error types at different distances. Overall, as the distance changes, the primary sources of error limiting recognition performance also shift. At 100 m, significant intra-class morphological variations can easily cause the detector to miss atypical samples. Since the explicit classifier can only process targets for which candidate bounding boxes have already been generated—and cannot recover samples that were not proposed by the detector at all—DB-MSAF + Cls still has a false negative rate of 10.0%.
At 1000 m, classification errors become a more prominent limiting factor. The 905-SB model has a false negative rate of 4.4%, but its misclassification rate reaches 11.7%, revealing an imbalance between strong detection capability and insufficient class discrimination ability. DB-MSAF + Cls, on the other hand, controls the false negative rate and misclassification rate at 5.4% and 3.5%, respectively, indicating that cross-band feature fusion and explicit reclassification play complementary roles at this distance.
At 2100 m, the false negative rate and classification error rate for 808-SB reached 23.1% and 53.1%, respectively. The mAP50–95 values for DB-Concat, DB-MSAF, and DB-MSAF + Cls were 0.445, 0.402, and 0.434, respectively. The explicit classifier improved DB-MSAF’s mAP50–95 by 3.2 percentage points, but it still did not surpass DB-Concat. This suggests that explicit physical features can compensate for some of the classification errors at long distances but cannot recover candidate information or localization accuracy lost during the preceding detection process. Although DB-MSAF + Cls did not produce any false negatives in the current 2100-m test subset, this limited-sample result cannot be interpreted as an overall performance advantage at long range; its mAP50–95 of only 0.434 indicates that localization and recognition at this distance remain highly challenging.
Compared to the best-performing alternative architecture in Table 3, DB-MSAF + Cls achieves mAP50–95 and recall that are approximately 8 and 19 percentage points higher, respectively. Under the current 808/905 nm dataset and unified evaluation conditions, these results support the notion that explicitly modeling the asymmetry of dual-band responses provides additional discriminative information beyond that of the tested single-band backbone networks and dual-band fusion baselines; however, this does not imply that the method is universally superior to all possible dual-band detection architectures.
Overall, the performance gains do not stem from the simple superposition of dual-band information but rather from the hierarchical exploitation of response asymmetry: independent branches preserve band-specific characteristics, multi-scale attention enables sample-relevant fusion, and an explicit feature classifier further refines the classification of difficult classes within candidate regions. It should be emphasized that the results in this paper are point estimates based on fixed training, validation, and test set partitions; the test set contains only unseen samples within the sampled distance groups and does not include entirely new distances or independently collected scenarios. Therefore, the current results are applicable for model comparisons under identical conditions; they should not be regarded as estimates of overall performance with confidence intervals, nor do they guarantee generalization to unknown environments. Equation (10) provides an ideal physical basis for the normalized dual-band response relationship, but its cross-distance generalization still requires further validation through leave-one-distance-out testing, independent scenarios, and larger-scale datasets.

5. Conclusions

To balance sensitivity and false alarm suppression in long-range cat-eye target detection, this study proposes a range-conditioned recognition framework based on the registration of 808 nm and 905 nm images. This framework treats the two wavelength bands as a calibrated dual-band detection pair and utilizes the cross-band response asymmetry caused by chromatic aberration and defocusing in the cat-eye target’s internal optical system for discrimination. Under an ideal calibration model, the common geometric distance term in the normalized dual-band echo power ratio can be canceled out; however, in actual measurements, atmospheric transmission and residual effects in the image domain still exhibit a certain degree of distance dependence. Therefore, the class differences observed in this study are applicable only to the evaluated range of 100–2100 m. Based on this physical understanding, cat-eye target recognition is transformed from single-band intensity discrimination to a joint analysis of symmetric and asymmetric dual-band responses, with the dominant discriminative information gradually shifting from spot-scale differences at close range to intensity response differences at long range.
Constrained by the aforementioned physical priors, the proposed framework preserves band-specific representations through a structurally symmetric two-branch backbone network, performs cross-band feature fusion using an attention mechanism, and reintroduces response asymmetry information under chromatic aberration and defocus constraints into the decision-making process via an explicit feature classifier, thereby forming a complete workflow from candidate target detection to feature reclassification. Under the current fixed evaluation scheme, this framework achieves optimal overall performance, with mAP50 and mAP50–95 reaching 0.907 and 0.475, respectively. Its performance advantages are evident on the full test set as well as the 100 m and 1000 m subsets; however, on the 2100 m subset, DB-Concat’s mAP50–95 is slightly higher than that of the full model presented in this paper (0.445 vs. 0.434). Furthermore, this framework is capable of correcting representative misclassifications in the evaluation scenarios and suppressing some false positives under conditions involving weak targets at medium to long ranges, indicating that explicitly leveraging the asymmetry in dual-band responses caused by chromatic defocus helps improve recognition performance under the current experimental conditions.
Future research will further evaluate the framework’s generalization capability and distance applicability boundaries through independent repeated experiments, cross-scenario testing, and leave-one-distance-out validation, and will incorporate additional commercial optical devices such as binoculars, rifle scopes, and achromatic, apochromatic, and catadioptric systems. At the methodological level, we will further investigate a unified distance-adaptive architecture that reduces reliance on range-finding priors and extend the joint analysis of symmetry and asymmetry to multiband fusion and continuous tracking under conditions of relative motion between the target and the sensor. Before considering deployment in unrestricted urban environments, the final scanning and emission configurations must undergo assessment for accessible emission levels, nominal ocular hazard distances, and laser product classification in accordance with applicable laser safety standards [52,53,54].

Author Contributions

Conceptualization, X.L. (Xin Li), K.S. and J.B.; Methodology, Y.L., X.L. (Xin Li), Q.Z. and K.S.; Software, Y.L. and A.L.; Validation, Y.L., X.L. (Xin Li), Q.Z., Z.L. and A.L.; Formal analysis, Y.L. and A.L.; Investigation, Q.Z., Z.L., X.L. (Xudong Li) and S.L.; Resources, Q.Z., J.B. and X.L. (Xudong Li); Data curation, Y.L., X.L. (Xin Li) and Q.Z.; Writing—original draft, Y.L.; Writing—review & editing, X.L. (Xin Li), Z.L. and K.S.; Visualization, Y.L., K.S., A.L. and W.S.; Supervision, X.L. (Xin Li), Z.L. and J.B.; Project administration, X.L. (Xin Li), Q.Z. and J.B.; Funding acquisition, Z.L. All authors have read and agreed to the published version of the manuscript.

Funding

This work was supported by Anhui Provincial Natural Science Foundation (No. 2308085MF211).

Data Availability Statement

The raw imagery and trained models are not publicly available because they were acquired under a security-classified project that has not reached its declassification date. Access requests may be directed to the corresponding author and are subject to institutional and security approval.

Acknowledgments

During the preparation of this manuscript, the authors used ChatGPT-4 for language polishing and readability improvement. The authors reviewed and edited the output and take full responsibility for the content of the publication.

Conflicts of Interest

Qixian Zhang, Xudong Li and Shuangquan Li were employed by the Xi’an Institute of Applied Optics. The remaining authors declare that the research was conducted in the absence of any commercial or financial relationships that could be construed as a potential conflict of interest.

References

  1. Du, X.; Wang, C.; Zhou, H.; Zhang, Y.; Guo, J.; Chen, F. Progress in laser active detection technology based on the cat’s eye effect. Results Phys. 2024, 67, 108030. [Google Scholar] [CrossRef] [Scilit]
  2. Zhang, Y.; Sun, X. Analysis of the restricting factors of laser countermeasure active detection technology. Infrared Phys. Technol. 2016, 77, 16–20. [Google Scholar] [CrossRef] [Scilit]
  3. Li, L.; Ren, J.; Wang, X. Fast cat-eye effect target recognition based on saliency extraction(Article). Opt. Commun. 2015, 350, 33–39. [Google Scholar] [CrossRef] [Scilit]
  4. Kim, S.; Lee, J. Small infrared target detection by region- adaptive clutter rejection for sea- based infrared search and track. Sensors 2014, 14, 13210–13242. [Google Scholar] [CrossRef] [Scilit]
  5. Yu, C.; Liu, Y.; Wu, S.; Hu, Z.; Xia, X.; Lan, D.; Liu, X. Infrared small target detection based on multiscale local contrast learning networks. Infrared Phys. Technol. 2022, 123, 104107. [Google Scholar] [CrossRef] [Scilit]
  6. Lei, C.M.; Zhou, F.; Chen, T.; Chen, H.; Ma, Y.Y. Long-range active laser detection system based on cat’s eye effect. In Eighth Symposium on Novel Photoelectronic Detection Technology and Applications; SPIE: Bellingham, DC, USA, 2022. [Google Scholar] [CrossRef] [Scilit]
  7. Sjöqvist, L.; Allard, L.; Gustafsson, O.; Henriksson, M.; Pettersson, M. Turbulence effects in a horizontal propagation path close to ground: Implications for optics detection. In Proceedings of Technologies for Optical Countermeasures VIII, Prague, Czech Republic, 21–22 September 2011; SPIE: Bellingham, WA, USA, 2011; Volume 8187, p. 81870M. [Google Scholar]
  8. Mieremet, A.L.; Schleijpen, R.M.A.; van Putten, F.J.M.; Veerman, H. Retroreflection reduction by masking apertures (Article). Opt. Eng. 2010, 49, 043202. [Google Scholar] [CrossRef] [Scilit]
  9. Mieremet, A.L.; Schleijpen, H.M.A.; Pouchelle, P.N. Modeling the detection of optical sights using retro-reflection. In Proceedings of the Laser Radar Technology and Applications XIII; SPIE: Bellingham, DC, USA, 2008; p. 69500E. [Google Scholar] [CrossRef] [Scilit]
  10. Zhao, X.J.; Gao, Z.Y.; Zhang, Y.Y. Technique of active laser reconnaissance and the applications in the military. Opt. Tech. 2003, 29, 415–417. [Google Scholar] [CrossRef]
  11. Abel, N.J.; Marciniak, M.A.; Haeri, M.B.; Cain, S.C. Wave-optics modeling of aberration effects in optical cross section measurements. Opt. Eng. 2005, 44, 084302. [Google Scholar] [CrossRef] [Scilit]
  12. Ren, X.; Li, L. Recognizing cat-eye targets with dual criterions of shape and modulation frequency. Chin. Opt. Lett. 2011, 9, 041101. [Google Scholar] [CrossRef] [Scilit]
  13. Qian, F.; Zhang, B.; Yin, C.; Yang, M.; Li, X. Recognition of interior photoelectric devices by using dual criteria of shape and local texture. Opt. Eng. 2015, 54, 123110. [Google Scholar] [CrossRef] [Scilit]
  14. Chen, W.; Zhang, L. The Cat’s Eye Effect Target Recognition Method Based on deep convolutional neural network. In Proceedings of the Conference Proceeding of 2020 3rd International Conference on Algorithms, Computing and Artificial Intelligence (ACAI); ACM: New York, NY, USA, 2020; pp. 378–383. [Google Scholar]
  15. Liu, C.; Zhao, C.; Zhang, H.; Zhang, Z.; Zhai, Y.; Zhang, Y. Design of an Active Laser Mini-Camera Detection System Using CNN. IEEE Photonics J. 2019, 11, 2700212. [Google Scholar] [CrossRef] [Scilit]
  16. Chen, W.; Zhang, L. The cat’s eye target recognition based on fully convolutional residual network and visual saliency. In Proceedings of the AOPC 2021: Novel Technologies and Instruments for Astronomical Multi-Band Observations; SPIE: Bellingham, DC, USA, 2021; p. 120690G. [Google Scholar] [CrossRef] [Scilit]
  17. Huang, J.; Zhang, H.; Wang, L.; Zhang, Z.; Zhao, C. Improved YOLOv3 Model for miniature camera detection. Opt. Laser Technol. 2021, 142, 107133. [Google Scholar] [CrossRef] [Scilit]
  18. Li, L.; Wang, X.B.; Zhang, W.G. A recognition method of ‘cat-eye’ effect target based on texture character. Acta Photonica Sin. 2014, 43, 0210001. [Google Scholar] [CrossRef]
  19. Shan, C.M.; Sun, H.; Zhao, Y.; Chen, J.; Li, S. Identification Method of the Optical Target Aperture by Laser Active Interference Fringe Spacing. Acta Photonica Sin. 2017, 46, 1214002. [Google Scholar] [CrossRef] [Scilit]
  20. Han, L.; Zhang, H.; Ma, X.; Zhao, C.; Yang, S. Real-time detection system of cat-eye effect target based on embedded platform. Qiangjiguang Yu Lizishu/High Power Laser Part. Beams 2015, 27, 011013. [Google Scholar] [CrossRef] [Scilit]
  21. Wang, X.; Zhang, J.; Wang, S. The Cat’s Eye Effect Target Recognition Method Based on Visual Attention. Chin. J. Electron. 2019, 28, 1080–1086. [Google Scholar] [CrossRef] [Scilit]
  22. Zhang, X.P.; Qian, F. A fast recognition algorithm for photoelectric peeping equipment. DEStech Trans. Comp. Sci. Eng. 2017. [Google Scholar] [CrossRef] [Scilit]
  23. Bai, X.; Zhang, Z.; Zhang, Z.; Fam, D. An anti-interfering “cat-eye” target detection method based on intelligent sight. Opto-Electron. Eng. 2021, 48, 210115. [Google Scholar]
  24. Chen, Z.B.; Chen, N.; Shi, K.; Li, G.N.; Liu, X.Y. The research about high-dynamic and low-gray target image differential capture technology based on laser active detection. EURASIP J. Image Video Process. 2018, 2018, 61. [Google Scholar] [CrossRef] [Scilit]
  25. Lv, Z.; Du, X.; Zhang, K.; Chen, F. Three-dimensional echo distribution analysis of multi-band and oblique Gaussian beams propagating through cat-eye optical system. Opt. Laser Technol. 2022, 151, 108044. [Google Scholar] [CrossRef] [Scilit]
  26. Lv, Z.; Zhang, K.; Bao, R.; Zhou, H.; Yang, K.; Li, W.; Du, X.; Chen, F. Three-dimensional echo light field analysis for dual-band laser active detection of a cat-eye optical system. Opt. Express 2023, 31, 25993–26013. [Google Scholar] [CrossRef] [Scilit]
  27. Yue, Z.; Yu, R.; Wang, D.; Zhu, S. Research on the light field of cat-eye effect echo under dual-band oblique incidence in laser active detection. In Proceedings of the Tenth Symposium on Novel Optoelectronic Detection Technology and Applications; SPIE: Bellingham, DC, USA, 2025; Volume 13511, pp. 603–611. [Google Scholar]
  28. Zhang, Z.; Song, D.L.; Xu, B.S.; Han, J.Y.; Zhao, Y.F.; Chen, J.Z. Method of cat-eye effect target recognition based on dual-spectral imaging and deep learning. In Proceedings of the 2nd International Conference on Laser, Optics and Optoelectronic Technology (LOPET 2022); SPIE: Bellingham, DC, USA, 2022; Volume 12343, p. 123432Z. [Google Scholar]
  29. Sjöqvist, L.; Allard, L.; Bolander, G.; Pettersson, M.; Edström, S. Optics detection using a dual channel approach. In Technologies for Optical Countermeasures IX; SPIE: Bellingham, DC, USA, 2012. [Google Scholar] [CrossRef] [Scilit]
  30. Auclair, M.; Sheng, Y.; Fortin, J. Identification of targeting optical systems by multiwavelength retroreflection. Opt. Eng. 2013, 52, 054301. [Google Scholar] [CrossRef] [Scilit]
  31. Wu, D.S.; Liu, B.Q.; Hu, W.G.; Liu, J.; Ying, J.J. Matrix-optics-based echo characteristic model of the cat-eye effect. Acta Opt. Sin. 2016, 36, 0608001. [Google Scholar] [CrossRef] [Scilit]
  32. Qu, J.H.; Zhang, H.Y.; Fan, Y.; Wang, L.; Wang, H.Y.; Zhao, C.M. Mechanism of multi-wavelength laser detection of micro cameras. J. Appl. Opt. 2022, 43, 809–818. [Google Scholar] [CrossRef] [Scilit]
  33. Wu, C.; Li, Y.; Xu, A.; Liu, J. Simulation of laser active detection system and cat’s eye effect. In Proceedings of the 2024 3rd International Conference on Artificial Intelligence and Intelligent Information Processing; ACM: New York, NY, USA, 2024. [Google Scholar] [CrossRef] [Scilit]
  34. Zheng, Z.; Zhang, H.; Shi, G.; Han, L.; Zhao, C. Proceedings of the Cat-eye Target Imaging System Research and Dual-channel DSP Implementation. In Proceedings of the 5th International Symposium on Photoelectronic Detection and Imaging—Laser Sensing and Imaging and Applications; SPIE: Bellingham, DC, USA, 2013. [Google Scholar]
  35. Sjöqvist, L.; Allard, L.; Henriksson, M.; Jonsson, P.; Pettersson, M. Target discrimination strategies in optics detection. In Proceedings of the Technologies for Optical Countermeasures X; and High-Power Lasers 2013: Technology and Systems; SPIE: Bellingham, DC, USA, 2013; p. 88980K. [Google Scholar] [CrossRef] [Scilit]
  36. Zhang, K.; Lv, Z.; Chen, F.; Wang, J.M.; Li, W.W.; Chen, Y.; Ding, X.P. Research progress of laser active detection technology based on cat-eye effect (invited). Laser Optoelectron. Prog. 2024, 61, 2011016. [Google Scholar] [CrossRef] [Scilit]
  37. Zhou, B.; Liu, B.Q.; Wu, D.S. Research on echo energy of ‘cat-eye’ target based on laser’s character of polarization. In Proceedings of the 2011 International Conference on Electronics and Optoelectronics; IEEE: Piscataway, NJ, USA, 2011; Volume 2, pp. V2-302–V2-305. [Google Scholar] [CrossRef] [Scilit]
  38. Hu, M.; Wang, Y.; Jiang, Z.; Pang, C.; Li, Y.; Shao, Z.; Yue, Z.; Liu, Y.; Kong, Z.; Wang, P.; et al. Cat-eye inspired active–passive-composite aperture-shared sub-terahertz meta-imager for non-interactive concealed object detection. Laser Photonics Rev. 2026, 20, e01337. [Google Scholar] [CrossRef] [Scilit]
  39. Solanki, R.S.; Khurana, V. Studies on retro-reflection for optical target detection. J. Opt. 2024, 53, 336–341. [Google Scholar] [CrossRef] [Scilit]
  40. Xie, T.; Wang, C.; Jiang, Y.; Jiang, C.; Zhu, J. Research on laser active detection method for cat-eye targets based on spatial context. Infrared Laser Eng. 2025, 54, 20250158. [Google Scholar] [CrossRef] [Scilit]
  41. Zhou, B.; Wang, W.; Yan, N.; Zhao, L.; Li, C. Integrating the cat’s eye effect and deep learning for low-altitude target detection. Front. Inf. Technol. Electron. Eng. 2025, 26, 2455–2469. [Google Scholar] [CrossRef] [Scilit]
  42. He, S.; Meng, Y.; Gong, M. Active laser detection system for recognizing surveillance devices(Article). Opt. Commun. 2018, 426, 313–324. [Google Scholar] [CrossRef] [Scilit]
  43. Chen, Z.; Li, S.; Zhen, J. Mechanisms of active detection on micro-cameras based on cat-eye effect with different incident angles. In Proceedings of the Fourteenth International Conference on Information Optics and Photonics (CIOP 2023), Xi’an, China, 7–10 August 2023; SPIE: Bellingham, WA, USA, 2023; Volume 12935, p. 129352O. [Google Scholar]
  44. Shan, C.; Xu, Z.; Zhang, Y.; Lao, G.; Song, J.; Li, B. A new recognition method aimed at optical reconnaissance attitude based on laser active interference. In Proceedings of the AOPC 2022: Optical Sensing, Imaging, and Display Technology; SPIE: Bellingham, WA, USA, 2023. [Google Scholar] [CrossRef] [Scilit]
  45. Kim, I.I.; McArthur, B.A.; Korevaar, E.J. Comparison of laser beam propagation at 785 nm and 1550 nm in fog and haze for optical wireless communications. In Proceedings of the Optical Wireless Communications III; SPIE: Bellingham, WA, USA, 2001; Volume 4214, pp. 26–37. [Google Scholar] [CrossRef] [Scilit]
  46. Al Naboulsi, M.; Sizun, H.; de Fornel, F. Fog attenuation prediction for optical and infrared waves. Opt. Eng. 2004, 43, 319–329. [Google Scholar] [CrossRef] [Scilit]
  47. Han, Y.; Gao, P.; Huang, J.; Zhang, T.; Zhuang, J.; Hu, M.; Wu, Y. Ground-based synchronous optical instrument for measuring atmospheric visibility and turbulence intensity: Theories, design and experiments. Opt. Express 2018, 26, 6833–6850. [Google Scholar] [CrossRef] [Scilit]
  48. Hu, J.; Shen, L.; Sun, G. Squeeze-and-excitation networks. In Proceedings of the IEEE Conference on Computer Vision and Pattern Recognition (CVPR), Salt Lake City, UT, USA, 18–23 June 2018; pp. 7132–7141. [Google Scholar] [CrossRef] [Scilit]
  49. Singh, B.; Davis, L.S. An analysis of scale invariance in object detection—SNIP. In Proceedings of the IEEE Conference on Computer Vision and Pattern Recognition (CVPR); IEEE: Piscataway, NJ, USA, 2018; pp. 3578–3587. [Google Scholar]
  50. Grinsztajn, L.; Oyallon, E.; Varoquaux, G. Why do tree-based models still outperform deep learning on typical tabular data? Adv. Neural Inf. Process. Syst. 2022, 35, 507–520. [Google Scholar] [CrossRef] [Scilit]
  51. Cawley, G.C.; Talbot, N.L.C. On over-fitting in model selection and subsequent selection bias in performance evaluation. J. Mach. Learn. Res. 2010, 11, 2079–2107. [Google Scholar]
  52. GB/T 7247.1-2024; Safety of Laser Products—Part 1: Equipment Classification and Requirements. China Standards Press: Beijing, China, 2024.
  53. IEC 60825-1:2014; Safety of Laser Products—Part 1: Equipment Classification and Requirements. IEC: Geneva, Switzerland, 2014.
  54. International Commission on Non-Ionizing Radiation Protection. ICNIRP Guidelines on Limits of Exposure to Laser Radiation of Wavelengths between 180 nm and 1,000 μm. Health Phys. 2013, 105, 271–295. [Google Scholar] [CrossRef] [Scilit]
  55. Zhao, Y.; Lv, W.; Xu, S.; Wei, J.; Wang, G.; Dang, Q.; Liu, Y.; Chen, J. DETRs beat YOLOs on real-time object detection. In Proceedings of the IEEE/CVF Conference on Computer Vision and Pattern Recognition (CVPR); IEEE: Piscataway, NJ, USA, 2024; pp. 16965–16974. [Google Scholar] [CrossRef] [Scilit]
  56. Jocher, G.; Qiu, J.; Liu, M.; Lyu, S.; Akyon, F.C.; Kalfaoglu, M.E. Ultralytics YOLO26: Unified real-time end-to-end vision models. arXiv 2026, arXiv:2606.03748. [Google Scholar] [CrossRef] [Scilit]
  57. Zhu, H.; Dong, W.; Yang, L.; Li, H.; Yang, Y.; Ren, Y.; Zhu, Q.; Feng, Z.; Li, C.; Lin, S.; et al. WaveMamba: Wavelet-Driven Mamba Fusion for RGB-Infrared Object Detection. In Proceedings of the IEEE/CVF International Conference on Computer Vision; IEEE: Piscataway, NJ, USA, 2025; pp. 11219–11229. [Google Scholar] [CrossRef] [Scilit]
Figure 1. Illustrative urban laser active detection scenario based on the cat-eye effect. A hand-held optoelectronic device (e.g., a camera) in the sensor’s field of view returns a strong, localized highlight echo along the incident laser path (upper-right callout). Other architectural glints, such as metal railings and window glazing (lower callouts), illustrate the general false-alarm problem that motivates this work. The red boxes highlight the bright echoes and their corresponding enlarged views.
Symmetry 18 01560 g001
Figure 2. Schematic illustration of chromatic-defocus-induced dual-band response symmetry breaking in a cat-eye target. The blue and green lines represent the optical paths at 808 nm and 905 nm, respectively, while the red arrow and dashed boxes indicate the enlarged focal-plane region.
Symmetry 18 01560 g002
Figure 3. Overall framework for cat-eye target detection and recognition based on dual-band response-asymmetry-guided active illumination. (a) Dual-band laser active illumination and dual-channel return imaging; (b) dual-branch detection network and feature fusion on registered dual-band images; (c) dual-band differential feature analysis, classifier discrimination, and fusion-based recognition.
Symmetry 18 01560 g003
Figure 4. Architecture of the symmetric dual-branch YOLO11 network with multi-scale attention for asymmetry-aware fusion. Colors distinguish different functional modules, arrows indicate the direction of feature flow, and blue dashed lines denote multi-scale feature connections.
Symmetry 18 01560 g004
Figure 5. Detection and asymmetry-driven reclassification fusion framework at 1000 m.
Symmetry 18 01560 g005
Figure 6. Qualitative near-field dual-band return-spot examples of different target types at 100 m.
Symmetry 18 01560 g006
Figure 7. Scale and intensity asymmetric feature space distribution at 100 m. Color intensity represents the magnitude of the feature difference, with darker shades indicating larger values; red denotes true targets, whereas blue denotes false targets.
Symmetry 18 01560 g007
Figure 8. Far-field cross-band response asymmetry of different target types at 2100 m. For each target, the 808 nm and 905 nm images are rendered using the same linear colorbar range; colorbar ranges may differ across target categories to preserve the visibility of weak far-field echoes. The 30 mm single-aperture telescope, the 15 signposts, and the electric torch did not provide usable target returns at 2100 m and are therefore not displayed.
Symmetry 18 01560 g008
Figure 9. Scale and intensity asymmetric feature space distribution at 2100 m. Color intensity represents the magnitude of the feature difference, with darker shades indicating larger values; red denotes true targets, whereas blue denotes false targets.
Symmetry 18 01560 g009
Table 1. Comparison of representative prior cat-eye/optical-target active detection studies with the present work.
StudyBand(s)Max. RangeTarget TypesRecognition
Approach
Bai et al. (2021) [23]Single-band active laserIndoor and outdoor testsCat-eye targets and background interferenceM-sequence correlation and image registration
Huang et al. (2021) [17]Single bandLaboratory and field testsMiniature camerasImproved YOLOv3
Zhang et al. (2022) [28]Dual spectralNot specifiedCat-eye targetsDual-spectral imaging and deep learning
Lei et al. (2022) [6]532 nm5.7 km50 mm-aperture cameraLong-range active detection system
Lv et al. (2023) [26]532 nm and 10.6 μmLaboratory scaleCat-eye optical systemTheoretical modeling and dual-band experiment
Xie et al. (2025) [40]Active laserMultiple distances, maximum not specifiedCat-eye and interfering targetsAdaptive feature extraction, YOLOv8/DCNv3 and spatial-context fusion
Zhou et al. (2025) [41]Near-infrared active detectionNot specifiedLow-altitude small optical targetsSKNet21 with local-pyramid attention and feature-pyramid fusion
This work808 nm and 905 nm100–2100 mCat-eye targets and high-return false targetsDual-branch multiscale YOLO and asymmetry-guided reclassification
Table 2. Implementation details.
Training
Input Image SizeTraining EpochsBatch SizeOptimizerLearning RateMomentum/Weight Decay
832 × 8322004SGD0.010.937/0.0005
Environment
GPUSoftware
2 × NVIDIA GeForce RTX 3090 (24 GB)PyTorch 2.9.1, Ultralytics 8.4.7, CUDA 12.1
Dataset
Classes/distance binsTraining/validation/test sets
10/13 (100–2100 m)3807/605/466 images
Acquisition
808 nm905 nm
200 μs, 10 Hz, 200 A, 8 × 6 mrad100 μs, 10 Hz, 80 A, 5 × 4 mrad
Table 3. Comparison of alternative backbone architectures on the same dataset (RT-DETR and YOLO26: single-band inputs; WaveMamba: dual-band input).
BackboneBandPRmAP50mAP50–95
RT-DETR808 nm0.6730.7020.7370.369
RT-DETR905 nm0.6870.6840.7600.394
YOLO26808 nm0.6880.7190.7550.371
YOLO26905 nm0.7290.7200.7370.386
WaveMamba808 nm + 905 nm0.8520.7290.7220.346
Table 4. Overall performance comparison across models.
ModelPRmAP50mAP50–95
808-SB0.6900.7200.7300.373
905-SB0.7290.8400.7990.413
DB-Concat0.7380.8600.8310.427
DB-MSAF0.7820.8520.8700.452
DB-MSAF + Cls0.8320.9160.9070.475
Disclaimer/Publisher’s Note: The statements, opinions and data contained in all publications are solely those of the individual author(s) and contributor(s) and not of MDPI and/or the editor(s). MDPI and/or the editor(s) disclaim responsibility for any injury to people or property resulting from any ideas, methods, instructions or products referred to in the content.