Article

Geotechnical Assessment of Differential Settlements Under Asymmetric Loading: Implications for Pipeline Performance

by
Francesco Castelli
,
Valentina Lentini
* and
Maria Stella Vanessa Sammito
Faculty of Engineering and Architecture, University “Kore” of Enna, 94100 Enna, Italy
*
Author to whom correspondence should be addressed.
Symmetry 2026, 18(9), 1427; https://doi.org/10.3390/sym18091427
Submission received: 27 July 2026 / Revised: 21 August 2026 / Accepted: 24 August 2026 / Published: 26 August 2026
(This article belongs to the Special Issue Symmetry in Seismic Geotechnical Engineering and Soil Mechanics)

Abstract

Industrial tanks are key components of process plants. However, they are highly susceptible to foundation settlement under high operating loads. Therefore, reducing settlement is necessary to protect the tank and the associated piping. In this work, Finite Element Method (FEM) analyses were conducted to assess the effects of construction on adjacent pipelines in an industrial plant located on the eastern coast of Sicily (Italy). The biological basin has a longitudinal axis of symmetry and consists of two tanks. The geotechnical model was developed from geological and geotechnical investigations carried out in the investigated area. PLAXIS2D software (Bentley Systems) was employed to perform consolidation analyses. The findings show that the magnitude and application of loads play a key role in the estimated settlements, demonstrating the importance of including the load eccentricity in the analysis. The influence zone following the construction of the biological basin was derived to evaluate the potential impact on adjacent pipelines.

1. Introduction

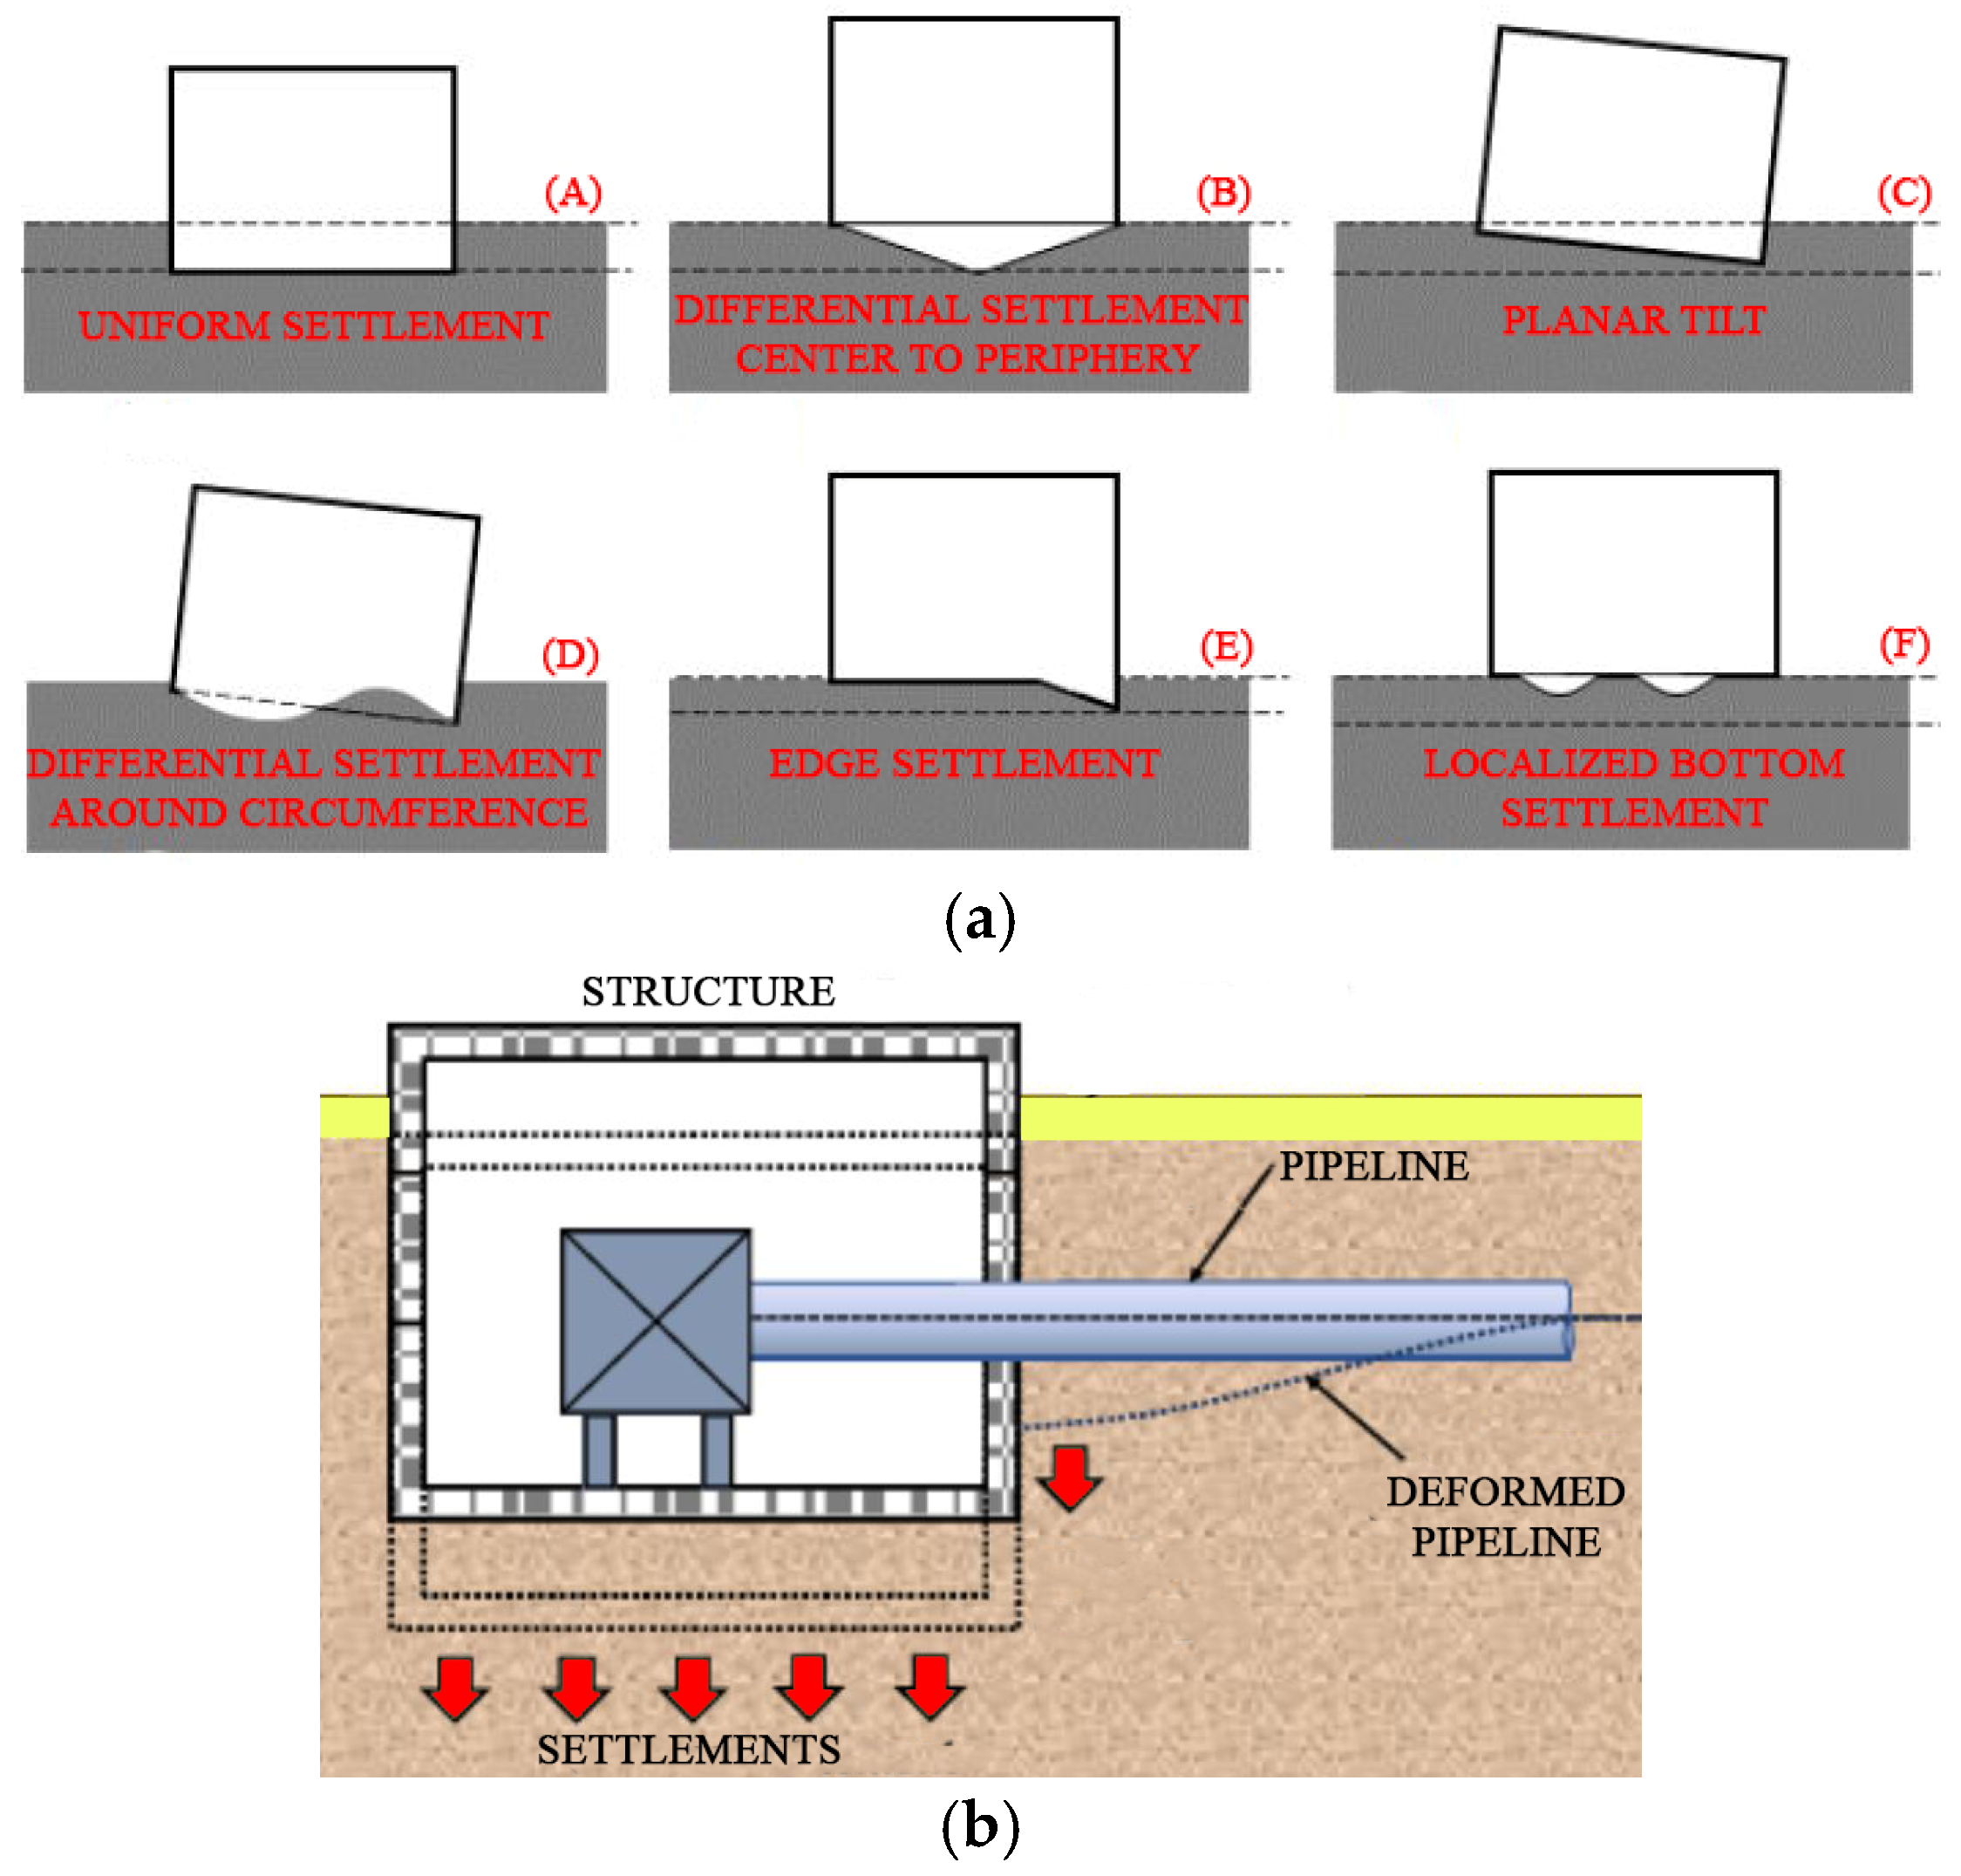
Industrial plants are complex engineering systems composed of a wide range of structures and components, such as storage tanks, pipelines, and reactors [1,2,3]. Large-scale industrial storage tanks play a crucial role in industrial processing plants, serving as containment systems for oil, chemicals, water, and other process fluids. However, it is well known that foundation settlement of a tank can be particularly severe, due to the high applied loads and the compressibility of underlying soil deposits [4]. Thus, foundation settlements of storage tanks must be limited to ensure that instantaneous and long-term settlements can be tolerated by the tank, the associated pipelines, and the adjacent structures. The main modes of tank settlements, shown in Figure 1a, comprise: uniform settlement, differential settlement center to periphery, planar tilt, differential settlement around circumference, edge settlement, and localized bottom settlement [5].
Ground settlement can produce significant deformation in the pipelines because of bending and axial strain, possibly leading to pipe rupture or loss of containment. In industrial plants, this can cause additional hazards, such as fire and explosions. Indeed, even minor differential settlements can introduce a significant amount of deformation in the pipelines [6,7,8]. Differential settlement between the structure and the ground is displayed in Figure 1b. As a result, the pipeline follows this movement, assuming an S-shaped configuration and developing bending and axial strain [6].
In recent years, numerous studies have been conducted to evaluate the pipeline vulnerability [9].
Most existing studies address pipeline–soil interaction through experimental, numerical, and analytical methods. Huang et al. [7] proposed a pipe–soil interaction model to accurately obtain the soil spring performance parameters. Huo et al. [8] investigated analytical methods to analyze the stress and deformation of pipes in pipe–soil interaction problems. Ayinde et al. [10] developed a closed-form predictive equation for assessing buried water pipe performance. Sheil et al. [11] investigated the influence of surcharge boundary conditions and pressure level on the axial sliding behavior of a trenched pipeline surrounded by sand backfill. The Finite Element Method (FEM) has been widely adopted to analyze the flexural and longitudinal response of buried pipelines [12,13,14,15,16]. For example, Qin et al. [17] investigated longitudinal barrel bending and soil resistance along the pipeline under normal fault offsets based on the results of full-scale laboratory tests and FEM analysis.
Other studies have focused on calculating tank settlements and the resulting damage to the tank structure. For example, Shi et al. [4] developed a FEM model for strength assessment of a large-scale oil storage tank based on field data of tank foundation settlement. Thusyanthan et al. [4] performed numerical analysis to predict preliminary tank settlements. Jiao et al. [18] developed a FEM model to evaluate non-uniform settlement in large crude oil storage tanks. Refs. [19,20,21] provided theoretical perspectives on deformation prediction and soil–structure interaction problems. Refs. [22,23] employed numerical simulation approaches to investigate deformation responses under complex construction conditions.
Despite the extensive literature on tank settlement, e.g., [4,18], and on pipeline–soil interaction, e.g., [7,8], a significant gap remains regarding the evaluation of far-field effects of new heavy structures, such as tanks, on existing or associated pipelines in industrial plants. Indeed, the consolidation process induced by the construction of these structures can produce far-field settlements, inducing bending and axial strains in nearby pipelines.
Previous studies have demonstrated the relevance of far-field effects in engineering problems. Specifically, Chandrawanshi and Garg [24] investigated the effect of structure–soil–structure interaction (SSSI) on the footing settlement, showing that the effect of SSSI causes a maximum increase of 1.80 times in the vertical settlement compared to the soil–structure interaction (SSI). Moghadasi et al. [25] evaluated settlement and tilt resulting from adjacent foundation interaction considering five types of deposits, demonstrating that foundation interaction leads to a maximum settlement of 21.29 mm. Shumakov et al. [26] evaluated the zone influence area of an excavation on the foundations of adjacent buildings using a graphical method, reporting a maximum influence zone area of 11.383 m2.
However, a direct quantitative comparison with the case under consideration is not achievable. Indeed, the available studies focus on SSSI or excavation effects on shallow foundations, but these concepts have not been extended to an industrial context, where large tanks impose high operating loads. Despite this, all these studies highlight that far-field effects from a structure can significantly affect the adjacent structures. By addressing far-field settlement effects in this specific context, the present study provides new insights into pipeline vulnerability in industrial plants.
The novelty of the present work addresses the gap related to far-field settlement effects and adopts an integrated perspective by evaluating how asymmetric operational conditions propagate settlements beyond the foundation and can affect adjacent pipelines in industrial plants. For this reason, the paper illustrates the results of 2D FEM consolidation analyses performed on the soil volume affected directly and indirectly by the construction of a biological basin located within an industrial plant in Augusta (Sicily, Italy). Moreover, two asymmetric loading conditions were considered to evaluate their impact on the development of settlements.

2. Site Description and Characteristics of the Biological Basin

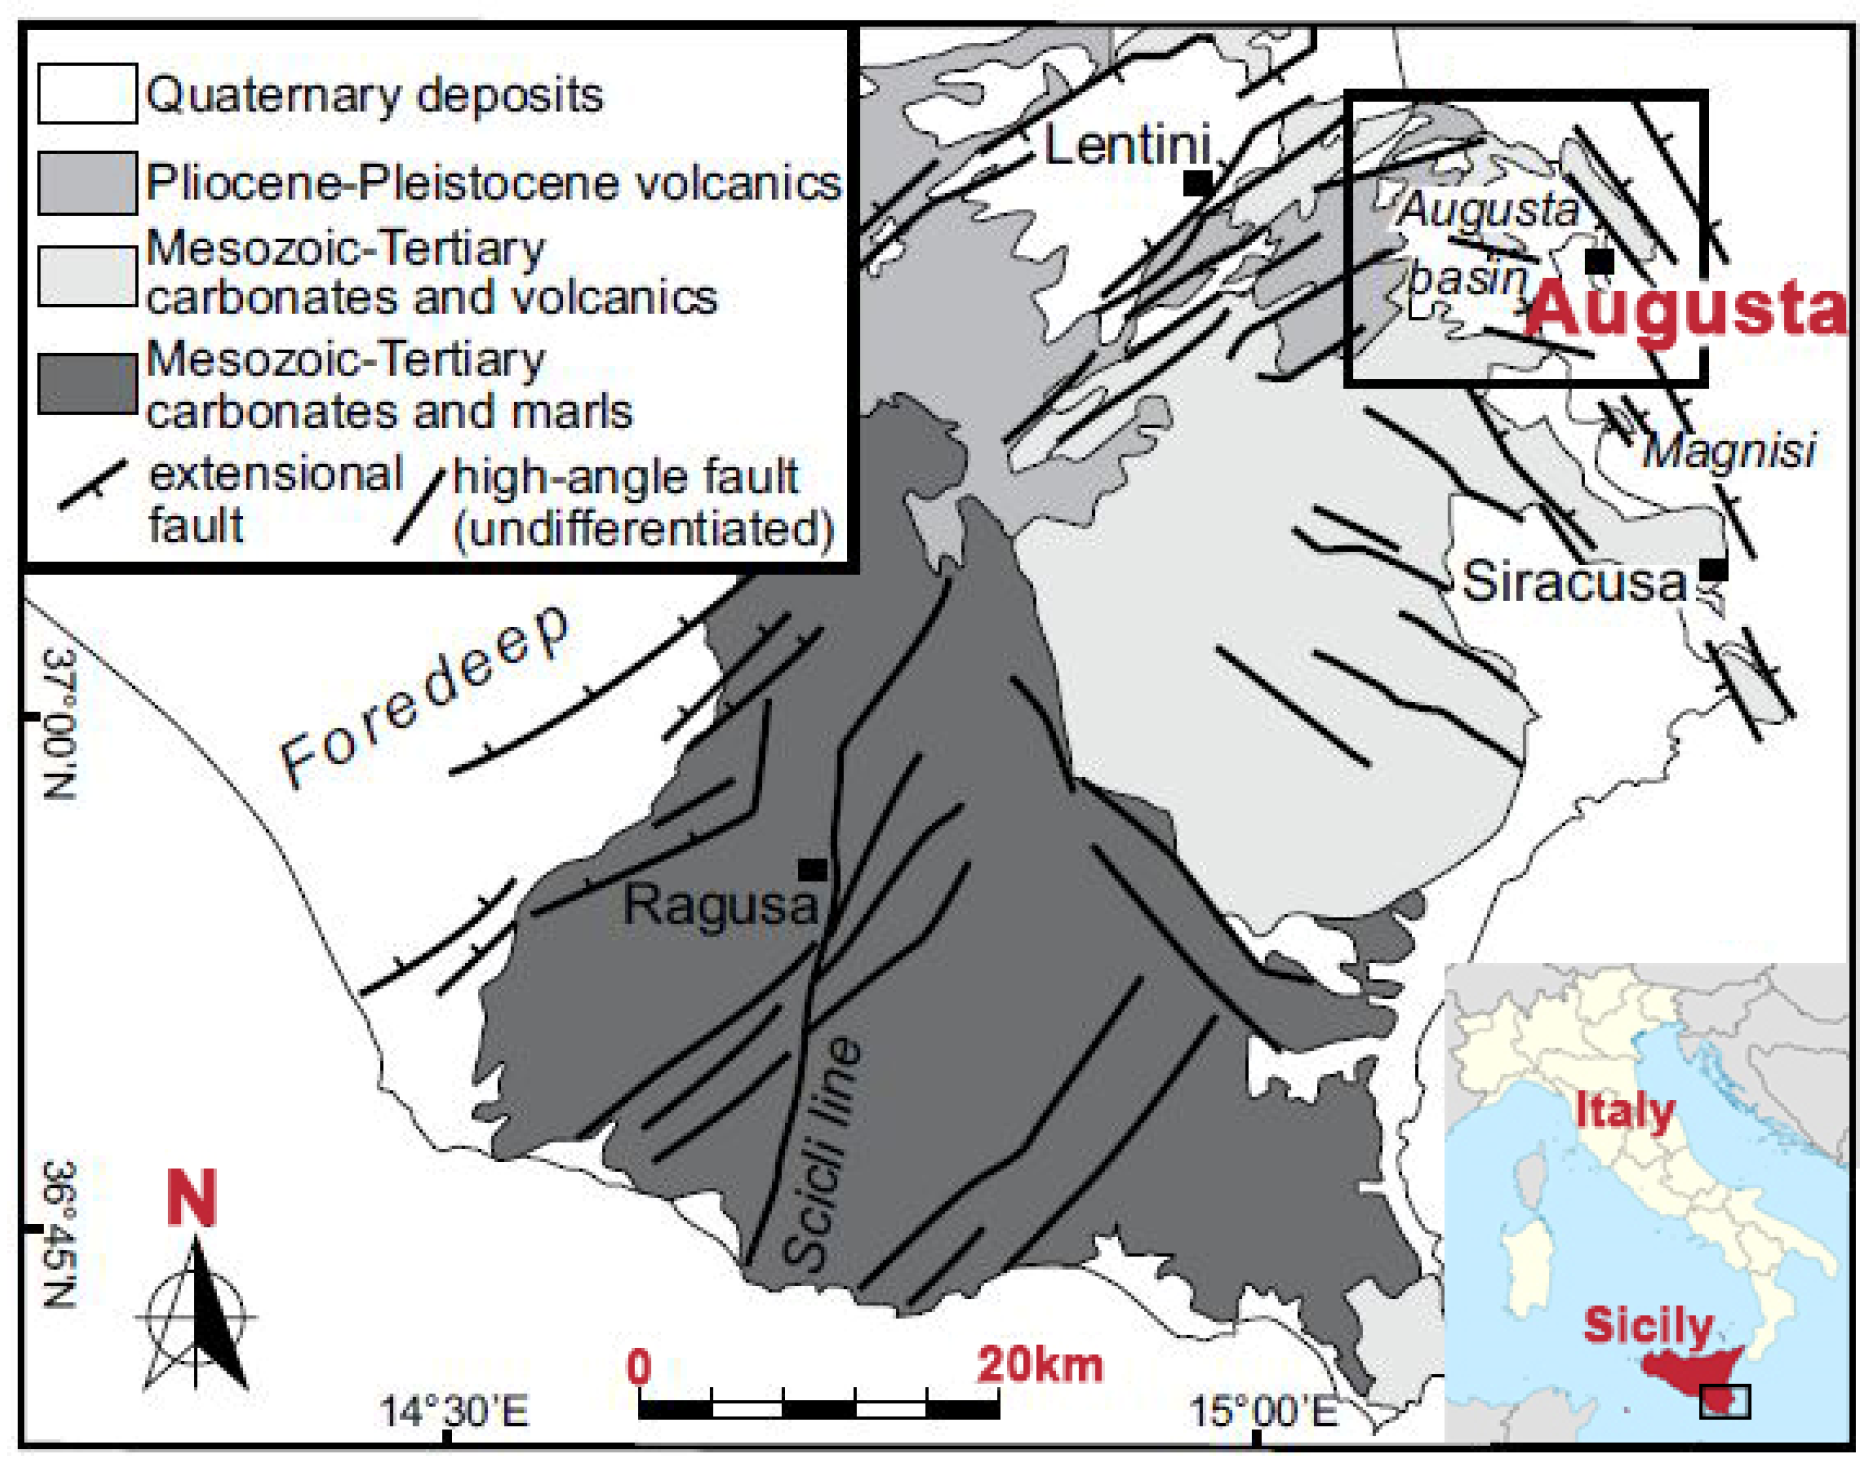
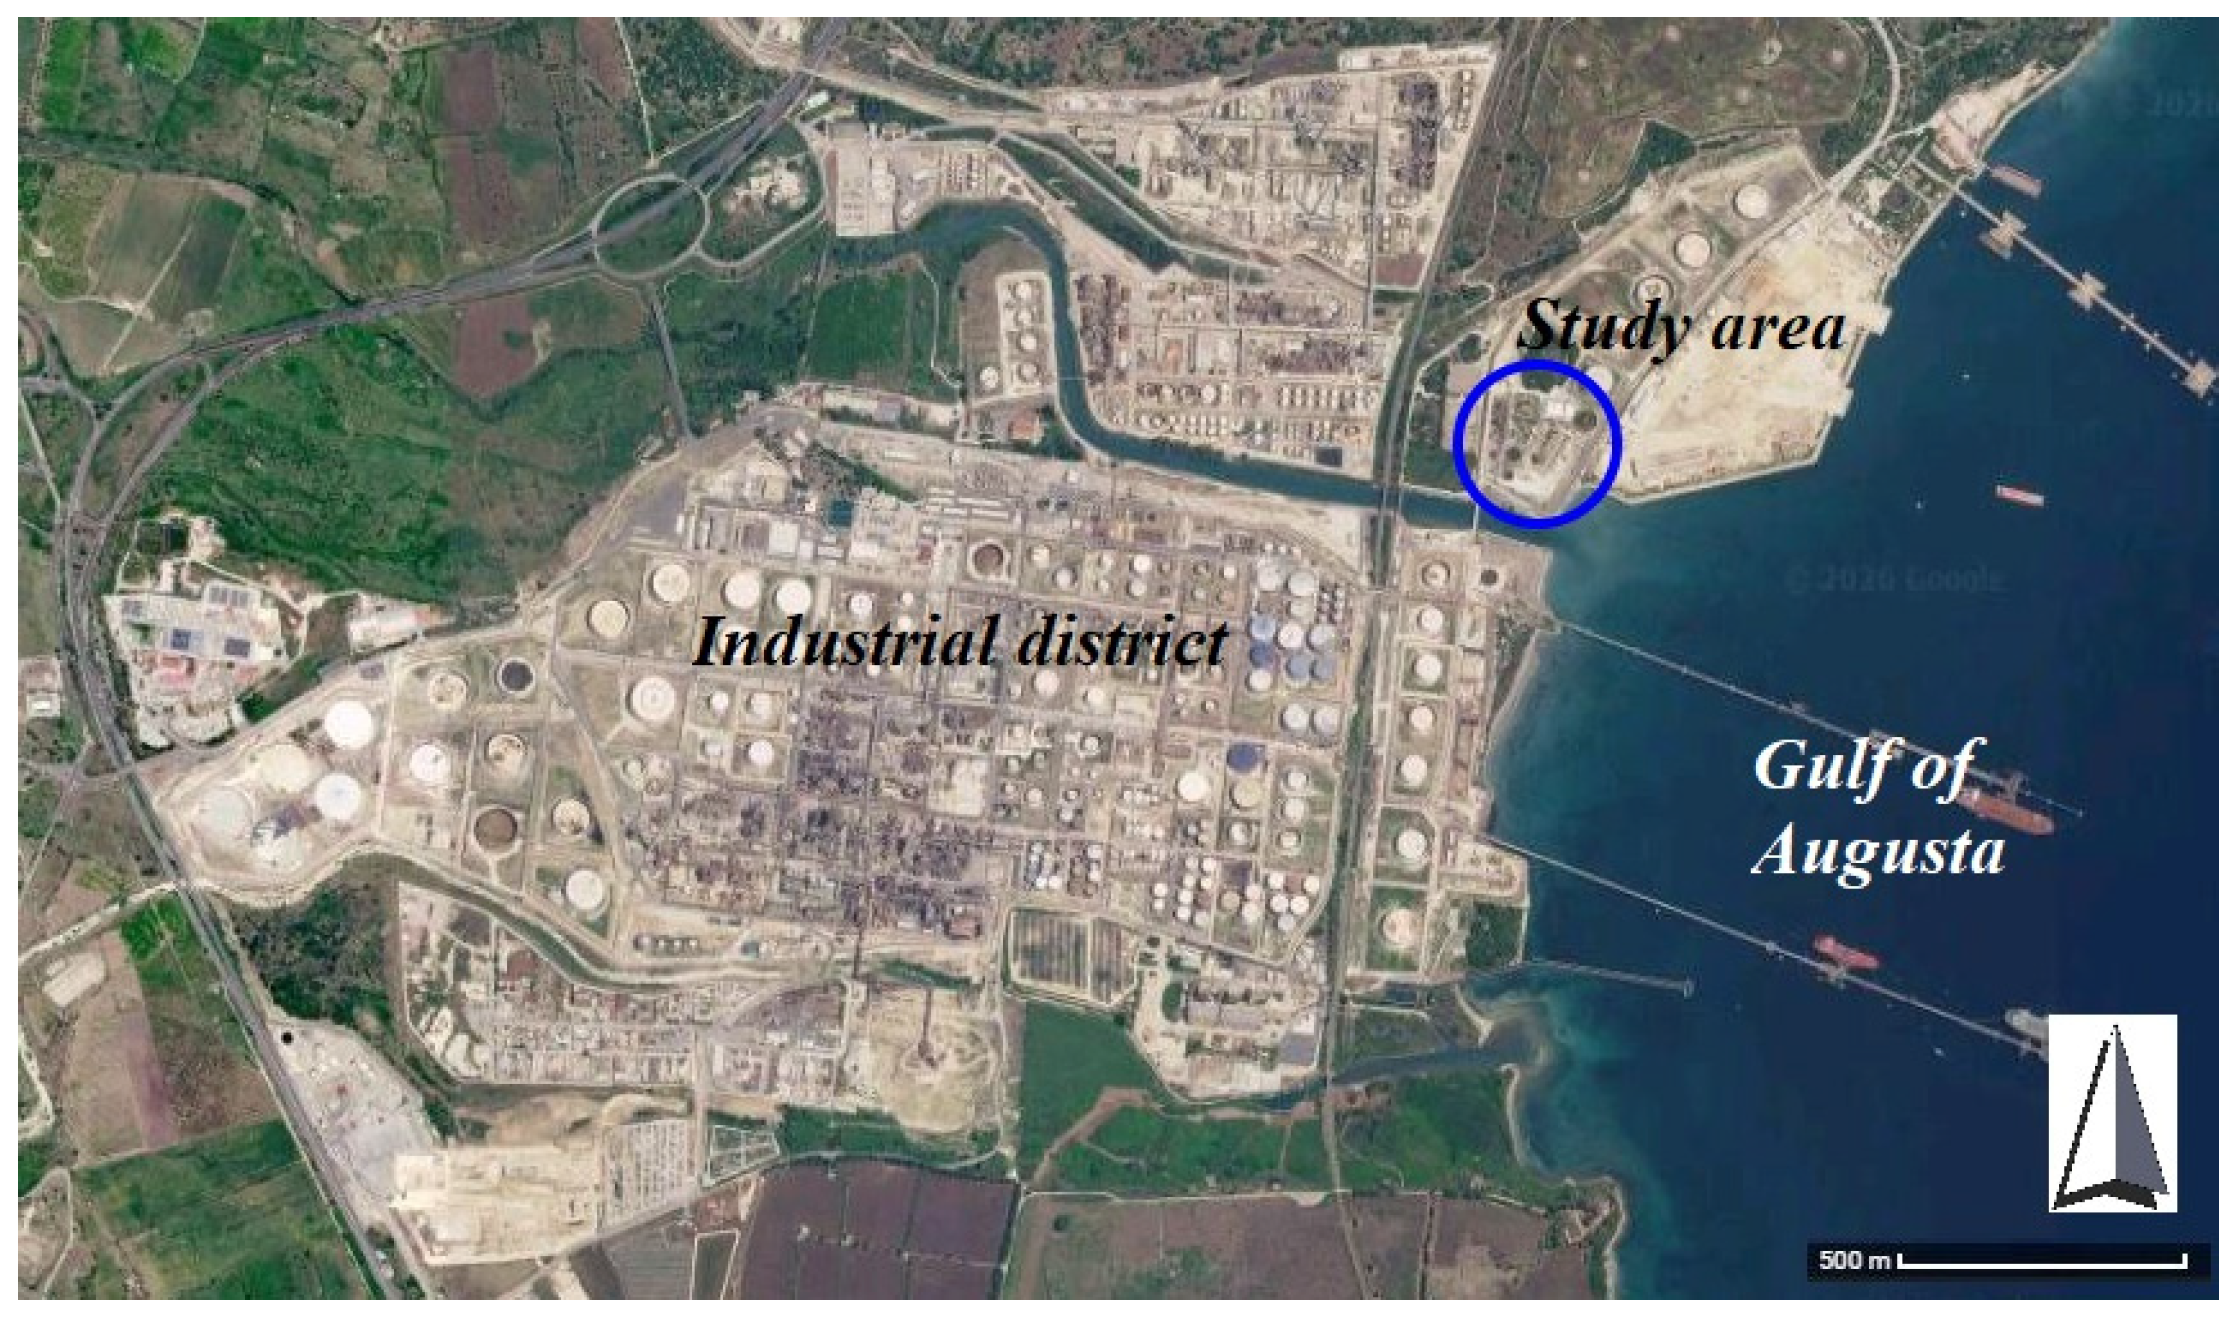
The city of Augusta, located on the eastern coast of Sicily (Italy), is part of the Hyblean Plateau (Figure 2). The thickness of the deposits varies between 50 and 300 m. The upper layer is composed of recent alluvial soils which rest on Pleistocene marine clays, referred to as Augusta blue-gray clay. The area under investigation overlooks the large natural Gulf of Augusta (Figure 3).
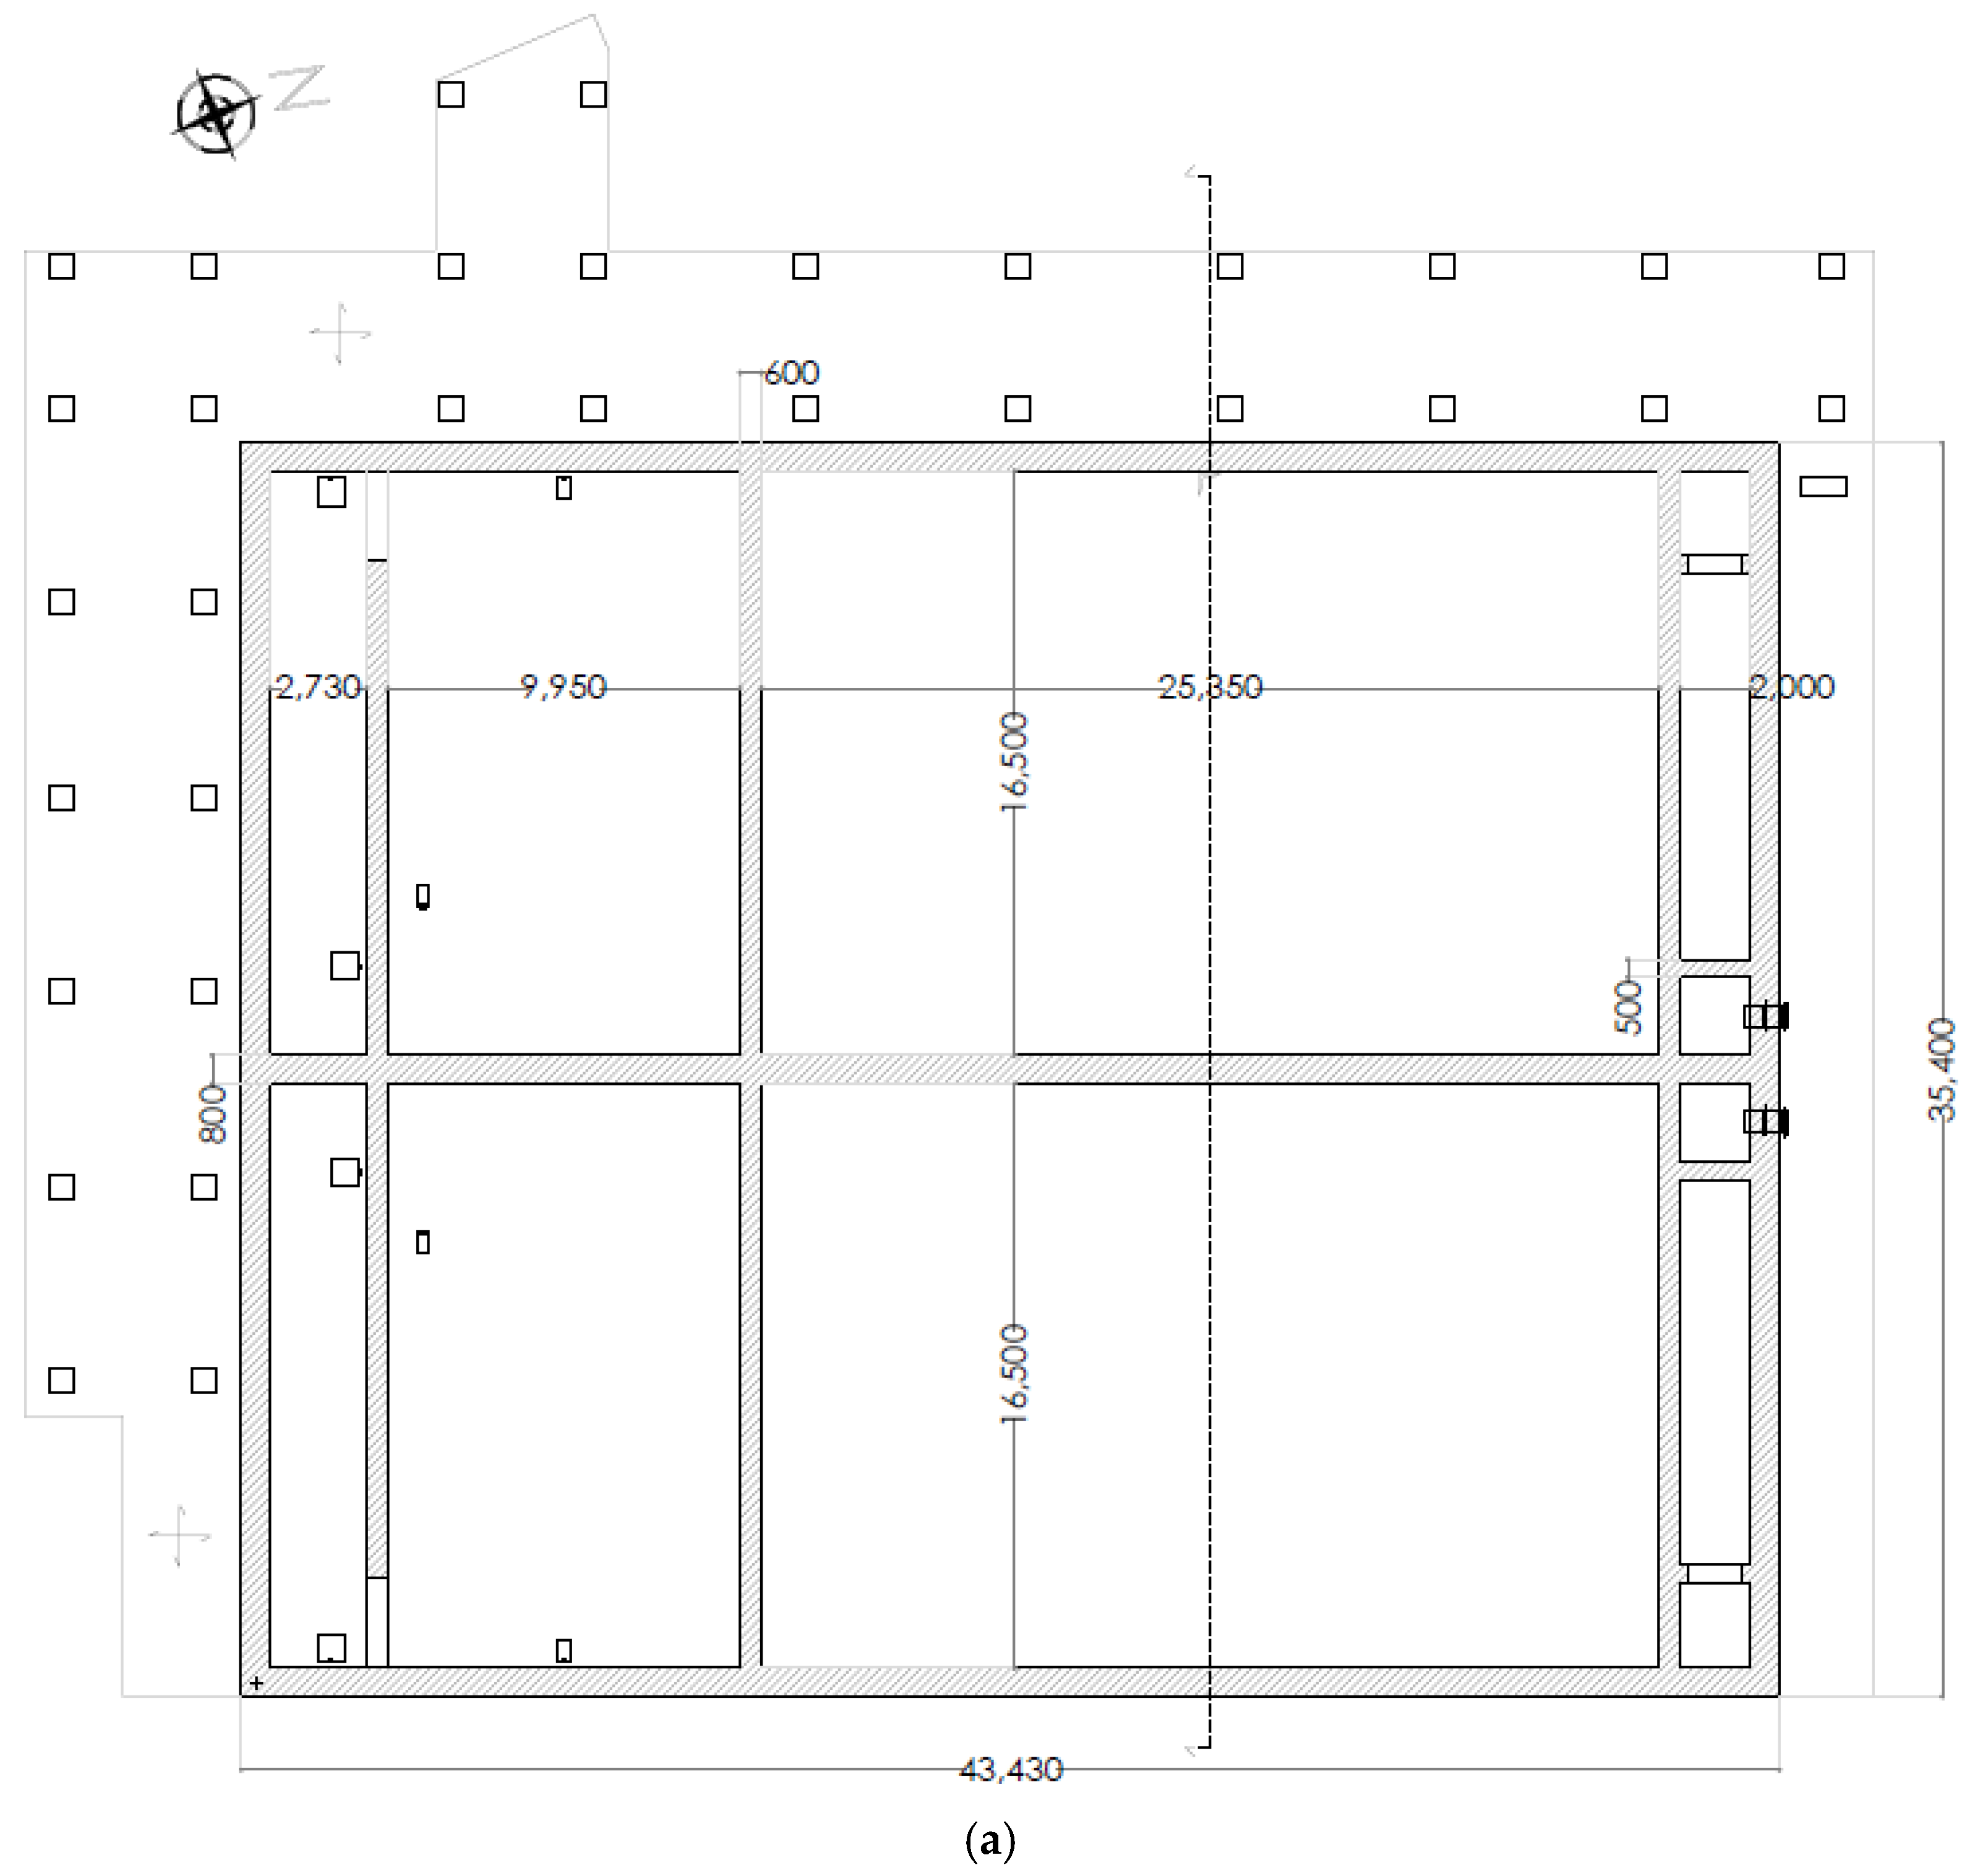
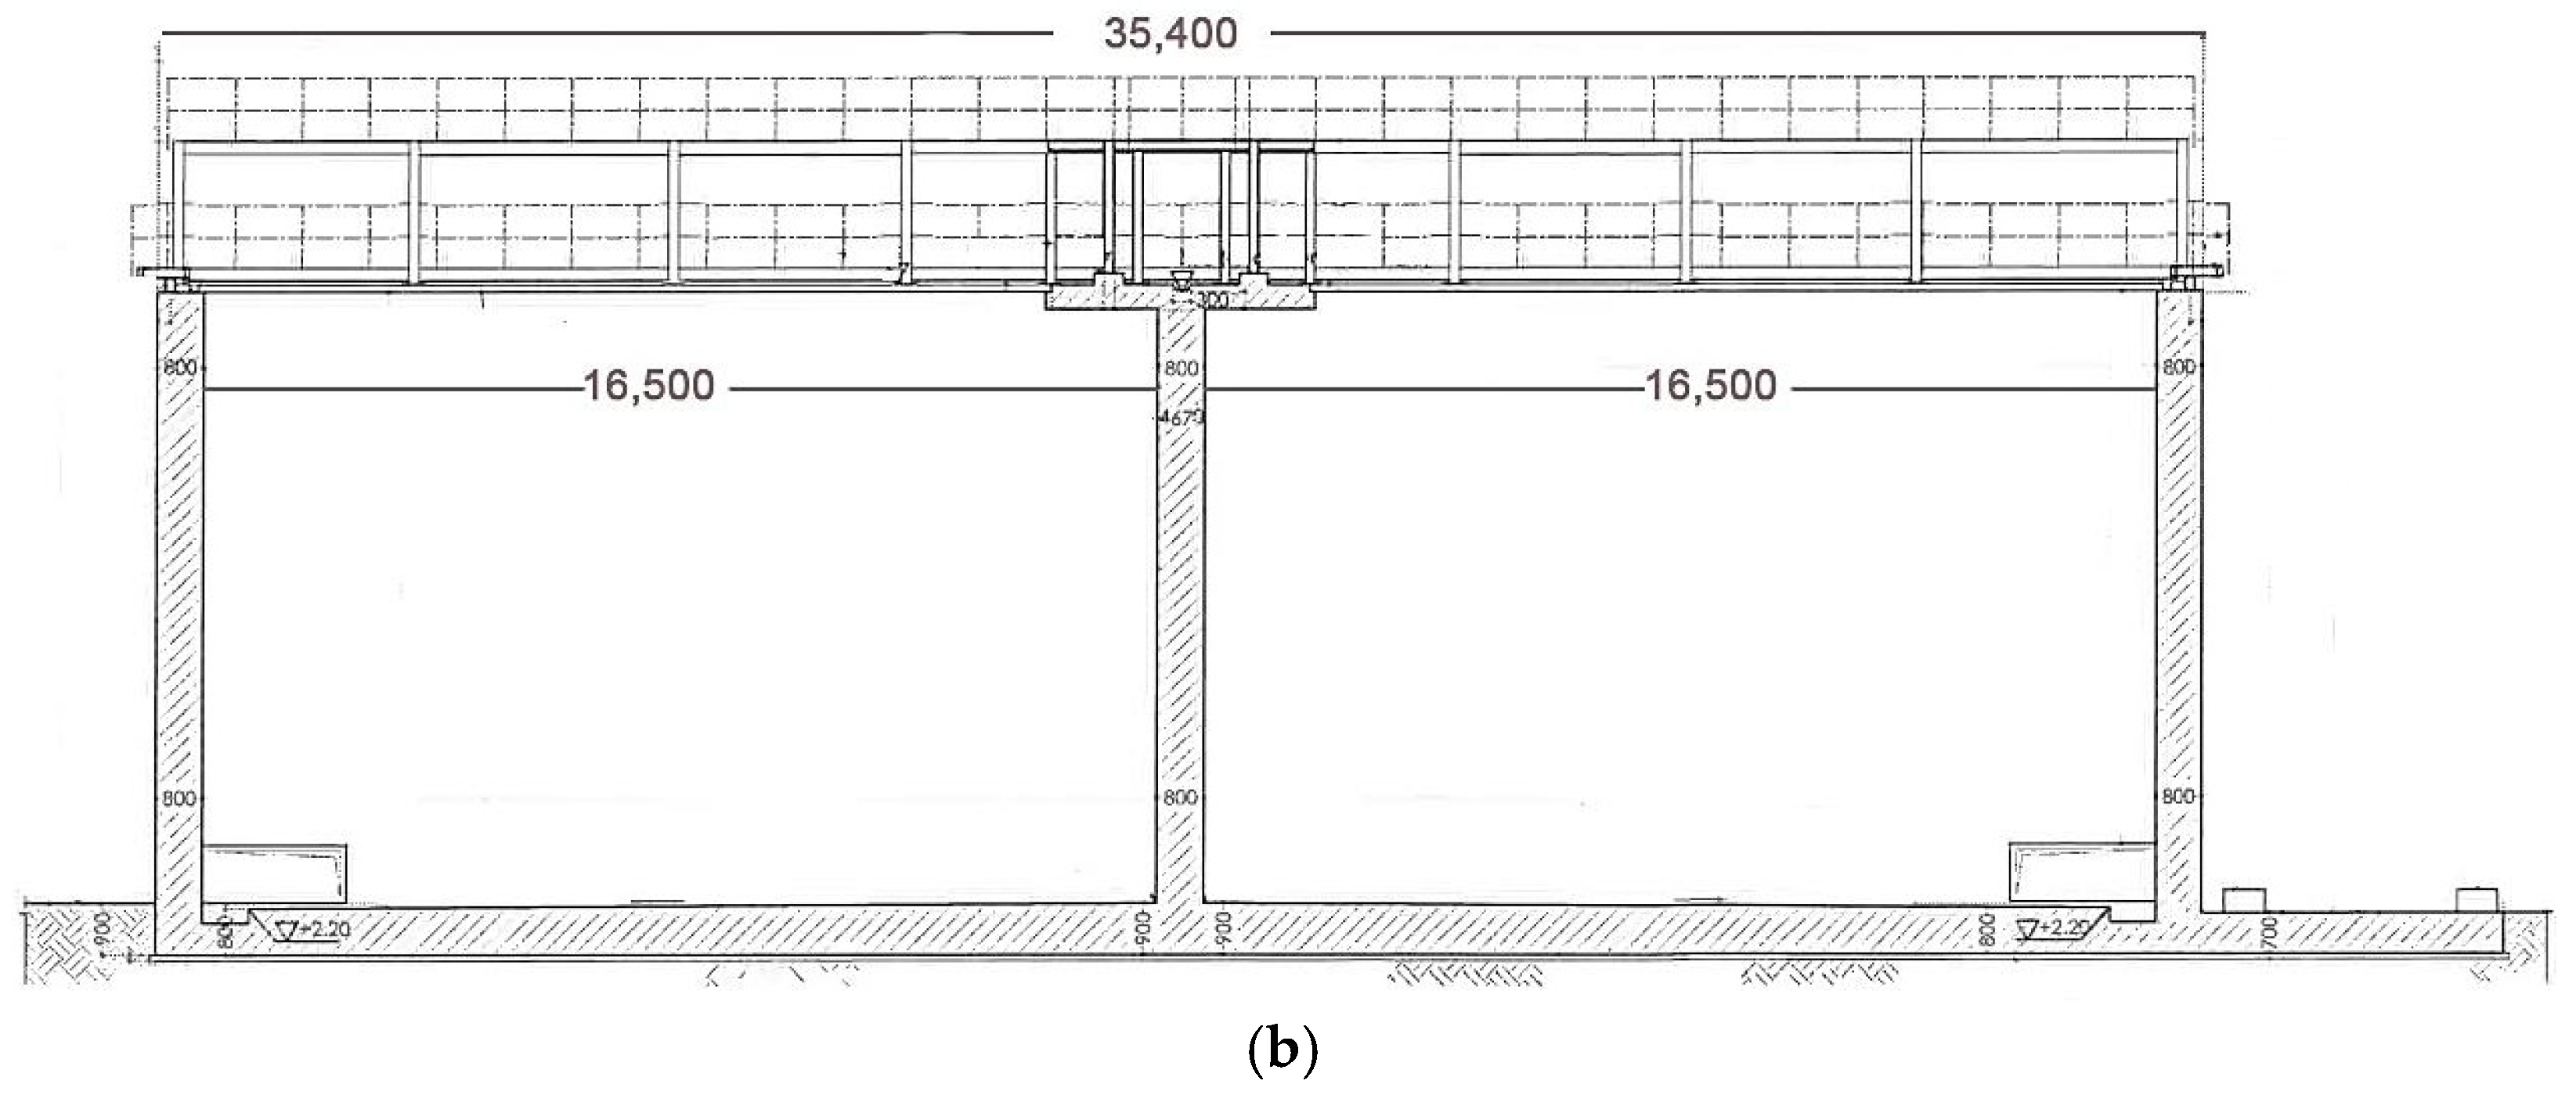
The biological basin under consideration has a rectangular base, with plan dimensions of 43.43 m × 35.40 m, walls 10.60 m high and 50, 60, and 80 cm thick. The foundation slab extends beyond the structure and has thicknesses of 80 cm (within the footprint of the structure) and 70 cm (outside). The foundation level is 85 cm below the external level. The structure has a longitudinal axis of symmetry. The biological basis is expected to contain wastewater with a specific weight of 1080 kg/m3, up to a depth of 7.20 m from the top of the slab. It consists of two tanks, which can be filled either individually or simultaneously.
The plan view and a representative section of the biological basis are shown in Figure 4.

3. Investigation Campaign and Geotechnical Characterization

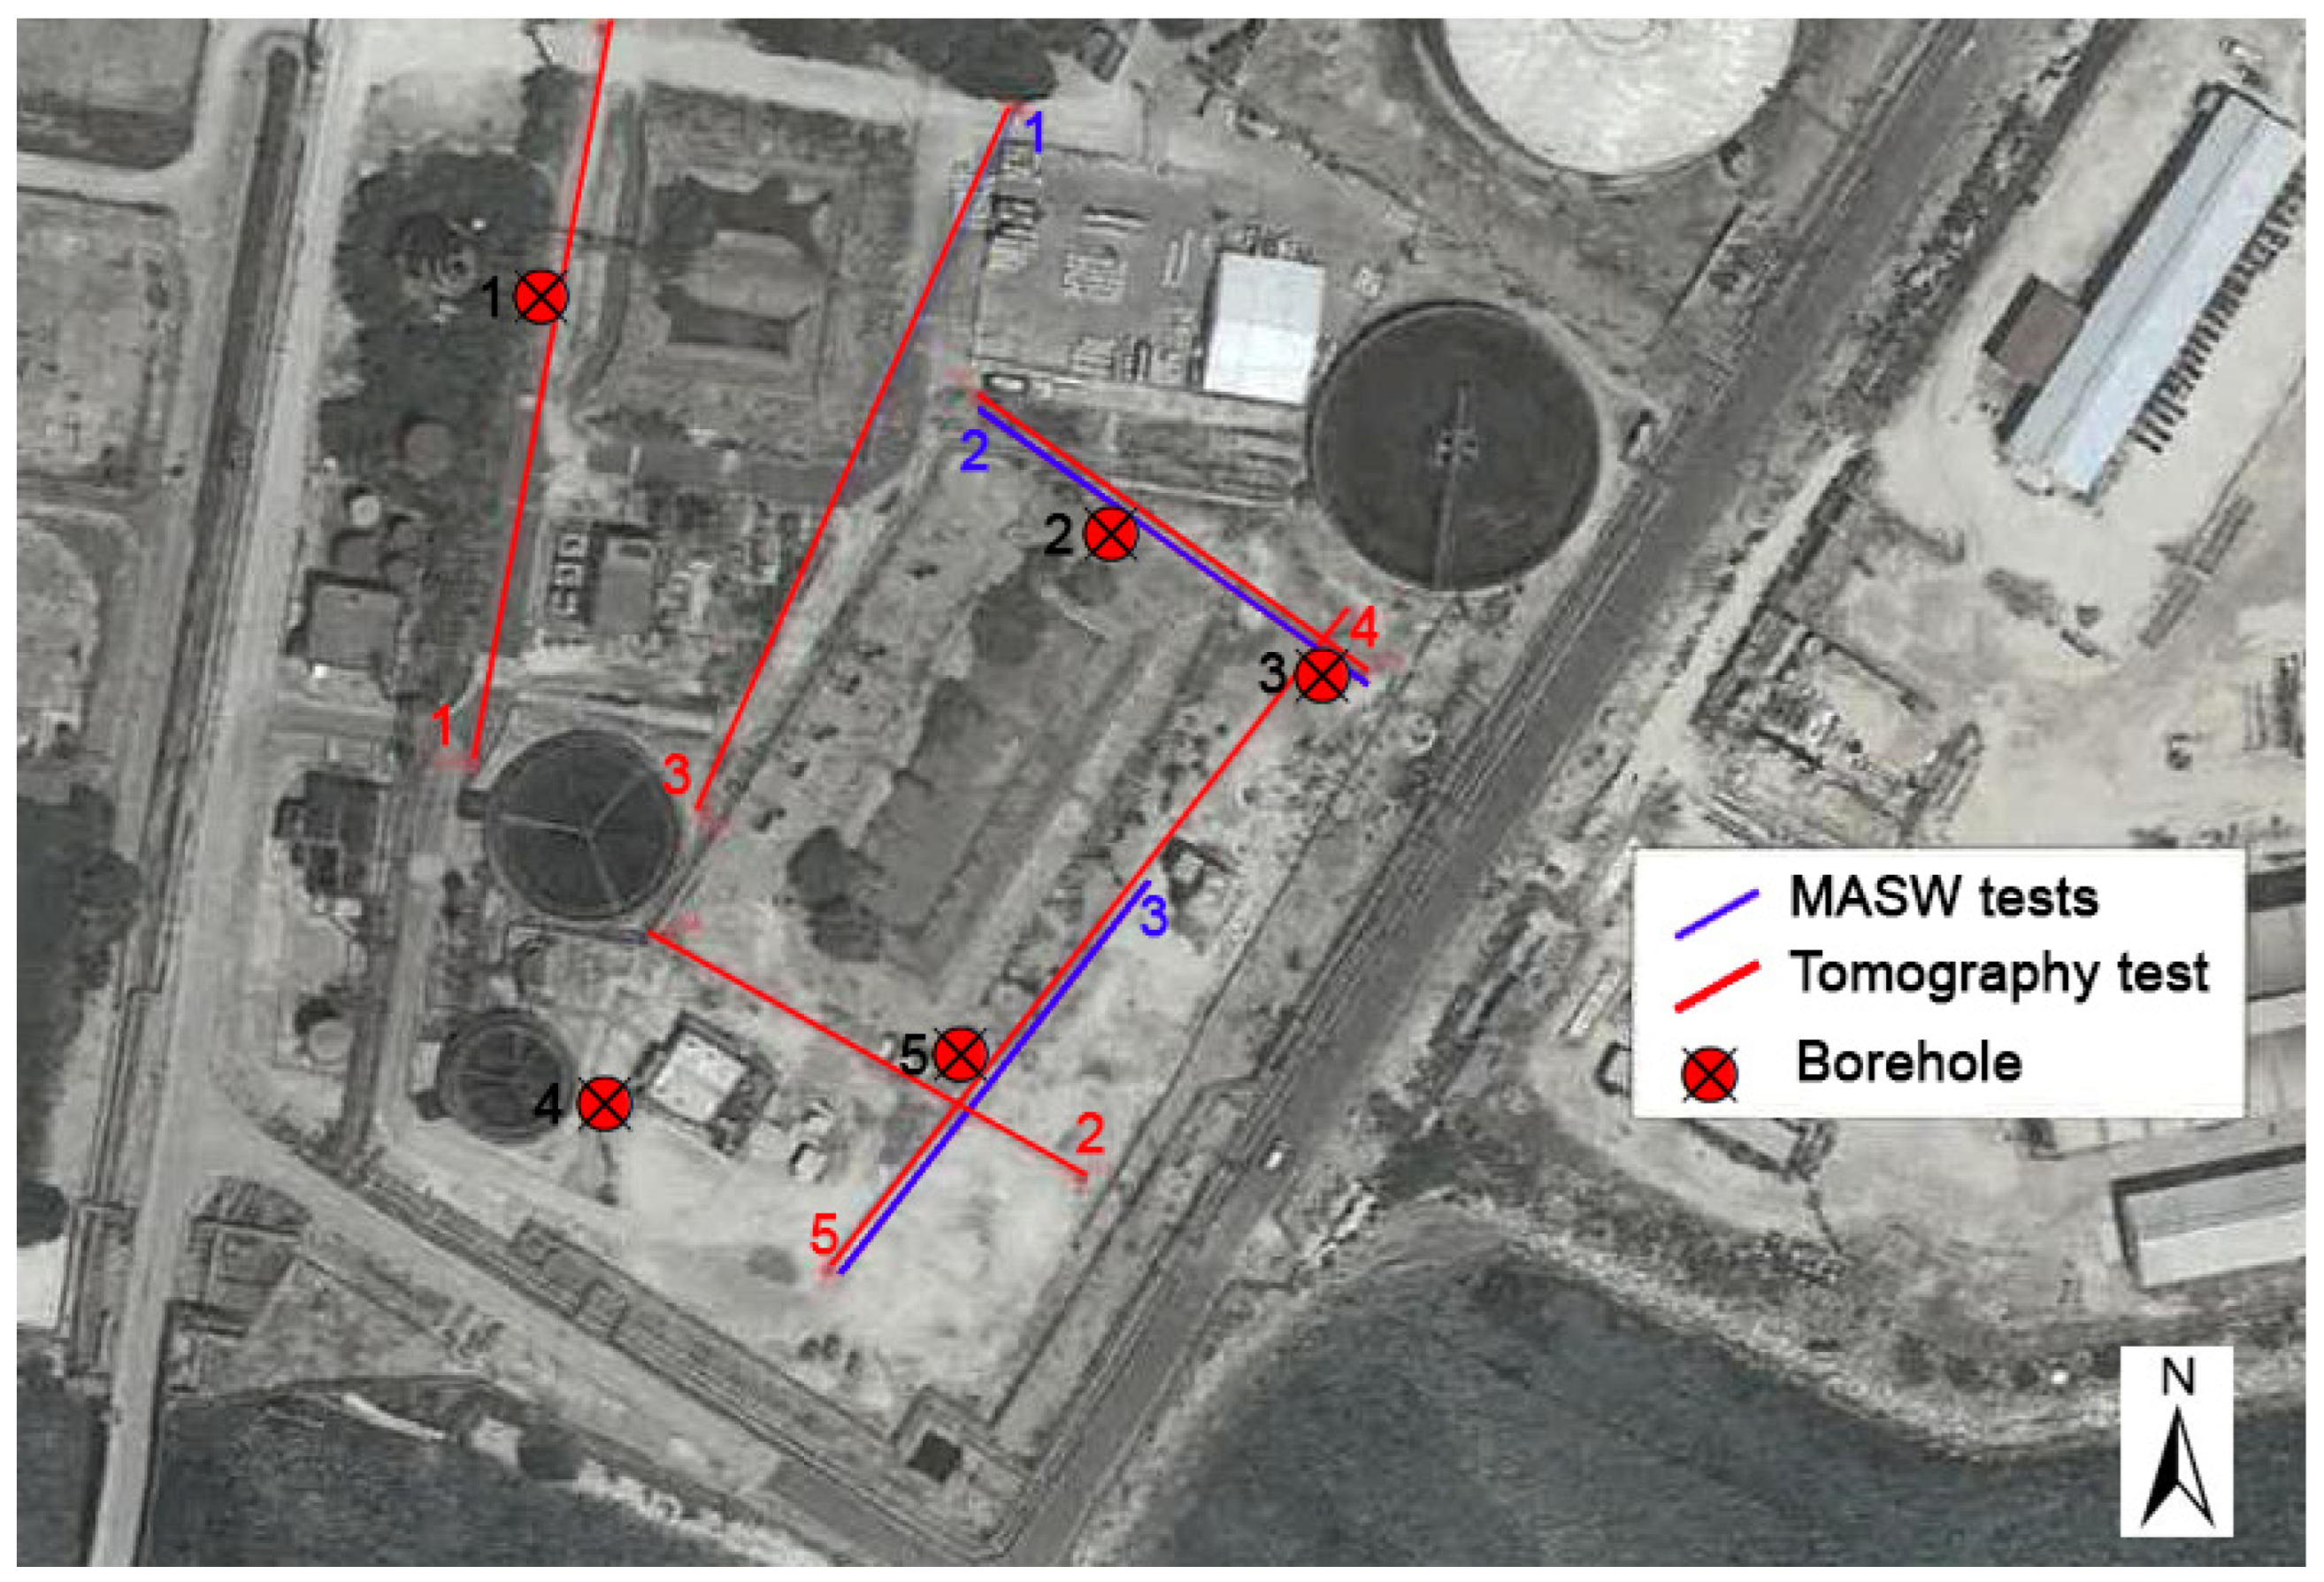
To define the geotechnical model, a qualitative and quantitative evaluation of the data was performed based on the results obtained from the geological investigations, geotechnical tests, and seismic tests. Specifically, the geotechnical investigation included: N. 5 boreholes; the collection of N.11 undisturbed samples and N.29 reconstituted samples for the execution of laboratory tests; N. 30 Standard Penetration Tests (SPT); N.5 active seismic tomography tests; N. 3 Multichannel Analysis of Surface Waves (MASW) tests. The location of in-site investigations is shown in Figure 5.
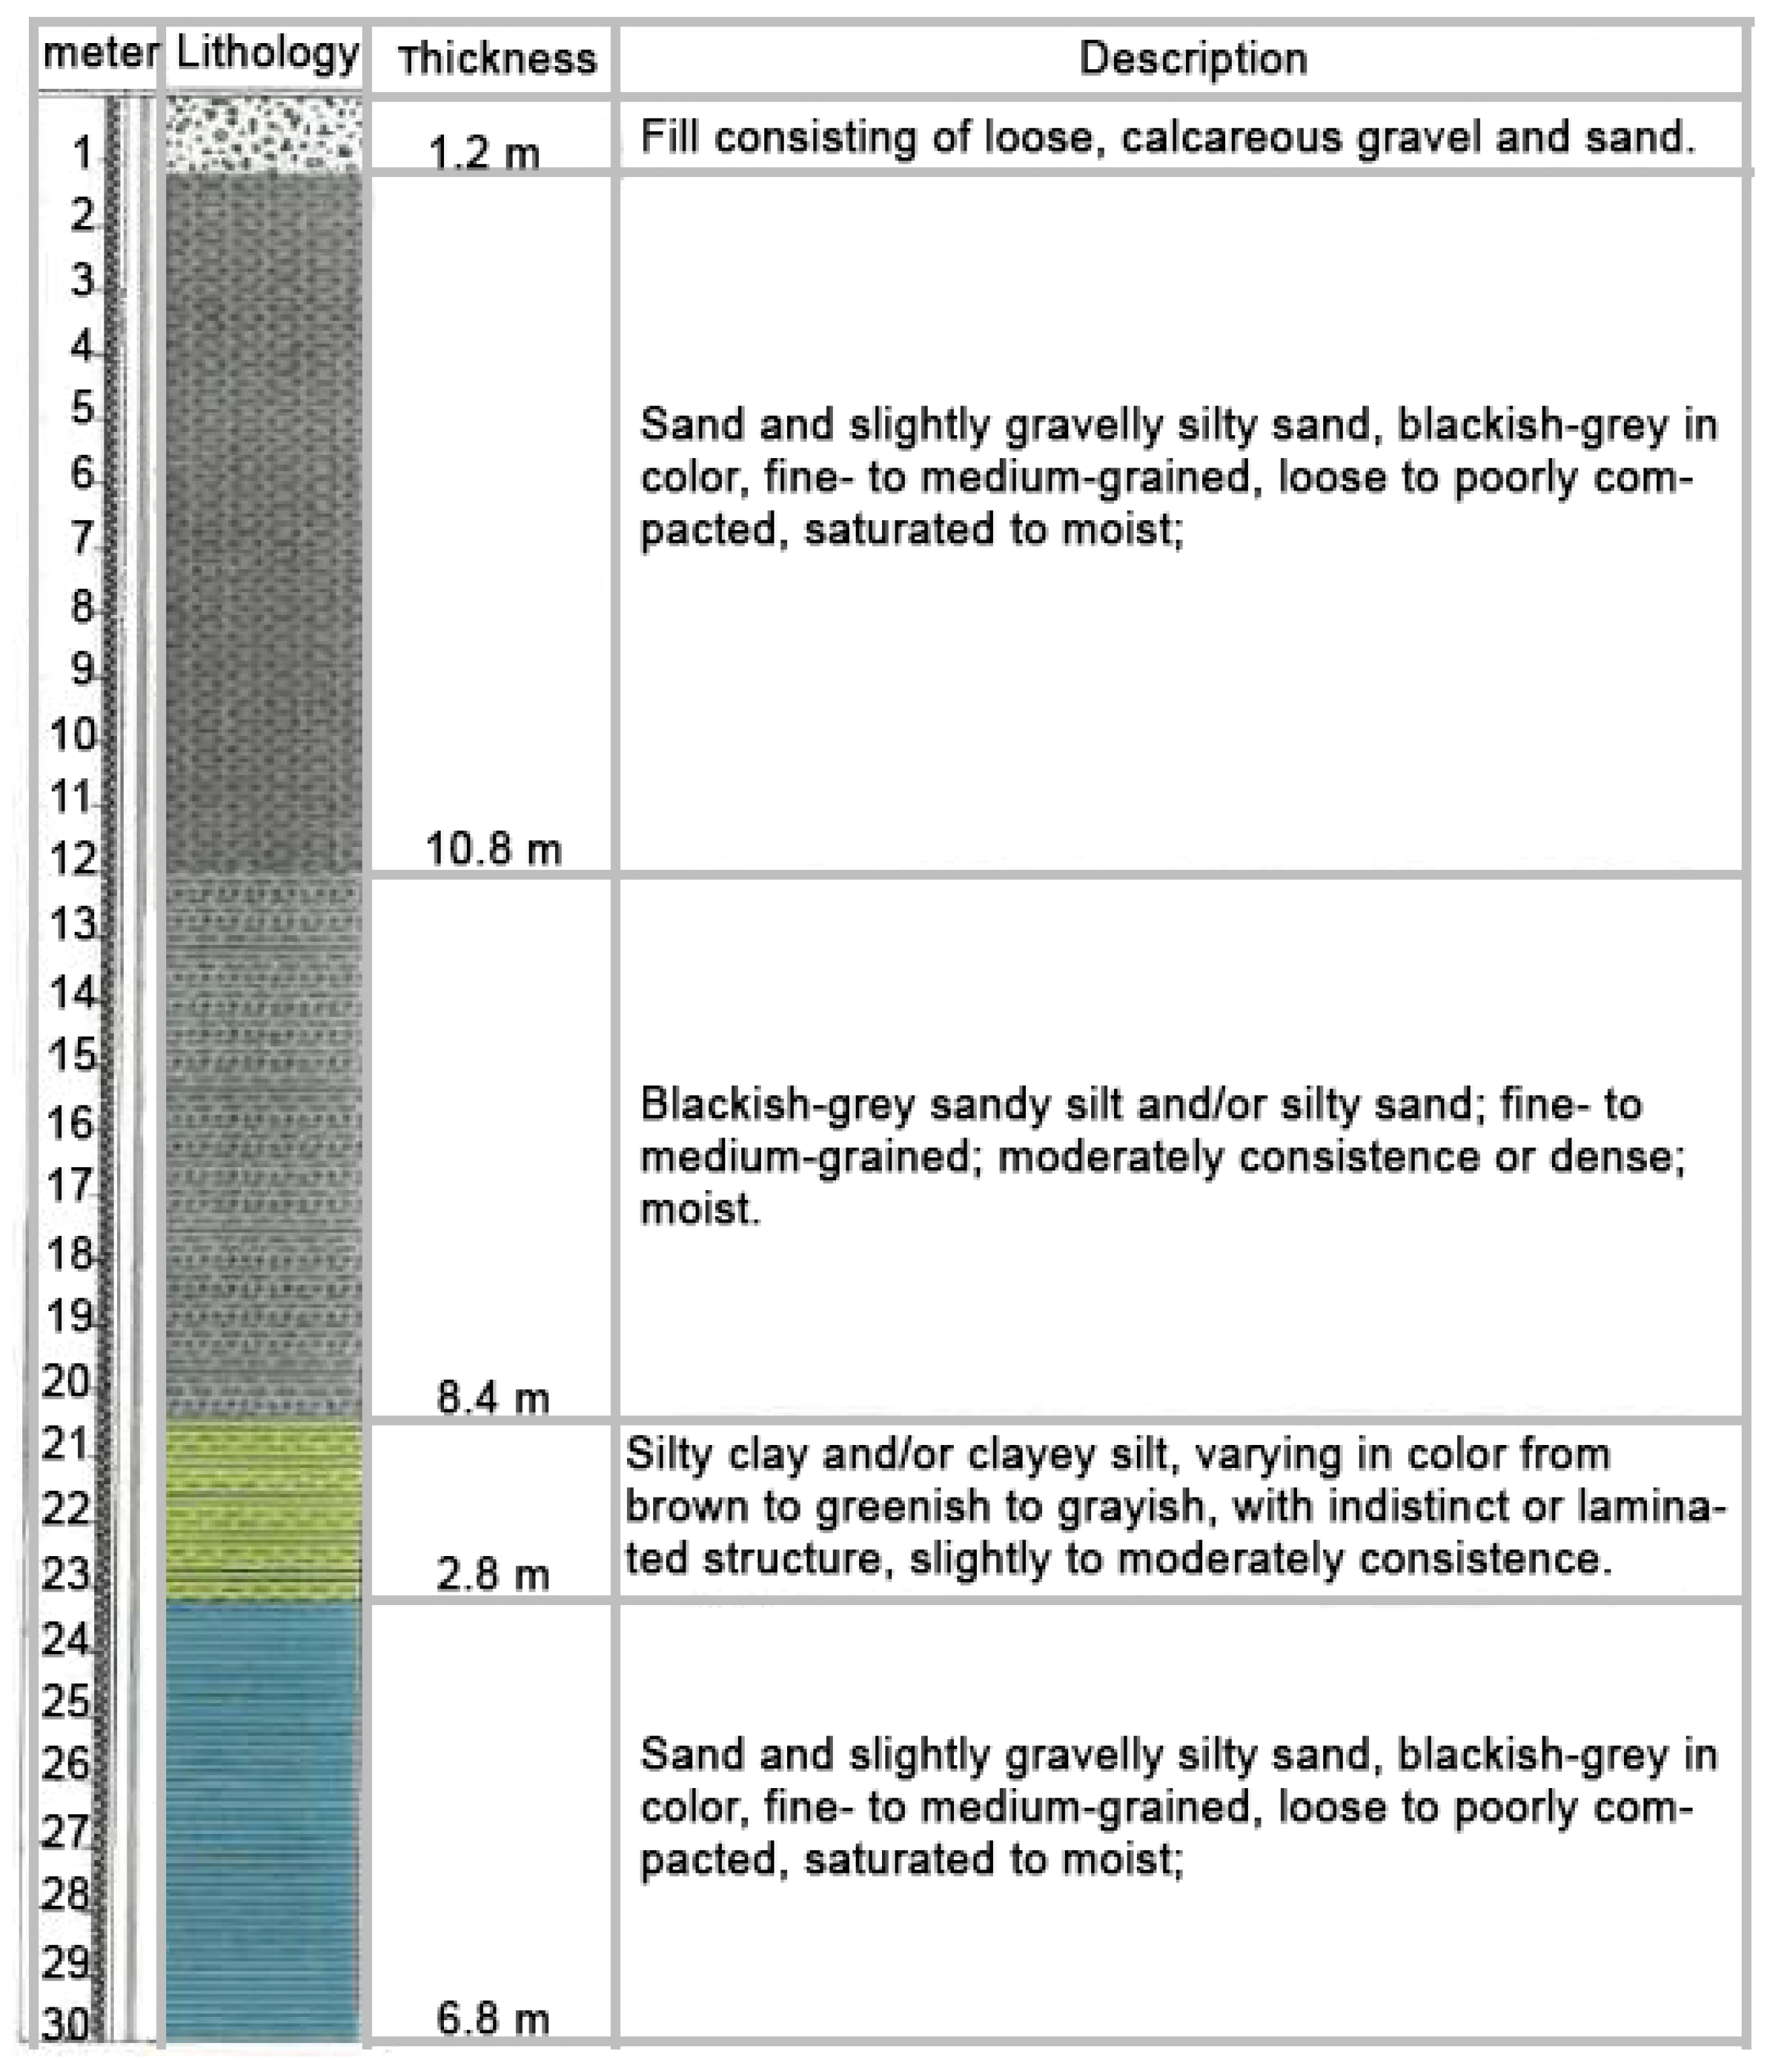
Borehole results reveal the presence of loose, alluvial, detrital soils with low bearing capacity. This detrital layer rests on gray-blue Pleistocene clays characterized by a superficial alteration horizon (Figure 6). The water table was found at a depth of 1.90 m.
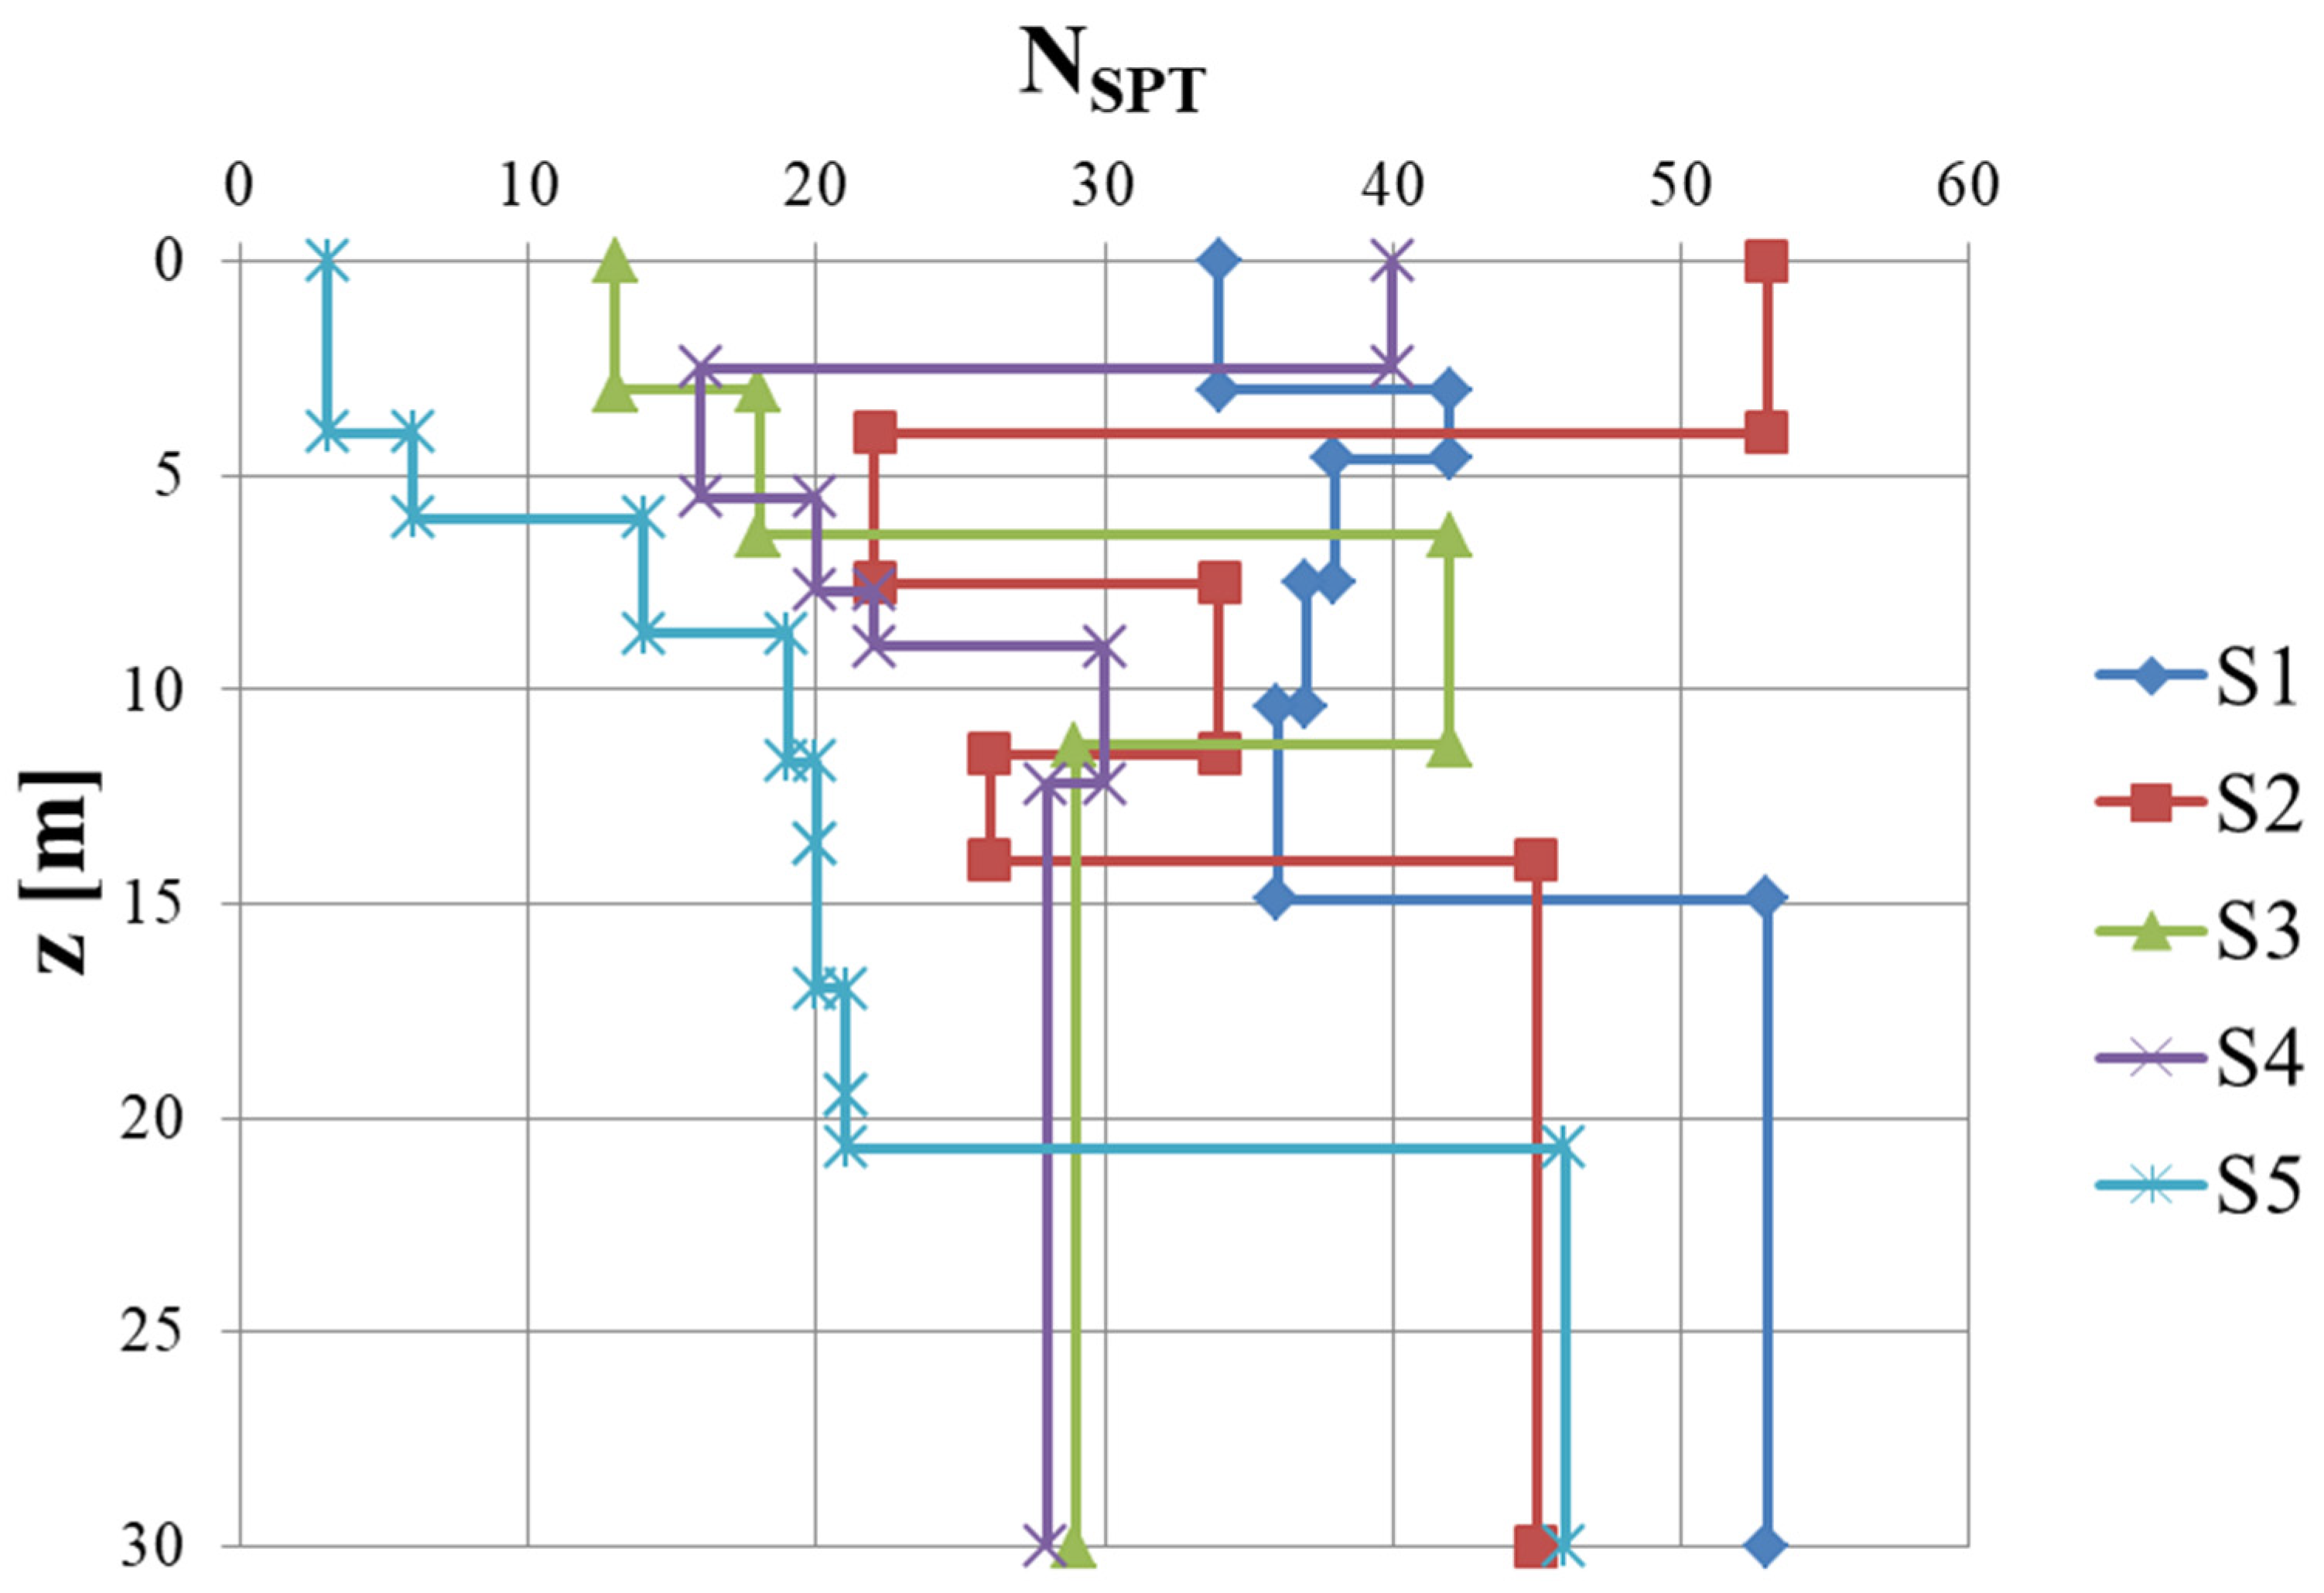
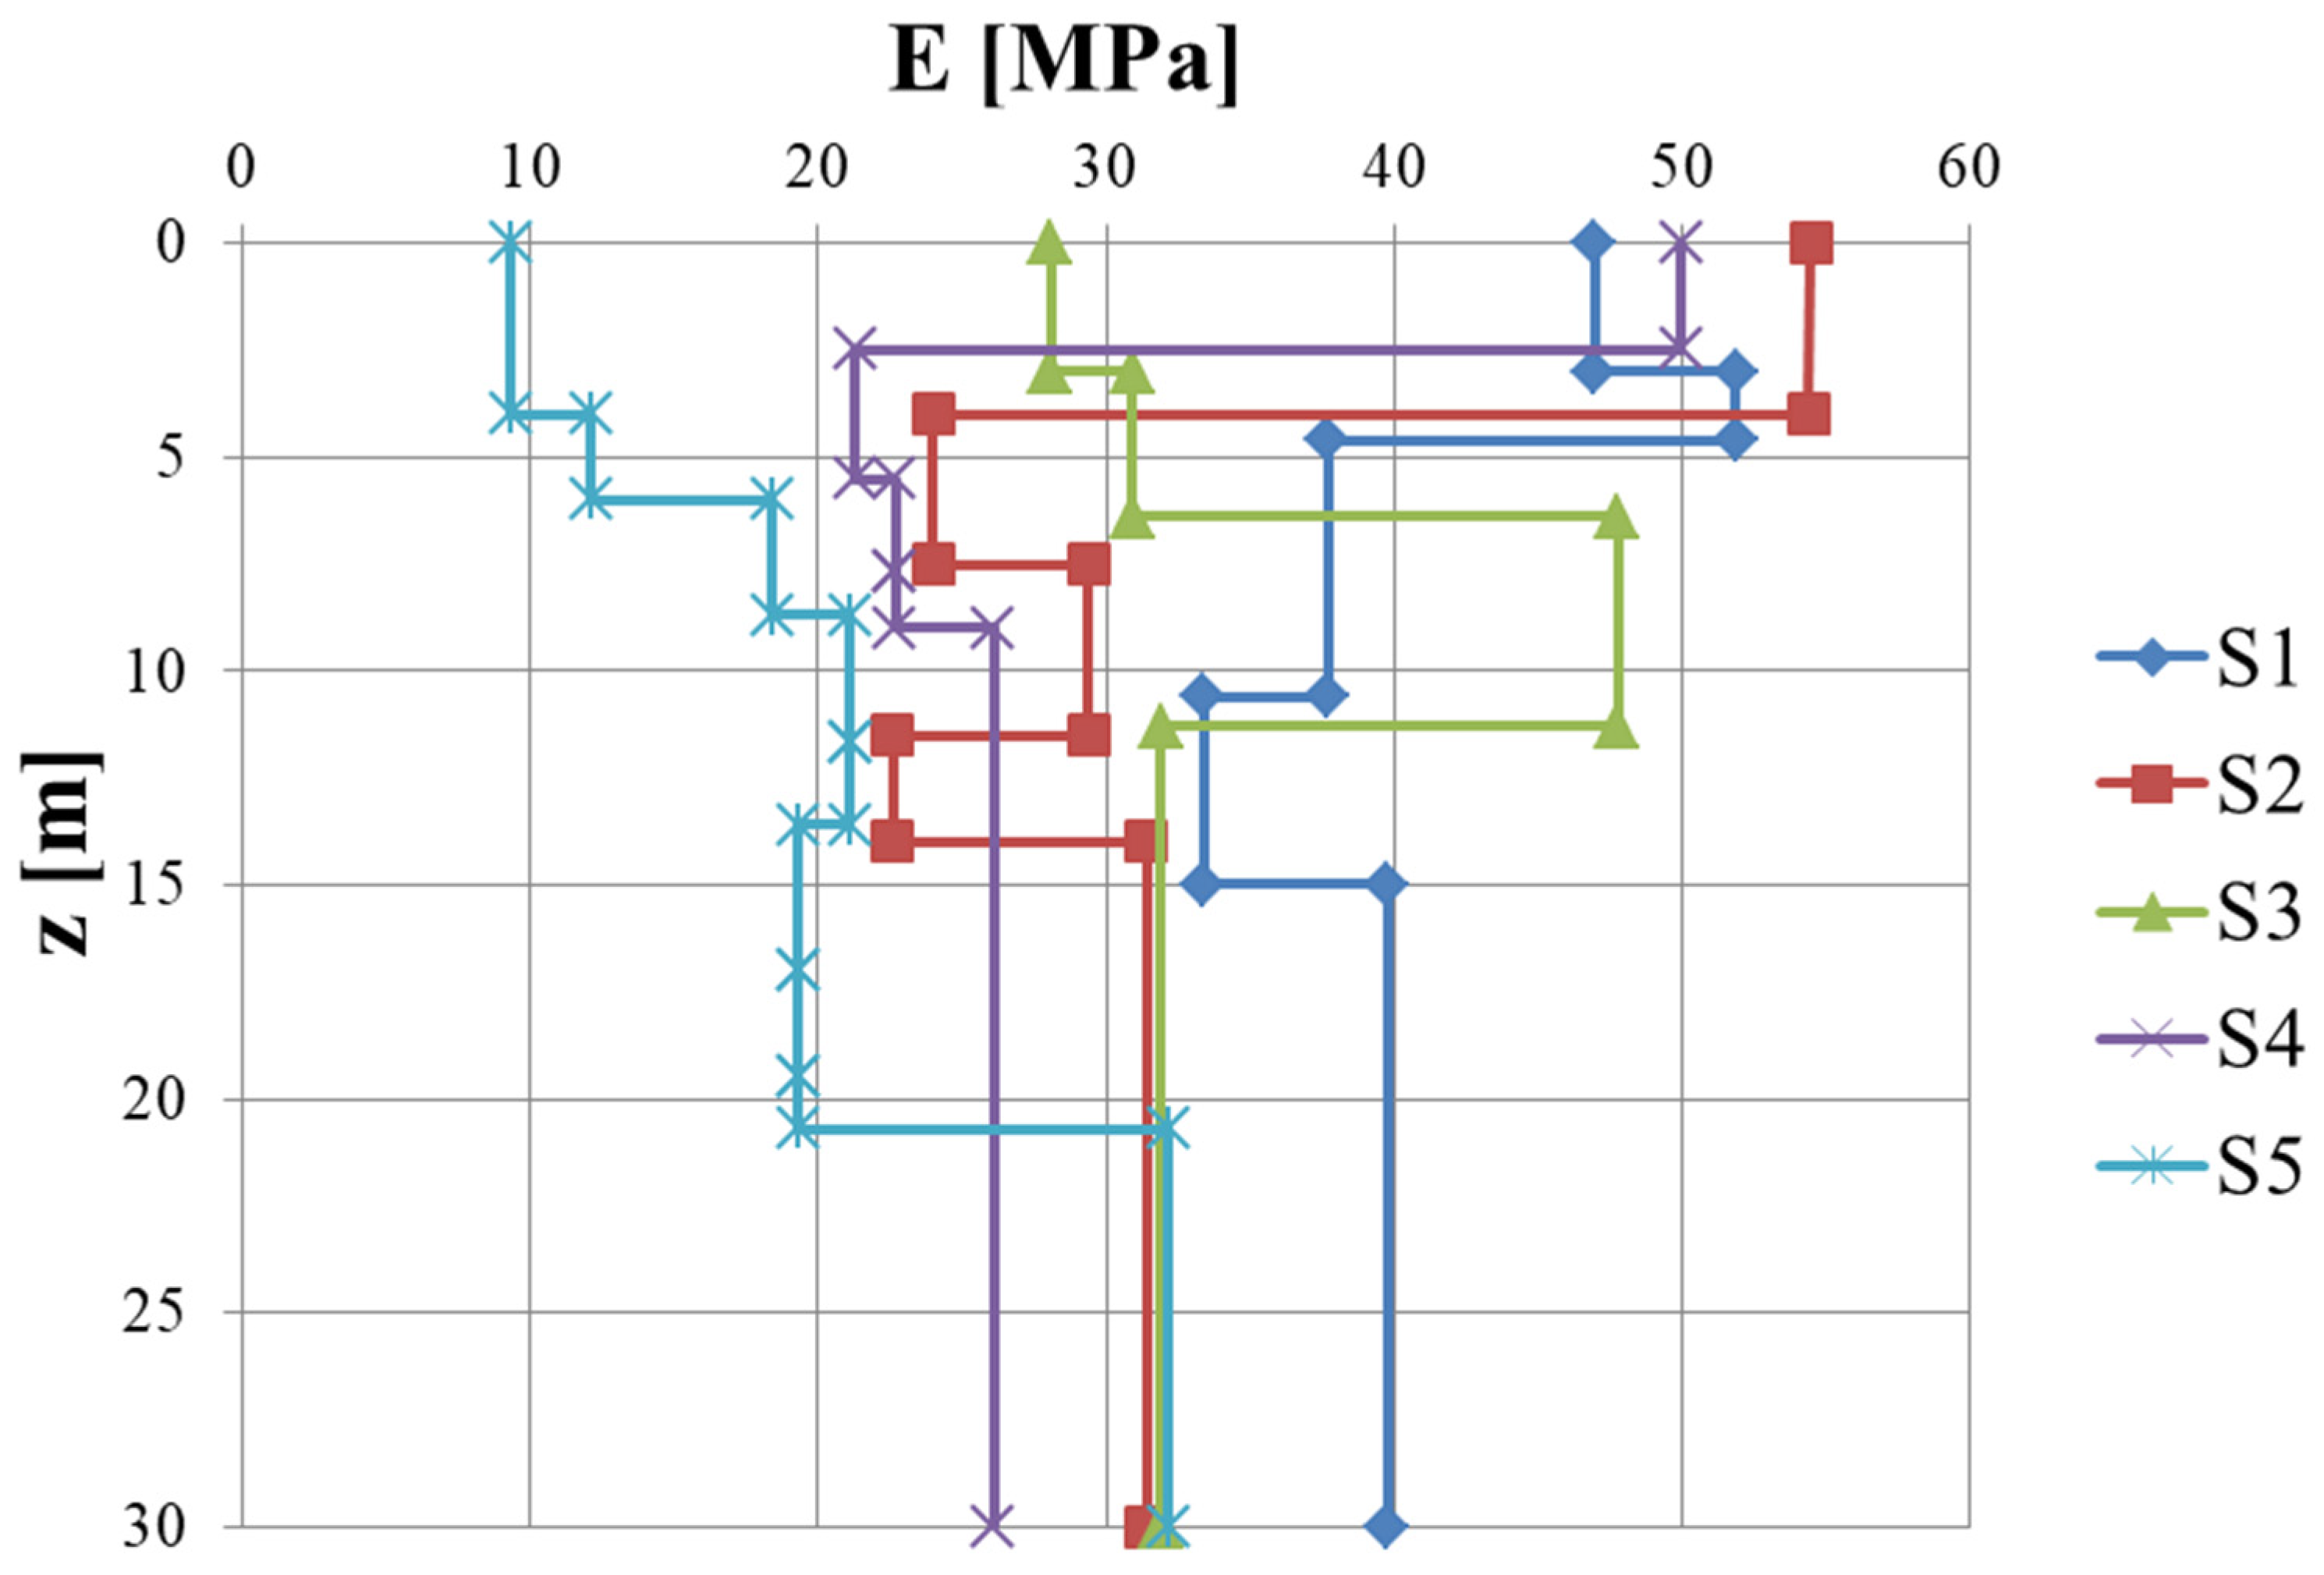
The SPT results, reported in Figure 7, show high variability at shallow depths. At approximately 10 m below ground surface, the variability decreases significantly. The mean modulus of elasticity, E, calculated from the SPT test data, is reported in Figure 8.
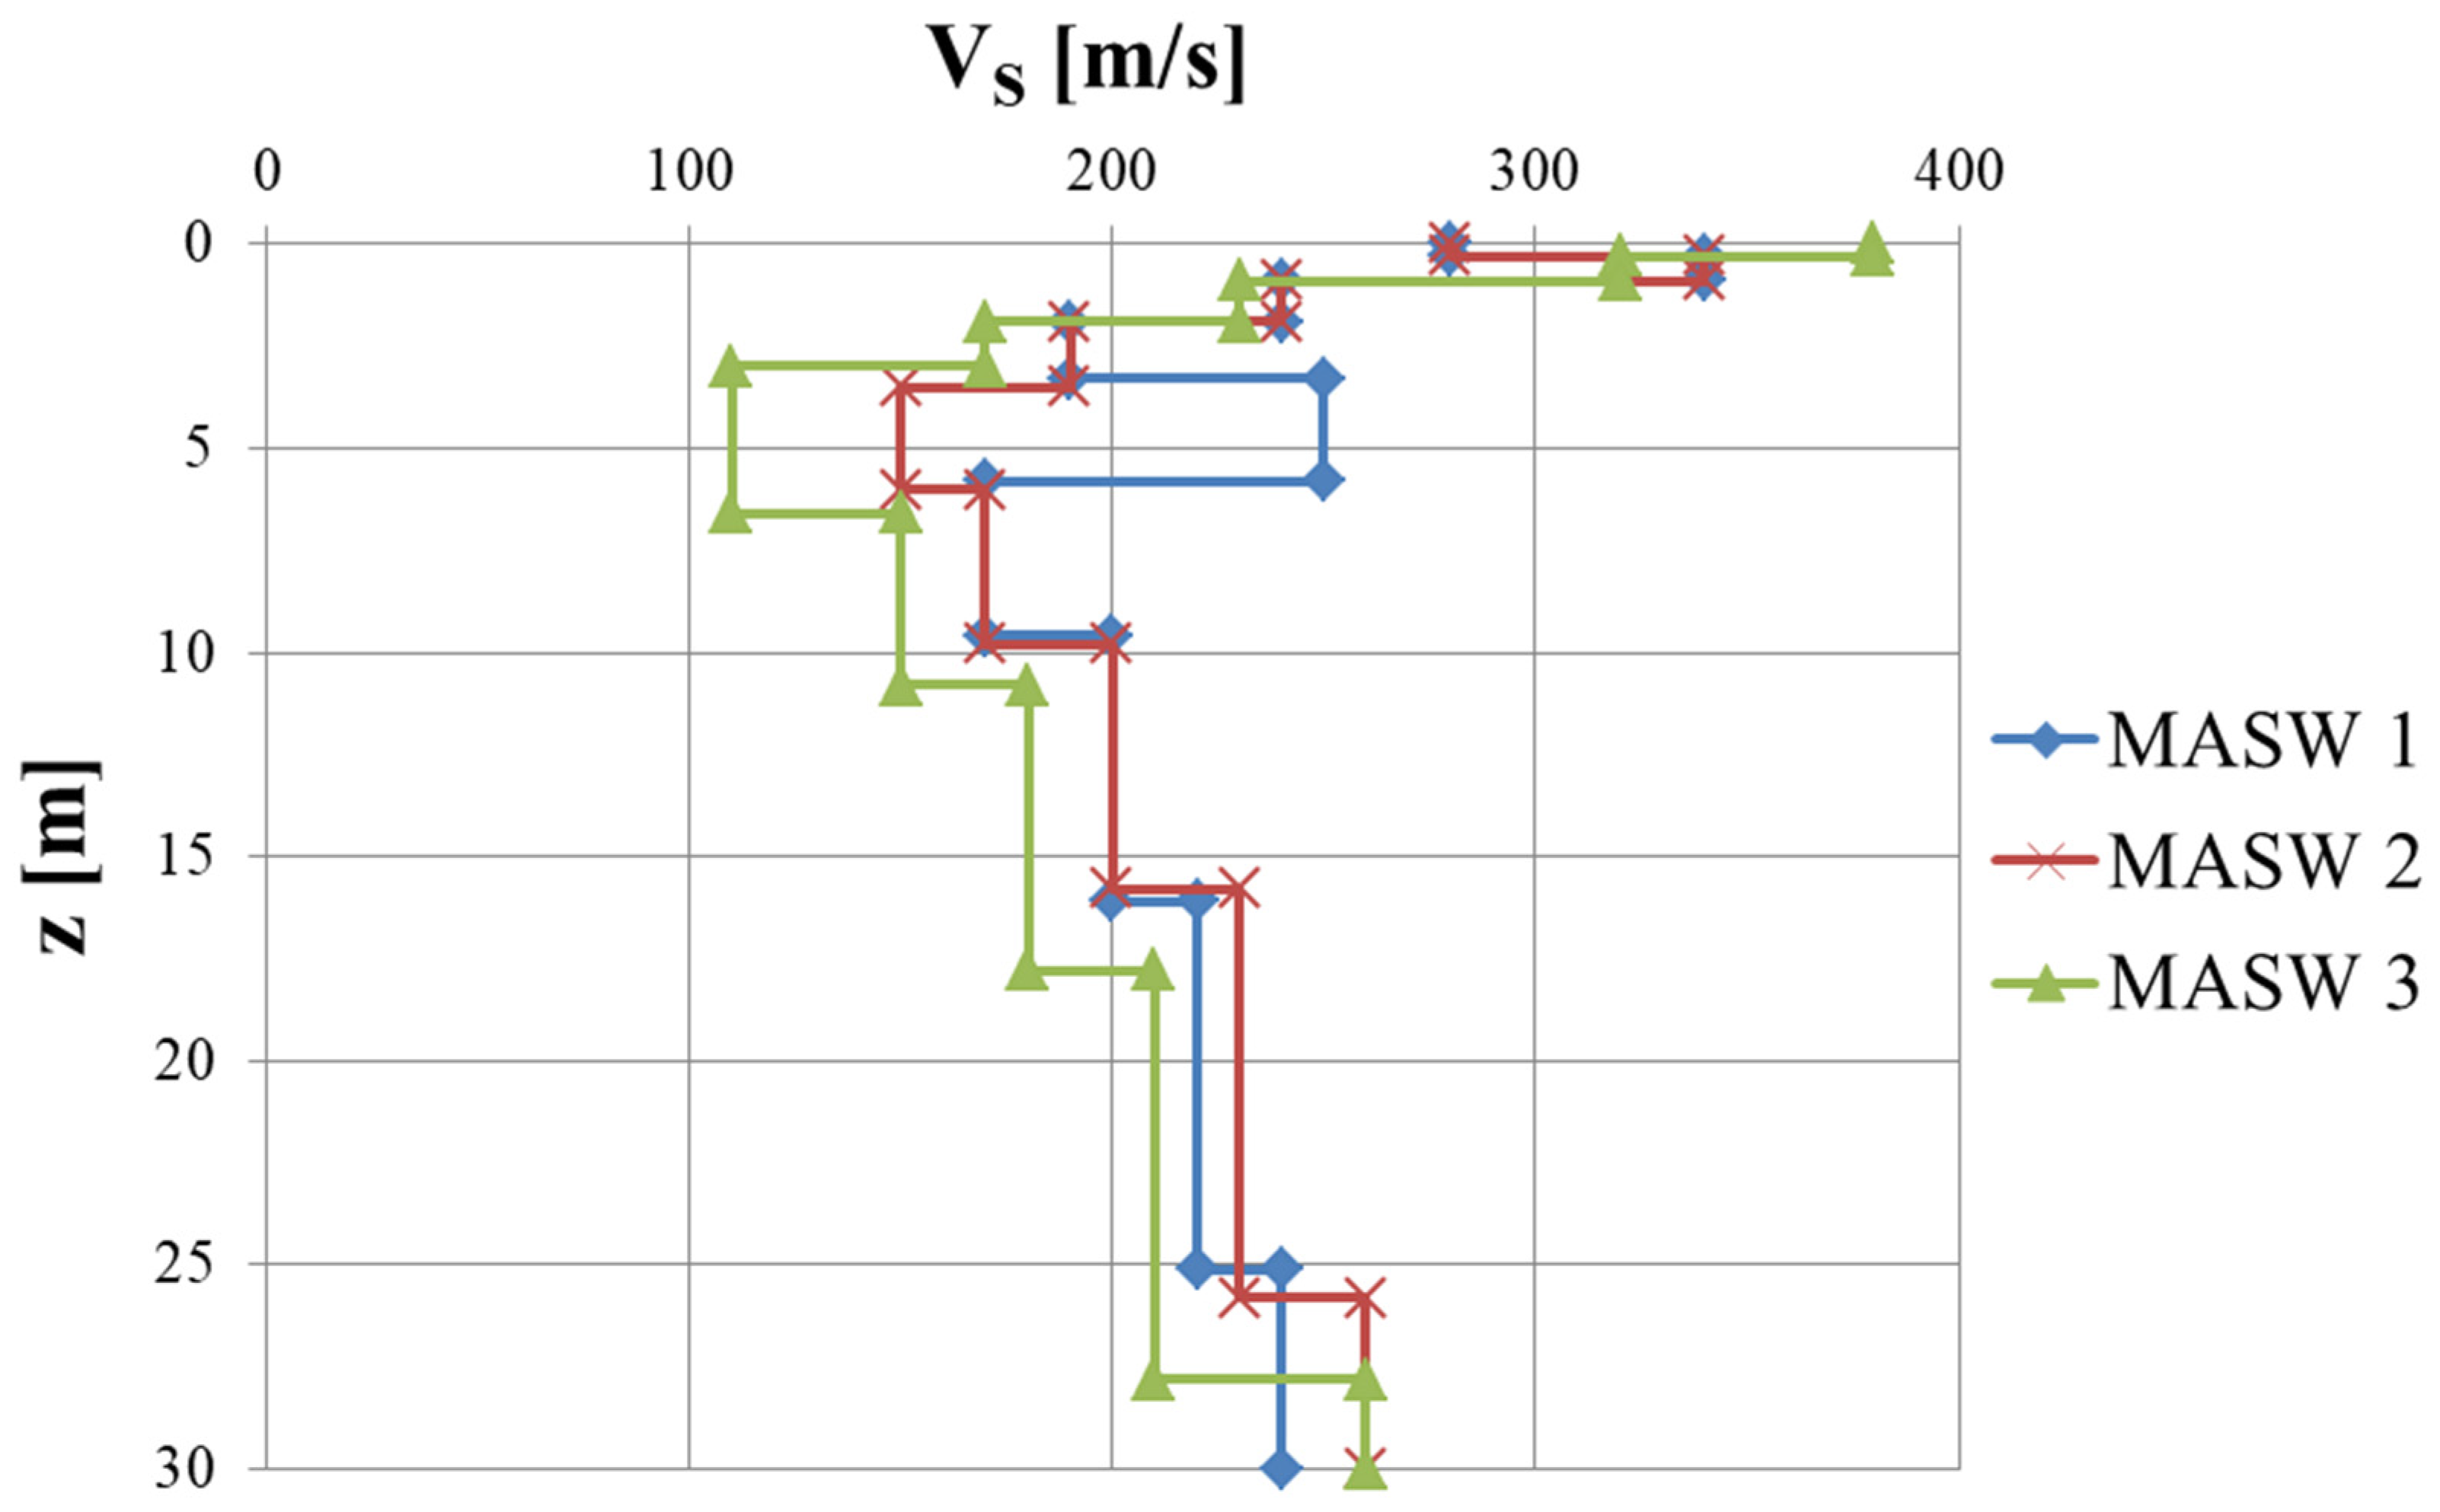
The shear wave velocity, Vs, profiles derived from MASW tests are displayed in Figure 9. It shows an approximately uniform trend with depth, with velocity inversions near the surface, indicating the presence of a stiffer superficial layer.
Based on the results obtained from the in situ and laboratory tests, the geotechnical characterization of the soil layers under consideration was derived. Values of the geotechnical parameters are reported in Table 1 for each soil layer, where γ is the soil unit weight, γs is the specific weight, c’ is the cohesion, cu is the undrained cohesion, φ’ is the shear resistance angle, φu is the undrained shear resistance angle, E is the modulus of elasticity for the soil, and ν represents the Poisson ratio and VS is the shear wave velocity.

4. Definition of the FEM Numerical Model and Boundary Conditions

In this study, consolidation analyses were conducted using the PLAXIS2D software (Bentley Systems) [27]. It is FEM software that allows for stability and deformation analyses in a variety of geotechnical applications [28,29,30]. The program allows for the simulation of real-world situations involving plane or axisymmetric deformation conditions.
For modeling soil layers, the software allows the use of 6-node or 15-node triangular elements. To obtain more accurate results, the 15-node triangular element was used in this study, as it provides a fourth-order interpolation for the displacements, and the numerical integration uses twelve Gaussian points (stress points). However, their use entails high computational costs in terms of time and memory requirements [31].
In FEM analyses, the mechanical behavior of the soil is described through constitutive models. One of the most widely used constitutive models is the Mohr–Coulomb model, which was employed in this study and requires five input parameters. The geotechnical properties of each layer used for the FEM numerical modeling are reported in Table 2.
The modulus of elasticity, E, was not directly measured. It was derived from SPT blow counts, NSPT, using well-established empirical correlations [32,33]. The unit weight and resistance parameters were instead obtained from laboratory tests conducted on undisturbed samples.
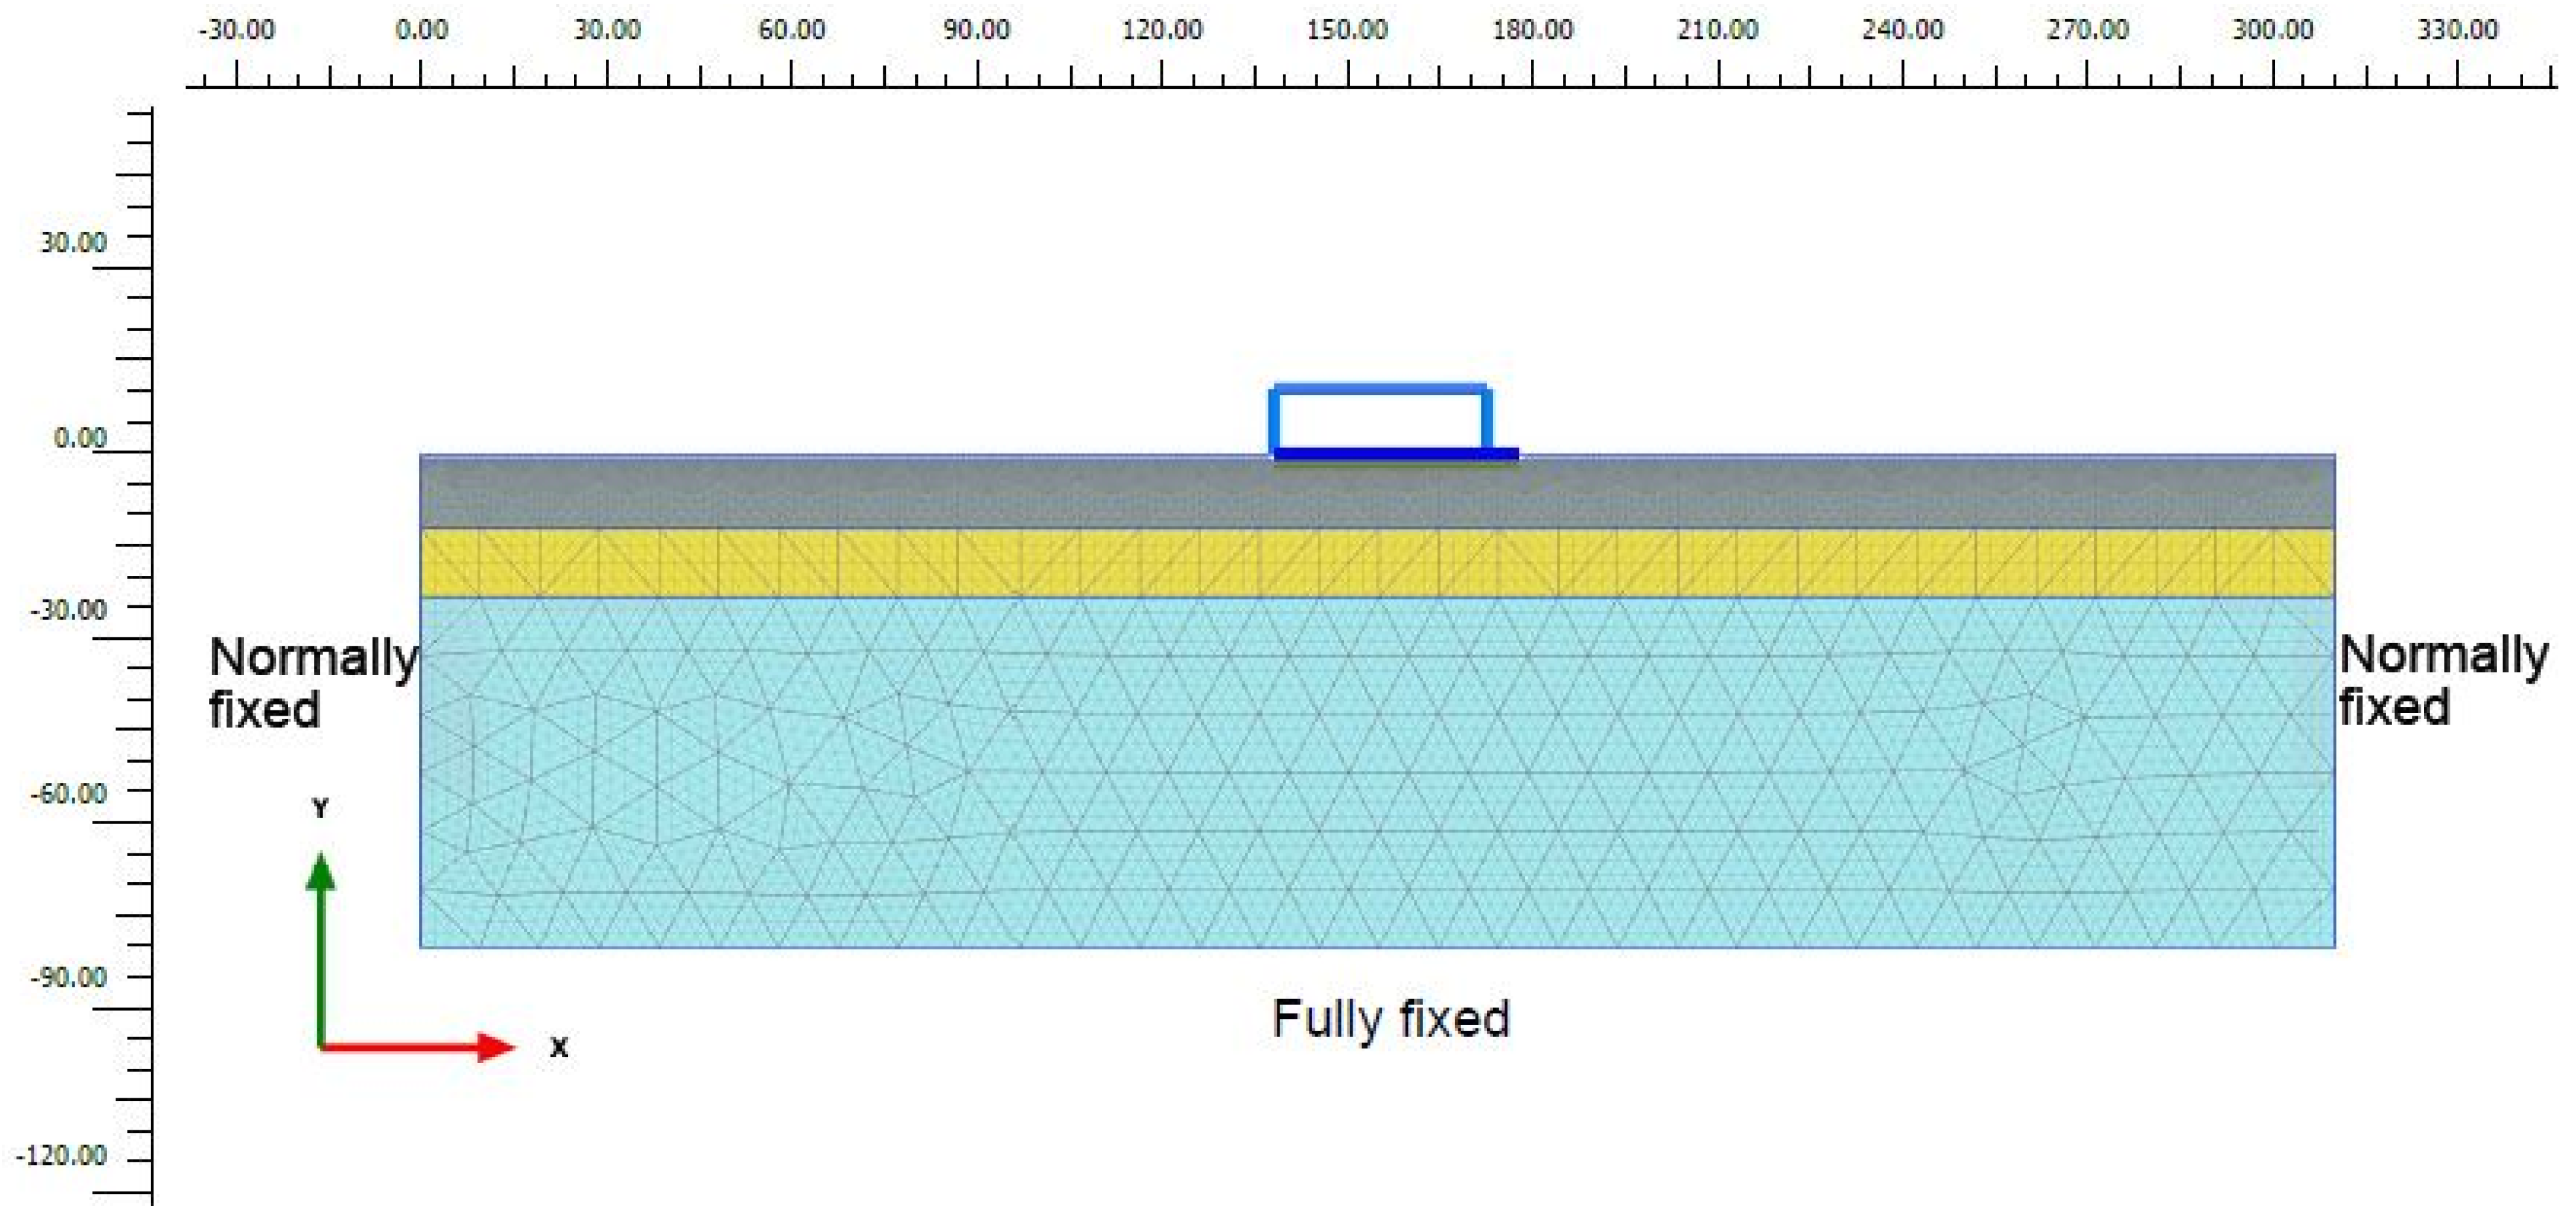
With regard to boundary conditions, default constraints were applied to the model, corresponding to normally fixed for the vertical contours and fully fixed for the base. The water table was set at a depth of 1.90 m from ground level. The soil model has dimensions of 310 m × 80 m. To minimize any boundary effects, the length of the model was set to nine times the footprint of the biological basin. With reference to the biological basin, the section representing its structural behavior was analyzed (Figure 4b).
The structural elements were modeled as plates in PLAXIS2D using a linear elastic constitutive law (E = 31,500 MPa and ν = 0.2). The plates in the 2D finite element model consist of beam elements with three degrees of freedom per node: two translational (ux and uy) and one rotational (in the x-y plane: ΦZ). When 15-node triangular elements are used to model the soil layers, the software employs 5-node beam elements for the plates. For appropriate modeling of soil–structure interaction, interface elements were added to the foundation plates. When 15-node triangular elements are used to model the soil layers, the interface elements are defined by five pairs of nodes [27].
The finite element mesh has a total number of elements equal to 1264. The numerical model used in the FEM consolidation analyses is shown in Figure 10.

5. Consolidation Analysis and Asymmetric Loading Conditions

In FEM analyses, conducted using the PLAXIS2D software, three different phases were performed. In the first phase, the initial stress state was calculated. The second phase consisted of an elastic–plastic deformation analysis. Undrained conditions were analyzed using Undrained A behavior for the soil, in which stiffness and strength are defined in terms of effective parameters [34]. In order to analyze the dissipation of overpressures in the clay layer as a function of time, a consolidation phase was performed.
The consolidation analyses were performed by requiring a 90% consolidation rate. The time required to reach the target consolidation rate is provided by the code. A permeability of 2 × 10⁻⁶ cm/s was considered for the clay layer.
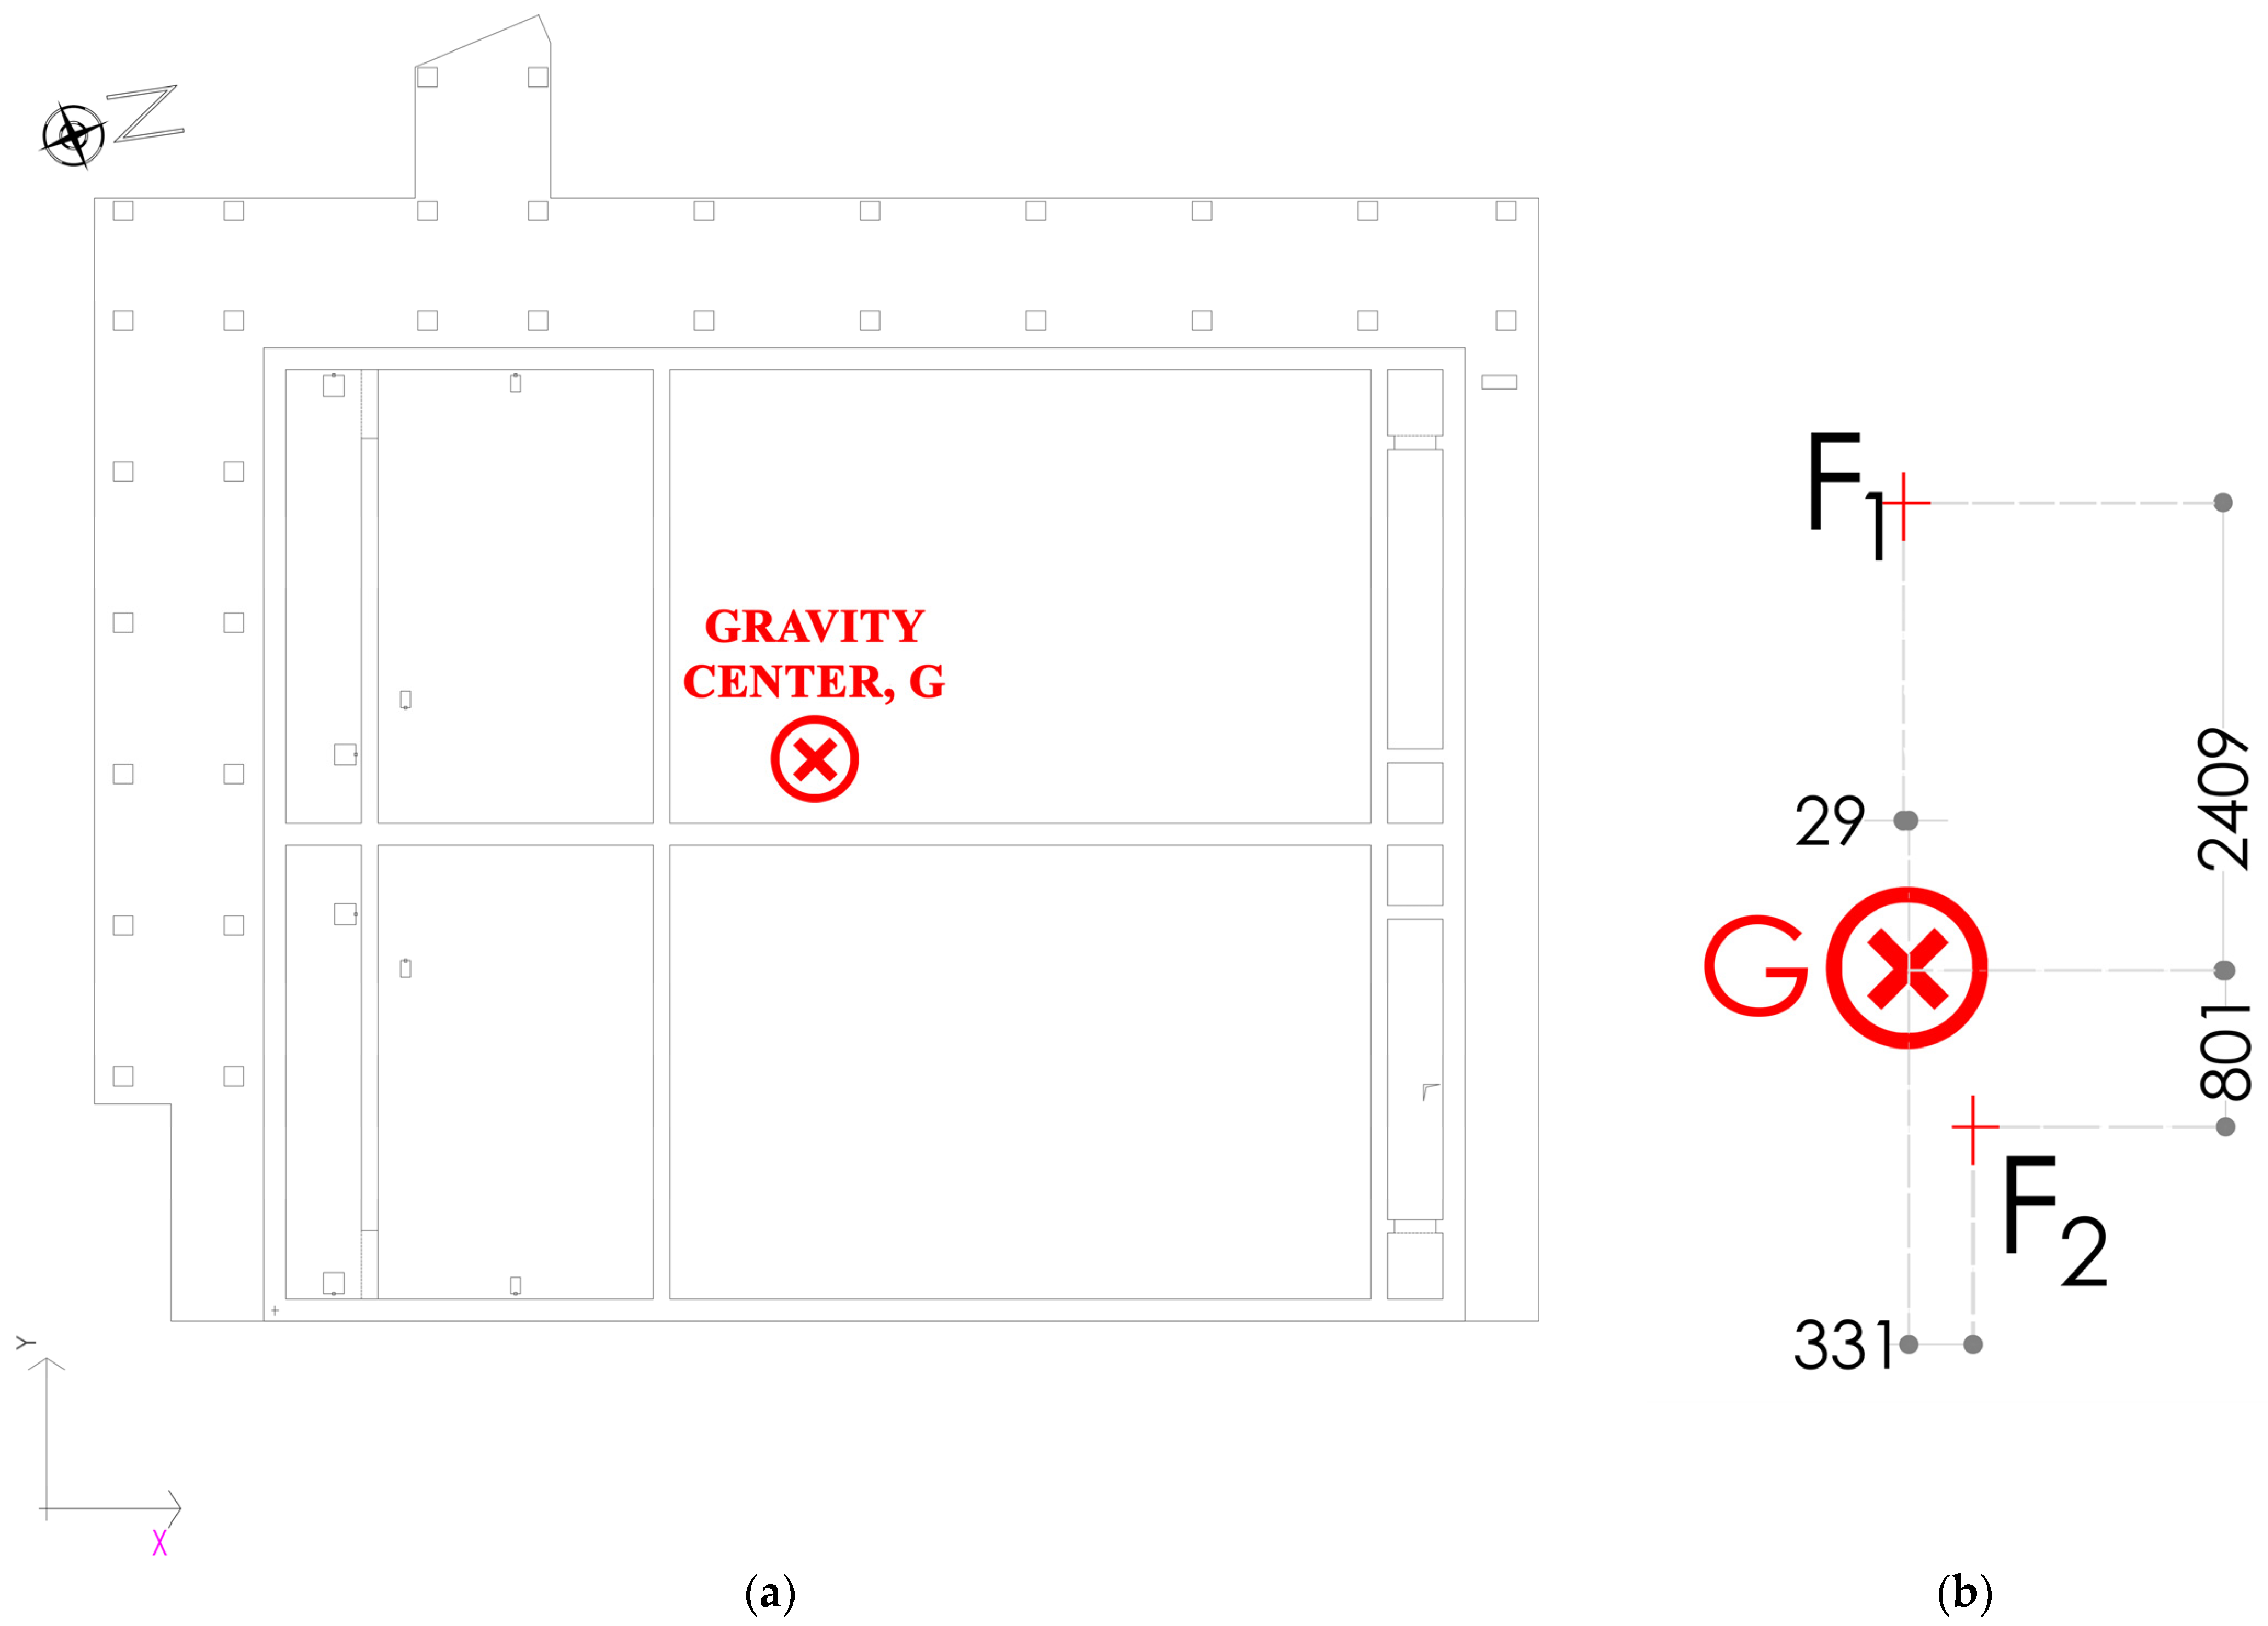
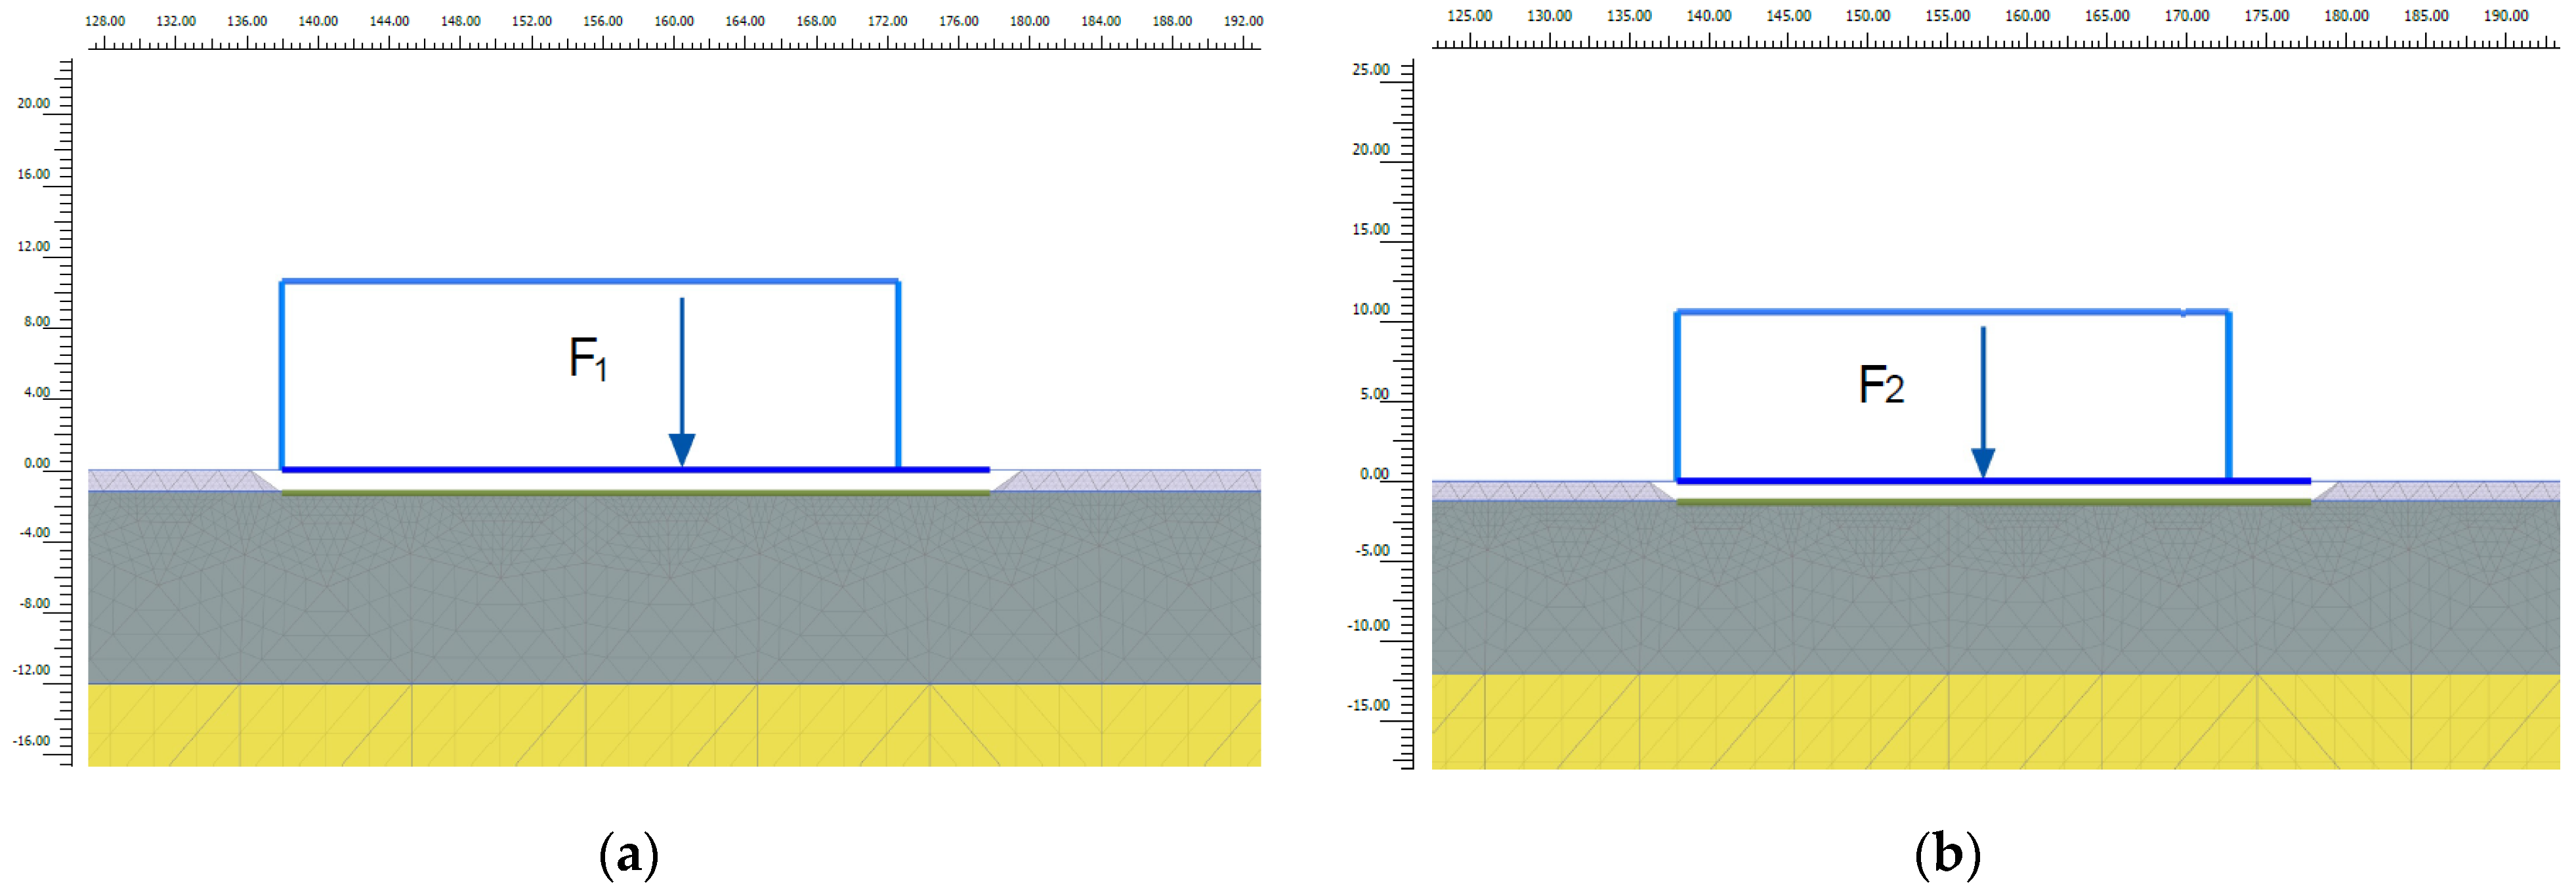
Two different loading conditions were analyzed in the present study: only the west tank full (Case 1) or both tanks full (Case 2). These cases represent the most severe real operating conditions for the biological basin under consideration in terms of settlements and induced far-field effects. Other operating conditions would result in lower magnitudes of settlements and were therefore not considered critical for the pipeline integrity. The resultant of the loads on the foundation referred to a 1 m transverse strip, F1 and F2, is reported in Table 3 together with the eccentricity (Ey) referred to the center of gravity of the slab, G (Figure 11).
The numerical model used for consolidation analyses is shown in Figure 12 for Case 1 and Case 2.

6. Analyses of the Results

The analysis results obtained for the two loading conditions are discussed below. Several nodes were preselected to obtain the settlements related to the soil volume directly and indirectly affected by the biological basin.

6.1. Case 1: Only the West Tank Full

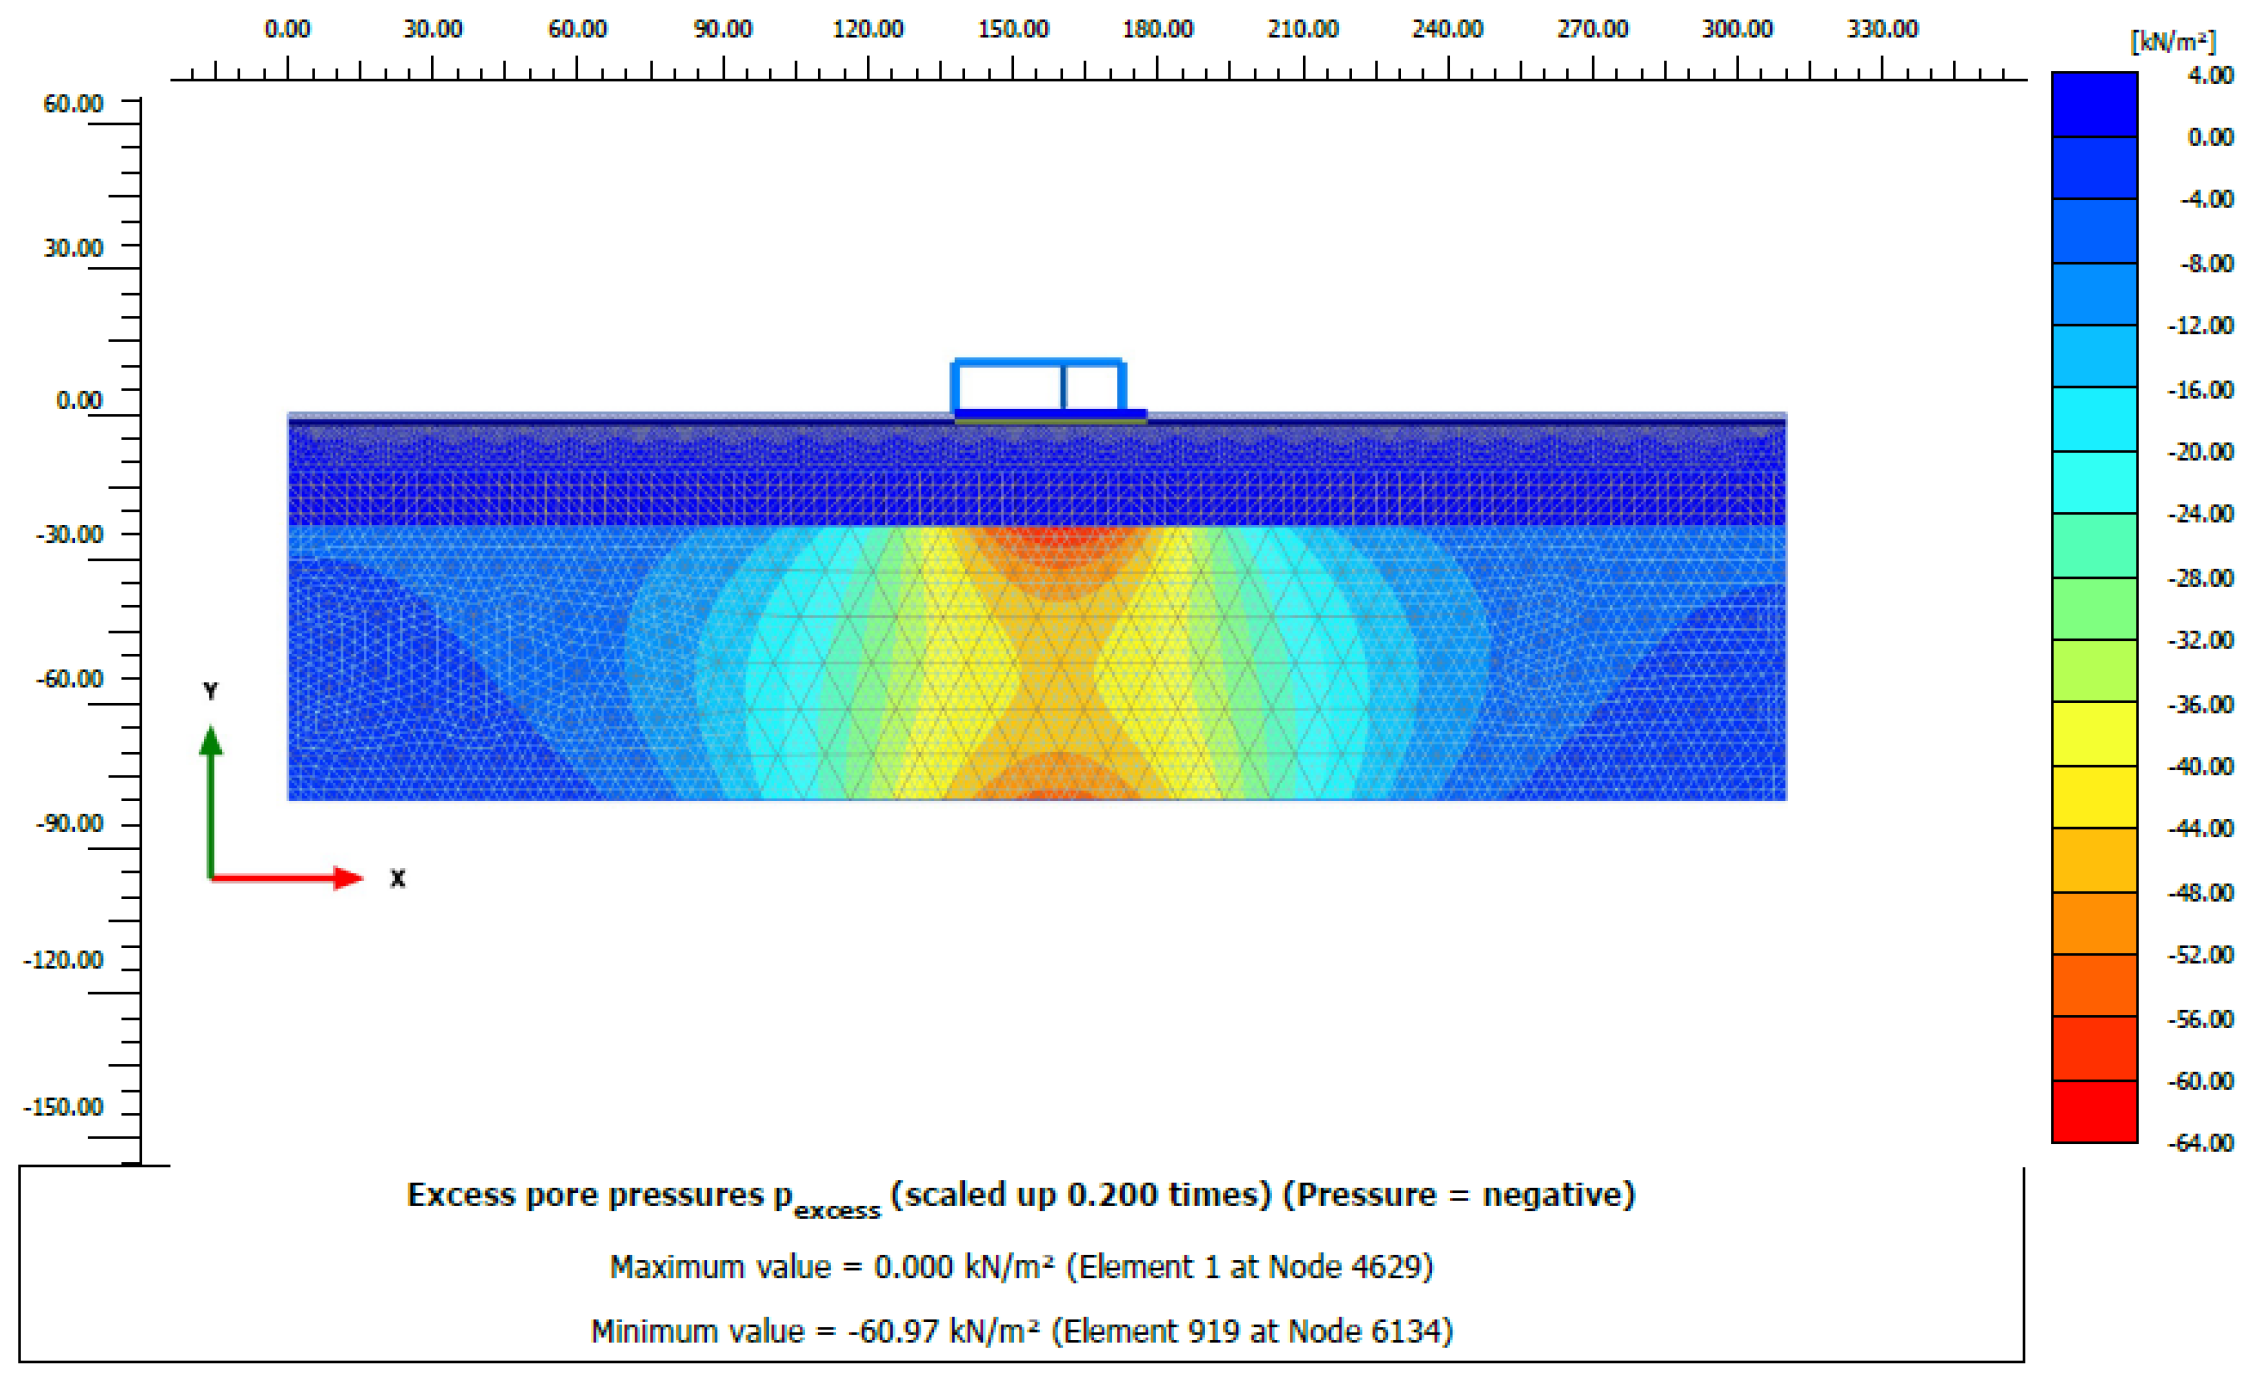
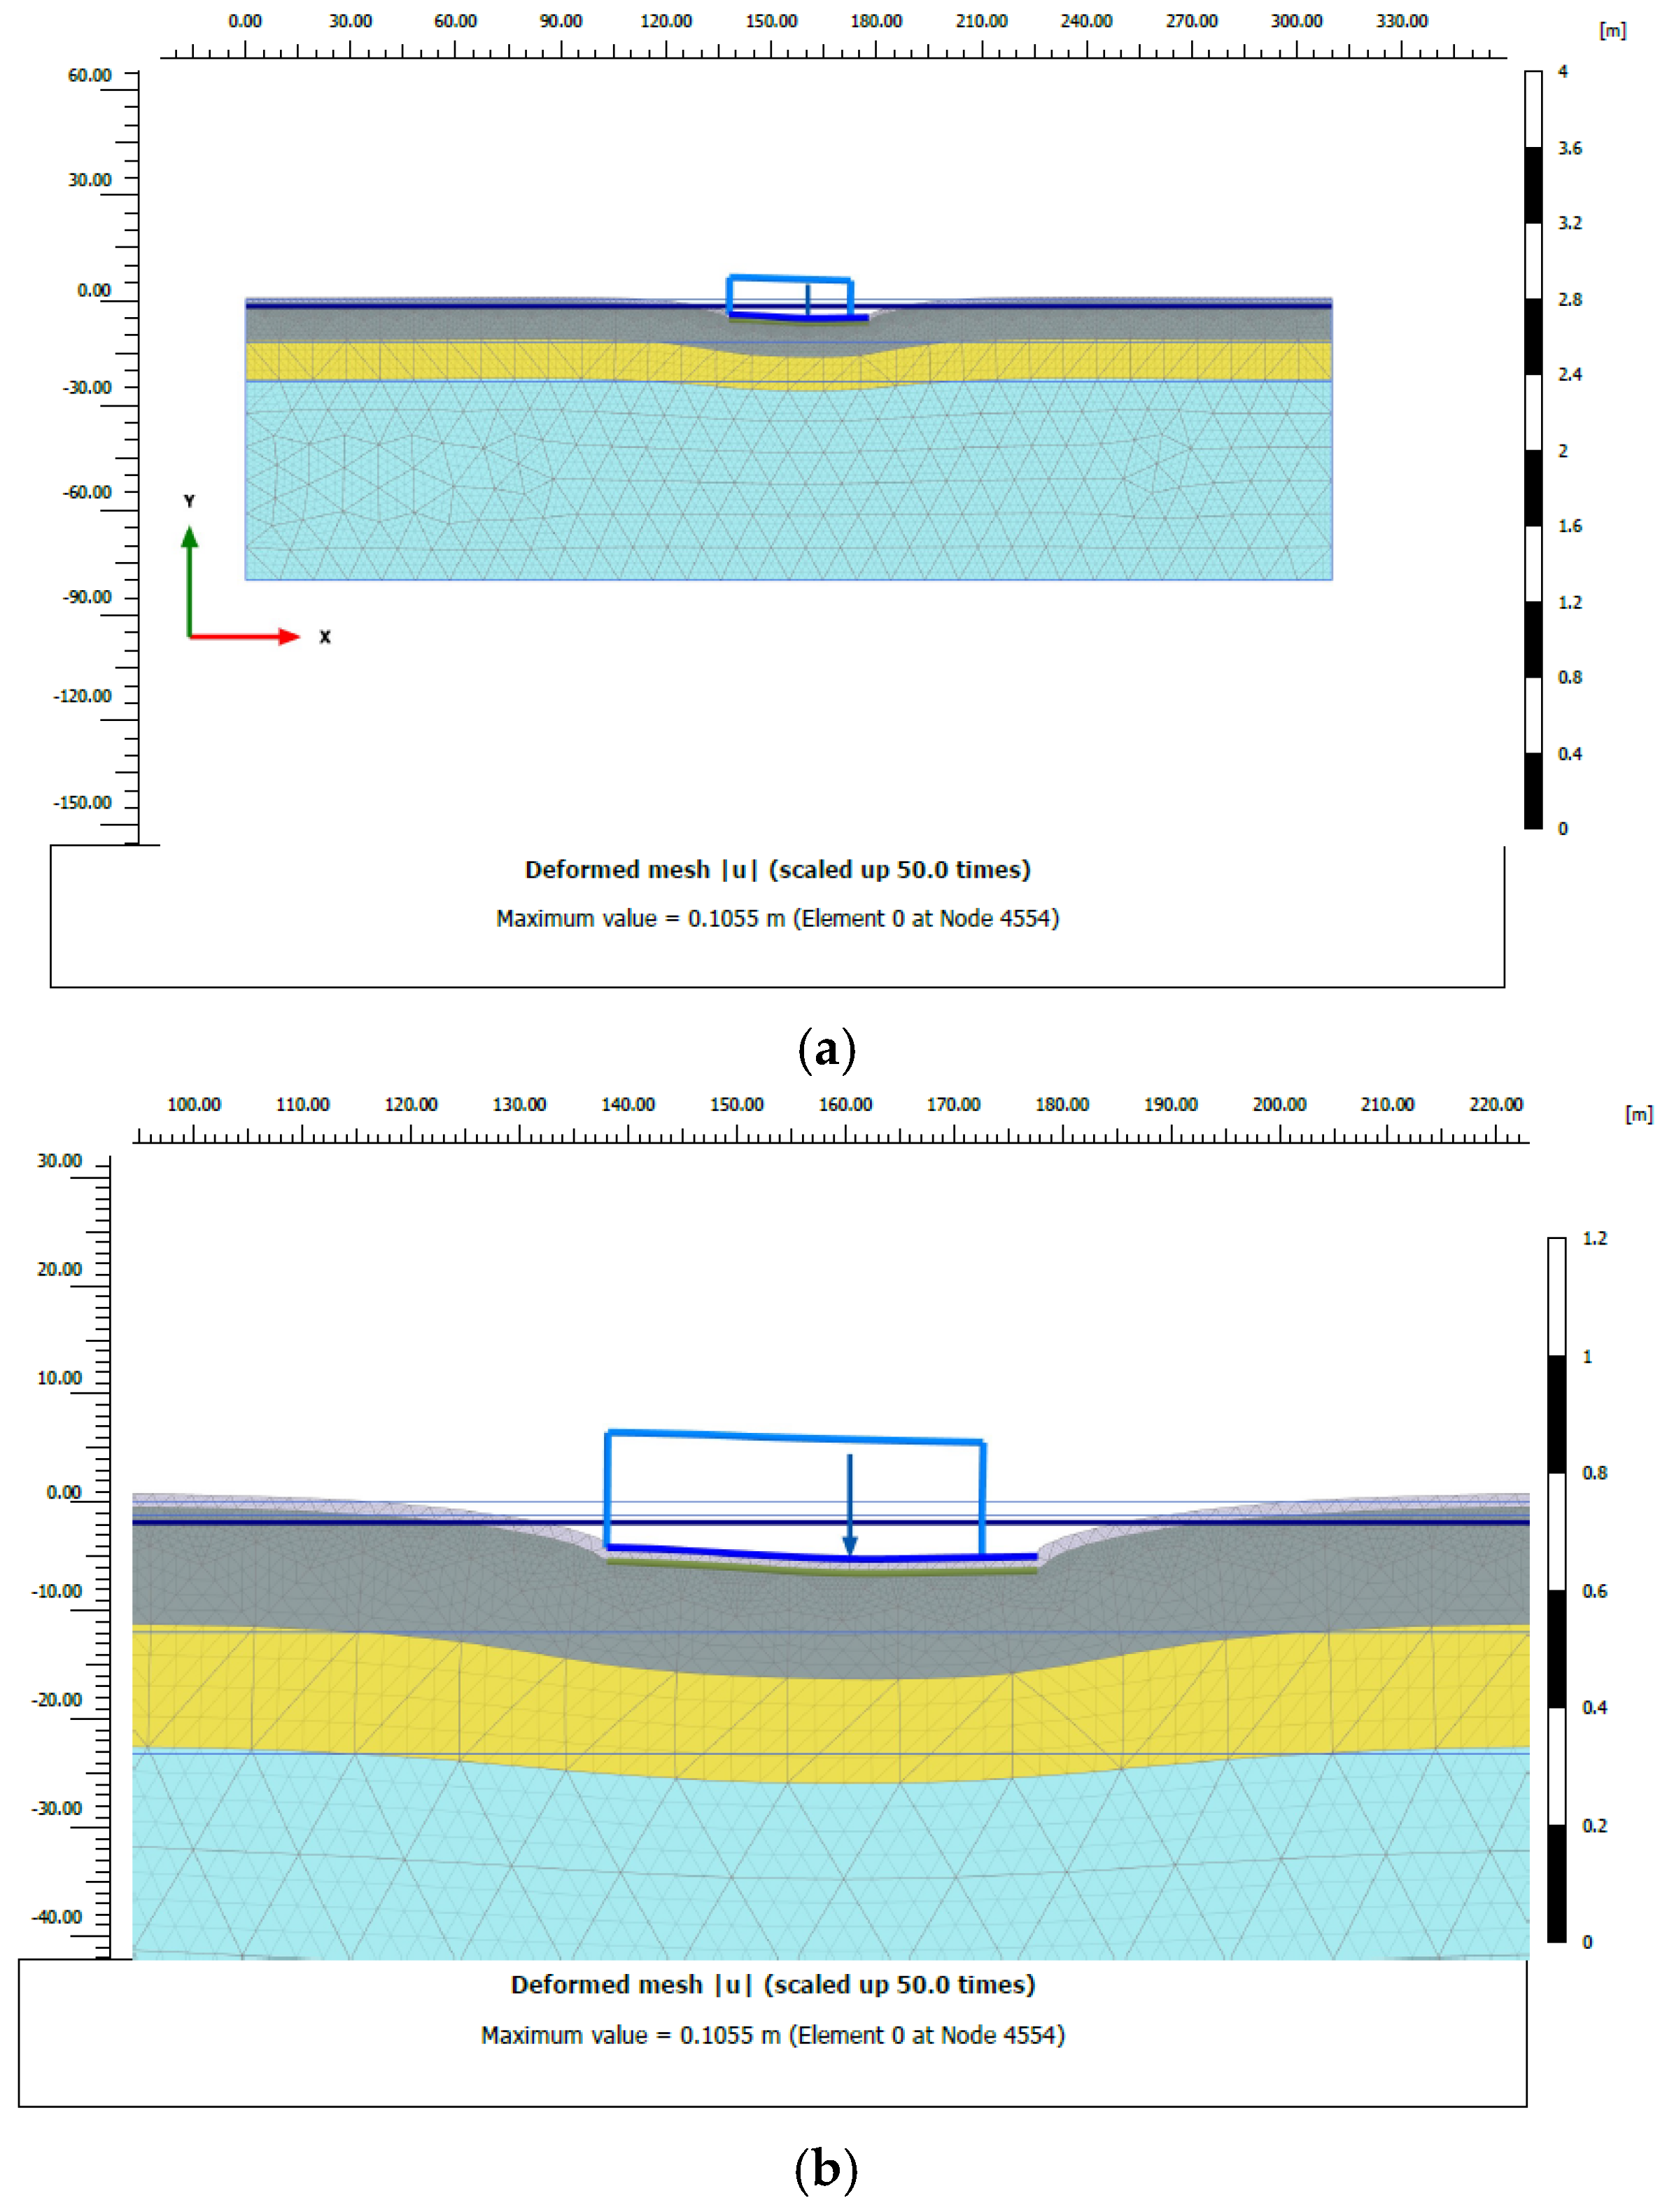
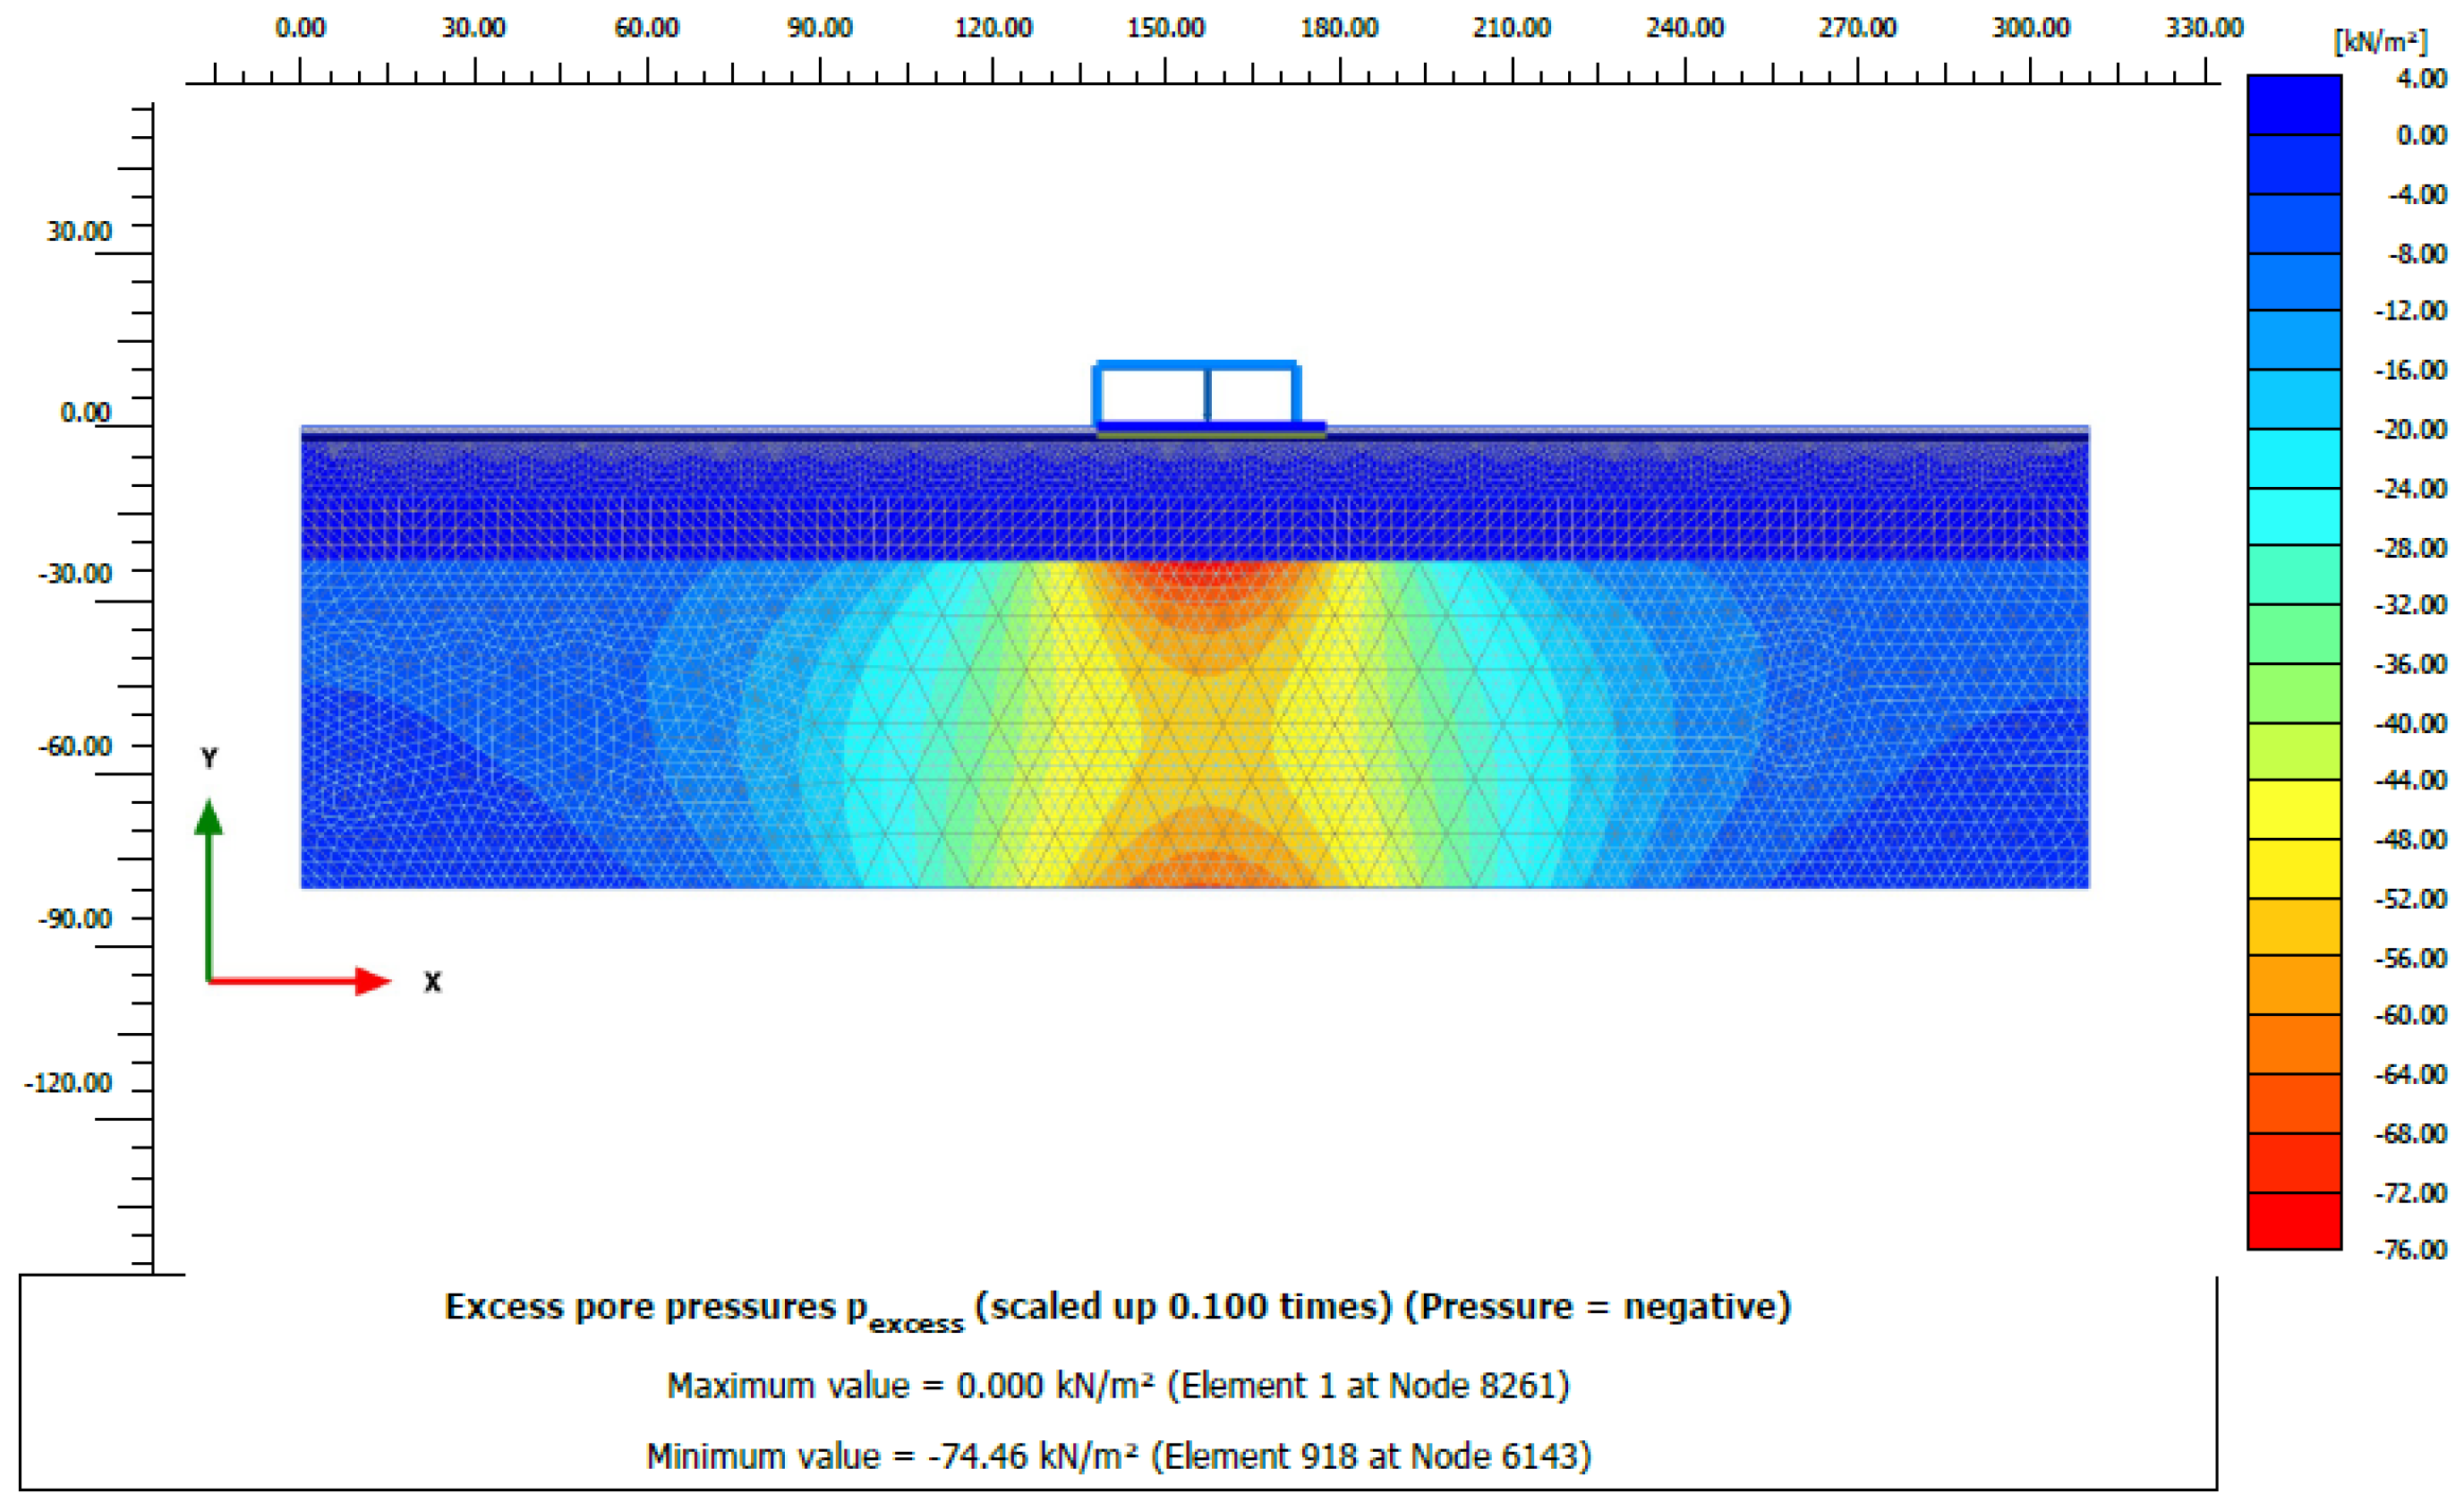
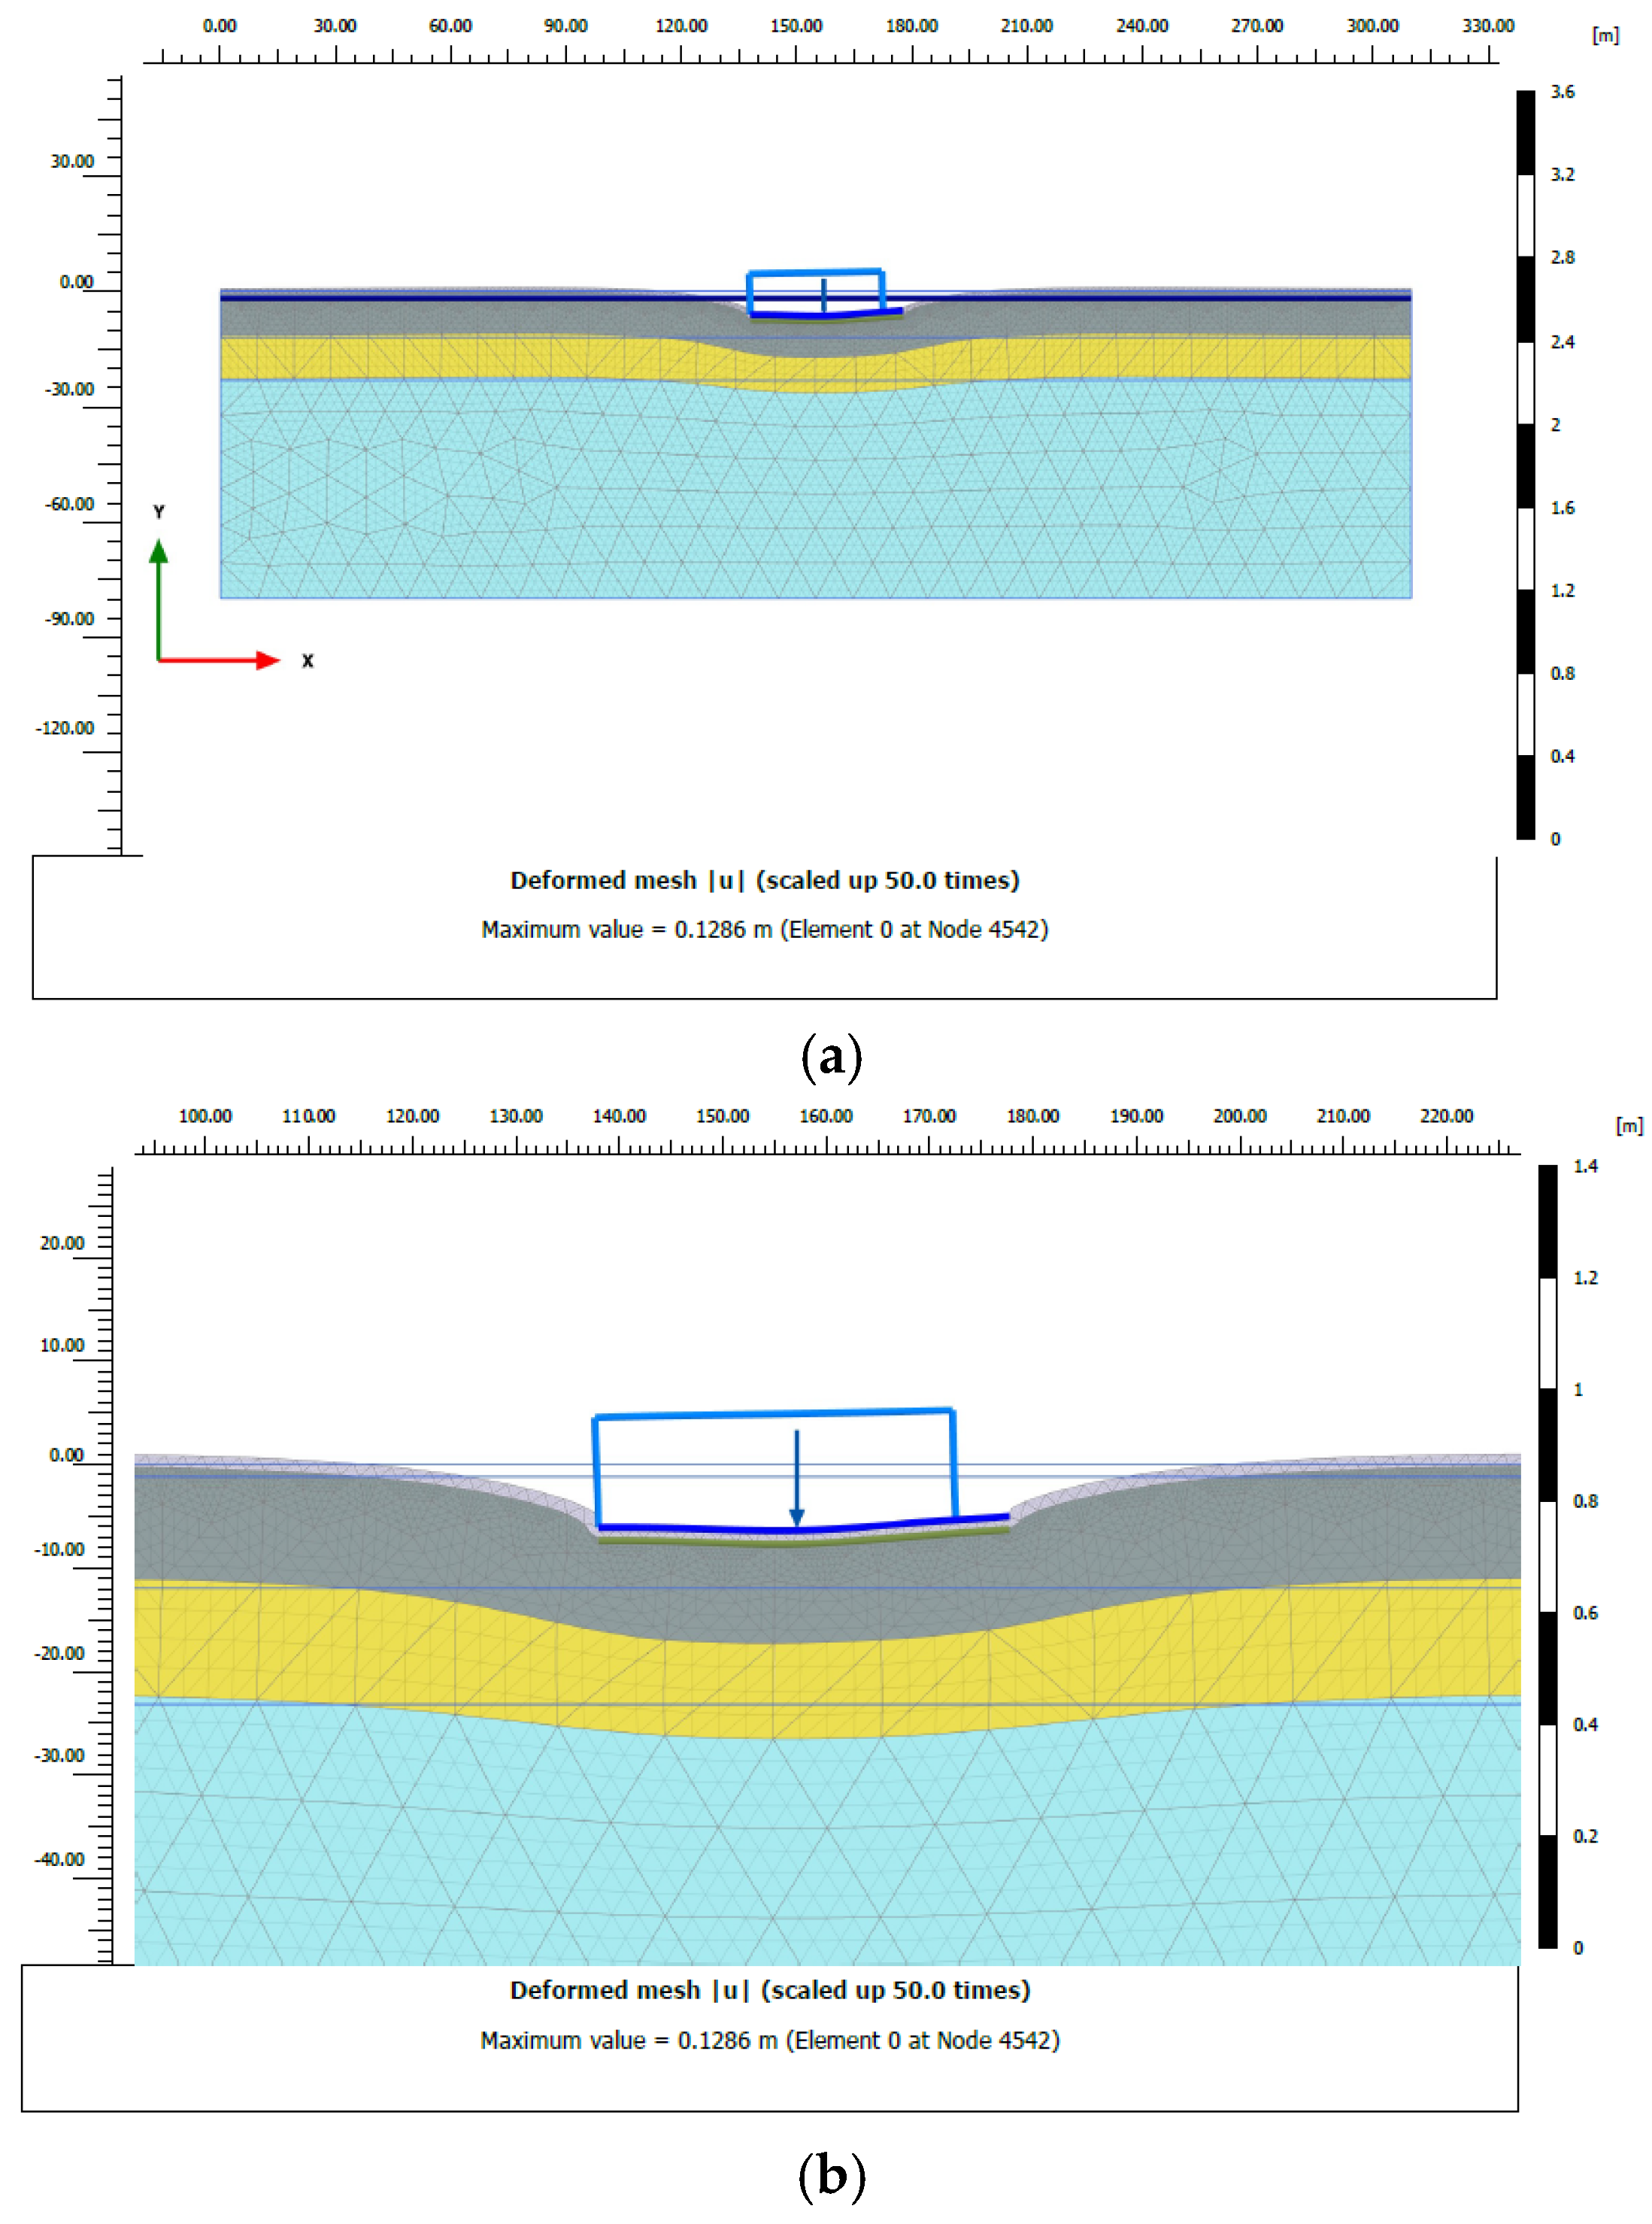
The pore pressures developed at the end of the plastic phase are reported in Figure 13 for Case 1: only the west tank full. It can be observed that the highest pore pressure value reached in the clay layer is equal to 60.97 kN/m2. Figure 14 shows the deformed mesh at the end of the consolidation phase.
To assess the settlements related to the soil volume directly affected by the construction, three different nodes were preselected: Node 1, central to the foundation slab (x = 154.8 m; y = 0 m); Node 2, to the east of the foundation slab (x = 138.5 m; y = 0 m); and Node 3, to the west of the foundation slab (x = 177.8 m; y = 0 m).
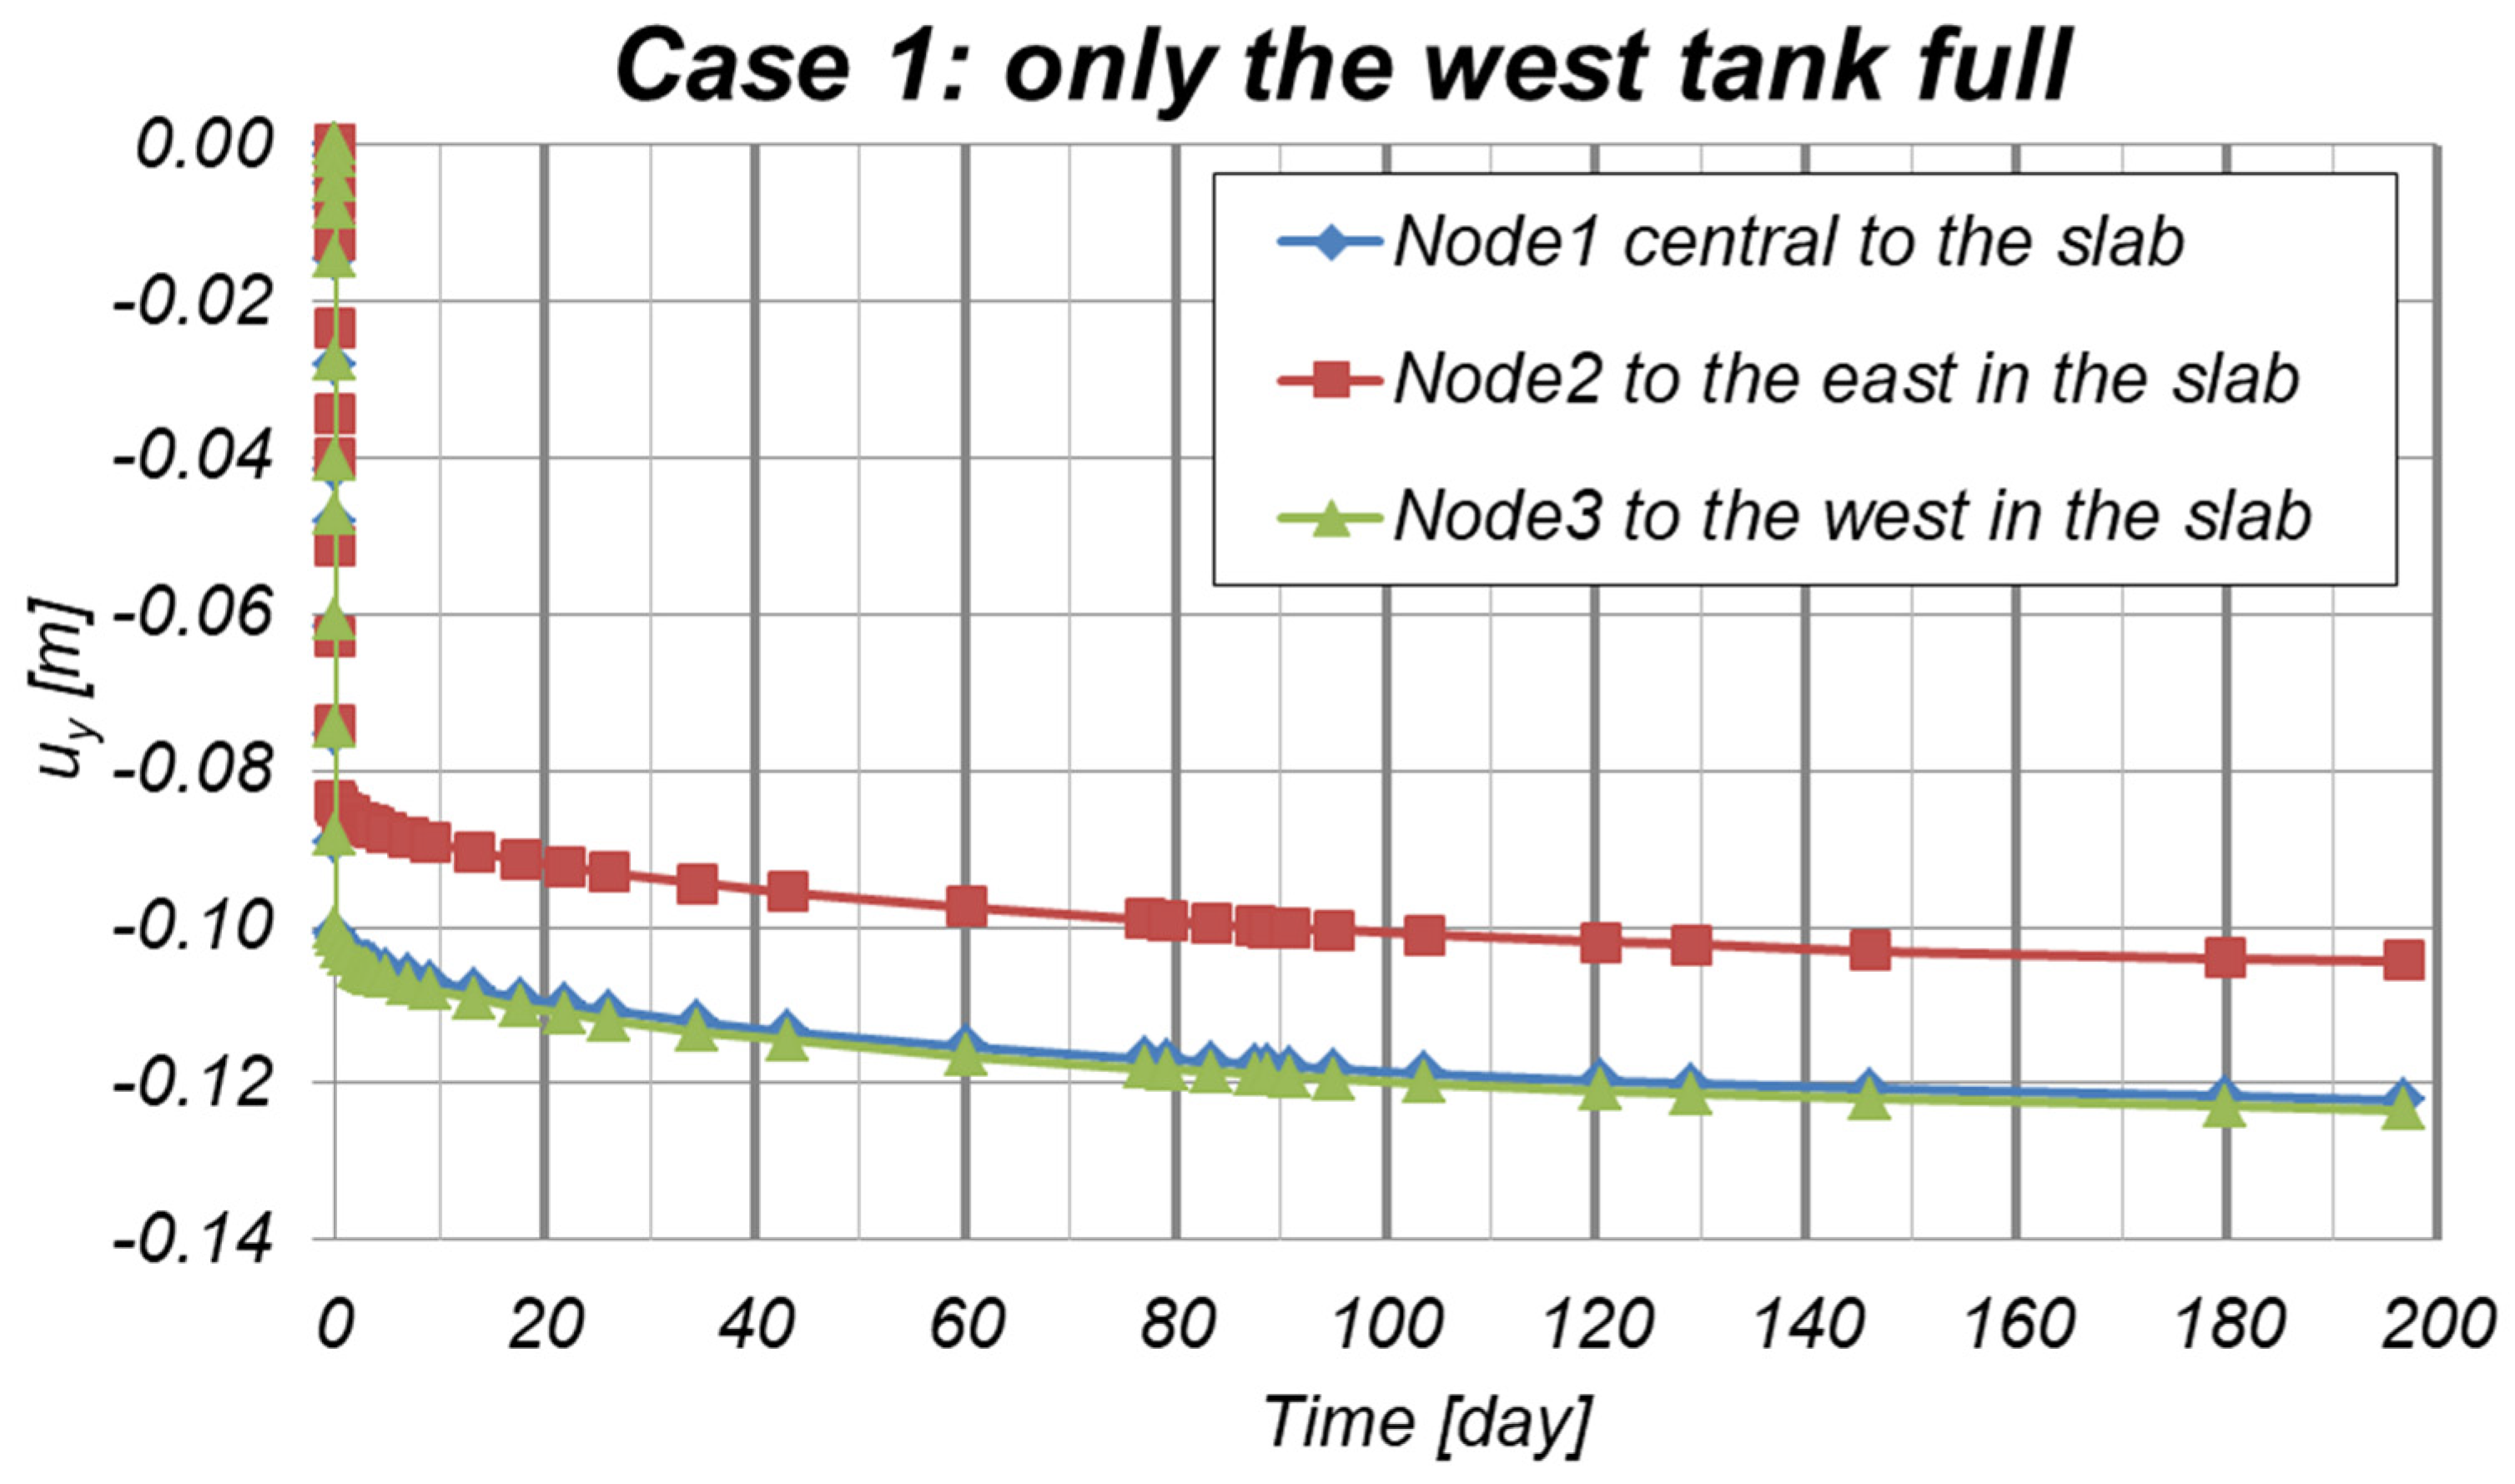
The variation in settlements, uy [m], over Time [day] obtained from the consolidation analysis for the three nodes is shown in Figure 15.
The results reported in Figure 15 show for Node 1, central to the slab, an instantaneous settlement of 10.1 cm and a long-term settlement of 12.2 cm, which includes the instantaneous settlement. Furthermore, the 90% degree of consolidation is achieved at 197 days = 6.6 months. An instantaneous settlement of 8.4 cm and a long-term settlement of 10.4 cm were achieved for Node 2, to the east in the slab. Finally, Figure 15 shows Node 3, to the west in the foundation slab, with an instantaneous settlement of 10.0 cm and a long-term settlement of 12.3 cm. Consequently, results highlight a maximum differential settlement of approximately 2 cm.
The five boreholes performed in the investigated area (Figure 5) showed no significant lateral heterogeneity in stratigraphy or soil properties. Therefore, a laterally homogeneous subsoil model was defined for consolidation analyses. As a consequence, the observed settlement asymmetry is attributed to the operating loading conditions.
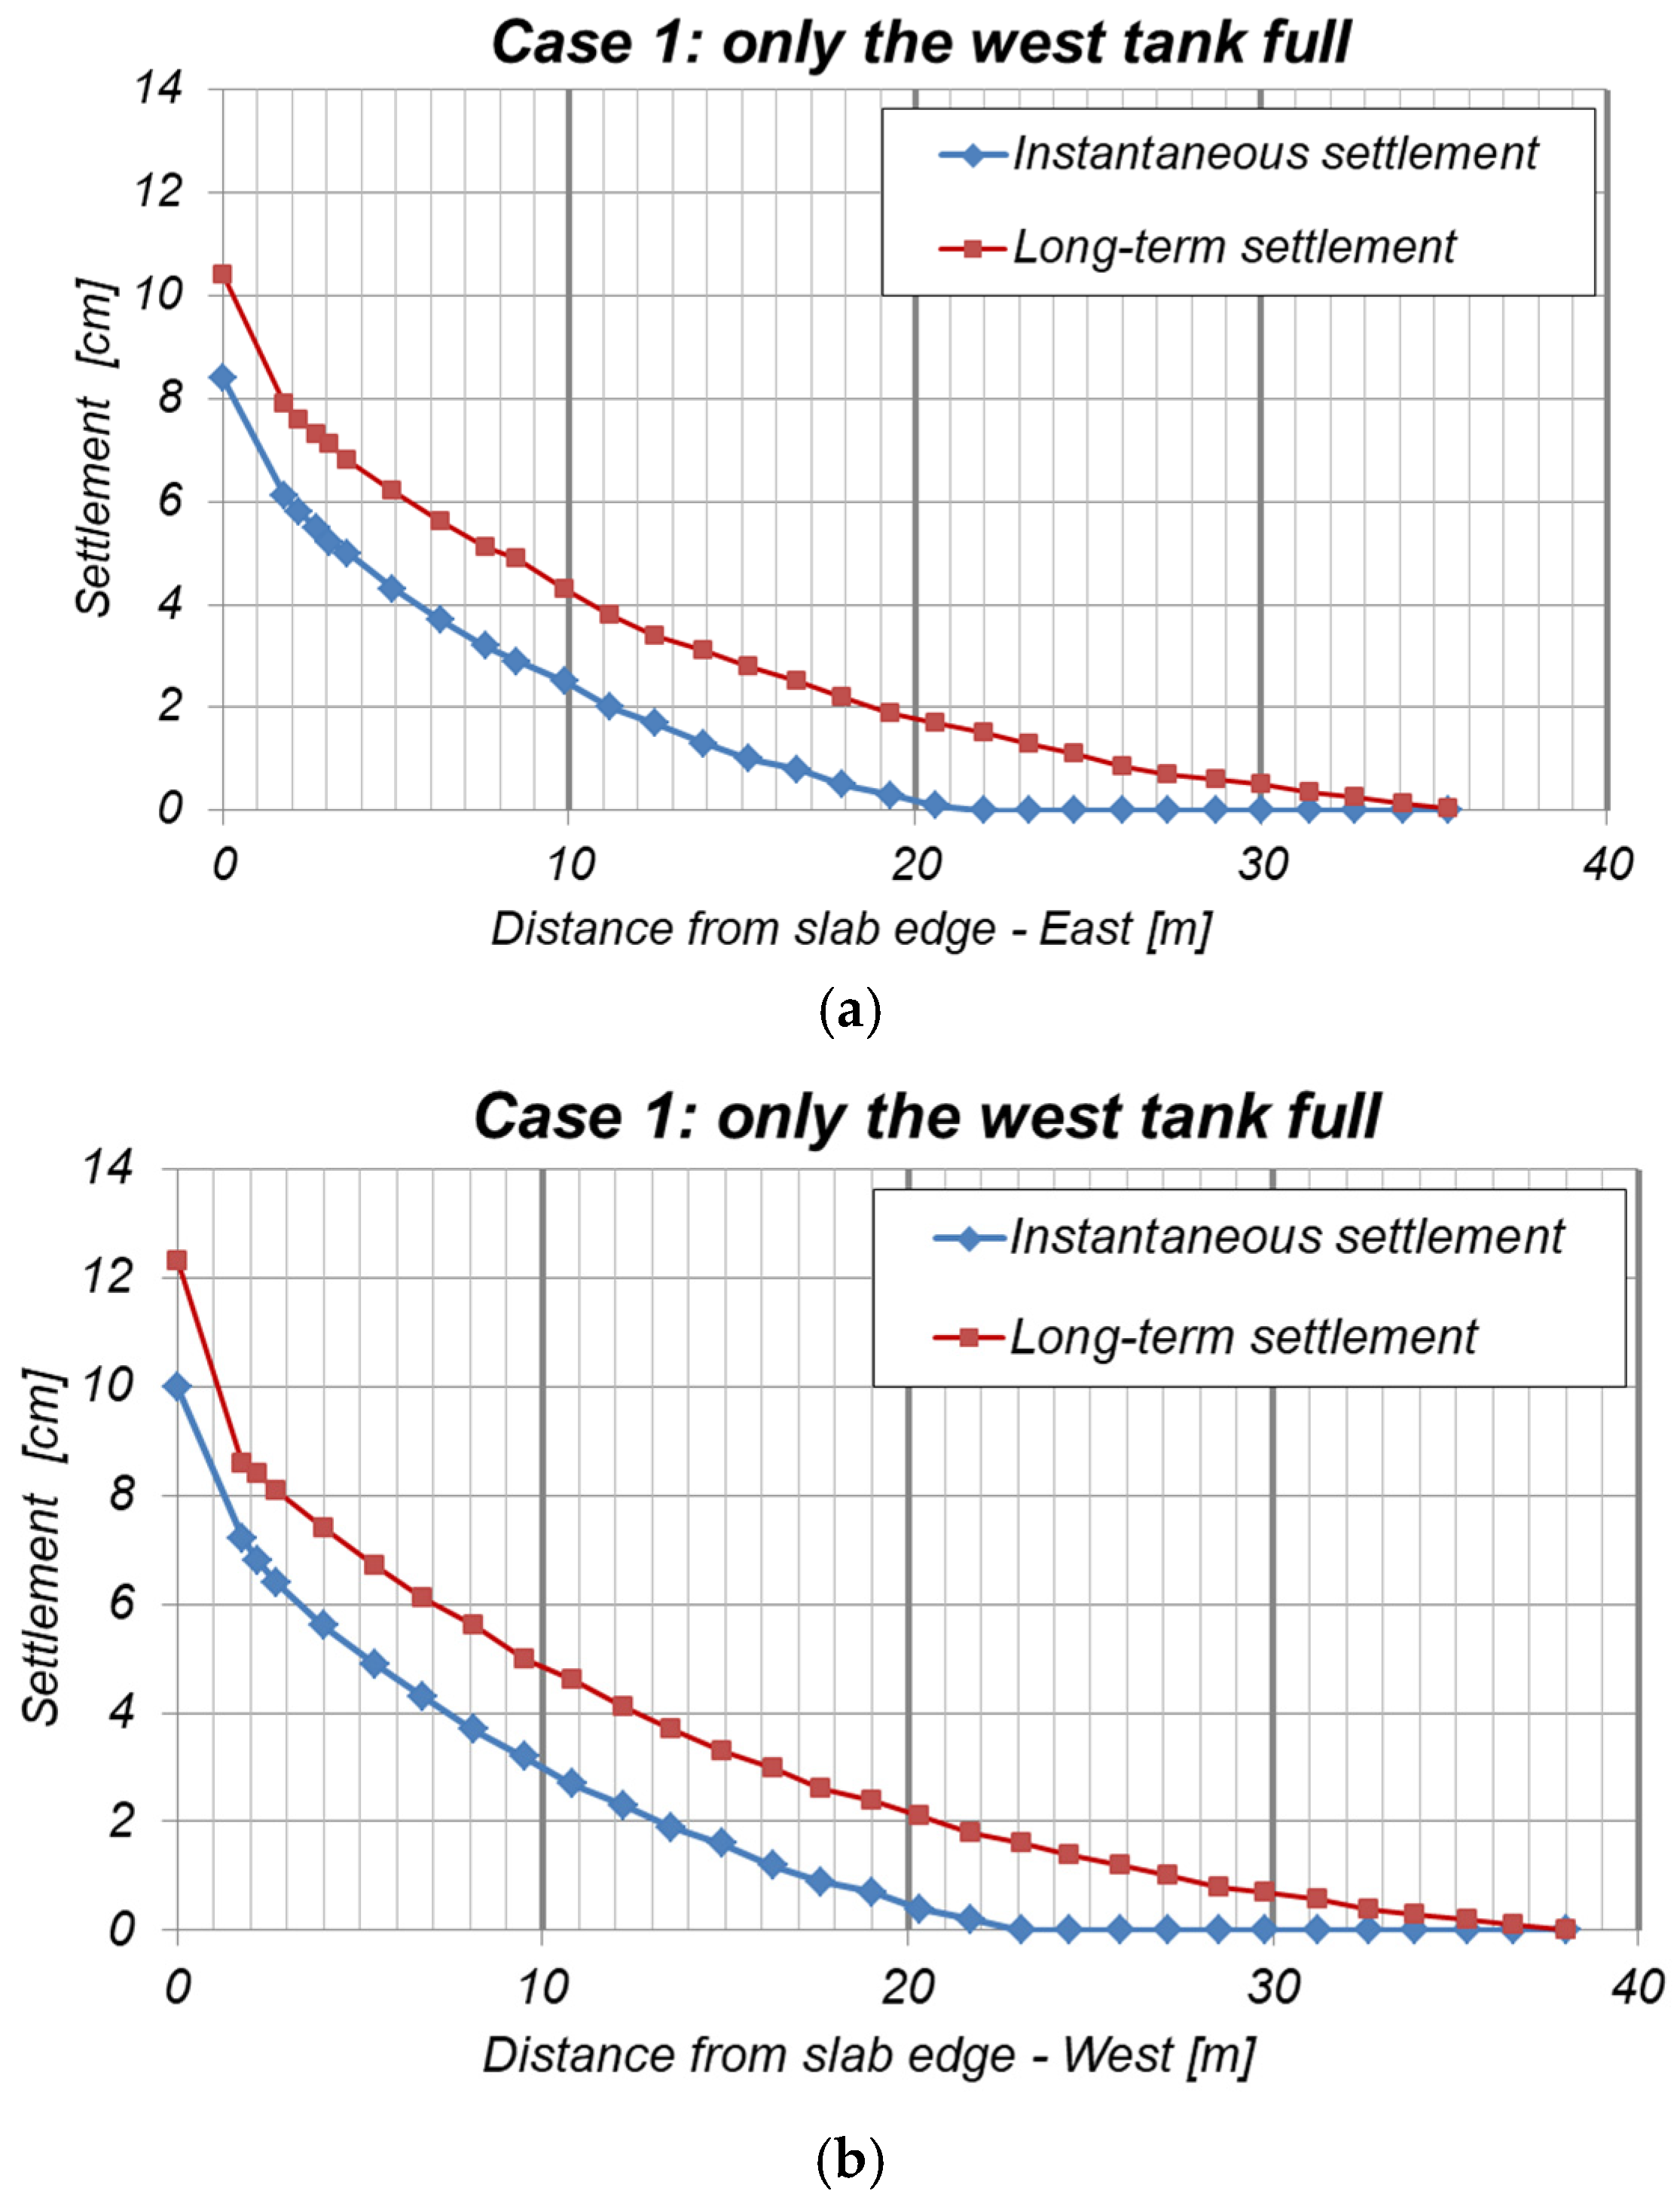
To assess the settlement of the soil volume adjacent to the biological basin, several nodes were preselected to the east and west, at increasing distances from the foundation slab. Figure 16 shows the variation in settlement in centimeters as the distance from the foundation slab, expressed in meters, varies in the east and west directions. The results indicate that the maximum extent of the soil volume adjacent to the structure indirectly affected by the construction is 35.4 m in the east direction and 38.0 m in the west direction.

6.2. Case 2: Both Tanks Full

The pore pressures developed at the end of the plastic phase are reported in Figure 17 for Case 2: both tanks full. It can be observed that the highest pore pressure value reached in the clay layer is equal to 74.46 kN/m2, i.e., 22% higher than in the first case analyzed. Figure 18 shows the deformed mesh at the end of the consolidation phase.
To assess the settlements related to the soil volume directly affected by the construction, the same nodes were preselected: Node 1, central to the foundation slab (x = 154.8 m; y = 0 m); Node 2, to the east of the foundation slab (x = 138.5 m; y = 0 m); and Node 3, to the west of the cantilever slab (x = 177.8 m; y = 0 m).
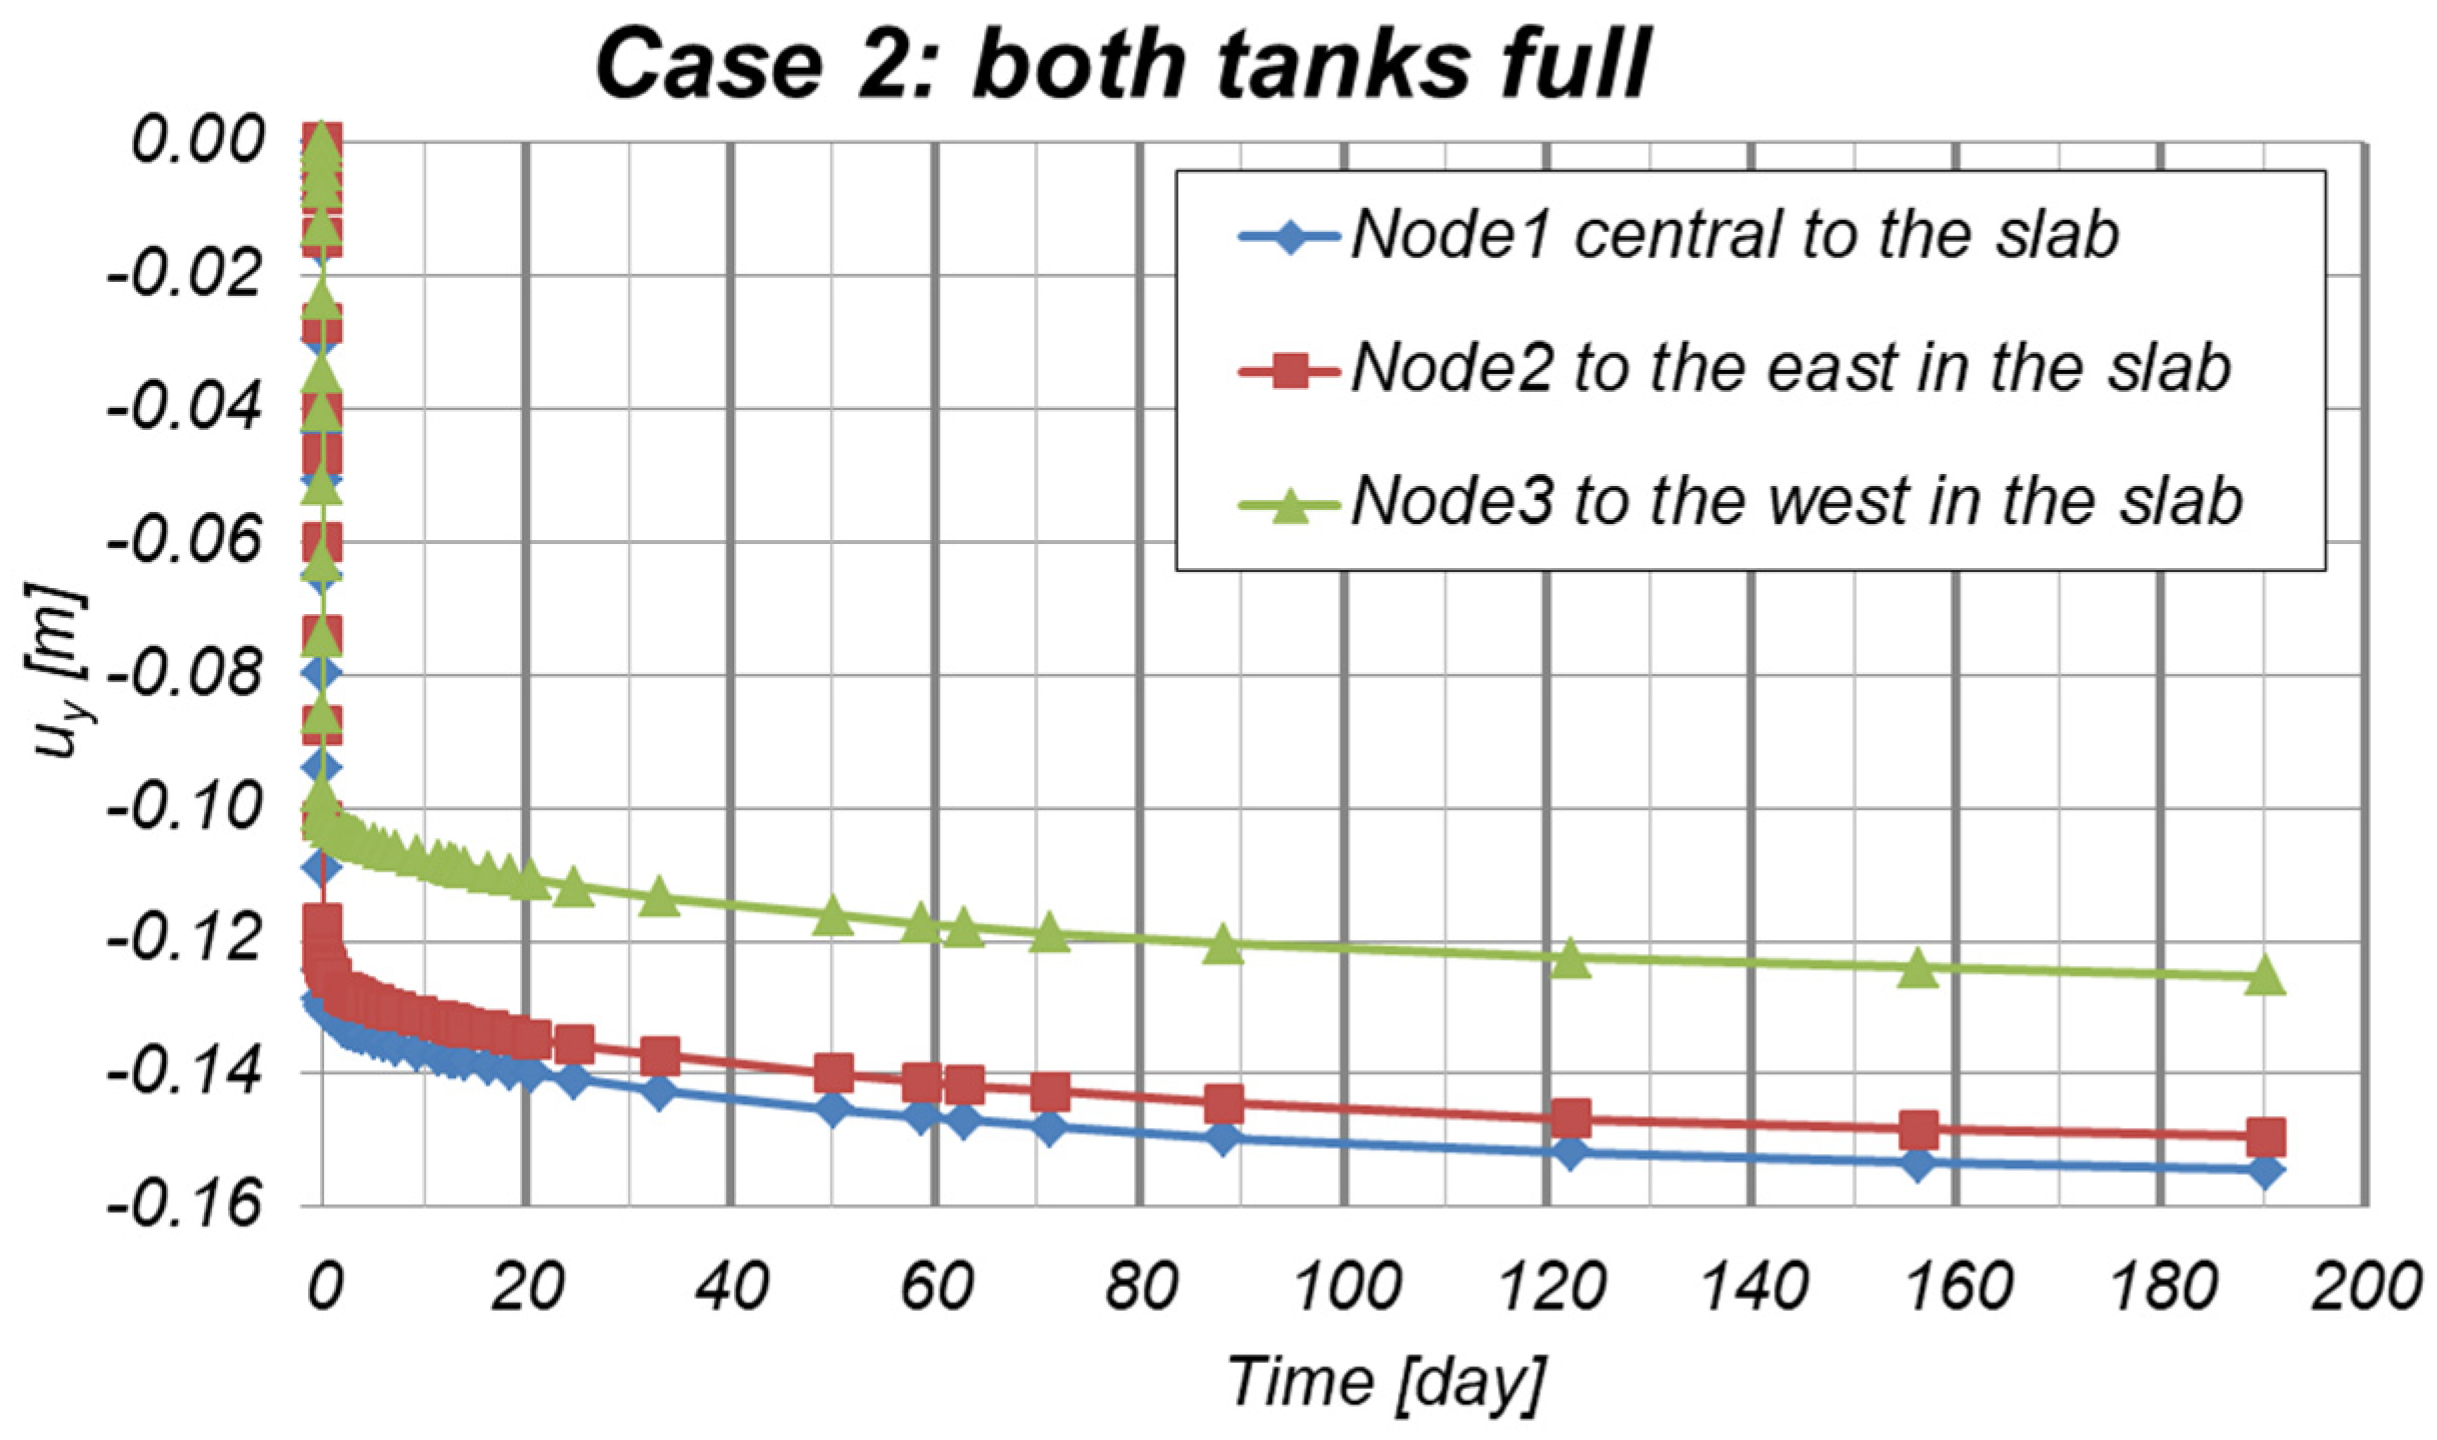
The variation in settlements over time obtained from the consolidation analysis for the three nodes is shown in Figure 19.
The results reported in Figure 19 show that Node 1, central to the slab, has an instantaneous settlement of 12.9 cm and a long-term settlement of 15.5 cm, which includes the instantaneous settlement. Furthermore, the 90% degree of consolidation is achieved at 190 days = 6.3 months. Figure 18 reports for Node 2, to the east in the slab, an instantaneous settlement of 12.2 cm and a long-term settlement of 14.9 cm. Finally, an instantaneous settlement of 10.1 cm and a long-term settlement of 12.5 cm were obtained for Node 3, to the west in the slab. The results, therefore, highlight a maximum differential settlement of approximately 3 cm.
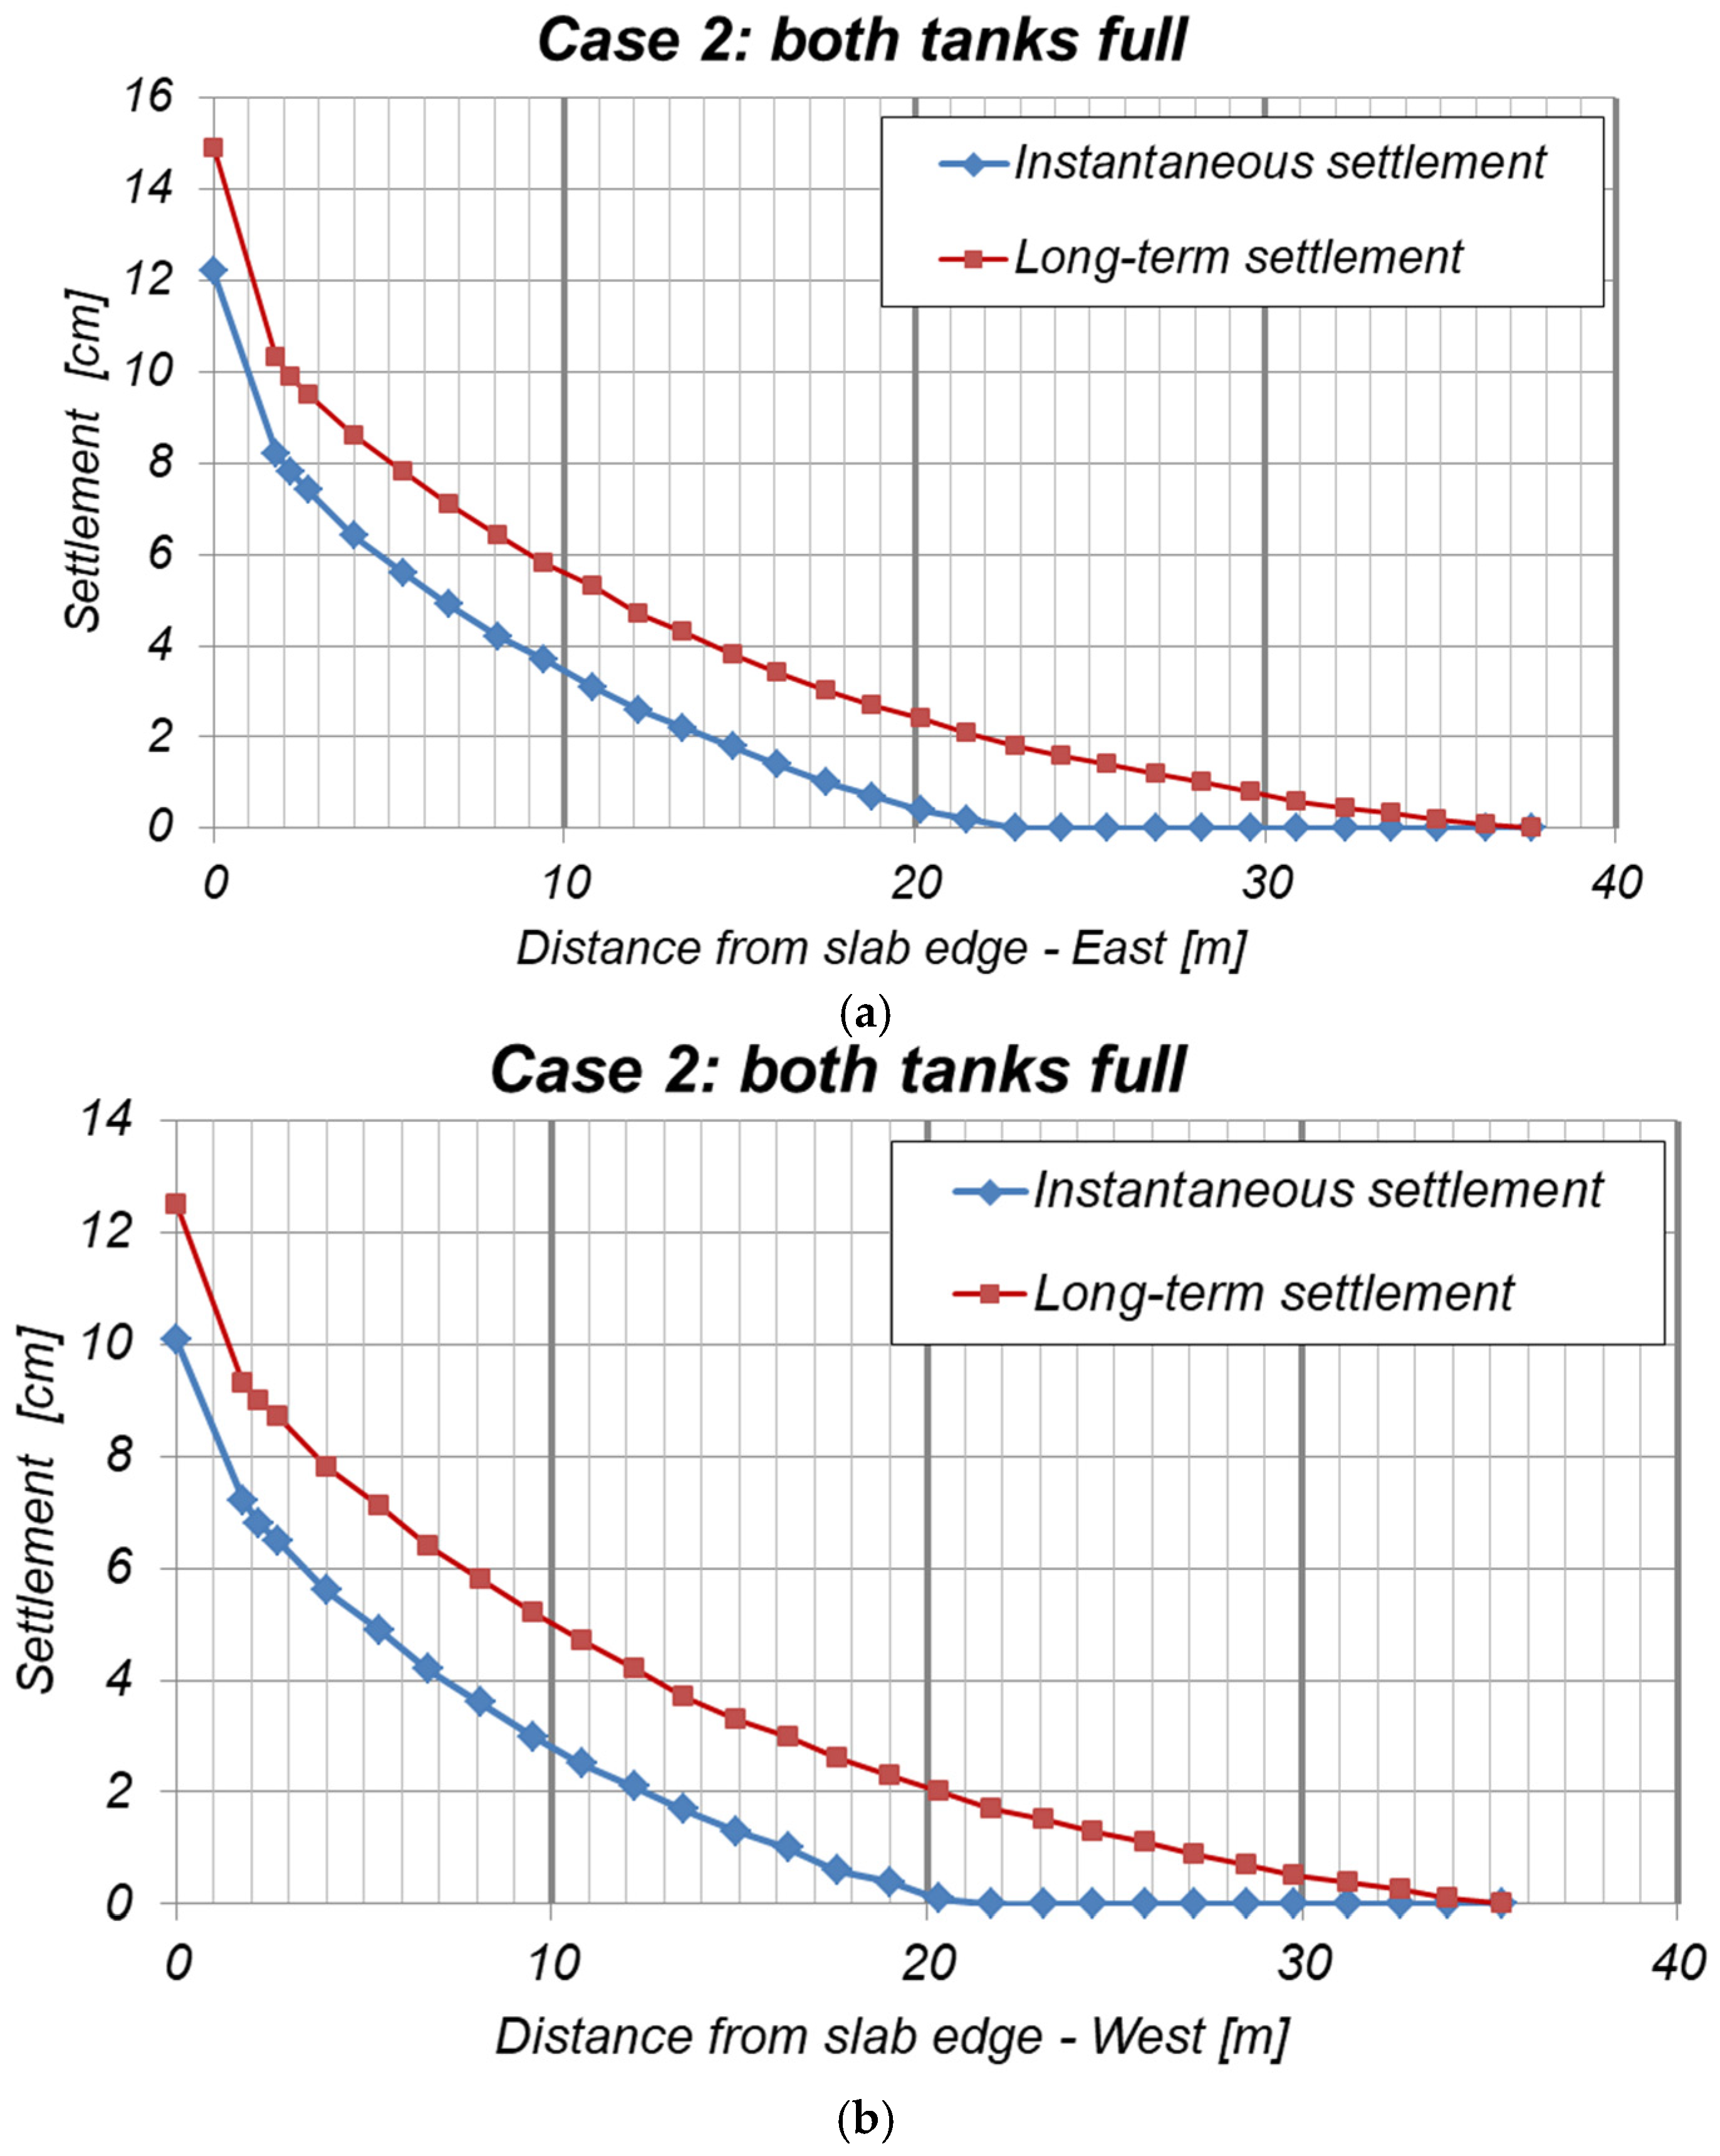
To assess the settlement of the soil volume adjacent to the structure, several nodes were preselected to the east and west, at increasing distances from the foundation slab. Figure 20 shows the variation in settlement in centimeters as the distance from the foundation slab, expressed in meters, varies in the east and west directions. The results indicate that the maximum extent of the soil volume adjacent to the structure indirectly affected by the construction is 37.6 m in the east direction and 35.3 m in the west direction.
Finally, an intermediate loading condition was analyzed considering only the west tank half-full. Results showed maximum settlements of 8.0 cm for Node 1 central to the slab, 7.4 cm for Node 2 to the east in the slab, and 7.8 cm for Node 3 to the west in the foundation slab. Consequently, results highlight a maximum differential settlement of 0.6 cm. This demonstrates that the intermediate loading condition is less critical than the full operating conditions considered in the main FEM analyses, as it provides lower total and differential settlements.
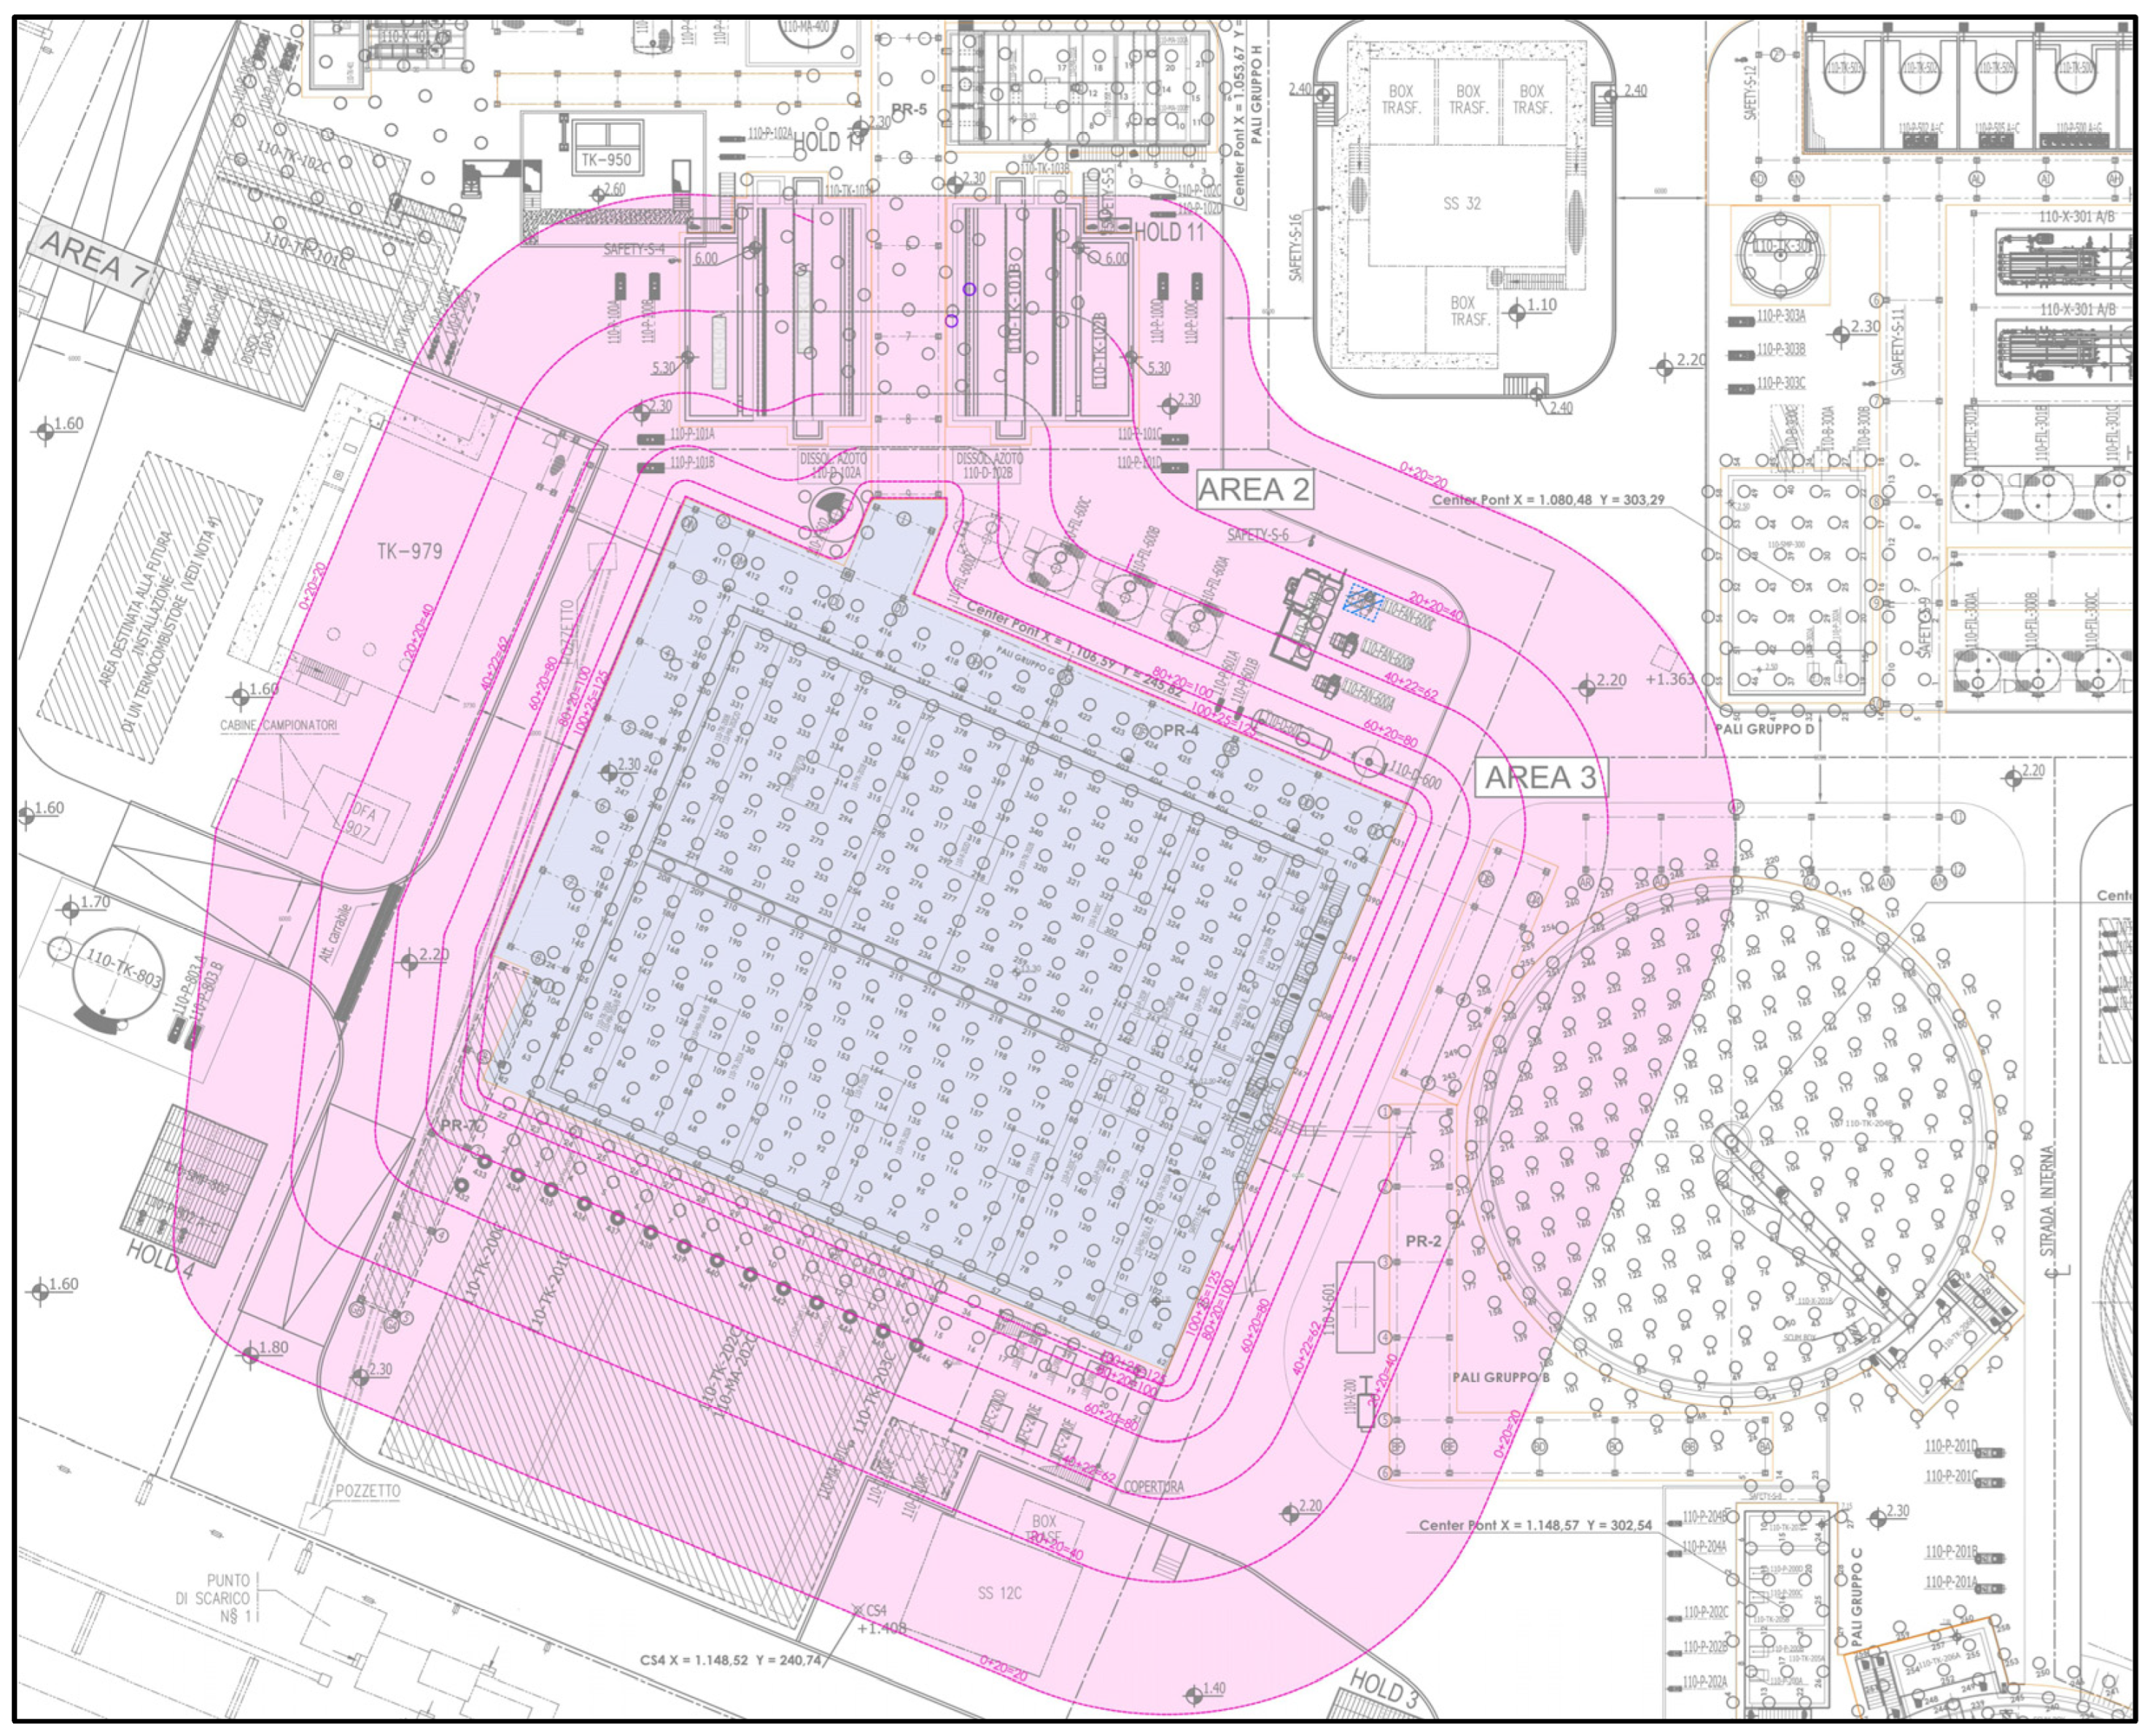
The influence zone following the construction of the biological basin is displayed in Figure 21. It shows that the settlements are not limited to the foundation slab of the biological basin but propagate laterally and affect the adjacent structures.
The estimated settlements reach the maximum value directly beneath the biological basin, where the load increase and the developed pore pressures at the end of the plastic phase are greatest. Then, the settlement gradually decreases with distance, affecting the adjacent structures and the pipelines.

7. Conclusions

In this work, 2D FEM consolidation analyses were carried out on the soil volume affected directly and indirectly by the construction of a biological basin located within an industrial plant in Augusta (Sicily, Italy).
The main findings and considerations can be summarized as follows:
  • The pore pressures developed at the end of the consolidation phase are about 22% higher when both tanks are full, with a peak value of 74.46 kN/m2 in the clay layer.
  • A comparison between the two loading conditions highlights that settlement values are higher when both tanks are full, as expected. The maximum value of 15.5 cm corresponds to a 90% degree of consolidation, achieved at 6.3 months. The obtained settlement values are significant and may affect the pipeline integrity. However, current codes and design guidelines do not define allowable settlement thresholds for similar structures. Consequently, as a precautionary measure, the foundation of the biological basin will be constructed at a higher elevation to compensate for the expected initial settlements.
  • Considering only the west tank filled, the location of maximum settlement is on the western side of the slab, with differential settlement of approximately 2 cm between the west and the east sides. In contrast, considering both tanks filled, the location of maximum settlement is on the central part of the slab, with differential settlement of approximately 3 cm between the central part and the east side. This shows that the eccentricity of the resultant force affects the location of maximum settlement and the development of differential settlements.
Although the biological basin has a longitudinal axis of symmetry in terms of geometry, results show that the application of asymmetric load conditions leads to asymmetric settlement responses.
  • Maximum differential settlements of 2–3 cm were obtained in this work. This result is relevant given that differential settlements can produce considerable deformation in the pipelines because of bending and axial strain.
  • In both cases, the settlements are maximum beneath the biological basin and decrease with distance. However, the soil volume indirectly affected by the construction is greater when only the west tank is full, even if the magnitude of the load is lower, achieving 38.0 m in the west direction. This result shows the importance of considering the load eccentricity.
Results of this work have direct engineering implications for pipeline protection in industrial plants. Although the biological basin has a longitudinal axis of symmetry, asymmetric operational conditions lead to differential settlements that can induce bending and axial strains in adjacent pipelines. Moreover, the far-field settlement effects propagate to considerable distances from the foundation, showing the importance of considering not only settlements beneath new heavy structures (e.g., tanks) but also far-field deformations. Considering the predicted maximum total settlements of 15.5 cm and differential settlements in the range of 2–3 cm, mitigation measures are recommended to limit potential damage to adjacent pipelines in industrial plants. Specifically, the obtained maximum value of 15.5 cm of total settlement may affect the pipeline integrity. Consequently, as a precautionary measure, the foundation of the biological basin will be constructed at a higher elevation to compensate for the expected initial settlements within the 38 m influence zone, since long-term settlements are not expected to be equally significant.

8. Limitations and Future Developments

In this paper, static loading conditions have been analyzed. Future work could include evaluating the dynamic response of the system considering the interaction between the biological basin and the soil. This aspect has received limited attention in current codes and design guidelines. Indeed, the seismic vulnerability of petrochemical facilities is commonly evaluated in accordance with codes and guidelines established for new and existing buildings [2]. Thus, the evaluation of the dynamic response of the system coupled with liquefaction and seismic-induced settlement assessment [35,36,37,38] will provide valuable insight into pipeline vulnerability under dynamic loading conditions.
The numerical analysis is conducted using a 2D plane strain FEM model. This assumption is commonly adopted for structures with a longitudinal axis of symmetry, as in the case under consideration. Moreover, the analyses are focused on the most representative and critical cross-section. Therefore, the 2D numerical model allows for capturing the primary deformation mechanisms with a reasonable computational cost. However, the biological basin and the asymmetric filling conditions considered in this study can induce three-dimensional effects. The influence of three-dimensional characteristics could also be included in the evaluation of the predicted settlement distribution and influence zone considering 3D configurations. The inclusion of three-dimensional effects could induce additional total settlements due to the reduction in lateral confinement, a more extensive influence zone, and differential effects in the structure due to the asymmetric filling. As a result, future developments could include 3D FEM analyses or alternative numerical approaches to better evaluate the predicted settlement distribution and the influence zone.
Previous studies have demonstrated the relevance of the settlement influence zone in civil engineering problems [24,25,26]. However, these concepts have not been extended to an industrial context, where large tanks impose high operating loads. Consequently, it was not possible to make a direct comparison with other studies. The development of analytical solutions or empirical relationships for this context is recommended for future work.
Finally, the present paper addresses the problem from a geotechnical perspective, focusing on the evaluation of ground settlements induced by the biological basin. The translation of differential settlements of 2–3 cm into actual stresses and strains in pipelines requires structural analyses considering the soil-pipeline interaction, as discussed in [7,8,9,10,11,12,13,14,15,16,17].

Author Contributions

Conceptualization, F.C., V.L. and M.S.V.S.; methodology, F.C., V.L. and M.S.V.S.; software, M.S.V.S.; formal analysis, F.C., V.L. and M.S.V.S.; data curation, F.C., V.L. and M.S.V.S.; writing—original draft preparation, F.C., V.L. and M.S.V.S.; writing—review and editing, F.C., V.L. and M.S.V.S.; project administration, F.C. and V.L. All authors have read and agreed to the published version of the manuscript.

Funding

This research received no external funding.

Data Availability Statement

The original contributions presented in this study are included in the article. Further inquiries can be directed to the corresponding author.

Acknowledgments

The authors wish to thank all anonymous reviewers for their valuable comments and suggestions.

Conflicts of Interest

The authors declare no conflicts of interest.

Abbreviations

The following abbreviations are used in this manuscript:
FEMFinite Element Method
MASWMultichannel Analysis of Surface Waves
SPTStandard Penetration Tests

References

  1. Lanzano, G.; Salzano, E.; Santucci De Magistris, F.; Fabbrocino, G. Vulnerability of Pipelines Subjected to Permanent Deformation Due to Geotechnical Co-seismic Effects. Chem. Eng. Trans. 2013, 32, 415–420. [Google Scholar] [CrossRef] [Scilit]
  2. Castelli, F.; Grasso, S.; Lentini, V.; Sammito, M.S.V. Effects of Soil-Foundation-Interaction on the Seismic Response of a Cooling Tower by 3D-FEM Analysis. Geosciences 2021, 11, 200. [Google Scholar] [CrossRef] [Scilit]
  3. Pan, J.; Liang, S. A study on the buckling behavior of in-service large open-topped oil-storage tanks. Structures 2021, 29, 211–224. [Google Scholar] [CrossRef] [Scilit]
  4. Shi, L.; Wang, X.; Shai, J.; Xu, K.; Li, M. Oil storage tank settlement assessment based on standard and finite element analyses. In Proceedings of the ASME 2017 Pressure Vessels and Piping Conference, Waikoloa, HI, USA, 16–20 July 2017. [Google Scholar] [CrossRef] [Scilit]
  5. Thusyanthan, I.; Enriquez, H. Design Guidance for Evaluating Storage Tank Settlements and Acceptable Tank Settlement Criteria. In Proceedings of the 20th Internacional Conference on Soil Mechanics and Geotechnical Engineering, Sydney, Australia, 1–5 May 2022; pp. 2317–2322. [Google Scholar]
  6. Fappas, D.; Gregory, C.S.; Karamanos, S.A.; Keil, B.D.; Mielke, R.D.; Card, R.J. Safeguarding the Integrity of Large-Diameter Steel Pipelines Subjected to Differential Ground Settlements. In Pipelines; American Society of Civil Engineers: Reston, VA, USA, 2021. [Google Scholar]
  7. Huang, Z.; Yu, X.; Lv, Z.; Chen, C.; Shuai, J.; Li, Y.; Liu, Q. Mechanical response analysis of pipeline under settlement based on pipe-soil interaction model. Appl. Ocean Res. 2024, 151, 104162. [Google Scholar] [CrossRef] [Scilit]
  8. Huo, Y.; Hassan Gomaa, S.M.M.; Zayed, T.; Meguid, M. Review of analytical methods for stress and deformation analysis of buried water pipes considering pipe-soil interaction. Undergr. Space 2023, 13, 205–227. [Google Scholar] [CrossRef] [Scilit]
  9. Zhang, H.; Feng, Q.; Yan, B.; Zheng, X.; Yang, Y.; Chen, J.; Zhang, H.; Liu, X. State of the Art of Oil and Gas Pipeline Vulnerability Assessments. Energies 2023, 16, 3439. [Google Scholar] [CrossRef] [Scilit]
  10. Ayinde, O.; Hu, Q.; Wang, F.; Bao, Y.; An, G. Stress prediction equation for buried pipelines subjected to internal loading and cold wave-induced soil temperature. Tunn. Undergr. Space Technol. 2026, 172, 107543. [Google Scholar] [CrossRef] [Scilit]
  11. Sheil, B.B.; Martin, C.M.; Byrne, B.W. Simulation of overburden pressure during laboratory investigations of axial pipe–soil interaction. Gèotechnique 2021, 71, 272–278. [Google Scholar] [CrossRef] [Scilit]
  12. Cocchetti, G.; di Prisco, C.; Galli, A.; Nova, R. Soil–pipeline interaction along unstable slopes: A coupled three-dimensional approach. part 1: Theoretical formulation. Can. Geotech. J. 2009, 46, 1289–1304. [Google Scholar] [CrossRef] [Scilit]
  13. Ni, P.; Moore, I.D.; Take, W.A. Numerical modeling of normal fault-pipeline interaction and comparison with centrifuge tests. Soil Dyn. Earthq. Eng. 2018, 105, 127–138. [Google Scholar] [CrossRef] [Scilit]
  14. Qin, X.; Ni, P. Kinematics of bell-spigot joints in vitrified clay pipelines under differential ground movement. Tunn. Undergr. Space Technol. 2019, 91, 103005. [Google Scholar] [CrossRef] [Scilit]
  15. Qin, X.; Wang, Y.; Fu, C. Joint kinematics and sealing capacity assessment of ductile iron pipes under abrupt transverse ground movements. Can. Geotech. J. 2022, 59, 342–358. [Google Scholar] [CrossRef] [Scilit]
  16. Zhai, K.; Wang, F.; Fang, H.; Ni, P.; Ji, X.; Guo, C.; Hu, S. Serviceability assessment of prestressed concrete cylinder pipes with broken wires: Analytical solution and numerical simulation. Tunn. Undergr. Space Technol. 2022, 126, 104551. [Google Scholar] [CrossRef] [Scilit]
  17. Qin, X.; Ni, P.; Wang, Y.; Yan-Jun Du, Y.J. Mechanical response estimation of jointed rigid pipes under normal fault rupture. Soil Dyn. Earthq. Eng. 2021, 146, 106754. [Google Scholar] [CrossRef] [Scilit]
  18. Jiao, Y.; Wang, Y.; Li, J.; Liu, X. Finite Element Analysis and Improved Evaluation of Mechanical Response in Large Oil Storage Tanks Subjected to Non-Uniform Foundation Settlement. Processes 2024, 12, 2838. [Google Scholar] [CrossRef] [Scilit]
  19. Zhou, P.; Wang, J.; Song, Z.; Tian, X.; Zhang, Y.; Xiao, W.; Yagiz, S. Theoretical prediction method for settlement of existing tunnel induced by undercrossing. Transp. Geotech. 2026, 62, 102111. [Google Scholar] [CrossRef] [Scilit]
  20. Zhou, P.; Song, Z.; Wang, J.; Zhang, Y.; Tian, X. Prediction method for ground surface settlement induced by bias tunnel based on stochastic medium theory. Chin. J. Geotech. Eng. 2025, 47, 589–598. [Google Scholar] [CrossRef] [Scilit]
  21. Wang, J.; Zhou, P.; Song, Z.; Li, S.; Zhang, Q. A New Calculation Method for Tunneling-Caused Stratum Settlement. KSCE J. Civ. Eng. 2022, 26, 2624–2640. [Google Scholar] [CrossRef] [Scilit]
  22. Huo, R.; Zhou, P.; Song, Z.; Wang, J.; Li, S.; Zhang, Y. Study on the settlement of large-span metro station’s baseplate caused by the tunnels newly built beneath it. Adv. Mech. Eng. 2019, 11, 1687814018825161. [Google Scholar] [CrossRef] [Scilit]
  23. Zhou, P.; Wang, J.; Song, Z.; Cao, Z.L.; Pei, Z.M. Construction Method Optimization for Transfer Section Between Cross Passage and Main Tunnel of Metro Station. Front. Earth Sci. 2022, 10, 770888. [Google Scholar] [CrossRef] [Scilit]
  24. Chandrawanshi, S.; Garg, V. Effect of adjacent structures on footing settlement for different multi-building arrangements. Open Eng. 2024, 14, 20240092. [Google Scholar] [CrossRef] [Scilit]
  25. Moghadasi, H.; Eslami, A.; Akbarimehr, D.; Asgari, S. Assessment of adjacent foundations consequences and solutions for remediation via physical modeling. Soil Dyn. Earthq. Eng. 2024, 180, 108613. [Google Scholar] [CrossRef] [Scilit]
  26. Shumakov, I.; Basanskyi, V.; Fursov, Y.; Bratishko, S.; Savchenko, O. Determination of the impact zone of enabling works of a new construction on the surrounding buildings. Sci. Bull. Build. 2023, 1, 17–22. [Google Scholar] [CrossRef] [Scilit]
  27. PLAXIS 2D. Reference Manual. 2018. Available online: https://communities.bentley.com/products/geotech-analysis/w/plaxis-soilvision-wiki/50826/manuals-archive-plaxis (accessed on 1 January 2026).
  28. Castelli, F.; Grasso, S.; Lentini, V.; Sammito, M.S.V. Calibration of the UBC3D-PLM soil model from dilatometer Marchetti test (DMT) for the liquefaction behaviour and cyclic resistance ratio (CRR) of sandy soils. Soil Dyn. Earthq. Eng. 2024, 187, 109002. [Google Scholar] [CrossRef] [Scilit]
  29. Grasso, S.; Sammito, M.S.V. Assessment of 2D site effects for seismic microzonation studies: Application to Eastern Sicily (Italy). Bull. Earthq. Eng. 2025, 23, 3889–3922. [Google Scholar] [CrossRef] [Scilit]
  30. Castelli, F.; Grasso, S.; Lentini, V.; Sammito, M.S.V. Assessment of liquefaction effects on dynamic soil-structure interaction for the 1908 Messina and Reggio Calabria scenario earthquake. Soil Dyn. Earthq. Eng. 2024, 178, 108445. [Google Scholar] [CrossRef] [Scilit]
  31. PLAXIS 2D. Scientific Manual. 2018. Available online: https://communities.bentley.com/products/geotech-analysis/w/plaxis-soilvision-wiki/50826/manuals-archive-plaxis (accessed on 1 January 2026).
  32. Bowles, J.E. Foundation Analysis and Design; McGraw-Hill Companies: New York, NY, USA, 1996; p. 154. [Google Scholar]
  33. Stroud, M.A. The standard penetration test in insensitive clays and soft rock. In Proceedings of the 1st European Symposium on Penetration Testing, Stockholm, Sweden, 5–7 June 1974; Volume 2, pp. 367–375. [Google Scholar]
  34. PLAXIS 2D. Material Models Manual. 2018. Available online: https://communities.bentley.com/products/geotech-analysis/w/plaxis-soilvision-wiki/50826/manuals-archive-plaxis (accessed on 1 January 2026).
  35. Castelli, F.; Grasso, S.; Lentini, V.; Sammito, M.S.V. Liquefaction Resistance of Sandy Soil in South-Eastern Sicily from Cyclic Direct Simple Shear Testing. Geotech. Geol. Eng. 2025, 43, 488. [Google Scholar] [CrossRef] [Scilit]
  36. Grasso, S.; Sammito, M. Assessment of liquefaction potential in the framework of seismic microzonation using different approaches. Bull. Earthq. Eng. 2025, 23, 6013–6046. [Google Scholar] [CrossRef] [Scilit]
  37. Lentini, V.; Castelli, F. Liquefaction Resistance of Sandy Soils from Undrained Cyclic Triaxial Tests. Geotech. Geol. Eng. 2019, 37, 201–216. [Google Scholar] [CrossRef] [Scilit]
  38. Castelli, F.; Grasso, S.; Lentini, V.; Sammito, M.S.V. Nonlinear 3D Finite Element Analysis of a Coupled Soil–Structure System by a Deterministic Approach. Geosciences 2024, 14, 100. [Google Scholar] [CrossRef] [Scilit]
Figure 1. (a) Modes of tank settlement: (A) uniform settlement, (B) differential settlement center to periphery, (C) planar tilt; (D) differential settlement around circumference, (E) edge settlement, (F) localized bottom settlement (from [5]; modified); (b) differential settlement between the structure and the ground (from [6]; modified).
Symmetry 18 01427 g001
Figure 2. Location of the city of Augusta (Sicily, Italy) in the geological sketch map of the Hyblean Plateau.
Symmetry 18 01427 g002
Figure 3. Orthophoto of the investigated area. The blue circle indicates the study area (From Google Maps, modified).
Symmetry 18 01427 g003
Figure 4. (a) Plan view and (b) a representative section of the biological basis (Units: mm).
Symmetry 18 01427 g004aSymmetry 18 01427 g004b
Figure 5. Location of in situ tests performed in the investigated area.
Symmetry 18 01427 g005
Figure 6. Soil stratigraphy obtained from in situ investigation.
Symmetry 18 01427 g006
Figure 7. SPT blow counts, NSPT, versus depth obtained for each borehole.
Symmetry 18 01427 g007
Figure 8. Modulus of elasticity, E, versus depth obtained from NSPT values.
Symmetry 18 01427 g008
Figure 9. Shear wave velocity, Vs, profiles derived from MASW tests performed in the investigated area.
Symmetry 18 01427 g009
Figure 10. Numerical model used for FEM analyses with the indication of boundary conditions (Units: m).
Symmetry 18 01427 g010
Figure 11. (a) Center of gravity of the slab, G, and (b) eccentricity of the loads referred to G (Units: mm).
Symmetry 18 01427 g011
Figure 12. Loading conditions used for the FEM analyses: (a) Case 1 and (b) Case 2 (Units: m).
Symmetry 18 01427 g012
Figure 13. Pore pressures developed at the end of the plastic phase (Case 1).
Symmetry 18 01427 g013
Figure 14. (a) Deformed mesh at the end of the consolidation phase and (b) detailed view of the biological basin (Case 1).
Symmetry 18 01427 g014
Figure 15. Settlements, uy [m] as a function of Time [day] obtained from the consolidation analysis for the Node1 central to the slab (x = 154.8 m; y = 0 m); Node2 to the east in the slab (x = 138.5 m; y = 0 m; Node3 to the west in the slab (x = 177.8 m; y = 0 m) (Case 1).
Symmetry 18 01427 g015
Figure 16. Settlement vs. distance from foundation slab: (a) east and (b) west directions (Case 1).
Symmetry 18 01427 g016
Figure 17. Pore pressures developed at the end of the plastic phase (Case 2).
Symmetry 18 01427 g017
Figure 18. (a) Deformed mesh at the end of the consolidation phase and (b) detailed view of the biological basin (Case 2).
Symmetry 18 01427 g018
Figure 19. Settlements, uy [m] as a function of Time [day] obtained from the consolidation analysis for the Node1 central to the slab (x = 154.8 m; y = 0 m); Node2 to the east in the slab (x = 138.5 m; y = 0 m; Node3 to the west in the slab (x = 177.8 m; y = 0 m) (Case 2).
Symmetry 18 01427 g019
Figure 20. Settlement vs. distance from foundation slab: (a) east and (b) west directions (Case 2).
Symmetry 18 01427 g020
Figure 21. Influence zone following the construction of the biological basin. Iso-settlement lines and affected areas are indicated in pink (Units: mm).
Symmetry 18 01427 g021
Table 1. Geotechnical characterization of the soil layers under consideration.
Layerγ [kN/m3]γs [kN/m3]c’ [kPa]cu [kPa]φ’ [°]φu [°]E [kPa]ν [-]VS [m/s]
Fill19.5020.558.8478.4530.0-635,8460.33320
Silty sand18.5025.439.2388.2625.015.047,1600.38140
Sandy silt17.5025.439.23117.6822.011.026,0000.40180
Silty clay17.8026.778.45166.7120.013.037,0000.40220
Table 2. Input parameters used in FEM analyses for the Mohr–Coulomb model.
Layerγ [kN/m3]c’ [kPa]φ’ [°]E [kPa]ν [-]From [m]To [m]
Fill19.5058.8430.0635,8460.3301.20
Silty sand18.5039.2325.047,1600.381.2012.0
Sandy silt17.5039.2322.026,0000.4012.023.2
Silty clay17.8078.4520.037,0000.4023.280
Table 3. Loading conditions used for the FEM analyses.
CaseF [kN/m]Ey [m]
137442.41
24886−0.80
Disclaimer/Publisher’s Note: The statements, opinions and data contained in all publications are solely those of the individual author(s) and contributor(s) and not of MDPI and/or the editor(s). MDPI and/or the editor(s) disclaim responsibility for any injury to people or property resulting from any ideas, methods, instructions or products referred to in the content.