1. Introduction
In modern engineering fields such as artificial intelligence, intelligent manufacturing, and aerospace engineering, a large number of practical problems can be abstracted as high-dimensional, multi-constrained, and nonconvex continuous optimization problems, including unmanned aerial vehicle (UAV) path planning, parameter identification, and resource scheduling [
1,
2]. The core challenge of these problems lies in the nonlinear characteristics of the search space, the strong coupling among decision variables, and the frequent presence of multiple optimization objectives, which make it difficult for traditional deterministic optimization methods to obtain satisfactory solutions within a reasonable computational time [
3,
4]. As a result, swarm intelligence-based optimization algorithms, which are stochastic methods inspired by natural phenomena or social behaviors, have become mainstream approaches for solving complex optimization problems due to their strong global search capability, high robustness, and independence from gradient information [
5,
6,
7,
8].
From the perspective of inspiration sources, existing swarm intelligence optimization algorithms can generally be categorized into three groups. The first group is based on biological behaviors, such as Particle Swarm Optimization (PSO) inspired by flocking behavior of birds [
9], Artificial Bee Colony (ABC) algorithm mimicking honeybee foraging mechanisms [
10], Secretary Bird Optimization Algorithm (SBOA) inspired by the survival strategies of secretary birds in different environments [
11], Grey Wolf Optimizer (GWO) motivated by the hierarchical leadership and cooperative hunting behavior of grey wolves [
12], Dung Beetle Optimizer (DBO) inspired by the dung-rolling behavior of beetles [
13], and Whale Optimization Algorithm (WOA), which simulates the unique bubble-net feeding mechanism of humpback whales involving encircling, shrinking, and spiral movements [
14]. These algorithms achieve optimization by modeling cooperation and competition within biological populations [
15].
The second group is based on physical phenomena, such as the Gravitational Search Algorithm (GSA), which simulates gravitational interactions among objects [
16], and the Polar Lights Optimizer (PLO), inspired by the physical mechanism of aurora formation [
17]. These algorithms construct search update rules by exploiting physical laws. The third group is based on social or organizational behaviors, such as Differential Evolution (DE), which abstracts evolutionary processes in natural and social systems [
18]. Among them, the Enterprise Development Optimization (ED) algorithm [
19], as an emerging social behavior-inspired method, models enterprise development by abstracting four core dimensions—task execution, organizational structure adjustment, technological innovation, and personnel interaction—into optimization operators. By breaking away from the limitations of traditional biologically inspired algorithms, ED has demonstrated unique advantages in certain optimization problems.
In recent years, extensive research efforts have focused on improving the performance of swarm intelligence optimization algorithms, mainly through algorithmic structure enhancement, parameter adaptive adjustment, and multi-strategy hybridization [
20,
21,
22,
23]. In terms of parameter adaptation, Yin et al. proposed a reinforcement learning-based PSO (RLPSO), which introduces a reinforcement learning-driven parameter adaptation mechanism to improve optimization accuracy during the exploitation phase [
24]. Regarding multi-strategy hybridization, Shi et al. proposed an improved catch fish optimization algorithm based on multi-strategy fusion, which employs a Markov-guided Cauchy perturbation strategy to construct a dynamic elite selection pool, thereby alleviating inefficient exploration caused by random reference individual selection. By leveraging the heavy-tailed property of the Cauchy distribution, the algorithm enhances global exploration capability and the ability to escape local optima [
25]. Gong et al. developed a multi-strategy improved Snake Optimizer (ISO), which introduces an adaptive Lévy flight strategy during the exploration phase to enhance global search capability while minimizing adverse effects on convergence speed. In the exploitation phase, a novel food position update mechanism is applied to accelerate convergence. Additionally, ISO integrates dual-lens fusion-enhanced opposition-based learning and a population-based survival-of-the-fittest strategy to improve robustness [
26].
Despite these advancements, existing improvement strategies still suffer from several limitations. First, variable correlations in high-dimensional optimization problems are often insufficiently considered, resulting in search directions that deviate from the true descent directions of the optimal solution [
27]. Second, most algorithms employ uniform update strategies for individuals with different performance levels, leading to inefficient allocation of search resources. Third, many parameter adjustment mechanisms lack effective historical feedback, making it difficult to adapt to dynamically changing search environments [
28,
29].
In practical engineering applications, three-dimensional UAV path planning represents a typical and challenging application scenario for swarm intelligence algorithms. This problem requires multi-objective optimization of path length, smoothness, and safety under complex terrain obstacles and threat constraints, and thus constitutes a high-dimensional, multi-constrained, and nonconvex optimization problem [
30,
31]. Existing algorithms such as PSO, DE, and DBO can generate feasible solutions for this task; however, they often suffer from path redundancy, insufficient obstacle avoidance accuracy, and slow convergence speed [
32,
33]. These shortcomings become more pronounced in high-dimensional and complex environments, making it difficult to satisfy the efficiency and reliability requirements of real-world engineering applications.
Although swarm intelligence optimization algorithms have achieved remarkable progress in solving complex optimization problems, several critical challenges remain in high-dimensional, multimodal, and strongly coupled scenarios [
34,
35,
36]. First, achieving a dynamic balance between exploration and exploitation is difficult, as many traditional algorithms rely on fixed strategies or empirical parameters, which may lead to premature convergence or reduced search efficiency. Second, as problem dimensionality increases, variable correlations become more prominent, and search strategies operating in the original coordinate space struggle to effectively capture problem structure, resulting in limited search directions. Third, the widespread use of uniform individual update mechanisms ignores performance differences among individuals, leading to suboptimal utilization of computational resources. Finally, the generalization ability and robustness of some improved algorithms across problems with varying complexity and real-world engineering constraints remain insufficiently validated [
37,
38].
To address these challenges, this paper proposes a Public Management–Augmented Enterprise Development Optimization algorithm (PMAED), aiming to enhance optimization accuracy, convergence speed, and stability in complex optimization problems through multi-strategy integration and mechanism innovation, while validating its practicality in real engineering applications. PMAED adopts adaptive differential evolution as the core search backbone, dynamically adjusting search parameters through a historical success memory mechanism. An eigen-based rotated coordinate search strategy is incorporated to align search directions with variable correlation structures. Furthermore, inspired by public management and organizational governance concepts, a hierarchical performance-based governance mechanism is introduced to apply differentiated interventions to individuals with different search performances. This design significantly improves local exploitation efficiency while maintaining strong global exploration capability. Through comprehensive benchmark experiments and engineering application validation, this study demonstrates the effectiveness and generality of the proposed algorithm for complex continuous optimization problems, and provides new insights into the development of social system-inspired optimization methods.
The main contributions of this paper are summarized as follows:
- (1)
A novel multi-strategy optimization framework (PMAED) integrating adaptive differential evolution, rotated search, and hierarchical governance is proposed.
- (2)
A new eigen-based rotated search strategy is introduced to handle variable correlations in high-dimensional problems.
- (3)
A hierarchical performance governance mechanism is developed to improve resource allocation and convergence efficiency.
- (4)
Extensive experiments on the CEC2020 and CEC2022 benchmark suites, along with statistical and stability analyses, verify the effectiveness and generality of the proposed algorithm. Additionally, its application to a 3D UAV path planning model with complex terrain and threat constraints further demonstrates its effectiveness and potential in real-world constrained optimization problems.
The remainder of this paper is organized as follows.
Section 2 reviews the fundamental principles of the enterprise development optimization algorithm and presents the proposed PMAED in detail, including the adaptive differential evolution backbone, rotated coordinate search strategy, and public management augmentation mechanism.
Section 3 conducts comprehensive comparative experiments on the CEC2020 and CEC2022 benchmark function suites to evaluate algorithm performance from multiple perspectives, including optimization accuracy, convergence behavior, stability, and statistical significance.
Section 4 formulates the three-dimensional UAV path planning problem and applies PMAED to this engineering application to demonstrate its effectiveness under complex terrain and threat constraints. Finally,
Section 5 concludes the paper and outlines potential directions for future research.
2. Methodology
2.1. Enterprise Development Optimization
The Enterprise Development Optimization (ED) algorithm is a population-based metaheuristic inspired by the dynamic evolution mechanism of enterprises. Instead of mimicking biological behaviors, ED abstracts enterprise development into an iterative optimization process driven by four functional dimensions: task execution, organizational structure, technological innovation, and personnel interaction [
19].
Figure 1 illustrates the conceptual inspiration of the enterprise development process, which provides the theoretical basis for the ED framework used in this study.
Through alternating these activities, the algorithm gradually shifts its search behavior from global exploration to local exploitation, enabling effective optimization in complex continuous spaces.
Let the optimization problem be defined as
where
is a D-dimensional decision vector, and
denotes the objective function.
- (1)
Population Initialization
At the beginning of the optimization process, a population consisting of N candidate solutions is randomly generated within the feasible search space.
Each individual is represented as a vector:
The initialization of each component is performed independently according to [
19]:
where
and
are the lower and upper bounds of the
-th dimension (scalars), and
is a uniformly distributed random scalar.
This strategy ensures that the initial population uniformly covers the search space, providing sufficient diversity for subsequent exploration.
- (2)
Enterprise Activity Modeling and Update Mechanisms
In ED, enterprise evolution is simulated through four activity modes. Each activity defines a distinct position update rule, reflecting different organizational behaviors.
The task-oriented activity models inefficient or poorly executed tasks within an enterprise. In optimization terms, this corresponds to introducing a low-quality reference solution to stimulate improvement.
A task-related individual is generated as:
where
are bound vectors,
is a random vector with each element sampled from (0,1), and
denotes element-wise multiplication.
This mechanism injects randomness into the population, preventing premature convergence.
Structural adjustment reflects how enterprise structure evolves under the influence of both internal coordination and external benchmarking [
39].
The position update rule is defined as:
where
is a scalar perturbation factor,
denotes the global best solution at iteration
t, and
is the structural centroid vector, computed as:
with
randomly selected individuals.
This strategy encourages individuals to evolve toward promising structural configurations guided by collective information.
Technological innovation balances exploration and exploitation, representing the dual nature of technological progress in enterprises [
39].
The update rule is formulated as:
where
are scalar coefficients.
This formulation enables adaptive learning behavior across different optimization stages.
Personnel interaction models the influence of teamwork and individual specialization within an enterprise.
A randomly selected dimension
is determined by:
The update for the selected dimension is:
where
is the average value of the selected dimension among several randomly chosen individuals.
This dimension-wise update enhances diversity while preserving convergence stability.
- (3)
Activity Switching Strategy
At each iteration, the ED algorithm activates only one enterprise activity for each individual.
The selection is controlled by a time-dependent scalar function:
where
is the current iteration index,
is the maximum number of iterations, and
.
As iterations progress, the probability gradually shifts from exploration-oriented activities to exploitation-oriented ones, enabling a smooth transition from global search to local refinement.
2.2. Proposed Methodology
2.2.1. Adaptive Differential Evolution Backbone
In the standard ED algorithm, individual updates mainly rely on heuristic operators (Structure, Technology, and People) to introduce random perturbations, and its search behavior is highly dependent on randomly generated parameters and operator-switching mechanisms. Although this strategy can be effective for certain low-dimensional or relatively simple problems, in complex optimization scenarios characterized by high dimensionality, strong nonlinearity, or significant inter-variable correlations, fixed or empirically tuned parameter settings struggle to dynamically balance global exploration and local exploitation. This often results in degraded search efficiency or premature convergence.
To enhance adaptability and search robustness, the PMAED algorithm incorporates an adaptive search framework centered on Differential Evolution (DE), combined with a success-history-based memory mechanism to enable online learning and dynamic adjustment of the mutation factor and crossover probability. This framework adopts a pbest-guided differential mutation strategy as its core and is further complemented by an external archive mechanism to fully exploit differential information among population members.
At the
-th generation, for the
-th individual
, an index
is first randomly selected from the historical memory, and the adaptive control parameters are generated as follows:
where
and
denote the memorized successful mutation factor and crossover probability, respectively, and
represents the standard Gaussian distribution. To ensure parameter validity, both
and
are constrained to the interval (0,1].
Subsequently, the top
elite individuals in the current population are selected to form the pbest set, from which one individual
is randomly chosen as the guiding vector. The differential mutation vector is then constructed as [
40]:
where
, and
can be randomly selected from either the current population or the external archive to further enhance search diversity.
After generating the mutant vector, PMAED employs a binomial crossover scheme to construct the trial solution:
where
is a randomly selected dimension index that guarantees at least one dimension undergoes mutation.
If the trial solution
outperforms the original individual
, the corresponding parameters
and the associated fitness improvement are recorded and used to update the historical memory. The memory update is performed using a Lehmer mean weighted by the magnitude of improvement:
where
denotes the relative improvement weight of the
-th successful individual.
Through this adaptive differential evolution backbone, PMAED dynamically adjusts the search step size and crossover intensity based on real-time feedback from the evolutionary process, thereby achieving an automatic balance between exploration and exploitation at different search stages. As a result, the algorithm exhibits significantly improved stability and convergence efficiency when tackling complex optimization problems.
2.2.2. Eigen-Based Rotated Search Framework
In high-dimensional continuous optimization problems, strong correlations or non-orthogonal couplings often exist among decision variables, rendering conventional axis-aligned search strategies ineffective for accurately approaching the optimal solution. When standard ED and conventional DE algorithms perform differential operations in the original coordinate space, the resulting search directions may significantly deviate from the true descent directions of the problem, thereby leading to reduced search efficiency.
To address this issue, the PMAED algorithm introduces an eigen-based rotated search framework grounded in covariance analysis. By online estimation of the principal directions of the population distribution, the search process is transformed into a feature space that better aligns with the intrinsic structure of the optimization problem.
At the
-th generation, the current population is first sorted in ascending order of fitness, and the top
elite individuals are selected to form the set
Subsequently, the mean vector
and the covariance matrix of this set are computed as
An eigen-decomposition is then performed on the symmetrized covariance matrix:
where
denotes the matrix of eigenvectors, which serves as the basis of the rotated coordinate system.
Under this rotated coordinate system, the position of each individual is mapped as
All differential mutation and perturbation operations are conducted in the
-space to generate new candidate solutions
, which are then mapped back to the original space via the inverse transformation:
By incorporating the eigen-based rotated search framework, PMAED adaptively aligns its search directions with the underlying variable correlation structure, enabling differential mutations to better conform to the intrinsic geometry of the problem. Consequently, the algorithm achieves markedly improved search efficiency and convergence stability when addressing non-separable, ill-conditioned, or strongly coupled optimization problems.
2.2.3. Public Management Augmentation Strategy
Although the adaptive differential evolution backbone and the rotated search mechanism substantially enhance the overall performance of the algorithm, in complex, multimodal, or late-stage search scenarios, the population may still suffer from imbalanced allocation of search resources or long-term inefficiency of certain individuals. Standard swarm intelligence algorithms typically apply a uniform update strategy to all individuals, lacking differentiated regulation mechanisms tailored to individuals with varying performance levels.
To address this limitation, PMAED introduces the Public Management Augmentation (PMA) strategy from the perspective of public management and organizational governance. In this framework, population individuals are analogized as “departments” with different performance levels, and hierarchical governance and differentiated interventions are implemented according to their search performance.
At the
-th generation, PMAED first sorts the current population in ascending order of fitness. Let the population size be
. The individuals are then partitioned into three performance tiers according to fixed proportions: the top 20% are defined as Elite (high-performance tier), the subsequent 50% are categorized as Normal (medium-performance tier), and the remaining 30% are assigned to the Poor (low-performance tier). The corresponding numbers of individuals are given by:
The hierarchical performance governance mechanism divides the population into three groups (elite, normal, and poor) based on fitness ranking. Each group is assigned different search strategies: elite individuals focus on exploitation with small perturbations, normal individuals balance exploration and exploitation, and poor individuals are encouraged to explore new regions through larger perturbations. Additionally, poor individuals are guided toward the global best solution to avoid stagnation. This mechanism improves resource allocation and enhances convergence efficiency.
This stratification process is performed dynamically at each generation, ensuring that individual tiers are continuously adjusted along the search process and preventing search bias caused by fixed role assignments.
During the evolutionary stage, PMAED applies differentiated search control strategies to individuals from different performance tiers. For individuals, a relatively conservative update scheme is adopted by reducing perturbation intensity and strengthening stable guidance, thereby accelerating local exploitation while avoiding excessive disruption of high-quality solutions. individuals follow the standard update mechanism augmented with guidance from the elite group, enabling them to maintain a certain level of exploration while gradually converging toward high-potential regions. In contrast, for individuals, perturbation strength and update amplitude are deliberately increased to broaden the search range and enhance the ability to escape local optima.
Furthermore, to prevent low-performance individuals from occupying computational resources for extended periods with limited contribution, PMAED introduces a centralized compulsory intervention mechanism. When an individual is classified into the
tier, its trial solution is corrected in an overlay manner centered on the current global best solution
, expressed as:
where
is a perturbation control coefficient that preserves necessary randomness while enforcing strong guidance, and
and
denote the lower bound and upper bound of the search space, respectively. This mechanism effectively redirects low-performance individuals toward high-potential search regions, thereby reducing computational budget waste and improving overall convergence efficiency.
Through the proposed PMA strategy, PMAED achieves performance-differentiated hierarchical governance and search behavior regulation without relying on additional gradient information. This approach not only maintains fast convergence but also effectively mitigates premature convergence, significantly enhancing the robustness and overall optimization performance of the algorithm when dealing with complex, multimodal, and high-dimensional optimization problems.
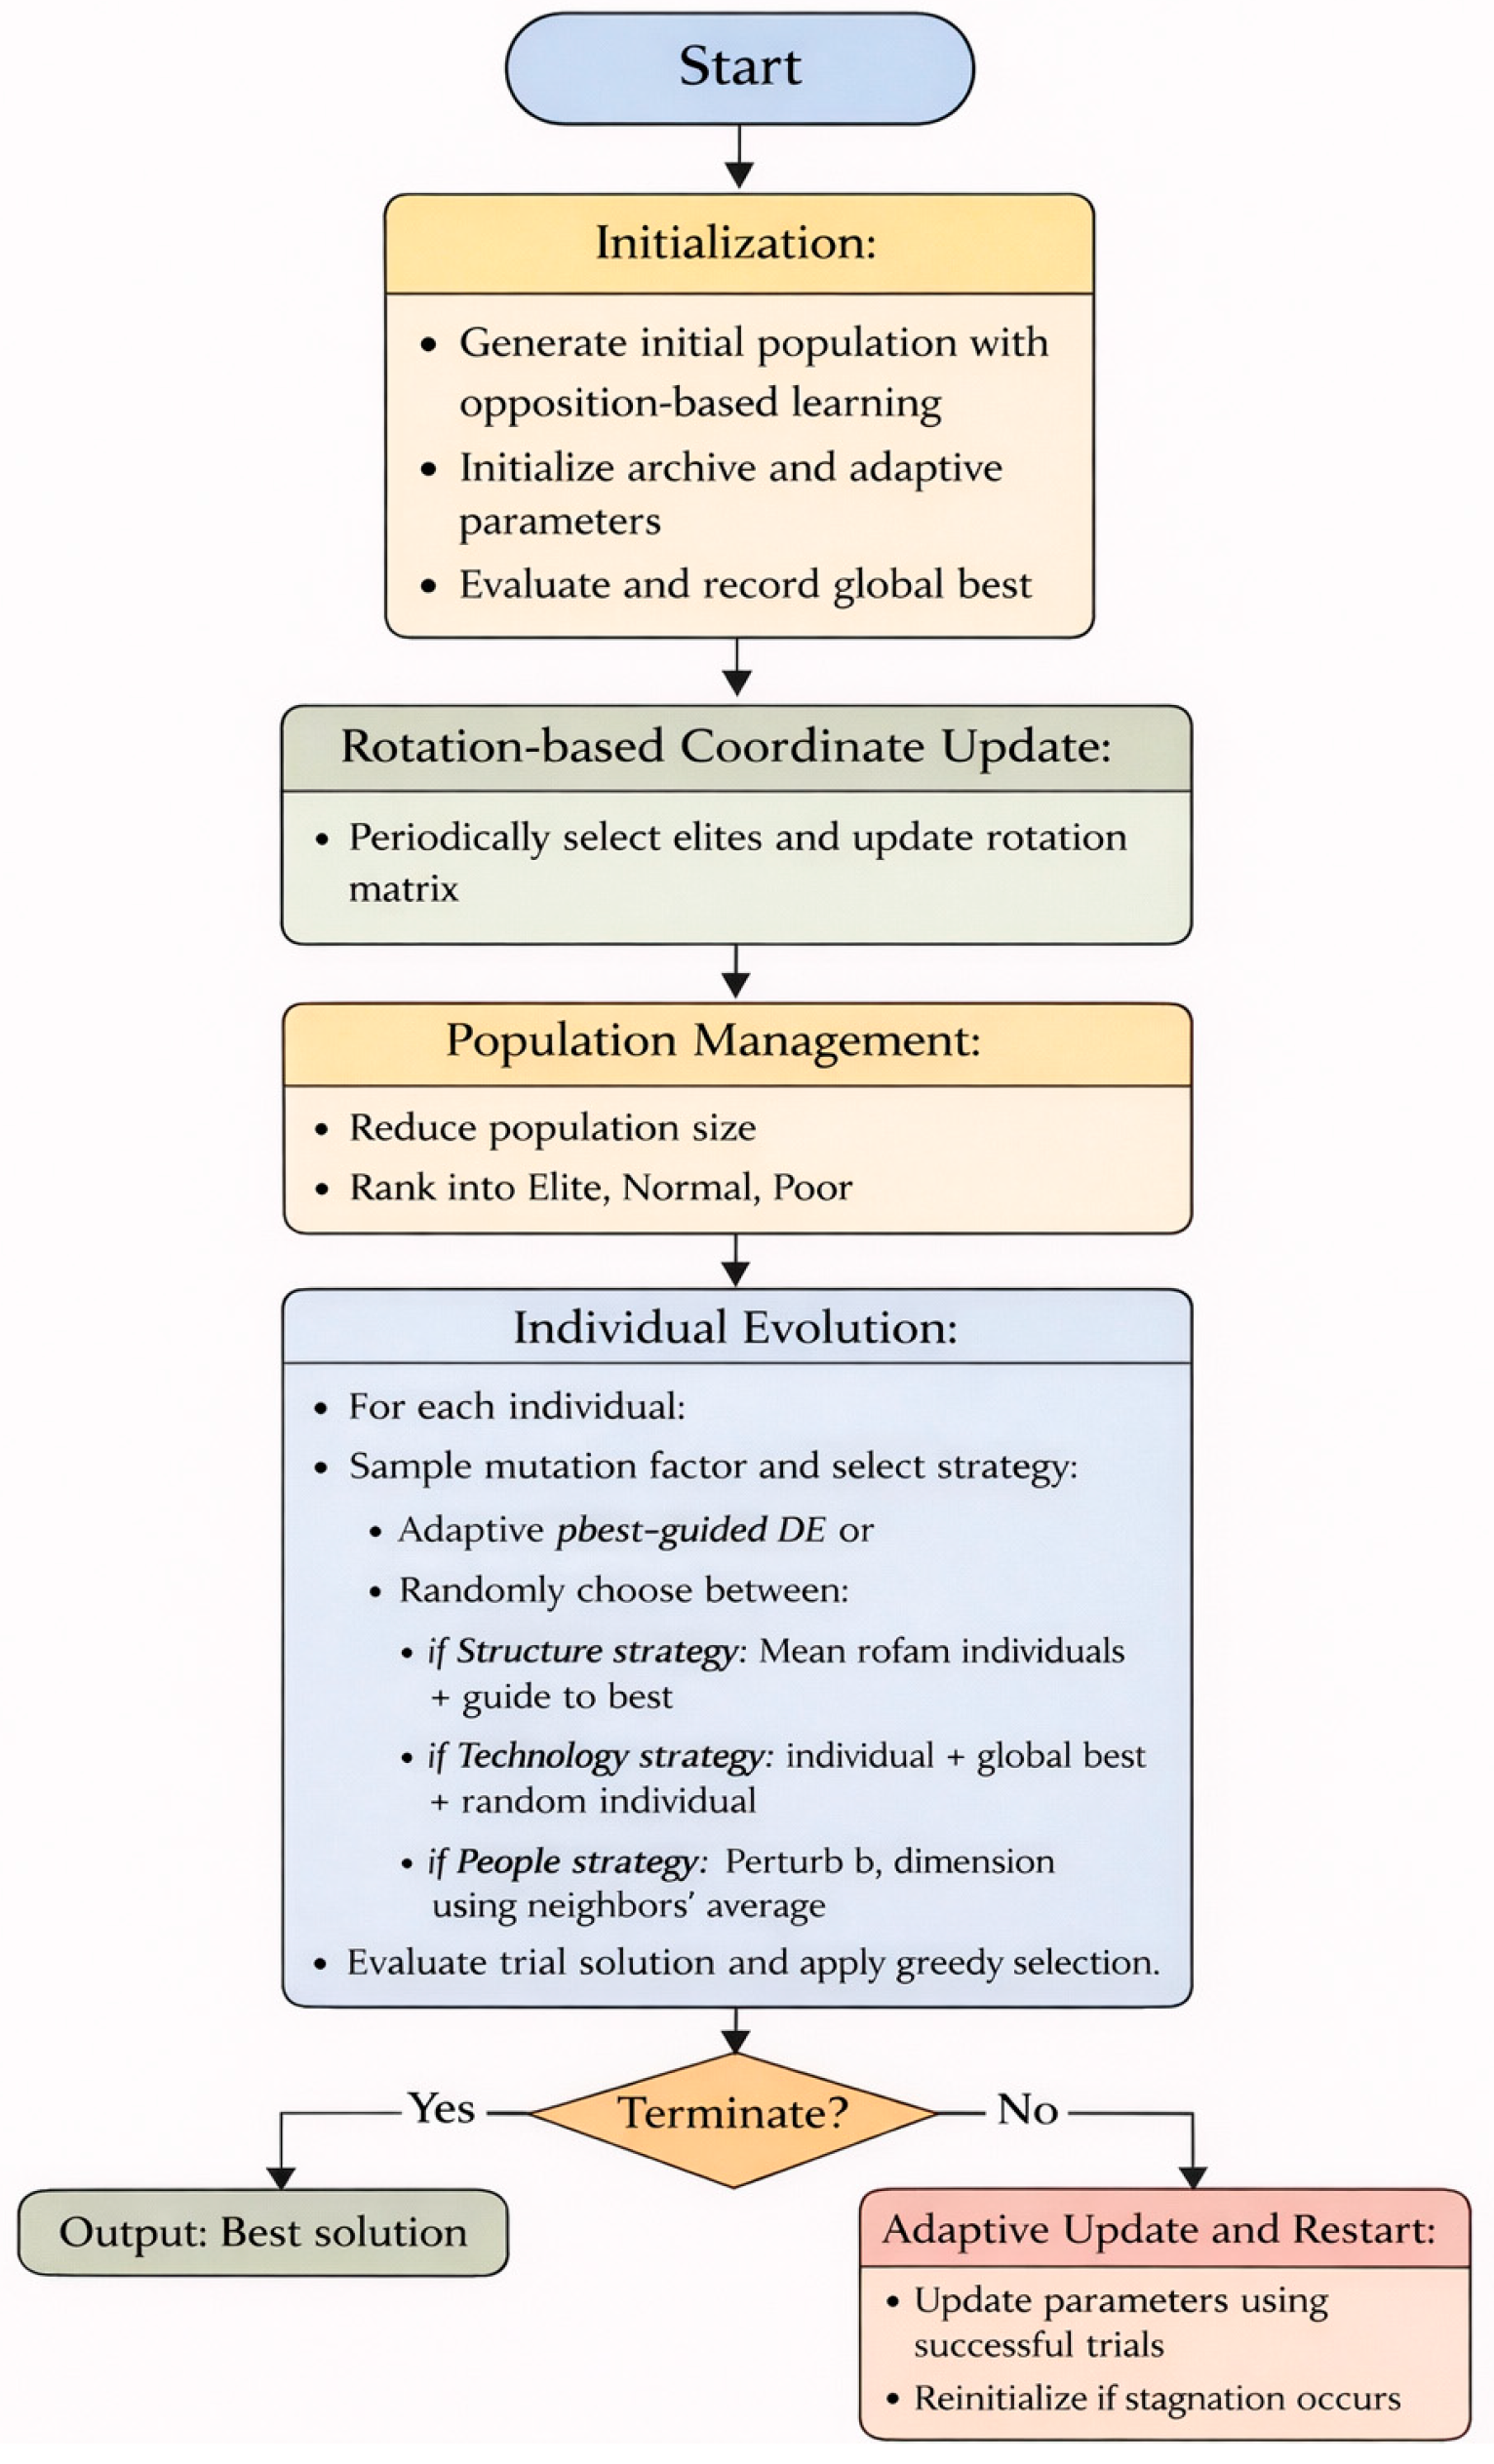
Based on the above discussion, the pseudocode for PMAED is presented in Algorithm 1 and the flowchart is shown in
Figure 2.
| Algorithm 1. Pseudo-Code of PMAED |
Input: objective function
Output: Best solution , best fitness .
1: Initialize the population randomly within .
2: Apply opposition-based learning and select the best individuals.
3: Initialize archive , parameter memories , and rotation matrix .
4: Evaluate population and record .
5: while do
6: Update rotation matrix using covariance eigen-decomposition of elite individuals (periodically).
7: Reduce population size according to remaining evaluation budget.
8: Sort population by fitness and divide into Elite, Normal, and Poor groups (PMA).
9: for
10: Sample adaptive parameters from memory
11: Select from top individuals and two random individuals (archive allowed).
12: Strategy selection:
13: a) Adaptive pbest-guided differential evolution strategy
b) MED-inspired auxiliary strategy pool.
14: if the auxiliary pool is selected, randomly activate one of the following strategies:
15: Structure strategy: generate a candidate solution by combining the mean position of several individuals and directing the search toward the current best solution.
16: Technology strategy: update the individual by learning simultaneously from the global best solution and another randomly selected individual.
17: People strategy: perturb a randomly selected dimension using the averaged information of multiple neighboring individuals.
18: Generate a trial solution via crossover and apply boundary handling.
19: For individuals in the Poor group, apply centralized intervention toward the current global best solution.
20: Evaluate the trial solution and apply greedy selection.
21: Update the archive and global best solution if improvement is achieved.
22: end for
23: Update parameter memories using successful trials.
24: If stagnation detected, reinitialize a fraction of worst individuals (micro-restart).
25: end while
26: Return the global best solution and its fitness . |
The dynamic balance is achieved by three core mechanisms:
- (1)
Adaptive DE parameters: Mutation factor F and crossover rate CR are updated by historical success memory, automatically increasing exploration in early iterations and strengthening exploitation in later stages.
- (2)
Rotated coordinate search: Adapts to problem structure to improve exploitation efficiency without losing exploration ability.
- (3)
Hierarchical governance: Elite individuals focus on exploitation, while poor individuals enhance exploration, maintaining population diversity and convergence speed simultaneously.
3. Experimental Study on CEC Benchmark Functions
3.1. Comparative Algorithms and Parameter Configuration
This section investigates the effectiveness of the proposed PMAED algorithm by testing it on two widely recognized and challenging numerical optimization benchmark suites, namely CEC2020 and CEC2022. The CEC2020 and CEC2022 benchmark suites consist of a set of standardized test functions widely used for evaluating optimization algorithms. These functions include unimodal, multimodal, hybrid, and composition functions, designed to assess different aspects such as convergence speed, global search capability, and robustness.
To provide a comprehensive performance comparison, PMAED is evaluated against a diverse set of well-established and state-of-the-art optimization methods. These include classical metaheuristic algorithms such as Particle Swarm Optimization (PSO) [
9] and Differential Evolution (DE) [
18]; improved variants of traditional approaches, including Velocity Pausing Particle Swarm Optimization (VPPSO) [
41] and Ensemble sinusoidal differential covariance matrix adaptation with Euclidean neighborhood (MadDE) [
42]; and several recently developed high-performance optimizers, namely the Dung Beetle Optimizer (DBO) [
13], Dhole Optimization Algorithm(DOA) [
43], Black-winged Kite Algorithm (BKA) [
44], Rime optimization algorithm (RIME) [
45] and Enterprise Development Optimization Algorithm(ED) [
19]. The parameter settings and implementation details of all comparative algorithms are summarized in
Table 1.
To ensure fairness in comparison and reduce the impact of random disturbances on experimental outcomes, all algorithms were evaluated under identical experimental settings. The population size was fixed at 30 individuals, with the maximum number of iterations capped at 500. Each algorithm was independently executed 30 times to obtain statistically reliable results. The performance of the algorithms was assessed using statistical indicators, including the mean value (Mean) and standard deviation (Std), and the best results are highlighted in bold for clarity.
All experiments were conducted on a uniform computing platform running the Windows 11 operating system. The hardware environment was equipped with an Intel® Core™ i7-12700 processor (base frequency of 2.1 GHz) and 32 GB of RAM. All simulations and numerical computations were implemented using MATLAB R2022b.
3.2. Parameter Sensitivity Analysis
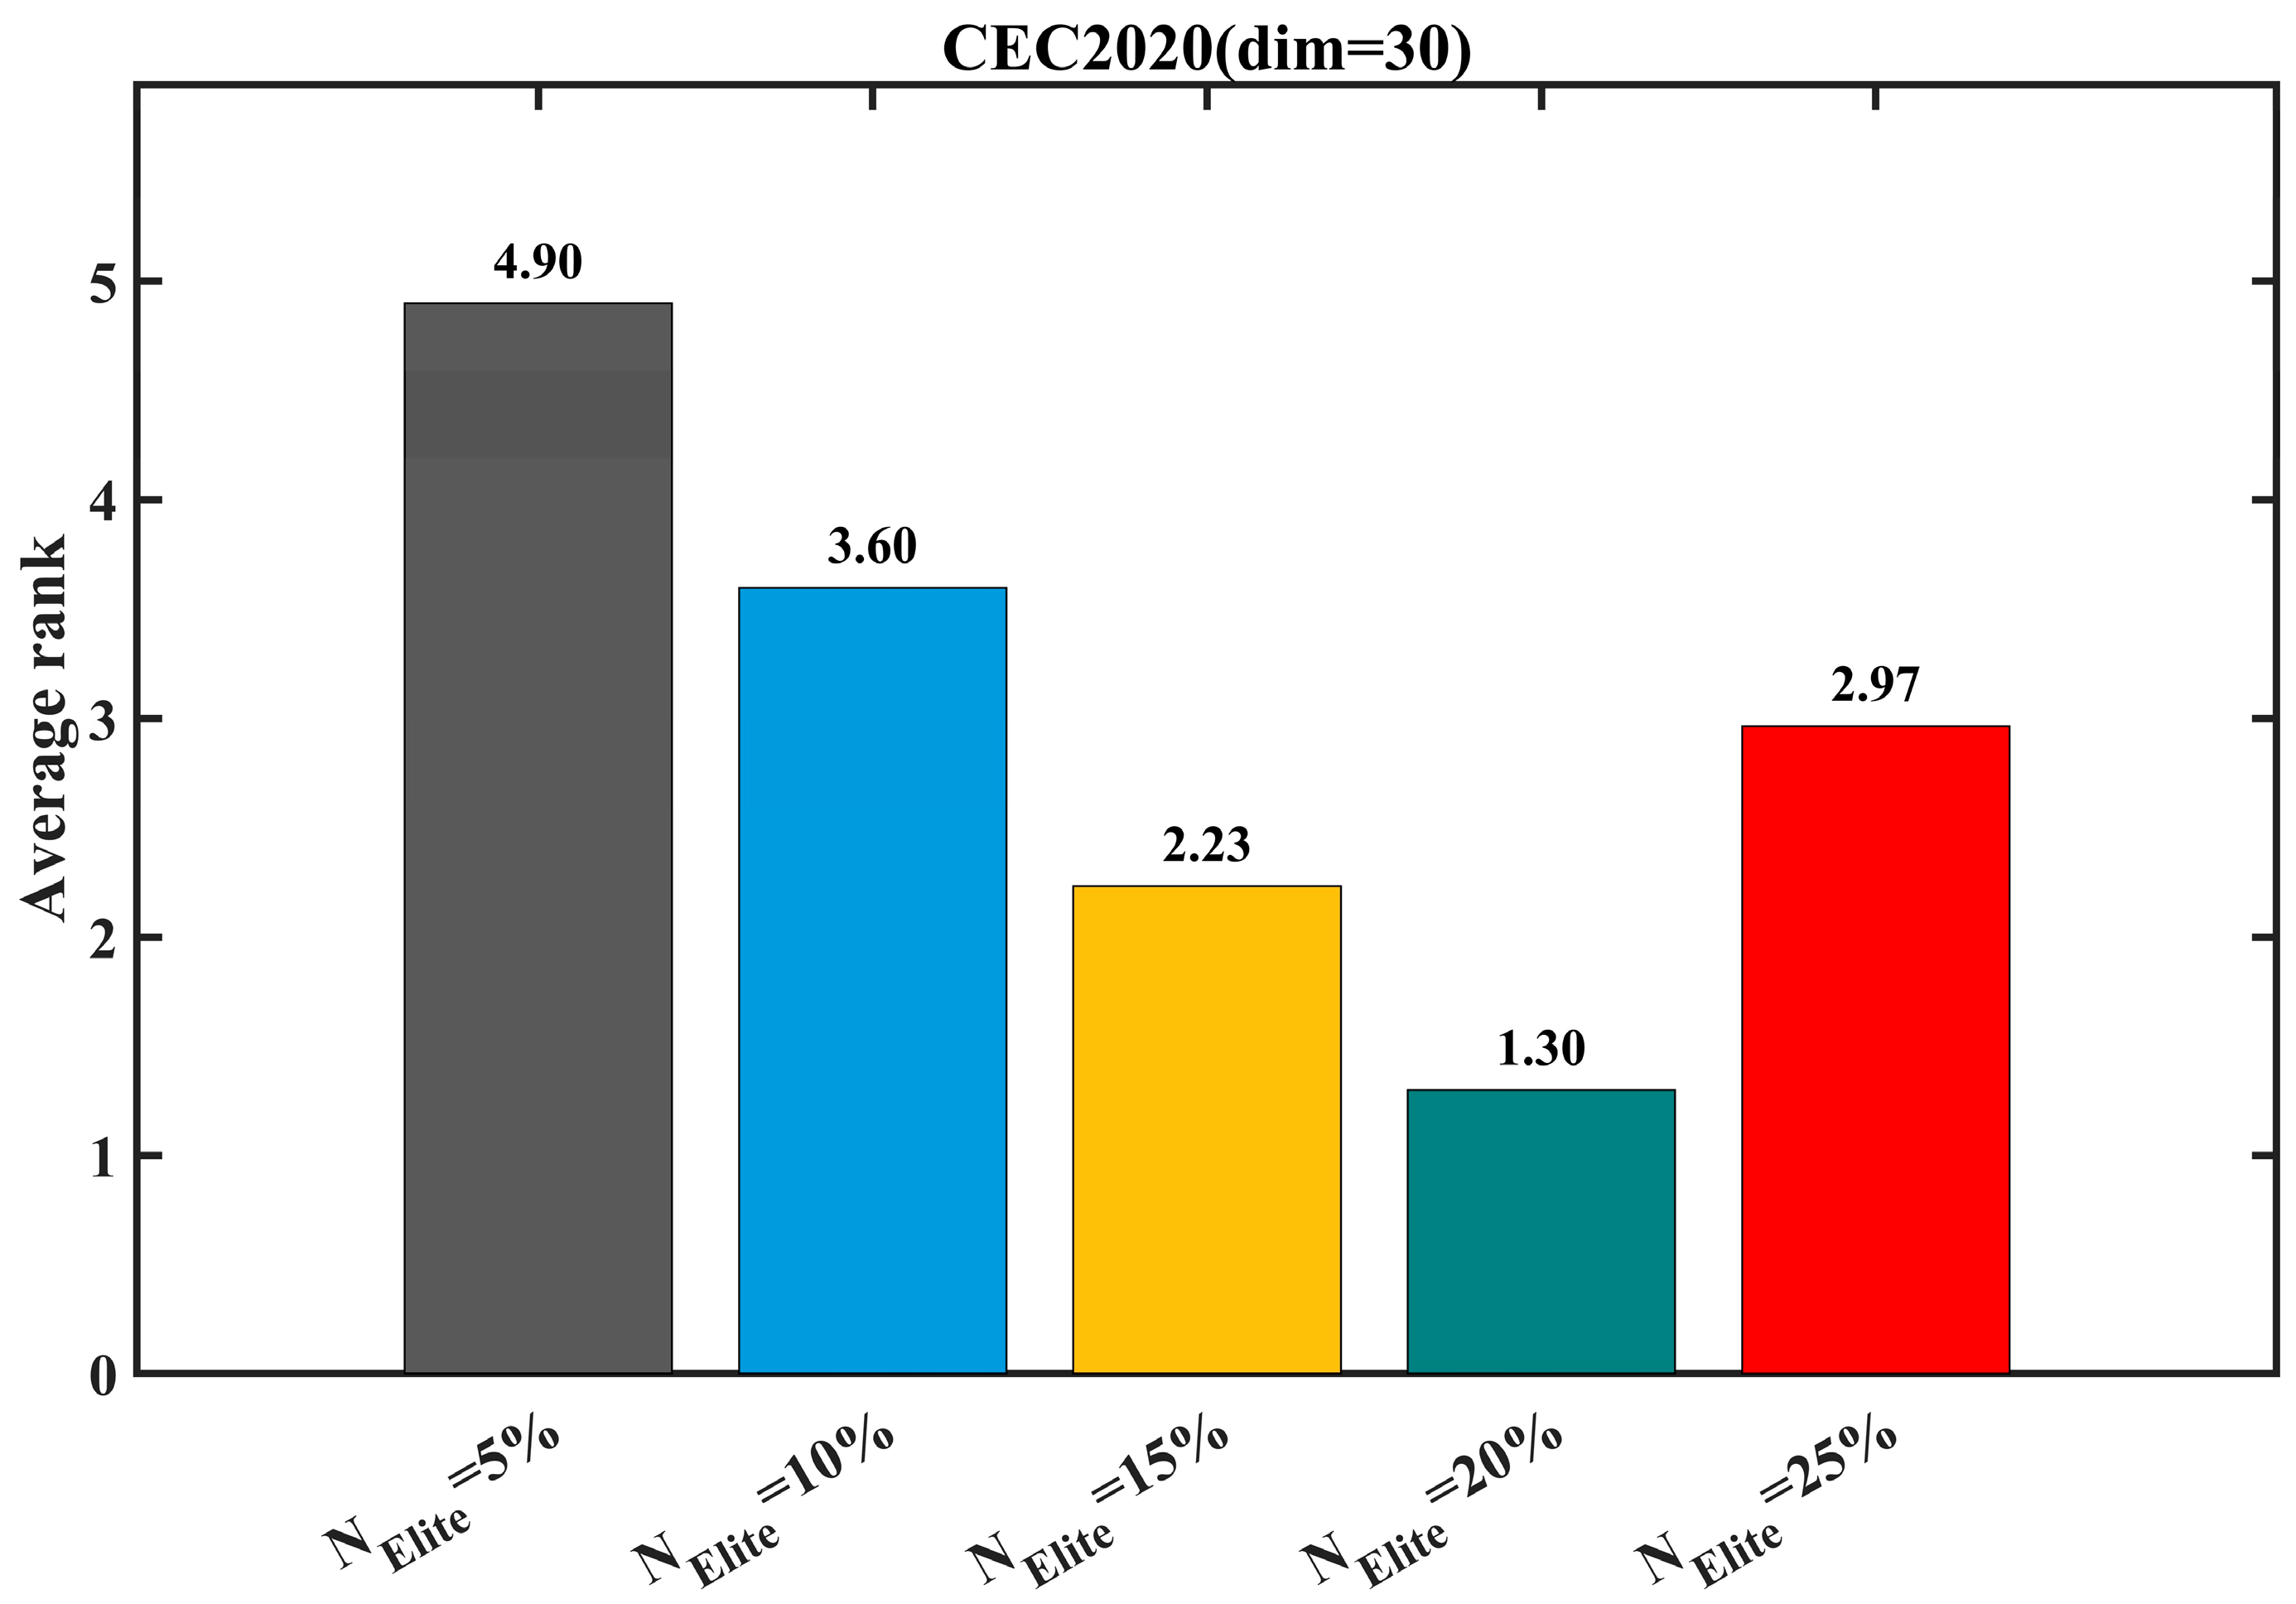
To investigate the effect of the elite population proportion in the public management enhancement strategy on the overall optimization performance of the PMAED algorithm, a parameter sensitivity study is conducted in this section. As high-quality search samples during the iterative process, elite individuals directly influence the efficiency of resource allocation and the guidance strength of the hierarchical governance mechanism. A low proportion may result in insufficient high-quality information, thereby failing to effectively guide population convergence; conversely, an excessively high proportion may cause the population to overly focus on local regions, leading to premature convergence. Therefore, different values of are examined using a controlled variable approach, and the average ranking is adopted as the evaluation metric to determine the optimal elite population proportion, ensuring a balance between exploration and exploitation.
Figure 3 illustrates the average ranking results of the PMAED algorithm under different values of
, where a lower ranking value indicates better overall performance. As
increases from 5% to 20%, the average ranking decreases steadily from 4.90 to 1.30, demonstrating a significant improvement in performance. This indicates that a moderate increase in the proportion of elite individuals provides more effective high-quality search guidance, enhancing local exploitation efficiency while maintaining reasonable search diversity. However, when
further increases from 20% to 25%, the average ranking rises to 2.97, reflecting a noticeable decline in performance. This deterioration can be attributed to the excessive reliance on elite individuals, which weakens global exploration capability and increases the risk of being trapped in local optima.
Overall, the results indicate that the PMAED algorithm achieves the best performance when , corresponding to the lowest average ranking. Therefore, the elite population proportion is set to 20% in this study.
3.3. Ablation Study Analysis
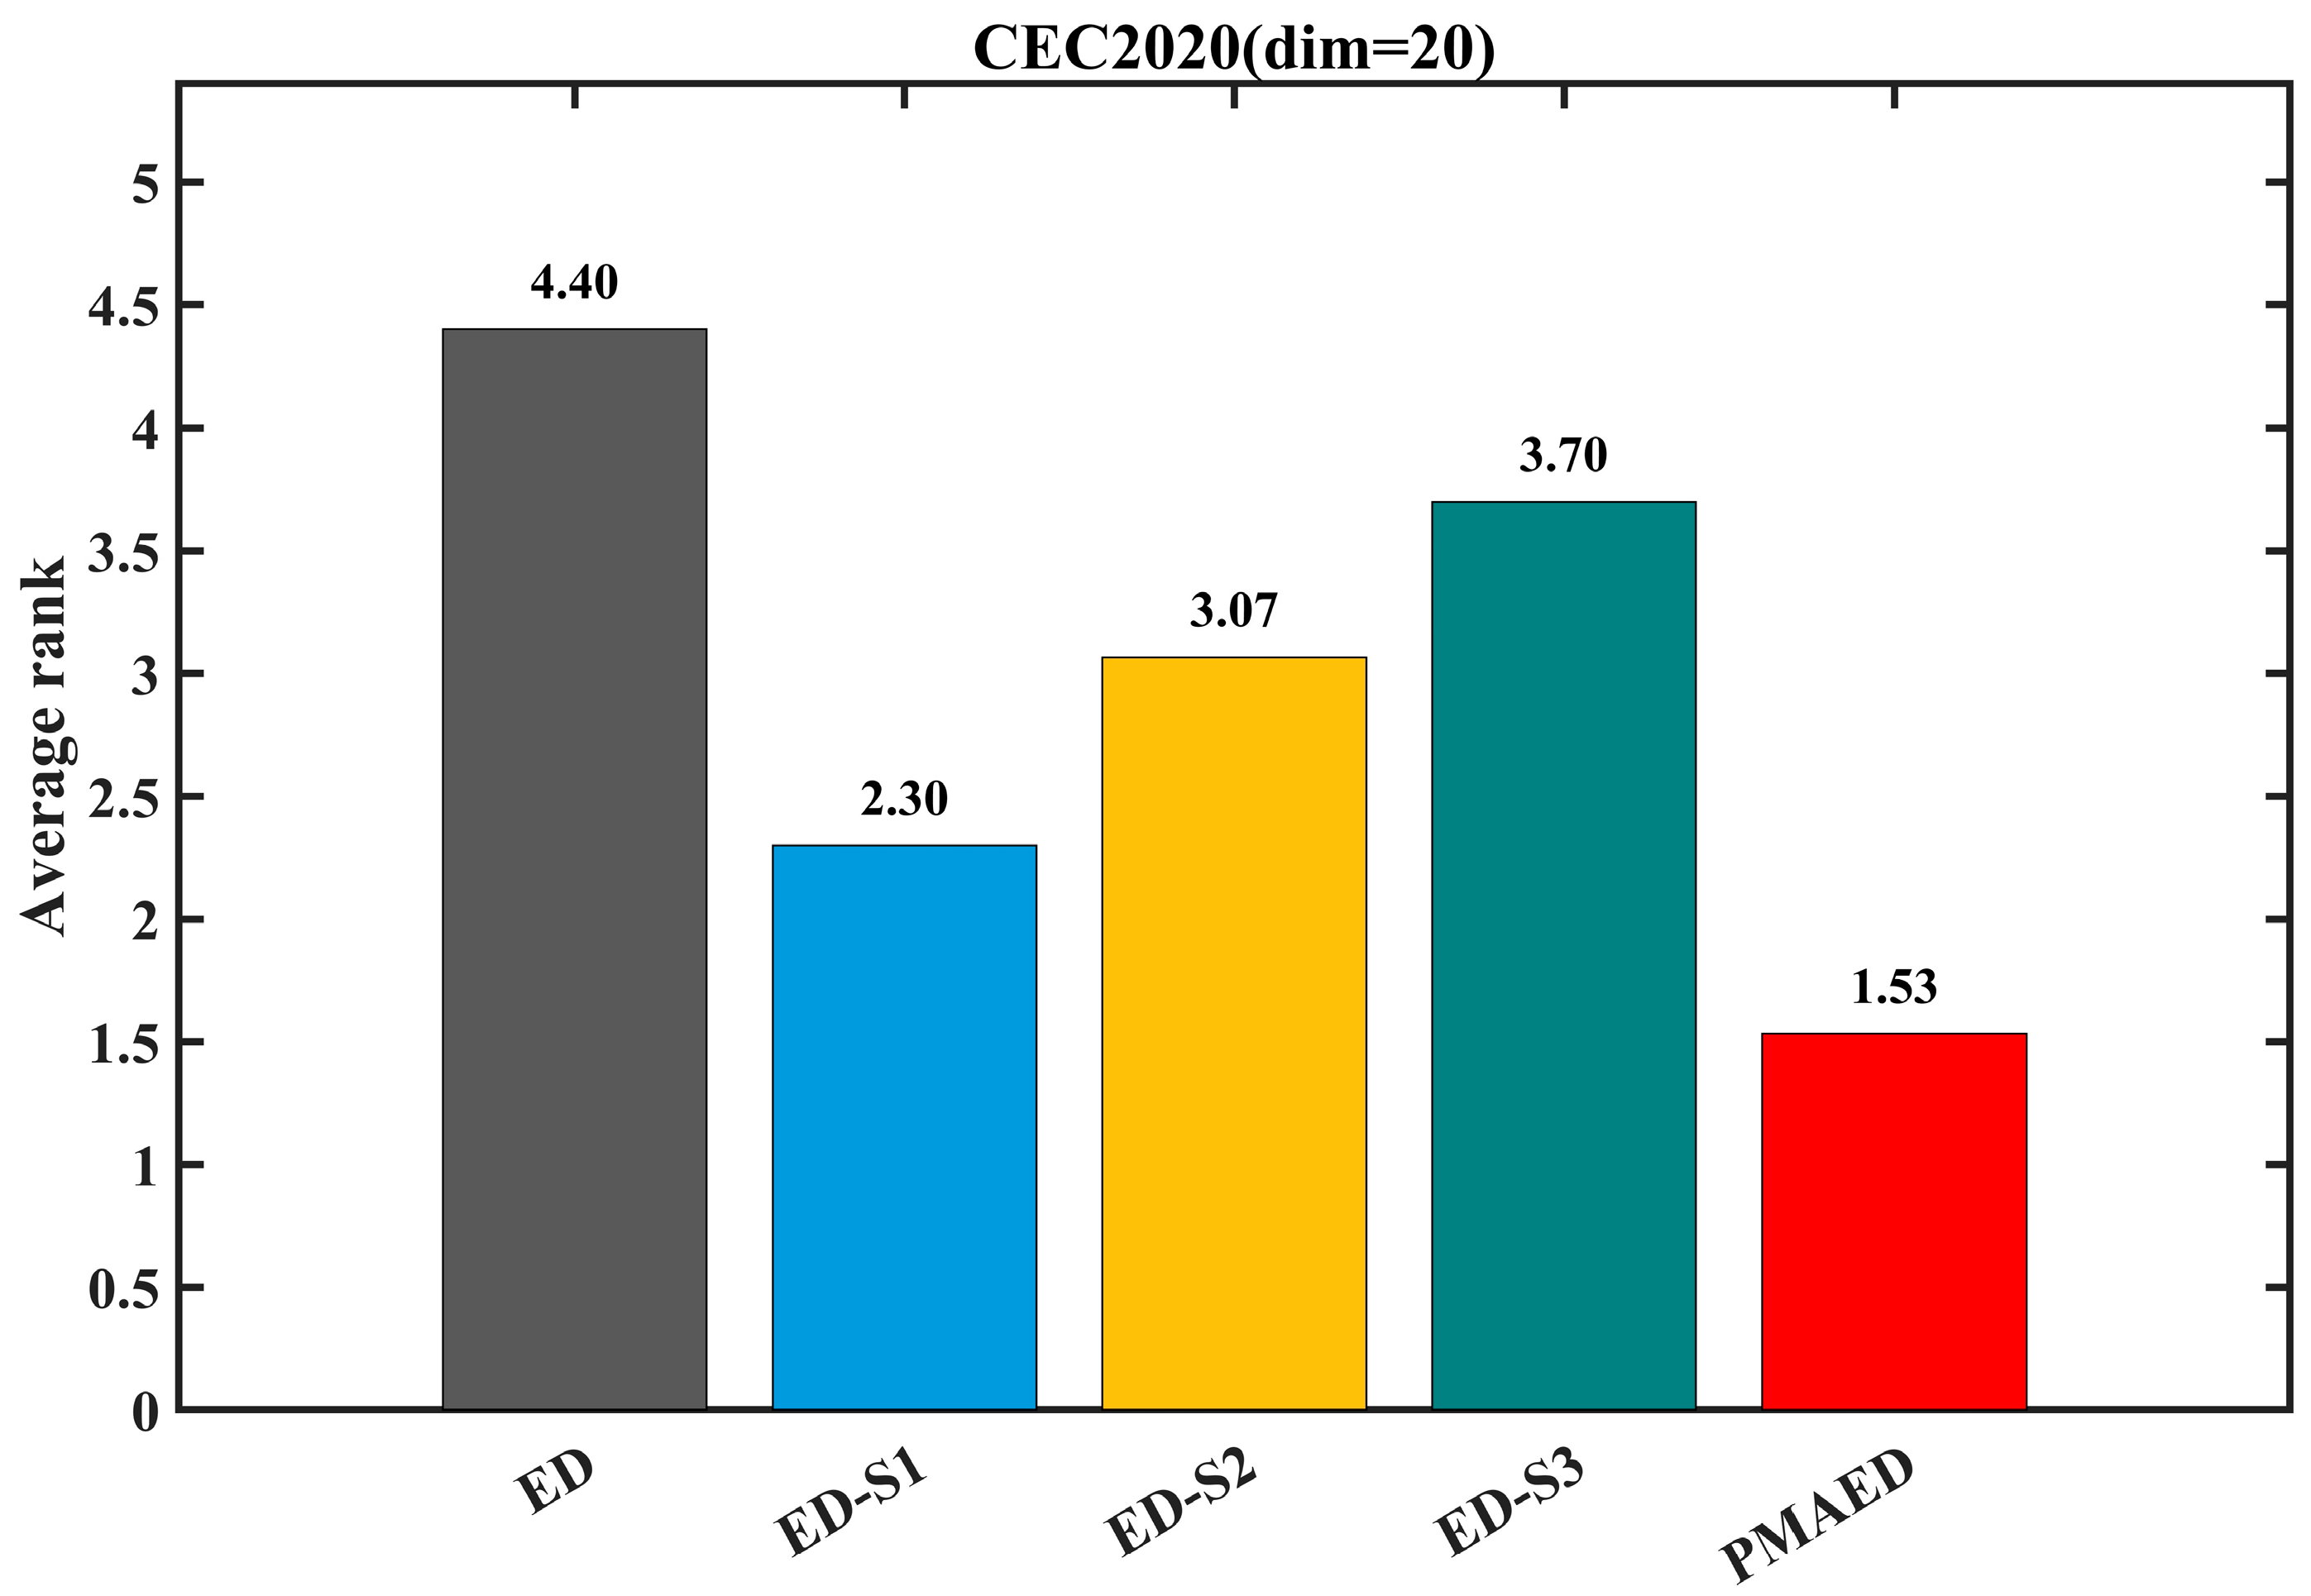
To quantitatively evaluate the performance improvements contributed by the three proposed enhancement strategies, an ablation study is conducted in this section. Specifically, the adaptive differential evolution backbone (S1), the feature rotation search framework (S2), and the public management enhancement strategy (S3) are individually integrated into the baseline Enterprise Development (ED) algorithm. Their performances are then compared with that of the complete PMAED algorithm. The average ranking is employed as the primary evaluation metric, where a lower ranking value indicates superior overall performance.
Figure 4 presents the comparison results of average rankings under different improvement strategies. The baseline ED algorithm achieves an average ranking of 4.40, indicating relatively limited performance. When S1 is incorporated alone, the average ranking decreases to 2.30, showing the most significant improvement. This demonstrates that the adaptive differential evolution backbone substantially enhances search accuracy and convergence speed through online parameter self-adaptation and efficient mutation–crossover mechanisms. When S2 is applied independently, the average ranking is 3.07, indicating that the feature rotation search framework effectively captures correlations among high-dimensional variables and optimizes the search direction, resulting in stable performance gains. When S3 is introduced alone, the average ranking becomes 3.70, confirming that the hierarchical performance governance mechanism improves search efficiency by optimizing resource allocation within the population.
When all three strategies are integrated to form the PMAED algorithm, the average ranking is further reduced to 1.53, significantly outperforming all single-strategy variants. This result clearly demonstrates the synergistic effect among the three strategies, which collectively enable a better balance between global exploration and local exploitation.
3.4. Experimental Evaluation on CEC 2020 Benchmark Functions
To verify the optimization accuracy, convergence efficiency, and stability of PMAED on global optimization tasks, this section conducts comparative experiments based on the CEC2020 benchmark function suite in 10- and 20-dimensional settings. By benchmarking PMAED against classical algorithms, state-of-the-art methods, and variants of the Golden Sine Algorithm, the effectiveness of PMAED’s multi-strategy integration and adaptive strategy selection mechanism is clearly demonstrated.
Table 2 and
Table 3 report the mean fitness values (Ave) and standard deviations (Std) achieved by PMAED and nine other comparison algorithms on the CEC2020 benchmark functions with 10 and 20 dimensions, respectively. In addition,
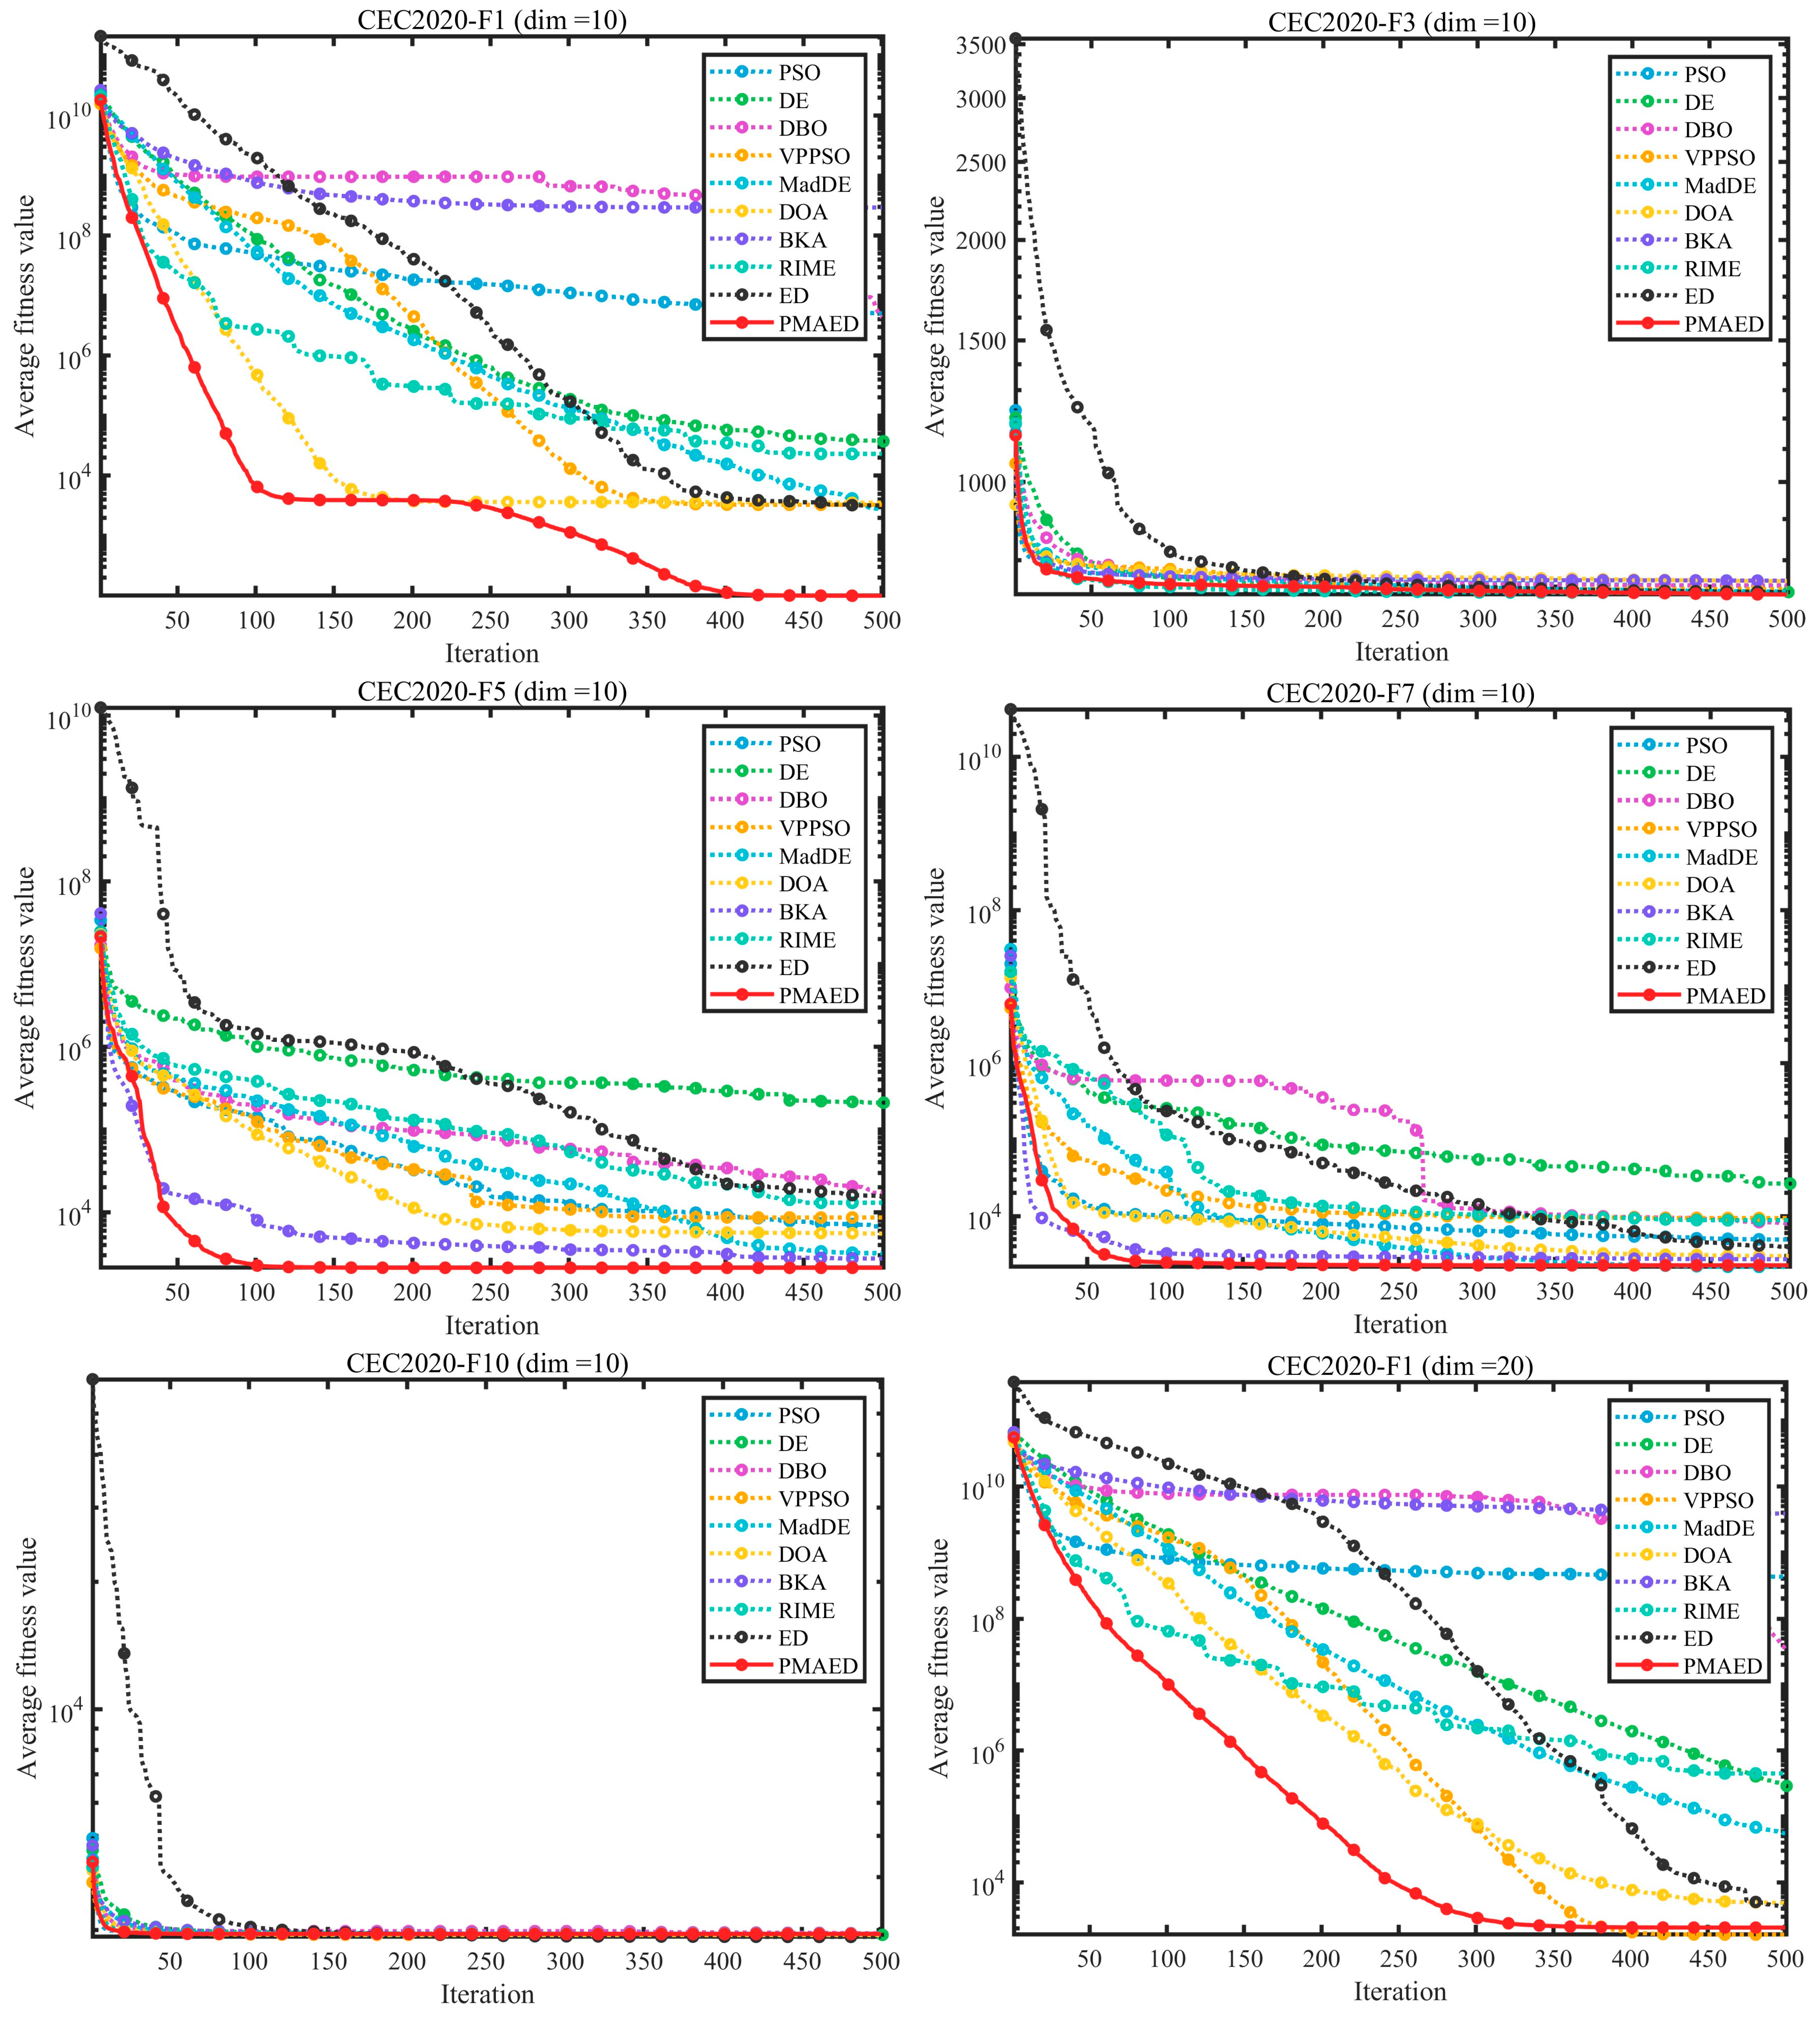
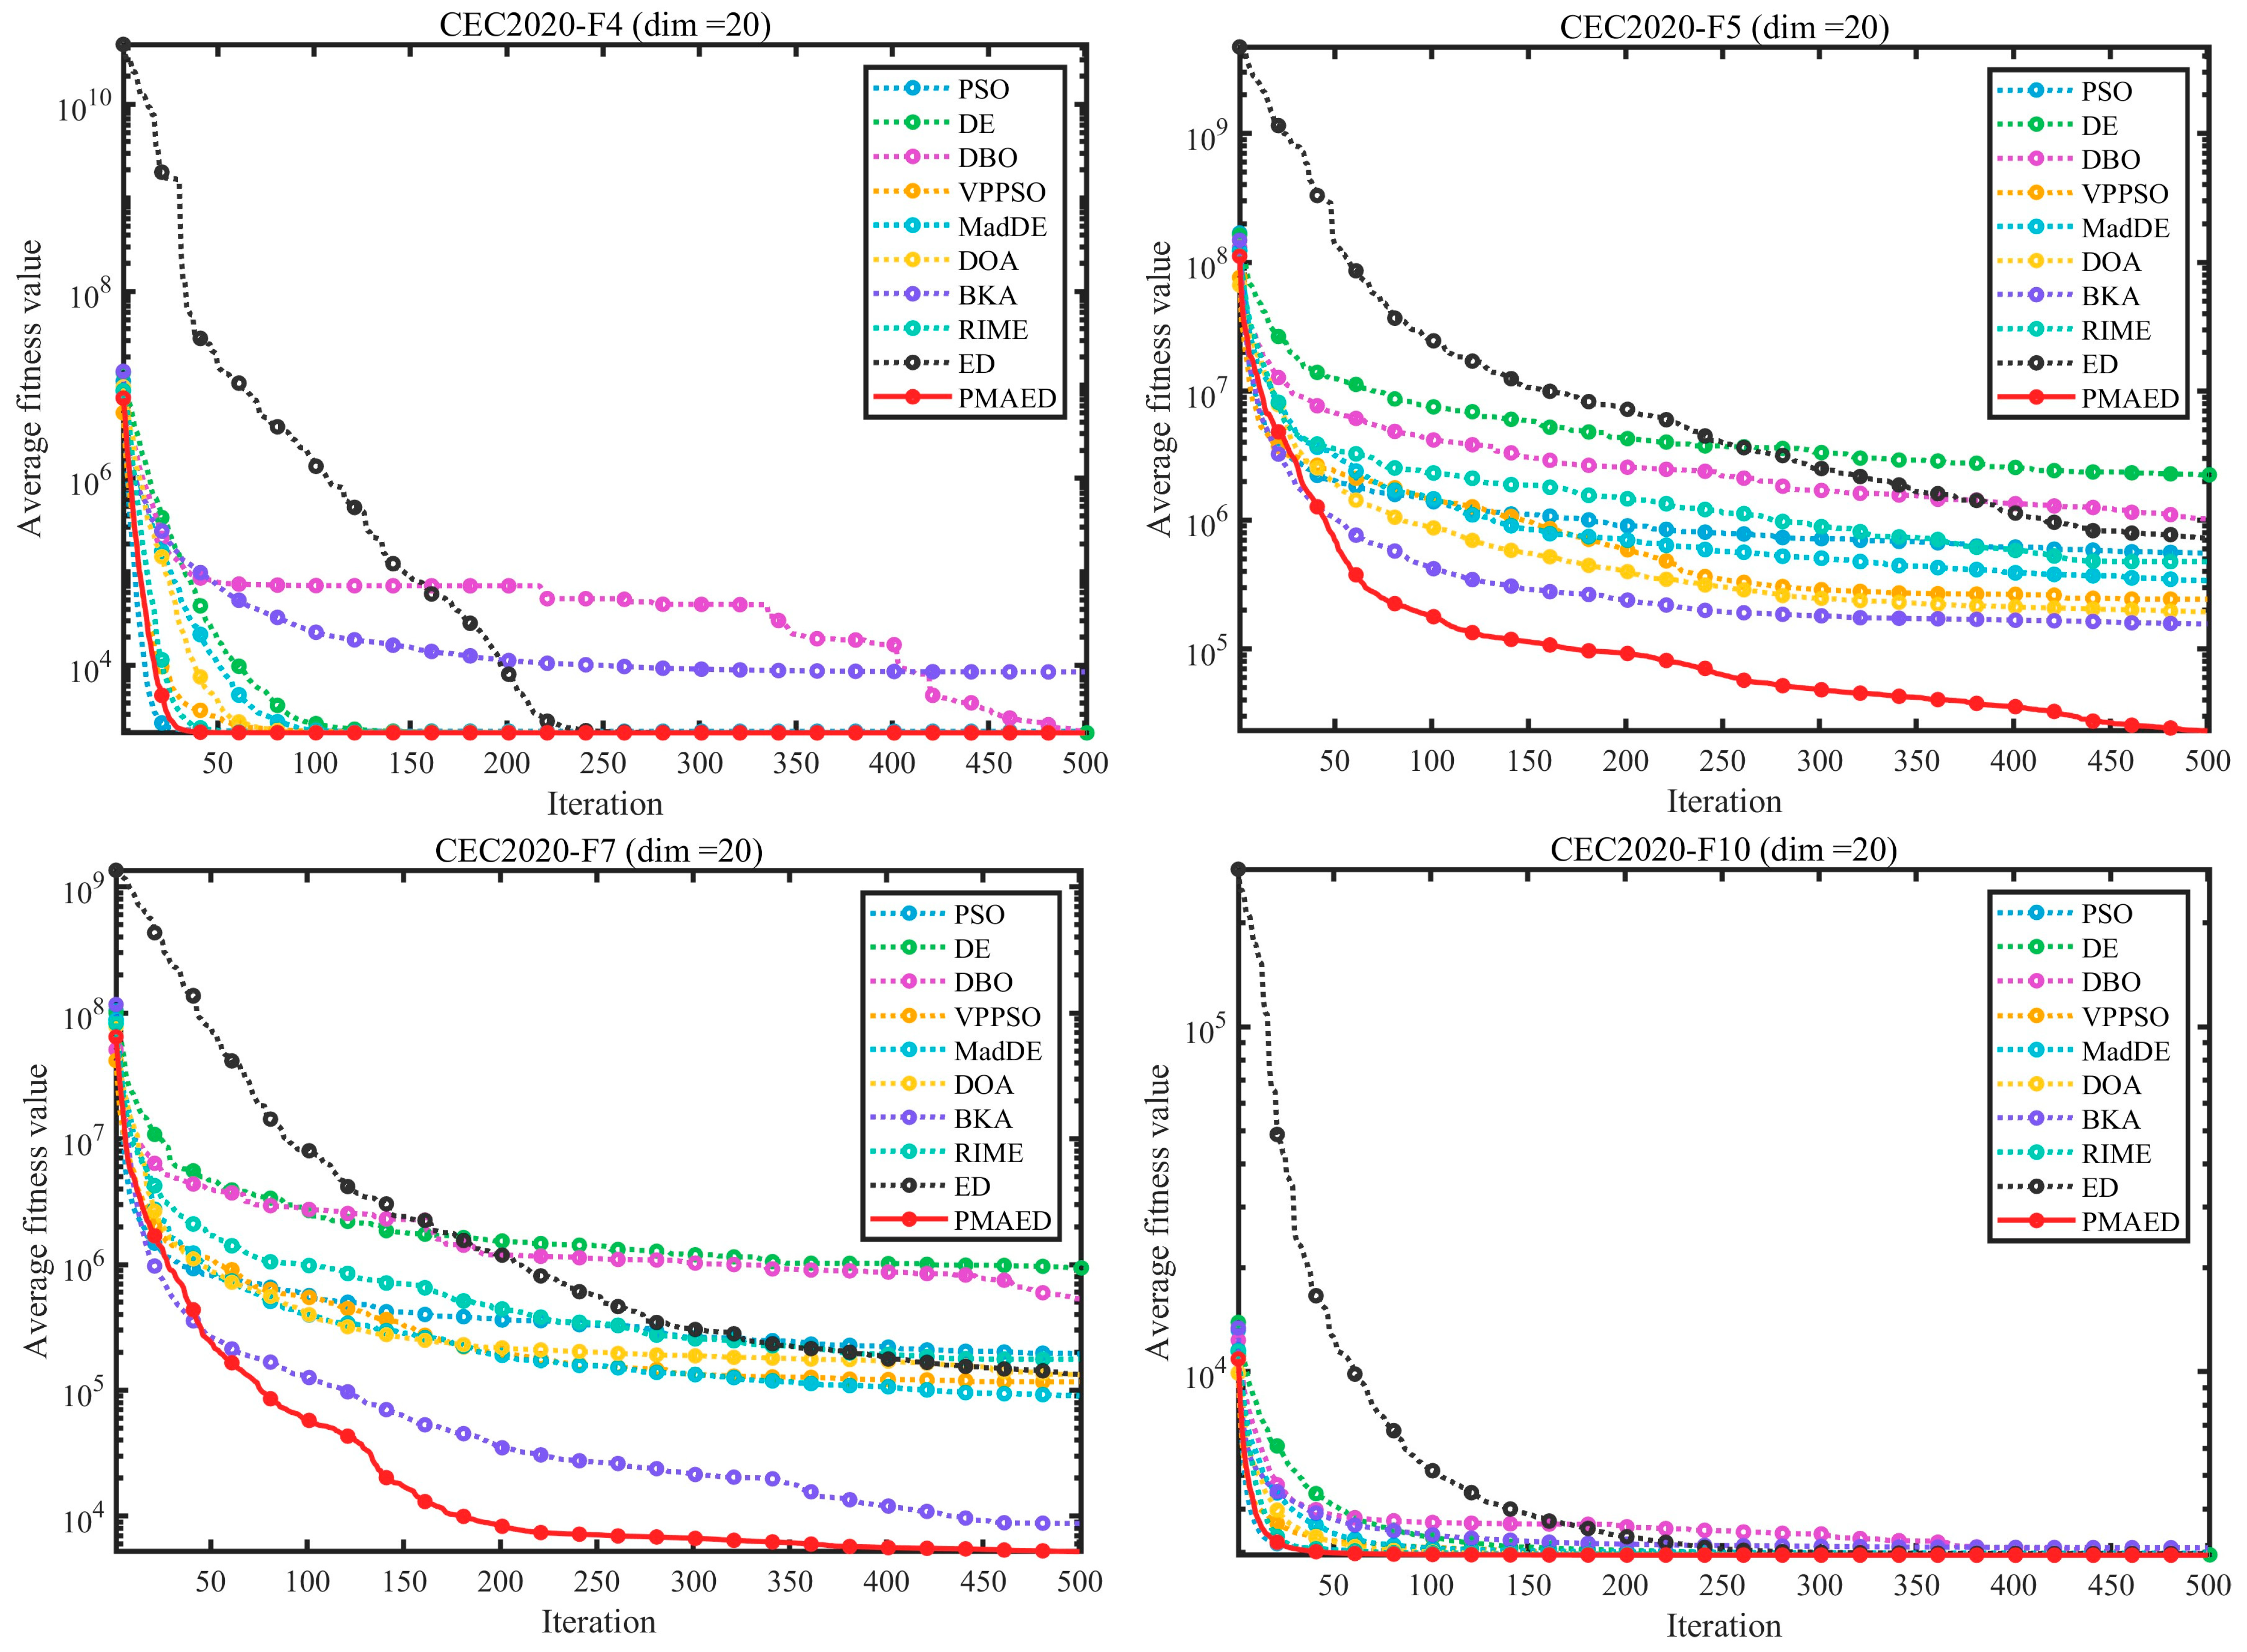
Figure 5 illustrates the convergence curves of several representative functions. Together, the numerical results and convergence behaviors provide comprehensive evidence of PMAED’s superior optimization performance in terms of both solution quality and convergence characteristics.
In the 10-dimensional scenario (
Table 2), PMAED demonstrates clear advantages on several key benchmark functions. For F3 (a unimodal function), PMAED achieves a mean fitness value of 7.1785 × 10
2, which is lower than all comparison algorithms (ED: 7.3032 × 10
2, RIME: 7.2844 × 10
2), with a standard deviation of only 4.8653 × 10
0, indicating superior local exploitation accuracy and stability. On F5 (a complex multimodal function), PMAED attains a mean fitness value of 2.1318 × 10
3, which is significantly better than DE (2.1060 × 10
5) and DBO (1.7066 × 10
4), and even lower than the relatively strong MadDE (3.1796 × 10
3). The corresponding standard deviation of 1.7488 × 10
2 suggests that PMAED possesses stronger global exploration capability and a higher potential to escape local optima in complex multimodal landscapes. For F4, a continuous high-dimensional optimization function, the performance of all algorithms is relatively similar; however, PMAED still slightly outperforms the others with a mean fitness value of 1.9011 × 10
3 and a standard deviation of 3.2749 × 10
−1, highlighting its fine-grained optimization capability in smooth search spaces. Nevertheless, for F1, F2, and F10, PMAED does not exhibit a significant advantage over ED and some other algorithms, which can be attributed to the simple unimodal characteristics of these functions, for which traditional algorithms are already well adapted.
When the dimensionality is increased to 20 (
Table 3), the performance advantages of PMAED become more pronounced, especially on high-dimensional and complex functions. For F1, PMAED achieves a mean fitness value of only 1.1523 × 10
3, which is far lower than those of PSO (4.2714 × 10
8) and BKA (3.8658 × 10
9), and still improves upon the second-best VPPSO (1.6107 × 10
3). The corresponding standard deviation of 1.4984 × 10
3 indicates that PMAED maintains good stability in high-dimensional search spaces. On F5, PMAED records a mean fitness value of 1.3037 × 10
4, substantially outperforming DE (2.2451 × 10
6) and PSO (5.5352 × 10
5), and even achieving an order-of-magnitude reduction compared with ED (7.2004 × 10
5), which clearly demonstrates its efficient search capability in high-dimensional and strongly coupled landscapes. The results on F7 further confirm this advantage: PMAED achieves a mean fitness value of 4.5003 × 10
3, which is significantly lower than those of other algorithms (e.g., MadDE: 9.0601 × 10
4, DOA: 1.3272 × 10
5), with a standard deviation of 2.5688 × 10
3, indicating that PMAED simultaneously maintains high accuracy and stability on high-dimensional nonlinear functions. In addition, for F3, F4, and other functions, PMAED consistently achieves the lowest or second-lowest mean fitness values, with standard deviations remaining within a reasonable range, further validating its general applicability across different types of high-dimensional functions.
The convergence curves shown in
Figure 5 further corroborate the above numerical results from a dynamic perspective. For the 10-dimensional F5 function, the convergence curve of PMAED drops rapidly during the early iterations and consistently remains at the lowest level, whereas the curves of PSO, DE, and other algorithms decrease more slowly and converge to significantly higher final values, indicating that PMAED can quickly locate promising search regions and continuously refine solutions. For the 10-dimensional F7 function, PMAED gradually widens the performance gap after the mid-iterations, effectively avoiding the stagnation phenomena observed in ED, RIME, and related algorithms. In the 20-dimensional F1 function, the convergence curve of PMAED exhibits an almost monotonic decreasing trend, while PSO, DBO, and other algorithms maintain high convergence values throughout the iterations with pronounced fluctuations, highlighting the superior convergence stability and efficiency of PMAED in high-dimensional spaces. The convergence behavior on the 20-dimensional F5 function further demonstrates that PMAED preserves sufficient search vitality in the later stages of evolution, continuously approaching the optimal solution, whereas most other algorithms suffer from premature convergence and their curves flatten too early.
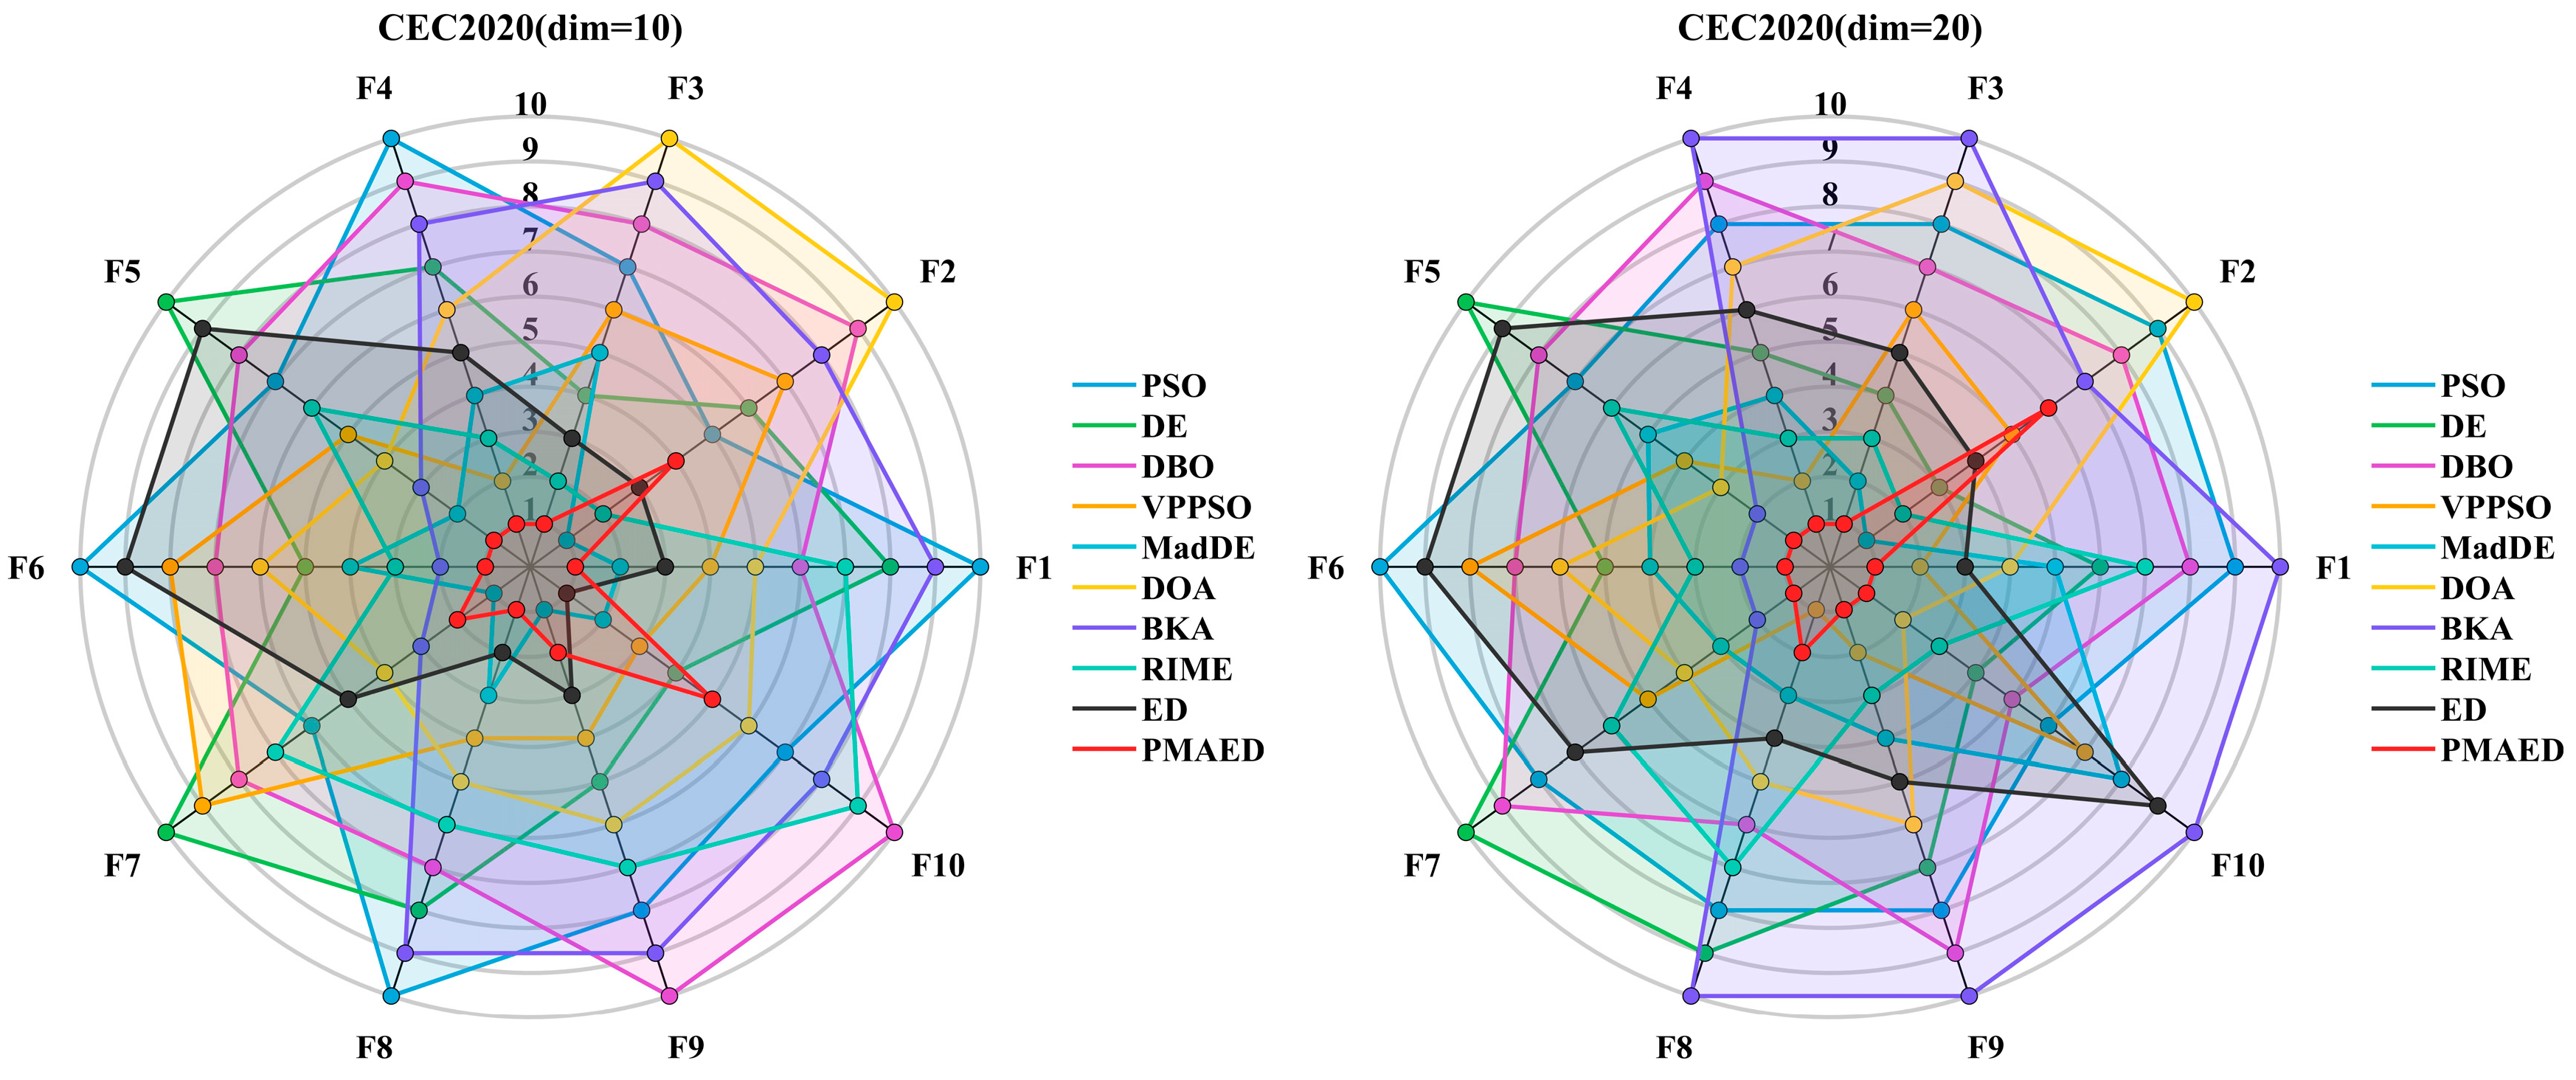
Figure 6 illustrates the ranking distribution of all algorithms across the CEC2020 benchmark functions, where a lower ranking value indicates superior performance on the corresponding function. From the overall distribution, it can be observed that PMAED achieves a significantly higher frequency of first- and second-place rankings compared to all other competing algorithms, attaining optimal or near-optimal results on the majority of test functions and demonstrating strong overall competitiveness.
In contrast, traditional swarm intelligence algorithms such as PSO, DBO, and BKA are primarily concentrated within the ranking range of 6th to 10th place, indicating relatively weaker optimization capability on complex high-dimensional functions. Although algorithms such as DE, MadDE, and ED perform well on certain functions, their ranking distributions are more dispersed, reflecting lower stability compared to PMAED.
Furthermore, as the problem dimensionality increases from 10 to 20, the frequency with which PMAED ranks within the top two positions further increases, while the rankings of other competing algorithms generally shift toward lower positions. This observation clearly demonstrates that PMAED exhibits more pronounced performance advantages in high-dimensional and strongly coupled optimization problems, consistently producing high-quality solutions.
Overall, PMAED consistently exhibits superior optimization accuracy, convergence efficiency, and stability on the CEC2020 benchmark functions in both 10- and 20-dimensional settings, with particularly pronounced advantages on high-dimensional, multimodal, and strongly coupled problems. This performance can be attributed to the synergistic effects of its adaptive differential evolution backbone, eigen-based rotated search framework, and PMA public management augmentation strategy, which jointly enable a dynamic balance between global exploration and local exploitation. As a result, PMAED can adaptively accommodate optimization problems of different dimensionalities and characteristics, effectively alleviating the search efficiency degradation and premature convergence issues commonly encountered by traditional algorithms in complex high-dimensional spaces.
3.5. Experimental Evaluation on CEC 2022 Benchmark Functions
To further verify the optimization performance and general applicability of PMAED under different scenarios, this section conducts experiments using the CEC2022 benchmark function suite. The primary objective is to evaluate the universality and robustness of PMAED across optimization problems with varying dimensionalities and complexity levels. The CEC2022 benchmark functions cover a wide range of problem types, including unimodal, multimodal, and hybrid characteristics, encompassing both low-dimensional simple optimization scenarios and high-dimensional, strongly coupled complex landscapes. This diversity enables a comprehensive assessment of an algorithm’s global exploration capability, local exploitation accuracy, and adaptive regulation performance.
Compared with CEC2020, the CEC2022 benchmark functions are designed to be more challenging in terms of nonlinearity and inter-variable correlations, thereby further exposing the performance limitations of traditional algorithms in complex scenarios and highlighting the advantages of PMAED’s multi-strategy integration mechanism. Through comprehensive comparisons with classical algorithms and state-of-the-art heuristic methods in both 10- and 20-dimensional settings, more convincing experimental evidence can be provided to demonstrate the practical application potential of PMAED.
Table 4 and
Table 5 present the mean fitness values (Ave) and standard deviations (Std) obtained by PMAED and nine comparison algorithms on the CEC2022 benchmark functions under 10- and 20-dimensional scenarios, respectively. In addition, the convergence curves shown in
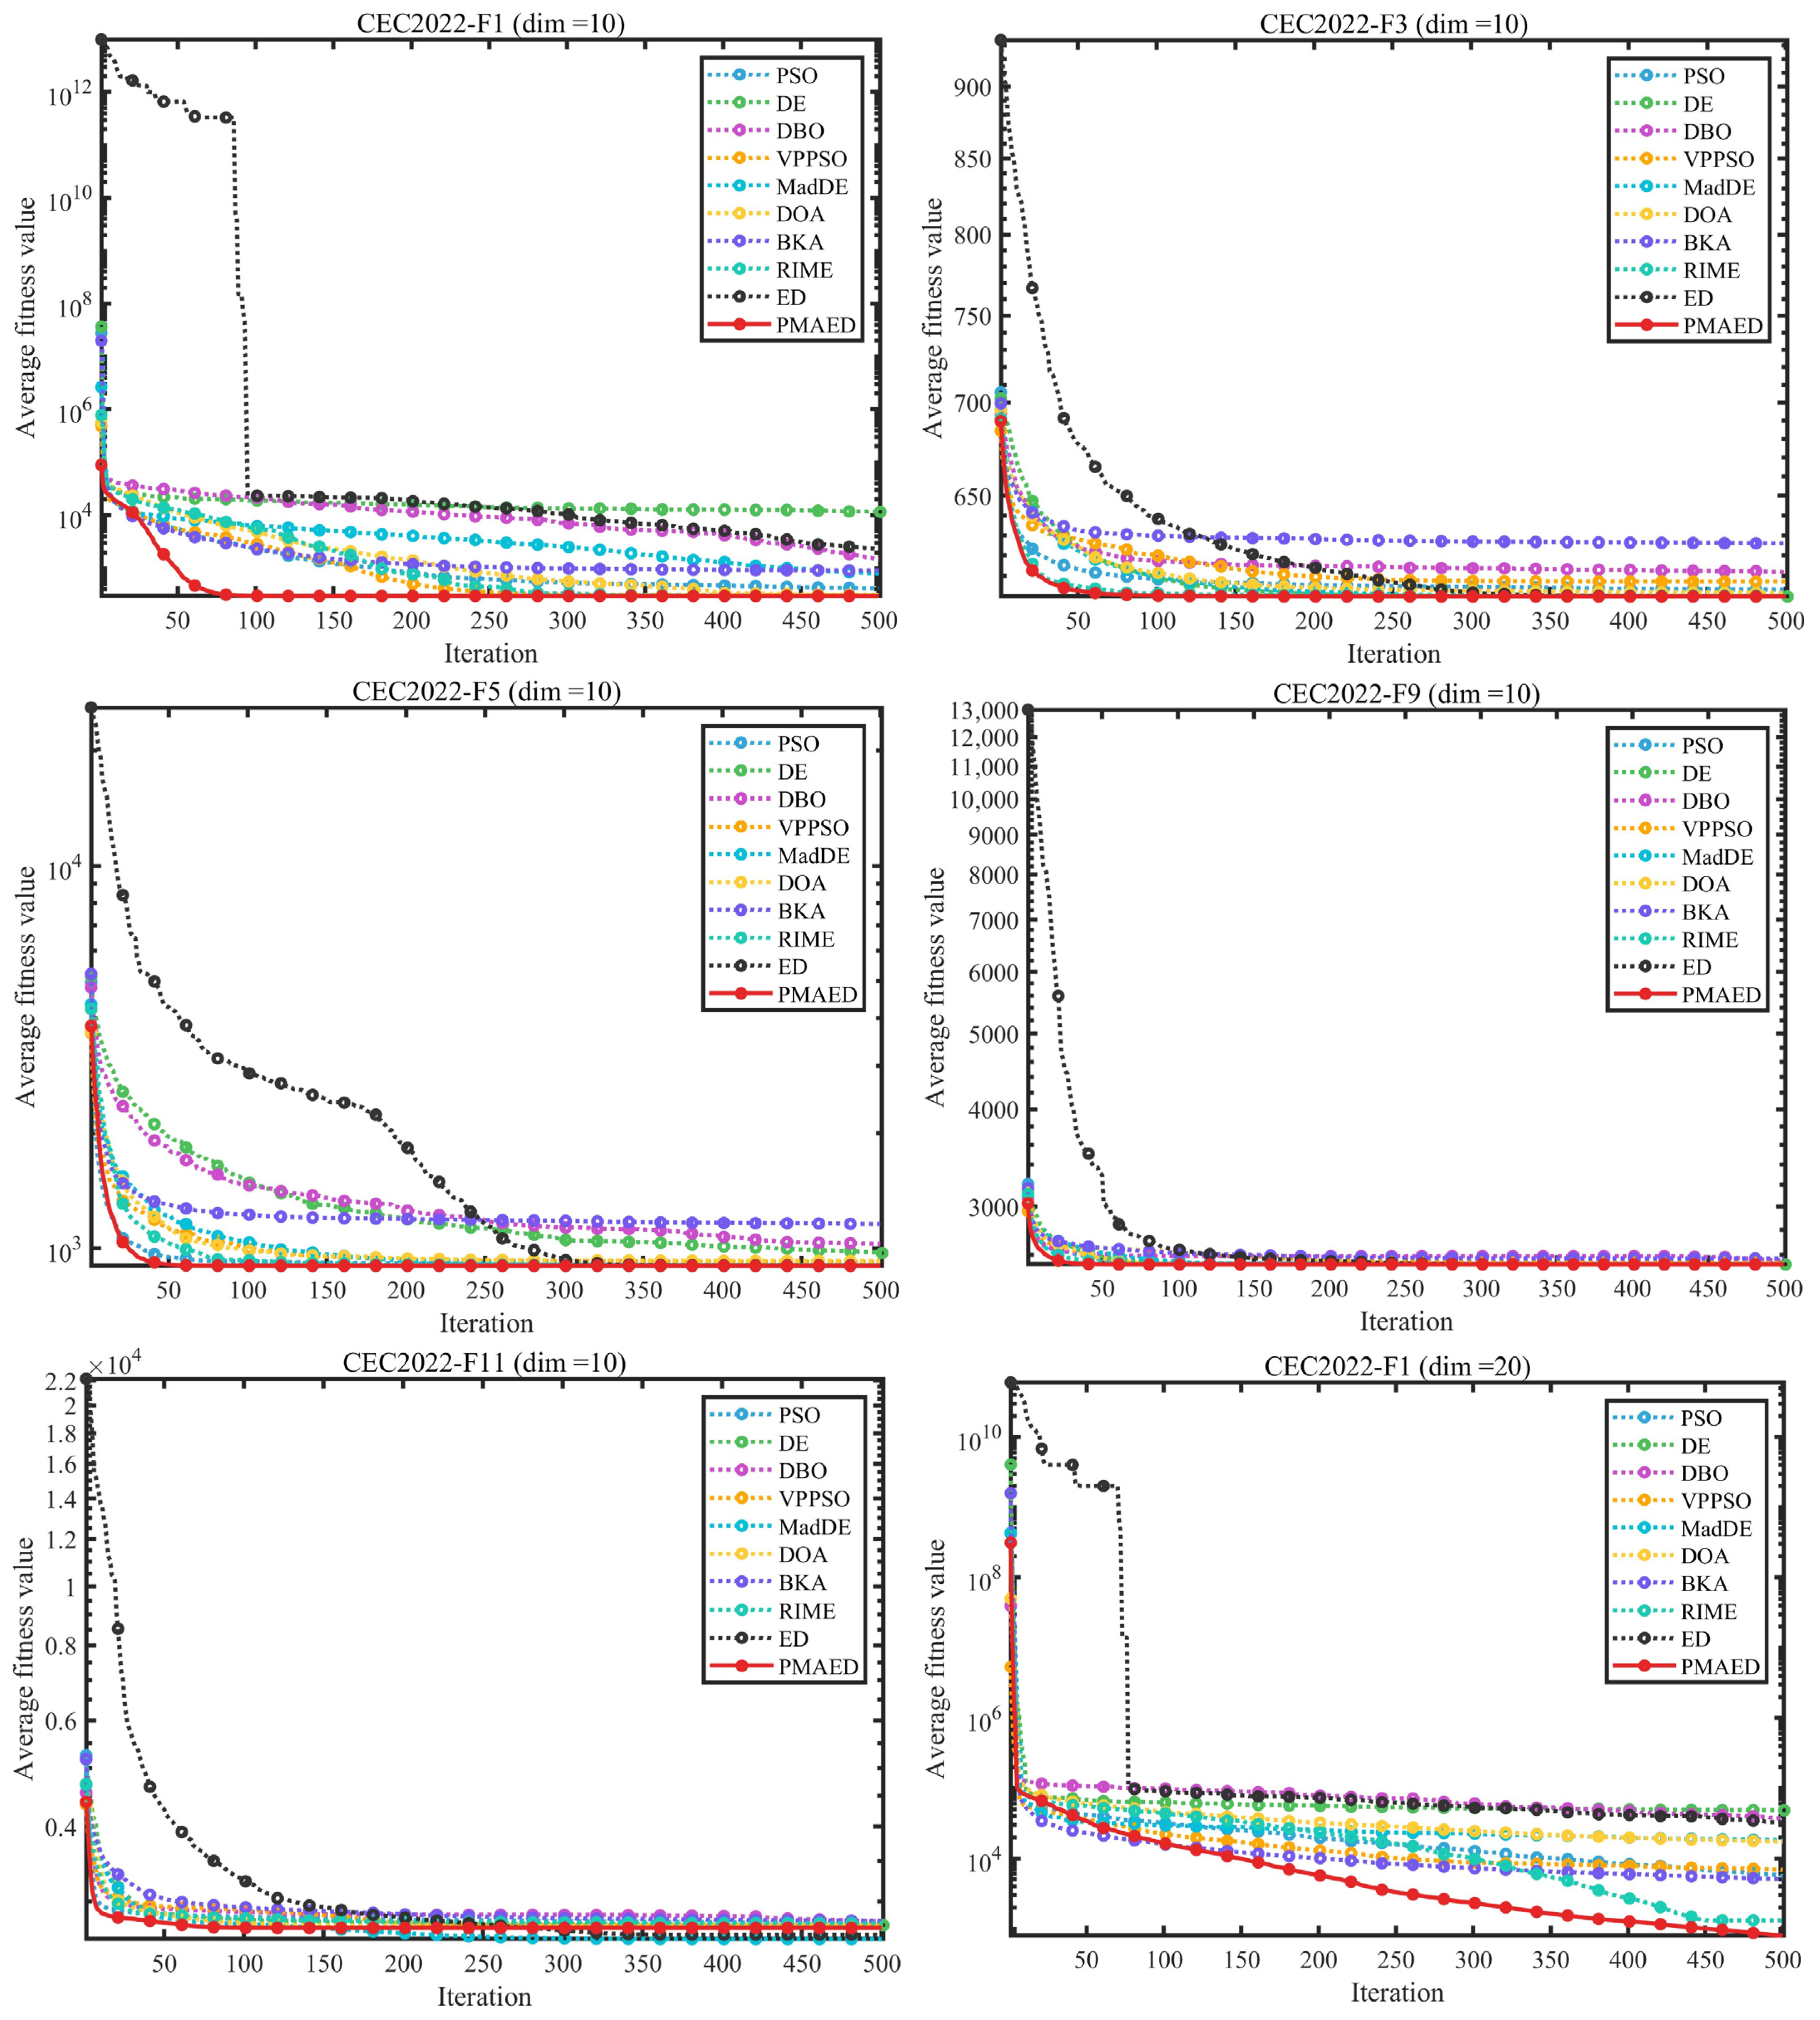
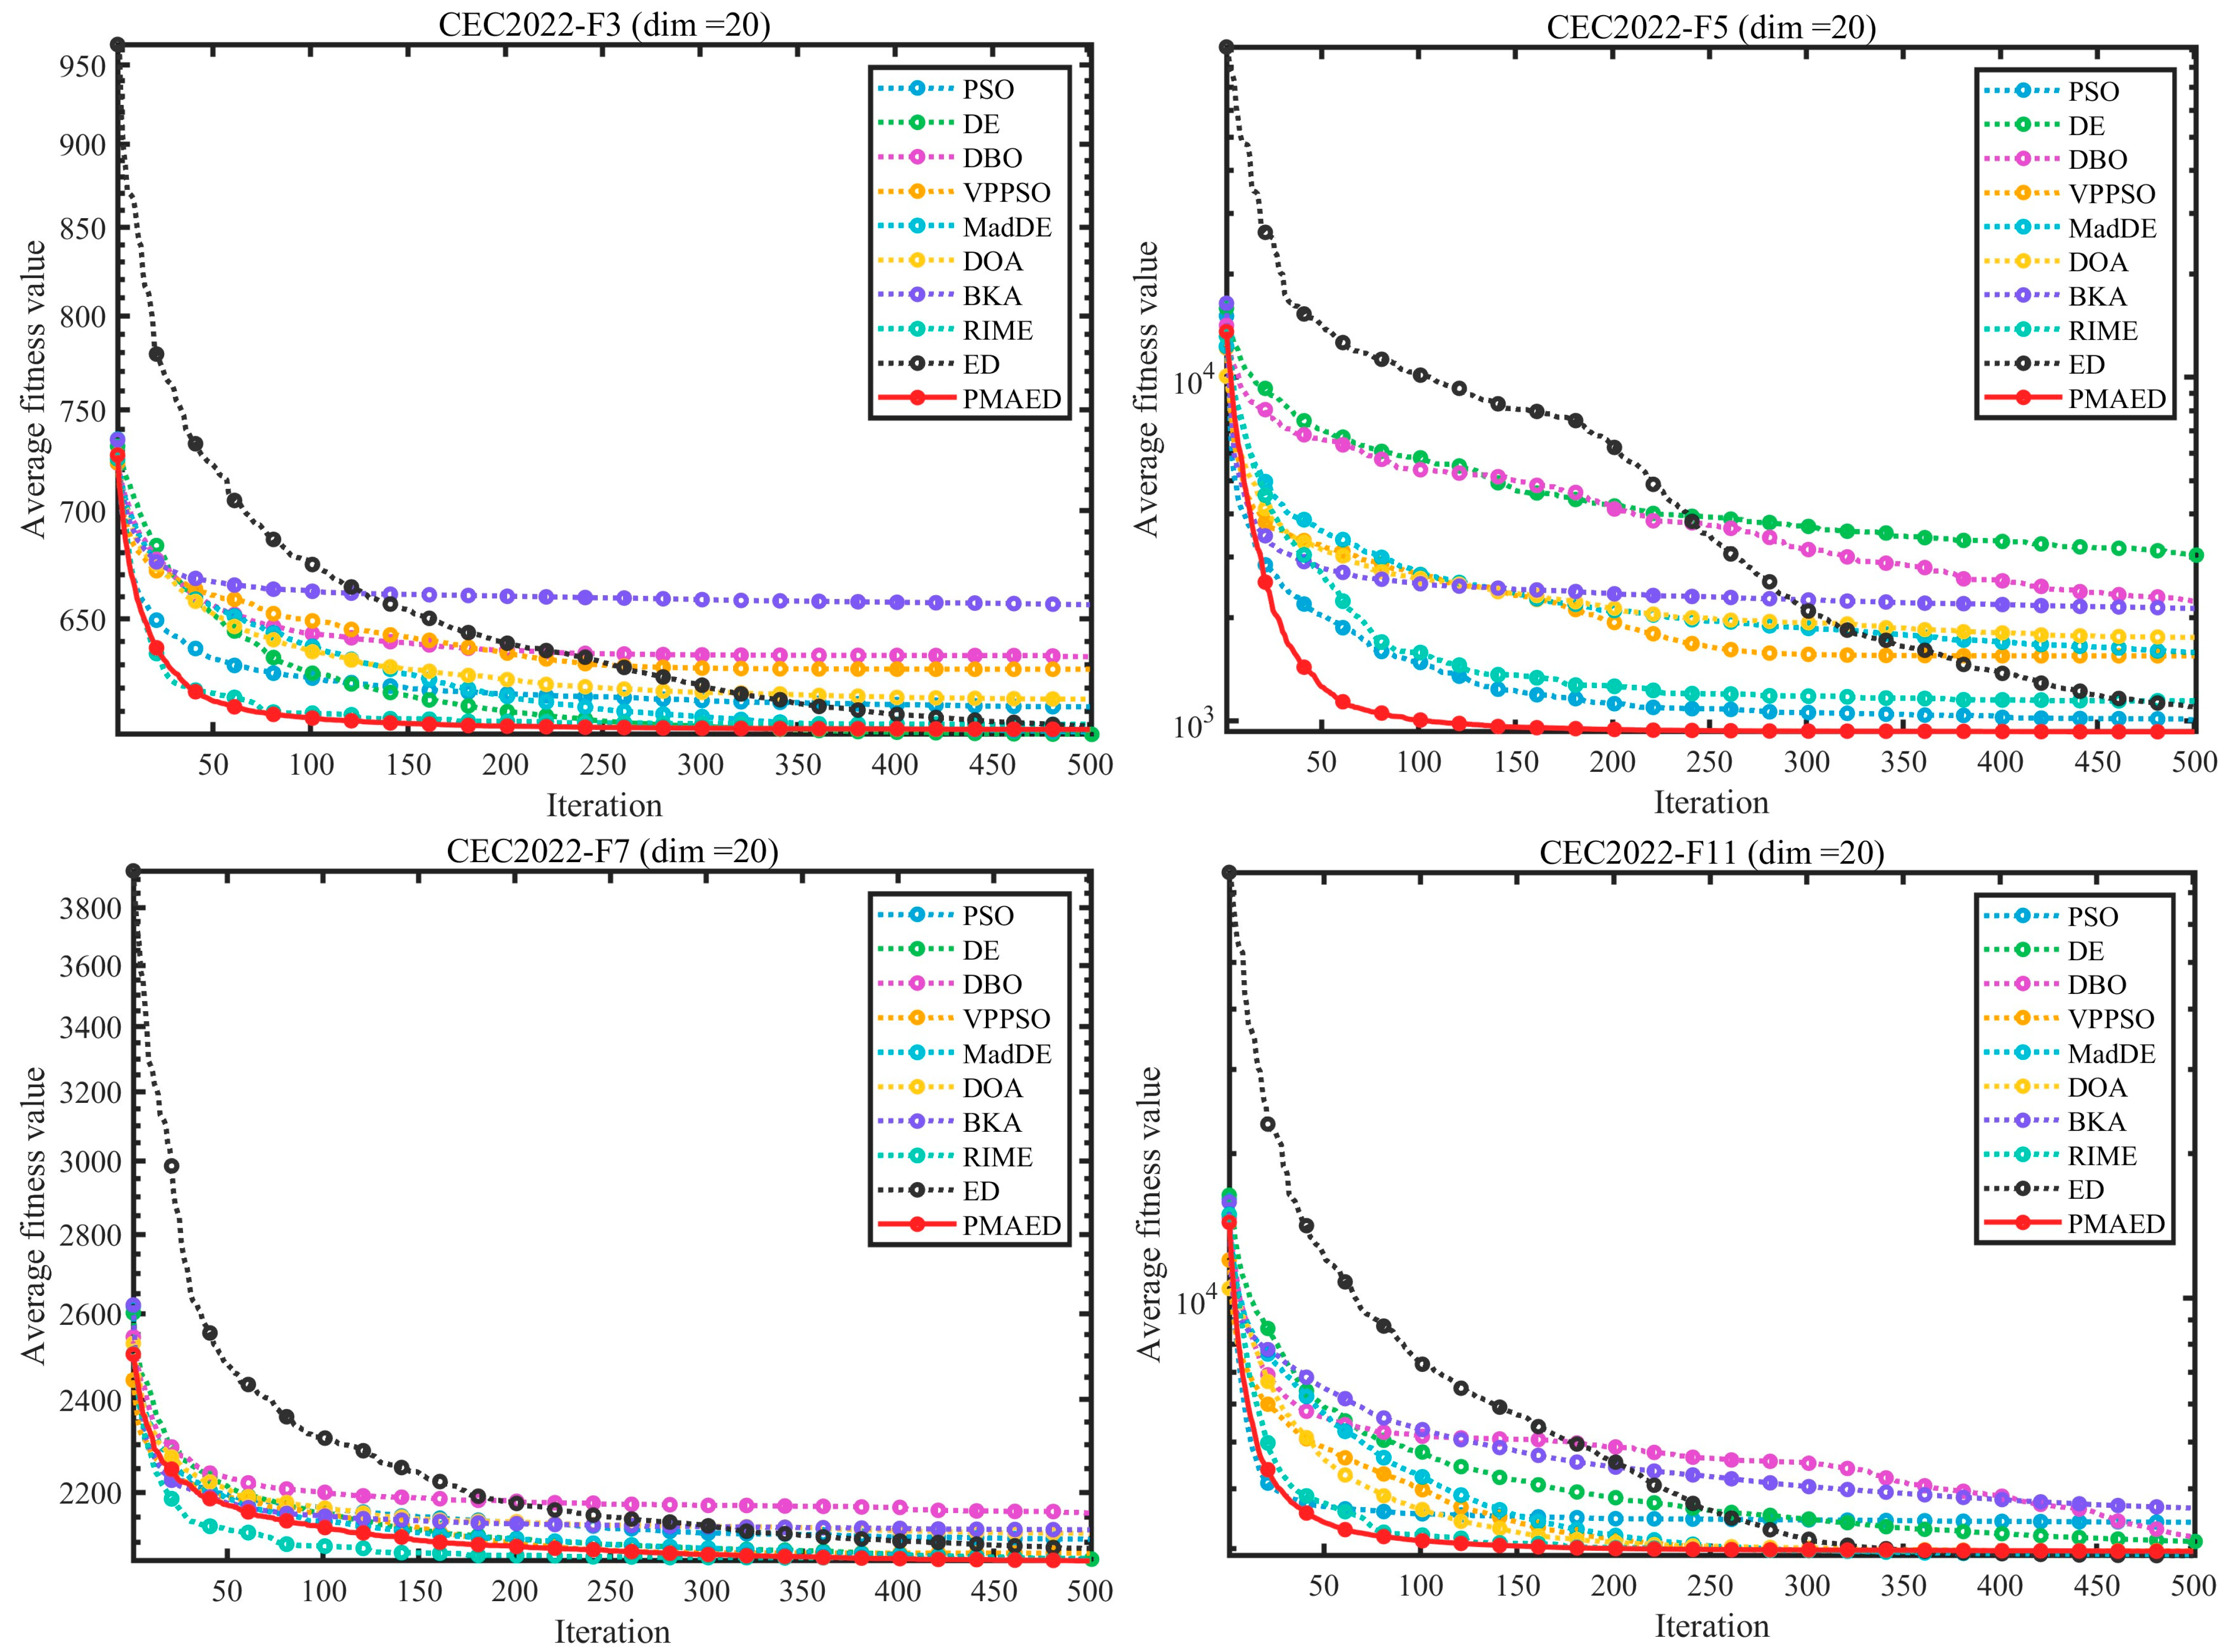
Figure 7 visually illustrate the search processes and convergence efficiencies of the compared algorithms. Together, these results comprehensively validate the overall superiority of PMAED across optimization problems with different levels of complexity.
In the 10-dimensional scenario (
Table 4), PMAED exhibits outstanding performance on several key functions. For F1, PMAED achieves a mean fitness value of 3.0000 × 10
2 with an extremely small standard deviation of 4.9510 × 10
−14, significantly outperforming RIME (3.0094 × 10
2) and VPPSO (3.1517 × 10
2), thereby attaining optimization accuracy close to the theoretical optimum. For F6, a highly complex multimodal function, PMAED obtains a mean fitness value of 1.8261 × 10
3, which is lower than those of MadDE (1.9259 × 10
3) and ED (3.4770 × 10
3), with a standard deviation of only 2.2663 × 10
1, reflecting stronger global exploration capability and higher stability. On F4, PMAED achieves the best performance among all algorithms with a mean fitness value of 8.0776 × 10
2 and a standard deviation of 3.2658 × 10
0, highlighting its fine-grained optimization ability in smooth search spaces. In addition, on functions such as F3 and F5, PMAED consistently ranks among the top-performing algorithms, while maintaining low standard deviations, which further confirms its stable performance in low-dimensional scenarios.
When the dimensionality increases to 20 (
Table 5), the advantages of PMAED become even more pronounced. For F1, PMAED achieves a mean fitness value of 3.3884 × 10
2, which is far lower than those of PSO (5.5853 × 10
3) and DBO (3.7343 × 10
4), and still significantly better than the second-best RIME (1.3134 × 10
3). The corresponding standard deviation of 5.6934 × 10
1 demonstrates excellent optimization accuracy and stability in high-dimensional search spaces. For F5, PMAED attains a mean fitness value of 9.2936 × 10
2, markedly outperforming DE (3.0368 × 10
3) and DBO (2.2319 × 10
3), with a standard deviation of 2.0791 × 10
1, indicating a strong ability to escape local optima in high-dimensional multimodal landscapes. On F4, PMAED records a mean fitness value of 8.2925 × 10
2, which is lower than all comparison algorithms, with a standard deviation of 1.2821 × 10
1, further validating its efficient search performance in high-dimensional and strongly coupled scenarios. Moreover, on F2, F3, F7, and other functions, PMAED consistently maintains advantages in both mean fitness values and standard deviations, demonstrating its general applicability across different types of high-dimensional functions.
The convergence curves shown in
Figure 7 further corroborate the above numerical results from a dynamic perspective. For the 10-dimensional F6 function, the convergence curve of PMAED drops rapidly in the early iterations and quickly stabilizes, whereas the curves of PSO, DE, and other algorithms decrease more slowly and converge to significantly higher final values, indicating that PMAED can rapidly identify high-quality search regions and complete fine-grained optimization. For the 20-dimensional F1 function, the convergence curve of PMAED consistently remains at the lowest level with no noticeable fluctuations, while the curves of other algorithms such as PSO and BKA exhibit severe oscillations and low convergence efficiency. The convergence behavior on the 20-dimensional F5 function further shows that PMAED continues to approach the optimal solution after the mid-iterations, whereas most comparison algorithms suffer from convergence stagnation, highlighting PMAED’s sustained optimization capability in high-dimensional complex search spaces.
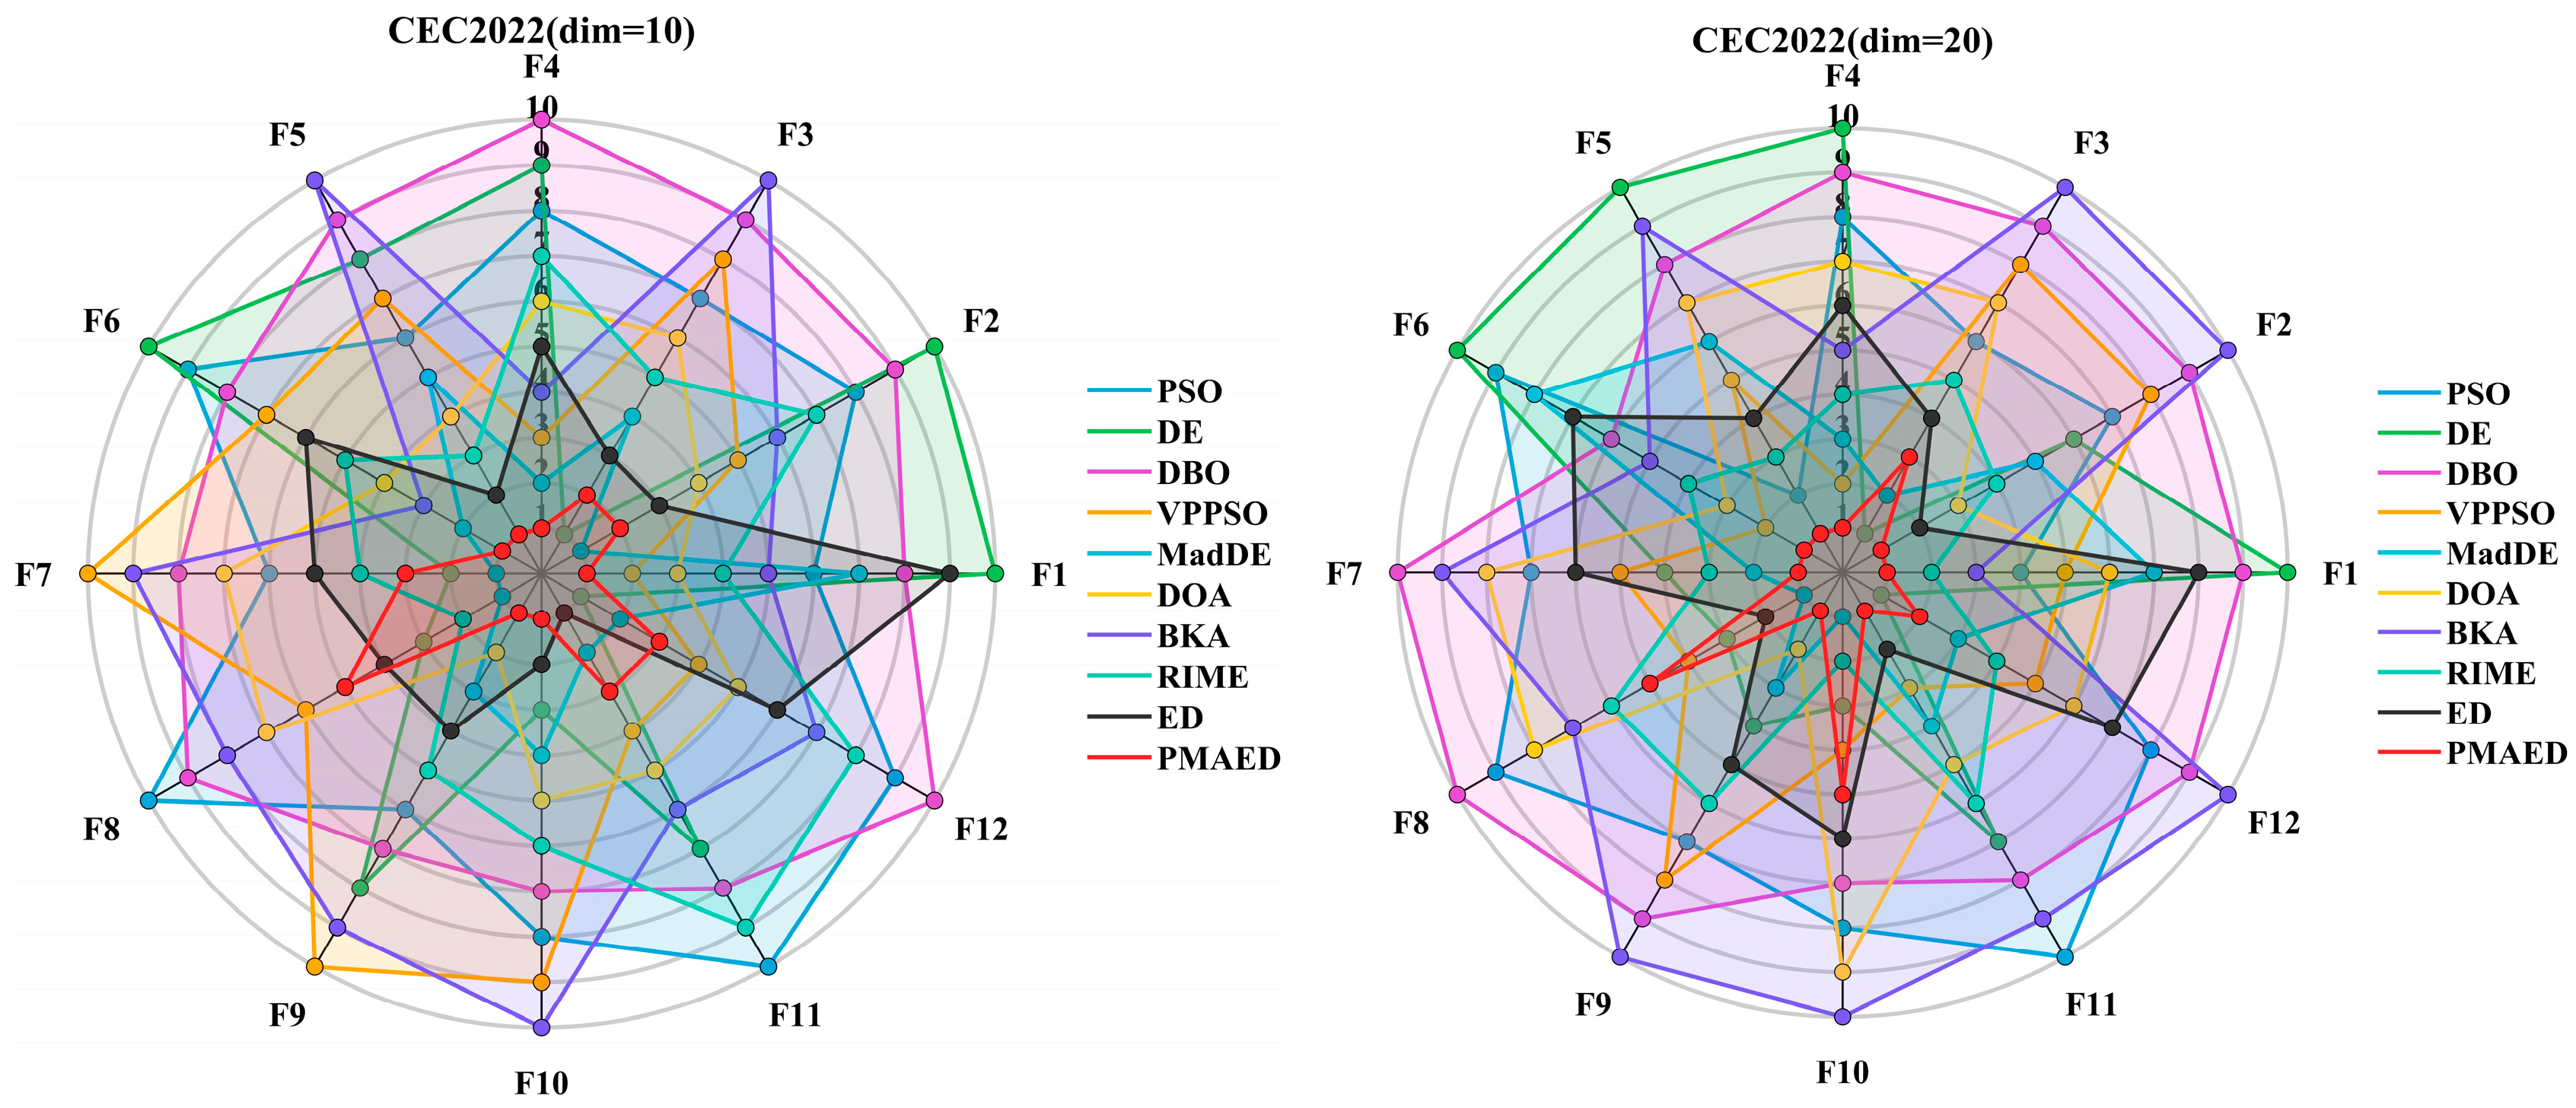
Figure 8 presents the ranking distribution of all algorithms on the CEC 2022 benchmark functions. From the overall trend, PMAED exhibits a substantially higher frequency of first- and second-place rankings compared to other competing algorithms, achieving optimal or near-optimal performance on the vast majority of test functions and demonstrating stable and outstanding overall performance. Algorithms such as MadDE, RIME, and ED show a certain level of competitiveness and can rank among the top performers on some functions. However, their ranking distributions are relatively dispersed, with higher frequencies concentrated in the 3rd to 5th positions, indicating lower stability compared to PMAED. In contrast, traditional algorithms such as PSO, DBO, and BKA are still mainly distributed at the 6th position and below, reflecting insufficient optimization capability when dealing with the high-dimensional, strongly coupled, and complex multimodal problems in CEC 2022. As the problem dimensionality increases from 10 to 20, the proportion of PMAED ranking within the top two positions further increases, while the rankings of other algorithms generally shift toward lower positions. This further confirms that PMAED demonstrates more pronounced performance advantages and stronger generalization capability in complex, high-dimensional real-world optimization scenarios.
In summary, PMAED demonstrates superior optimization accuracy, convergence efficiency, and stability on the CEC2022 benchmark functions in both 10- and 20-dimensional settings, with particularly significant advantages on high-dimensional complex problems. This performance can be attributed to the synergistic effects of the adaptive differential evolution backbone, the eigen-based rotated search strategy, and the PMA public management augmentation mechanism, which enable PMAED to adaptively handle optimization problems of varying dimensionalities and complexities while effectively balancing global exploration and local exploitation. Consequently, PMAED provides a reliable and effective algorithmic solution for real-world complex optimization problems.
3.6. Stability Analysis
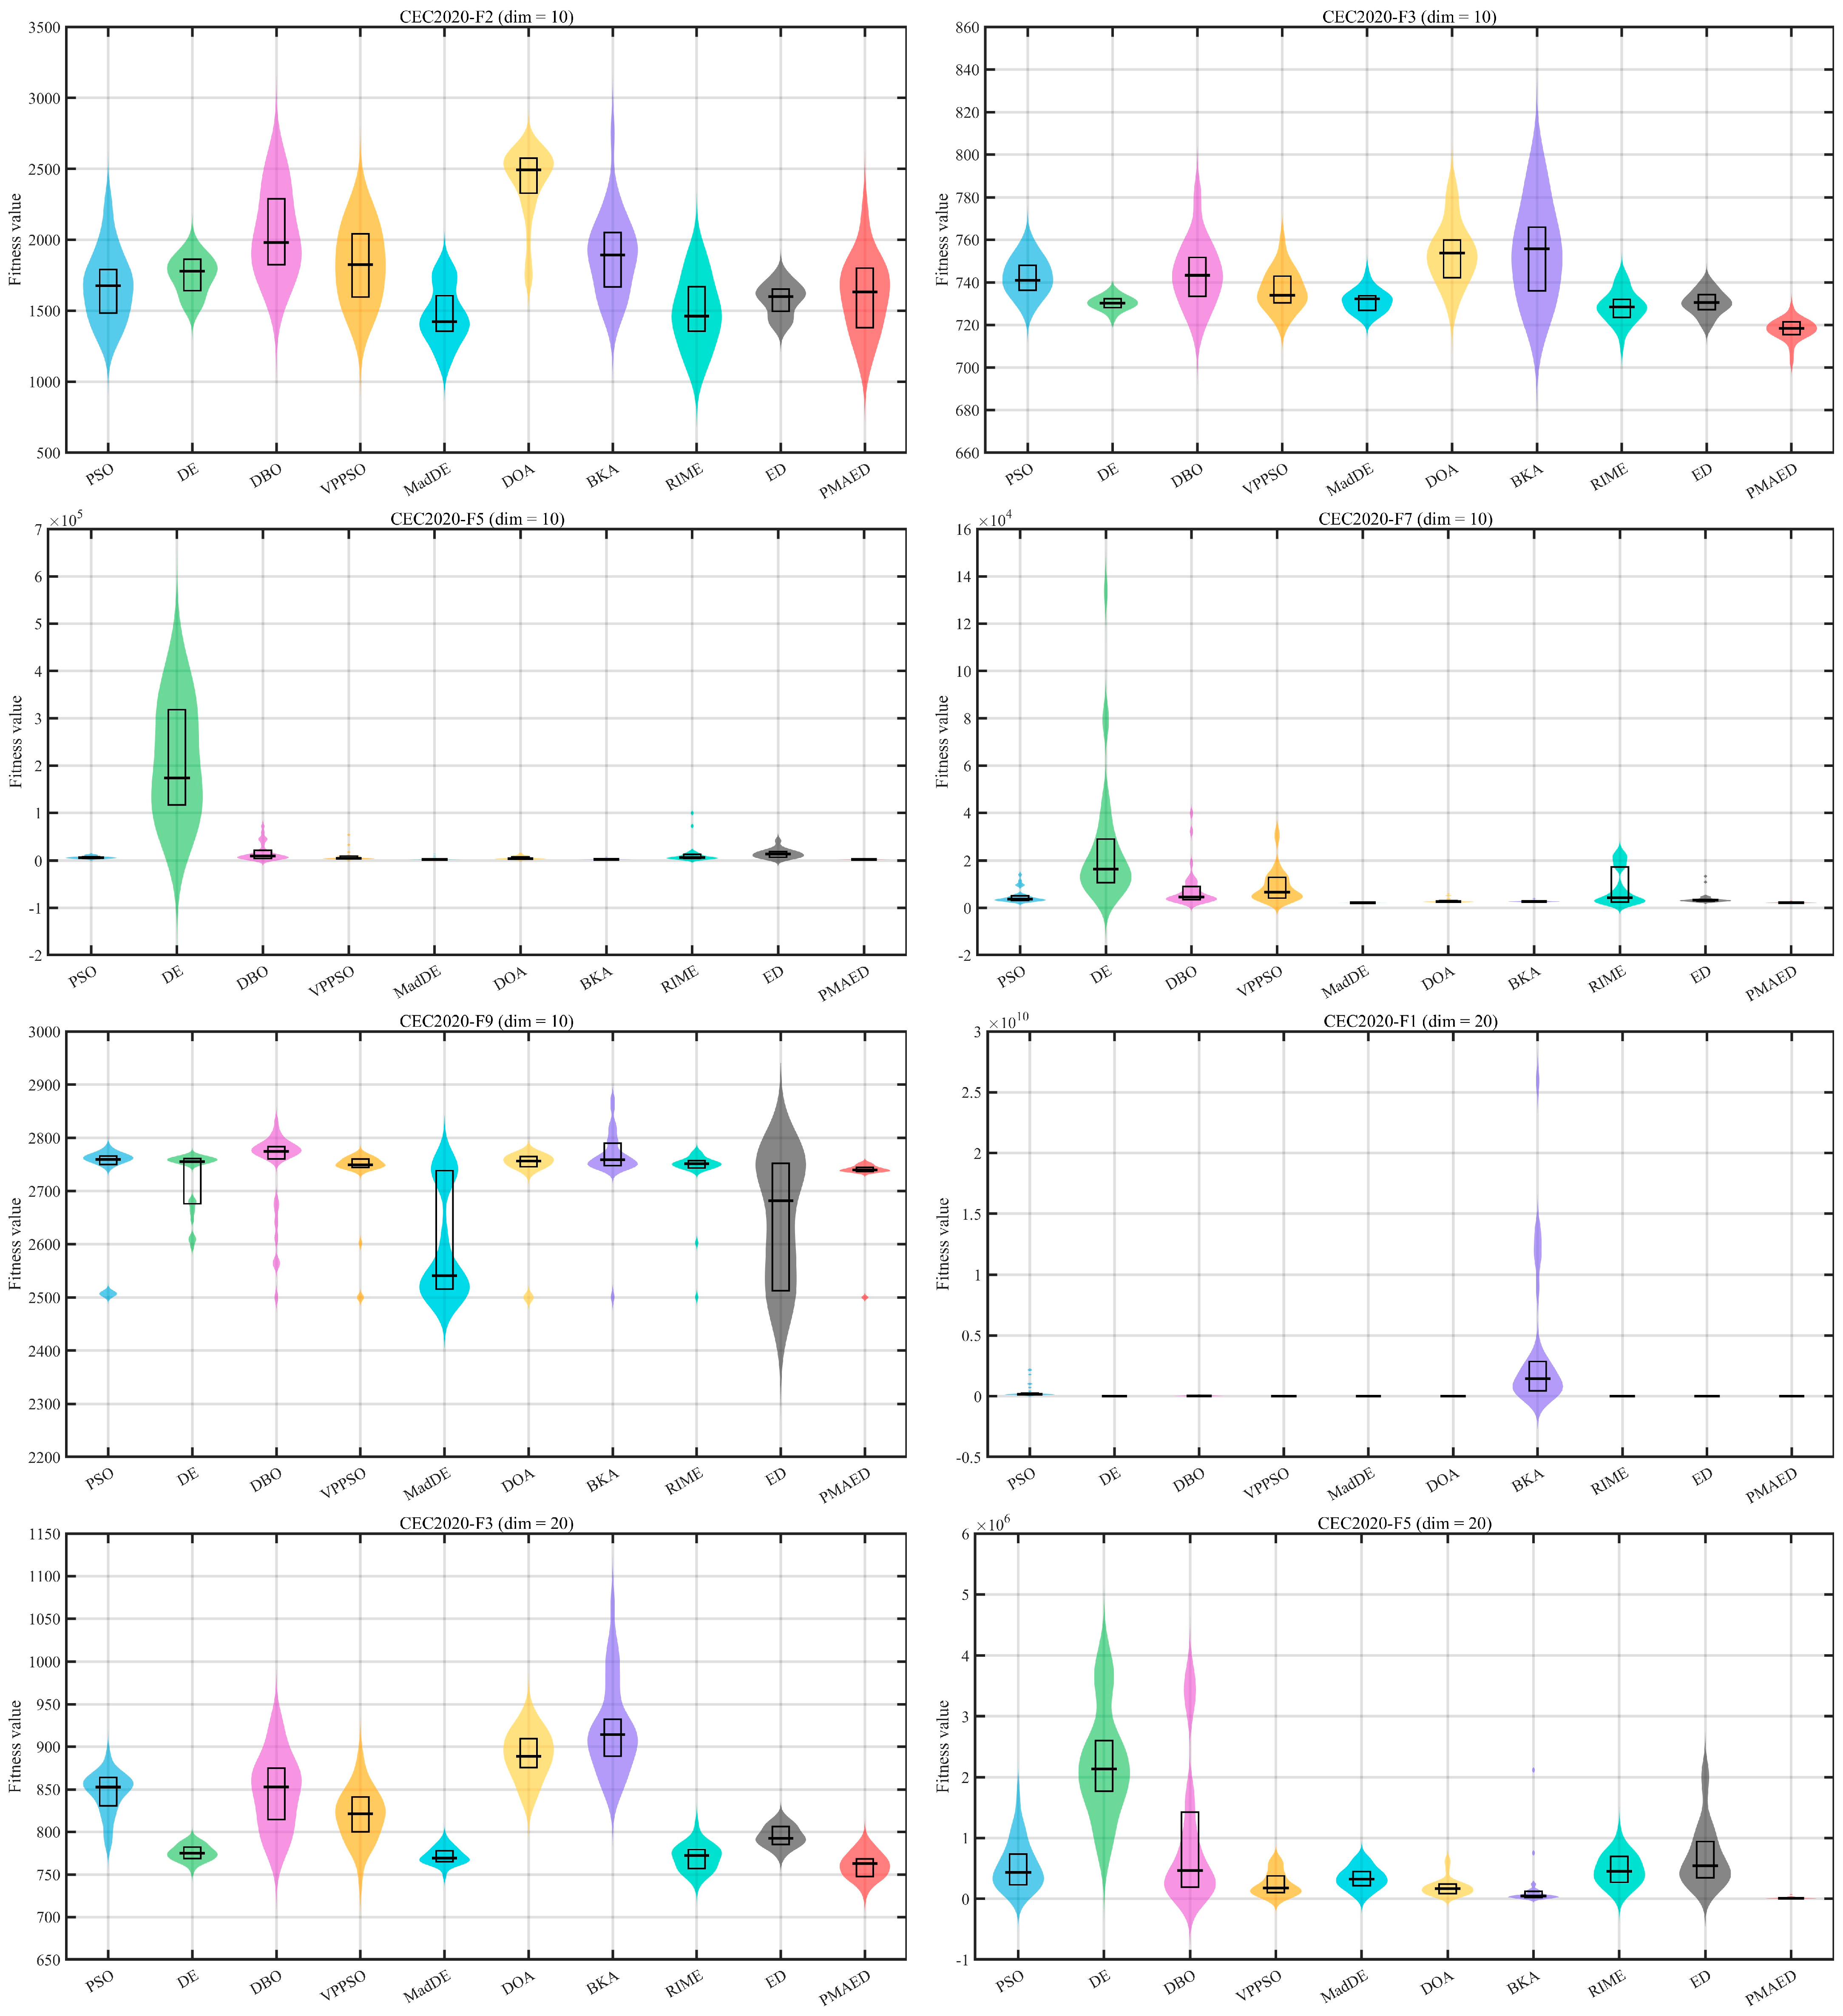
The stability of numerical optimization algorithms directly determines their reliability in practical applications. Particularly for complex optimization problems, the consistency and dispersion of results obtained from multiple independent runs are key indicators of algorithmic robustness. Although the preceding sections have demonstrated the optimization accuracy and efficiency of PMAED through mean fitness values and convergence curves, single-dimensional performance metrics are insufficient to fully characterize the variability of an algorithm across repeated executions. Therefore, this section conducts a stability analysis based on the CEC2020 benchmark function suite in 10- and 20-dimensional settings. Box plots are employed to quantify the distribution characteristics of fitness values, enabling a systematic comparison of the stability of PMAED and nine competing algorithms in terms of data dispersion, median location, and the proportion of outliers. This experimental design further reveals the effectiveness of PMAED’s multi-strategy integration mechanism—including adaptive differential evolution, eigen-based rotated search, and the PMA public management augmentation—in reducing stochastic disturbances and enhancing result consistency, thereby providing stability-oriented support for its application to real-world complex optimization problems.
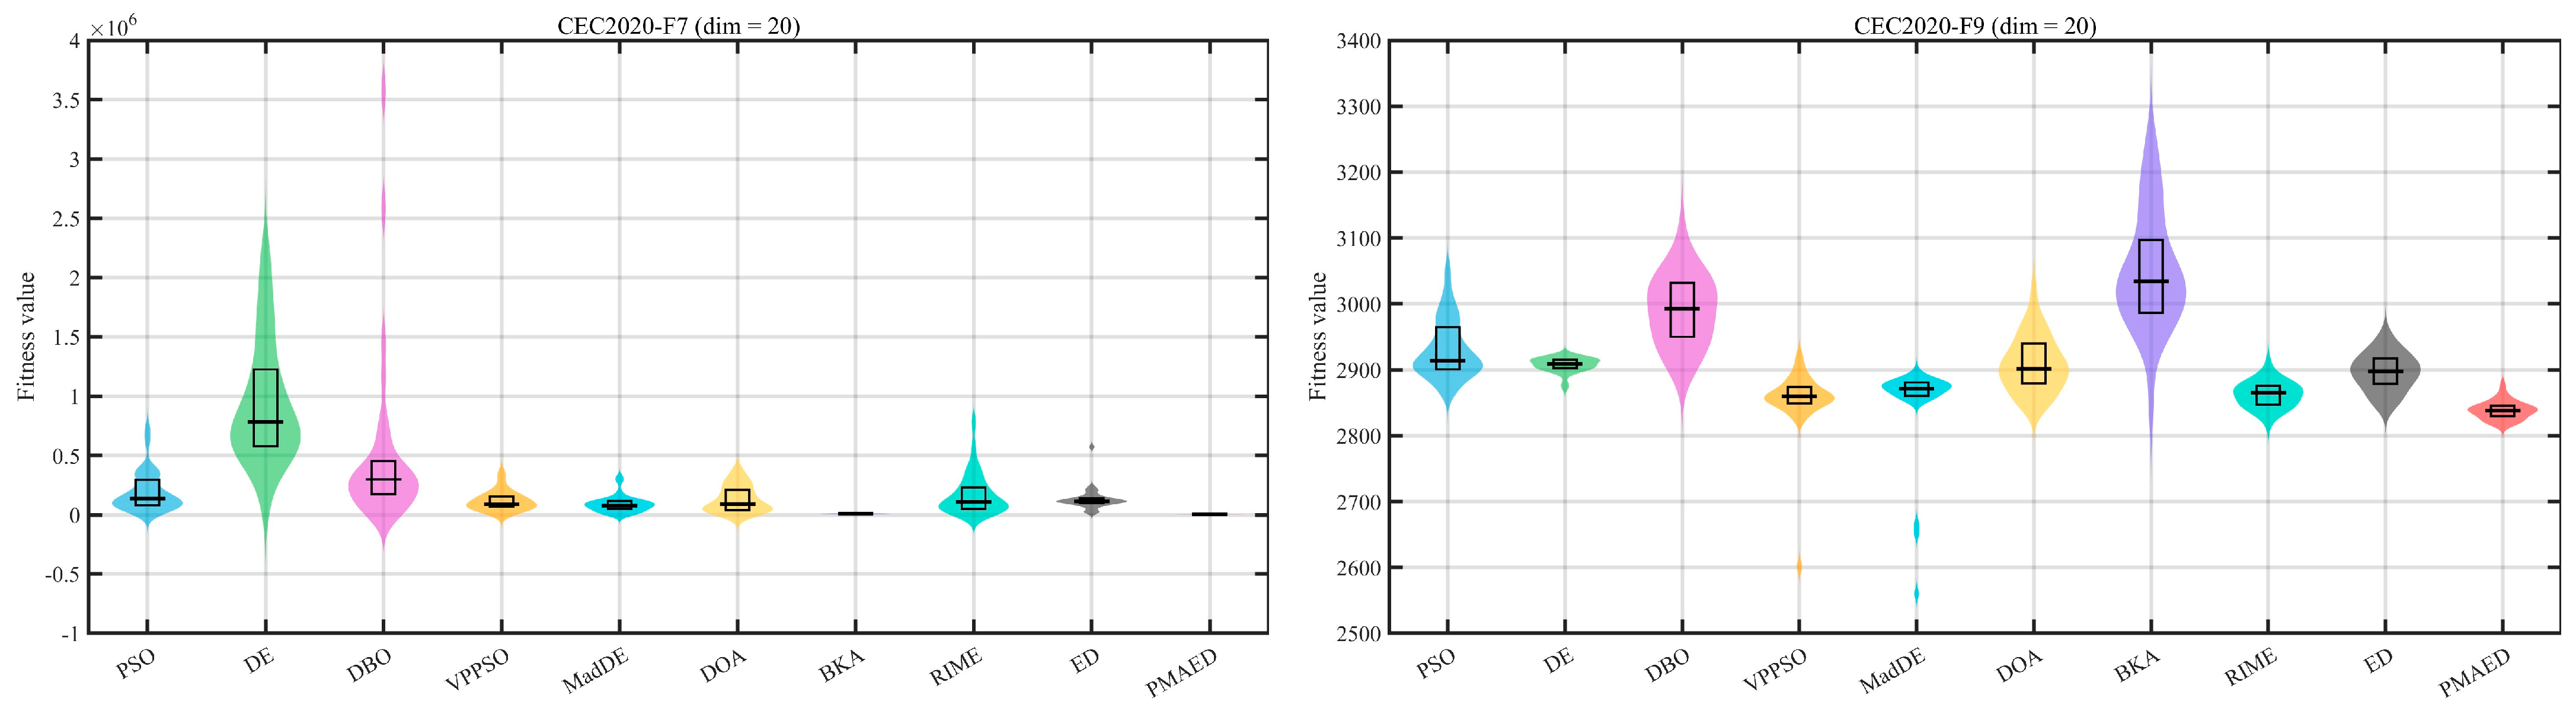
Figure 9 presents the box plots of PMAED and nine comparison algorithms on the CEC2020 benchmark functions under 10- and 20-dimensional scenarios. The stability of each algorithm across multiple independent runs is visually reflected by the dispersion of data, the position of the median, and the presence of outliers. In the box plots, a shorter box length indicates lower data dispersion, while a median closer to the optimal value and the absence of outliers signify stronger algorithmic stability.
In the 10-dimensional scenario, PMAED exhibits a pronounced stability advantage. For F3, the box plot of PMAED shows the shortest box length, with a median of approximately 7.18 × 10², which is substantially lower than those of PSO (7.43 × 10²) and DBO (7.44 × 10²), and no outliers are observed. This indicates a high degree of consistency across runs when optimizing unimodal functions. For F5, a complex multimodal function, the box of PMAED is entirely concentrated in the low-fitness region, with a median of only 2.13 × 10³, whereas DE, DBO, and other algorithms exhibit widely dispersed boxes and even a large number of high-fitness outliers. This contrast highlights PMAED’s strong capability to resist local optima interference and maintain stable search behavior in complex landscapes. For F9, although the box length of PMAED is comparable to those of ED and MadDE, its median is lower and no extreme outliers are present, demonstrating its advantage in balancing convergence speed and stability.
When the dimensionality increases to 20, the stability superiority of PMAED becomes even more evident. For F1, the box distributions of PSO, BKA, and other algorithms span several orders of magnitude and contain numerous outliers, whereas PMAED exhibits a highly concentrated box with a median of only 1.15 × 10³ and no pronounced dispersion, reflecting its ability to withstand the curse of dimensionality and maintain stable optimization performance in high-dimensional spaces. For F5, the box plot of PMAED has the shortest length, with a median of 1.30 × 10⁴, which is far lower than those of DE (2.25 × 10⁶) and PSO (5.54 × 10⁵), and no outliers are observed. This indicates that PMAED can consistently approach the optimal solution in high-dimensional, multimodal, and strongly coupled scenarios. For F7, the box of PMAED is concentrated in the low-fitness region with a median of 4.50 × 10³, while other algorithms such as DE and DBO show highly dispersed distributions with numerous high-fitness outliers, further validating the effectiveness of PMAED’s multi-strategy integration in enhancing stability under high-dimensional conditions.
Overall, PMAED demonstrates superior stability on the CEC2020 benchmark functions in both 10- and 20-dimensional settings, characterized by more concentrated box distributions, more favorable median values, and fewer outliers. This performance can be attributed to the synergistic effects of the adaptive differential evolution backbone with dynamic parameter adjustment, the eigen-based rotated search strategy that accommodates variable correlations, and the PMA public management augmentation that precisely intervenes in low-performance individuals. Together, these mechanisms effectively reduce stochastic disturbances during the search process, enabling PMAED to maintain stable and consistent optimization performance across different dimensionalities and problem types.
3.7. Statistical Analysis of Experimental Results
3.7.1. Wilcoxon Rank-Sum Significance Test
Although the optimization performance of PMAED has been validated in the previous sections through numerical results, convergence curves, and stability analysis, these evaluations are primarily based on intuitive data comparisons and lack statistical significance verification. To objectively determine whether the performance differences between PMAED and the comparison algorithms are statistically significant rather than caused by random factors, this section adopts the Wilcoxon rank-sum test, a nonparametric statistical method. This test does not require the assumption of normal data distribution and is therefore more suitable for the performance data of optimization algorithms. With a significance level of
, the null hypothesis that “there is no performance difference between two algorithms” is examined. From a statistical perspective, this analysis quantitatively evaluates the performance superiority of PMAED and provides more rigorous evidence for its effectiveness [
46,
47,
48,
49].
Table 6 reports the Wilcoxon rank-sum test results of PMAED against nine comparison algorithms on the CEC2020 (10/20 dimensions) and CEC2022 (10/20 dimensions) benchmark function suites, where “+/=/−” denote the numbers of functions on which PMAED performs significantly better, shows no significant difference, or performs significantly worse, respectively.
For the CEC2020 benchmark functions, PMAED exhibits strong statistical advantages in the 10-dimensional scenario. Compared with PSO, PMAED achieves significant superiority on 7 functions and no significant difference on 3 functions. Against DE, DBO, and VPPSO, PMAED is significantly better on all 10 functions, with no cases of inferior performance. Even when compared with relatively competitive algorithms such as MadDE and ED, PMAED still achieves significant superiority on 8 functions, with no functions showing significantly worse performance. In the 20-dimensional scenario, this advantage is further reinforced: PMAED is significantly better than PSO on all 10 functions, and when compared with DE, DBO, MadDE, and ED, only 1 or 0 functions show no significant difference, while the remaining functions are all significantly better. These results fully confirm the statistical reliability of PMAED’s performance advantages in high-dimensional and complex search spaces.
For the CEC2022 benchmark functions, in the 10-dimensional scenario, PMAED achieves significant superiority on all 12 functions when compared with PSO and DBO. Against DE, VPPSO, MadDE, and most other algorithms, PMAED is significantly better on 10 functions, with only a few functions showing no significant difference. Only in comparison with ED does PMAED exhibit 5 functions with no significant difference, while no functions show significantly worse performance. In the 20-dimensional scenario, PMAED continues to outperform PSO with significant superiority on all 12 functions. Against DE, DBO, DOA, BKA, and other algorithms, PMAED achieves significant superiority on 10 or more functions. Although 4 functions show no significant difference when compared with RIME, the overall results are still dominated by statistically significant advantages.
Table 6 shows that PMAED is significantly better than other algorithms on more than 80% of functions (
p < 0.05). For example, it outperforms PSO on all 10/12 functions in high dimensions, indicating strong stability. Compared with MadDE and ED, PMAED still has significant advantages, proving the effectiveness of the multi-strategy integration. The few non-significant cases occur in simple unimodal functions where all algorithms converge to the optimum.
Overall, across all dimensional settings and benchmark function suites, PMAED demonstrates statistically significant superiority over the vast majority of comparison algorithms, with no scenario exhibiting significantly worse performance. These results statistically confirm that the optimization advantages of PMAED are not incidental, but rather stem from the synergistic integration of the adaptive differential evolution backbone, the eigen-based rotated search strategy, and the PMA public management augmentation mechanism. Consequently, PMAED achieves significantly better performance than both traditional algorithms and state-of-the-art heuristic methods in terms of optimization accuracy, convergence efficiency, and stability.
3.7.2. Friedman Mean-Rank Statistical Test
Although the Wilcoxon rank-sum test verifies the statistical significance of performance differences between PMAED and individual algorithms, it cannot intuitively reflect the comprehensive ranking of all algorithms across multiple dimensions and benchmark suites. To quantitatively evaluate the overall competitiveness of PMAED from a global perspective, this section adopts the Friedman average ranking test, a nonparametric statistical method. Without assuming normal data distribution, this test ranks algorithms by computing their mean rank (M.R.) and total rank (T.R.) across all test functions. A smaller mean rank and a higher (i.e., better) total rank indicate superior overall performance. The experiments cover both 10- and 20-dimensional scenarios of the CEC2020 and CEC2022 benchmark function suites, thereby providing a comprehensive assessment of PMAED’s overall advantages across different dimensionalities and problem complexities.
Table 7 reports the Friedman mean rank (M.R.) and total rank (T.R.) results of PMAED and nine comparison algorithms on the CEC2020 and CEC2022 benchmark function suites under 10- and 20-dimensional settings, offering a clear view of their overall performance rankings.
For the CEC2020 benchmark functions, PMAED exhibits an overwhelming comprehensive advantage. In the 10-dimensional scenario, PMAED achieves a mean rank of 1.90 and ranks first in terms of total rank, significantly outperforming the second-ranked MadDE (M.R. = 2.50) and the third-ranked ED (M.R. = 4.30), with a pronounced gap compared to the remaining algorithms. In the 20-dimensional scenario, PMAED’s mean rank further decreases to 1.60, while it continues to hold the first position in total rank. Even the next-best algorithms, such as MadDE (M.R. = 3.90) and VPPSO (M.R. = 4.20), lag far behind PMAED, fully confirming its dominant comprehensive performance in high-dimensional and complex search spaces.
For the CEC2022 benchmark functions, PMAED likewise maintains its leading position in overall ranking. In the 10-dimensional case, PMAED records a mean rank of 2.00 and ranks first in total rank, ahead of the second-ranked MadDE (M.R. = 2.83) and the third-ranked ED (M.R. = 4.17). In the 20-dimensional case, PMAED achieves a mean rank of 1.92 and again ranks first, outperforming MadDE (M.R. = 3.75) and RIME (M.R. = 4.08). Notably, across both 10- and 20-dimensional scenarios, PMAED consistently maintains mean ranks below 2.00, whereas the mean ranks of other algorithms are generally above 3.00, with the performance gap becoming more pronounced as dimensionality increases. This clearly demonstrates PMAED’s superior and robust overall performance across optimization problems of varying complexity.
From the perspective of cross-benchmark consistency, PMAED attains the first total rank in all dimensional settings of both the CEC2020 and CEC2022 benchmark suites, making it the only algorithm to consistently rank first across all tested scenarios. In contrast, the rankings of other algorithms fluctuate considerably: MadDE frequently ranks second but is surpassed by RIME in certain cases (e.g., CEC2022 with 20 dimensions), while algorithms such as ED and VPPSO exhibit noticeable ranking variations with changes in dimensionality and benchmark sets. These results indicate that PMAED’s multi-strategy integration mechanism—including adaptive differential evolution, eigen-based rotated search, and the PMA public management augmentation—possesses exceptional generality and stability, enabling it to effectively address optimization problems of different types and dimensionalities. Consequently, PMAED demonstrates a comprehensive performance that is significantly superior to both traditional algorithms and state-of-the-art heuristic methods.
4. Three-Dimensional UAV Path Planning
4.1. Problem Description
In complex mission environments, unmanned aerial vehicles (UAVs) are required to autonomously generate safe, efficient, and smooth flight paths from a given start position to a designated target position. During the flight process, the UAV must avoid terrain obstacles and threat regions while maintaining feasible altitude and smooth maneuvering characteristics.
From an optimization perspective, the three-dimensional UAV path planning problem can be formulated as a constrained continuous optimization problem, where the objective is to minimize the overall path cost subject to terrain clearance constraints, threat avoidance constraints, and flight feasibility requirements. Due to the nonlinear terrain structure, irregularly distributed threat regions, and the continuous nature of the search space, this problem is highly nonlinear, multi-constrained, and nonconvex, making it difficult to solve using traditional deterministic optimization methods.
Therefore, swarm intelligence-based optimization algorithms are well suited for addressing this type of problem, owing to their strong global search capability and robustness in complex environments.
4.2. Three-Dimensional Environment Modeling
The UAV operating environment is defined as a bounded three-dimensional region
, expressed as
where
denote the horizontal dimensions of the mission space, and
represents the maximum allowable flight altitude. Within this space, the ground terrain is modeled as a continuous surface described by a composite height function
, which is constructed by combining periodic terrain undulations and multiple Gaussian-shaped mountain peaks. Specifically, the terrain elevation is defined as
where the first component
represents smooth but irregular ground fluctuations generated by trigonometric functions,
and the second component
simulates mountainous terrain through a superposition of Gaussian peaks,
Here, denotes the number of mountain peaks, indicates the center of the -th peak, represents its height, and control the spatial spread of the peak in the horizontal plane. To guarantee safe flight, the UAV altitude at any point along the trajectory must satisfy the terrain clearance condition .
In addition to terrain obstacles, the environment contains hostile threat regions, such as radar detection zones or anti-aircraft defense areas, which are modeled as cylindrical regions projected onto the horizontal plane. Each threat region is characterized by a center location
and an effective radius
. For any trajectory point
, entering a threat region is prohibited, and the corresponding safety constraint is given by
for all threat regions. Any trajectory violating this condition is regarded as infeasible.
To reduce the dimensionality of the optimization problem while preserving sufficient flexibility and smoothness of the trajectory, the UAV path is parameterized using a finite number of intermediate control points. Let the start point and end point be denoted by
and
, respectively. Between them,
intermediate control points
, are introduced. The
-coordinates of these control points are uniformly distributed between the start and end points according to
while the corresponding
and
coordinates are treated as decision variables to be optimized. This formulation ensures a natural forward progression of the trajectory while allowing lateral and vertical adjustments to avoid obstacles.
The complete set of control points, including the start and end points, is used to reconstruct a continuous three-dimensional flight trajectory via cubic spline interpolation,
Cubic spline interpolation guarantees continuity of both position and first-order derivatives, thereby ensuring smooth curvature and feasibility for UAV motion.
To evaluate the quality of a candidate trajectory, the interpolated path is discretized into
uniformly spaced points
. The primary optimization objective is to minimize the total path length, which is defined as
where
denotes the Euclidean norm. Minimizing this term encourages shorter and more efficient flight paths.
However, minimizing path length alone may result in excessive altitude oscillations or abrupt turns. To address this issue, an altitude smoothness term is introduced to penalize large deviations from the mean flight altitude,
where
is the altitude of the
-th trajectory point and
represents the average altitude of the entire path. This term promotes stable altitude profiles during flight.
Furthermore, to ensure smooth maneuvering and reduce sharp turns, a curvature-related cost is defined based on the angle between consecutive path segments. Let
denote the displacement vector between adjacent control points. The turning smoothness cost is expressed as
This formulation penalizes abrupt changes in direction and encourages smoother trajectories.
By combining the above components, the overall objective function of the UAV path planning problem is constructed as a weighted sum,
where
,
, and
are nonnegative weighting coefficients satisfying
. These weights balance path efficiency, altitude stability, and turning smoothness according to mission requirements.
To handle infeasible solutions during optimization, a penalty-based constraint handling strategy is adopted. If a candidate trajectory violates any terrain clearance or threat avoidance constraint, its objective value is assigned a large penalty value,
which effectively excludes infeasible solutions from the feasible search space.
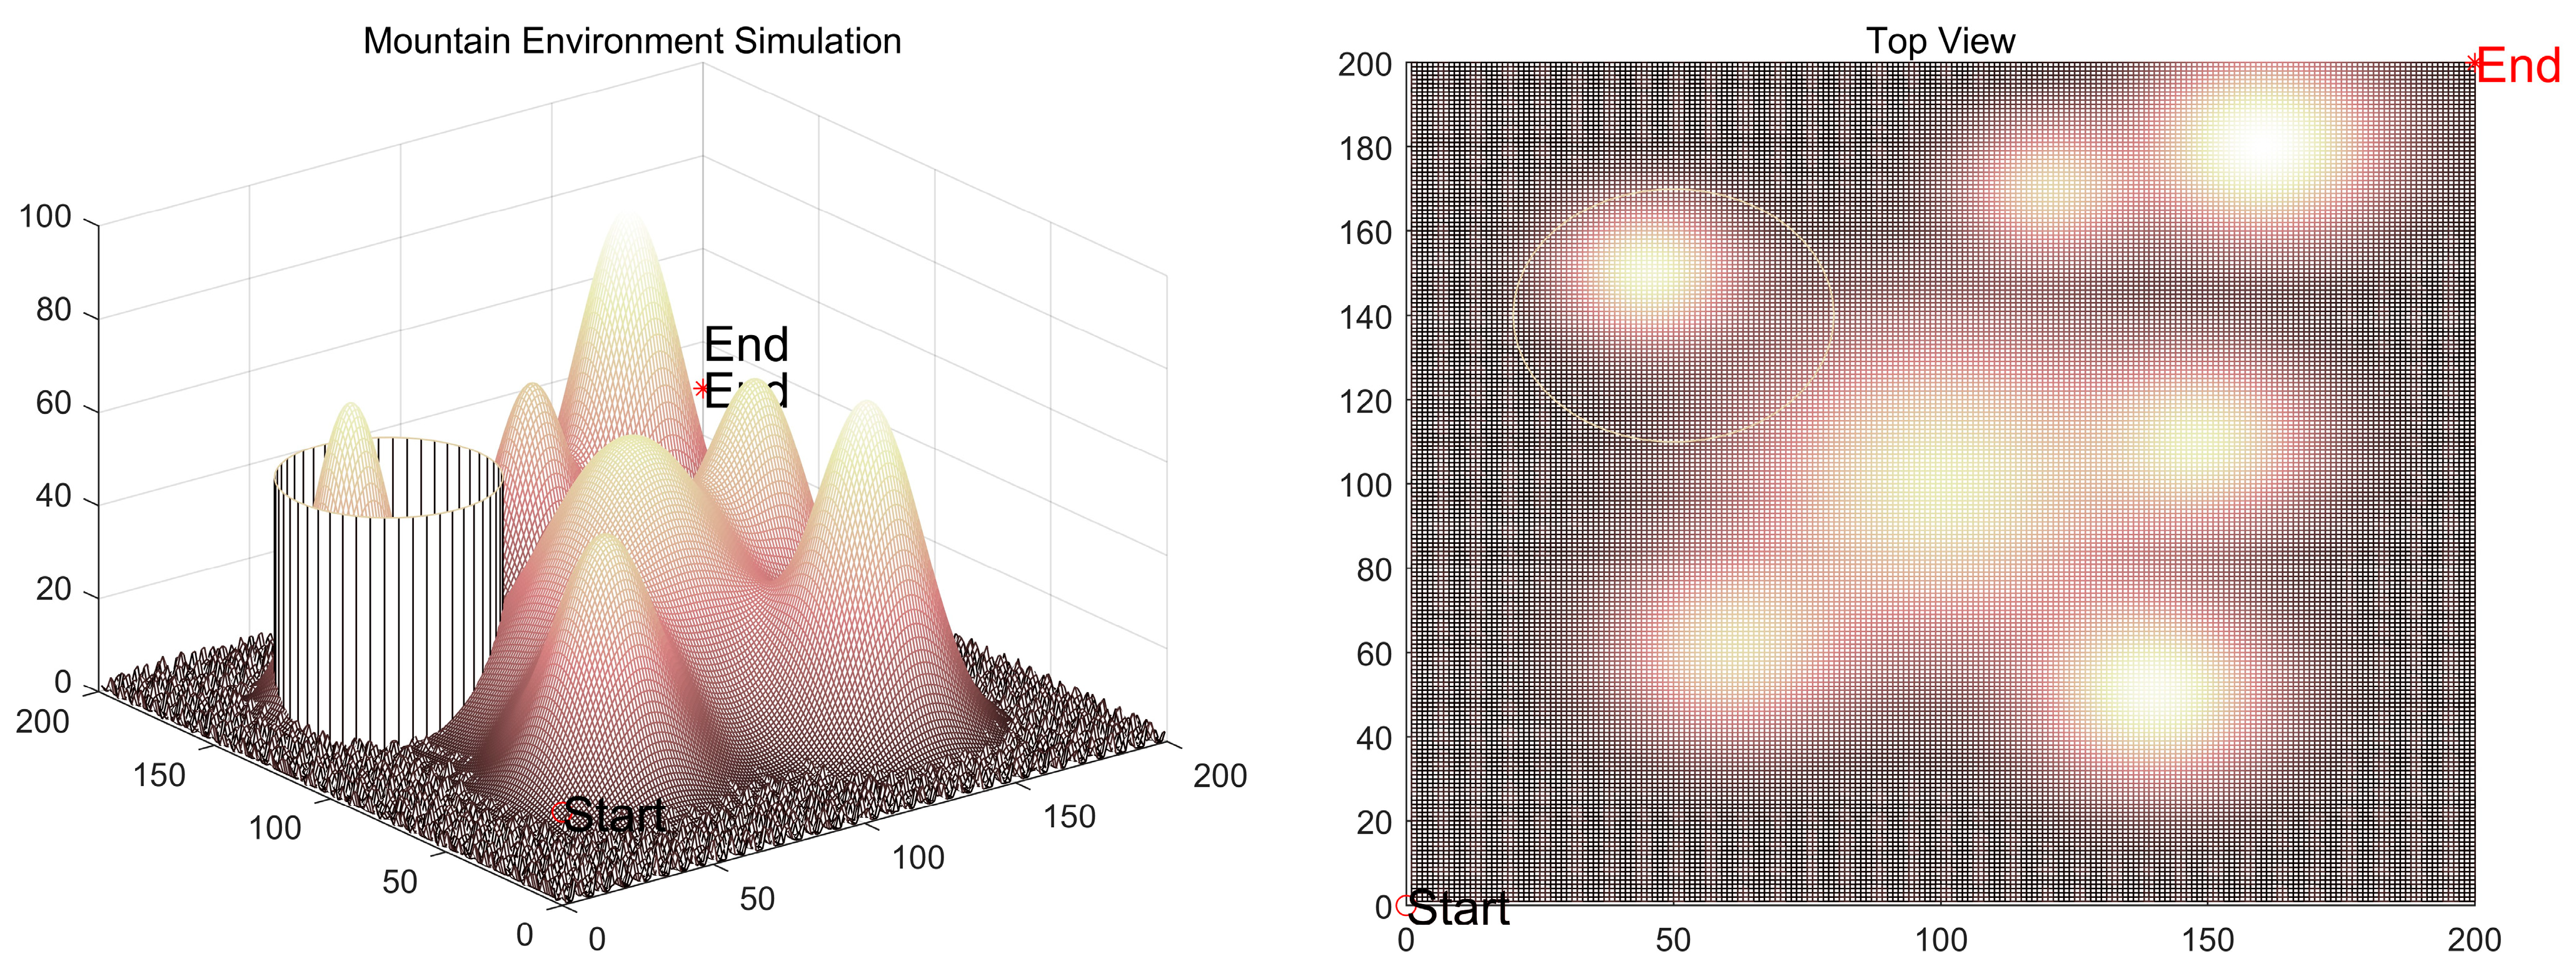
The final obtained map model is shown in
Figure 10.
Figure 10 depicts the 3D UAV flight environment with a 200 × 200 horizontal range and 0–50 altitude range. The terrain is composed of Gaussian mountain peaks and trigonometric undulations. Five cylindrical threat regions are randomly distributed, with different centers and radii. The start point is (0, 0, 0) and the end point is (200, 200, 20). The map contains complex obstacles and constraints to test the algorithm’s path planning ability.
4.3. Experimental Analysis of UAV Path Planning
Unmanned aerial vehicle (UAV) three-dimensional path planning is a typical nonlinear, multi-constraint, and nonconvex continuous optimization problem. It requires achieving a balanced trade-off among path safety, efficiency, and smoothness under complex terrain and threat-area constraints. The inherent difficulty of this problem and its practical engineering value closely match the application scenarios targeted by the PMAED algorithm. Although the preceding sections have demonstrated the superior performance of PMAED on benchmark functions, its applicability to real-world engineering problems still requires further validation.
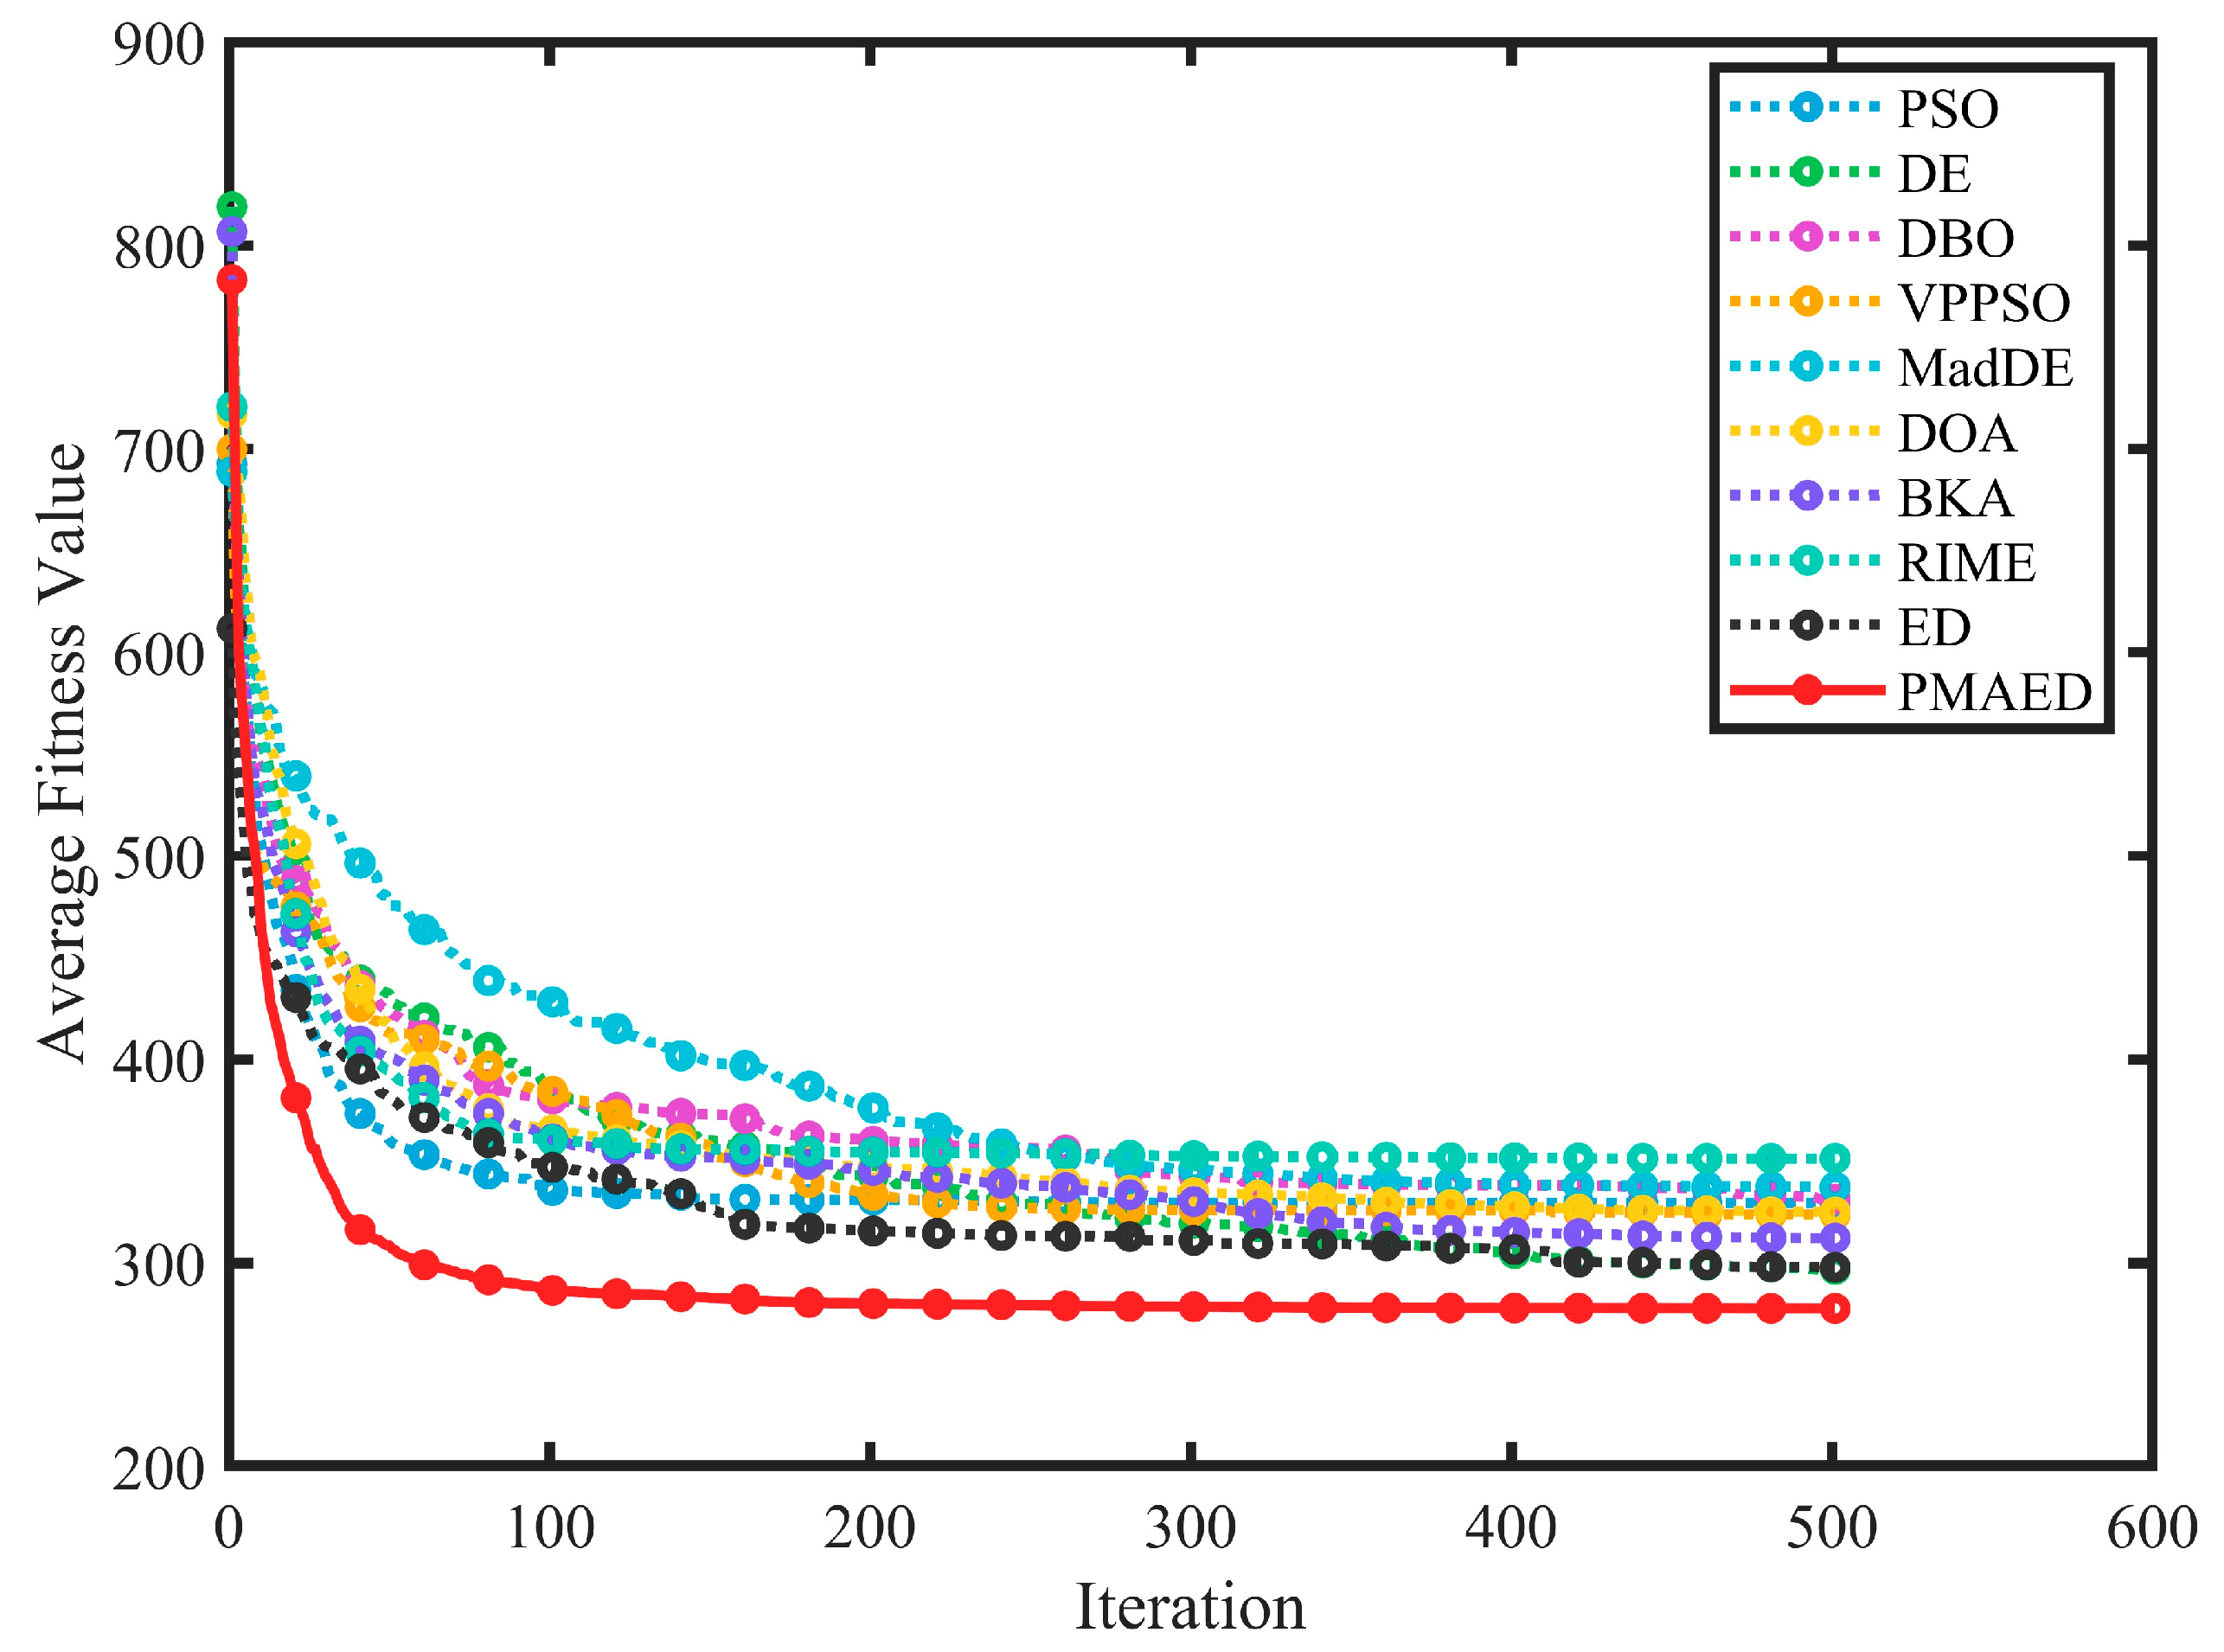
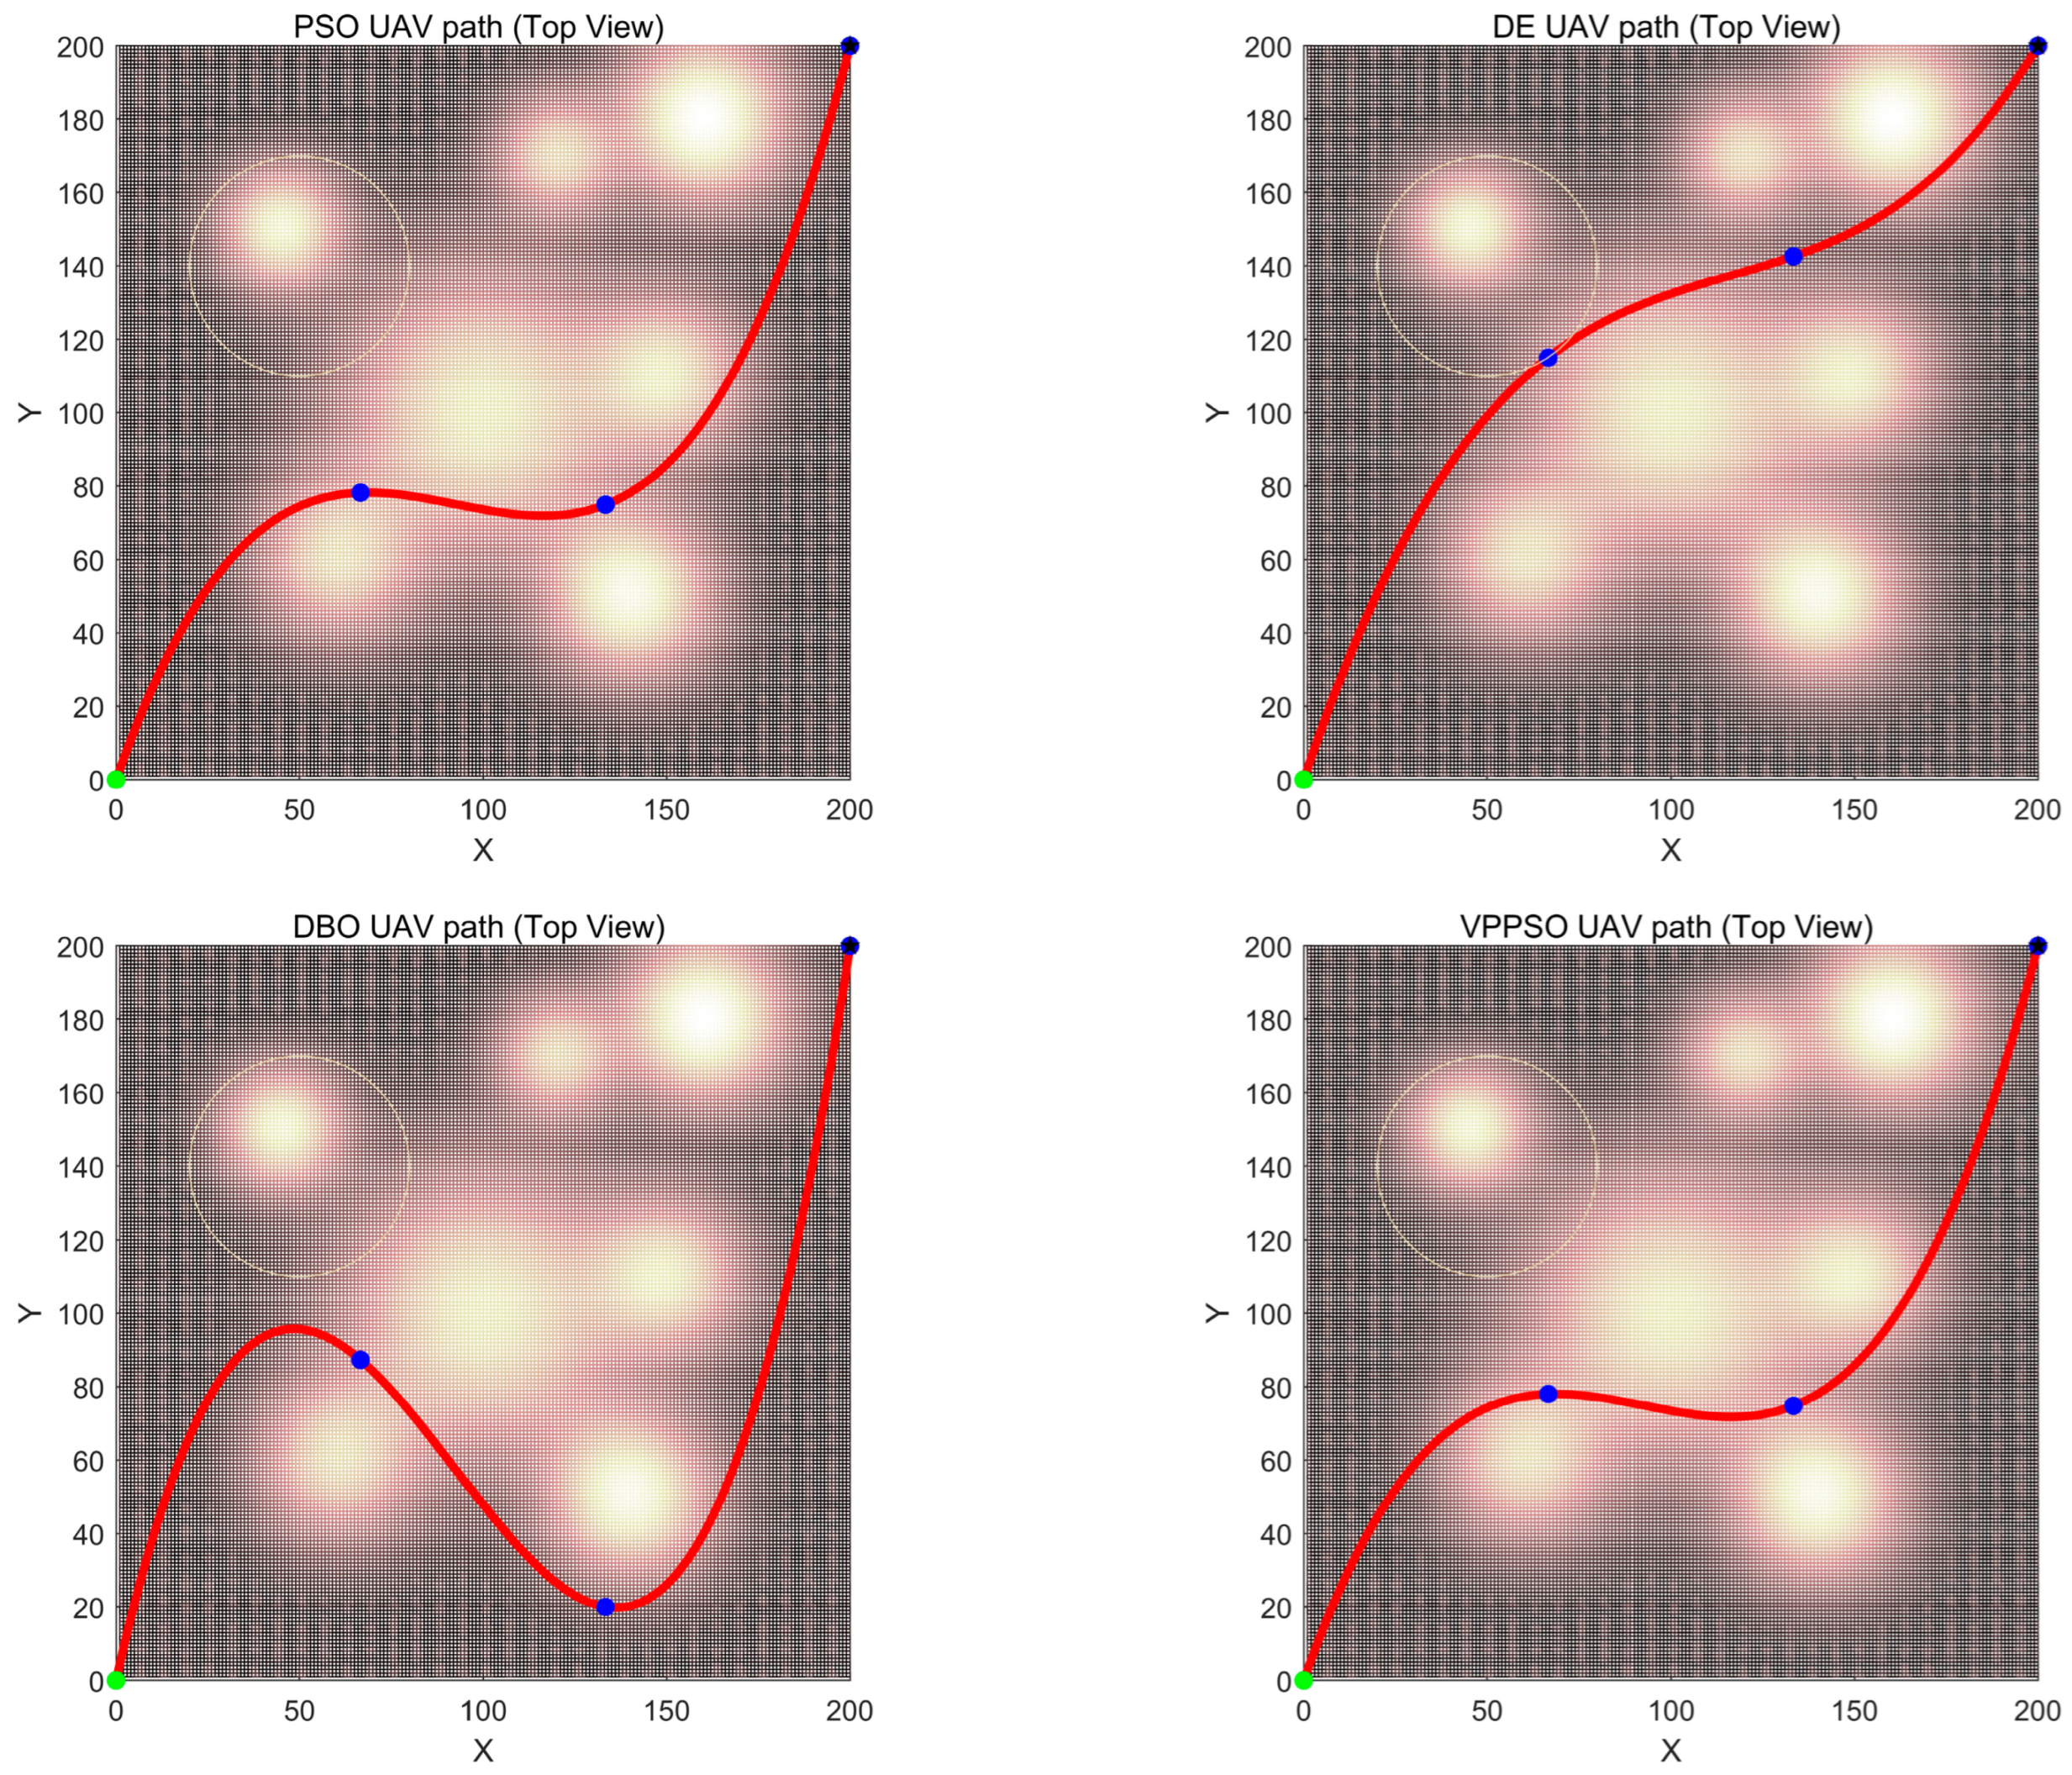
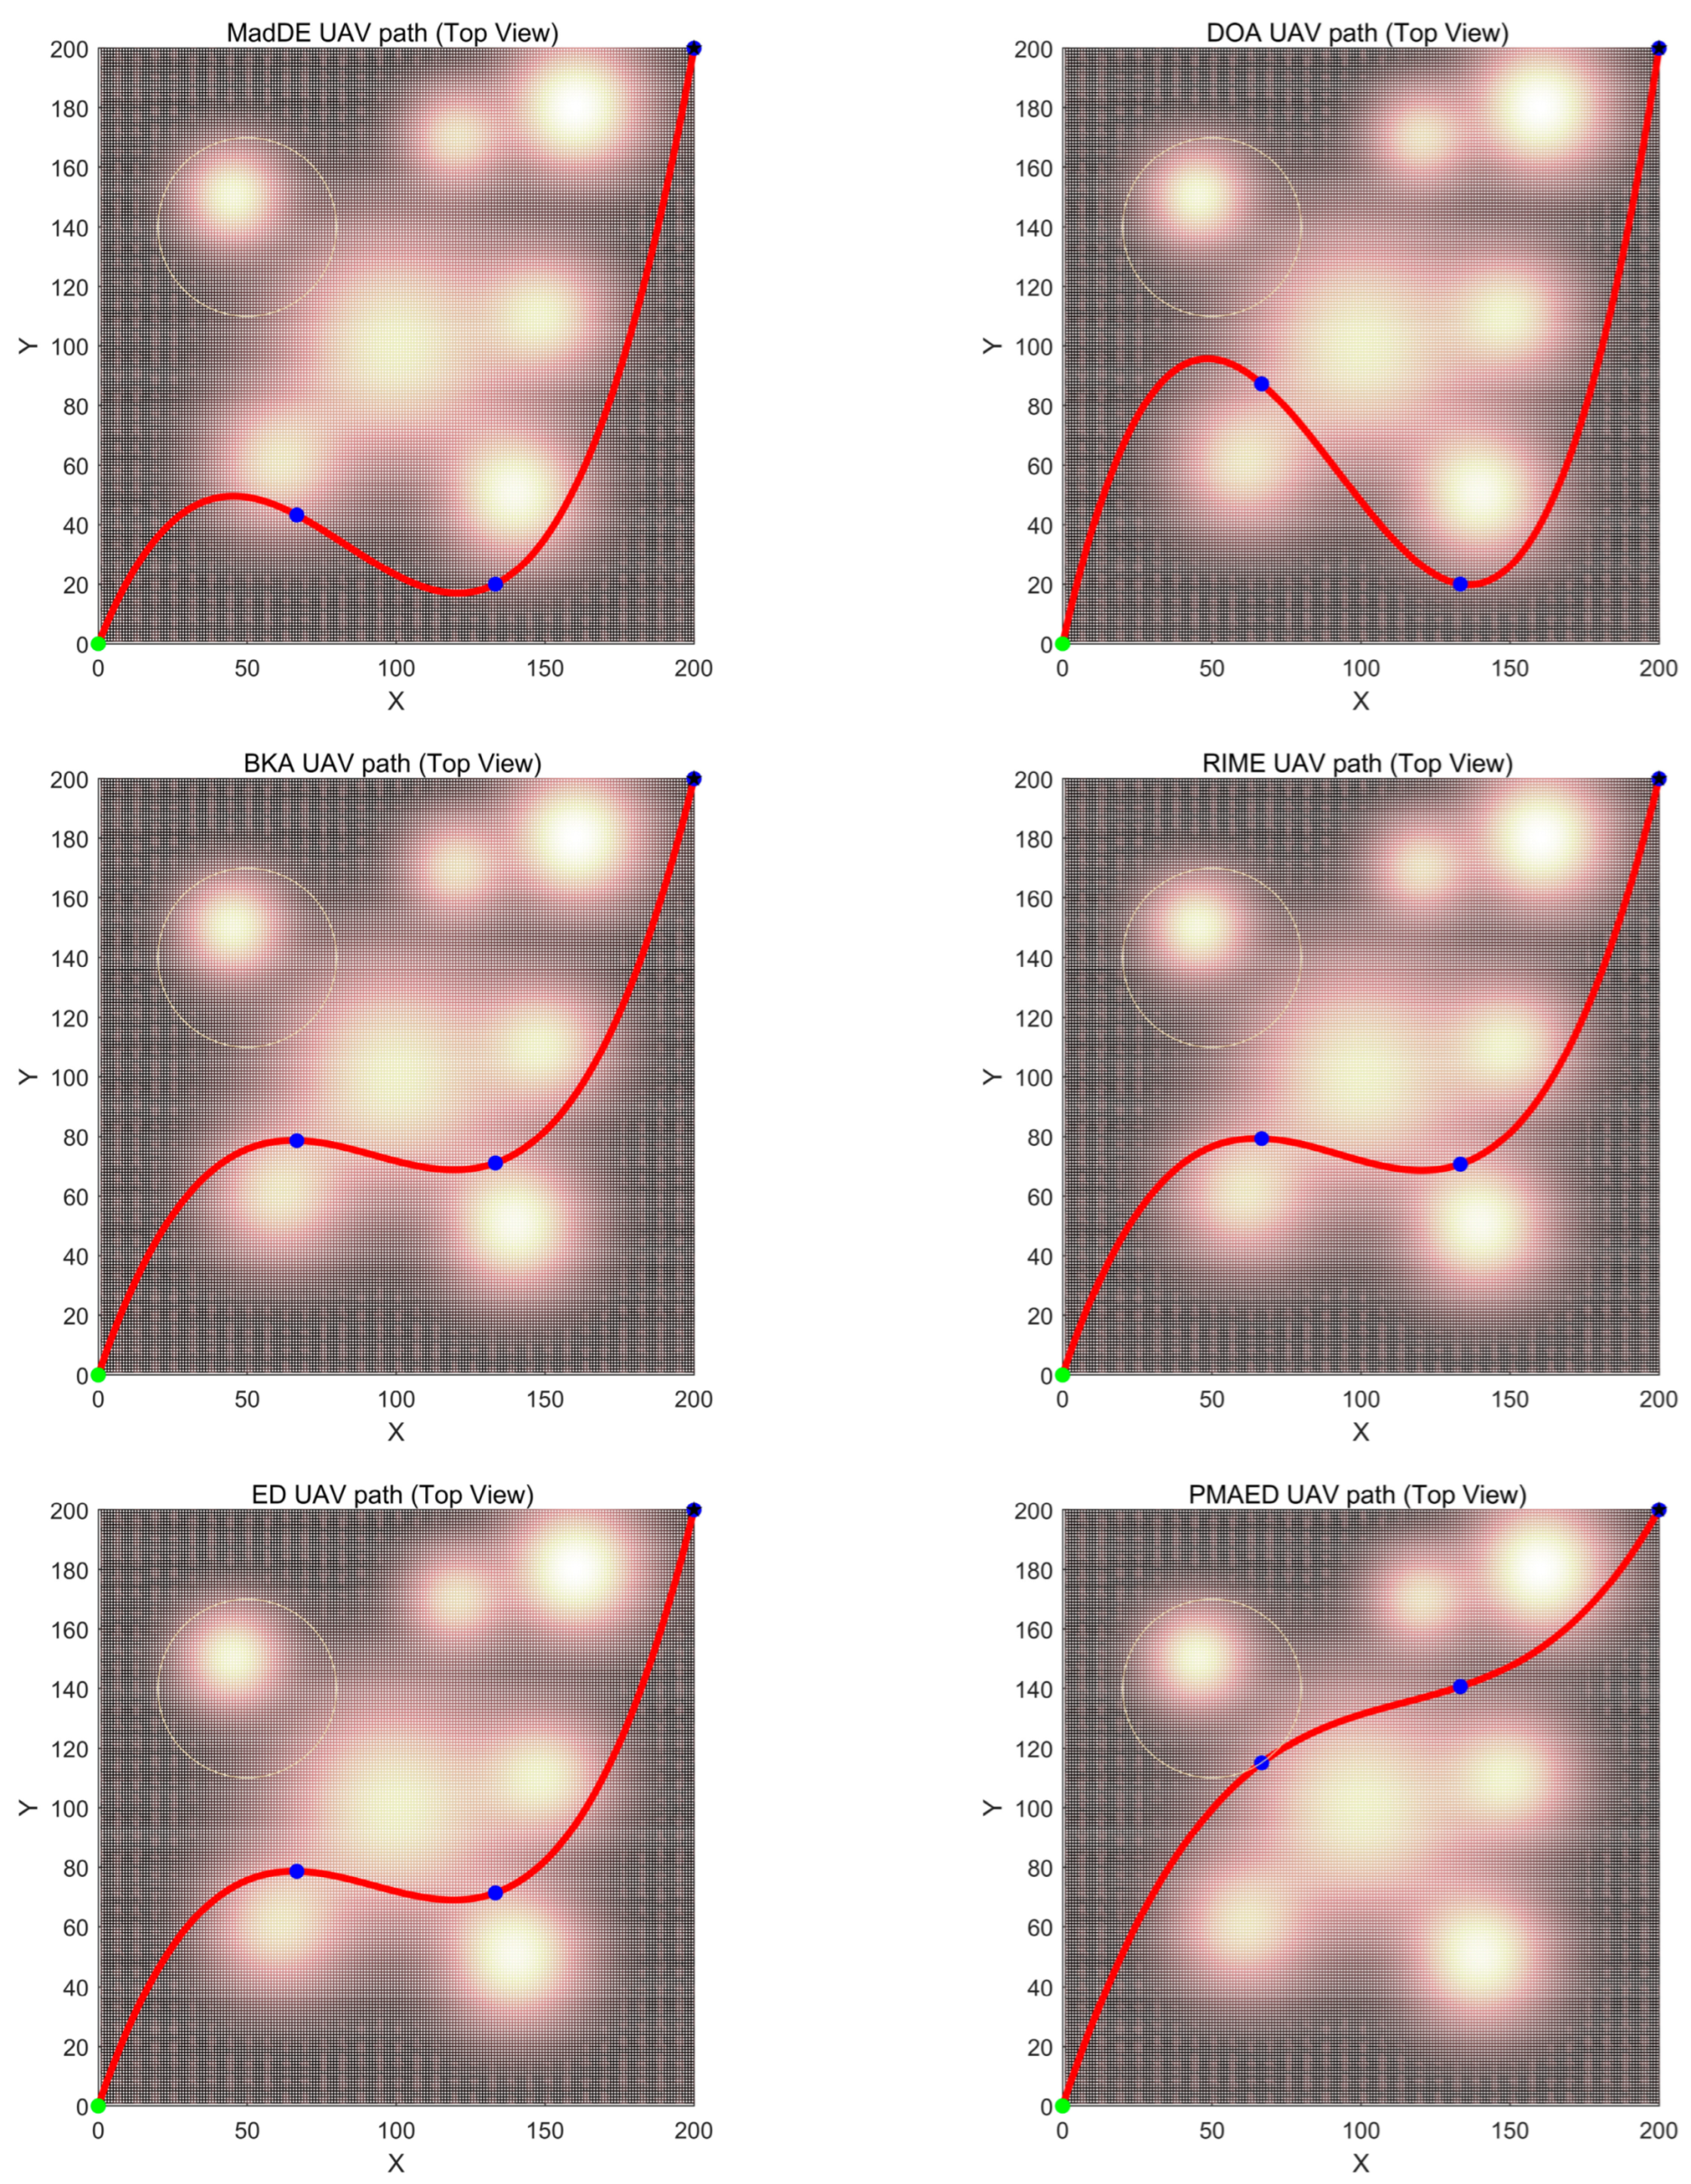
To this end, this section constructs a three-dimensional flight environment incorporating terrain obstacles and threat regions, and applies PMAED together with nine comparison algorithms to the UAV path planning task. Performance is evaluated from multiple perspectives, including path cost, stability, computational efficiency, and visualization quality, in order to verify the engineering practicality and superiority of PMAED in solving real-world optimization problems with complex constraints. The experimental results are illustrated in
Figure 11,
Figure 12 and
Figure 13, as well as in
Table 8. Specifically,
Table 8 reports the statistical results of PMAED and the nine comparison algorithms on the UAV path planning problem, including the mean cost, standard deviation, best value, worst value, median value, runtime, and Friedman ranking.
Figure 7 presents the path cost convergence curves of all algorithms, while
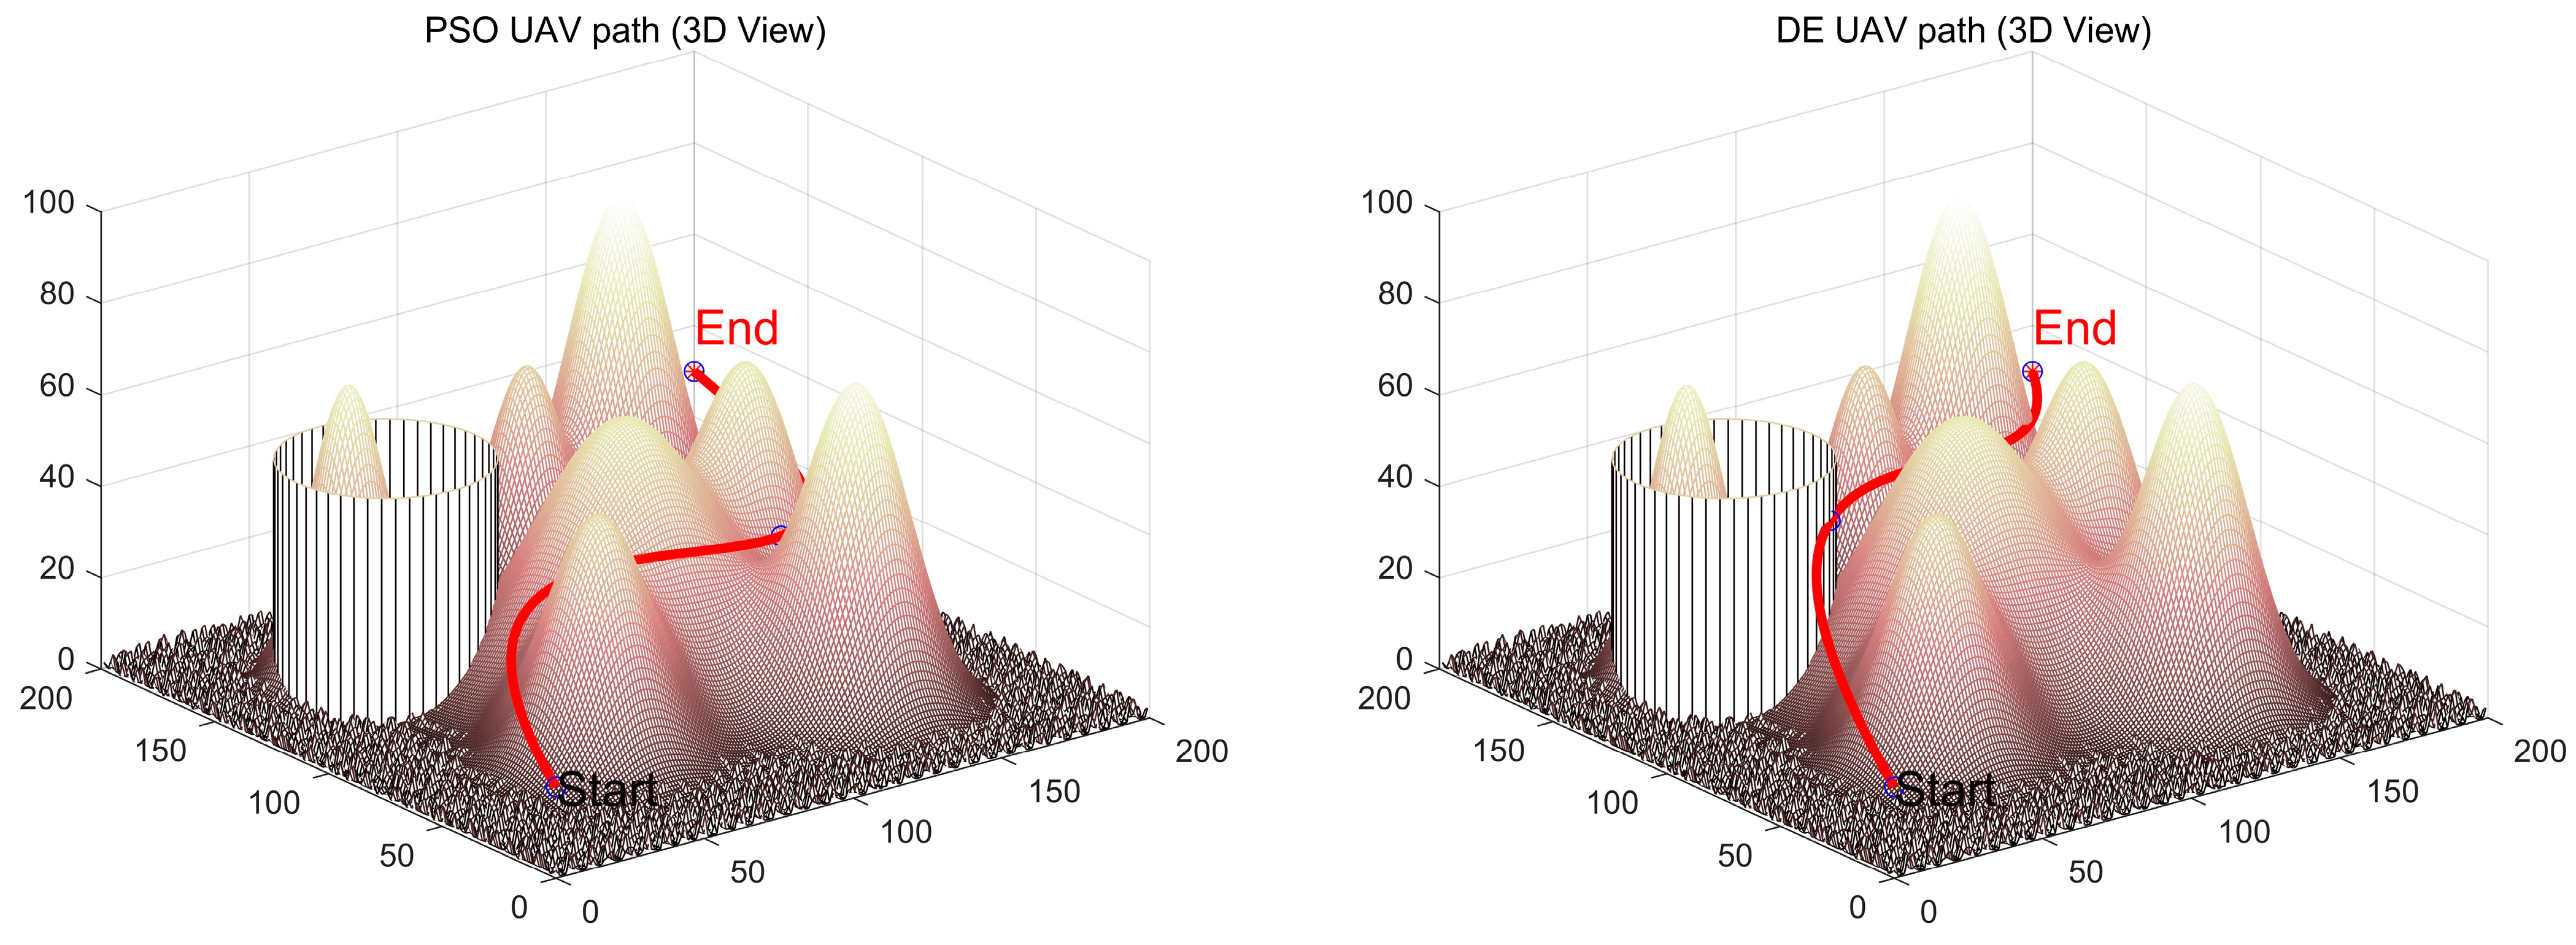
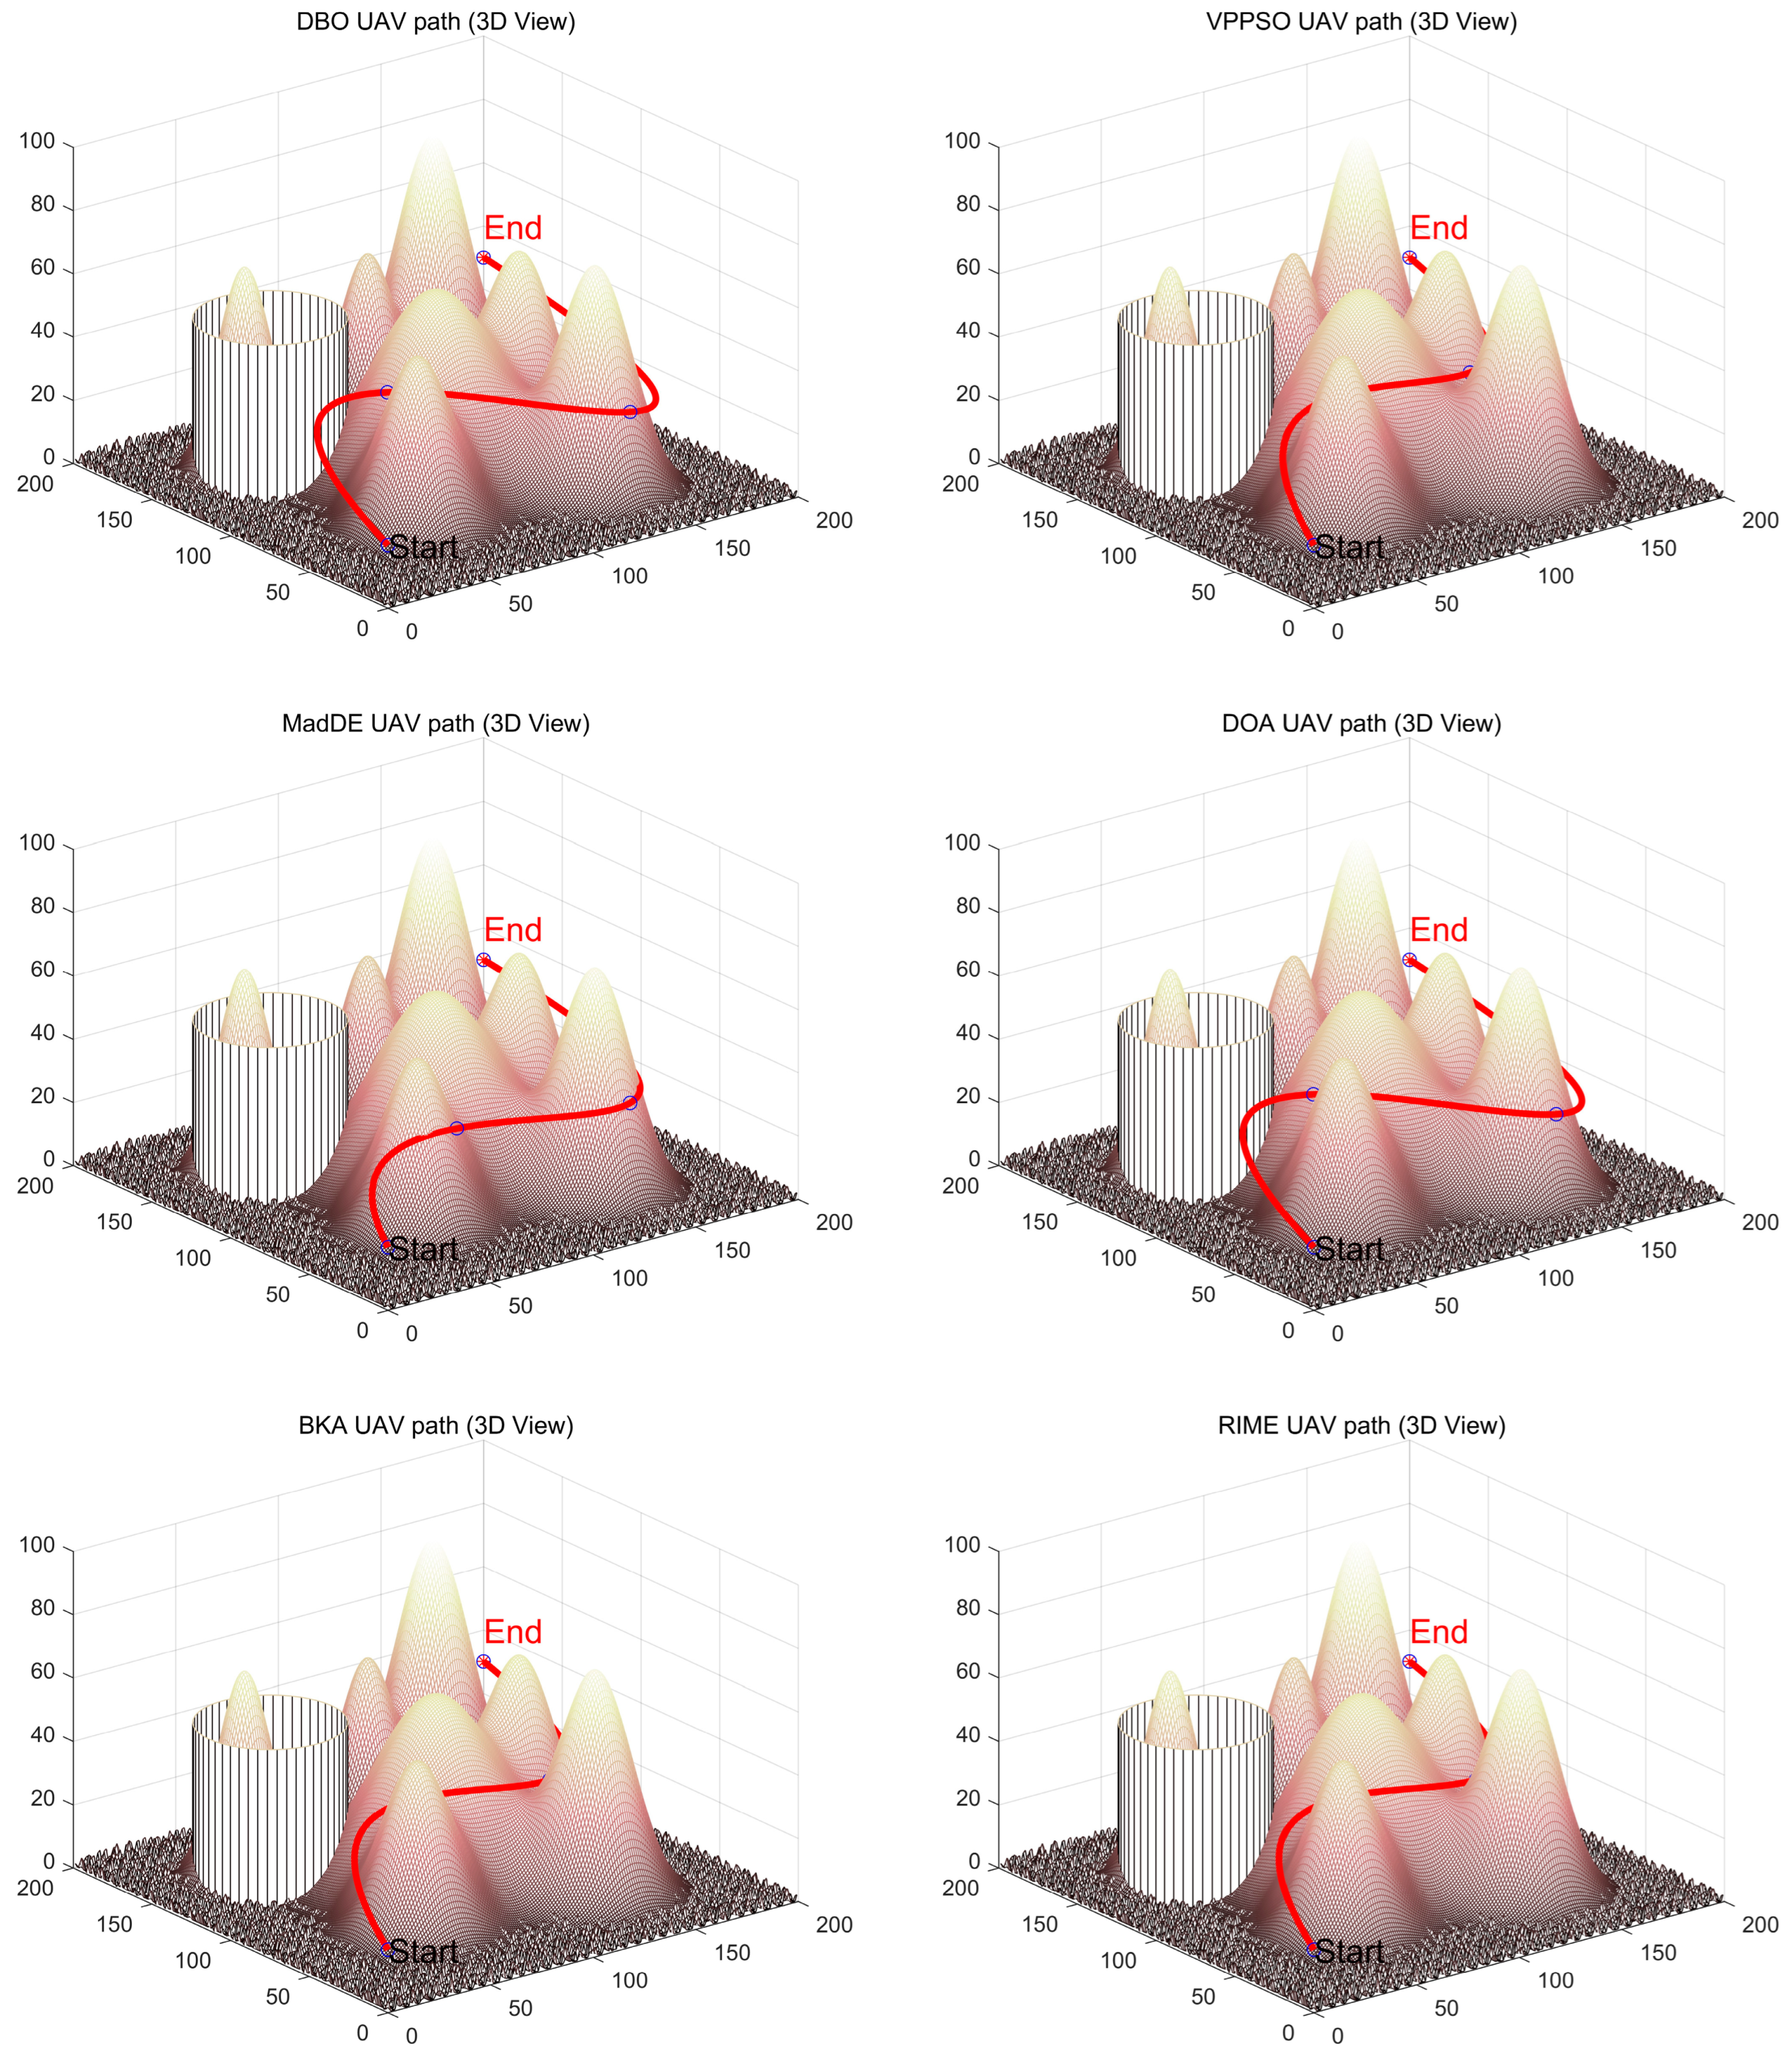
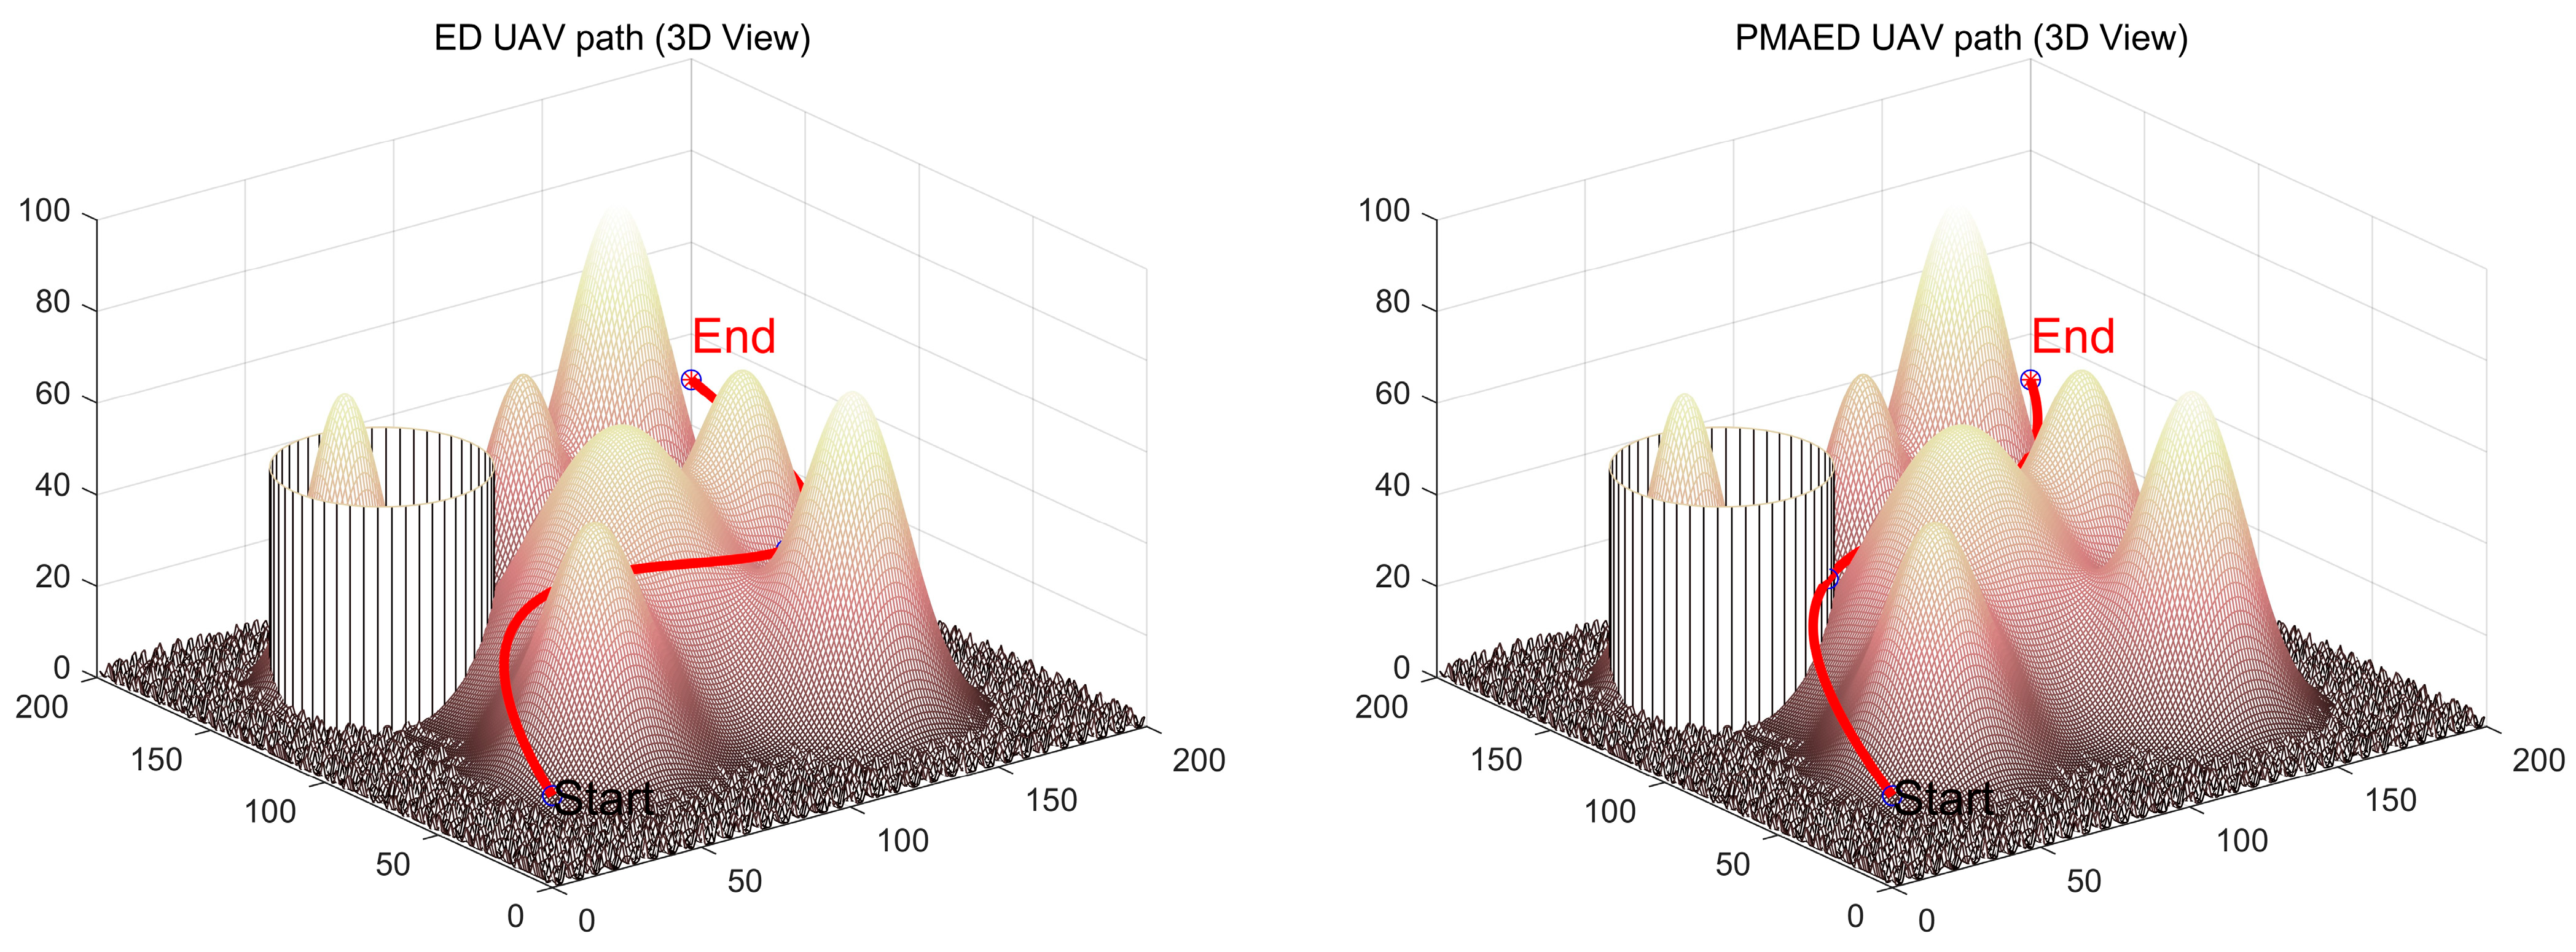
Figure 8 (including both 3D views and top-down views) intuitively visualizes the spatial characteristics of the planned paths and their obstacle-avoidance performance. Collectively, these results comprehensively validate the path planning capability of PMAED from quantitative metrics, convergence behavior, and visual analysis perspectives.
As shown in
Table 8, PMAED achieves the best performance across the core evaluation metrics. The mean path cost of PMAED is only 277.62, which is significantly lower than that of all comparison algorithms. Specifically, it is reduced by approximately 6.8% compared with the second-ranked ED (297.82) and by about 21.0% compared with the relatively inferior RIME (351.32), demonstrating superior path optimization accuracy. The standard deviation is 42.17, the smallest among all algorithms and substantially lower than those of DBO (84.04) and RIME (89.61), indicating extremely high consistency across repeated planning runs and a clear stability advantage. The best path cost reaches 231.10, which is comparable to the best results of other algorithms, while the worst value is only 392.20, outperforming most competitors. This indicates that PMAED can effectively control extreme-case path costs while maintaining high-quality optimal solutions. Moreover, the median value of 232.20 is far lower than those of the other algorithms, further confirming the overall superiority of PMAED in terms of path cost distribution.
In terms of computational efficiency, PMAED records a runtime of 24.59, which lies in the mid-range among all algorithms. It is slightly higher than PSO (22.99) and ED (23.15), but substantially lower than DOA (45.90) and BKA (53.97), achieving a favorable balance between performance and efficiency. The Friedman ranking results further indicate that PMAED attains the first place with a Friedman value of 4.17, confirming it as the algorithm with the best overall performance and demonstrating strong competitiveness in the UAV path planning task.
The fitness curves in
Figure 11 visually illustrate the convergence behavior of path costs for all algorithms. The convergence curve of PMAED drops rapidly during the early iterations, enters a stable phase sooner, and ultimately converges to the lowest value, indicating its ability to quickly locate high-quality path regions and perform fine-grained optimization. Although ED, DE, and similar algorithms also exhibit decreasing trends, their convergence speeds are slower and their final convergence values remain higher than that of PMAED. In contrast, algorithms such as DBO and RIME show large oscillations in their convergence curves and remain in high-cost regions for extended periods, reflecting poor search stability and difficulty in approaching the optimal path. Notably, PMAED’s convergence curve shows no significant oscillations in the later iterations, demonstrating its ability to maintain stable optimization behavior and avoid premature convergence or oscillatory search patterns.
The 3D view in
Figure 12 reveals that the paths planned by PMAED exhibit “smooth and efficient” characteristics. In complex mountainous terrain, the path maintains a reasonable altitude gradient without abrupt vertical changes, avoiding the “steep climbing” phenomena observed in paths generated by PSO and BKA, thereby reducing UAV maneuvering difficulty. In addition, the overall path direction is direct, with no unnecessary detours, effectively avoiding high-altitude obstacles while minimizing flight distance. This observation is consistent with the superior average cost results of PMAED reported in
Table 8.
The top-down view in
Figure 13 further validates the rationality of the planned paths. The paths generated by PMAED exhibit strong linearity and precisely avoid threat regions on the map, without the “long detours” or “repeated circling” behaviors observed in the paths of RIME and DBO. The path direction from the start point to the destination is continuous, with no abrupt directional changes, satisfying the maneuverability constraints of UAVs. In contrast, some comparison algorithms produce paths with sharp turns, increasing flight control difficulty. Moreover, the horizontal projection of PMAED’s paths is evenly distributed, without clustering near the boundaries of threat regions, which further enhances flight safety.
Overall, PMAED demonstrates the best comprehensive performance in the UAV path planning task. The generated paths feature lower costs, stronger stability, and superior geometric characteristics, while maintaining a reasonable level of computational efficiency. This performance can be attributed to the synergistic effects of the adaptive differential evolution backbone for dynamic path optimization, the eigen-based rotated search strategy for adapting to terrain and threat constraints, and the PMA public management augmentation mechanism for precise optimization of inefficient paths. Together, these components enable PMAED to efficiently balance path safety, efficiency, and smoothness under complex constraints, providing reliable algorithmic support for practical UAV path planning applications.
5. Summary and Feature Works
This paper proposed a Public Management–Augmented Multi-strategy Adaptive Enterprise Development Optimization algorithm (PMAED). By organically integrating adaptive differential evolution, an eigen-based rotated search strategy, and public management principles, PMAED constructed an optimization framework that effectively balanced global exploration capability and local exploitation efficiency. From the perspective of enterprise development and organizational governance, the population search process was explicitly modeled. The proposed algorithm not only preserved the strengths of enterprise development-based optimization in activity switching and structural evolution, but also significantly enhanced robustness and stability in high-dimensional, strongly coupled, and multimodal optimization problems through parameter self-learning, search-direction alignment, and hierarchical performance governance mechanisms.
Extensive experiments on the CEC2020 and CEC2022 benchmark function suites demonstrated that PMAED consistently outperformed a variety of classical and state-of-the-art algorithms in terms of optimization accuracy, convergence speed, and stability across different dimensions and function types. Statistical test results further confirmed the significance of these performance advantages. In addition, a three-dimensional UAV path planning model was constructed, and PMAED was applied to this complex engineering optimization problem. The experimental results showed that PMAED was capable of generating safer, more efficient, and smoother flight paths under multiple constraints, thereby demonstrating its strong engineering applicability.
PMAED was shown to be suitable for high-dimensional, nonlinear, and strongly coupled continuous optimization scenarios, such as UAV path planning, intelligent manufacturing parameter optimization, aerospace system design, and resource scheduling.
Future work will extend this research in several directions. On the one hand, the PMAED framework can be generalized to multi-objective and dynamic optimization problems to better accommodate more complex real-world scenarios. On the other hand, incorporating problem-specific knowledge or online learning mechanisms may further improve the efficiency and adaptability of PMAED in ultra-high-dimensional or real-time optimization tasks. Moreover, introducing the integration concept of public management and swarm intelligence into the design of other non-bio-inspired optimization algorithms may open new research avenues for complex system optimization.