Abstract
Digital Twins (DTs) have become essential tools for the design, diagnostics, and prognostics of mechanical systems. In gearbox applications, DTs are often built using physics-based simulations guided by ISO standards. However, standards-based approaches may suffer from complexity, licensing limitations, and computational costs. The concept of symmetry is inherent in gear mechanisms, both in geometry and in operational conditions, yet practical applications often face asymmetric load distributions, misalignments, and asymmetric and symmetric nonlinear behaviors. In this study, we propose a hybrid method that integrates data-driven modeling with standard-based simulation to develop efficient and accurate digital twins for gear transmission systems. A digital twin of a spur gear transmission is generated using KISSsoft®, employing ISO standards to compute safety factors across varied geometries and load conditions. An automated MATLAB-KISSsoft® (COM-interface) enables large-scale data generation by systematically varying key input parameters such as torque, pinion speed, and center distance. This dataset is then used to train a neural network (NN) capable of predicting safety factors, with hyperparameter optimization improving the model’s predictive accuracy. Among the tested NN architectures, the model with a single hidden layer yielded the best performance, achieving maximum prediction errors below 0.01 for root and flank safety factors. More complex failure modes such as scuffing and micropitting exhibited higher maximum errors of 0.0833 and 0.0596, respectively, indicating areas for potential model refinement. Comparative analysis shows strong agreement between the NN outputs and KISSsoft® results, especially for root and flank safety factors. Performance is further validated through sensitivity analyses across seven cases, confirming the NN’s reliability as a surrogate model. This approach reduces simulation time while preserving accuracy, demonstrating the potential of neural networks to support real-time condition monitoring and predictive maintenance in gearbox systems.
1. Introduction
The concept of symmetry plays a central role in gear design as geometrical regularity, symmetric or asymmetric teeth profiles, and balanced loading are hallmarks of ideal systems. However, in practical applications, these symmetries are often broken by factors such as torque fluctuations, manufacturing tolerances, and boundary conditions, leading to asymmetric stress distributions and degradation patterns. In our approach, the neural network implicitly learns these asymmetries by being trained on a large and systematically generated dataset that includes both symmetrical configurations and deviations from them. This allows the model to recognize the underlying symmetric structure of the gearbox while accurately accounting for asymmetric variations due to operational or structural perturbations. This dual sensitivity makes it well-suited to deployment in intelligent diagnostic systems, where the early detection of symmetry-breaking phenomena is critical for predictive maintenance and creation of data-driven models.
Data-driven analyses for the diagnostic and prognostic of operating machines have gained great attention the recent years due to the enormous research effort in the field of Big Data and System Identification through machine learning algorithms. Having a huge dataset is mandatory to train the algorithm and properly identify the model that is capable of replicating and predicting the behavior of a system. This idea sounds perfect for solving all the issues of mechanical systems that work under repetitive loading conditions, such as gears, bearings, or shafts. But, as already pointed out by Randall [1] more than a decade ago, this idea is affected by a significant weakness: huge datasets are available for working conditions where the systems are free from faults, while experimental data measured from sensors when systems are prone to break are limited and therefore not sufficient for training a model using machine learning techniques. To overcome this limitation, Randall proposed to generate synthetic data considering a wide range of possible cases to cover as many conditions as possible. Within this context, recent studies have demonstrated the effectiveness of hybrid approaches combining physics-based models and data-driven techniques, such as the use of digital twins (DTs) for synthetic data generation. These DTs enable the creation of extensive, high-fidelity datasets that are essential for training neural network models capable of capturing and predicting the complex dynamic behavior of mechanical systems [2,3,4,5,6].
Neural networks have been widely developed and increasingly employed in recent decades since they are potentially able to create links between input and output quantities without knowing the laws connecting these quantities [7]. However, in some cases where the dependency of the output on the input is not trivial (no direct and smooth proportionality), the NN could succeed or fail in building the link. The determination of the accuracy of an NN in reproducing the standards is of paramount importance for enabling its use in the creation of digital twins. Some of the main benefits of NN use include a faster, more portable response to inquiries, as well as the fact that it could be implemented in open-source software (e.g., Python). A digital twin is a virtual model of an actual mechanical device, which reproduces the static and dynamic features of the device [8]. Digital twins are often created by engineers for the design of optimized, effective gearboxes, by leaning on the ISO standards and codes, which are based on analytical formulae and tables taken from theories, experiments, and experience [9]. Even though accurate gear models are still objects of research (see e.g., [10,11]), during the design process, these formulae and tables are used to extract many safety factors (SFs) and/or parameters (PAs) regarding the gears, shafts, bearings, and other gearbox elements. For instance, designers are usually concerned about the bending safety factor, related to the bending of the gear tooth root, the pitting safety factor, related to the pitting generated on the flank, or the bearing lifetime parameter [12]. The governing laws that provide these safety factors and parameters can be complicated and unphysically discontinuous and nowadays one can find the aforementioned standards in different software, for example, KISSsoft®.
The utilization of physics-based simulations, particularly through tools like KISSsoft®, provides a robust framework for calculating safety factors amidst varying geometries and load conditions. The integration of ISO standards further guarantees that these simulations conform to recognized methodologies, adding credibility to the findings derived from such an approach [13]. However, standard-based methodologies often face challenges, including complexity, licensing issues, and high computational costs and time [14]. By leveraging the capabilities of KISSsoft® in conjunction with an automated data generation process through MATLAB®, the proposed method ensures that large datasets can be efficiently created. This allows for systematic variations in critical input parameters such as torque, pinion speed, and center distance, facilitating extensive coverage of operational scenarios relevant to gearbox performance. The generated dataset serves as the foundation for training a neural network designed to predict safety factors. The process of hyperparameter optimization contributes substantially to the model’s predictive accuracy, showcasing the adaptability of machine learning models in interpreting complex relationships within the data [13]. In comparative analyses, this trained NN demonstrated strong concordance with safety factors computed via KISSsoft®, specifically regarding root and flank safety metrics. Such consistency underscores the NN’s potential as a surrogate model to enhance the computational efficiency of digital twins without compromising accuracy [15]. Moreover, performance validation through sensitivity analyses across various scenarios corroborates the NN’s reliability. Such analyses are critical as they provide insights into how variations in input parameters influence gearbox performance and associated safety factors [16]. This capability not only accelerates the overall simulation process but also supports real-time condition monitoring and predictive maintenance initiatives, marking a significant advancement in the operational management of gear transmission systems [17].
Recent studies emphasize the role of gear meshing excitations in fatigue damage, particularly at high speeds. Liu et al. [18] demonstrated that even low-amplitude stresses near meshing frequencies can cause ultra-high-cycle fatigue due to resonance, indicating that traditional standards may underestimate fatigue risk under dynamic conditions. This underscores the need to incorporate dynamic effects into fatigue prediction models using large-scale simulation datasets and neural networks. However, as simulations become more complex, challenges in Big Data analytics—such as preprocessing and computational efficiency—must be addressed, as noted by Yoo et al. [19], with solutions like parallel computing enabling more effective neural network-based diagnostics. Lightweight deep learning models using simple acoustic features have achieved 95.5% fault detection accuracy with minimal resources [20], supporting real-time applications. Recurrent architectures have also proven effective in degradation prediction, with Deep Layer Recurrent Neural Networks outperforming traditional models in estimating turbofan engine life [21], aligning with this study’s goal of using machine learning for safety factor estimation in digital twins. In cases where labeled data are scarce, unsupervised methods like deep sparse autoencoders have successfully detected gear faults directly from raw vibration signals [22], highlighting the potential of adaptive feature learning. Hybrid approaches combining signal decomposition with neural networks have also shown strong performance, achieving 100% classification accuracy in gear diagnostics [23]. Structured deep learning pipelines applied in other domains, such as fishing gear classification from AIS data, further demonstrate the value of robust preprocessing and dual-module architectures [24], offering insights transferable to gearbox diagnostics. Data augmentation through automated systems simulating varied operational conditions enhances model robustness and generalization, as shown in visual inspection tasks [25]. Additionally, support vector machines with medium Gaussian kernels have provided resilient fault classification under noisy conditions [26], emphasizing the importance of model selection and feature representation. Finally, while deep learning models like CNNs offer high performance, traditional feature-based methods may deliver better interpretability for long-term monitoring, as demonstrated in train door diagnostics [27], reflecting a trade-off relevant to the development of transparent and effective digital twins for gearbox health monitoring.
In this study, we investigate a simple gearbox composed of two identical gears and demonstrate that, with proper training, a neural network can accurately replicate the complex behavior of certain safety factors. The NN is trained on a large dataset generated using an automated MATLAB script interfaced with KISSsoft®. This approach represents a model-based framework aimed at enabling diagnostics and prognostics in gear transmission systems; it goes beyond the methods based on environmental data like vibration of the housing or the current absorbed by the electric motor [14]. A digital twin of the gearbox is developed in KISSsoft® to produce a comprehensive dataset under varying operational conditions. The generated data are then used to train the NN, with machine learning techniques employed to optimize its hyperparameters. The results section presents a detailed comparison between the safety factors computed by KISSsoft® and those predicted by the trained neural network.
2. Dataset Generation
Training the algorithm requires obtaining the safety factors under different initial conditions, a process that is accomplished through initial simulations. Based on the parameters that we want to explore their effect on the lifetime; these simulations are conducted by setting different values for those parameters. To achieve this goal, a platform is needed to simulate the same model but with different values for a specific parameter, e.g., center distance. Thanks to the communication ability of KISSsoft®, i.e., COM interface, with other external programs, a code is written in MATLAB [28] to integrate KISSsoft® into the training process chain. KISSsoft® is a program that could calculate the safety factors based on ISO standards. To create the spur gear pair model by KISSsoft®, setting parameters are divided into three groups:
 Table 1. Gear pair characteristics.
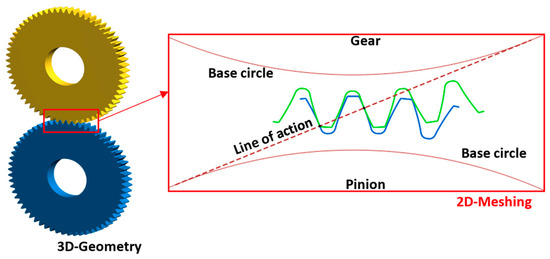 Figure 1. The considered gear pair model in KISSsoft®.
- Oil characteristics: “Shell Omala S2 G 68” with the properties presented in Table 2.
 Table 2. Oil characteristics of “Shell Omala S2 G 68”.
 - The specific parameters to represent their effects on the lifetime or safety factors.
To create the gear pair model, “Standard Tool 1.25/0.38/1.0 ISO 53.2:1997 Profile A” [38] is considered as the reference profile. Crowning modification is applied to the pinion and gear teeth with the same value on both sides (see Figure 2).
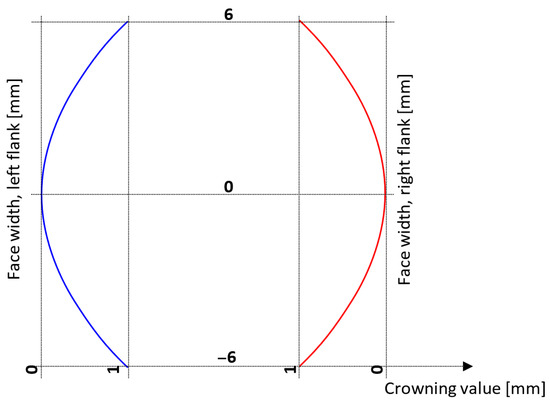
Figure 2.
Applied crowning modification on the left and right sides of the pinion and gear.
Finally, the last part of the required data is specific parameters whose influence we explore on the different safety factors, i.e., lifetime, input torque, speed, center distance, Kinematic viscosity at 100 °C, core hardening, and teeth surface roughness.
3. Safety Factors
Safety factors are fundamental indicators used in mechanical design to quantify the reliability and durability of components under operational conditions. In gear transmissions, safety factors represent the ratio between the permissible load and the actual load applied to the system. They provide a margin of safety to account for uncertainties in material properties, manufacturing tolerances, load variations, and environmental influences. According to ISO standards, different types of safety factors are defined for various failure modes, such as tooth root fatigue, pitting, and scuffing. These factors are crucial in ensuring that the gear system performs within acceptable limits over its intended service life, and they form the basis for assessing both the design quality and remaining useful life in prognostic applications. In the following, we introduce and describe the specific safety factors considered in this study, which are used to evaluate the performance and durability of the gear transmission system under various operating conditions.
3.1. Safety Factors to Protect Against Scuffing
Scuffing consists of local welding due to poor lubrication, resulting in the removal of material from the meshing teeth [39]. Adhesive wear can occur not only when the lubricant film is not thick enough to separate roughness asperities, but also in full lubricant film conditions. In the latter case, wear mechanisms are activated by thermal instabilities. According to the literature, scuffing depends on several parameters related to the gears, such as the material and teeth surface finishing, and a role is also played by the lubricant. Scuffing phenomena can be classified as cold and warm (or hot). Considering warm scuffing, this phenomenon takes place when the dynamics between mating teeth are characterized by high contact temperatures, pressures, and sliding velocities. These conditions lead to sharp temperature peaks in localized areas, resulting in welding between the asperities. The temperature gradients are so sharp that globally the temperature remains low. In the literature, two different methods are available for calculating the warm scuffing load-carrying capacity of gears:
- The flash temperature method is based on Blok’s local temperature along the contact path (see ISO 6336:20 [40]).
- The integral temperature method is based on the weighted average temperature along the contact path (see ISO 6336:21 [41]).
The contact temperature is given by the sum of the internal bulk temperature (temperature of the teeth before entering into contact, almost constant even during the meshing), and the flash temperature (temperature increment along the contact path, fluctuating during the meshing). According to ISO 13989:1 [42] (replaced by ISO 6336:20 [40]), no ranges are given for scuffing safety factors based on the flash temperature method. The integral temperature is given by the sum of the bulk temperature plus the weighted average of the flash temperatures integrated along the contact path. According to ISO 13989:2 [43] (replaced by ISO 6336:21 [41]), the scuffing safety factors based on the integral temperature method are related to scuffing wear, as shown in Table 3.

Table 3.
Range of scuffing safety factors based on the integral temperature method.
In addition, scuffing safety factors are calculated according to DIN 3990, Part 4 [44]:
- Minimum safety for scuffing (integral temperature): 1.8.
- Minimum safety for scuffing (flash temperature): 2.
Standards do not explicitly define this value for precision gears with modules below 1.5. Nonetheless, empirical data indicate that the necessary safety factors are significantly lower compared to those used for gears with larger modules (typically around 0.8 for root and 0.6 for flank). This discrepancy arises because the strength calculation methods and formulae are primarily based on tests conducted with larger gears, leading to overly conservative safety factors when applied to small-module gears [45].
3.2. Safety Factors to Protect Against Micropitting
The micropitting phenomenon follows the same mechanisms as macropitting (or just pitting), but it takes place on a small scale. It results in increased dynamic loads and noise and, if not tackled, it continues to propagate, leading to macropitting or other gear fault mechanisms. Depending on the application, a small degree of micropitting may be tolerated. Following ISO 6336:22 [46], the safety factor against micropitting is given by the ratio of the minimum lubricant film thickness in the contact area and the permissible lubricant film thickness in the contact area. Unfortunately, the ISO provides only guidelines for the safety factor , but no numerical values are given. A technical report [47] based on the values reported in ISO 6336:22, identified the safety factor ranges shown in Table 4.

Table 4.
Safety factors to protect against micropitting.
3.3. Safety Factors to Protect the Hardened Layer
Surface-hardened gears are employed in high-power transmission. The thermal treatment improves the durability and the bending strength of gear teeth. The hardening depth is of utmost importance, and if it is not sufficient, cracks might develop at the transition between the hardened layer and the gear core. The DNVGL-CG-0036 [48] (which replaces DNV 41.2), implemented in KISSsoft®, does not provide any indication of safety factor values or ranges.
3.4. Flank Fracture Safety Factors
Tooth flank fracture is a critical fatigue failure mode in gears, characterized by crack initiation beneath the flank surface. These subsurface cracks typically result from shear stresses induced by Hertzian contact on the flanks. According to ISO/DTS 6336-4 [49], a minimum safety factor of SFF (min ≥ 1.2) should be applied when detailed calculations are feasible (i.e., using Method A). However, if the analysis involves uncertainties—such as rough estimations of hardness or residual stress depth profiles, as in Method B—a higher safety factor is recommended to account for these approximations.
3.5. Flank and Root Safety Factors
Determining the required safety factors for tooth root and flank strength is a crucial part of gear design, especially for applications such as industrial gear units, vehicles, and presses. However, the DIN 3990 and ISO 6336 standards provide limited guidance on this aspect. According to DIN 3990, Part 11 [50], which pertains to industrial gear units, the following minimum safety factors are recommended:
Flank safety: 1.0.
Root safety: 1.4.
The AGMA 6006 [51] guideline, which applies to gear systems in wind turbines, states that for calculations based on ISO 6336, a minimum root safety factor (SFmin) of 1.56 should be used. In contrast, for AGMA-based calculations, an SFmin of 1.0 is considered adequate. This aligns with our observations that AGMA-based evaluations typically yield lower root safety factors compared to those calculated using the ISO standard [45].
4. Data-Driven Neural Network Model
In this section, a neural network-based causal model has been proposed in order to obtain a digital twin for gear safety factor estimation. Such a mode is composed of a shallow feed-forward neural network [7] (with setting parameters shown in Table 5), which can be described as a series of functional transformations of the input features by using nonlinear basic functions with adaptive parameters, which can be expressed as:
where is a nonlinear activation function, and are the basis functions, which depend on parameters, and must be adjusted along with the neural network coefficients during training. The schema of the proposed causal model is depicted in Figure 3, whilst the input and output parameters are reported in Table 1. In particular, the feed-forward shallow neural network is composed of three layers: an input layer with 7 units, and a hidden layer with 21 units using a sigmoidal activation function and an output layer with 11 units. The neural network parameters have been adjusted during a training procedure, in which the half sum-of-square error function is minimized by the use of the stochastic gradient descent algorithm [52]. The minimized error function is:
where is the number of training points, are the neural network output values, and are the corresponding known target values. 157,500 values for each input and output feature were generated by the KISSsoft® model; half of them were used for training whilst the remaining portion was used for validation. The number of units in the hidden layer that better approximate the safety factors were obtained via an iterative procedure. Such a procedure consists of training a series of models with different numbers of units in the hidden layer; the optimal hidden layer unit number is the one that minimizes the error. Due to the stochastic nature of the gradient descent algorithm, each model is trained 20 times and the training that gives the minimum error is selected. In this work, 19 different models have been taken into account for a total of 380 training processes. Figure 4 depicts the result of this analysis. It is possible to see that the minimum error is obtained with a model composed of 21 units in the hidden layer. This causal model has been selected as a data-driven digital twin.

Table 5.
Setting parameters of considered neural network, feed-forward neural network.
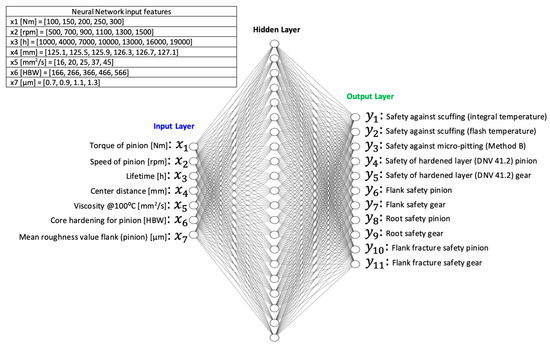
Figure 3.
Causal model schema.
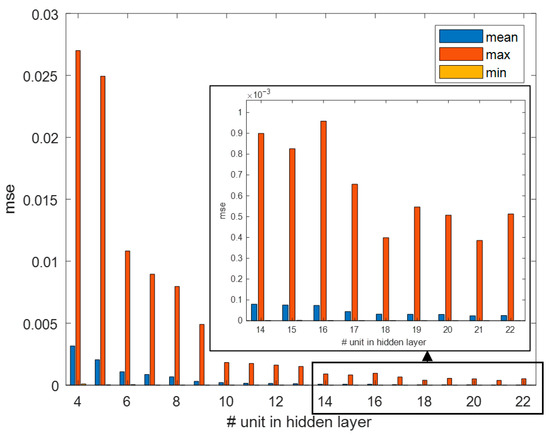
Figure 4.
Mean square error of units in the hidden layer.
5. Neural Network Results
For testing the accuracy of the NN applied to DTs of gearboxes, we first created a huge database by varying different features of a simple gearbox, then we employed this dataset for training an NN, and finally, we compared the performance of this NN concerning the standards. We chose a pair of identical gears as representative of a simple gearbox. Then we selectively varied seven of its features to create a database of 4400 different gear pairs/operation conditions by using KISSsoft®. The seven parameters were pinion torque, pinion speed, lifetime, center distance, oil viscosity (at 100 °C), pinion core hardening, and pinion mean roughness value flank. For each combination of the 7 features, we stored the value of 11 safety factors/parameters, calculated by the software through S-standards, namely, safety against scuffing (integral temperature), safety against scuffing (flash temperature), safety against micropitting, pinion safety of hardened layer, gear safety of hardened layer, pinion flank safety, gear flank safety, pinion root safety, gear root safety, pinion flank fracture safety, and gear flank fracture safety. Then, we took half of the produced database for the training of supervised NNs, whereas the second half was kept for testing. The data were scaled and standardized, and different NNs were trained: the NN with one 20-unit hidden layer was proved to provide the best performance. For the test, we first used the 7 features of the second half of the database as an input for the NN and we compared its output with the stored value of the 11 safety factors/parameters for each case (i.e., a combination of the 7 features). In total, there are seven cases; in each case, one parameter is varied within a specific range while the others remain fixed at their nominal values, as defined in Table 6.

Table 6.
Nominal values of seven parameters and the range of each parameter at a specific case.
Figure 5 illustrates the predicted safety factors (in red) against the KISSsoft® reference values (in black) across a range of input torque from 100 to 300 N·m. Each subplot corresponds to a different safety factor considered in the study. A consistent trend is observed across all the plots: the neural network can closely replicate the decreasing behavior of the safety factors as the pinion torque increases. The agreement between the two curves is particularly high for safety factors related to root and flank strength, as well as the DNV 4.1.2 hardened layer assessments, indicating that the neural network has successfully learned the relationship between the operating conditions and these mechanical indicators. However, a slight deviation is noticeable for more complex failure modes, i.e., micropitting and scuffing, where the red curve (neural network) diverges marginally from the KISSsoft® predictions. This divergence aligns with the error analysis presented earlier and highlights the greater sensitivity of these safety factors to nuanced parameter variations, which may require denser or more diverse training data to capture fully. Nonetheless, the overall strong agreement across the board confirms the capability of data-driven models to emulate standard-based digital twins with high accuracy and efficiency, especially when well-trained on a wide and representative dataset.
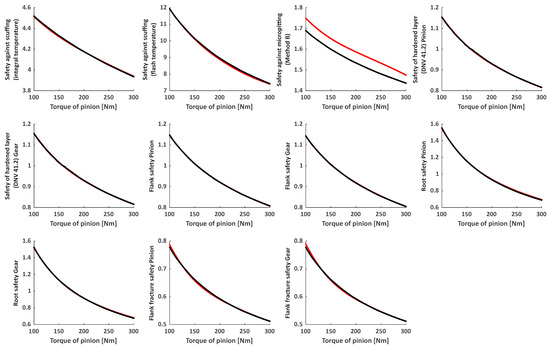
Figure 5.
Predicted vs. reference values of safety parameters as a function of pinion torque; Case 1: torque of pinion [Nm] = [min 100, max 300]; – Neural network model, – KISSsoft®.
To evaluate the performance of the trained neural network, two error metrics were calculated for each safety factor: the maximum error and the root averaged squared error (RMS). As shown in Figure 6, the highest errors are observed for safety against scuffing (flash temperature) and safety against micropitting (Method B). These metrics exhibit a maximum error of approximately 0.0833 and 0.0596, respectively, suggesting that the model struggles to accurately capture the complex interactions influencing these failure modes. In contrast, the safety of the hardened layer and flank safety factor for both pinion and gear show excellent predictive accuracy, with errors remaining below 0.01. Flank fracture and root safety factors exhibit moderate accuracy, with relatively low RMS values and acceptable maximum errors. These results indicate that while the neural network performs well for most safety factors, specific modes such as micropitting and scuffing may require enhanced input representation, additional training data, or tailored network tuning to improve accuracy.
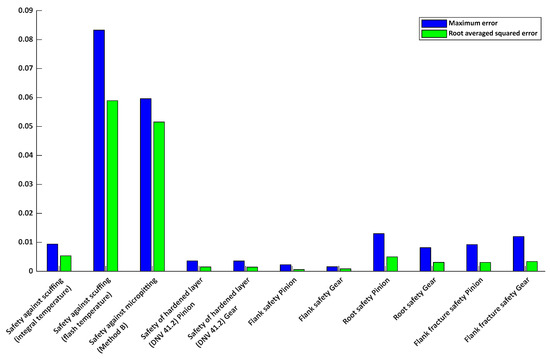
Figure 6.
Comparison of prediction accuracy for various gear safety factors using the neural network model of Case 1; ● RMS of error, ● Maximum error.
The lower prediction accuracy for safety factors related to micropitting and scuffing is attributed to the complex, multi-scale nature of these failure mechanisms and their sensitivity to subtle input variations, as shown in Figure 5 and Figure 6. Additionally, limited representation of critical cases in the training dataset likely contributes to the higher prediction errors, which future work aims to address through targeted dataset expansion. Therefore, while the proposed approach demonstrates strong predictive capabilities, its accuracy is inherently limited by the complexity of certain failure mechanisms and the representativeness of the training data.
The remaining six safety metrics included in Appendix A—speed of pinion, lifetime, center distance, viscosity at 100 °C, core hardening for pinion, and mean roughness value flank (pinion)—further confirm the predictive strength of the neural network model.
6. Conclusions
This study explored the potential of neural networks as predictive tools for digital twins of gearboxes, using a comprehensive dataset of 4400 gear pair configurations generated via KISSsoft® under ISO-based standards. By varying seven key input parameters and evaluating eleven safety factors for each case, we created a robust dataset that enabled supervised training and testing of multiple NN architectures. Although this study focused on spur gears to demonstrate the feasibility of the proposed neural network approach, the methodology is inherently extendable to other gear types including helical, bevel, and planetary systems.
The trained network showed strong predictive capability, particularly for the safety of the hardened layer and flank safety—both for pinion and gear. More complex failure modes such as scuffing (flash temperature) and micropitting exhibited higher maximum errors, reaching 0.0833 and 0.0596, respectively, indicating that these outputs are more sensitive to subtle variations in the input space and may benefit from additional training data or targeted model refinement. Case-specific evaluations (e.g., Case 1: varying pinion torque from 100 to 300 Nm) demonstrated the NN’s ability to replicate the nonlinear trends of safety factor degradation under increasing load. The close match between the NN predictions and KISSsoft® outputs underscores the network’s capacity to generalize from training data and capture complex interactions between design parameters and mechanical performance.
The model achieved very low root averaged squared errors (RMSs) and maximum errors for most outputs, including safety against scuffing (integral temperature), with a maximum error of 0.0085 and RMS of 0.0039; safety of the hardened layer (DNV 41.2) for pinion and gear, with maximum errors of 0.0057 and 0.0046, and RMS of 0.0022 each; and flank safety for pinion and gear, with maximum errors of 0.0032 and 0.0024, and RMS of 0.0015 and 0.0012, respectively. Root safety and flank fracture safety factors also showed good accuracy, with root safety (pinion and gear) having maximum errors of 0.0153 and 0.0106, and flank fracture safety (pinion and gear) with maximum errors of 0.0117 and 0.0134. The more complex phenomena—safety against scuffing (flash temperature) and micropitting—had the highest errors, with maximum errors of 0.0833 and 0.0596, and RMS values of 0.0584 and 0.0517, respectively, indicating their higher sensitivity to input variation.
A key limitation of the current study is that the neural network models are trained based on simulation data generated via KISSsoft® according to ISO standards. Therefore, it should be noted that the model is currently trained on simulation data. While this approach enables systematic exploration of system dynamics and potential faults, it may not encompass all the uncertainties present in real operating conditions. For predictive maintenance applications, future work will focus on validating and adapting the model using experimental data to ensure its reliability and effectiveness in real-world scenarios. The study validates the use of data-driven models as efficient surrogates for standard-based simulations in gearbox design and health assessment. The integration of NN-based prediction into digital twin frameworks enables faster, scalable, and cost-effective tools for real-time diagnostics and prognostics.
Author Contributions
Conceptualization, A.Z., F.P. and M.M.; methodology, A.Z., F.P. and M.M.; software, A.Z. and M.M.; validation, A.Z., F.P. and M.M.; formal analysis, A.Z., F.P. and M.M.; investigation, A.Z., F.P. and M.M.; resources, A.Z. and F.P.; data curation, A.Z. and M.M.; writing—original draft preparation, A.Z. and M.M.; writing—review and editing, A.Z., F.P. and M.M.; visualization, A.Z., F.P. and M.M.; supervision, A.Z. and F.P.; project administration, A.Z. and F.P.; funding acquisition, F.P. All authors have read and agreed to the published version of the manuscript.
Funding
Financial support was provided by the “SUSTAINABLE MOBILITY CENTER (Centro Nazionale per la Mobilità Sostenibile—CNMS)”, Spoke 13 “Electric Traction and Batteries (ETB)” project code CN00000023—CUP E93C22001070001.
Data Availability Statement
The data presented in the current study are available on request from the corresponding author.
Conflicts of Interest
The authors declare no conflict of interest.
Appendix A. Error Analysis of Neural Network Predictions and Influence of Parameters on Safety Factors
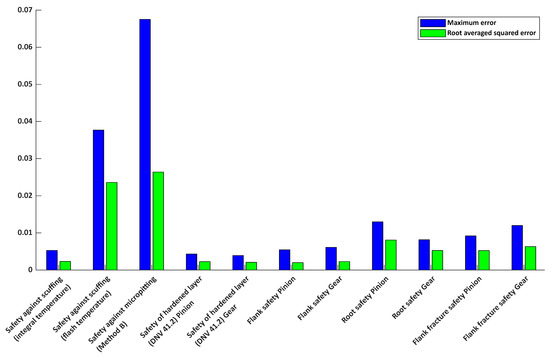
Figure A1.
Comparison of prediction accuracy for various gear safety factors using the neural network model of Case 2; ● RMS of error, ● Maximum error.
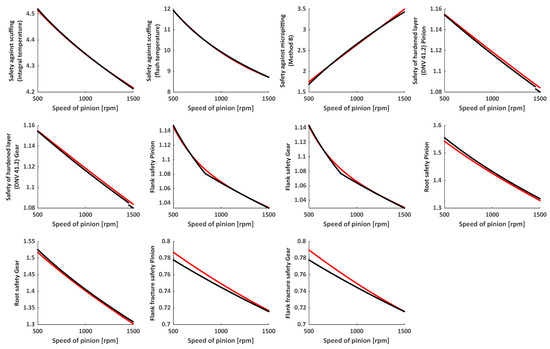
Figure A2.
Predicted vs. reference values of safety parameters as a function of pinion speed; Case 2: Speed of pinion [rpm] = [min 500, max 1500]; – Neural network model, – KISSsoft®.
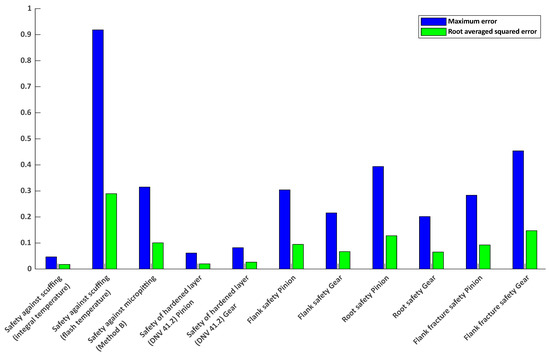
Figure A3.
Comparison of prediction accuracy for various gear safety factors using the neural network model of Case 3; ● RMS of error, ● Maximum error.
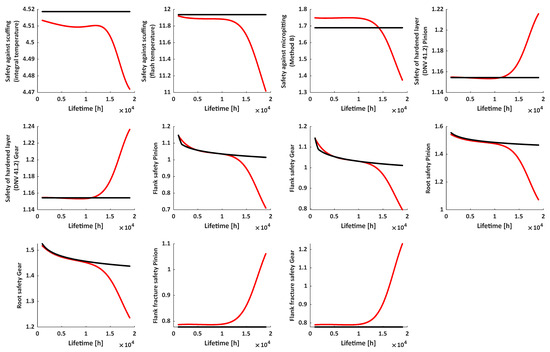
Figure A4.
Predicted vs. reference values of safety parameters as a function of lifetime; Case 3: lifetime [h] = [min 1000, max 19000]; – Neural network model, – KISSsoft®.
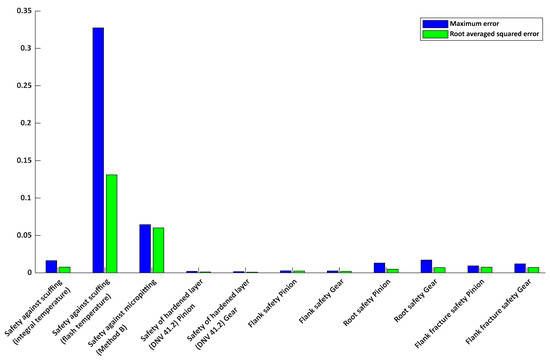
Figure A5.
Comparison of prediction accuracy for various gear safety factors using the neural network model of Case 4; ● RMS of error, ● Maximum error.
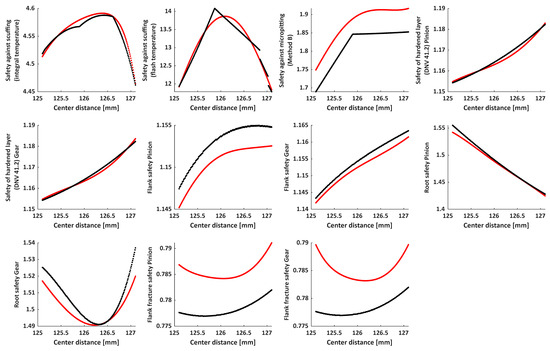
Figure A6.
Predicted vs. reference values of safety parameters as a function of center distance; Case 4: center distance [mm] = [min 125.1, max 127.1]; – Neural network model, – KISSsoft®.
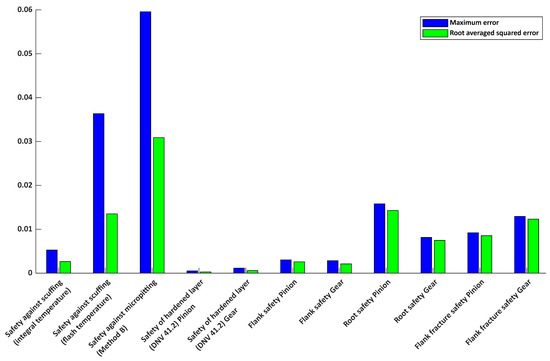
Figure A7.
Comparison of prediction accuracy for various gear safety factors using the neural network model of Case 5; ● RMS of error, ● Maximum error.
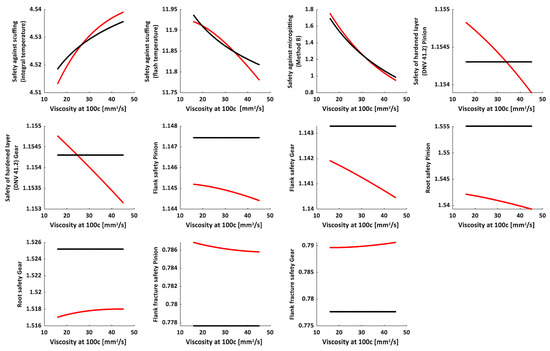
Figure A8.
Predicted vs. reference values of safety parameters as a function of viscosity; Case 5: viscosity at 100 [mm2/s] = [min 16, max 45]; – Neural network model, – KISSsoft®.
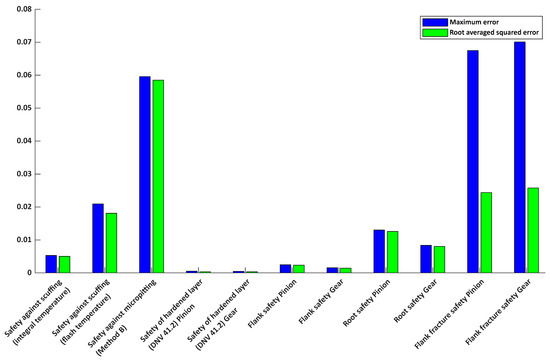
Figure A9.
Comparison of prediction accuracy for various gear safety factors using the neural network model of Case 6; ● RMS of error, ● Maximum error.
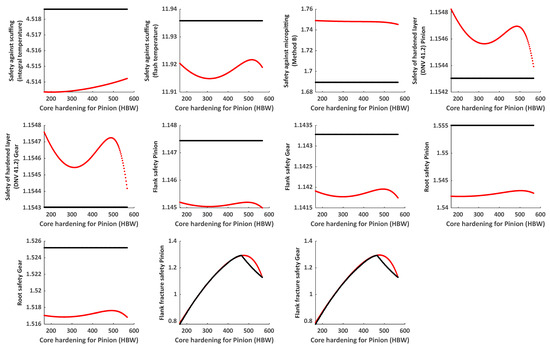
Figure A10.
Predicted vs. reference values of safety parameters as a function of pinion core hardening; Case 6: core hardening for pinion [HBW] = [min 166, max 566]; – Neural network model, – KISSsoft®.
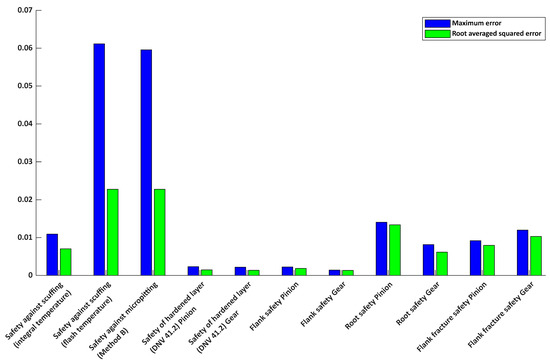
Figure A11.
Comparison of prediction accuracy for various gear safety factors using the neural network model of Case 7; ● RMS of error, ● Maximum error.
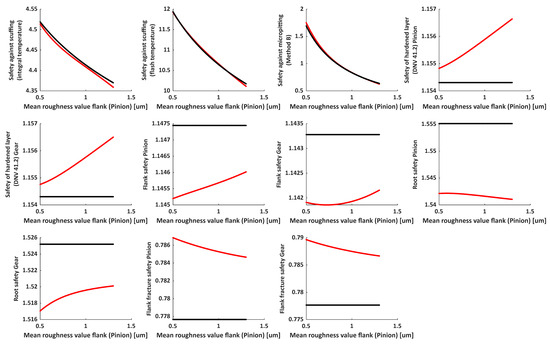
Figure A12.
Predicted vs. reference values of safety parameters as a function of pinion mean roughness; Case 7: mean roughness value of flank (pinion) [um] = [min 0.5, max 1.3]; – Neural network model, – KISSsoft®.
References
- Randall, R.B. The application of fault simulation to machine diagnostics and prognostics. Int. J. Acoust. Vib. 2009, 14, 81–89. [Google Scholar] [CrossRef]
- Molaie, M.; Samani, F.S.; Zippo, A.; Iarriccio, G.; Pellicano, F. Spiral bevel gears: Bifurcation and chaos analyses of pure torsional system. Chaos Solitons Fractals 2023, 177, 114179. [Google Scholar] [CrossRef]
- Zippo, A.; Iarriccio, G.; Bergamini, L.; Colombini, E.; Veronesi, P.; Pellicano, F. Fluid–Structure Interaction of a thin cylindrical shell filled with a non-Newtonian fluid. J. Fluids Struct. 2023, 117, 103829. [Google Scholar] [CrossRef]
- Pellicano, F.; Zippo, A.; Iarriccio, G.; Barbieri, M. Experimental study on nonlinear random excitation. In Proceedings of the International Conference of the Italian Association of Design Methods and Tools for Industrial Engineering, Modena, Italy, 9–10 September 2019; pp. 637–648. [Google Scholar] [CrossRef]
- Iarriccio, G.; Zippo, A.; Pellicano, F.; Barbieri, M. Resonances and nonlinear vibrations of circular cylindrical shells, effects of thermal gradients. Proc. Inst. Mech. Eng. Part C J. Mech. Eng. Sci. 2021, 235, 4818–4832. [Google Scholar] [CrossRef]
- Iarriccio, G.; Zippo, A.; Pellicano, F. Asymmetric vibrations and chaos in spherical caps under uniform time-varying pressure fields. Nonlinear Dyn. 2022, 107, 313–329. [Google Scholar] [CrossRef]
- Bishop, C.M.; Nasrabadi, N.M. Pattern Recognition and Machine Learning; Springer: Berlin/Heidelberg, Germany, 2006; Volume 4, p. 738. Available online: https://link.springer.com/book/9780387310732 (accessed on 30 July 2025).
- Liu, M.; Fang, S.; Dong, H.; Xu, C. Review of digital twin about concepts, technologies, and industrial applications. J. Manuf. Syst. 2021, 58, 346–361. [Google Scholar] [CrossRef]
- Shigley, J.E.; Mischke, C.R. Standard Handbook of Machine Design; McGraw-Hill: New York, NY, USA, 1996; Available online: https://lccn.loc.gov/95050600 (accessed on 30 July 2025).
- Molaie, M.; Zippo, A.; Pellicano, F. Chaotic dynamics of spiral bevel gears. Int. J. Non-Linear Mech. 2025, 175, 105098. [Google Scholar] [CrossRef]
- Zippo, A.; Molaie, M.; Pellicano, F. Nonlinear Dynamics of a Coupled Electromechanical Transmission. Vibration 2025, 8, 34. [Google Scholar] [CrossRef]
- Radzevich, S.P.; Dudley, D.W. Handbook of Practical Gear Design; CRC Press: Boca Raton, FL, USA, 1994. [Google Scholar]
- He, B.; Liu, L.; Zhang, D. Digital twin-driven remaining useful life prediction for gear performance degradation: A review. J. Comput. Inf. Sci. Eng. 2021, 21, 030801. [Google Scholar] [CrossRef]
- Bühler, M.; Steiner, B.; Bednar, T. November. Digital Twin applications using the SIMULTAN data model and Python. In IOP Conference Series: Earth and Environmental Science; IOP Publishing: Bristol, UK, 2022; Volume 1101, p. 082015. [Google Scholar] [CrossRef]
- Lehner, D.; Pfeiffer, J.; Tinsel, E.F.; Strljic, M.M.; Sint, S.; Vierhauser, M.; Wortmann, A.; Wimmer, M. Digital twin platforms: Requirements, capabilities, and future prospects. IEEE Softw. 2021, 39, 53–61. [Google Scholar] [CrossRef]
- Alonso, R.; Borras, M.; Koppelaar, R.H.; Lodigiani, A.; Loscos, E.; Yöntem, E. SPHERE: BIM digital twin platform. Proceedings 2019, 20, 9. [Google Scholar] [CrossRef]
- Ashtari Talkhestani, B.; Jung, T.; Lindemann, B.; Sahlab, N.; Jazdi, N.; Schloegl, W.; Weyrich, M. An architecture of an intelligent digital twin in a cyber-physical production system. at-Automatisierungstechnik 2019, 67, 762–782. [Google Scholar] [CrossRef]
- Liu, C.; Sun, S.; Li, Q. The Impact of Gear Meshing in High-Speed EMU Gearboxes on Fatigue Strength of the Gearbox Housing. Technologies 2025, 13, 311. [Google Scholar] [CrossRef]
- Yoo, K.H.; Leung, C.K.; Nasridinov, A. Big Data Analysis and Visualization: Challenges and Solutions. Appl. Sci. 2022, 12, 8248. [Google Scholar] [CrossRef]
- Kim, J.; Kim, J.; Kim, H. A Study on Gear Defect Detection via Frequency Analysis Based on DNN. Machines 2022, 10, 659. [Google Scholar] [CrossRef]
- Thakkar, U.; Chaoui, H. Remaining Useful Life Prediction of an Aircraft Turbofan Engine Using Deep Layer Recurrent Neural Networks. Actuators 2022, 11, 67. [Google Scholar] [CrossRef]
- Qu, Y.; He, M.; Deutsch, J.; He, D. Detection of Pitting in Gears Using a Deep Sparse Autoencoder. Appl Sci. 2017, 7, 515. [Google Scholar] [CrossRef]
- Xiao, D.; Ding, J.; Li, X.; Huang, L. Gear Fault Diagnosis Based on Kurtosis Criterion VMD and SOM Neural Network. Appl. Sci. 2019, 9, 5424. [Google Scholar] [CrossRef]
- Kim, K.I.; Lee, K.M. Convolutional Neural Network-Based Gear Type Identification from Automatic Identification System Trajectory Data. Appl. Sci. 2020, 10, 4010. [Google Scholar] [CrossRef]
- Chen, L.; Yan, N.; Yang, H.; Zhu, L.; Zheng, Z.; Yang, X.; Zhang, X. A Data Augmentation Method for Deep Learning Based on Multi-Degree of Freedom (DOF) Automatic Image Acquisition. Appl. Sci. 2020, 10, 7755. [Google Scholar] [CrossRef]
- Lin, S.L. Application of Machine Learning to a Medium Gaussian Support Vector Machine in the Diagnosis of Motor Bearing Faults. Electronics 2021, 10, 2266. [Google Scholar] [CrossRef]
- Ham, S.; Han, S.Y.; Kim, S.; Park, H.J.; Park, K.J.; Choi, J.H. A Comparative Study of Fault Diagnosis for Train Door System: Traditional Versus Deep Learning Approaches. Sensors 2019, 19, 5160. [Google Scholar] [CrossRef] [PubMed]
- The MathWorks, Inc. MATLAB Version: 9.13.0 (R2022b). 2022. Available online: https://www.mathworks.com (accessed on 30 July 2025).
- DIN 3962-1:1978-08; Tolerances for Cylindrical Gear Teeth; Tolerances for Deviations of Individual Parameters. DIN (Deutsches Institut für Normung), Deutsches Institut Fur Normung: Berlin, Germany, 1978.
- DIN 3962-2:1978-08; Tolerances for Cylindrical Gear Teeth; Tolerances for Tooth Trace Deviations. DIN (Deutsches Institut für Normung), Deutsches Institut Fur Normung: Berlin, Germany, 1978.
- DIN 3962-3:1978-08; Tolerances for Cylindrical Gear Teeth; Tolerances for Pitch-span Deviations. DIN (Deutsches Institut für Normung), Deutsches Institut Fur Normung: Berlin, Germany, 1978.
- ISO 3448:1992; Industrial Liquid Lubricants—ISO Viscosity Classification. International Organization for Standardization: Geneva, Switzerland, 1992.
- ISO 3104:2023; Petroleum Products—Transparent and Opaque Liquids—Determination of Kinematic Viscosity and Calculation of Dynamic Viscosity. International Organization for Standardization: Geneva, Switzerland, 2023.
- ISO 2909:2002; Petroleum Products—Calculation of Viscosity Index from Kinematic Viscosity. International Organization for Standardization: Geneva, Switzerland, 2002.
- ISO 12185:2024; Crude Petroleum, Petroleum Products and Related Products—Determination of Density—Laboratory Density Meter with an Oscillating U-Tube Sensor. International Organization for Standardization: Geneva, Switzerland, 2024.
- ISO 2592:2017; Petroleum and Related Products—Determination of Flash and Fire Points—Cleveland Open Cup Method. International Organization for Standardization: Geneva, Switzerland, 2017.
- ISO 3016:2019; Petroleum and Related Products from Natural or Synthetic Sources—Determination of Pour Point. International Organization for Standardization: Geneva, Switzerland, 2019.
- ISO 53:1998; Cylindrical Gears for General and Heavy Engineering—Standard Basic Rack Tooth Profile. International Organization for Standardization: Geneva, Switzerland, 1998.
- Vullo, V. Gears: Analysis of Load Carrying Capacity and Strength Design; Springer Nature: London, UK, 2020; Volume 2. [Google Scholar] [CrossRef]
- ISO/TS 6336-20; Calculation of Load Capacity of Spur and Helical Gears—Part 20: Calculation of Scuffing Load Capacity—Flash Temperature Method. International Organization for Standardization: Geneva, Switzerland, 2017.
- ISO/TS 6336-21; Calculation of Load Capacity of Spur and Helical Gears Part 21: Calculation of Scuffing Load Capacity—Integral Temperature Method. International Organization for Standardization: Geneva, Switzerland, 2017.
- ISO/TR 13989-1; Calculation of Scuffing Load Capacity of Cylindrical, Bevel and Hypoid Gears Part 1: Flash Temperature Method. International Organization for Standardization: Geneva, Switzerland, 2000.
- ISO/TR 13989-2; Calculation of Scuffing Load Capacity of Cylindrical, Bevel and Hypoid Gears Part 2: Integral Temperature Method. International Organization for Standardization: Geneva, Switzerland, 2000.
- DIN 3990-41; Calculation of Load Capacity of Cylindrical Gears; Application Standard for Vehicle Gears. Deutsches Institut Fur Normung: Berlin, Germany, 1990.
- KISSsoft Manual, KISSsoft AG, Version 2022. Available online: https://www.kisssoft.com/en/products/technical-description (accessed on 3 July 2025).
- ISO/TS 6336-22:2018; Calculation of Load Capacity of Spur and Helical Gears. Part 22: Calculation of Micropitting Load Capacity. International Organization for Standardization: Geneva, Switzerland, 2018.
- Olson, R.; Michaud, M.; Keller, J. Case Study of ISO/TS 6336-22 Micropitting Method (No. NREL/CP-5000-76776); National Renewable Energy Lab. (NREL): Golden, CO, USA, 2020. [Google Scholar]
- DNVGL-CG-0036; Calculation of Gear Rating for Marine Transmissions, Classification Note. Det Norske Veritas: Høvik, Norway, 2015.
- ISO/TS 6336-4; Calculation of Load Capacity of Spur and Helical Gears Part 4: Calculation of Tooth Flank Fracture Load Capacity. International Organization for Standardization: Geneva, Switzerland, 2024.
- DIN 3990-11; Calculation of Load Capacity of Cylindrical Gears—Application Standard for Industrial Gears. Deutsches Institut Fur Normung: Berlin, Germany, 1989.
- AGMA 6006; Standard for Design and Specifications of Gearboxes for Wind Turbines. American Gear Manufacturers Association: Alexandria, VA, USA, 2020.
- Rumelhart, D.E.; Hinton, G.E.; Williams, R.J. Learning Internal Representations by Error Propagation; Technical Report; Institute for Cognitive Science, California University of San Diego: La Jolla, CA, USA, 1985. [Google Scholar]
Disclaimer/Publisher’s Note: The statements, opinions and data contained in all publications are solely those of the individual author(s) and contributor(s) and not of MDPI and/or the editor(s). MDPI and/or the editor(s) disclaim responsibility for any injury to people or property resulting from any ideas, methods, instructions or products referred to in the content. |
© 2025 by the authors. Licensee MDPI, Basel, Switzerland. This article is an open access article distributed under the terms and conditions of the Creative Commons Attribution (CC BY) license (https://creativecommons.org/licenses/by/4.0/).