Article

Pilot Study: Effects of High-Intensity Training on Gait Symmetry and Locomotor Performance in Neurodivergent Children

by
Noah D. Chernik
1,2,*,
Melody W. Young
3,4,
Reuben N. Jacobson
1,
Stratos J. Kantounis
1,2,
Samantha K. Lynch
1,
James Q. Virga
1,5,
Matthew J. Cannata
1,6,
Hannah M. English
1,
Pranav Krish
1,
Anand Kanumuru
1,
Alexander Lopez
7,8 and
Michael C. Granatosky
1,2,*
1
Department of Anatomy, New York Institute of Technology College of Osteopathic Medicine, Old Westbury, NY 11545, USA
2
Center for Biomedical Innovation, New York Institute of Technology College of Osteopathic Medicine, Old Westbury, NY 11545, USA
3
Department of Biology, Duke University, Durham, NC 27708, USA
4
Department of Biomedical Engineering, Duke University, Durham, NC 27708, USA
5
Neurosurgical Oncology Unit, Surgical Neurology Branch, National Institutes of Neurological Disorders and Stroke, National Institutes of Health, Bethesda, MD 20894, USA
6
DeMatteis Center for Cardiac Research and Education, Catholic Health St Francis Hospital & Heart Center, Roslyn, NY 11576, USA
7
School of Health Professions, New York Institute of Technology College of Osteopathic Medicine, Old Westbury, NY 11545, USA
8
Inclusive Sports and Fitness, Holbrook, NY 11741, USA
*
Authors to whom correspondence should be addressed.
Symmetry 2025, 17(7), 1073; https://doi.org/10.3390/sym17071073 (registering DOI)
Submission received: 30 May 2025 / Revised: 24 June 2025 / Accepted: 1 July 2025 / Published: 6 July 2025
(This article belongs to the Special Issue Symmetry and Asymmetry in Biomechanics and Gait Mechanics)

Abstract

Neuromuscular gait deficits in children with autism spectrum disorder (ASD) are often overlooked. High-intensity training protocols may improve running performance, but their efficacy in pediatric populations is underexplored. This study evaluates the impact of a high-intensity running protocol on locomotor performance in neurotypical and neurodivergent children (children with ASD). Spatiotemporal gait characteristics (speed, stride frequency, stride length, and duty factor), gait symmetry (symmetry ratio), and kinematics were assessed for ten neurodivergent children (10–15 years old) during a 15 m sprint. Locomotor costs (cost of locomotion, transport, and locomotion per stride) were analyzed in six neurodivergent participants (11–14 years old) via open-flow respirometry during treadmill running. Participants completed a 5–12 week, twice-weekly program; neurotypical participants served as a control group. Neurodivergent and neurotypical children exhibited baseline differences in spatiotemporal variables. Following training, neurodivergent participants demonstrated statistically significant improvements in spatiotemporal metrics and locomotor costs. Differences in symmetry between the two groups were not present pre- or post-program. These findings highlight the efficacy of high-intensity running programs in improving sensorimotor function and coordination in children with ASD. This program provides valuable insights into gross motor rehabilitation for neurodivergent children, supporting its potential as an effective intervention.

1. Introduction

Autism Spectrum Disorder (ASD) is a neurodevelopmental condition primarily known for its impact on social interaction and communication [1,2]. However, ASD is also associated with a range of neuromuscular impairments that lead to functional and physiological deficits, such as motor skill difficulties, gait abnormalities, sensory processing issues, and hypotonia [2,3,4,5,6,7]. Specifically, children with ASD may exhibit motor control challenges, including impairments in rhythm and timing, bilateral coordination, and postural control [6,8,9,10,11]. When running, these children demonstrate reduced range of motion in the frontal, sagittal, and transverse planes, shorter stride lengths, and increased vertical displacement of their center of mass, as well as lateral leg movements [4,9,10,11,12,13,14]. Additionally, children with ASD exhibit higher gait asymmetry, especially in the primary spatiotemporal parameters of stride length and stride duration [9,12,15,16]. Higher levels of gait asymmetry create higher metabolic costs of locomotion, creating more difficulty for these individuals to keep up with their neurotypical (NT) peers [17]. Furthermore, these higher metabolic costs of locomotion contribute to accelerated fatigue. In turn, this contributes to reduced motor coordination and even higher levels of gait asymmetry, which has been shown to increase as individuals reach higher levels of fatigue [18,19,20].
Studies using both direct [21] and indirect [22,23,24,25] measures have shown significant reductions in cardiorespiratory fitness and increased locomotor costs in individuals with ASD. These higher locomotor costs may contribute to a lack of motivation to engage in physical activity, leading to reduced participation [26,27]. This decreased physical activity can, in turn, increase the risk of obesity, which is twice as common in individuals with ASD [26,28].
Children with ASD require ongoing interventions to ensure their development aligns with that of NT peers [29,30,31]. As children gain proficiency in foundational motor skills, they can explore new ways to engage with their peers through play [32]. These experiences help strengthen their skill sets and advance their abilities through practice and exploration [32,33]. However, children with ASD face barriers such as social isolation and motor difficulties, limiting their ability to develop and refine motor skills [8,30,34,35,36,37,38,39,40]. They may also experience comorbid conditions such as sensory processing disorders and dyspraxia [36,41]. Over time, these children may develop inefficient movement patterns that become ingrained, making it more challenging to correct maladaptive behaviors due to impaired sensorimotor processing and difficulty learning new skills [42,43].
Previous research has demonstrated the benefits of group exercise programs for individuals with ASD, with such interventions improving physical fitness and motor abilities [44,45,46]. One promising intervention is High-Intensity Interval Training (HIIT), which alternates short bursts of intense exercise with brief rest or low-intensity periods [47]. High-Intensity Interval Training has been shown to improve cardiovascular fitness, burn calories, and induce acute changes in running kinematics, spatiotemporal factors, and overall performance [48,49,50]. High-intensity training has been the focus of many studies involving children [51,52,53], including individuals with special education needs (e.g., ASD, ADHD, cerebral palsy) [54,55,56], with a wide range of training durations, from a few weeks to year-long programs [55,56,57]. The structured nature of HIIT offers a promising approach for addressing motor control deficits in individuals with ASD, herein neurodivergent (ND) [51], and these programs have also shown potential for implementation in schools [57]. However, few studies have specifically explored the effectiveness of high-intensity running training on improving gait in the ND population.
Given these considerations, we aim to assess the efficacy of a high-intensity running program by addressing the following questions:
Question 1:
Do the metabolic costs of movement, running kinematics, spatiotemporal gait characteristics, and symmetry of NT and ND children differ at baseline?
Hypothesis 1:
We expect to find significant differences in spatiotemporal gait characteristics, higher energetic costs, and higher levels of asymmetry in the ND group compared to the NT group.
Question 2:
Does a high-intensity running program improve running performance and reduce metabolic costs in ND children?
Hypothesis 2:
We expect to see improvements in spatiotemporal characteristics such as speed, as well as decreased levels of asymmetry and metabolic costs.
Question 3:
Can a high-intensity running program enhance the performance of ND children, enabling them to achieve gait characteristics and metabolic costs similar to those of NT children?
Hypothesis 3:
We expect to see a closing of differences between the two groups, but the ND group will still exhibit different gait characteristics and higher metabolic costs compared to NT children.

2. Materials and Methods

2.1. Subjects

We included a total of 27 individuals (aged 6–15 years) in this study. We conducted all training and trials at Inclusive Sports and Fitness (ISF; 5004 Veterans Memorial Hwy, Holbrook, NY 11741, USA). We divided participants into an NT group (individuals without clinical diagnoses of developmental pathologies; n = 15) and an ND group (individuals with a clinical diagnosis of ASD; n = 12), as shown in Table 1. All ND participants were classified as Level One severity [1] and did not report any lower limb mobility or strength pathologies. To participate in the study, the ND children were required to provide documentation of a clinical diagnosis of Level One severity ASD.
We conducted two interrelated experiments to assess the efficacy of a high-intensity running protocol (HIIT; details on training provided below) on both spatiotemporal/kinematic changes and energetic efficiency. However, the participant cohorts differed between the two interrelated experiments (Supplemental Tables S1 and S2). In both studies, we used the NT group as a control and excluded them from the training program. The New York Institute of Technology College of Osteopathic Medicine Internal Review Board approved this study (Protocol: BHS–1559).
We excluded individuals with lower limb strength or mobility pathologies during participant recruitment. All ND children adhered to a minimum five-week training intervention, attending two one-hour sessions per week. For the metabolic energy study, we ensured participants met the same criteria but were also free of metabolic or cardiorespiratory pathologies that could interfere with metabolic testing. Additionally, we excluded individuals who could not tolerate wearing the respirometry mask for the full duration of all metabolic tests.

2.2. High-Intensity Interval Training (HIIT) Protocol

We employed a running protocol that utilized motorized high-speed treadmill training from Tuff Tread, Inc. (Conroe, TX, USA) and included participants with limited treadmill experience. We provided verbal and demonstrative instructions to familiarize participants with the treadmill and safety gear. Sessions, lasting six to twenty weeks, occurred twice weekly for one hour, depending on individual program compliance. Children who were able to remain in the protocol for longer than six weeks were encouraged to continue, and final assessments were conducted once they were no longer able to adhere to the twice-weekly training sessions. The protocol, based on Beau Chavez’s training program (UbrZati, Melbourne, FL, USA), focused on high-intensity, short-duration running. After a dynamic warmup, including stretching, running/walking, and plyometrics, participants begin their HIIT protocol. The speed of each interval is dictated by the duration and incline and is aimed to be near self-reported maximal efforts. The protocol begins with a 2-minute run at a 5% incline. This is followed by a 1-minute run at a 10% incline and then another 1-minute run at a 15% incline. Next, there are two 30-second runs at a 25% incline. After that, there is a 30-second run at a 28% incline, followed by another 30-second run at a 30% incline. Then, the workout includes six 10-second sprints at a 12% incline. Finally, it concludes with a 3-minute run at an 8% incline.
Prior to the first training session, maximum treadmill intensity was tested in all participants by recording the fastest achievable speed during an eight-second trial at 0% incline. Occupational therapists provided verbal feedback on running posture and form throughout training phases, being mindful of the study protocol and each participant’s neurodevelopment (Supplemental Figure S1). The use of feedback was left to the discretion of the trained occupational therapists. The timing of feedback depended on the participant, but it was typically given between sprint efforts. Corrective exercises and drills were performed at the session’s conclusion if deemed necessary by the occupational therapists. Prior to the session conclusion, occupational therapists guided participants through a series of static stretches. Progression throughout the program was individualized and determined by the supervising occupational therapists. Once a participant appeared to be exerting a sub-maximal effort (i.e., based on heart rate, fatigue in their running form, and communication with the participant), the speed was increased for the next training session.

2.3. Kinematic and Spatiotemporal Testing

We recruited a total of 19 participants for kinematic and spatiotemporal testing [9 NT (6:3 male to female ratio); 10 ND (all male)]. We tested the ND group both before the start of the HIIT protocol (pre-ND) and at the end of the program (post-ND) (program duration ~13.80 ± 6.96 weeks), while we assessed the NT population only once (without any training). The testing required participants to sprint 15 m across grass turf a minimum of five times, with 2 min breaks between each trial. We instructed participants to run as fast as possible without any intentional deceleration until they passed the 15 m mark. We altered these instructions on a per-participant basis to ensure comprehension and compliance.
We captured trials on a single GoPro Hero10 (GoPro, San Mateo, CA, USA) at 120 Hz orthogonally (Supplemental Figure S1), and only fully visible strides were considered for processing (see Supplemental Tables S1 and S2 for individual contributions). We measured spatiotemporal variables, including velocity (m/s), stride length (m), stride duration (s), and duty factor (%), using ImageJ (Version 1.54d; NIH, Bethesda, MD, USA) with video footage of locomotor trials, following previously published methodology [58,59]. We normalized dimensionless variables (stride length, speed, and stride duration) by each individual’s leg length ( l O ; measured from the most inferior lateral malleolus to the superior iliac crest) [58]. Duty factor (%) is defined as the proportion of the stride cycle where the foot is in contact with the ground (stance phase) [60]. To assess changes in gait cycle timing and gait symmetry, we calculated the symmetry ratio for each trial of ground running for the following measures: stride length, stride duration, stance time, and swing time [61]. This measurement is calculated using each spatiotemporal measure (ST) in the following equation:
S y m m e t r y   R a t i o = S T R i g h t / S T L e f t
We extracted instantaneous angles of the shoulder, elbow, hip, knee, and ankle from the same video footage at each frame of the joint throughout the stride using ImageJ (Supplemental Figure S2). We calculated average kinematic traces (e.g., an average of all kinematic traces per angle) by first down-sampling the total number of frames to n = 45 (to accommodate videos with fewer frames) and then calculating the mean and standard deviation at each frame.

2.4. Energetics

Metabolic energetics testing consisted of 12 participants [6 NT (4:2 male to female ratio; 40.9–69.7 kg; age range 11–14 years) and 6 ND (all males; 35.3–51.1 kg; age range 11–13 years)] using the COSMED K5 respirometry system (COSMED, Concord, CA, USA). Due to recruiting constraints, we selected four ND participants from the larger pool of 10 ND participants in the ground running trials, along with two treatment-naive ND participants. The four ND participants from the ground running trials had at least a six-month washout period between the end of their training program and the start of the metabolic energetics testing. We tested the NT participants one time without any training, while we tested the ND group before (pre-ND) and after (post-ND) the six-week training duration (see Supplemental Table S3 for individual contributions).
Before all energetics testing, we instructed participants not to consume any food at least two hours before their scheduled appointment. At each testing session, we fitted participants with an appropriate respirometry mask and asked them to sit or lie down (self-selected) in a quiet room for 15–20 min to measure resting metabolic rate (RMR). All testing trials required participants to complete a single trial of continuous running (3–7 min) at a predetermined velocity (see below) on a treadmill, which concluded once they reached a steady state of oxygen consumption. We captured all videos at 120 Hz from a lateral view using GoPro video cameras (HERO10, GoPro, San Mateo, CA, USA) (Supplemental Figure S1).
The velocity differed between participants as we set the treadmill speed to a constant Froude number (0.788) [62,63] to control for differences in metabolic costs associated with body mass and speed [64,65,66,67].
We analyzed all energetics data using custom-written MATLAB (Version R2024b; MathWorks, Natick, MA, USA) and R (Version 4.3.1; R Core Team, Vienna, Austria) code [68] with previously published formulas [64,65]. Briefly, using VO2 (L), we determined the timestamps when steady state occurred (i.e., the point at which VO2 consumption per minute plateaued). We averaged the raw metabolic rate (kcal/min) within those timestamps. We converted metabolic rate (MR) into J·s−1 and subtracted RMR from MR to yield the net metabolic rate (MRnet). We calculated the net cost of locomotion (COLnet, in units of J·s−1·kg−1 or W·kg−1) by dividing MRnet by the participant’s mass (kg). To normalize energetic cost by the average speed (m·s−1) at which participants ran, we derived the net cost of transport (COTnet in units of J·kg−1·m−1). Finally, to understand the energetic cost per stride (COLnet per cycle, in units of J·kg−1·stride cycle−1), we derived the net cost of locomotion per stride by dividing COLnet by stride frequency. We used video footage to calculate stride frequency in ImageJ.

2.5. Statistical Analyses

We conducted statistical analyses in R [68] using the packages “lmerTest” and “effectsize” [69] and MATLAB. To evaluate the impact of the HIIT, we developed linear mixed-effect models to assess changes in spatiotemporal variables, gait cycle variability, and kinematic changes in range of motion. We developed linear regression models to assess changes in metabolic cost. Each linear mixed-effect model included the individual as a random effect to address behavioral idiosyncrasies, and age was included as a fixed effect. Regression models for ND-specific comparisons also included training duration as an additional effect. To determine the strength of any statistically significant differences in the models, we performed t-tests and calculated effect size using Cohen’s d.
We assessed three conditions in each set of regression models: (1) pre-ND to NT, (2) post-ND to NT, and (3) pre-ND to post-ND. Before statistical analysis, we first normalized and checked all angular data for homogeneity and outliers. To determine where along the stride significant differences in joint kinematics occurred between pre-ND and NT, pre-ND and post-ND, and post-ND and NT, we performed a non-paired one-dimensional statistical parametric mapping (1D-SPM) t-test using open-source code (www.spm1d.org; accessed on 22 June 2025) in MATLAB. Each cluster of the gait (every ~2.22%) was examined for statistically significant differences between groups [70,71]. The results are reported as black horizontal bars at the bottom of each graphic.
For direct comparisons between pre-ND versus NT and post-ND versus NT, we used a series of χ2 tests to assess the likelihood that high-intensity training significantly impacted the differences in kinematic profiles. We performed a root mean square error (RMSE) analysis to further compare the differences in kinematic traces. The RMSE analysis examined each frame of the kinematic tracing and determined whether a statistical difference was present. A lower RMSE indicated greater similarity between the two kinematic traces. We created all graphs using R [68] with the package “ggplot”.

3. Results

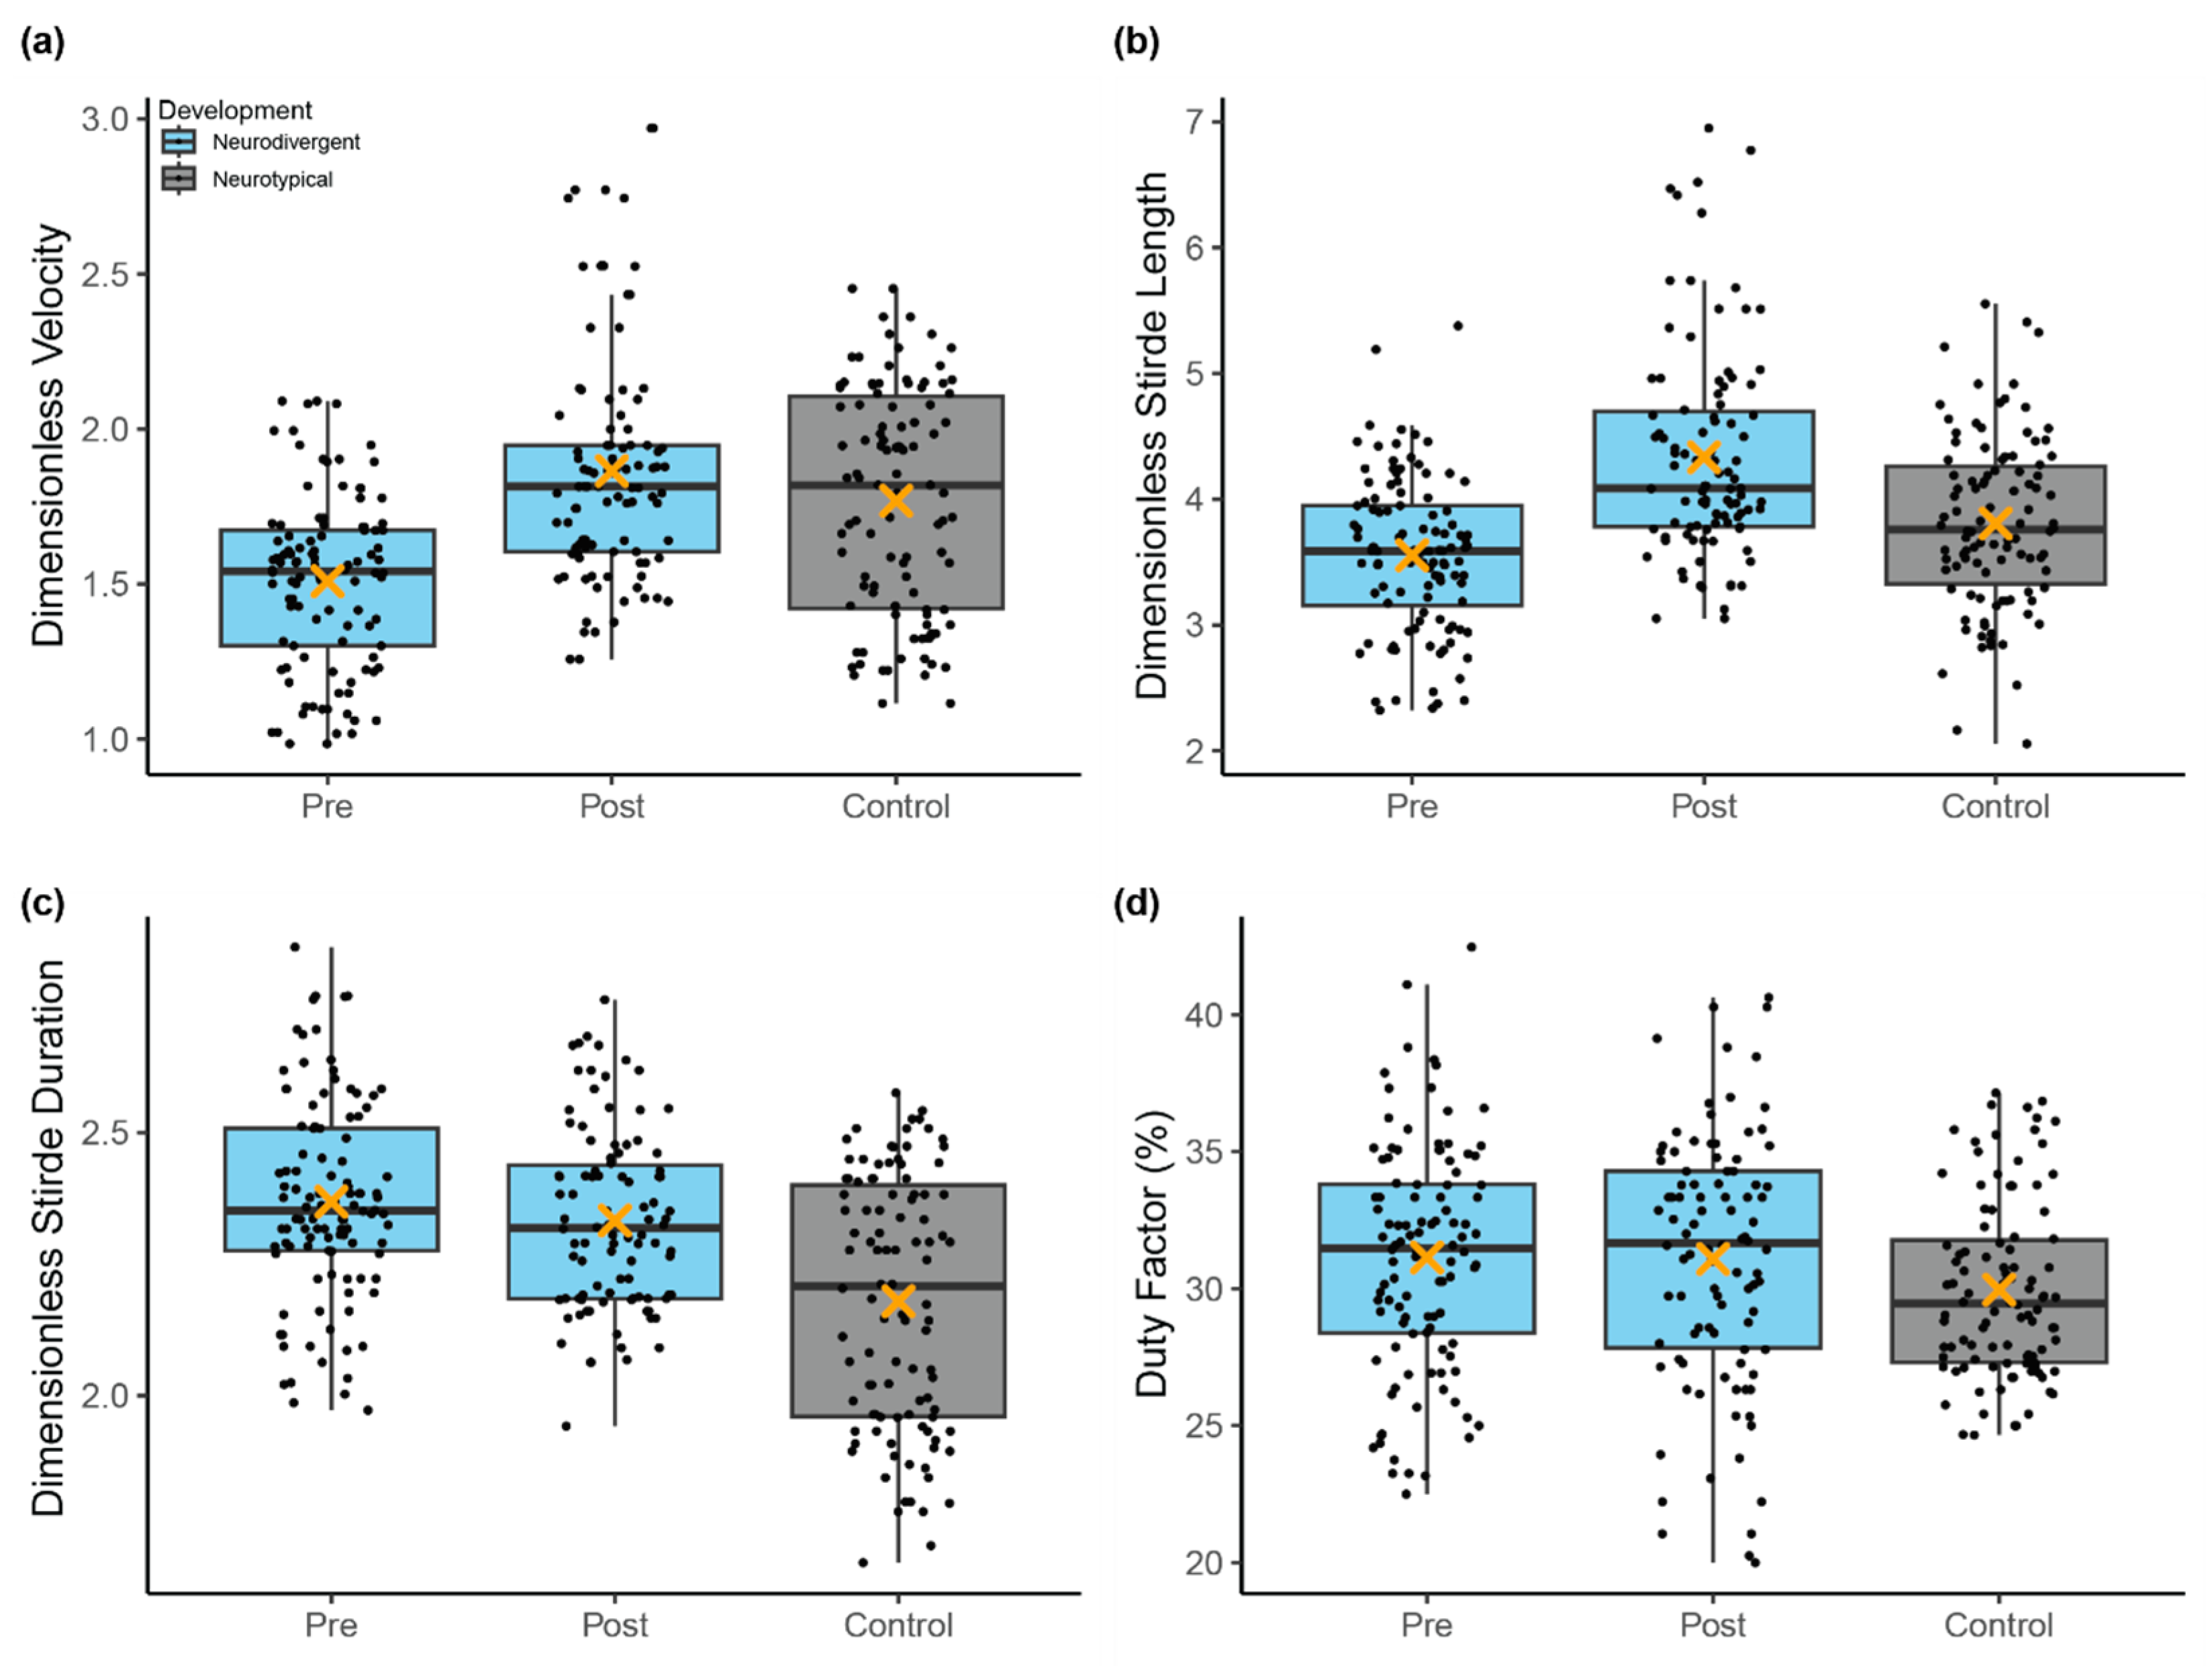
3.1. Spatiotemporal Gait Characteristics
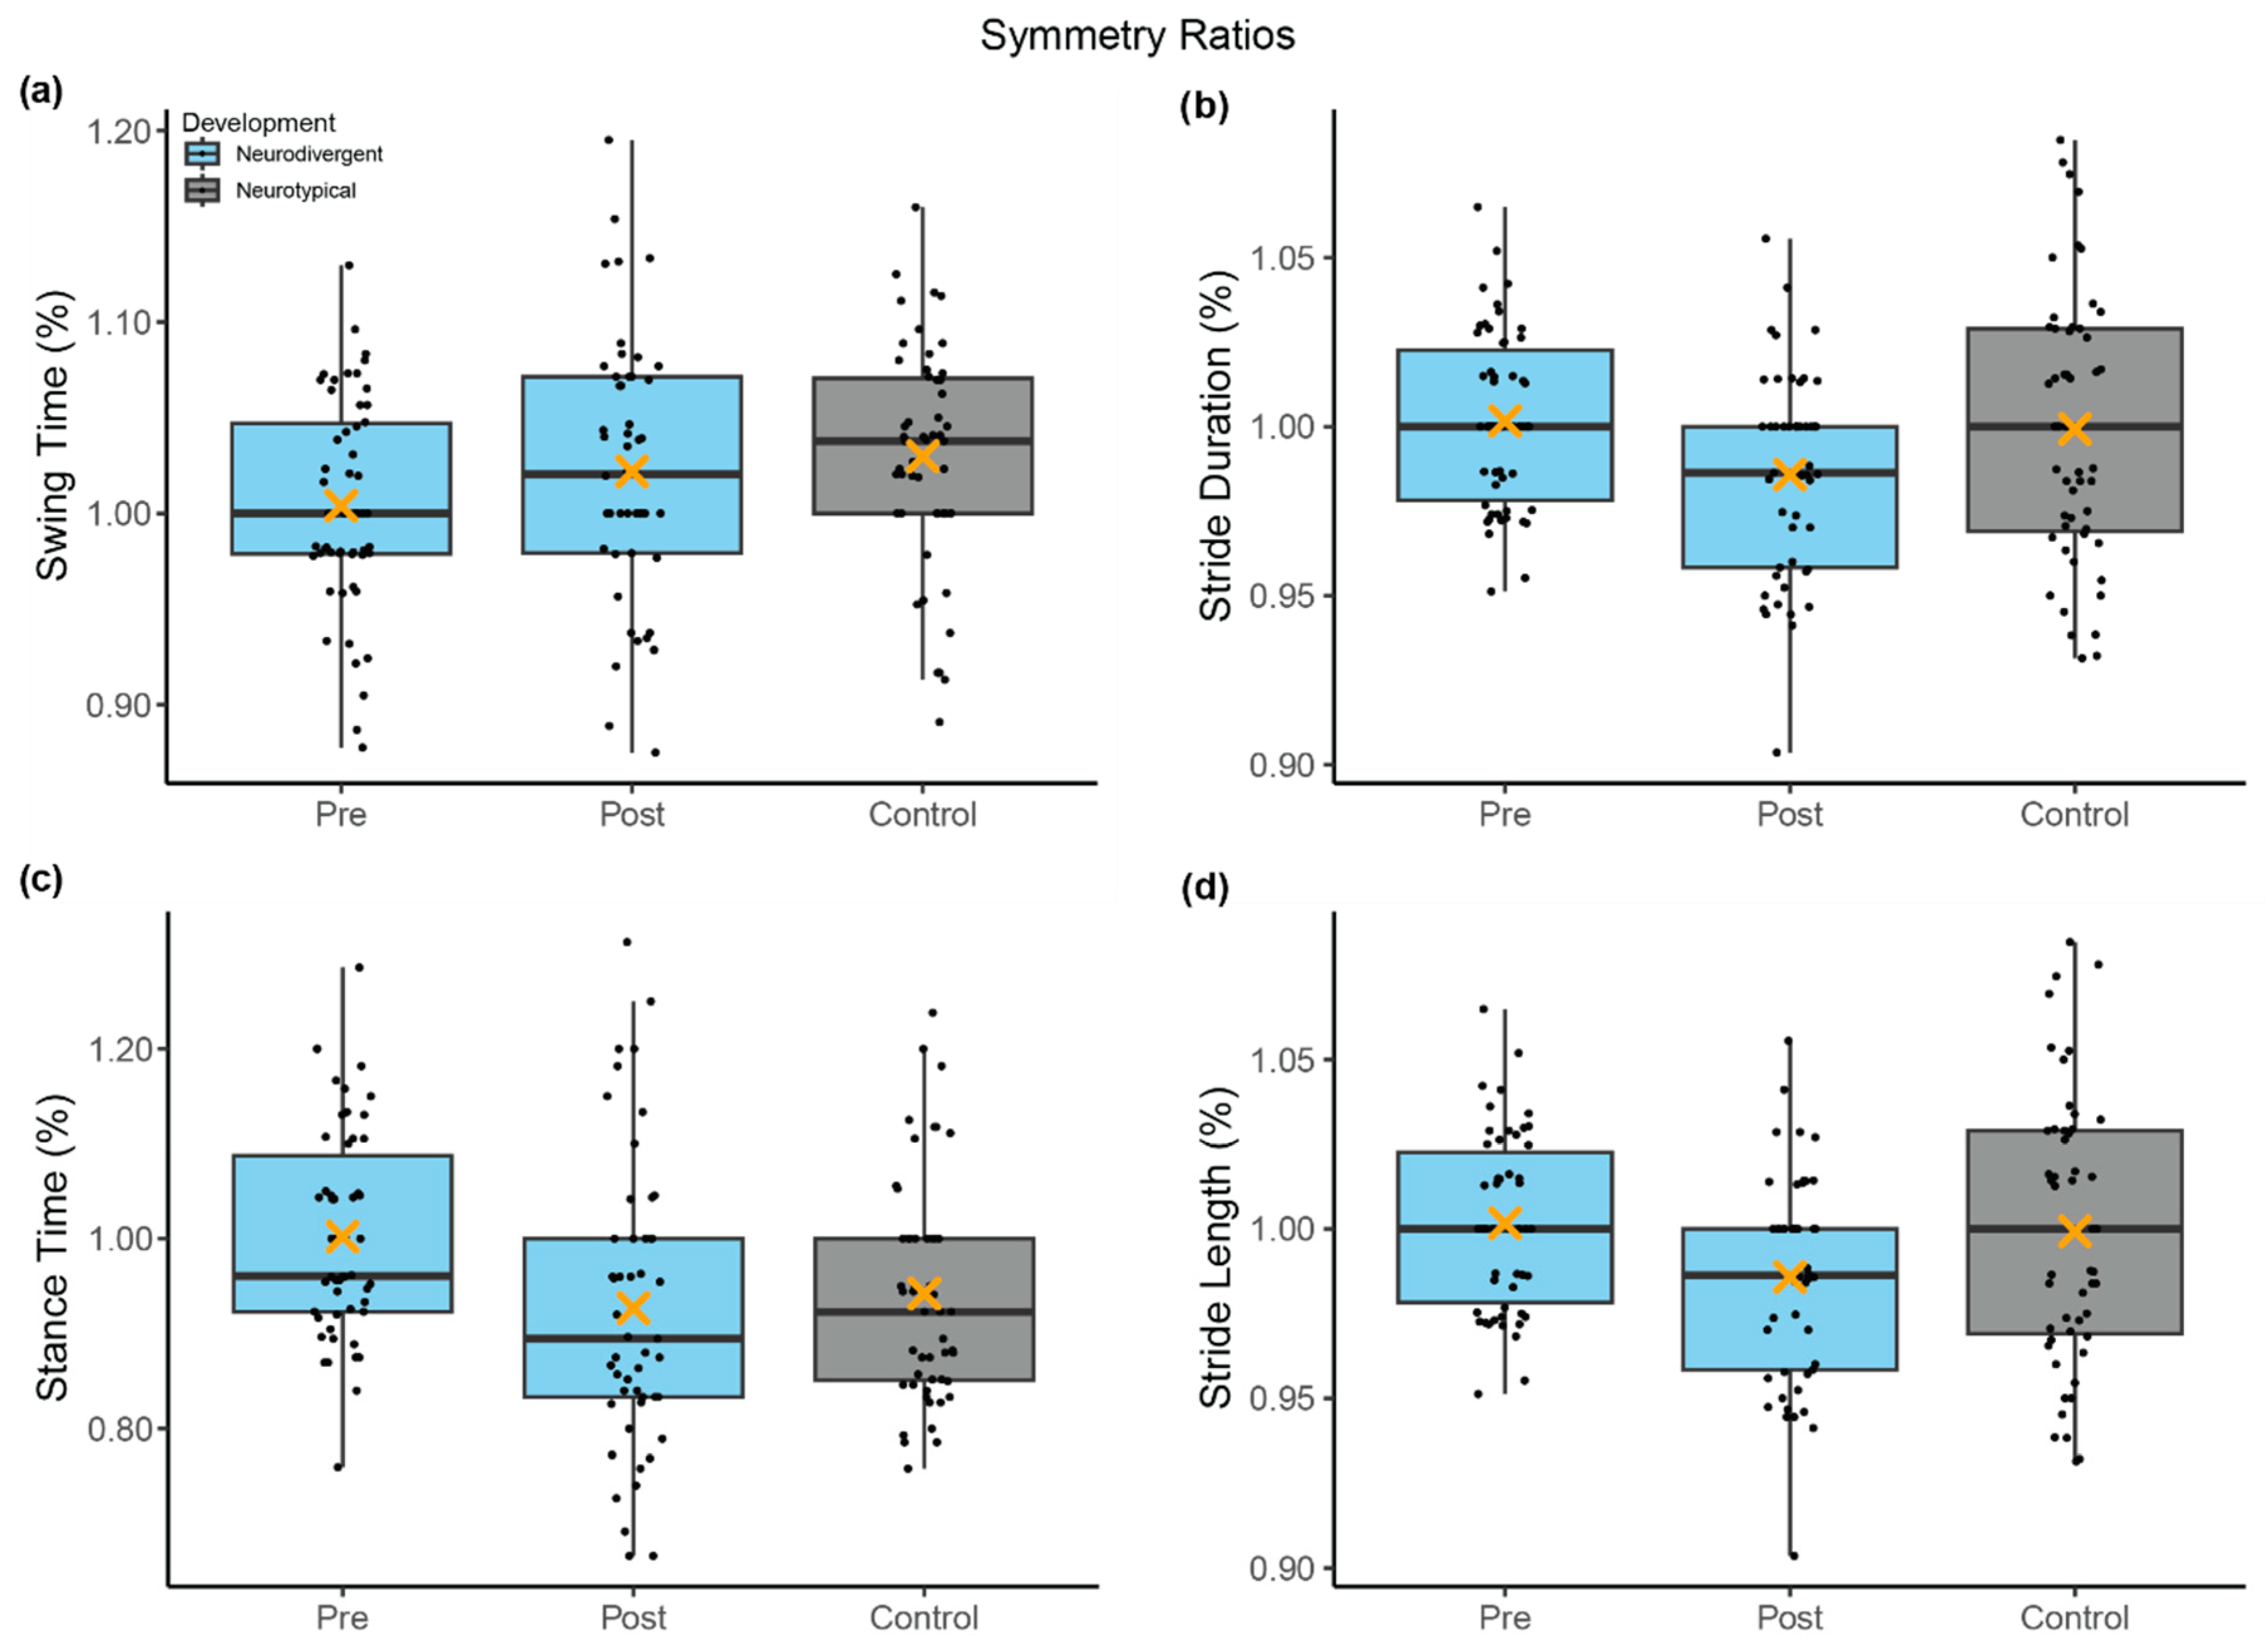
Compared to the NT group, the pre-ND group exhibited significantly lower dimensionless speed (1.77 ± 0.37 and 1.51 ± 0.28, respectively; p = 0.015) and higher stride duration (2.18 ± 0.24 and 2.37 ± 0.19, respectively; p = 0.016; t-test p < 0.001; Cohen’s d = 0.79). Duty factors and stride lengths did not differ statistically between the groups (all p-values > 0.144). The HIIT protocol significantly increased dimensionless speed (1.51 ± 0.28 to 1.86 ± 0.38) and dimensionless stride length (3.55 ± 0.61 to 4.33 ± 0.85; all p-values < 0.001; all t-test p < 0.001; all Cohen’s d > 1.01) in the ND group. The post-ND group demonstrated significantly higher dimensionless stride duration than the NT group (2.33 ± 0.17 and 2.18 ± 0.24; p = 0.019; t-test p < 0.001; Cohen’s d = 1.57). Dimensionless speed, stride length, and duty factors did not differ statistically between these groups (all p-values > 0.093) (Table 2; Figure 1).

3.2. Gait Symmetry

Prior to any intervention, there were no statistically significant differences in symmetry between the pre-ND group and the NT group (all p-values > 0.051). After program intervention, there were no statistically significant differences in asymmetry between the post-ND group and the NT group. Comparing the pre-ND group to the post-ND group, there were statistically significant changes in symmetry ratio. The pre-ND group symmetry ratio indicated a higher level of symmetry for stride duration (Pre: 1.00 ± 0.03; Post: 0.99 ± 0.03; p = 0.005; t-test p = 0.005; Cohen’s d = 0.57), stride length (Pre: 1.00 ± 0.03; Post: 0.99 ± 0.03; p = 0.005; t-test p = 0.005; Cohen’s d = 0.57), and stance time (Pre: 1.00 ± 0.11; Post = 0.93 ± 0.15; p = 0.002; t-test p = 0.002; Cohen’s d = 0.62) (Table 3; Figure 2).

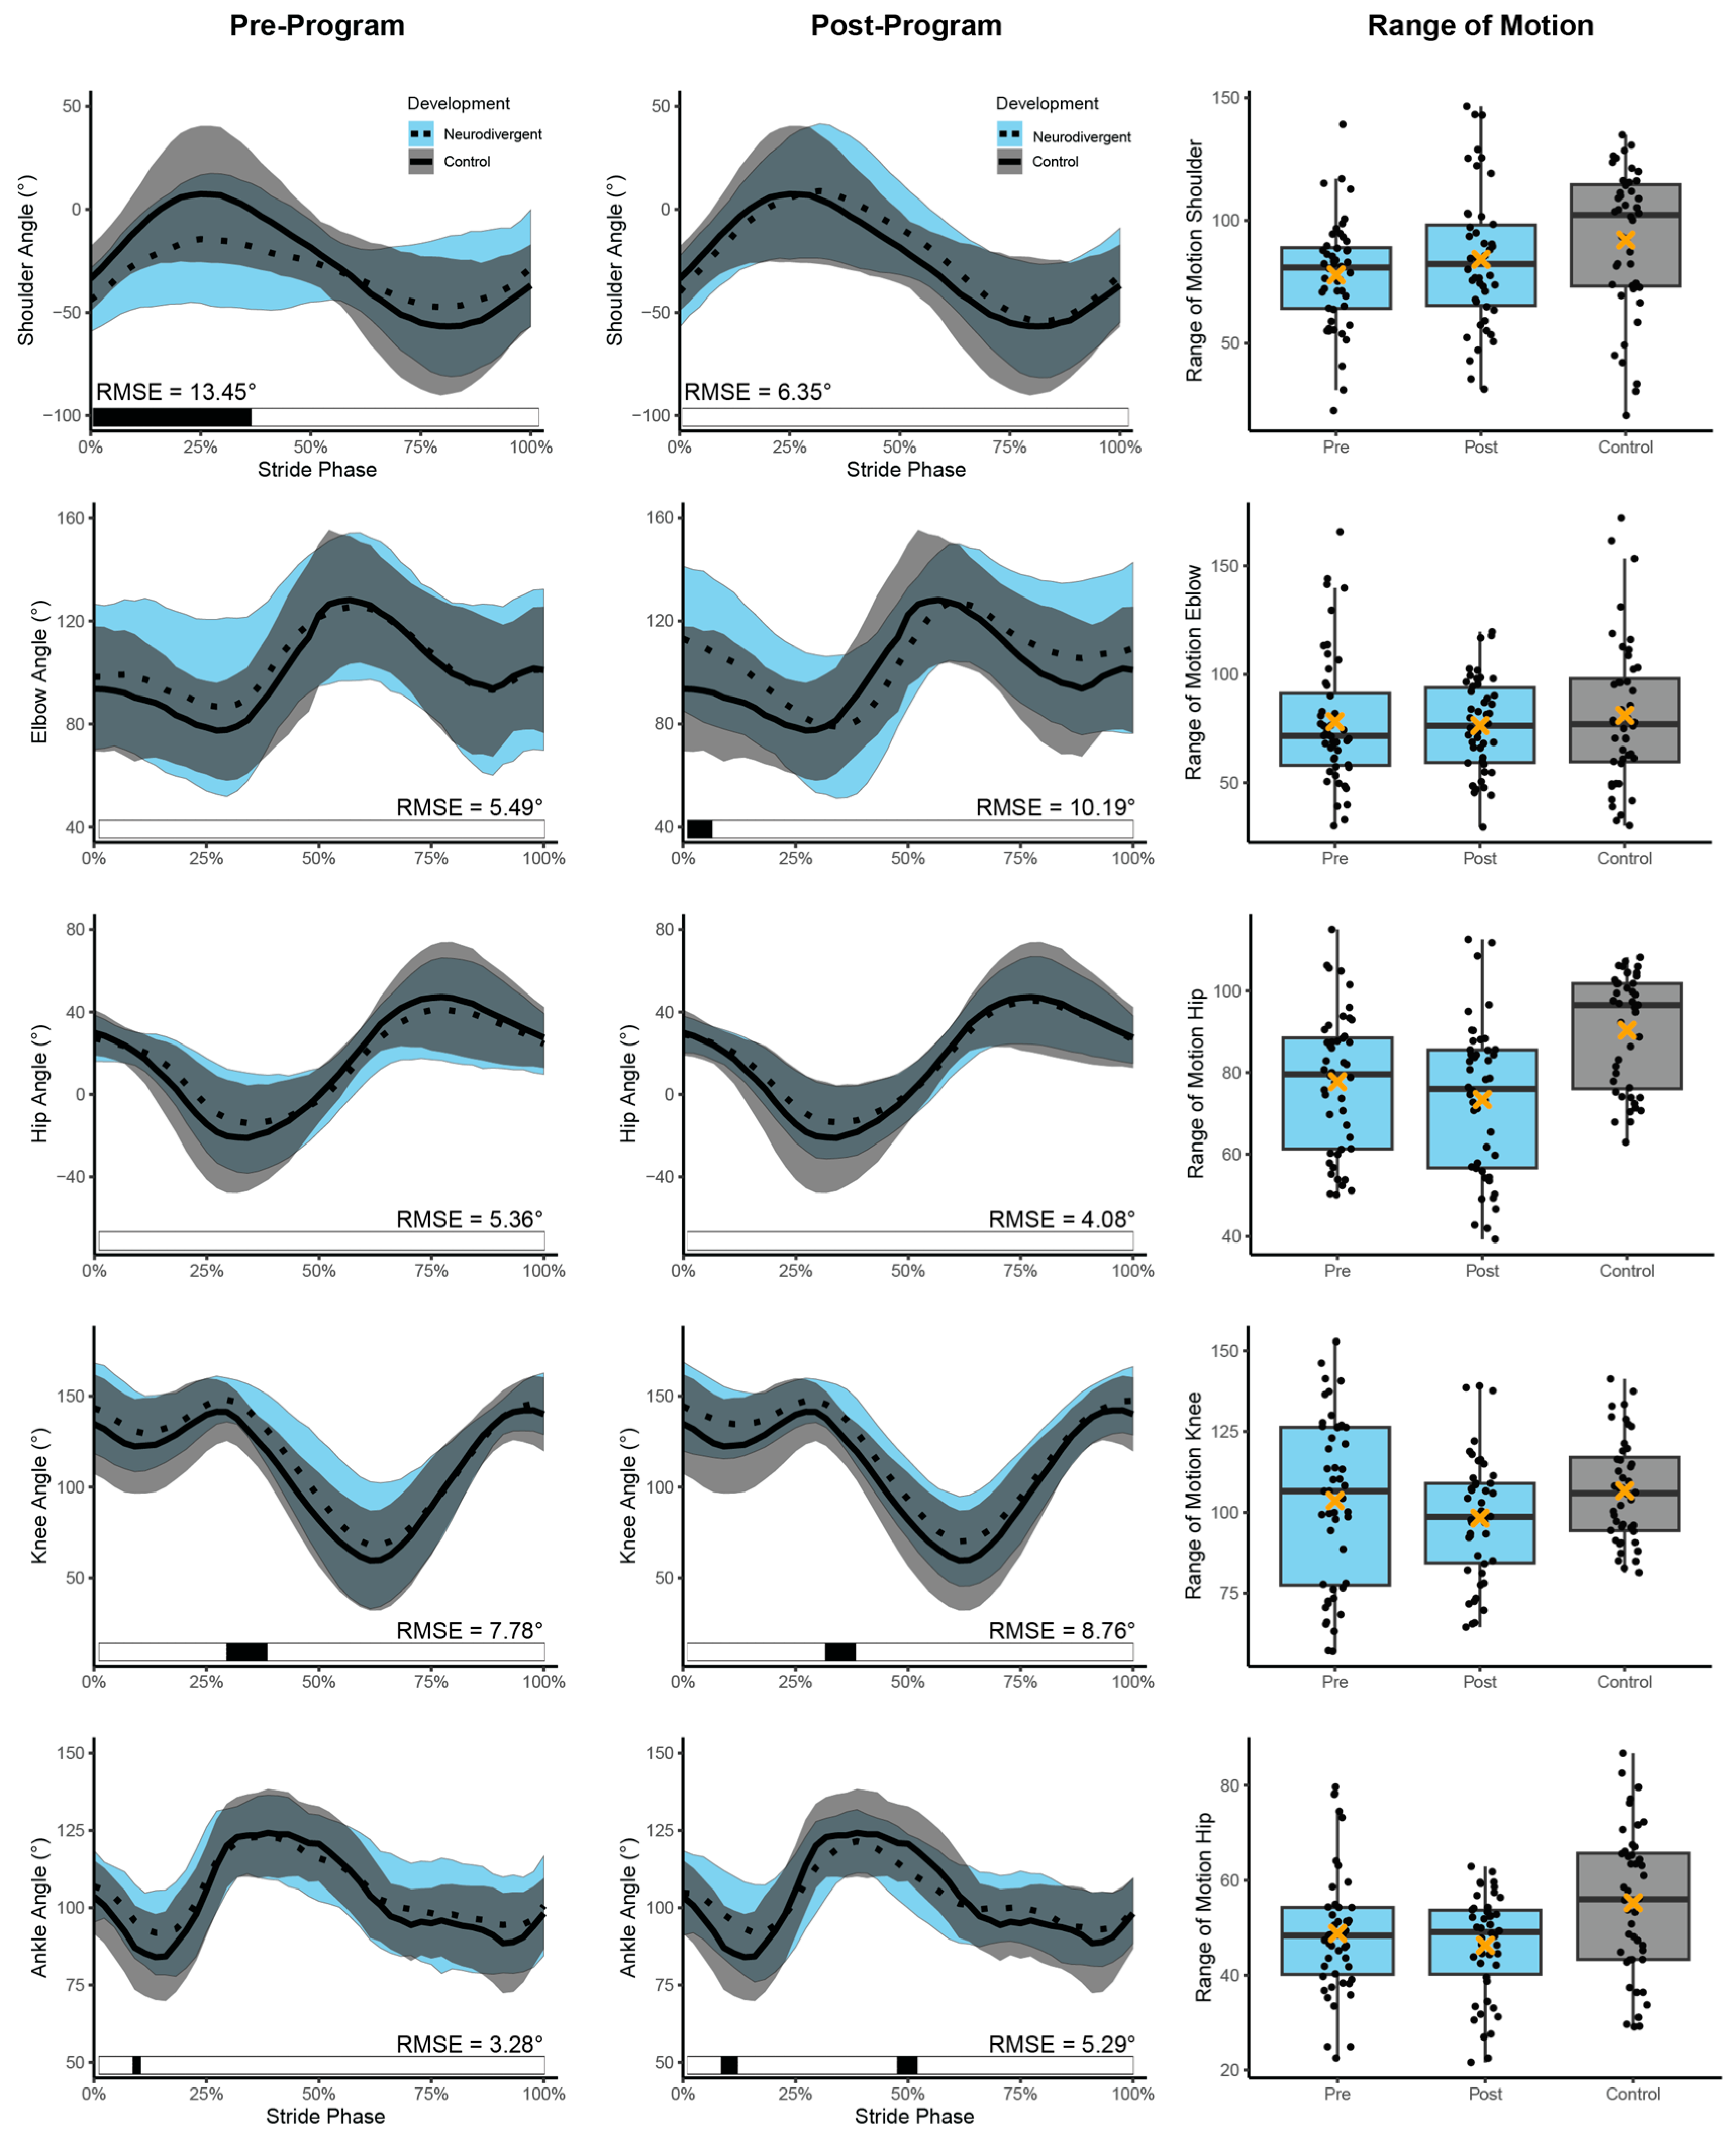
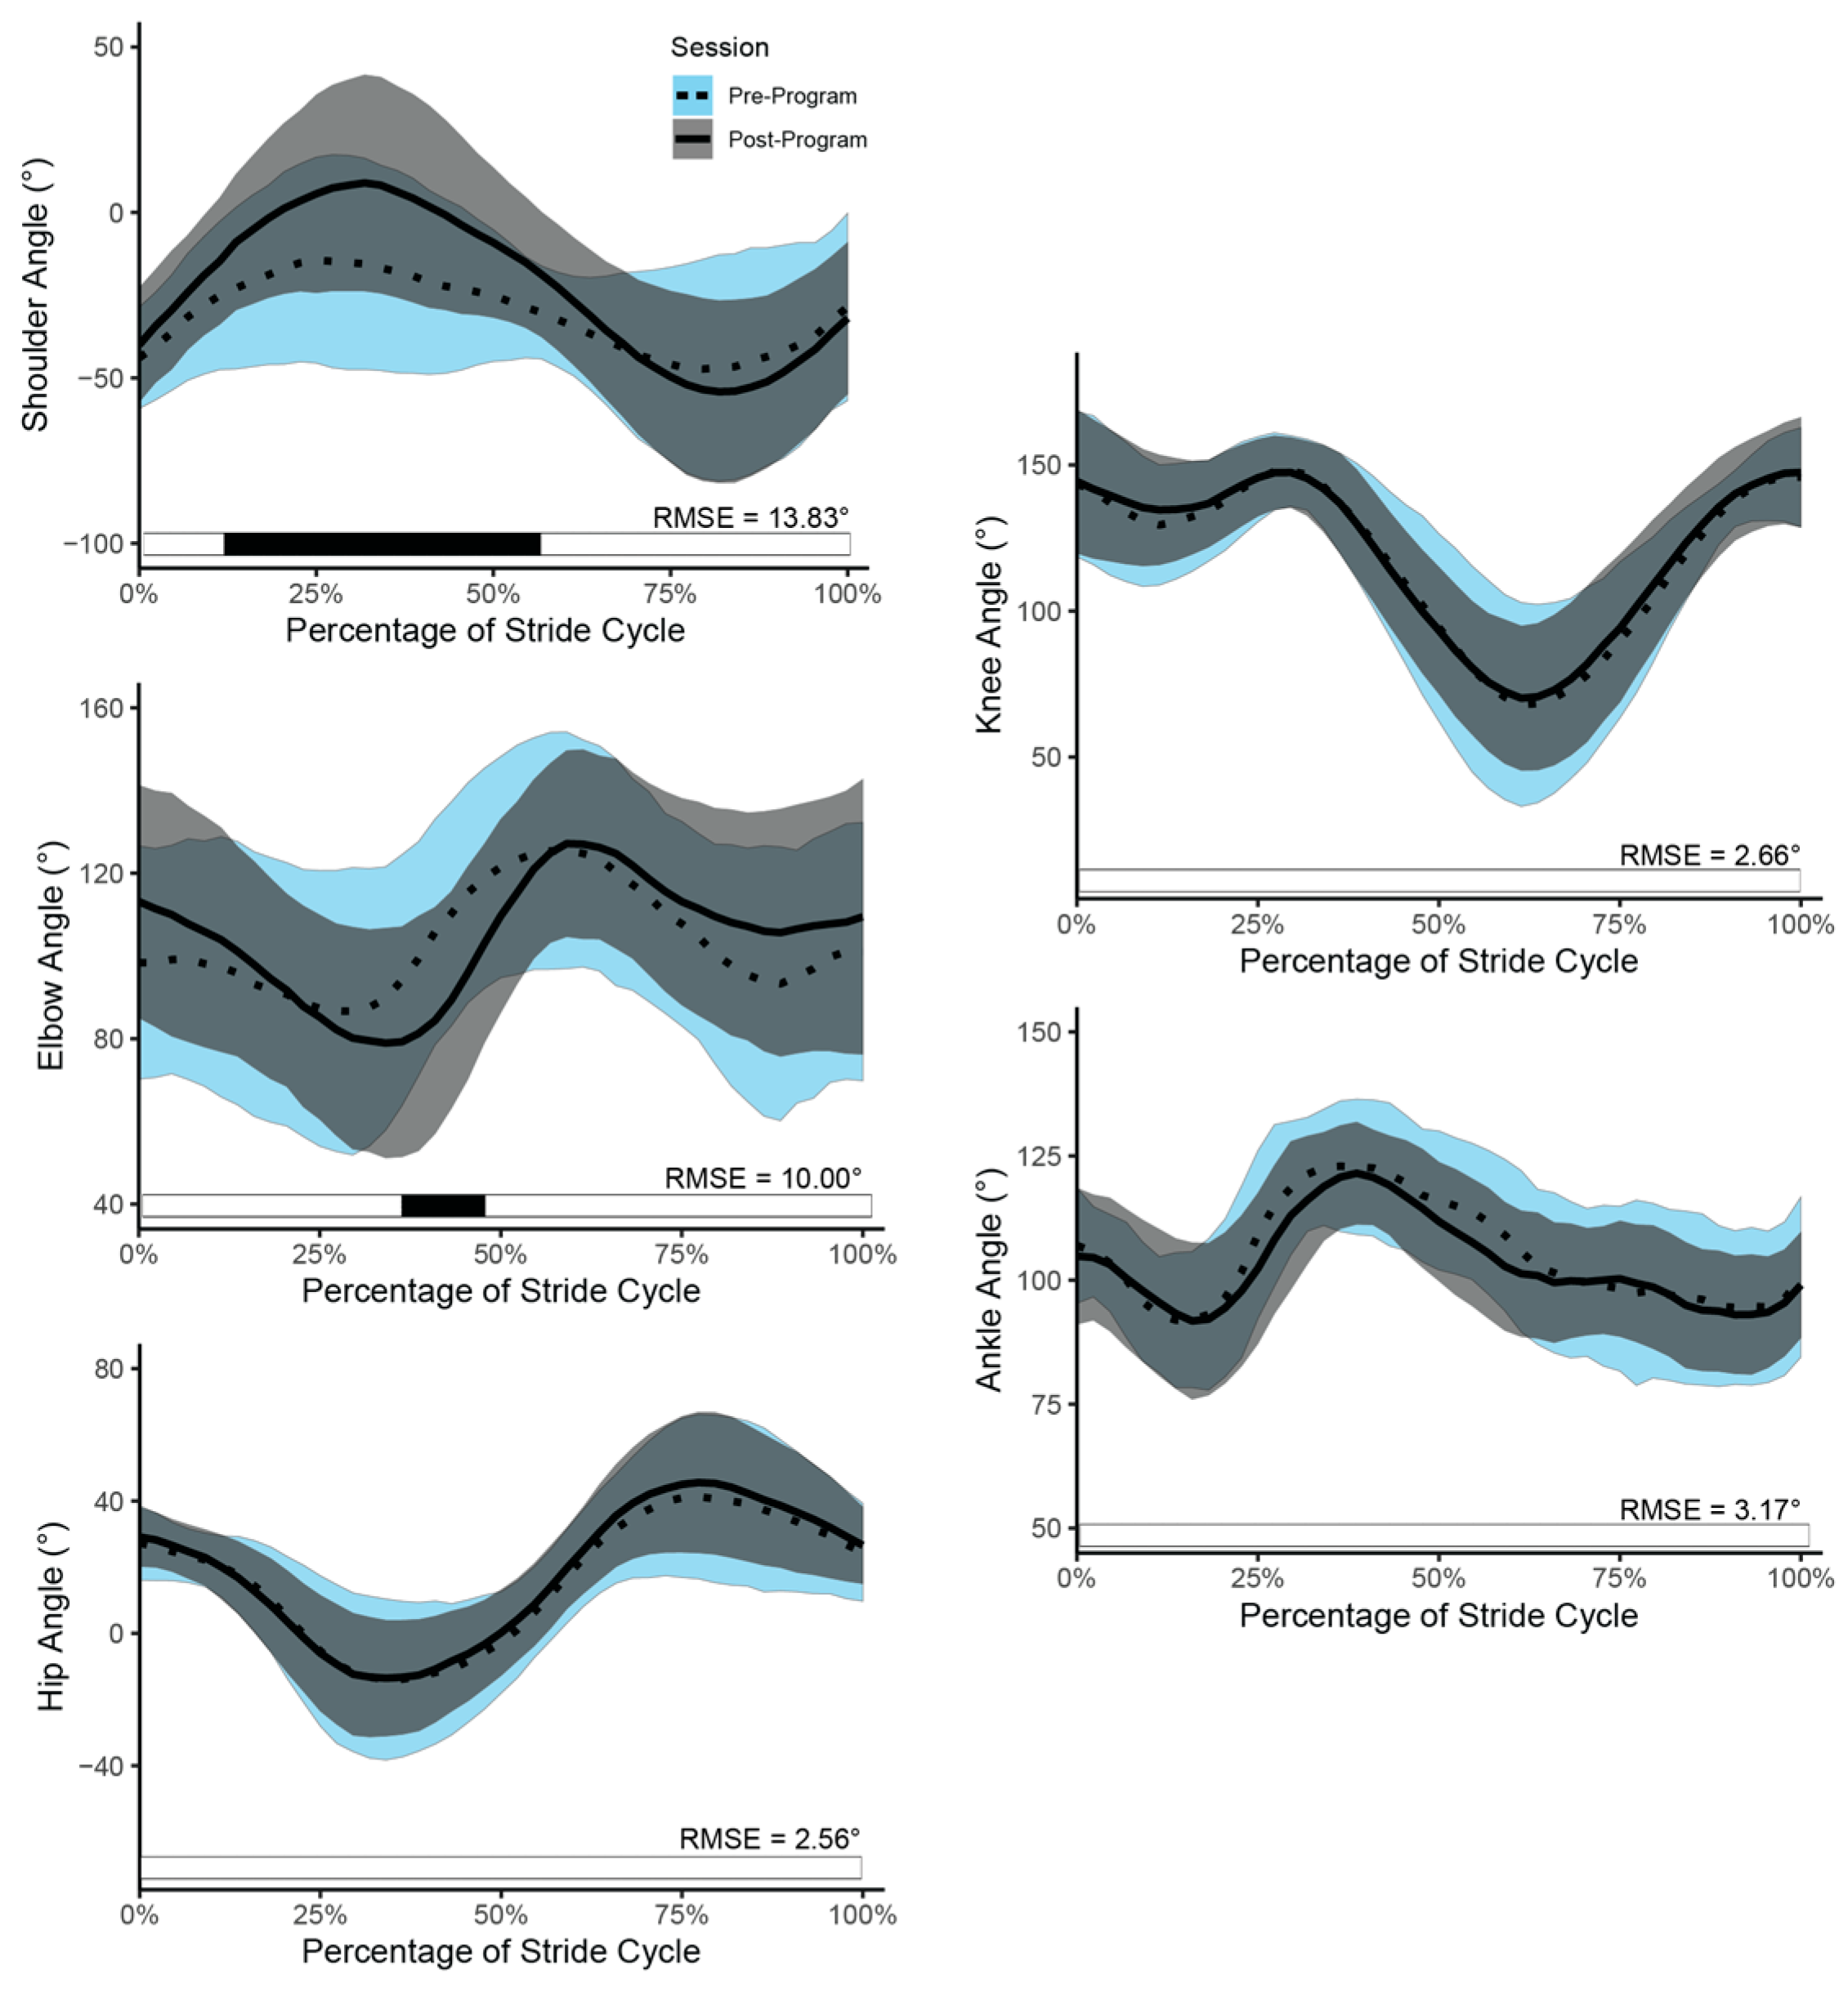
3.3. Running Kinematics

When we compared NT and pre-ND shoulder movements using the 1D-SPM, we observed that 37.7% of the strides differed statistically. However, when we compared NT and post-ND, 0% of the strides differed. This reduction in proportional differences was statistically significant (χ2 = 18.57, df = 1, p < 0.001). We observed this finding in the decrease in RMSE from the pre-program to the post-program comparison (Table 4; Figure 3). When we examined changes between the pre-ND and post-ND groups, 44.4% of the stride points differed significantly, with most differences occurring in shoulder protraction (Table 4; Figure 4).
For elbow movements, we found no significant differences (0.0%) in the stride when comparing the NT and pre-ND groups. However, when we compared NT and post-ND, 6.7% of the stride phase differed significantly. This finding was reflected in the increase in RMSE from the pre-program to the post-program comparison (Table 4; Figure 3). Between pre-ND and post-ND groups, 11.1% of the stride points differed significantly (Table 4; Figure 4).
When we compared NT and pre-ND hip movements, 0.0% of the strides differed statistically. In contrast, 0.0% of the strides differed when we compared NT and post-ND. This finding corresponded to a decrease in RMSE from the pre-program to the post-program comparison (Figure 3). We also observed a statistically significant range of motion difference between post-ND and NT (p = 0.015; t-test p < 0.001; Cohen’s d = 1.03; Table 4). However, 0.0% of stride points differed statistically between pre-ND and post-ND groups (Figure 4).
For knee movements, we observed that 8.9% of the strides differed statistically when we compared the NT and pre-ND groups. When we compared NT and post-ND, 6.6% of the strides differed. This finding aligned with the increase in RMSE from the pre-program to the post-program comparison (Table 4; Figure 3). Between pre-ND and post-ND groups, 0.0% of the stride points differed statistically (Table 4; Figure 4).
When we compared NT and pre-ND ankle movements, 2.2% of the strides differed statistically. In contrast, 8.9% of the strides differed when we compared NT and post-ND. We observed a statistically significant range of motion difference between post-ND and NT (p = 0.036; t-test p = 0.006; Cohen’s d = 0.67; Table 4; Supplemental Table S4). This finding was further supported by the increase in RMSE from pre-ND to post-ND comparison (Figure 3). When we examined changes between pre-ND and post-ND groups, 0.0% of the strides differed (Figure 4).

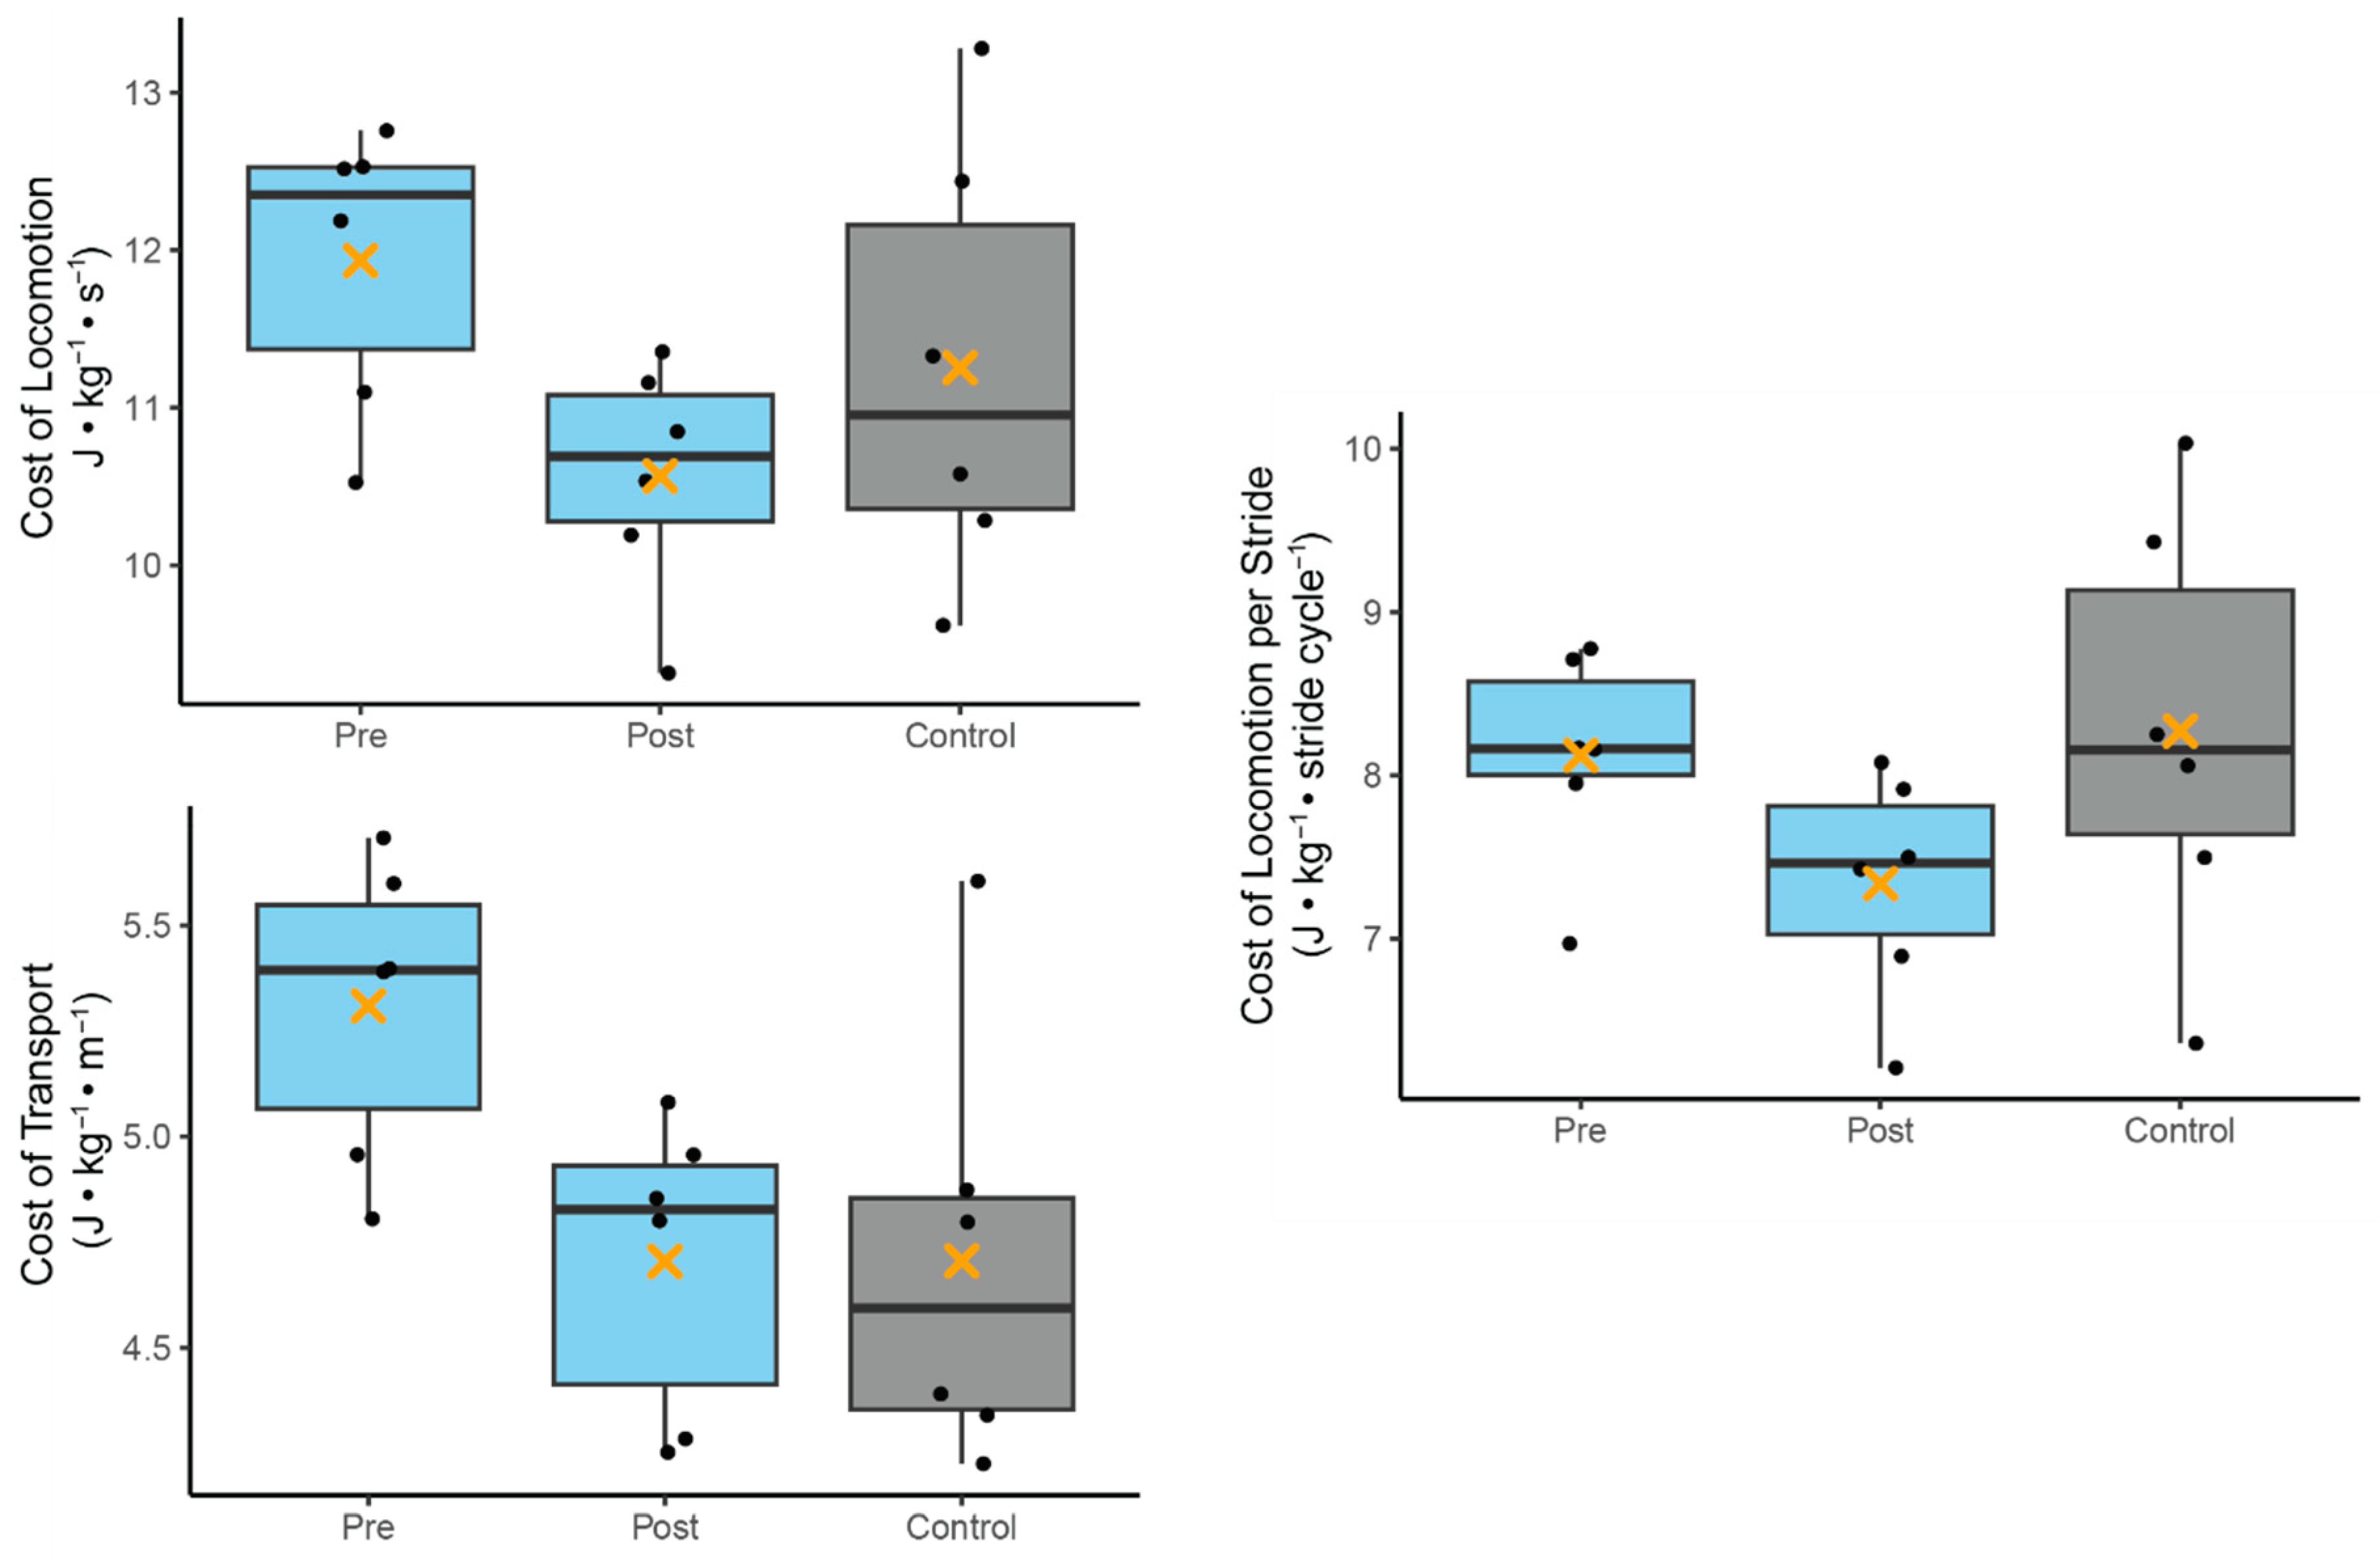
3.4. Running Energetics

We found that the pre-ND group exhibited a higher COLnet (11.94 ± 0.91 J·s−1·kg−1) and COTnet (5.31 ± 0.36 J·kg−1·m−1) compared to the NT group COLnet (11.25 ± 1.38 J·s−1·kg−1) and COTnet (4.71 ± 0.51 J·kg−1·m−1), although this difference was not statistically significant (all p-values > 0.089). Examining COLnet per stride, the pre-ND group displayed a lower energetic cost (8.12 ± 0.65 J·kg−1·stride cycle−1) compared to the NT group (8.27 ± 1.32 J·kg−1·stride cycle−1), although this difference was not statistically significant (p = 0.137) (Table 5; Figure 5).
The HIIT protocol significantly (p = 0.008; t-test p = 0.018; Cohen’s d = 1.65) reduced the COLnet from pre-program (11.94 ± 0.91 J·s−1·kg−1) to post-program (10.57 ± 0.74 J·s−1·kg−1). In our analysis of the COTnet, the HIIT protocol significantly (p = 0.020; t-test p = 0.014; Cohen’s d = 1.71) decreased the metabolic cost of transport from pre-program (5.31 ± 0.36 J·kg−1·m−1) to post-program (4.70 ± 0.35 J·kg−1·m−1). However, the HIIT protocol did not significantly (p = 0.053) reduce the COLnet per cycle from pre-program (8.12 ± 0.65 J·kg−1·stride cycle−1) to post-program (7.34 ± 0.69 J·kg−1·stride cycle−1) (Table 5; Figure 5).
Comparing the post-ND group to the NT group, we found a nearly equal metabolic cost between the two groups (all p-values > 0.283). For the COLnet, the post-ND group (10.57 ± 0.74 J·s−1·kg−1) showed no significant difference compared to the NT group (11.25 ± 1.38 J·s−1·kg−1). Similarly, there was no significant difference in the COTnet between the post-ND group (4.70 ± 0.35 J·kg−1·m−1) and the NT group (4.71 ± 0.51 J·kg−1·m−1). Additionally, the COLnet per cycle did not differ appreciably between the post-ND group (7.34 ± 0.61 J·kg−1·stride cycle−1) and the NT group (8.31 ± 1.36 J·kg−1·stride cycle−1) (Table 5; Figure 5).

4. Discussion

This study aimed to evaluate the running performance and associated energetic costs of ND children diagnosed with ASD after participating in a HIIT protocol. At baseline testing, the NT group exhibited significantly greater dimensionless speed and faster stride duration compared to their ND peers (Table 2; Figure 1). These differences align with previous research highlighting the distinctive running patterns of ND children and their challenges in lower-body coordination, sensorimotor processing, and motor planning [4,5,72]. However, our findings conflict with those of Bennett and Haegele [4]), as their baseline ND sample exhibited statistically significant differences in stride length rather than stride duration. This discrepancy may be attributed to the relatively small sample size in our study, the younger age of our participants compared to those in Bennett and Haegele [4], or the restrictive nature of our recruitment process (see Limitations below) and rigid exclusion criteria (see Materials and Methods above). It is also possible that our ND population had fewer physical limitations at baseline compared to the populations in previous studies [4,5].
Regardless of these initial differences, the first important qualitative finding of note is that ND individuals successfully transferred sensory-perceptual motor experiences from the mechanical treadmill (e.g., during the training protocol) to ground surface running (e.g., in spatiotemporal and kinematic testing protocols). This suggests that improvements in locomotor performance were not limited to treadmill running. When comparing the pre-ND to post-ND groups, we observed an increase in dimensionless speed and stride length. Comparing the post-ND group to the NT group, there was no longer a statistical difference in locomotor speed. However, the NT group still demonstrated a faster dimensionless stride duration (Table 2; Figure 1). Thus, while the HIIT program achieved its goal of promoting comparable running speeds between ND children and their NT peers, the mechanism by which participants achieved this similarity differed. Specifically, the ND group improved speed primarily through modifications in stride length, rather than stride duration [60]. This finding corresponds with the known literature and behaviors of modulating speed. By preferably increasing stride length compared to stride frequency to achieve higher speeds, stride variation is limited [73]. The limitation of stride variation leads to greater gait stability, balance, and a decreased fall risk [73,74].
Generally, children with ASD exhibit slower self-selected speeds and shorter strides [4,13]. These findings demonstrate that the HIIT protocol described above can help children with ASD overcome these self-selected gait deficits and achieve more typical motor patterning.
Examining the changes in inter-stride symmetry, we observed changes between the pre-ND and post-ND groups, but no statistically significant changes between the pre-ND and NT or post-ND and NT groups. Through the HIIT protocol, the ND participants developed a more asymmetric gait. While not statistically significant, we observed the pre-ND group running with more intra-limb symmetry compared to the NT control group, especially when examining stance and swing time symmetry ratios. Post-program, these values converged, with the post-ND group exhibiting almost equal symmetry ratios compared to the NT group. Our findings contradict the current literature regarding asymmetry during over-ground locomotion, as children with ASD tend to walk and run with higher levels of left-right asymmetry [12,38]. While our comparisons contradict previous work regarding baseline symmetry in the ASD population, the changes seen between pre- and post-program show the potential benefits of the HIIT protocol. Improvements in motor coordination allowed ND participants to run similarly to their NT counterparts. Additionally, this increase in asymmetry can partially be explained by increases in top running speed. Particularly in novice runners, as speed increases above the preferred running speed, a higher level of asymmetry is seen [75].
From a kinematic perspective, we observed relatively few notable differences between the pre-ND and post-ND groups or between the pre-ND and NT participants (see Dufek et al. [5]). While statistically significant differences were present between the post-ND and NT participants in both the hip and ankle joints, these differences were likely influenced by confounding variables in our analysis (Table 4; Supplemental Table S4). The limited kinematic differences may be attributed to the relatively small sample size, the specific characteristics of our population (see above), or the use of two-dimensional kinematic tracking (see Section 4.1). However, we observed significant differences in shoulder positioning between the pre-ND group and the NT sample, with 37.7% of the stride showing statistical differences. At the end of the HIIT protocol, these differences decreased, with none of the stride remaining statistically different. These differences may be attributed to a reduced ability of ND runners to protract the shoulder joint during the stance phase compared to their NT peers (Figure 3). Importantly, these differences were no longer observed following the HIIT protocol. This finding underscores the effectiveness of the HIIT protocol in disrupting the inefficient and highly variant coupling of body parts observed in ND runners. Previous studies have shown that increased variation in inter-limb coordination negatively impacts the running ability of children with ASD [12]. While multi-joint coupling supports postural stability, it diminishes dynamic movement skills essential for diverse running tasks such as quickness, directional changes, sprinting, and distance running [4,13,76]. The enhanced decoupling of shoulder movements achieved through training likely contributed to improved coordination, synchronicity, and maneuverability during running. These findings highlight potential future research opportunities focusing on the neurological adaptations resulting from this type of training.
When examining the effects of the HIIT protocol on energetic costs, the ND group demonstrated substantial improvements over the course of the program. Not only did these values decrease during training, but the post-ND energetic costs were comparable to those of the NT controls (Table 5; Figure 5). High-intensity training programs have been shown to enhance gross motor performance variables in both general and ASD populations [77]. These performance gains likely explain some of the observed improvements in metabolic efficiency [78]. As the generation of muscular force is the predominant energy-consuming process in locomotion [79,80], reducing the rate of muscle force production per unit of body mass—and thereby the metabolic cost of supporting the body—is achieved by lengthening the stance phase [60,79,80]. Since stride distance is a critical determinant of stance phase duration [80], the reduction in energetic costs of running would favor individuals who increase speed through stride length [60,80]. Indeed, our findings show that ND individuals increased locomotor speeds primarily through longer stride lengths following the HIIT protocol. While not directly linked in our study, previous studies have found that improvements in shoulder protraction and overall forelimb range of motion contribute to reduced locomotor costs [81,82,83]. As Arellano and Kram [81,82] and [83] demonstrated, increased arm swing correlates with lower energetic costs. This relationship may be one of the underlying drivers of improved locomotor efficiency and represents a promising avenue for future research in this population.
Comparing the results of this study to other training programs for the ND community further supports the use of structured exercise, especially HIIT, to improve motor proficiency and metabolic efficiency. Structured exercise has been shown to improve motor performance in the ASD population [77,84,85,86]. HIIT has been used in previous exercise programs and has been shown to generate improvements in activity levels and exercise ability while providing high levels of enjoyment for both athletes and staff [54,56]. These prior studies that implemented HIIT focused on short interval sprinting as part of the intervention, but the primary outcome variables were the ability to perform exercise [54] or specific health biomarkers [56], rather than metabolic efficiency and changes in running performance. By analyzing running and performance-specific outcomes, this study contributes new data and variables supporting the use of HIIT in the ASD population. The positive feedback from parents of the ND participants regarding improvements in social and emotional behavior further aligns with previous research highlighting the benefits of structured exercise for the ASD population [87,88]. While these remarks are anecdotal, analyzing and quantifying this feedback is a future goal to further support the use of HIIT in this population. Programs that demonstrate quantitative improvements seen by the athletes can help build confidence and self-esteem, allowing individuals to minimize barriers in their daily lives [54].

4.1. Limitations

The experimental design and recruitment for this study faced several challenges. Recruiting ND participants proved difficult due to the protected nature of this population, and recruitment was limited to word-of-mouth and social media. Inclusion criteria, such as verbal consent capability, absence of lower limb pathologies, and the ability to support body weight, further narrowed the pool. This was exacerbated by the necessity of one-to-one coaching, which was constrained by therapist availability at ISF. This limited our ability to recruit individuals with similar baseline motor abilities, age, and past athletic involvement. ISF operates with a focus on treatment and did not want to turn away potential candidates merely due to differences in baseline ability. Instead, we attempted to control for these differences in ability through our statistical models.
As ISF operates as a facility to provide free support to the ASD population, recruiting NT participants was challenging. While there was an attempt to match controls for each ND participant, the study was limited by the niche focus of ISF. Due to limited resources at ISF and the ethical concerns of reallocating staff to coach and observe an NT group of athletes, the study did not include a control group that participated in HIIT. Future research with a larger surplus of resources would allow for a better comparison between the NT and ND populations.
Ensuring participant adherence posed additional challenges. While some participants remained adherent to the protocol for a longer duration, we were aware of the challenges related to adherence. Some participants were unwilling to continue in the study due to time constraints, other obligations, or personal issues. While we attempted to control for these differences in duration in our statistical models, future studies would benefit from a larger sample size with better adherence and reliability.
Recruiting participants for metabolic cost testing posed additional hurdles. In addition to the specified criteria, participants needed to be comfortable wearing a tight-fitting mask during physical activity. Those unable to remain still during resting metabolic rate or exercise with the mask were excluded. Through our recruitment for the metabolic cost testing, we recognized that the only willing participants were individuals already familiar with ISF. To ensure no additional training benefits, we ensured a minimum of 6 months with no high-intensity training between the end of their ground running training period and the start of the metabolic efficiency testing.
While we would like to publish the protocol in its entirety to help benefit others in the rehabilitation space, we are unable to do so due to copyright. Without a detailed protocol available, the reproducibility of this study may be compromised.
Kinematic analysis faced limitations due to the ND population’s developmental issues, preventing the use of markers due to hypersensitivity. Markerless kinematic tracing in 2D via ImageJ was employed, restricting interpretations as the medial/lateral plane and full-body kinematics were not captured. Such fine-scale kinematic tracking may have revealed more differences as described by Dufek et al. [5]. Additionally, self-reported limb dominance was not collected for symmetry analysis. While previous studies suggest the effect of lower limb dominance is likely insignificant when accounting for asymmetry, this can be an area for future research [18,89].
Future studies can elaborate on and further expand our results by using larger patient populations. Additionally, a study directly tying energetic and kinematic changes through simultaneous analysis can further highlight the importance of gait training and coordination in the ND population.

4.2. Clinical Implications

Taken together, our data have important implications for therapeutic intervention. The noticeable improvements between the beginning and end of the HIIT protocol are unsurprising, as previous studies assessing the efficacy of HIIT have demonstrated significant immediate changes in running kinematics, spatiotemporal factors, and overall performance [48,49,50]. Our results, in accordance with previously published studies [54,55,77], suggest that the high-intensity program described above can be safely introduced to ND children, leading to notable improvements in overall performance outcomes. These findings are further supported by previous studies and aim to provide additional evidence for the implementation of this type of program for the broader ASD community [57]. In an effort to limit the costs of such programs, we chose to examine a more affordable method of training compared to the costs and supervision required for resistance training-focused HIIT. This finding is particularly intriguing from a rehabilitation standpoint, considering the challenges ND children face due to sensorimotor deficits and dyspraxia, which make learning on typical ground surfaces problematic [36,90]. Additionally, it is assumed that traditional methods of training athletes to refine skills may not be effective for children struggling with imitating, planning, and executing new skills [36]. Our data provide evidence against such an assertion.
According to Kindregan [7], gaining a deeper understanding of the gross movement dysfunction observed in children with ASD may enhance the likelihood of referrals to therapeutic interventionists who focus on addressing issues like muscular weakness, motor learning, postural control, and balance. Interventions targeted at mitigating the movement deficits, especially the spatiotemporal gait characteristics and shoulder kinematics identified in this study, could potentially enhance the functional ambulation of children with ASD, allowing them to navigate a dynamic environment more consistently and efficiently [5,7].

Supplementary Materials

The following supporting information can be downloaded at: https://www.mdpi.com/article/10.3390/sym17071073/s1, Additional tables are provided demonstrating individual contributions for spatiotemporal, symmetry, and energetic measurements. Additionally, joint angle measurements (mean, min, max, range) have been provided in Supplemental Data. Figures depicting data collection and joint angles are also provided. Figure S1: Diagram representing data collection. Spatiotemporal and kinematic data were collected via a lateral camera recording 15m sprints on a grass turf. Participants contributed at least five runs with a minimum of a two-minute break between each trial. Prior to the first HIIT session, participants contributed at least five runs with a minimum of a two-minute break between each running trial and participants were given the agency to decide to start another trial (a). Metabolic cost data were collected via a respirometry system. Participants ran at a fixed velocity until a steady state of oxygen consumption was achieved. All trials were captured via a lateral camera (b). Figure S2: Diagram representing the five joint angles measured during kinematic analysis. The shoulder angle was formed between the elbow, the shoulder, and a horizontal line parallel to the shoulder (a). The elbow angle was formed between the wrist, elbow, and shoulder (b). The hip angle was formed between the knee, hip, and an anterior horizontal line parallel to the hip (c). The knee angle was formed between the lateral malleolus, the knee, and the hip (d). The ankle angle was formed between the most anterior and superior aspect of the foot, the lateral malleolus, and the knee (e). Table S1: Anthropogenetic measurements [i.e., leg length (m)], gender, neurodevelopmental status [i.e., development], spatiotemporal gait variables [i.e., dimensionless speed, dimensionless stride duration, dimensionless stride length, duty factor (%)] represented as means ± standard deviations collected from 19 human participants (10:9 neurodivergent to neurotypical; denoted by development). Number of trial contributions is denoted by n. For the neurodivergent participants, Pre and Post denotes the pre- and post-program testing. For the neurotypical controls, all Post data fields remain empty, as they did not go through the training program. Table S2: Anthropogenetic measurements [i.e., leg length (m)], neurodevelopmental status [i.e., development], gender, and symmetry ratios [i.e., Stride Duration (%); Stride Length (%); Swing Time (%); Stance Time (%)] from 19 human participants (10:9 neurodivergent to neurotypical; denoted by development). For the neurodivergent participants, Pre and Post denotes the pre- and post-program testing. For the neurotypical controls, all Post data fields remain empty, as they did not go through the training program. Table S3: Anthropogenetic measurements [i.e., leg length (m), weight (kg)], neurodevelopmental status [i.e., development], gender, and energetic variables [i.e., cost of locomotion (J·s−1·kg−1), cost of transport (J·kg−1·m−1), cost of locomotion per cycle (J·kg−1·stride cycle−1)] from 12 human participants (6:6 neurodivergent to neurotypical; denoted by development). For the neurodivergent participants, Pre and Post denote the pre- and post-program testing. For the neurotypical controls, all Post data fields remain empty, as they did not go through the training program. Ground Running represents if the participant was also part of the cohort for the ground running analysis (spatiotemporal and kinematic analysis). Table S4: Mean, Maximum, Minimum, and Range of Motion (ROM) averages for all measured joint angles. Values are separated by development group (neurodivergent/neurotypical) and pre- or post-program testing (start/end). Number of trials for each group is denoted by n.

Author Contributions

Conceptualization, N.D.C., M.W.Y., S.K.L., M.C.G. and A.L.; Methodology, N.D.C., M.W.Y., S.K.L., M.C.G. and A.L.; Software, N.D.C., M.W.Y., R.N.J., S.J.K., J.Q.V., M.J.C., H.M.E., P.K., A.K. and M.C.G.; Validation, N.D.C., M.W.Y., M.C.G. and A.L.; Formal Analysis, N.D.C., M.W.Y., M.C.G. and A.L.; Investigation, N.D.C., M.W.Y., M.C.G. and A.L.; Resources, M.C.G. and A.L.; Data Curation, N.D.C., R.N.J., S.J.K., S.K.L., J.Q.V., M.J.C., H.M.E., P.K. and A.K.; Writing—Original Draft Preparation, N.D.C., M.W.Y., M.C.G. and A.L.; Writing—Review and Editing, N.D.C., R.N.J., S.J.K., S.K.L., J.Q.V., M.J.C., H.M.E., P.K. and A.K.; Visualization, N.D.C., M.W.Y. and M.C.G.; Supervision, M.C.G. and A.L.; Project Administration, M.C.G. and A.L.; Funding Acquisition, M.C.G. and A.L. All authors have read and agreed to the published version of the manuscript.

Funding

This study was funded in part by the Center for Biomedical Innovation at New York Institute of Technology and Inclusive Sports and Fitness.

Institutional Review Board Statement

The protocol was approved by the New York Institute of Technology College of Osteopathic Medicine Institutional Review Board (Protocol: BHS-1599). Approval date 07 June 2022.

Informed Consent Statement

All subjects gave their informed consent for inclusion before participating in the study.

Data Availability Statement

All data necessary to replicate the statistical analyses are provided in Supplemental Data.

Acknowledgments

We thank the occupational therapists, staff, and student aides of ISF who assisted with the training and supervision of the high-intensity training. We thank the participants and families for partaking in the trial. Additionally, we thank Nayan Pallothu and Aiza Chaudhry, who assisted with data curation and digitization.

Conflicts of Interest

The authors state that one of the coauthors (A.L.) conducted the training of the participants. However, it is important to note that all data collection and processing were performed independently by individuals not affiliated with Inclusive Sports and Fitness.

Abbreviations

The following abbreviations are used in this manuscript:
ASDAutism Spectrum Disorder
HIITHigh Intensity Interval Training
ISFInclusive Sports and Fitness
NDNeurodivergent
NTNeurotypical
RMRResting Metabolic Rate
MRMetabolic Rate
COLCost of Locomotion
COTCost of Transport

References

  1. American Psychiatric Association (Ed.) Diagnostic and Statistical Manual of Mental Disorders: DSM-5-TRTM, 5th ed.; Text Revision; American Psychiatric Association Publishing: Washington, DC, USA, 2022; ISBN 978-0-89042-576-3. [Google Scholar]
  2. Kangarani-Farahani, M.; Malik, M.A.; Zwicker, J.G. Motor Impairments in Children with Autism Spectrum Disorder: A Systematic Review and Meta-Analysis. J. Autism. Dev. Disord. 2023, 54, 1997. [Google Scholar] [CrossRef] [PubMed]
  3. Abdel Karim, A.E.; Mohammed, A.H. Effectiveness of Sensory Integration Program in Motor Skills in Children with Autism. Egypt. J. Med. Hum. Genet. 2015, 16, 375–380. [Google Scholar] [CrossRef]
  4. Bennett, H.J.; Haegele, J.A. Running Biomechanics of Adolescents with Autism Spectrum Disorder. J. Biomech. Eng. 2021, 143, 111005. [Google Scholar] [CrossRef]
  5. Dufek, J.S.; Eggleston, J.D.; Harry, J.R.; Hickman, R.A. A Comparative Evaluation of Gait between Children with Autism and Typically Developing Matched Controls. Med. Sci. 2017, 5, 1. [Google Scholar] [CrossRef]
  6. Fournier, K.A.; Hass, C.J.; Naik, S.K.; Lodha, N.; Cauraugh, J.H. Motor Coordination in Autism Spectrum Disorders: A Synthesis and Meta-Analysis. J. Autism. Dev. Disord. 2010, 40, 1227–1240. [Google Scholar] [CrossRef]
  7. Kindregan, D.; Gallagher, L.; Gormley, J. Gait Deviations in Children with Autism Spectrum Disorders: A Review. Autism Res. Treat. 2015, 2015, e741480. [Google Scholar] [CrossRef]
  8. Bhat, A.N. Motor Impairment Increases in Children with Autism Spectrum Disorder as a Function of Social Communication, Cognitive and Functional Impairment, Repetitive Behavior Severity, and Comorbid Diagnoses: A SPARK Study Report. Autism Res. 2021, 14, 202–219. [Google Scholar] [CrossRef] [PubMed]
  9. Rinehart, N.J.; Tonge, B.J.; Iansek, R.; McGinley, J.; Brereton, A.V.; Enticott, P.G.; Bradshaw, J.L. Gait Function in Newly Diagnosed Children with Autism: Cerebellar and Basal Ganglia Related Motor Disorder. Dev. Med. Child Neurol. 2006, 48, 819–824. [Google Scholar] [CrossRef]
  10. Vernazza-Martin, S.; Martin, N.; Vernazza, A.; Lepellec-Muller, A.; Rufo, M.; Massion, J.; Assaiante, C. Goal Directed Locomotion and Balance Control in Autistic Children. J. Autism Dev. Disord. 2005, 35, 91–102. [Google Scholar] [CrossRef]
  11. Weiss, M.; Moran, M.; Parker, M.E.; Foley, J. Gait Analysis of Teenagers and Young Adults Diagnosed with Autism and Severe Verbal Communication Disorders. Front. Integr. Neurosci. 2013, 7, 33. [Google Scholar] [CrossRef]
  12. Bennett, H.J.; Jones, T.; Valenzuela, K.A.; Haegele, J.A. Coordination Variability during Running in Adolescents with Autism Spectrum Disorder. Autism 2022, 26, 1201–1215. [Google Scholar] [CrossRef] [PubMed]
  13. Bennett, H.J.; Ringleb, S.I.; Bobzien, J.; Haegele, J.A. Are Gait Biomechanics Related to Physical Activity Engagement? An Examination of Adolescents with Autism Spectrum Disorder. Med. Sci. Sports Exerc. 2022, 54, 447. [Google Scholar] [CrossRef] [PubMed]
  14. Calhoun, M.; Longworth, M.; Chester, V.L. Gait Patterns in Children with Autism. Clin. Biomech. 2011, 26, 200–206. [Google Scholar] [CrossRef] [PubMed]
  15. Manicolo, O.; Brotzmann, M.; Hagmann-von Arx, P.; Grob, A.; Weber, P. Gait in Children with Infantile/Atypical Autism: Age-Dependent Decrease in Gait Variability and Associations with Motor Skills. Eur. J. Paediatr. Neurol. 2019, 23, 117–125. [Google Scholar] [CrossRef]
  16. Rinehart, N.J.; Tonge, B.J.; Bradshaw, J.L.; Iansek, R.; Enticott, P.G.; McGinley, J. Gait Function in High-Functioning Autism and Asperger’s Disorder. Eur. Child Adolesc. Psychiatry 2006, 15, 256–264. [Google Scholar] [CrossRef]
  17. Sebastião, E.; Bollaert, R.E.; Hubbard, E.A.; Motl, R.W. Gait Variability and Energy Cost of Oveground Walking in Persons with Multiple Sclerosis: A Cross-Sectional Study. Am. J. Phys. Med. Rehabil. 2018, 97, 646–650. [Google Scholar] [CrossRef]
  18. Brown, A.M.; Zifchock, R.A.; Hillstrom, H.J. The Effects of Limb Dominance and Fatigue on Running Biomechanics. Gait Posture 2014, 39, 915–919. [Google Scholar] [CrossRef]
  19. Gao, Z.; Fekete, G.; Baker, J.S.; Liang, M.; Xuan, R.; Gu, Y. Effects of Running Fatigue on Lower Extremity Symmetry among Amateur Runners: From a Biomechanical Perspective. Front. Physiol. 2022, 13, 899818. [Google Scholar] [CrossRef]
  20. Radzak, K.N.; Putnam, A.M.; Tamura, K.; Hetzler, R.K.; Stickley, C.D. Asymmetry between Lower Limbs during Rested and Fatigued State Running Gait in Healthy Individuals. Gait Posture 2017, 51, 268–274. [Google Scholar] [CrossRef]
  21. Bricout, V.-A.; Pace, M.; Dumortier, L.; Baillieul, F.; Favre-Juvin, A.; Guinot, M. Reduced Cardiorespiratory Capacity in Children with Autism Spectrum Disorders. J. Clin. Med. 2018, 7, 361. [Google Scholar] [CrossRef]
  22. Coffey, C.; Sheehan, D.; Faigenbaum, A.D.; Healy, S.; Lloyd, R.S.; Kinsella, S. Comparison of Fitness Levels between Elementary School Children with Autism Spectrum Disorder and Age-Matched Neurotypically Developing Children. Autism Res. 2021, 14, 2038–2046. [Google Scholar] [CrossRef] [PubMed]
  23. Pan, C.-Y. Motor Proficiency and Physical Fitness in Adolescent Males with and without Autism Spectrum Disorders. Autism 2014, 18, 156–165. [Google Scholar] [CrossRef]
  24. Pan, C.-Y.; Tsai, C.-L.; Chu, C.-H.; Sung, M.-C.; Ma, W.-Y.; Huang, C.-Y. Objectively Measured Physical Activity and Health-Related Physical Fitness in Secondary School-Aged Male Students with Autism Spectrum Disorders. Phys. Ther. 2016, 96, 511–520. [Google Scholar] [CrossRef]
  25. Tyler, K.; MacDonald, M.; Menear, K. Physical Activity and Physical Fitness of School-Aged Children and Youth with Autism Spectrum Disorders. Autism Res. Treat. 2014, 2014, e312163. [Google Scholar] [CrossRef] [PubMed]
  26. Bandini, L.G.; Gleason, J.; Curtin, C.; Lividini, K.; Anderson, S.E.; Cermak, S.A.; Maslin, M.; Must, A. Comparison of Physical Activity between Children with Autism Spectrum Disorders and Typically Developing Children. Autism 2013, 17, 44–54. [Google Scholar] [CrossRef]
  27. Pan, C.-Y. The Efficacy of an Aquatic Program on Physical Fitness and Aquatic Skills in Children with and without Autism Spectrum Disorders. Res. Autism Spectr. Disord. 2011, 5, 657–665. [Google Scholar] [CrossRef]
  28. Curtin, C.; Jojic, M.; Bandini, L.G. Obesity in Children with Autism Spectrum Disorders. Harv. Rev. Psychiatry 2014, 22, 93–103. [Google Scholar] [CrossRef] [PubMed]
  29. Cairney, J.; Hay, J.; Faught, B.E.; Corna, L.M.; Flouris, A.D. Developmental Coordination Disorder, Age and Play: A Test of the Divergence in Activity-Deficit with Age Hypothesis. Adapt. Phys. Act. Q. 2006, 23, 261–276. [Google Scholar] [CrossRef]
  30. Haga, M. Physical Fitness in Children with High Motor Competence Is Different from That in Children with Low Motor Competence. Phys. Ther. 2009, 89, 1089–1097. [Google Scholar] [CrossRef]
  31. Hands, B. Changes in Motor Skill and Fitness Measures among Children with High and Low Motor Competence: A Five-Year Longitudinal Study. J. Sci. Med. Sport 2008, 11, 155–162. [Google Scholar] [CrossRef]
  32. Sutapa, P.; Pratama, K.W.; Rosly, M.M.; Ali, S.K.S.; Karakauki, M. Improving Motor Skills in Early Childhood through Goal-Oriented Play Activity. Children 2021, 8, 994. [Google Scholar] [CrossRef]
  33. Donnelly, F.C.; Mueller, S.S.; Gallahue, D.L. Developmental Physical Education for All Children: Theory into Practice; Human Kinetics: Champaign, IL, USA, 2016; ISBN 978-1-4925-8565-7. [Google Scholar]
  34. Barnett, L.M.; van Beurden, E.; Morgan, P.J.; Brooks, L.O.; Beard, J.R. Childhood Motor Skill Proficiency as a Predictor of Adolescent Physical Activity. J. Adolesc. Health 2009, 44, 252–259. [Google Scholar] [CrossRef] [PubMed]
  35. Bhat, A.N.; Landa, R.J.; Galloway, J.C. Current Perspectives on Motor Functioning in Infants, Children, and Adults with Autism Spectrum Disorders. Phys. Ther. 2011, 91, 1116–1129. [Google Scholar] [CrossRef] [PubMed]
  36. Bodison, S.C. Developmental Dyspraxia and the Play Skills of Children with Autism. Am. J. Occup. Ther. 2015, 69, 6905185060. [Google Scholar] [CrossRef] [PubMed]
  37. Bouffard, M.; Watkinson, E.J.; Thompson, L.P.; Dunn, J.L.C.; Romanow, S.K.E. A Test of the Activity Deficit Hypothesis with Children with Movement Difficulties. Adapt. Phys. Act. Q. 1996, 13, 61–73. [Google Scholar] [CrossRef]
  38. Gong, L.; Liu, Y.; Yi, L.; Fang, J.; Yang, Y.; Wei, K. Abnormal Gait Patterns in Autism Spectrum Disorder and Their Correlations with Social Impairments. Autism Res. 2020, 13, 1215–1226. [Google Scholar] [CrossRef]
  39. Piek, J.; Bradbury, G.; Elsley, S.; Tate, L. Motor Coordination and Social–Emotional Behaviour in Preschool-aged Children. Int. J. Disabil. Dev. Educ.-Int. J. Disabil Dev. Educ. 2008, 55, 143–151. [Google Scholar] [CrossRef]
  40. Skinner, R.A.; Piek, J.P. Psychosocial Implications of Poor Motor Coordination in Children and Adolescents. Hum. Mov. Sci. 2001, 20, 73–94. [Google Scholar] [CrossRef]
  41. MacNeil, L.K.; Mostofsky, S.H. Specificity of Dyspraxia in Children with Autism. Neuropsychology 2012, 26, 165–171. [Google Scholar] [CrossRef]
  42. Delcour, M.; Russier, M.; Castets, F.; Turle-Lorenzo, N.; Canu, M.-H.; Cayetanot, F.; Barbe, M.F.; Coq, J.-O. Early Movement Restriction Leads to Maladaptive Plasticity in the Sensorimotor Cortex and to Movement Disorders. Sci. Rep. 2018, 8, 16328. [Google Scholar] [CrossRef]
  43. Mawson, A.R. Toward a Theory of Childhood Learning Disorders, Hyperactivity, and Aggression. ISRN Psychiatry 2012, 2012, 589792. [Google Scholar] [CrossRef] [PubMed]
  44. Hilton, C.L.; Cumpata, K.; Klohr, C.; Gaetke, S.; Artner, A.; Johnson, H.; Dobbs, S. Effects of Exergaming on Executive Function and Motor Skills in Children with Autism Spectrum Disorder: A Pilot Study. Am. J. Occup. Ther. 2014, 68, 57–65. [Google Scholar] [CrossRef]
  45. Lochbaum, M.; Crews, D. Viability of Cardiorespiratory and Muscular Strength Programs for the Adolescent with Autism. Complement. Health Pract. Rev. 2003, 8, 225–233. [Google Scholar] [CrossRef]
  46. Todd, T.; Reid, G. Increasing Physical Activity in Individuals with Autism. Focus Autism Other Dev. Disabil.-Focus Autism Dev. Disabil. 2006, 21, 167–176. [Google Scholar] [CrossRef]
  47. Gibala, M.J. High-Intensity Interval Training: A Time-Efficient Strategy for Health Promotion? Curr. Sports Med. Rep. 2007, 6, 211. [Google Scholar] [CrossRef]
  48. Koral, J.; Oranchuk, D.J.; Herrera, R.; Millet, G.Y. Six Sessions of Sprint Interval Training Improves Running Performance in Trained Athletes. J. Strength Cond. Res. 2018, 32, 617–623. [Google Scholar] [CrossRef]
  49. Rodríguez-Barbero, S.; González-Mohíno, F.; Rodrigo-Carranza, V.; Santos-Garcia, D.J.; Boullosa, D.; González-Ravé, J.M. Acute Effects of Interval Training on Running Kinematics in Runners: A Systematic Review. Gait Posture 2023, 103, 19–26. [Google Scholar] [CrossRef]
  50. Taylor, J.; Macpherson, T.; Spears, I.; Weston, M. The Effects of Repeated-Sprint Training on Field-Based Fitness Measures: A Meta-Analysis of Controlled and Non-Controlled Trials. Sports Med. 2015, 45, 881–891. [Google Scholar] [CrossRef]
  51. Bond, B.; Weston, K.L.; Williams, C.A.; Barker, A.R. Perspectives on High-Intensity Interval Exercise for Health Promotion in Children and Adolescents. Open Access J. Sports Med. 2017, 8, 243–265. [Google Scholar] [CrossRef]
  52. Lau, P.W.C.; Wong, D.P.; Ngo, J.K.; Liang, Y.; Kim, C.G.; Kim, H.S. Effects of High-Intensity Intermittent Running Exercise in Overweight Children. Eur. J. Sport Sci. 2015, 15, 182–190. [Google Scholar] [CrossRef]
  53. Nourry, C.; Deruelle, F.; Guinhouya, C.; Baquet, G.; Fabre, C.; Bart, F.; Berthoin, S.; Mucci, P. High-Intensity Intermittent Running Training Improves Pulmonary Function and Alters Exercise Breathing Pattern in Children. Eur. J. Appl. Physiol. 2005, 94, 415–423. [Google Scholar] [CrossRef]
  54. Kozlowski, K.F.; Lopata, C.; Donnelly, J.P.; Thomeer, M.L.; Rodgers, J.D.; Seymour, C. Feasibility and Associated Physical Performance Outcomes of a High-Intensity Exercise Program for Children with Autism. Res. Q. Exerc. Sport 2021, 92, 289–300. [Google Scholar] [CrossRef] [PubMed]
  55. Olin, S.S.; McFadden, B.A.; Golem, D.L.; Pellegrino, J.K.; Walker, A.J.; Sanders, D.J.; Arent, S.M. The Effects of Exercise Dose on Stereotypical Behavior in Children with Autism. Med. Sci. Sports Exerc. 2017, 49, 983–990. [Google Scholar] [CrossRef] [PubMed]
  56. Poon, E.T.-C.; Wongpipit, W.; Sun, F.; Tse, A.C.-Y.; Sit, C.H.-P. High-Intensity Interval Training in Children and Adolescents with Special Educational Needs: A Systematic Review and Narrative Synthesis. Int. J. Behav. Nutr. Phys. Act. 2023, 20, 13. [Google Scholar] [CrossRef] [PubMed]
  57. Leahy, A.A.; Kennedy, S.G.; Smith, J.J.; Eather, N.; Boyer, J.; Thomas, M.; Shields, N.; Dascombe, B.; Lubans, D.R. Feasibility of a School-Based Physical Activity Intervention for Adolescents with Disability. Pilot Feasibility Stud. 2021, 7, 120. [Google Scholar] [CrossRef]
  58. Granatosky, M.C.; Amanat, S.; Panyutina, A.A.; Youlatos, D. Gait Mechanics of a Blind Echolocating Rodent: Implications for the Locomotion of Small Arboreal Mammals and Proto-Bats. J. Exp. Zool. Part A Ecol. Integr. Physiol. 2021, 335, 436–453. [Google Scholar] [CrossRef]
  59. Granatosky, M.C.; McElroy, E.J.; Laird, M.F.; Iriarte-Diaz, J.; Reilly, S.M.; Taylor, A.B.; Ross, C.F. Joint Angular Excursions during Cyclical Behaviors Differ between Tetrapod Feeding and Locomotor Systems. J. Exp. Biol. 2019, 222, jeb200451. [Google Scholar] [CrossRef]
  60. Granatosky, M.C.; McElroy, E.J. Stride Frequency or Length? A Phylogenetic Approach to Understand How Animals Regulate Locomotor Speed. J. Exp. Biol. 2022, 225, jeb243231. [Google Scholar] [CrossRef]
  61. Chester, V.L.; Calhoun, M. Gait Symmetry in Children with Autism. Autism Res. Treat. 2012, 2012, 576478. [Google Scholar] [CrossRef]
  62. Delattre, N.; Lafortune, M.A.; Moretto, P. Dynamic Similarity during Human Running: About Froude and Strouhal Dimensionless Numbers. J. Biomech. 2009, 42, 312–318. [Google Scholar] [CrossRef]
  63. Alexander, R.M. Walking and Running. Math. Gaz. 1996, 80, 262–266. [Google Scholar] [CrossRef]
  64. Granatosky, M.C.; Bryce, C.M.; Hanna, J.; Fitzsimons, A.; Laird, M.F.; Stilson, K.; Wall, C.E.; Ross, C.F. Inter-Stride Variability Triggers Gait Transitions in Mammals and Birds. Proc. R. Soc. B 2018, 285. [Google Scholar] [CrossRef] [PubMed]
  65. Heglund, N.C.; Taylor, C.R. Speed, Stride Frequency and Energy Cost per Stride: How Do They Change with Body Size and Gait? J. Exp. Biol. 1988, 138, 301–318. [Google Scholar] [CrossRef] [PubMed]
  66. Halsey, L.G.; White, C.R. Terrestrial Locomotion Energy Costs Vary Considerably between Species: No Evidence That This Is Explained by Rate of Leg Force Production or Ecology. Sci. Rep. 2019, 9, 656. [Google Scholar] [CrossRef]
  67. Lighton, J.R. Measuring Metabolic Rates: A Manual for Scientists; Oxford University Press: Oxford, UK, 2008. [Google Scholar]
  68. R Core Team. R: A Language and Environment for Statistical Computing; R Foundation for Statistical Computing: Vienna, Austria, 2021. [Google Scholar]
  69. Kuznetsova, A.; Brockhoff, P.B.; Christensen, R.H.B. lmerTest Package: Tests in Linear Mixed Effects Models. J. Stat. Softw. 2017, 82, 1–26. [Google Scholar] [CrossRef]
  70. Nieuwenhuys, A.; Papageorgiou, E.; Desloovere, K.; Molenaers, G.; De Laet, T. Statistical Parametric Mapping to Identify Differences between Consensus-Based Joint Patterns during Gait in Children with Cerebral Palsy. PLoS ONE 2017, 12, e0169834. [Google Scholar] [CrossRef]
  71. Park, J.; Han, K. Quantifying Gait Asymmetry in Stroke Patients: A Statistical Parametric Mapping (SPM) Approach. Med. Sci. Monit. 2025, 31, e946754. [Google Scholar] [CrossRef]
  72. Bar-Haim, Y.; Bart, O. Motor Function and Social Participation in Kindergarten Children. Soc. Dev. 2006, 15, 296–310. [Google Scholar] [CrossRef]
  73. Danion, F.; Varraine, E.; Bonnard, M.; Pailhous, J. Stride Variability in Human Gait: The Effect of Stride Frequency and Stride Length. Gait Posture 2003, 18, 69–77. [Google Scholar] [CrossRef]
  74. Hausdorff, J.M.; Nelson, M.E.; Kaliton, D.; Layne, J.E.; Bernstein, M.J.; Nuernberger, A.; Singh, M.A.F. Etiology and Modification of Gait Instability in Older Adults: A Randomized Controlled Trial of Exercise. J. Appl. Physiol. 2001, 90, 2117–2129. [Google Scholar] [CrossRef]
  75. Mo, S.; Lau, F.O.Y.; Lok, A.K.Y.; Chan, Z.Y.S.; Zhang, J.H.; Shum, G.; Cheung, R.T.H. Bilateral Asymmetry of Running Gait in Competitive, Recreational and Novice Runners at Different Speeds. Hum. Mov. Sci. 2020, 71, 102600. [Google Scholar] [CrossRef]
  76. Li, Y.; Koldenhoven, R.M.; Liu, T.; Venuti, C.E. Age-Related Gait Development in Children with Autism Spectrum Disorder. Gait Posture 2021, 84, 260–266. [Google Scholar] [CrossRef] [PubMed]
  77. Arslan, E.; Ince, G.; Akyüz, M. Effects of a 12-Week Structured Circuit Exercise Program on Physical Fitness Levels of Children with Autism Spectrum Condition and Typically Developing Children. Int. J. Dev. Disabil. 2022, 68, 500–510. [Google Scholar] [CrossRef] [PubMed]
  78. Berryman, N.; Mujika, I.; Arvisais, D.; Roubeix, M.; Binet, C.; Bosquet, L. Strength Training for Middle- and Long-Distance Performance: A Meta-Analysis. Int. J. Sports Physiol. Perform. 2018, 13, 57–64. [Google Scholar] [CrossRef]
  79. Kram, R.; Taylor, C.R. Energetics of Running: A New Perspective. Nature 1990, 346, 265. [Google Scholar] [CrossRef]
  80. Pontzer, H. A Unified Theory for the Energy Cost of Legged Locomotion. Biol. Lett. 2016, 12, 20150935. [Google Scholar] [CrossRef] [PubMed]
  81. Arellano, C.J.; Kram, R. The Effects of Step Width and Arm Swing on Energetic Cost and Lateral Balance during Running. J. Biomech. 2011, 44, 1291–1295. [Google Scholar] [CrossRef]
  82. Arellano, C.J.; Kram, R. The Metabolic Cost of Human Running: Is Swinging the Arms Worth It? J. Exp. Biol. 2014, 217, 2456–2461. [Google Scholar] [CrossRef]
  83. Collins, S.H.; Adamczyk, P.G.; Kuo, A.D. Dynamic Arm Swinging in Human Walking. Proc. R. Soc. B Biol. Sci. 2009, 276, 3679–3688. [Google Scholar] [CrossRef]
  84. Castaño, P.R.L.; Suárez, D.P.M.; González, E.R.; Robledo-Castro, C.; Hederich-Martínez, C.; Cadena, H.P.G.; Vargas, P.A.S.; Montenegro, L.C.G. Effects of Physical Exercise on Gross Motor Skills in Children with Autism Spectrum Disorder. J. Autism Dev. Disord. 2023, 54, 2816–2825. [Google Scholar] [CrossRef]
  85. Hynes, J.; Block, M. Effects of Physical Activity on Social, Behavioral, and Cognitive Skills in Children and Young Adults with Autism Spectrum Disorder: A Systematic Review of the Literature. Rev. J. Autism Dev. Disord. 2023, 10, 749–770. [Google Scholar] [CrossRef]
  86. Pan, C.-Y.; Chu, C.-H.; Tsai, C.-L.; Sung, M.-C.; Huang, C.-Y.; Ma, W.-Y. The Impacts of Physical Activity Intervention on Physical and Cognitive Outcomes in Children with Autism Spectrum Disorder. Autism 2017, 21, 190–202. [Google Scholar] [CrossRef] [PubMed]
  87. Jackson, S.L.J.; Abel, E.A.; Reimer, S.; McPartland, J.C. Brief Report: A Specialized Fitness Program for Individuals with Autism Spectrum Disorder Benefits Physical, Behavioral, and Emotional Outcomes. J. Autism Dev. Disord. 2024, 54, 2402–2410. [Google Scholar] [CrossRef] [PubMed]
  88. Toscano, C.V.A.; Carvalho, H.M.; Ferreira, J.P. Exercise Effects for Children with Autism Spectrum Disorder: Metabolic Health, Autistic Traits, and Quality of Life. Percept. Mot. Ski. 2018, 125, 126–146. [Google Scholar] [CrossRef]
  89. Potdevin, F.; Gillet, C.; Barbier, F.; Coello, Y.; Moretto, P. Propulsion and Braking in the Study of Asymmetry in Able-Bodied Men’s Gaits. Percept. Mot. Ski. 2008, 107, 849–861. [Google Scholar] [CrossRef]
  90. Mostofsky, S.H.; Dubey, P.; Jerath, V.K.; Jansiewicz, E.M.; Goldberg, M.C.; Denckla, M.B. Developmental Dyspraxia Is Not Limited to Imitation in Children with Autism Spectrum Disorders. J. Int. Neuropsychol. Soc. 2006, 12, 314–326. [Google Scholar] [CrossRef]
Figure 1. Box plots showing the four dimensionless spatiotemporal gait variables: (a) dimensionless stride velocity, (b) dimensionless stride length, (c) dimensionless stride duration, and (d) duty factor (%). Each graph depicts the pre-program neurodivergent group (Pre), post-program neurodivergent group (Post), and neurotypical control group (Control). The orange “X” represents the mean.
Symmetry 17 01073 g001
Figure 2. Box plots showing the symmetry ratio for the following spatiotemporal values: (a) swing time (%), (b) stride duration (%), (c) stance time (%), and (d) stride length (%). Each graph depicts the pre-program neurodivergent group (Pre), post-program neurodivergent group (Post), and neurotypical control group (Control). The orange “X” represents the mean.
Symmetry 17 01073 g002
Figure 3. Kinematic angle tracking of five joints (shoulder, elbow, hip, knee, and ankle) through one stride (foot down to ipsilateral foot down), separated by pre- and post-program. Pre-Program compares the pre-intervention neurodivergent group to the neurotypical controls. Post-Program compares the post-intervention neurodivergent group to the same neurotypical controls. The solid line represents the mean value of the neurotypical group, and the grey ribbon represents one standard deviation. The dashed line represents the mean value of the neurodivergent group, and the blue ribbon represents one standard deviation. The darker grey represents the overlap between the two groups’ standard deviation. RMSE values are given in each graph, showing the differences between the two kinematic traces. The black shaded horizontal bar represents a statistically significant difference between the two strides at a given point (p = 0.05). Boxplots demonstrate the range of motion between the pre-program neurodivergent (Pre), post-program neurodivergent (Post), and the neurotypical control group (Control). The orange “X” represents the mean.
Symmetry 17 01073 g003
Figure 4. Kinematic angle tracking of five joints (shoulder, elbow, hip, knee, and ankle) through one stride (foot down to ipsilateral foot down), comparing the pre-program neurodivergent group to the post-program neurodivergent group. The dashed line represents the mean value of the pre-program neurodivergent group, and the blue ribbon represents one standard deviation. The solid line represents the mean value of the post-program neurodivergent group, and the grey ribbon represents one standard deviation. The darker grey represents the overlap between the two groups’ standard deviation. RMSE values are given in each graph, showing the differences between the two kinematic traces. The black shaded horizontal bar represents a statistically significant difference between the two strides at a given point (p = 0.05).
Symmetry 17 01073 g004
Figure 5. Box plots showing energetic variables (cost of locomotion (J·s−1·kg−1), cost of transport (J·kg−1·m−1), cost of locomotion per stride (J·kg−1·stride cycle−1). Each graph depicts the pre-program neurodivergent group (Pre), post-program neurodivergent group (Post), and neurotypical control group (Control). The orange “X” represents the mean.
Symmetry 17 01073 g005
Table 1. Demographic data regarding the subjects. Development notes the neurodevelopment of the group (neurotypical versus neurodivergent); gender notes the gender of each participant; n notes the number of participants in each demographic; age notes the mean age of the participants in years; leg length notes the average leg length in meters (m); and training duration notes the average number of weeks the individual remained in training.
DevelopmentGendernAge
(Mean ± Std)
Leg Length
(Mean ± Std)
Training Duration
(Mean ± Std)
Neurodivergent (ND)Male1212.08 ± 1.440.68 ± 0.0912.50 ± 7.15
Neurotypical (NT)Female510.60 ± 4.040.72 ± 0.19NA
Male1012.70 ± 1.340.79 ± 0.16NA
Table 2. Statistical parameters derived from linear mixed-effect models on dimensionless spatiotemporal variables. Development notes the neurodevelopment of the group (neurotypical versus neurodivergent); duration notes the amount of time the individual remained in training; age denotes the age of each participant; and foot denotes the side of the body of the measurement (left/right). Pre-program comparison compares pre-program neurodivergent to neurotypical participants (a). Neurodivergent change compares pre-program to post-program neurodivergent testing (b). Post-program comparison compares post-program neurodivergent to neurotypical participants (c). All statistical tests are referenced to neurodivergent participants, pre-program testing, and the left foot. Significant p-values are in bold.
Response Variable (Dimensionless)Fixed EffectEstimateStandard Errordft Valuep-Value
Pre-Program
Comparison (a)
VelocityDevelopment0.330.1219.032.680.015
Age−0.020.0319.10−0.870.393
Foot0.000.02191.040.001.000
Stride DurationDevelopment−0.230.0919.03−2.640.016
Age−0.020.0219.08−1.220.238
Foot0.000.01191.03−0.030.978
Stride LengthDevelopment0.350.2318.971.530.144
Age−0.100.0519.06−2.090.051
Foot0.000.05190.98−0.030.977
Duty FactorDevelopment−1.591.3318.92−1.190.247
Age0.400.2819.031.430.168
Foot−1.030.31190.93−3.340.001
Neurodivergent
Change (b)
VelocitySession0.380.03196.3414.26<0.001
Age−0.080.0510.03−1.540.155
Duration0.010.019.980.470.646
Foot0.000.03195.980.001.000
Stride DurationSession−0.020.02196.59−1.270.205
Age0.000.039.970.160.878
Duration0.010.019.871.210.255
Foot−0.010.02195.87−0.760.450
Stride LengthSession0.860.06196.3713.99<0.001
Age−0.170.109.99−1.590.142
Duration0.020.029.930.990.345
Foot−0.030.06195.93−0.450.654
Duty FactorSession−0.440.40196.32−1.100.272
Age0.490.719.960.690.507
Duration−0.090.169.90−0.550.592
Foot−1.160.39195.91−2.950.004
Post-Program
Comparison (c)
VelocityDevelopment−0.040.1419.07−0.300.766
Age−0.040.0319.12−1.240.229
Foot0.000.02181.090.001.000
Stride DurationDevelopment−0.190.0819.19−2.480.023
Age−0.030.0219.27−1.620.122
Foot−0.020.02181.22−1.210.226
Stride LengthDevelopment−0.470.2718.99−1.720.101
Age−0.140.0619.05−2.470.023
Foot−0.030.05181.01−0.690.490
Duty FactorDevelopment−1.241.2418.98−1.000.331
Age0.470.2619.121.820.084
Foot−2.160.35181.04−6.16<0.001
Table 3. Statistical parameters derived from linear mixed-effect models on symmetry between the left and right foot, measured by the logged symmetry ratio (STR/STL). Development notes the neurodevelopment of the group (neurotypical versus neurodivergent); duration notes the amount of time the individual remained in training; and age denotes the age of each participant. Pre-program comparison compares pre-program neurodivergent to neurotypical participants (a). Neurodivergent change compares pre-program to post-program neurodivergent testing (b). Post-program comparison compares post-program neurodivergent to neurotypical participants (c). All statistical tests are referenced to neurodivergent participants and pre-program testing. Significant p-values are in bold.
Response Variable (Dimensionless)Fixed EffectEstimateStandard Errordft Valuep-Value
Pre-Program
Comparison (a)
Ratio:
Stride Duration
Development0.000.01105.00−0.430.670
Age0.000.00105.00−0.610.543
Ratio:
Stride Length
Development0.000.01105.00−0.430.670
Age0.000.00105.00−0.610.543
Ratio:
Swing Time
Development0.020.0115.852.110.051
Age0.000.0019.511.050.304
Ratio:
Stance Time
Development−0.050.0320.25−1.930.067
Age−0.010.0122.02−1.020.319
Neurodivergent Change (b)Ratio:
Stride Duration
Session−0.020.01103.00−2.890.005
Age0.000.00103.000.140.888
Duration0.000.00103.000.720.476
Ratio:
Stride Length
Session−0.020.01103.00−2.890.005
Age0.000.00103.000.140.888
Duration0.000.00103.000.720.476
Ratio:
Swing Time
Session0.020.0195.101.400.164
Age0.000.0110.190.800.442
Duration0.000.009.571.350.209
Ratio:
Stance Time
Session−0.080.0395.70−3.200.002
Age0.000.019.76−0.320.753
Duration0.000.008.97−0.880.402
Post-Program
Comparison (c)
Ratio:
Stride Duration
Development0.010.01100.001.900.060
Age0.000.00100.00−1.020.309
Ratio:
Stride Length
Development0.010.01100.001.900.060
Age0.000.00100.00−1.020.309
Ratio:
Swing Time
Development0.010.0119.100.630.535
Age0.000.0021.880.710.488
Ratio:
Stance Time
Development0.020.0320.060.720.479
Age−0.010.0121.80−1.010.324
Table 4. Statistical parameters derived from linear mixed-effect models on the range of motion of five joints (shoulder, elbow, hip, knee, and ankle). Development notes the neurodevelopment of the group (neurotypical versus neurodivergent); duration notes the amount of time the individual remained in training; and age denotes the age of each participant. Pre-program comparison compares pre-program neurodivergent to neurotypical participants (a). Neurodivergent change compares pre-program to post-program neurodivergent testing (b). Post-program comparison compares post-program neurodivergent to neurotypical participants (c). All statistical tests are referenced to neurodivergent participants and pre-program testing. Significant p-values are in bold.
Joint AngleFixed EffectEstimateStandard
Error
dft Valuep-Value
Pre-Program
Comparison (a)
ShoulderDevelopment14.949.4919.071.570.132
Age−0.761.9819.04−0.380.706
ElbowDevelopment4.289.9719.120.430.673
Age−2.082.0819.08−1.000.330
HipDevelopment12.335.9818.952.060.053
Age−2.311.2518.93−1.850.080
KneeDevelopment2.438.8518.930.270.787
Age−3.221.8518.92−1.740.098
AnkleDevelopment5.644.7518.981.190.249
Age−3.270.9918.97−3.300.004
Neurodivergent
Change (b)
ShoulderSession7.004.6083.941.520.132
Duration−0.650.649.35−1.010.340
Age−2.082.809.82−0.740.475
ElbowSession−2.295.2394.00−0.440.663
Duration−0.950.4194.00−2.310.023
Age−2.781.8394.00−1.520.133
HipSession−3.242.0783.84−1.570.121
Duration−0.280.629.70−0.450.660
Age−5.602.689.83−2.090.064
KneeSession−3.792.3883.87−1.600.114
Duration−0.140.909.78−0.160.880
Age−6.123.889.86−1.580.146
AnkleSession−2.231.8284.28−1.230.224
Duration−0.190.3910.00−0.500.627
Age−2.481.6710.25−1.490.167
Post-Program
Comparison (c)
ShoulderDevelopment7.1610.6018.890.680.508
Age−0.992.2118.88−0.450.661
ElbowDevelopment5.749.2519.120.620.542
Age−1.971.9319.12−1.020.320
HipDevelopment16.306.1118.992.670.015
Age−3.221.2818.98−2.520.021
KneeDevelopment7.956.0618.821.310.206
Age−3.491.2718.81−2.760.013
AnkleDevelopment8.323.6919.112.250.036
Age−3.290.7719.10−4.27<0.001
Table 5. Statistical parameters derived from linear models on metabolic energetic costs of running: cost of locomotion (J·s−1·kg−1), cost of transport (J·kg−1·m−1), and cost of locomotion per cycle (J·kg−1·stride cycle−1). Development notes the neurodevelopment of the group (neurotypical versus neurodivergent); duration notes the amount of time the individual remained in training; and age denotes the age of each participant. Pre-program comparison compares pre-program neurodivergent to neurotypical participants (a). Neurodivergent change compares pre-program to post-program neurodivergent testing (b). Post-program comparison compares post-program neurodivergent to neurotypical participants (c). All statistical tests are referenced to neurodivergent participants and pre-program testing. Significant p-values are in bold.
MeasurementFixed EffectEstimateStandard
Error
t Valuep-Value
Pre-Program Comparison (a)Cost of LocomotionDevelopment −0.620.79−0.780.454
Age−0.060.35−0.180.863
Cost of TransportDevelopment −0.570.30−1.910.089
Age−0.040.13−0.290.777
Cost of Locomotion Per StrideDevelopment 5.783.541.630.137
Age−0.050.69−0.070.942
Neurodivergent Change (b)Cost of LocomotionSession −1.370.41−3.350.008
Age−0.600.27−2.180.057
Cost of TransportSession −0.600.21−2.820.020
Age0.040.140.280.785
Cost of Locomotion Per StrideSession−0.780.35−2.220.053
Age−0.410.24−1.750.114
Post-Program Comparison (c)Cost of LocomotionDevelopment 0.710.750.940.372
Age−0.020.33−0.060.955
Cost of TransportDevelopment 0.030.300.100.925
Age−0.030.13−0.210.836
Cost of Locomotion Per StrideDevelopment 0.810.711.140.283
Age0.130.310.410.693
Disclaimer/Publisher’s Note: The statements, opinions and data contained in all publications are solely those of the individual author(s) and contributor(s) and not of MDPI and/or the editor(s). MDPI and/or the editor(s) disclaim responsibility for any injury to people or property resulting from any ideas, methods, instructions or products referred to in the content.

