1. Introduction
Color Vision Deficiency (CVD) is a difference in the ability of individuals to perceive colors. It is caused by the partial or complete loss of function of one or more cone cells. In this context, it is divided into three main categories. These are anomalous trichromacy, dichromacy and monochromacy [
1].
Anomalous Trichromacy is a mild Color Vision Deficiency (CVD). It is characterized by dysfunction in one of the three cone cells in the retina of the eye. The three subtypes included in this category are Protanomaly, Deuteranomaly and Tritanomaly. Protanomaly is a reduced sensitivity to the color red due to a defect in the L-cone cell. Deuteranomaly is a reduced sensitivity to green colors due to a defect in the M-cone cell. Tritanomaly is a reduced sensitivity to blue colors due to a defect in the S-cone cell [
1]. Protanomaly, Deuteranomaly and Tritanomaly are also known as red weak, green weak and blue weak, respectively.
Dichromacy is a more serious Color Vision Deficiency (CVD) than Anomalous Trichromacy. It refers to the complete absence of one of the three cone cells in the retina of the eye. The three subtypes included in this category are Protanopia, Deuteranopia and Tritanopia. Protanopia is the loss of sensitivity to the color red due to the lack of the L-cone cell. Deuteranopia is the complete loss of sensitivity to the color green due to the lack of the M-cone cell. Tritanopia is the complete loss of sensitivity to the color blue due to the lack of the S-cone cell [
1]. Protanopia, Deuteranopia and Tritanopia species are also referred to as red blind, green blind and blue blind, respectively.
Monochromacy represents the condition wherein all cone cells are missing. It is possible to distinguish brightness variations. However, colors cannot be distinguished [
1].
Color Vision Deficiency (CVD) patients in the categories of Anomalous Trichromacy, Dichromacy and Monochromacy experience difficulties. However, it is possible to improve the visual experience of individuals with Color Vision Deficiency (CVD). In this context, the use of image processing techniques for the compensation of visual perception disorders has become prominent [
1]. Image processing, which is of great importance for the use and understanding of target data by Color Vision Deficiency (CVD) individuals, is a set of processes applied in editing and reconstructing images. It performs manipulations on images [
2,
3].
Image processing techniques are widely applied in many disciplines because they are critical to the accurate interpretation of visual data. In this context, studies that use image processing and artificial intelligence-based algorithms together are analyzed.
Essentially, the accurate and rapid classification of ophthalmic images is important for diagnosing eye diseases. It aims to facilitate and accelerate the detection of various eye diseases, such as diabetic retinopathy (DR) caused by the metabolic disorder known as diabetes and diabetic eye disease (DED), by means of image processing techniques applied to retinal fundus images. In this context, in the study [
4], by subjecting public retinal image datasets of DR disease to image processing processes such as preprocessing, enhancement, augmentation and normalization, and classifying them through a fine-tuned CNN model, RCKN, it achieved accuracy values of 99.09% and 98.7%. Similarly, the study [
5] draws attention to the importance of image processing for classification, which will enable the early detection of DED disease. The outputs obtained as a result of the application of traditional image processing techniques such as image quality improvement, image segmentation (region of interest) and image augmentation/duplication (geometric transformation) were given as inputs into the newly configured CNN model, and the 96.77 success rate obtained with the original images increased to 100 as a result of the image processing stages.
In the study [
6], it was attempted to improve the quality of retinal fundus images by using image preprocessing techniques such as the adaptive contrast enhancement algorithm (CLAHE) to increase local contrast, and Gamma correction to increase the density of features. CNNs are used for feature extraction in the detection of age-related macular degeneration (AMD), and then LSTM is used to distinguish these extracted features, and as a result, an advanced deep learning framework AMDNet23 is presented. As a result of the image processing techniques applied, a solid basis for classification was created with the increased quality of fundus images, and a successful result was derived, with an accuracy rate of 96.50%.
In a different study [
7], a median filter was used for noise removal on retinal OCT images. Then, Contrast Limited Adaptive Histogram Equalization (CLAHE) was applied for contrast improvements, followed by morphological processing, thresholding, and the removal of retinal layers with contour-based edge detection. The enhanced images obtained after these stages were classified with three different Convolutional Neural Network (CNN) models and used to detect four different eye diseases, and an accuracy rate of 96.50% was achieved.
In [
8], the authors aimed to automatically classify white blood cells (WBCs) from microscopic blood images for the purpose of diagnosing acute lymphoblastic leukemia (ALL). In this study, the cell nucleus and cytoplasm were separated from each other using image processing techniques, and various features based on shape, color and texture were extracted for each cell component. A new pixel cleaning approach was also proposed to reduce background noise, and these features were tested with different classification algorithms. In particular, 93% accuracy was achieved with support vector machines (SVMs).
In [
9], a deep learning-based method was proposed for the diagnosis of retinal diseases using optical coherence tomography (OCT) images. In the study, the data were normalized with a preprocessing process developed based on image processing techniques. In addition, processes such as denoising, contrast enhancement and region highlighting were applied. Then, classification was performed using a new convolutional neural network architecture with five convolutional layers with low computational cost. The proposed method achieved significant success in the detection of retinal diseases, with a success rate of 99.48%. This study revealed that image processing and deep learning techniques can provide high accuracy with low computational cost when used together.
In [
10], an image processing and Convolutional Neural Networks (CNN)-based method is presented for the classification of red blood cells (RBCs). In the proposed method, image processing steps such as color space transformation, edge detection, segmentation and morphological operations are applied to microscopic blood sample images to separate RBCs and extract features such as shape, size and color from each cell. The obtained data were analyzed with a 13-layer CNN architecture, and showed high classification success with 98.5% accuracy.
In the study [
11], a method for detecting and recoloring important areas in images was proposed in order to compensate for the color perception of Color Vision Deficiency (CVD) individuals. The method analyzes the importance maps of similar content images with image processing techniques. Then, it determines the image with the least color loss as a reference, and transfers the color scheme of this image to the target image. Thus, both color separation and visual importance are preserved, and the perceptual performance of the system increases. This approach not only improves color separation, but also increases the visual perception performance of the system by preserving the importance regions. In the study, the effectiveness of the method was verified with both objective evaluation metrics (AUC, AP, F-measure, RMS, MAE) and subjective user tests. The accuracy value reached up to 0.875. The use of image processing techniques increased the success rate and improved the perceptual experience of individuals with Color Vision Deficiency (CVD).
In the study [
12], Advanced Image Processing Techniques were used to improve the visual perception of individuals with Color Vision Deficiency (CVD). In this study, different correction steps were applied for both monochromatic and dichromatic Color Vision Deficiency (CVD). In the image processing process, many processing steps were performed, such as transformation from the RGB space to the LMS space, contrast enhancement, blurring, thresholding, morphological operations and color clustering. As a result of these operations applied to the Ishihara test images, it was stated that Color Vision Deficiency (CVD) individuals could see patterns and numbers that they could not distinguish before. The final versions of the images were transferred to a convolutional neural network trained using the MNIST dataset, and achieved 98.34% accuracy. In this respect, the study shows how effective image processing techniques are in overcoming visual disabilities such as Color Vision Deficiency (CVD), and reveals the potential of these techniques to be integrated into different applications.
In [
13], similar to our study, a filter design was carried out to improve the vision of Color Vision Deficiency (CVD) individuals based on Ishihara color tests. However, this filter, which did not work well in real-world images, was reworked as a filter in which the dullest/lightest shades were removed and all red tones were shifted to darker vibrant shades. The testing phase of this study [
13] was carried out by comparing the responses of a group of healthy and Color Vision Deficiency (CVD) individuals. The result of the study suggests that Color Vision Deficiency (CVD) individuals can accurately identify the colors in the picture, while at the same time the picture continues to look natural for those with normal vision.
As a result of the literature review, it can be seen that image processing techniques can be used as an effective tool both in medical image analysis and in visual compensation systems for individuals with Color Vision Deficiency (CVD). Image processing techniques supported by deep learning exhibit superior performance in various applications. As a result, the combined use of image processing techniques and deep learning approaches stands out as a promising research area in medical diagnosis and visual enhancement systems.
In this study, a new image processing filter based on a five-stage system that complements and supports itself has been developed. The hybrid filter design offers a powerful approach that has the potential to be integrated into products developed for Color Vision Deficiency (CVD) individuals. In objectively measuring the success of the developed filters independent of human judgment, the MobileNetV1 convolutional neural network architecture has typically been preferred. In this direction, the simulation outputs of how the original and enhanced images are perceived by Color Vision Deficiency (CVD) individuals are classified with the proposed architecture. As a result of the classification, the simulation outputs of the images improved within the scope of the final filter outperformed the simulation outputs of the original images. Thanks to this functionality that minimizes perception asymmetry, perceptual symmetry was provided to re-establish visual harmony and perceptual balance for Color Vision Deficiency (CVD) individuals.
2. Methodology
Digital images are a numerical representation of visual data that can be processed by computers. These images are composed of pixels. The color and brightness values of each pixel are numerically defined [
2]. Digital image processing is an important topic for digital images. This approach covers a series of operations such as analyzing, enhancing and transforming images. It provides fast and accurate results, especially in the fields of medicine, security and industry [
14].
Image processing is a discipline that enables high accuracy and efficiency in various applications by analyzing and processing visual data. Approaches developed in this field play an important role, especially for those with Color Vision Deficiency (CVD), in helping individuals to perceive images accurately. Advances in this field make images more accessible in order to overcome visual difficulties due to Color Vision Deficiency (CVD). CNN-based deep learning tools can be used to objectively evaluate the effectiveness of these solutions. CNNs have a powerful analytics capacity, enabling them to overcome distortions in color perception and provide individuals with a more accurate visual experience.
In this chapter, we present a novel methodological approach to accurately classifying different types of Color Vision Deficiency (CVD). In this direction, the image processing applications were carried out on the Google Colaboratory platform. The classification process was performed on a local computer equipped with an Intel i7-9750H CPU @ 2.60 GHz and 32 GB of RAM. The dataset used in the study, the image processing filters developed, and the classification process are explained in detail below.
2.1. Dataset
The dataset used in this study was created within the framework of a course project at Kuban State University. The project aims at the automatic recognition of Ishihara Color Vision Deficiency (CVD) test cards. The dataset contains digits between 0 and 9 and consists of 1400 images in total. At the beginning of each image, the digit of that image is labeled, followed by the name of the font used and the type of color rendering (colorization type). These features represent a structure that allows one to study the effects of different font and color combinations for the Color Vision Deficiency (CVD) test. The dataset was designed to enable the recognition of Ishihara test cards with various font and color variations, and provides an important resource for analyzing the effects of different parameters in visual recognition processes related to Color Vision Deficiency (CVD) [
15]. Sample images of blue blind, blue weak, green blind, green weak, mono, red blind and red weak classes in the dataset are presented in
Figure 1.
In
Figure 1, there are examples of different variations of Color Vision Deficiency (CVD) types. These examples are images of the digit 0 in the categories “blue blind”, “blue weak”, “green blind”, “green weak”, “mono”, “red blind” and “red weak”. Each type of Color Vision Deficiency (CVD) represents differences in the way individuals perceive colors. The images in
Figure 1 visually represent the effects of color perception for each type of Color Vision Deficiency (CVD).
In this study, the original images and the images enhanced using the proposed 5-stage filter were processed at 200 × 200 pixels. In the classification process, 80% of the dataset was divided into training data and 20% of the dataset was divided into test data. This ratio is suitable for assessing the generalizability of the model and testing its accuracy.
2.2. Model Development
In recent years, significant progress has been made in the field of image processing. In particular, deep learning-based approaches have radically transformed techniques in image processing [
16]. Image processing involves the process of processing, analyzing and transforming visual data into meaningful information. In this process, image analysis plays an important role, because the analysis of visual data allows meaning to be extracted from these data. Deep learning methods not only make these analysis processes more efficient, but also enable the production of new visual content [
17]. In this way, the boundaries between image processing and image analysis have become increasingly closer, and the two fields have become complementary.
Image processing approaches offer the ability to analyze large amounts of data quickly and effectively, providing significant advantages in a variety of fields. These technologies are particularly powerful in detecting details that the human eye cannot detect, and minimizing errors. In addition, image processing techniques, which are constantly evolving with developing artificial intelligence and machine learning methods, make it possible to obtain highly accurate results even with limited data [
18]. These advantages enable the development of effective and efficient applications in areas such as medicine, security and automation.
The model development process, built using image processing and deep learning approaches, aims to model the perception of cards in the Ishihara dataset by people with different types of Color Vision Deficiency (CVD). First, the original images are classified. In the second stage, classification is performed on the simulated images using the proposed image processing approach.
2.2.1. Image Processing
An image is a mathematical function representing horizontal and vertical positions in a two-dimensional coordinate system, denoted by f(x,y). In this function, the x and y coordinates determine the horizontal and vertical positions of the image, while f(x,y) is called the “pixel” or “intensity” [
19]. A continuous image, which is considered as a continuous data type, needs to be converted into digital form in order to be processed in a computer environment. This transformation process consists of two basic stages: sampling and quantization. Sampling is the sampling of a continuous image at regular intervals on a rectangular grid. Quantization is the expression of the sampled values at specific numerical levels (e.g., between 0–255). The digital image is a two-dimensional matrix of numbers that stores the data of the pixels obtained as a result of these processes [
20]. Each element of the matrix is called a pixel (PEL—picture element) and constitutes the smallest unit of the image. Each pixel has a single value that represents the light intensity at a particular point in the image. The numerical representation of pixels forms the basis of image processing algorithms. Each pixel carries the information at a specific point in the image, allowing visual data to be processed, analyzed and manipulated in a computer environment [
21].
Images are classified into three main categories: Binary Images, Gray Level Images and Color Images. Binary Images are images where each pixel value is 0 or 1. Gray Level Images are images consisting of black and white tones, where pixel values usually vary between 0 and 255. Color Images are images defined in RGB (Red, Green, Blue) or other color spaces, containing multiple channel values for each pixel [
22].
It is important to improve visual perception for individuals with Color Vision Deficiency (CVD) by using image processing techniques on images defined in RGB and gray level color space. Image enhancement is achieved by image processing techniques selected to positively affect the performance of the final output. Image enhancement is the process of modifying an image to transform it into a format suitable for human interpretation and perception [
23]. It also allows certain features to be emphasized on the image. Spatial Domain Methods and Frequency Domain Methods are the approaches used to enhance the image without distortion.
Spatial Domain Methods include methods that directly manipulate image pixels [
24]. With this method, the value of each pixel is directly processed regardless of its relationship with other pixels around it. Contrast Stretching, Noise Filtering and Histogram Modification are examples of spatial domain methods used for image enhancement and analysis [
23].
Frequency Domain Methods are the operations performed on the components of images that are converted into frequency components using mathematical equations [
24]. Fourier transform is used to analyze the pixel values in the image in the frequency domain.
In this study, a novel image processing filter is developed to overcome limitations and optimize color perception correction performance for Color Vision Deficiency (CVD) individuals. This approach is built on a five-step model, with each step complementing and supporting each other.
In this study, we present step-by-step simulation outputs of how the original images and the images enhanced by the proposed image processing steps are seen by Color Vision Deficiency (CVD) individuals.
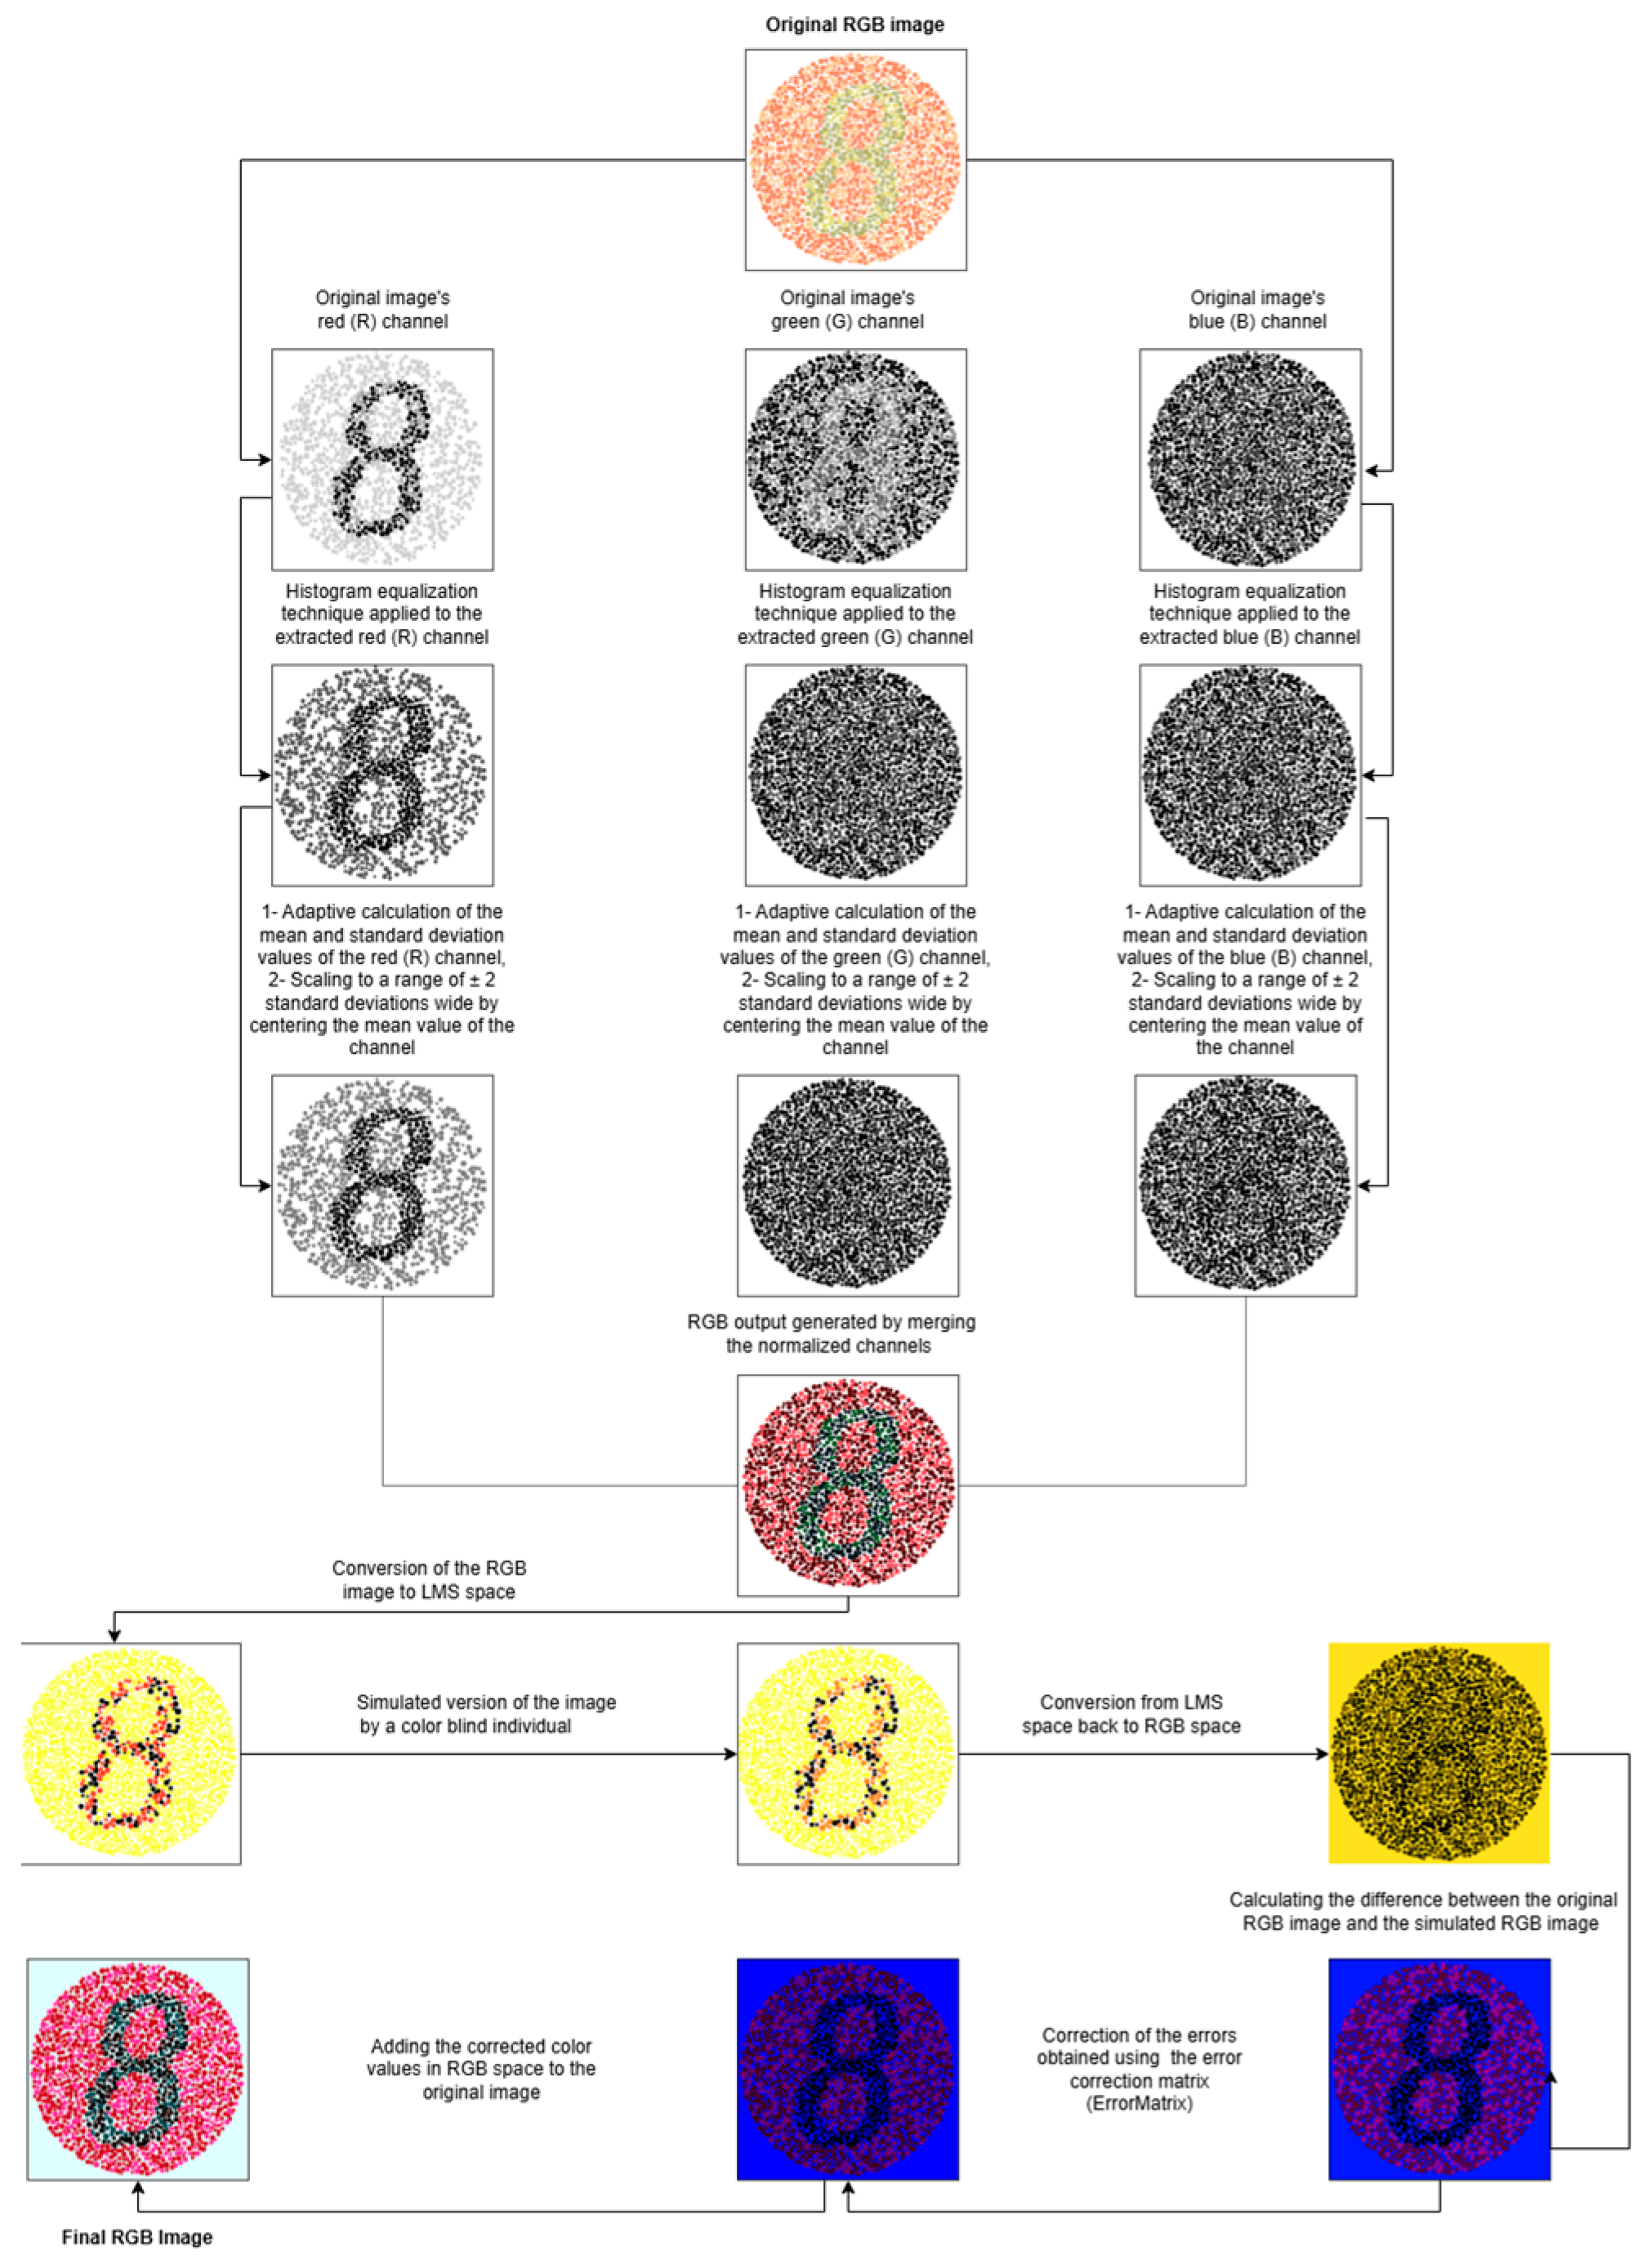
Proposed Image Processing Filter Version 1
Since the past, many studies have been conducted to improve color perception in individuals with Color Vision Deficiency (CVD). For example, the Daltonization algorithm is a widely used approach in the field of Color Vision Deficiency (CVD) correction. Therefore, it is planned to modify the Daltonization algorithm in the presented work.
In Proposed Image Processing Filter Version 1, normalization is first applied to the original images. Normalization analyzes the statistical properties of the color channels in detail to improve the effectiveness of the algorithm, and aims to significantly improve the visual performance of the image. In image processing, normalization is used to equalize the pixel density in images [
25].
The basic steps of the normalization process are as follows.
First, the input image is divided into R, G and B channels.
Contrast is increased by applying histogram equalization on each channel.
The mean value (μ) and standard deviation (σ) are calculated for each channel.
- -
Mean (μ): Represents the overall average of the pixel intensities [
26].
- -
Standard deviation (σ): It measures how much the intensities deviate from the mean and determines the contrast variation [
27].
Normalization compresses pixel values between their minimum (μ − 2σ) and maximum (μ + 2σ) values. This range covers approximately 95.5% of the data in a normal distribution [
26]. At this stage, compressing the values for each channel into a range of mean ± 2 standard deviations is performed to place the pixel values for the channels into a range that covers 95.5% of the pixel values. This process helps to minimize the effects of excessive brightness and excessive darkness in the image.
The applied normalization process makes it possible to reconstruct the coefficients before applying the Daltonization algorithm on the image. After the normalization process performed on the image within the Proposed Image Processing Filter Version 1 filter, the Daltonization Algorithm is applied.
The Daltonization algorithm aims to correct the color information lost in the image perceived by a Color Vision Deficiency (CVD) individual with the LMS color space. This makes it possible to compensate for the missing colors in the cones representing sensitivity to long (L), medium (M) and short (S) wavelengths. The algorithm includes CVD matrices that allow the simulation of Color Vision Deficiency (CVD), defined for three basic types of Color Vision Deficiency (CVD) (Protanopia, Deuteranopia and Tritanopia) [
28,
29,
30]. In this study, we use the CVD matrix designed for the Deuteranopia type, in which green color perception is significantly reduced. All stages of the Daltonization algorithm, which was constructed by making use of [
28,
29], are presented below.
- 1.
RGB-LMS Color Transform: In the first stage of the algorithm, the original RGB (Red, Green, Blue) image is transformed into LMS (long, medium, short wavelength) color space, which represents the physiological structure of the human visual system. The 3 × 3 matrix used in this transformation is characterized as [17.8824, 43.5161, 4.11935; 3.45565, 27.1554, 3.86714; 0.0299566, 0.184309, 1.46709] [
29].
- 2.
Color Vision Deficiency (CVD) Simulation
In the LMS color space, Color Vision Deficiency (CVD) is simulated using a predefined CVD matrix for Deuteranopia. The 3 × 3 matrix defined for the simulation is characterized as [0, 2.02344, −2.52581; 0,1,0; 0,0,1] [
29].
- 3.
LMS-RGB Conversion
The image in LMS space obtained after simulation is converted back to RGB color space using optimized transformation matrices. Unlike the traditional algorithm, in this work the matrix coefficients are reconstructed and optimized to improve color perception. These trial-and-error modifications are intended to achieve better results in color detection. The original and modified 3 × 3 matrices are [0.0809444479, −0.130504409, 0.116721066; −0.0102485335, 0.0540193266, −0.113614708; −0.000365296938, −0.00412161469, 0.693511405] [
28] and [0.0809444479, −0.130504409, 0.216721066; −0.0102485335, 0.050740193266, −0.113614708; −0.001065296938, −0.0412161469, 0.793511405]. The updated change matrix for the values determined within the original and modified matrices is obtained as [0, 0, +0.1; 0, −0.0033, 0; −0.0007, −0.0371, +0.1]. These updated values show an increase of +0.1 for the effect of S-Channel (Short Wavelength) on R-Channel, a decrease of −0.0033 for the effect of M-Channel (Medium Wavelength) on G-Channel, a decrease of −0.0007 for the effect of L-Channel (Long Wavelength) on B-Channel, a decrease of −0.0371 for the effect of M-Channel on B-Channel, and an increase of +0.1 for the effect of S-Channel on B-Channel. Thus, a more visually successful simulation was here achieved for Color Vision Deficiency (CVD) individuals.
- 4.
Error Analysis and Correction
The color differences between the original and simulated images can be analyzed using Equations (1)–(3). They are then multiplied by the error matrices given in Equation (4) [
29].
This step shifts the colors to the visible spectrum [
29].
- 5.
Adding the Corrected Color Values to the Original Image
The shifted color values in the RGB space obtained with Equation (4) are integrated into the original image. The mathematical expression of this situation is given in Equations (5)–(7) [
29].
This process creates an optimized image that can be perceived by individuals with Color Vision Deficiency (CVD).
- 6.
Visualization and Conclusion
In the final stage, the R, G and B channels depicted in Equations (5)–(7) are merged. This results in an error-corrected RGB image. This image is important for individuals with Color Vision Deficiency (CVD), providing them with more effective color perception.
The flow diagram of the Proposed Image Processing Filter Version 1 is given in
Figure 2.
The flow diagram in
Figure 2 shows the steps of the Daltonization Algorithm developed within the Proposed Image Processing Filter Version 1 on a sample Ishihara card image.
Proposed Image Processing Filter Version 2
The second filter developed in Proposed Image Processing Filter Version 2 is a modification of the shifting algorithm presented in [
29]. Accordingly, the steps of the shifting algorithm are presented below.
The image is converted from BGR color space to HSV color space [
29].
The values for the hue channel are shifted using the mathematical equation hsv_image[y, x][0] = (hsv_image[y, x][0] + h × 180). In this mathematical equation, the value of h is set as 0.3 [
29].
The pixel values in the hue channel are normalized to the 0–1 range by dividing by 180. In this process, if the values are less than zero, they are equal to zero. If the value is greater than one, one is subtracted from the normalized value and the result is multiplied by 180 again, and it is assigned to the relevant pixel. Thus, the pixel values are arranged in the specified range [
29].
The image in the HSV color space is converted into the RGB (Red/Red, Green/Green, Blue/Blue) color space and returned by the function [
29].
The output of these steps is shown in
Figure 3.
In the image processing hierarchy shown in
Figure 3, an innovative enhancement process performed on the saturation channel of the image is integrated to add originality to the shifting algorithm presented in [
29]. The details of the originalities including “adjusting tone” and “converting the image from HSV color space to RGB color space” in
Figure 3 are presented below.
The image output obtained using the shifting algorithm is converted to the HSV color space.
Each pixel value in the saturation channel is multiplied by a coefficient of 2.1. This coefficient value is determined by trial and error. As a result of this process, it is possible to make the colors appear brighter by increasing the saturation level (adjusting tone).
Converting the image from HSV color space to RGB color space.
This integrated improvement ensures that the final performance improves.
Proposed Image Processing Filter Version 3
In Proposed Image Processing Filter Version 3, a hybrid approach has been developed by integrating Daltonization and Shifting algorithms enriched with unique contributions to optimize Color Vision Deficiency (CVD) correction performance. This innovative combination combines the strengths of both algorithms to provide a more comprehensive color correction solution.
The steps of the hybrid structure are as follows:
- 1.
Applying the Normalization Process
The normalization process mentioned in Proposed Image Processing Filter Version 1 is applied to the RGB input image.
- 2.
Separation into Color Channels
The resulting normalized image is split into B, G and R channels.
- 3.
Application of the Daltonization Algorithm
To each color channel (B, G, R), the Daltonization algorithm is applied.
- 4.
Converting the image to RGB Space
After Daltonization and normalization, the resulting image is converted to RGB Space.
- 5.
Implementation of the Shifting Algorithm
After daltonization, the image is given as input to the shifting algorithm. Accordingly, first, the transformation to HSV color space is performed. Then Hue shifting is applied for the Hue (H) channel. This process is formulated as follows:
The shift of the Hue channel value is performed.
Then, the value is bounded.
- 6.
Implementation of Enhance (Increasing Color Saturation) Algorithm
By enhancing each pixel in the saturation (S) channel in the HSV color space, colors are perceived more clearly. Thus, the process of increasing color saturation is performed.
- 7.
Final Output
In the final stage, the saturated enhanced image is converted to the RGB color space to obtain the final output.
The visual setup of this seven-stage process is given in
Figure 4.
The sequential integration of the algorithms in
Figure 4 creates a synergistic effect, giving better results than when each is used alone. As a result of this hybrid approach, vision is improved in more Color Vision Deficiency (CVD) types, visual aesthetic quality is improved, and the distinction between color tones becomes clearer.
The synergistic integration of Daltonization and shifting algorithms in the hybrid approach presented in this study provides a more comprehensive solution by maximizing the advantages of both methods. The developed hybrid study is a new perspective in Color Vision Deficiency (CVD) correction technologies. It provides a promising basis for future work.
Proposed Image Processing Filter Version 4
In Proposed Image Processing Filter Version 4, a multi-stage image processing approach is presented using a Fourier transform-based approach with enhanced Daltonization and shifting algorithms starting from the BGR color space.
The steps of the proposed approach are as follows:
- 1.
Separation of Color Channels
The input image is divided into B, G and R channels
- 2.
Implementation of the Daltonization Algorithm
Each color channel (B, G, R) is passed through the daltonization algorithm.
- 3.
Application of Normalization
This is used to pull the values of the image to a certain range. It scales the value of each pixel in the image to a minimum of 0 and a maximum of 255.
- 4.
Converting the Image to RGB Space
After Daltonization and normalization, the resulting image is converted to the RGB color space.
- 5.
Implementation of the Shifting Algorithm
The RGB image is given as input to the shifting algorithm. First, a transformation to HSV color space is performed. Then, shifting is applied in the Hue (H) channel. The formulation of the algorithm applied in this section is given below.
- a.
After shifting the Hue channel, the value is kept between 0 and 180,
Here, 180% is the limit of the Hue value in the color cycle.
- b.
Then, the value is checked again and the limitation is achieved.
- 6.
Realization of Color Space Transformation
The image is converted to grayscale format.
- 7.
Edge Detection Using the Prewit Method in the Fourier Domain
The Prewit filter in the Fourier domain is used to emphasize the horizontal and vertical edges of the image. The process is performed in six steps. These steps are presented below.
The image is Fourier transformed to analyze its frequency components.
- b.
Adaptation of Prewitt Masks to the Frequency Domain
To detect horizontal (Mx) and vertical (My) edges, the Prewitt mask is made the same size as the image (by filling it with zeros). The mask is then transformed into the frequency domain.
The “frequency components” and “mask frequency components” are multiplied in the Fourier domain.
- d.
Applying the Inverse Fourier Transform
The Inverse Fourier transform is applied to the result processed in the frequency domain.
- e.
Calculation of Gradient Magnitude
The strength of the edges is combined with the responses in the X and Y directions.
Scaling is provided so that the gradient size is correctly displayed on the image.
- 8.
Obtaining the Final Image
The output obtained is returned.
The visual setup of this eight-stage process is given in
Figure 5.
The multi-stage image processing approach presented in
Figure 5 optimizes image quality and edge detection accuracy while providing efficient transitions between color spaces. The use of the Prewitt frequency filtering technique is an important part of edge detection for the target region.
Proposed Image Processing Filter Version 5
In Proposed Image Processing Filter Version 5, an approach has been developed that emphasizes the weight values applied to the image channels. The development of this approach was specifically designed to address color detection challenges and optimize the output. Building the filters in hierarchical order has a positive impact on the final result. The steps of the proposed approach are as follows:
The input image is split into channels B, G and R.
- 2.
Application of the Daltonization Algorithm
The Daltonization algorithm is applied to each color channel (B, G, R).
- 3.
Performing the Normalization Process
This is applied to pull the pixel values of the image into a certain range. As a result of this process, each pixel in the image is scaled with a minimum value of 0 and a maximum value of 255.
- 4.
Converting the image to RGB Color Space
The image is converted to RGB color space.
- 5.
Saturation and Brightness Enhancement
The image matrix obtained after the Daltonization and Normalization processes is summed on a pixel basis with the specified value. Thus, saturation and brightness enhancement is performed. The stages are given below.
- a.
Converting the Image to HSV Color Space
The image is converted to HSV Color Space to prepare the ground for further processing.
The Saturation (S) channel of the image in HSV color space is incremented by summing with the specified value.
The Value (V) channel of the image in HSV color space is incremented by summing with the specified value.
- d.
Converting the image to RGB Color Space
The image is converted back to RGB color space.
- 6.
Implementation of the Shifting Algorithm
The RGB image is given as input to the Shifting algorithm. Accordingly, the image is first converted to HSV color space and the pixels in the Hue (H) channel are shifted with a value of 0.3. Then, the process is completed by converting the image back to RGB color space. The scrolling operation is given below.
Here, 100% limits the Hue value in the color cycle. This improves color adjustments. In the last stage, the HSV color space is transformed to RGB color space.
- 7.
Edge detection using the Prewit method in the Fourier domain
The Prewitt filter is used in the Fourier domain to emphasize the horizontal and vertical edges of the image. The Prewitt filter is applied separately for each channel of the image in RGB color space, and the appearance of the colors is changed by applying weights to make a difference between the channels. Then the “Saturation and Brightness Enhancement” process is applied on the resulting image. The process is performed in six steps. These steps are presented below.
- a.
Separation into Color Channels
The input image is split into R, G and B color channels.
- b.
Applying Prewitt Filter to Channels
This algorithm highlights the horizontal and vertical edges of an image using Prewitt filters in the frequency domain, applied separately for each channel.
This functionality is realized in six steps:
The image is Fourier transformed to analyze its frequency components.
- ii.
Adaptation of Prewitt Masks to the Frequency Domain
To detect horizontal (M
x) and vertical (M
y) edges, the Prewit mask is made the same size as the image (by filling it with zeros). The mask is then transformed into the frequency domain.
The “frequency components” and “mask frequency components” are multiplied in the Fourier domain.
- iv.
Inverse Fourier Transform
The inverse Fourier transform is applied to the result processed in the frequency domain.
- v.
Calculation of Gradient Magnitude
The strength of the edges is determined by combining the responses in the X and Y directions.
Scaling is provided so that the gradient size is correctly displayed on the image.
- vii.
Returning the output obtained
- c.
Assigning Weights to Channels
Color channels are combined with different weights to change the appearance of colors and make certain colors more dominant than others.
The filtered and weighted channels are merged.
- e.
Increasing Saturation and Brightness
Contrast and Brightness Enhancement
The contrast and brightness of the image are increased. Alpha is the contrast multiplier applied to the image; beta is the brightness value added to the image.
The visual setup of this process, which consists of eight stages, is given in
Figure 6.
The multi-stage image processing approach presented in
Figure 6 optimizes image quality and edge detection accuracy by providing efficient transitions between color spaces.
2.3. MobilenetV1 Transfer Learning Architecture
MobileNetV1 is a convolutional neural network (CNN) architecture developed for mobile and embedded devices. Developed by Google, this model is designed to perform effective image classification in environments with limited computational resources [
31]. This architecture accepts fixed-size (224 × 224) and three-channel (RGB) images as input. The model applies various filters to the images it processes in order to analyze and understand the images. In addition, the MobileNetV1 architecture demonstrates its learning capacity with 4.2 million learned parameters [
32]. The advantage of MobileNetV1 is that a successful accuracy rate is achieved with fewer parameters and less programming compared to traditional convolutional neural networks [
33].
The main feature of the MobileNetV1 architecture is that it uses the depthwise separable convolution approach. This approach consists of two separate operations: depthwise convolution and pointwise convolution. In depth convolution, a convolution filter is applied to each input channel independently. In this way, each channel is processed spatially within itself. In pointwise convolution, information flow between channels is provided using 1 × 1 convolution kernels [
33].
MobileNetV1 consists of 13 main convolution layers that do not contain redundant connections and are linearly ordered. Each layer is supported by five hidden layers that include operations such as zero padding, depth-based, batch normalization, ReLU activation and feature map extraction. The Average Pooling layer, which comes after the convolutional layers, simplifies feature extraction while reducing spatial dimensions. Finally, the Fully Connected layer performs the classification process [
32].
The architecture’s separable convolution module reduces both the number of parameters and computational complexity, allowing modern mobile devices to fully utilize the CPU and GPU processing power [
33]. Thus, image recognition speed increases without decreasing accuracy, and there is no loss in image quality [
33]. Thanks to this feature, it has become applicable on mobile devices with limited computational resources, and has found use in various fields, especially in medical imaging [
31].
MobileNetv1 has achieved high accuracy in various image classification tasks [
31]. This architecture shows impressive performance in tasks such as object recognition, image classification and face detection, even in resource-constrained environments [
34]. Image processing filters developed in light of these features have been successfully classified and implemented with MobileNetv1.
3. Results and Discussion
The areas and purposes for which image processing technology, which has become indispensable today, is used can be quite diverse. The positive impact of this technology, which includes many techniques such as morphological operations, noise reduction, and edge detection, across many different sectors such as health, automotive, security, and defense, is undeniable. In this paper, an exemplary study is carried out to determine the benefits that image processing can provide to humanity.
The integrated use of image processing with developing artificial intelligence technologies plays an important role in obtaining meaningful information from raw data, which becomes increasingly important in the context of the digitalizing world. Processing digital images makes it easier to highlight critical components and enhance perception. Therefore, a powerful image processing hierarchy was developed in this study. Thus, image processing techniques developed by adopting innovative and original approaches have enabled the construction of filters that help Color Vision Deficiency (CVD) individuals see.
Another important issue is the objective evaluation of Color Vision Deficiency (CVD), independent of human judgment. The Ishihara test card dataset [
15], which has been frequently used by doctors from past to present to detect Color Vision Deficiency (CVD) during the evaluation process, is also used in this study. The Ishihara test cards, which are quite common, contain a hidden number or line created by combining elements of different colors and sizes that only healthy individuals can distinguish. The main purpose of this test is to detect visual disorders such as Color Vision Deficiency (CVD) [
35].
In this study, a two-stage evaluation system for Color Vision Deficiency (CVD) was developed. In the first stage of this evaluation system, original and filtered images were simulated for seven different Color Vision Deficiency (CVD) types using a simulator called the color blindness simulator [
30]. Simulation outputs provide a description of how the target image appears to seven different Color Vision Deficiency (CVD) individuals. In the second stage, simulation outputs were tested in a format independent of human trials using the MobileNetV1 transfer learning architecture. Performance criteria for the training and testing process are given in
Table 1,
Table 2,
Table 3,
Table 4,
Table 5,
Table 6,
Table 7 and
Table 8.
Table 1,
Table 2,
Table 3,
Table 4,
Table 5,
Table 6,
Table 7 and
Table 8 present an analysis of the performance metrics derived when using the MobileNetV1 transfer learning architecture for seven different Color Vision Deficiency (CVD) types simulated within the training and test datasets. In this analysis, it is seen that the Color Vision Deficiency (CVD) type with the highest detection accuracy is the blue blind type. The second best-performing Color Vision Deficiency (CVD) type is blue weak. This evaluation indicates that patients with blue blind and blue weak Color Vision Deficiency (CVD) types do not have much difficulty in perceiving images. However, it is clear that patients with green blind, green weak, mono, red blind and red weak Color Vision Deficiency (CVD) types have difficulties in daily life. The classification results derived with the simulation outputs confirm this. Therefore, a powerful five-stage combination including image processing approaches was performed. The combination process at each stage is explained in detail below.
In the first filter version, a new improved filter providing color compensation was created by integrating the normalization process into the Daltonization algorithm. Proposed Image Processing Filter Version 1 has shown success in detection performance in patients with Green weak and Red weak Color Vision Deficiency (CVD) types compared to other types.
In the second filter version, a new filter was developed by integrating a unique enhancement process performed on the saturation channel of the image into the shifting-based algorithm. Proposed Image Processing Filter Version 2 does not have a standout performance when compared to the classification results derived with the original and Proposed Image Processing Filter Version 1 simulation outputs. However, it is valuable because it is used in the creation of other filters.
Proposed Image Processing Filter Version 3, which was developed by using the hybrid structures of Proposed Image Processing Filter Version 1 and Proposed Image Processing Filter Version 2, achieved a high performance in detection accuracy for patients with green blind, green weak, Monochromacy, red blind and red weak Color Vision Deficiency (CVD) types. It also showed sufficient success in classifying simulation outputs related to blue blind and blue weak Color Vision Deficiency (CVD) types.
In the fourth version, a new filter was developed by integrating the Proposed Image Processing Filter Version 3, which is a hybrid structure created by combining Daltonization and Shifting filters, with a Fourier transform-based multi-stage image processing approach. This version, 4, performed similarly to Proposed Image Processing Filter Version 3. However, it did not show as high a success rate as Proposed Image Processing Filter Version 3 for types other than blue blind, green blind and Monochromacy Color Vision Deficiency (CVD).
Image Processing Filter Version 5, which is based on Image Processing Filter Version 4 and consists of the improved format of Version 4, is the design that provides maximum performance. In this version, a frequency-based Prewitt filter is applied to each color channel, and edge enhancement is achieved with channel-based weighting. It also includes saturation and details. Simulation outputs have produced performance values that demonstrate tremendous detection success for all types of Color Vision Deficiency (CVD).
These developed filters provide the harmony between color tones for individuals with color blindness. This makes it easier to perceive images. However, the random use of image processing algorithms is insufficient in obtaining the harmony between color tones. In order to discover the combinations that allow the reconstruction of the image, it is necessary to successfully construct the hierarchy between the algorithms. In this context, the proposed image processing filters are constructed as a result of long experiments. On the other hand, the evaluation of the success of these approaches is critical. In this study, the MobileNet transfer learning architecture is used to provide an evaluation independent of human judgment. The MobileNetV1 transfer learning architecture is preferred for use in evaluating the simulation outputs of the original and improved images. Thus, the success results of the developed filter designs can be evaluated independently of human judgment. This independence is valuable to ensuring the system is objective, consistent, scalable and unbiased.
When the results obtained with the MobileNet transfer learning approach were examined, the accuracy rates obtained for the images to which each filter was applied were analyzed. These accuracy rates were higher for at least one type of color blindness compared to the results obtained with the original images.
The new approaches introduced in the first two filters have been modified. Each filter showed a more successful performance in at least one color blindness type. However, the second filter did not show a high performance compared to the other developed filters. However, each filter developed after the second filter included the application of the previous filter. Therefore, the development of the second filter is necessary for the third, fourth and fifth filters to achieve maximum success.
The third filter is formed by using the hybrid of the first two filters. Each filter created after the third filter is created by using the previous filter. The final filter developed in the final stage is a new design that optimizes the detection success in patients with all types of color blindness. It also offers an output that produces maximum performance compared to other filters.
In many recent studies, it has been seen that the basic building blocks of image processing techniques, such as contrast enhancement, blurring, morphological operations, thresholding and color space transformations, can be restructured and provide effective solutions for specific problems. A significant portion of these studies focus on how existing techniques can be made more successful with appropriate combinations and scenario-specific parameter settings, rather than proposing new algorithms [
36,
37,
38,
39,
40].
The method proposed in this study is based on the successful results obtained by combining existing techniques in a unique way and optimizing parameters. These approaches, which are fundamental in the field of image processing, can provide significant improvements in color blindness correction when restructured with appropriate combinations. For example, the Dalton and shifting algorithms are two of the algorithms developed. However, it is stated in [
29] that such methods are not equally effective for all types of color blindness. In the relevant study, it is stated that the Daltonization algorithm is implemented for all types of dichromatic color blindness (Protanopia, Deuteranopia, Tritanopia), whereas the shifting color algorithm is proposed only for Tritanopia. Therefore, our main aim is to create a filter that will optimize performance in all types of color blindness. To this end, new combinations were created inspired by the Daltonization and shifting algorithms. The results show that the combination strategies constructed after long experimental processes are effective, and achieve successful results in color blindness correction. In particular, filter version 5 made an evaluation independent of human judgment for the Ishihara dataset. In this context, the MobileNetv1 transfer learning architecture used achieved over 90% accuracy for all types of color blindness. In order to compare the methodology used and performance derived in this study, the articles featured in the literature from the last 5 years have been scanned and are presented in
Table 9.
When
Table 9 is examined, it can be seen that the studies conducted within the scope of image processing are concentrated in the field of medicine. Therefore, the use of image processing methods is necessary in color blindness defect detection, which is one of the studies related to color perception. According to expert assessment, individuals with color blindness vision defects face some limitations and difficulties in daily life. This situation can affect the choice of profession as well as reducing quality of life standards. Therefore, it has a potential use in terms of adaptation to daily life. It is valuable for studies that are planned to correct the defect in line with the patient’s preferences. However, it should not be forgotten that Ishihara test cards, infographic maps and schematic drawings are visuals with controlled color transition, without background clutter. The data to be processed are clean. However, real natural images are noisy data with information density and soft color transitions. Pre-processing on the image is required before applying the filter. Therefore, we should plan to develop pre-processing filters on the powerful and diverse datasets provided in future studies. Thus, the success of applying any type of filter can be easily maximized.


