1. Introduction
Following the 2016 U.S. [
1,
2,
3] presidential election, the influence of fake news on voters during the electoral process emerged as a subject of widespread concern. Media analyses indicated that fake news has the potential to ensnare not only politicians and celebrities but also ordinary individuals. In her second public appearance after her electoral defeat, Hillary Clinton urged action against the proliferation of fake news. She highlighted that many serious news reports are increasingly becoming entertainment-driven and biased, rather than adhering to factual accuracy. Controversial and sensational content, politicians, and commentators are highly captivating due to their ability to draw attention. While such content may not offer substantial information, it certainly provides entertainment. During her tenure as first lady, amidst the Whitewater scandal, the Travelgate scandal, and the Filegate scandal, Hillary Clinton consistently declined to reveal additional information to the media and later denounced the Lewinsky scandal as a conspiracy. During the 2020 U.S. presidential election [
4,
5,
6], a plethora of rumors disseminate widely, including skepticism about the election results and allegations of voter fraud, which led to unrest and protest activities among certain segments of the population. In the context of Brexit, rumors circulated about the consequences of leaving the European Union [
7], including false predictions regarding the economy, borders, and immigration, causing unnecessary public anxiety. In India, rumors about religion and caste on social media have led to several violent incidents, such as conflicts triggered by rumors about a “beef ban” between different communities.
In stark contrast, Trump adeptly employed social media tactics to craft an image of himself as a “political icon”. By orchestrating a matrix of multiple accounts, he leveraged a synergistic dissemination effect, with social media acting as a protective shield to consolidate the domestic political arena. This backing laid the groundwork for his portrayal as a valiant president, bolstering his rhetorical authority and self-assurance on social media platforms. Concurrently, Trump merged the roles of “president” and “media”, disrupting the conventional political communication model of “president-media-audience” and thereby reducing the credibility, reach, and impact of traditional media outlets. Social media emerged as his primary battleground for self-promotion and political discourse. Trump’s social media strategy exemplifies the theory of opinion leadership, in which the sway of opinion leaders over audience decision-making surpasses that of mass media. As a political opinion leader, Trump adeptly conveyed his viewpoints and policy proposals to millions of followers through social media, effectively sculpting public sentiment.
With the rise of globalization, media plays an increasingly significant role in communication and dissemination. However, the infiltration of some aspects of Western culture into China, akin to flies in fresh air, is having a detrimental effect on young people. First, X-rated films profoundly impact minors, corrupting their innocent minds and poisoning their lives. Second, the prevalence of violent movies on television is steering youth down the wrong paths. In recent years, it has been common to encounter violent content whenever the TV is turned on, and children, being impressionable, struggle to cope with such intense images. Lastly, it appears that negative news tends to dominate media headlines. It is evident that young people exposed to these stories risk developing a distorted worldview. These events show that the rapid dissemination and significant impact of rumors require joint efforts from the government, media, and the public to strengthen the identification of and resistance to rumors [
8,
9], as well as to enhance information literacy, in order to mitigate the adverse effects of rumors on society [
10,
11].
The development of accurate rumor propagation models and thorough dynamic analysis forms the cornerstone of effective rumor containment strategies [
12,
13,
14,
15]. Historically, the field was revolutionized by Daley and Kendall’s seminal DK model (1965), which provided the foundational framework for rumor studies. Subsequent advancements by Maki and Thompson yielded the refined MT model. These pioneering models have stimulated extensive research into the complex mechanisms underlying information propagation [
16] and explored information diffusion across heterogeneous networks, while Wang et al. [
17] developed a novel public opinion dissemination model that incorporates emotional factors and distinguishes between languages, such as Chinese, English, or French. Rumor dissemination is subject to constant change due to linguistic barriers. Wang et al. [
17] also conducted numerical simulations on various parameters; they found that enhancing the rate of information exchange between languages could expand the reach of public opinion. Zhao et al. [
18] investigated the impact of the “hibernator” condition on public opinion dissemination and proposed a corresponding model. Xu et al. [
19], considering individual attitudes toward the dissemination of public opinion, emphasized the importance of the allure and uncertainty of opinion content. Tan and Cheong [
20] proposed a generalized dynamic opinion model, demonstrating that consensus formation on specific issues can enhance discussion diversity across multiple topics. As social networks continue to evolve, their influence on public opinion dissemination is becoming increasingly significant. Consequently, social networks should be prioritized as the principal intervention channel for public opinion regulation. Previous research by Cheng et al. [
21] has established a time-delay interaction model, developed rumor containment strategies, and introduced an optimal control framework for information management. Scholars employ various methods to solve differential equations and ascertain stability, with the Routh–Hurwitz stability criterion being the most commonly used approach. Moreover, several individuals have also explored other factors that affect the dissemination of public opinion [
22].
Based on the aforementioned description, we develop rumor dissemination models incorporating time-delay effects and investigate their dynamic behaviors [
22,
23]. The model in the text assumes that the population is homogeneous in terms of dissemination behavior (e.g., parameters such as the dissemination rate and the cessation rate are consistent for all individuals). This homogeneity is essentially a manifestation of translational symmetry (individuals are interchangeable). When a rumor emerges online, social network platform regulatory authorities typically implement damage control measures to mitigate its spread. This study develops an optimal control framework for rumor containment, employing Pontryagin’s Maximum Principle to achieve cost-effective suppression. The research offers four key contributions: (1) the development of time-delay rumor propagation models with rigorous stability analysis of equilibrium states; (2) the identification of Hopf bifurcation thresholds through parameter optimization and critical delay determination; (3) the design of a continuous control mechanism for efficient rumor mitigation within defined temporal constraints; and (4) empirical validation through numerical simulations and real-world case studies, demonstrating the practical applicability of the proposed methodology.
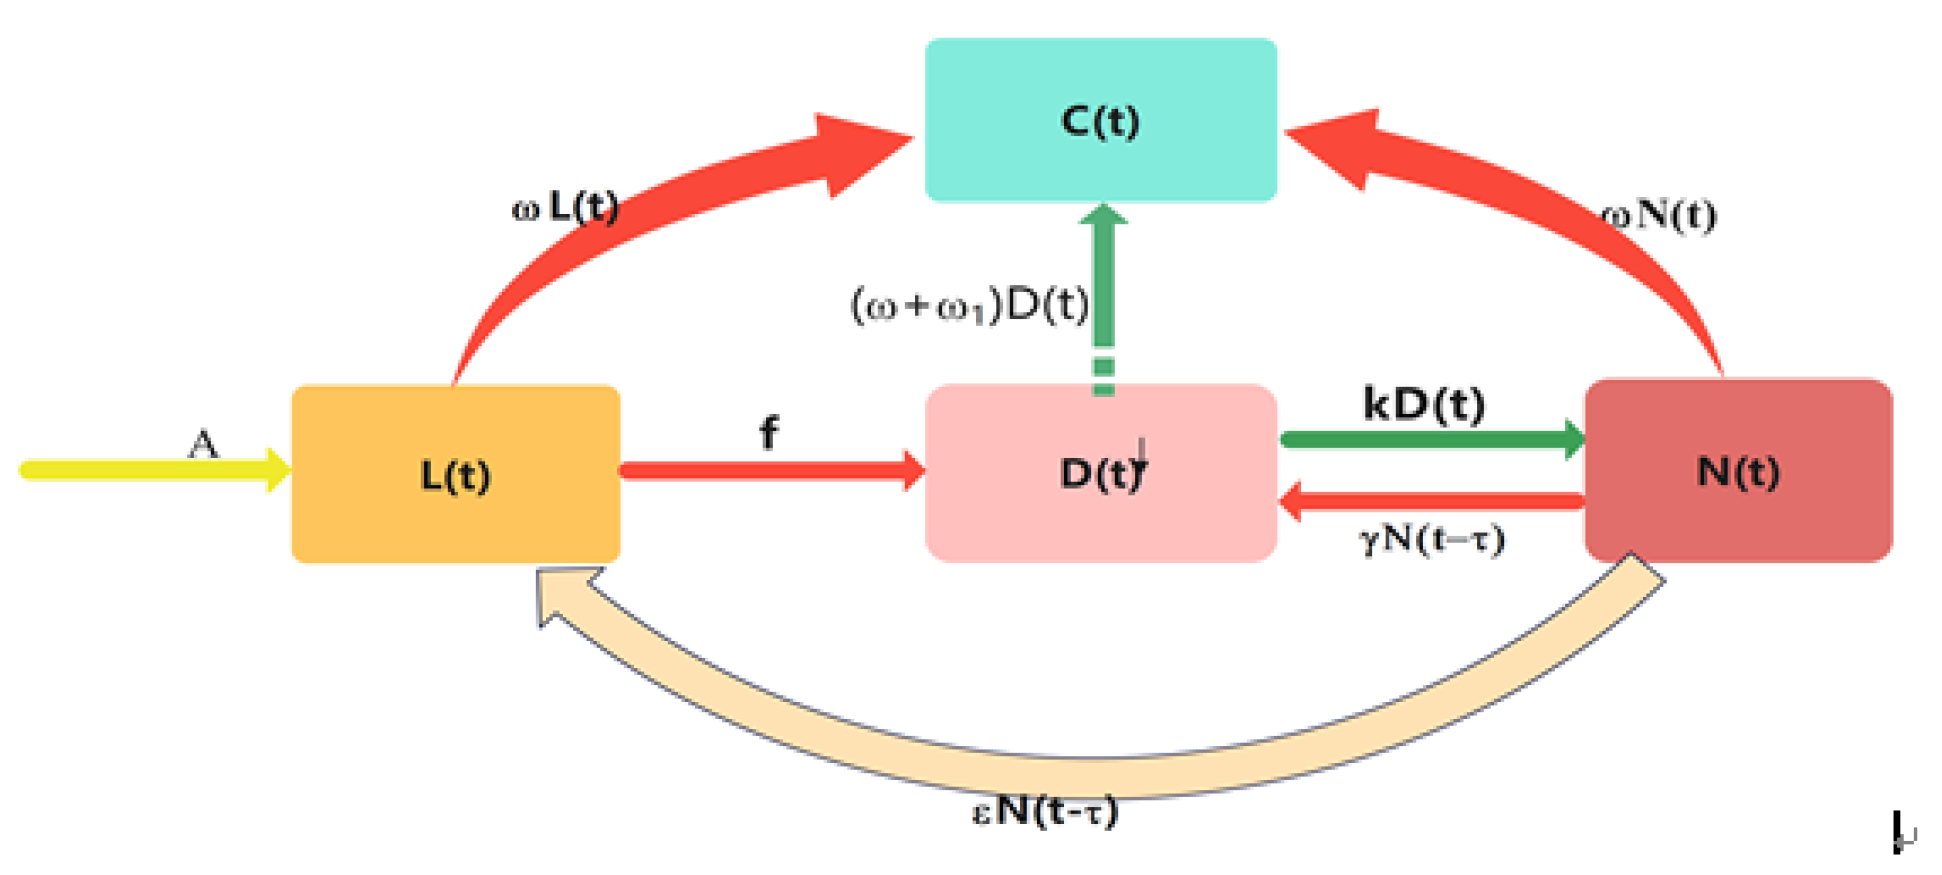
This paper divides the population in a rumor environment into four categories, latent disseminators, disseminators, non-disseminators, and quitters, and it establishes an
model with network public opinion channelization coefficient, a population inflow rate,
A, and an outflow rate,
and
. The dissemination mechanism of rumor events in a dynamic rumor environment is studied through the model, and the key factors affecting the development of rumor events are analyzed. Then, the solution of the model is analyzed, and a policy suggestion is put forward. The model formulation is presented in
Section 2, followed by the analysis of solution properties in
Section 3, focusing on positivity and boundedness.
Section 4 establishes the equilibrium states and determines the critical threshold.
Section 5 examines Hopf bifurcation occurrence and performs local stability analysis at equilibrium points. Finally,
Section 6 addresses global dynamics through Lyapunov function construction. In
Section 7, the issue of optimal control is presented for the studied model; we bring to light results regarding the existence of the optimal control and its characterization, implementing Pontryagin’ s maximum principle. In
Section 8, some numerical simulations are provided to verify the effectiveness of the theoretical results.
Section 9 concludes this paper.
2. The Methods of Model Formulation
The rules governing rumor dissemination can be encapsulated as follows.
(1) The dissemination of rumors is often acute and rapid. In some cases, the process is irreversible; for instance, individuals in the quitter category,
, should not re-enter the susceptible state .
(2) Non-disseminators, , are considered to no longer enter the early dissemination phase of latent disseminators, , and they are vulnerable to a repeated dissemination event. We can consider non-disseminators , to enter the early dissemination phase of latent disseminators, , and a repeated dissemination event. The group’s transmission rate is, .
(3) The dissemination of rumors can be facilitated through communication media. Due to the dissemination of individuals from a non-disseminating state to a susceptible or actively disseminating state, an average time delay, , is introduced in the development of carriers. Specifically, individuals who ceased dissemination at time may resume spreading at time t. Through interactions, susceptible individuals can be influenced by those who are actively disseminating rumors at the same time.
(4) At the initial time,
, the whole population is ignorant until the first rumor dissemination of misinformation online. In the dissemination diagram, the population inflow rate is indicated by users who engage in the relevant online rumor environment, Meanwhile,
, as the population outflow rate, indicates a user who is not interested in the rumor issue and withdraws from the online public environment (shown in
Figure 1).
(5) We assume that the controlling agent (“authorities”) has the ability to impact the dissemination of the rumor through some policies. In this study, we consider the intervention of authorities to cause people to leave an environment’s dissemination rate as .
(6) The saturation dissemination rate is a mathematical form used to describe the speed of public opinion dissemination. It takes into account the possibility that the dissemination rate may be limited and tend to saturate when the number of disseminators is large. The form of this incidence rate is usually expressed as
, where
is the transmission coefficient, L is the number of latent disseminators, D is the number of disseminators, and
is the saturation factor [
24,
25]. The saturation transmission rate simulates the decrease in the transmission rate due to factors such as behavioral changes and official resource limitations as the number of disseminators increases. This form of incidence rate can more reasonably reflect the spread of certain public opinions, especially when considering crowd behavioral changes and congestion effects. The saturation transmission rate is widely applied in models like public opinion, helping to more accurately simulate and predict the dynamics of spread, particularly in situations where public opinion dissemination may be affected through inhibitory effects. By choosing appropriate parameters, this incidence form can prevent the unbounded growth of the contact rate, thus describing the public opinion process more reasonably [
26,
27].
The role of the saturation factor in the model is to introduce a restrictive factor to simulate the decrease in the dissemination rate due to limitations in resources, individual behavioral changes, or other factors as the number of dissemination individuals increases. The saturation effect more accurately reflects the dynamics of rumor dissemination within a population, particularly when the number of dissemination individuals is high. In such cases, the dissemination rate does not increase indefinitely but tends to stabilize at a certain level.
Hence, we introduce a compartmental diagram for rumor dissemination (
Figure 1).
The population’s evolutionary trajectory is mathematically characterized through a set of coupled differential equations, expressed as system (
1):
The corresponding mathematical formulation of the dissemination dynamics of rumor is given as follows: is the recurrence rate of rumor dissemination. k is the stop rate of rumor dissemination. is the dissemination rate of the from non-disseminators , to latent disseminators . is the delay in dissemination.
The developed model shows that the variables
, and
are independent of
. For further analysis, we can focus on the following reduced system. All system parameters maintain positive values in accordance with their biological significance in human population modeling [
28]. The initial values for the dynamical system (
1) must be defined as follows:
This study defines the scope of mathematical modeling through the following constraints to ensure the rationality of the model:
4. The Method for Equilibrium Points and the Threshold of the Model
The proposed dynamical system (
1) possesses precisely two biologically meaningful steady-state solutions, both located within the non-negative orthant.
(i) Dissemination-free equilibrium
,
, when no dissemination occurs, at which point all the rumor dissemination components are zeros.
When
,
, we can get
.
(ii) Interior equilibrium
when transmission persists in the system. The system’s equilibrium state, designated as
, is analytically established in this section. For model system (
1), equilibrium
corresponds to the nontrivial solution of the subsequent equation set.
On solving the above, we get
The threshold parameter is derived using the next-generation matrix approach. Within a system [
31,
32], the dissemination dynamics are captured via compartment
,
. Through matrix decomposition, the system can be partitioned into
, where
represents the transmission component matrix
and the transition component matrix
for dissemination and non-dissemination associated terms, respectively. The governing equations for the public opinion dissemination network are expressed as follows:
Now, we can write
First, we find the required Jacobian matrix,
The Jacobian matrices
and
evaluated at
are provided as
The threshold
corresponds to the spectral radius of the next-generation matrix, i.e.,
,
Then,
We find the feature value:
We work out
Thus, the threshold is obtained as follows:
In the expression of the threshold , the parameters appear in a symmetric form, reflecting the balance between transmission and suppression mechanisms.
5. The Method of Local Stability
The stability of model system (
1) is analyzed at both the equilibrium state free of dissemination and the interior equilibrium state. The dissemination-free equilibrium (DFE)
represents the state of complete absence of dissemination, while the interior equilibrium
corresponds to the persistent dissemination scenario. Stability determination involves computing the Jacobian matrix and analyzing the sign patterns of its eigenvalues. The Jacobian matrix
J is a matrix obtained by linearizing the system at the equilibrium point
and
. It describes the local linear behavior of the system near this equilibrium point. It is derived by linearizing the dynamic behavior of the system at the equilibrium point;
and
are used to determine the local stability of the system.
Based on differential equation theory, the local asymptotic stability of equilibrium
is ensured when the spectral abscissa of the corresponding Jacobian matrix lies in the left half-plane of the complex domain. When
crosses the critical threshold of 1, the system dissemination from a dissemination-free equilibrium (symmetric state) to an interior equilibrium (symmetry-breaking state). This process is analogous to a symmetry-breaking phase dissemination in statistical physics, where the system shifts from a uniform state to a non-uniform one. Following the definition
, the linearized system can be expressed as
The Jacobian matrix is then given by
The Jacobian matrix
is derived through the linearization of the system at the dissemination-free equilibrium point
, when no dissemination occurs, and it is provided via
The Jacobian matrix
is derived:
After some computations, the characteristic equation is
where
The characteristic equation’s roots exhibit negative real components if and only if the Routh–Hurwitz stability conditions [
32] are satisfied, thereby guaranteeing the local asymptotic stability of equilibrium
. Consequently, the dissemination-free equilibrium
exhibits local asymptotic stability, as confirmed through the fulfillment of the Routh–Hurwitz conditions:
,
, and the inequality
. The local asymptotic stability of the equilibrium point
can be assessed using the Routh–Hurwitz stability criterion [
32]. Based on the principle, the characteristic equation’s roots possess negative real parts when the following conditions are met concurrently:
,
, and
. These requirements are fulfilled for the system under consideration, thereby confirming the local asymptotic stability of the equilibrium state
.
Theorem 1. The interior equilibrium is locally asymptotically stable under the conditions that , , and , where the are specified in the proof of this theorem.
Proof. The local stability characteristics of the endemic equilibrium
are investigated through a spectral analysis of the Jacobian matrix
, which is obtained by linearizing the governing equations in system (
1).
We calculate the Jacobian matrix
:
After some computations, the characteristic equation is
where
For
, Equation (
7) becomes
where
The interior equilibrium demonstrates local asymptotic stability when the following Routh–Hurwitz conditions are fulfilled: □
Proposition 1. The interior equilibrium exhibits local asymptotic stability under instantaneous interaction conditions, where time delays are negligible. In the absence of delay, the interior equilibrium exhibits local asymptotic stability.
Proposition 1 establishes that, regardless of parameter configurations in system (
1) with time delay
, all solution trajectories asymptotically approach interior equilibrium
as temporal evolution progresses,
. Subsequently, we investigate the critical stability conditions governing system (
1) as the time delay
parameter undergoes incremental variations from its null state. Based on the continuous dependence of characteristic roots on
, Equation (
7) will exhibit roots transitioning to positive real parts upon crossing the imaginary axis. Through analytical examination, we determine that complex number
(where
and
) denote specific system characteristics) satisfies Equation (
7) as a root if and only if the following condition holds:
Applying Euler’s formula, which states that
, we derive the following expression.
By squaring both original equations and applying the fundamental trigonometric identity
, we obtain the following relationship:
Let
We have
The characteristic Equation (
7) is guaranteed to possess exclusively stable roots (with negative real components) when the Routh–Hurwitz stability conditions are satisfied, leading to the following analytical conclusion.
Theorem 2. The interior equilibrium in the time-delayed system (1) maintains local asymptotic stability across all positive delay values , provided that the subsequent stability criteria are satisfied: In stability analysis, the symmetry in the distribution of characteristic equation roots (e.g., complex conjugate pairs) determines the system’s dynamic behavior (such as decaying oscillations or growth).
Existence of Hopf Bifurcation
Hopf bifurcation refers to the phenomenon where, as the system’s parameters change through a critical value, the equilibrium point shifts from stability to instability, and a limit cycle emerges from it. Hopf bifurcation is a crucial nonlinear dynamic phenomenon where the stability of the system changes as a certain parameter varies, leading to significant alterations in the system’s behavior. Specifically, as the parameter changes, some unstable equilibrium points in the system undergo a “bifurcation”, meaning dissemination from instability to stability; this causes the system to transition from one stable state to another.
The polynomial equation
possesses a minimum of one positive solution, designated as
. This mathematical property implies the existence of a corresponding positive root
, Equation (
9). Consequently, the characteristic Equation (
7) exhibits a conjugate pair of purely imaginary roots
when the delay parameter reaches the critical value
. These relationships are quantitatively expressed through Equation (
8) as follows:
where the index
i enumerates non-negative integers
Defining
, the primary bifurcation threshold where Equation (
7) first acquires purely imaginary roots, we observe that the equilibrium
maintains its stability within the delay interval
but undergoes destabilization when
exceeds this critical value. The dynamical system (
1) experiences an irreversible stability transition at
, with no subsequent recovery of stability for
.
Then, we differentiate the Equation (
7) with respect to
following the transversality condition:
Differentiating Equation (
7) with respect to
yields
Then,
Then, we have
Due to
, we can get
.
This section demonstrates the emergence of the Hopf bifurcation phenomena, characterized by periodic solution branches, coinciding with the stability loss of the rumor equilibrium. By using the time delay parameter as the bifurcation parameter, we demonstrate the occurrence of a Hopf bifurcation at the critical delay threshold when the following conditions are met:
(a) , , and all other eigenvalues have negative real parts at .
(b) .
The analytical findings conclusively satisfy the transversality criterion, confirming the existence of a non-degenerate Hopf bifurcation. Therefore, the existence of Hopf bifurcation is established [
33].
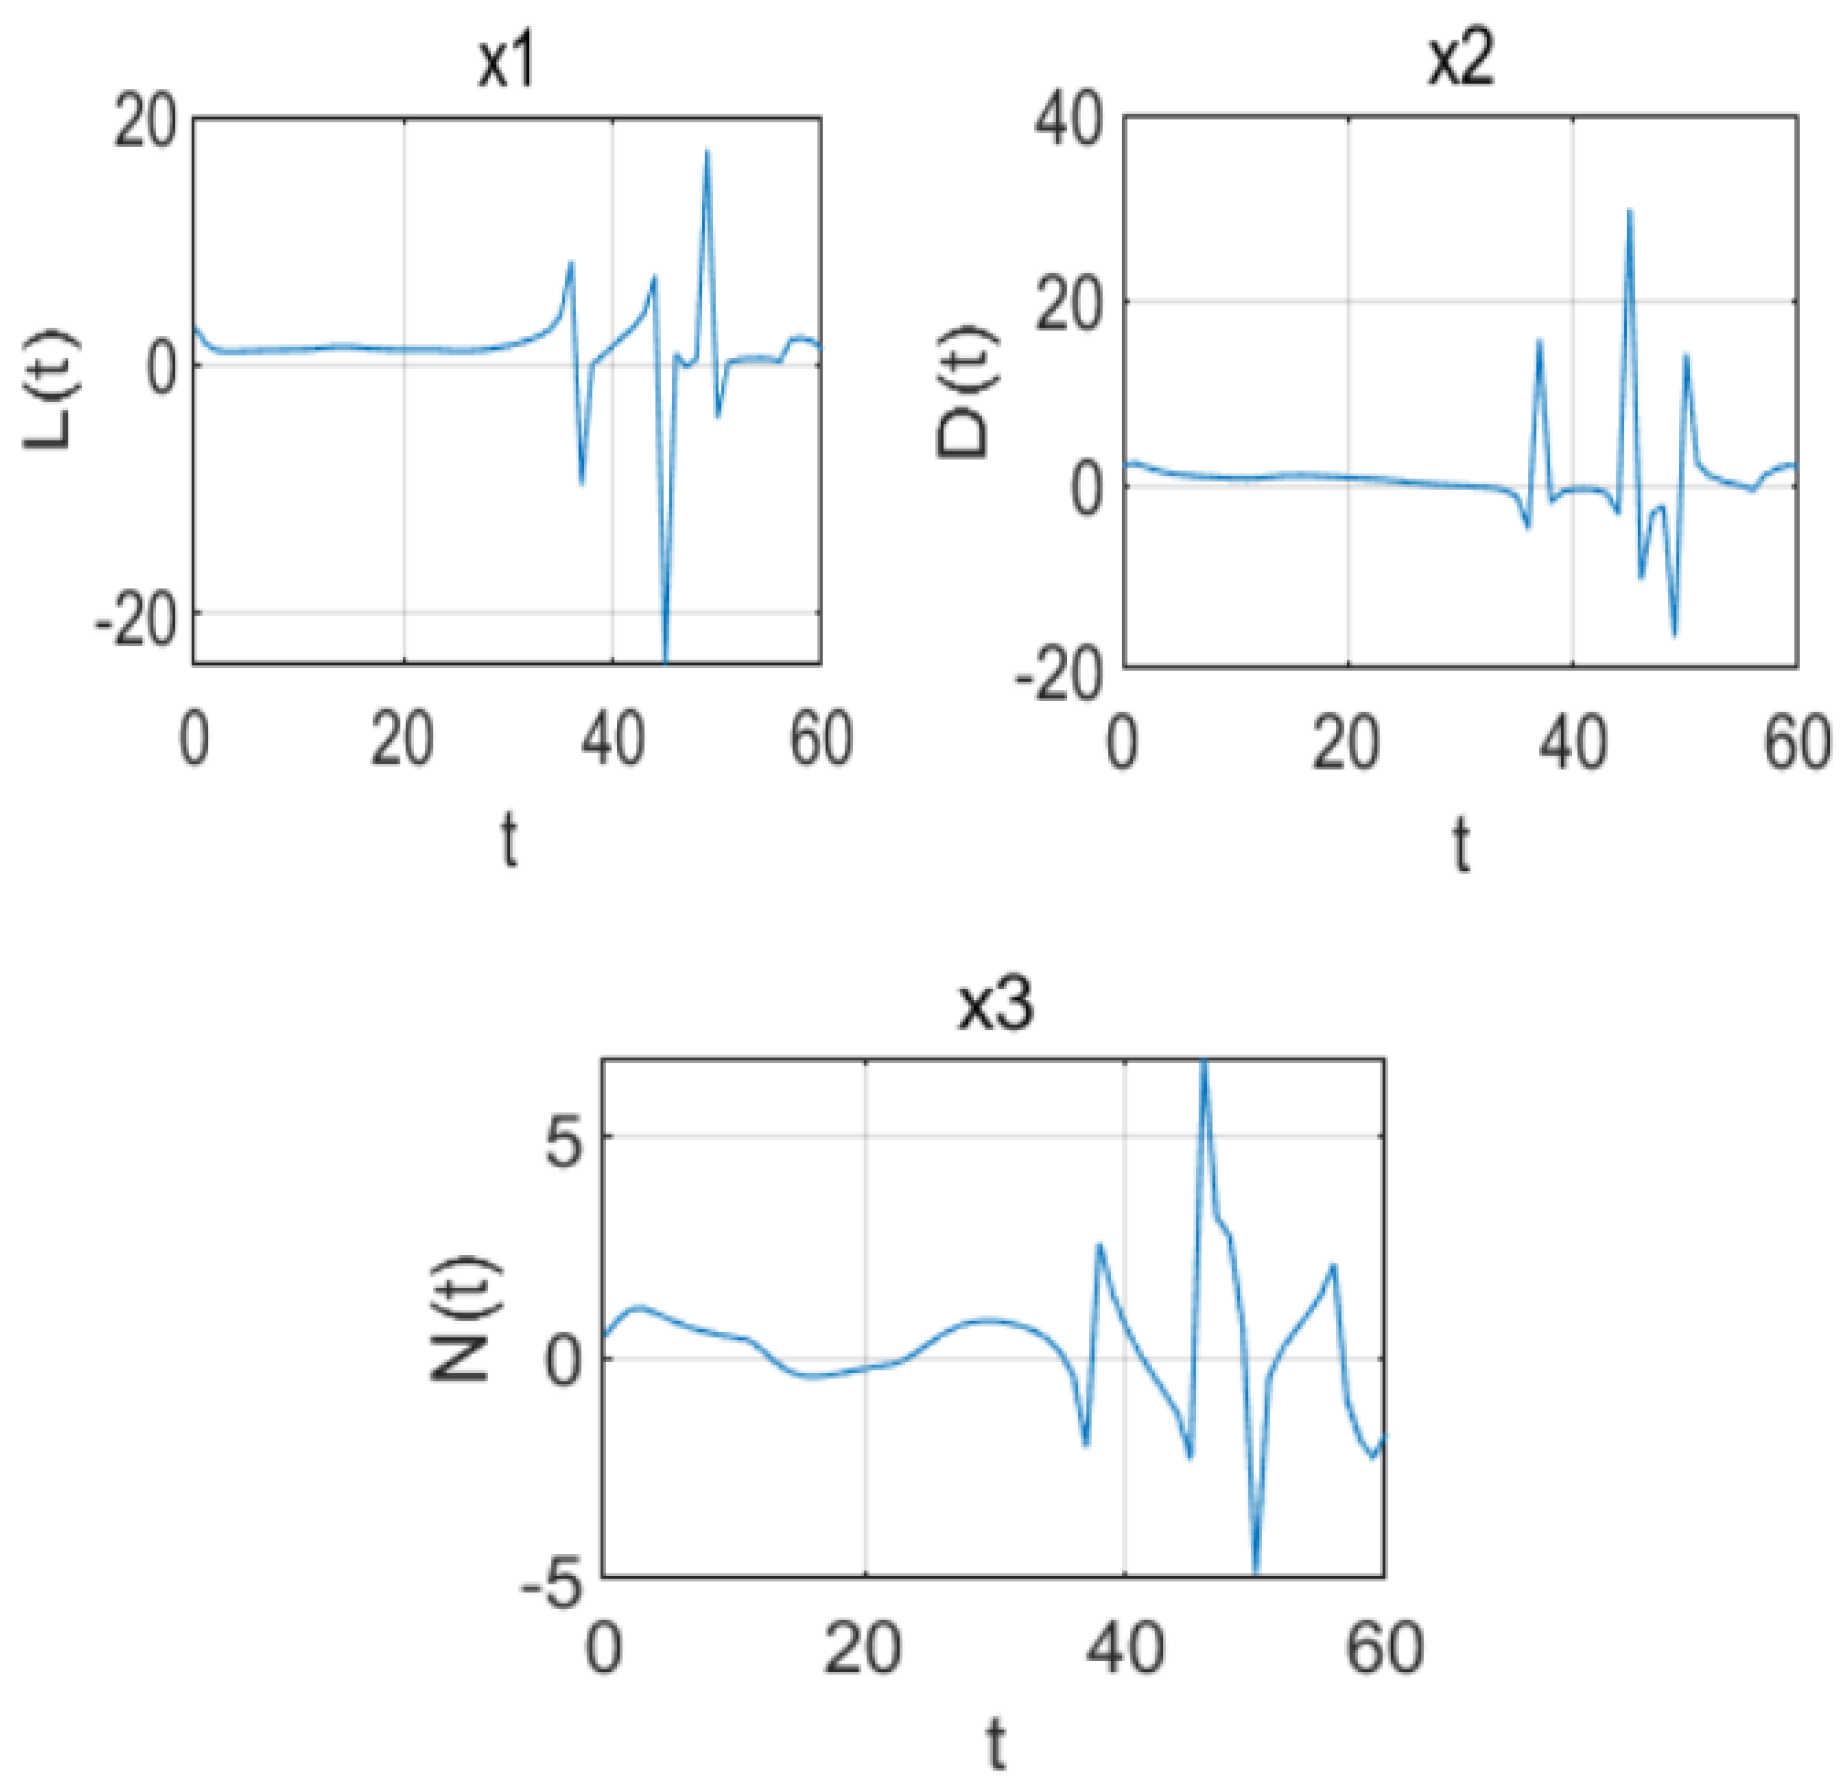
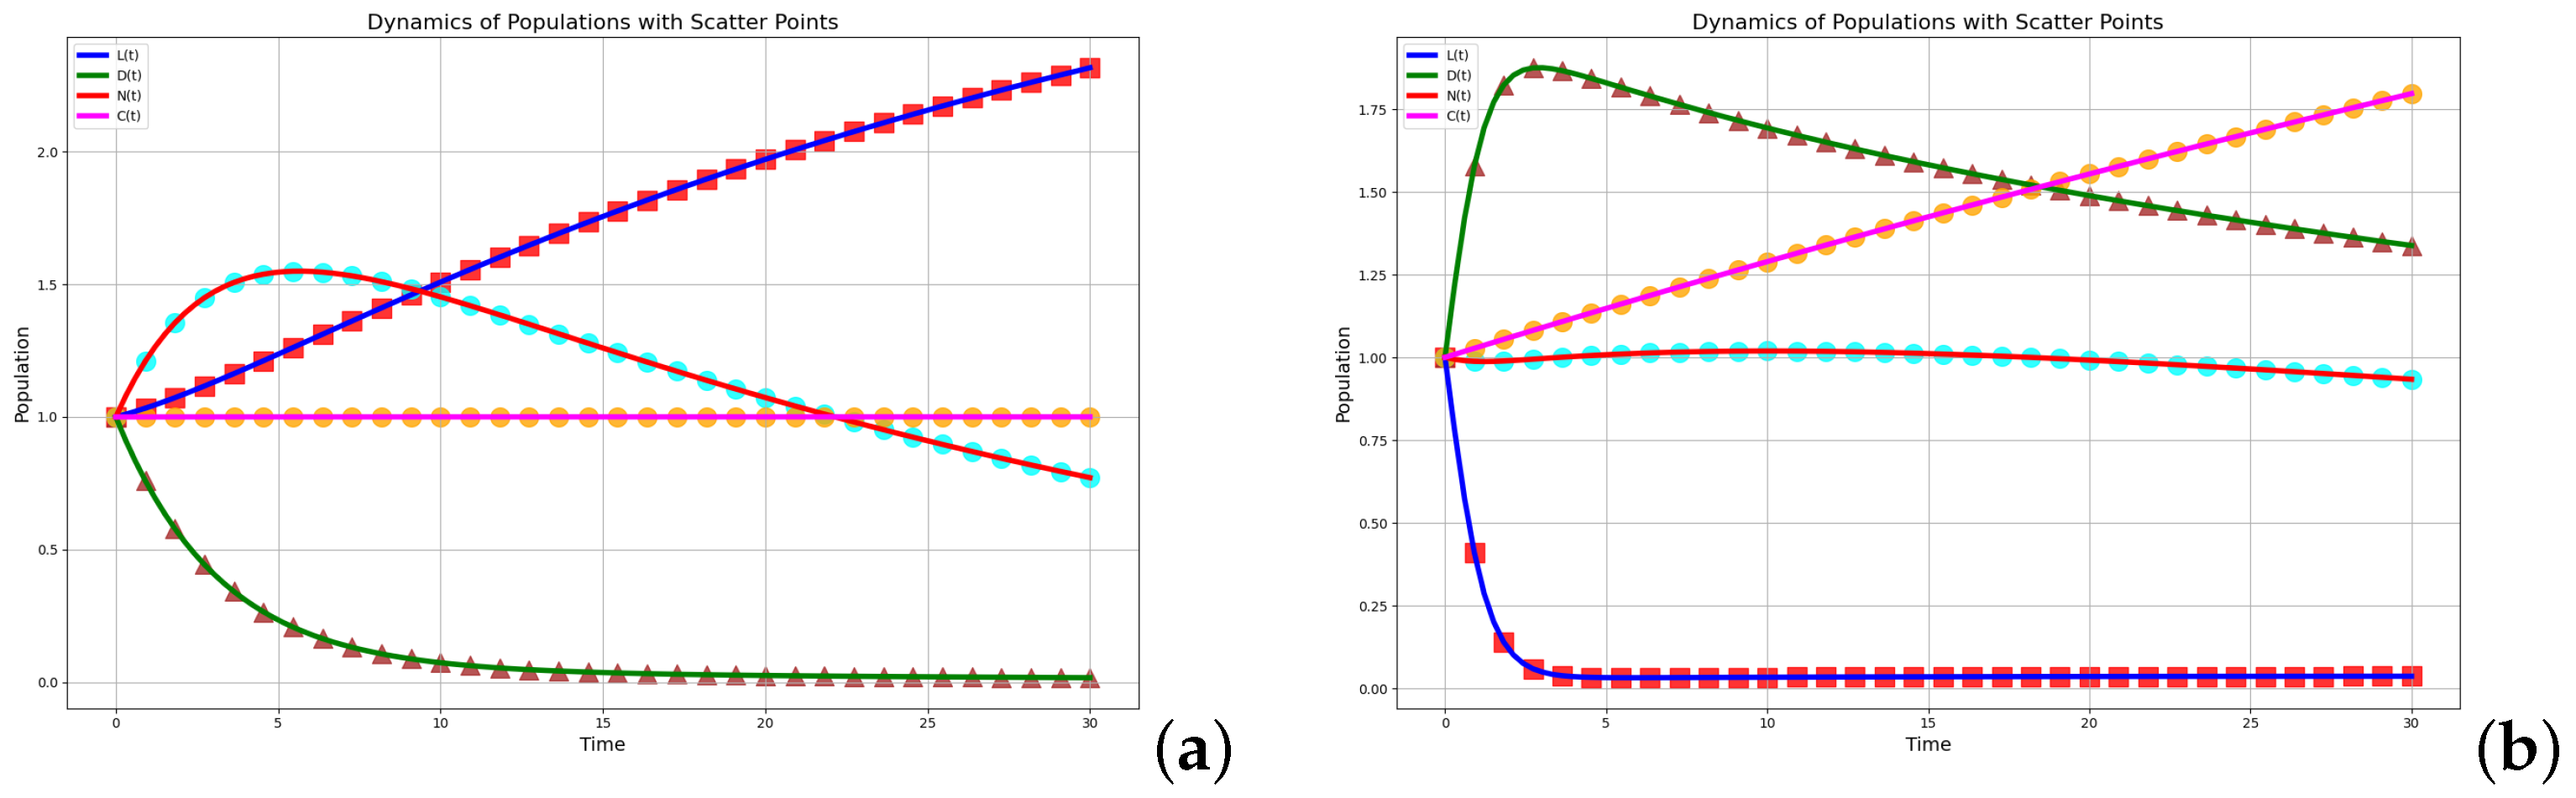
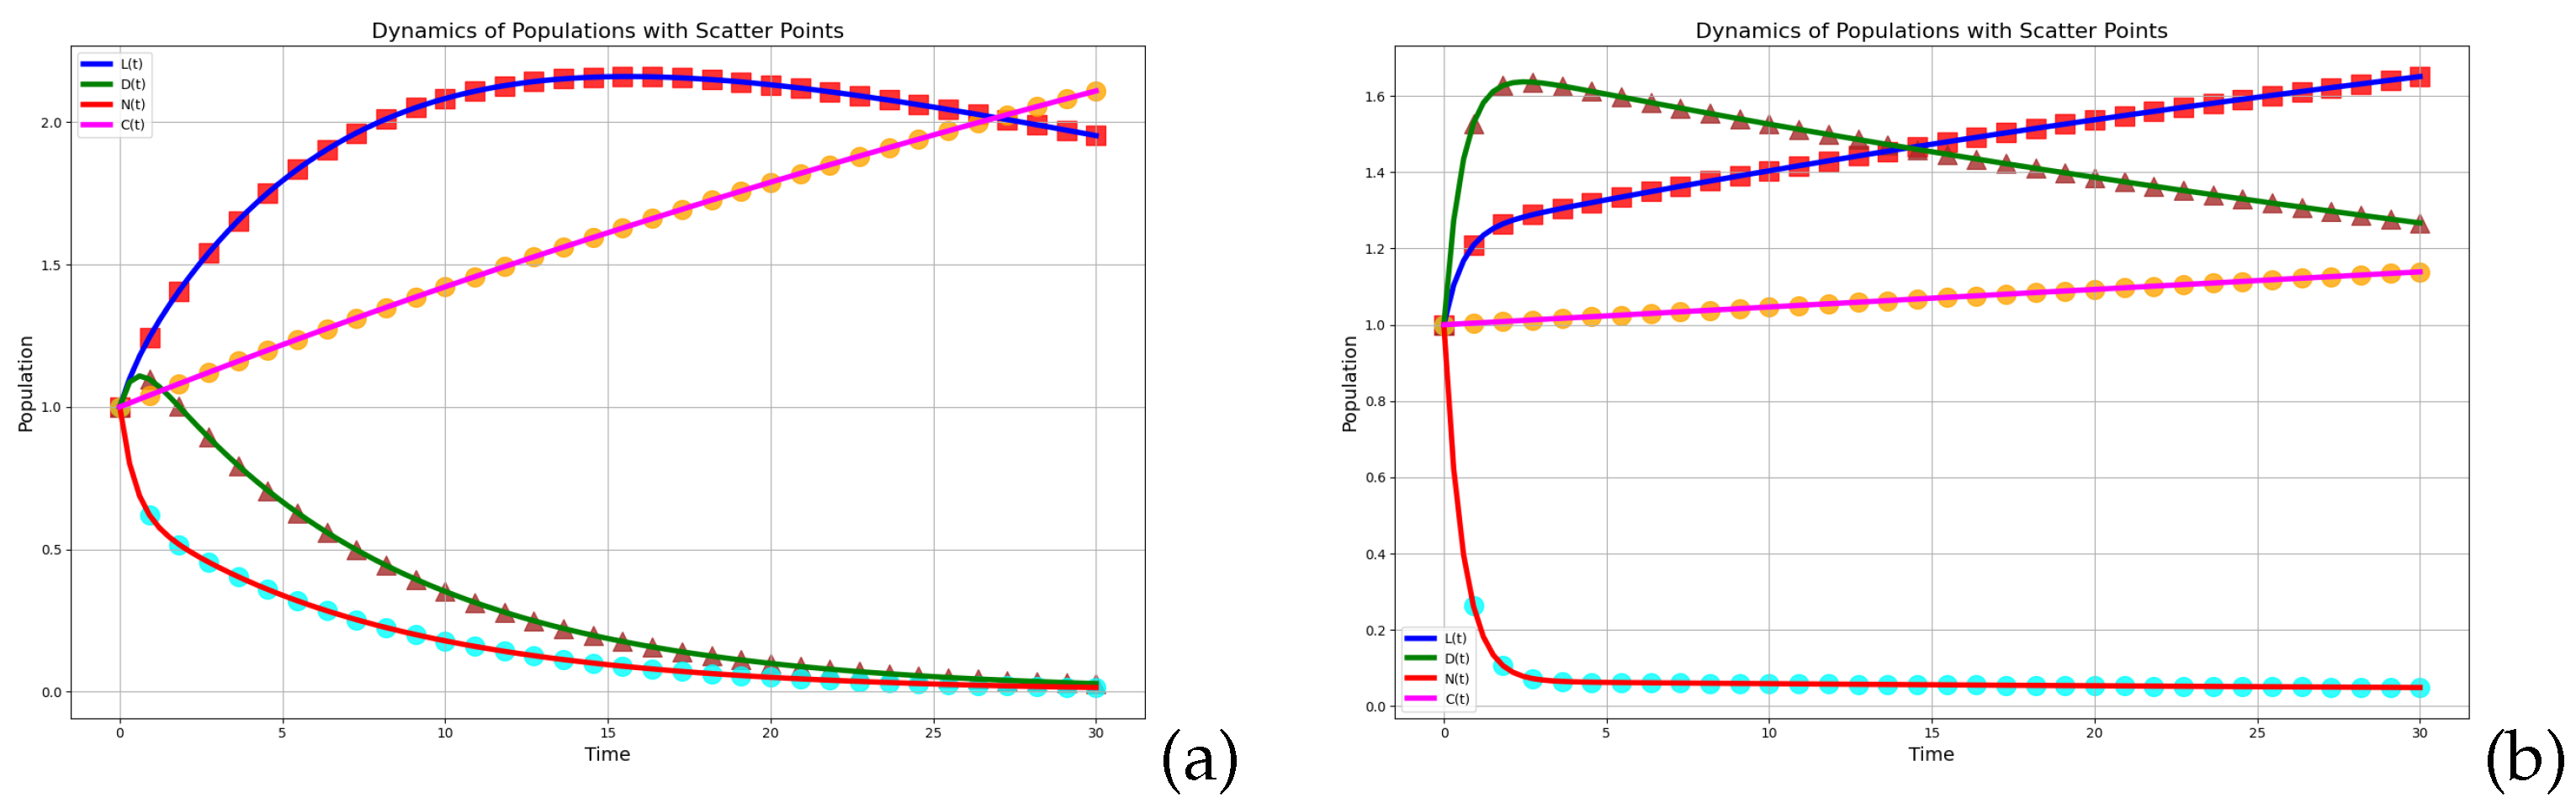
We can observe that, when
(
Figure 2), starting from the equilibrium point
,
, and
lose their stability and begin to exhibit periodic oscillations, and they may even tend towards 0, which signifies the disappearance of rumor dissemination.
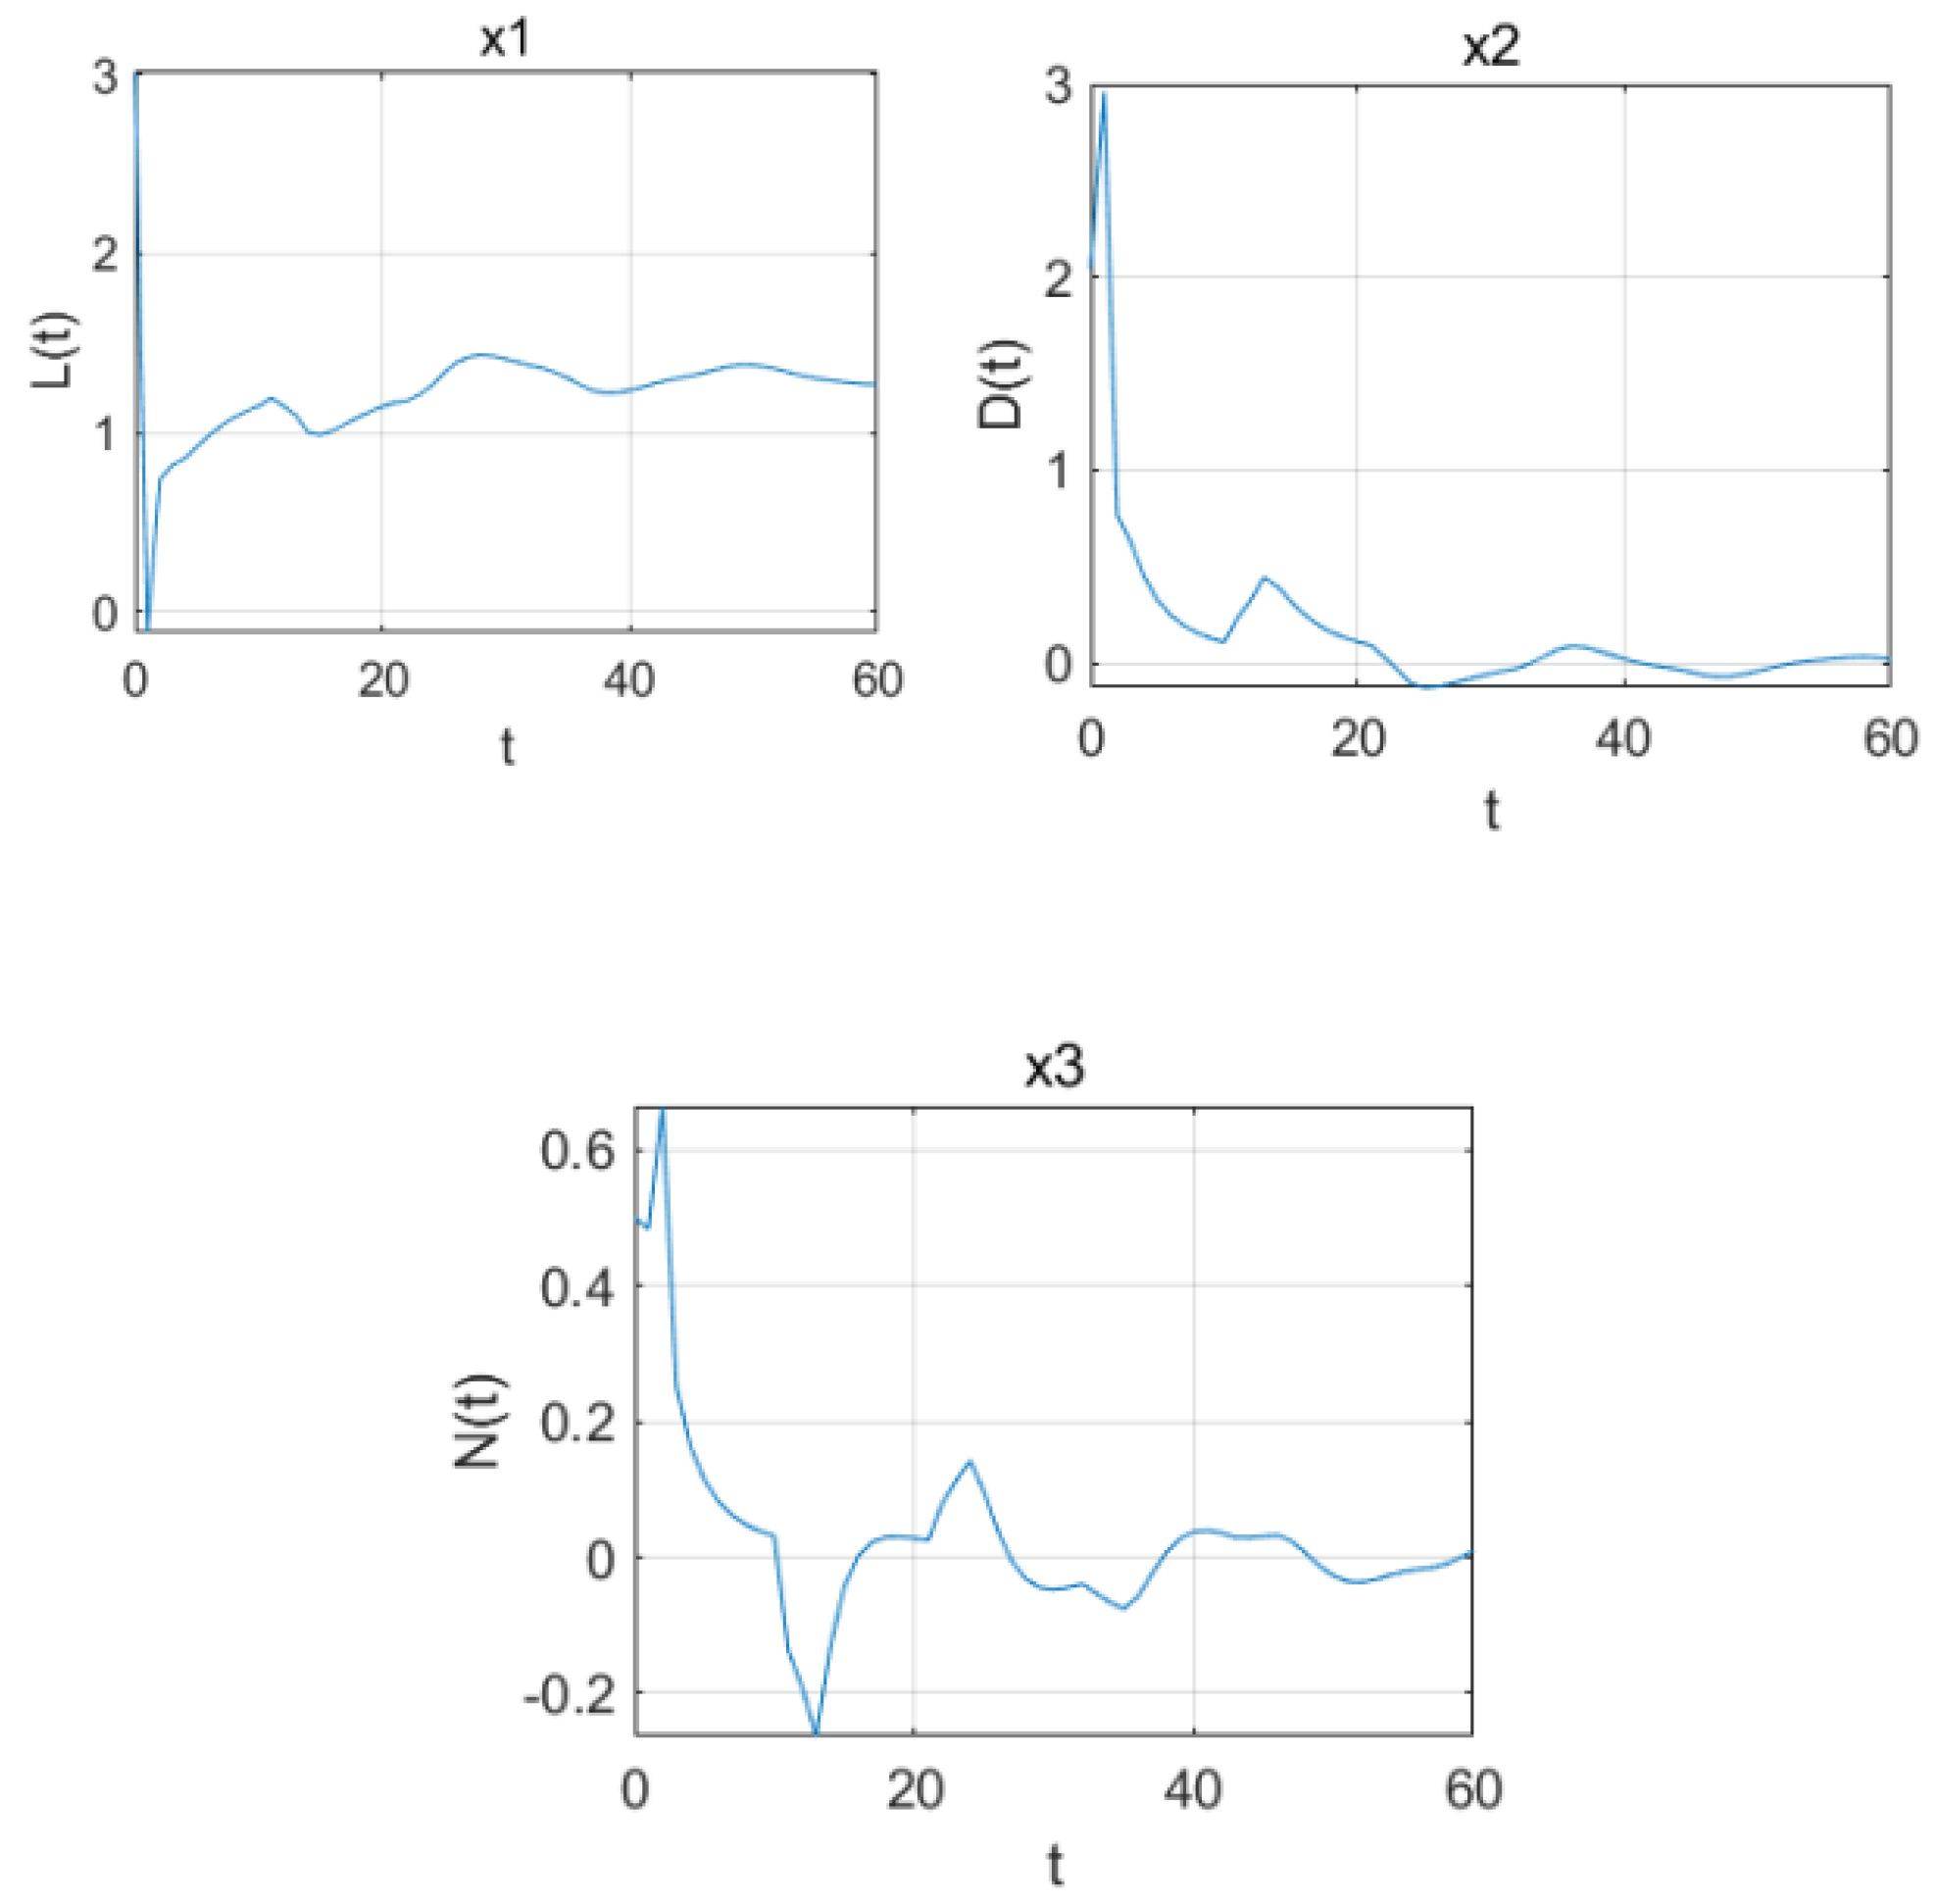
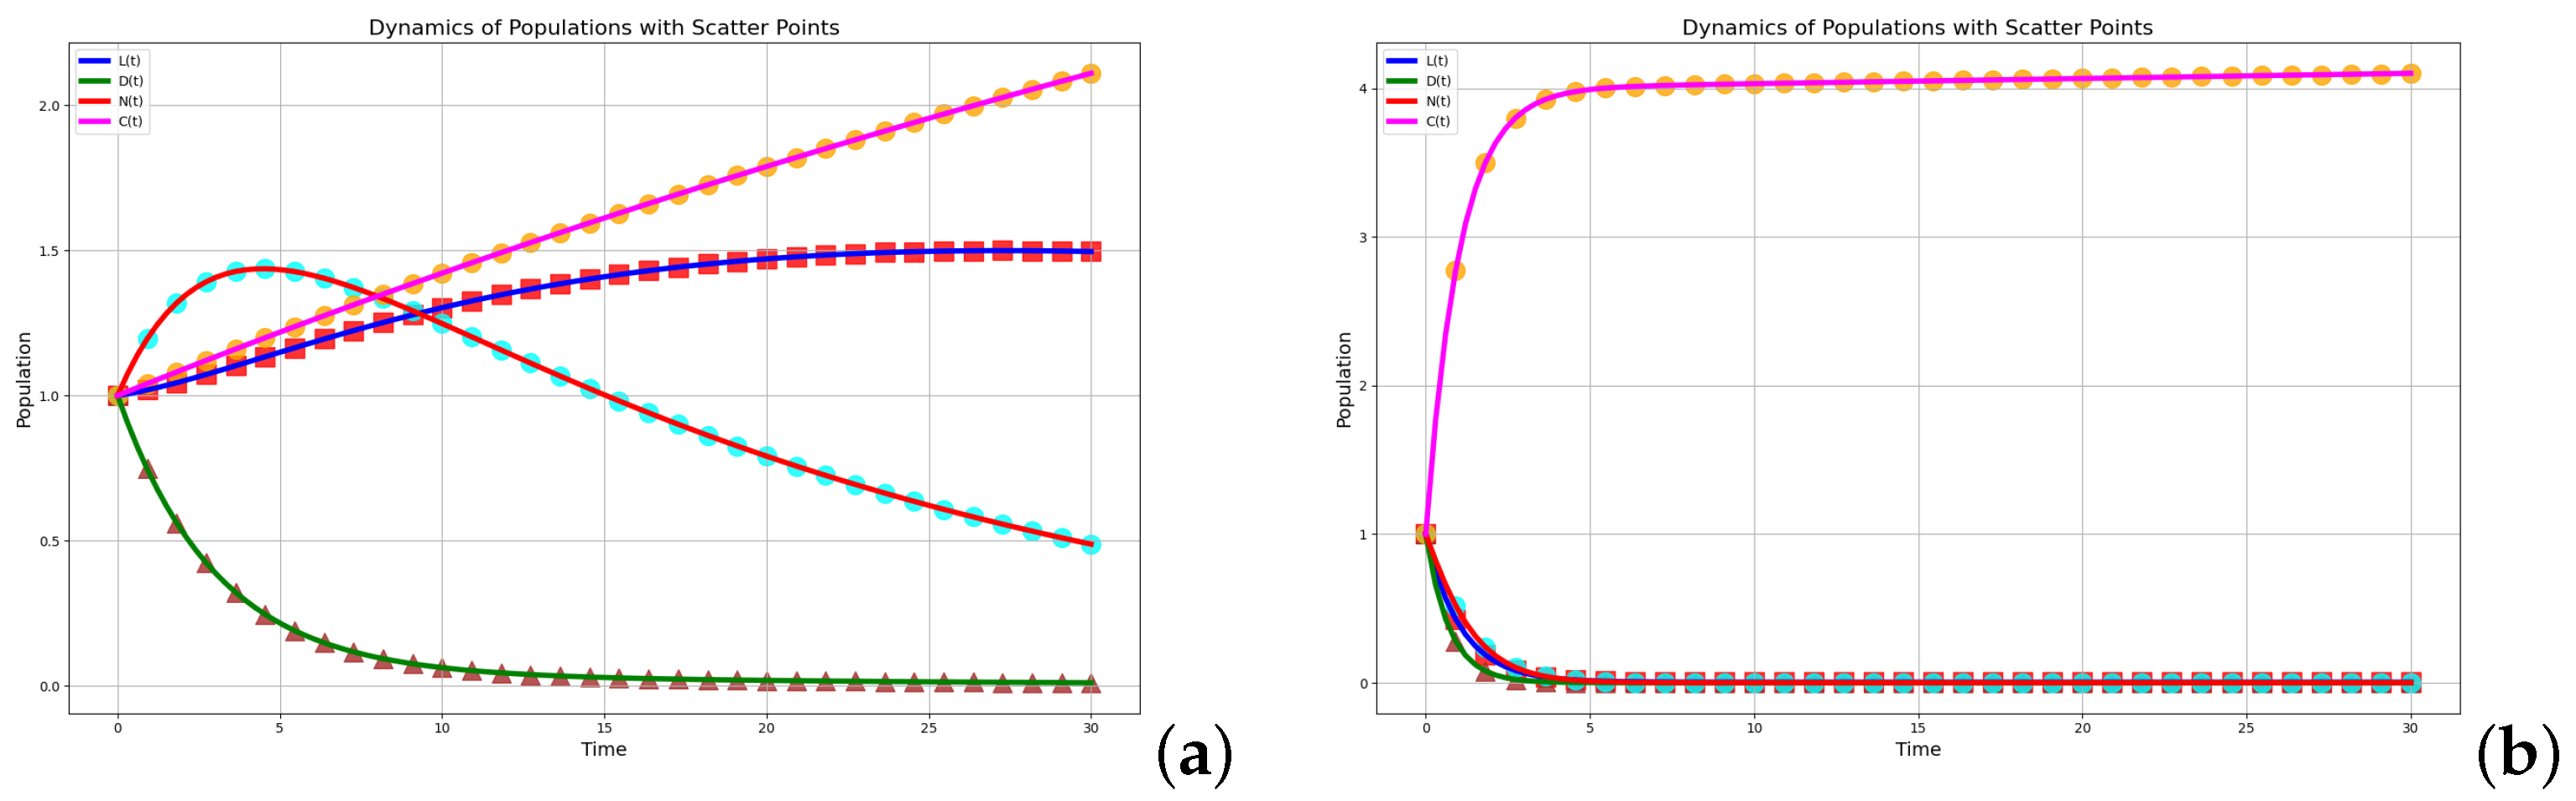
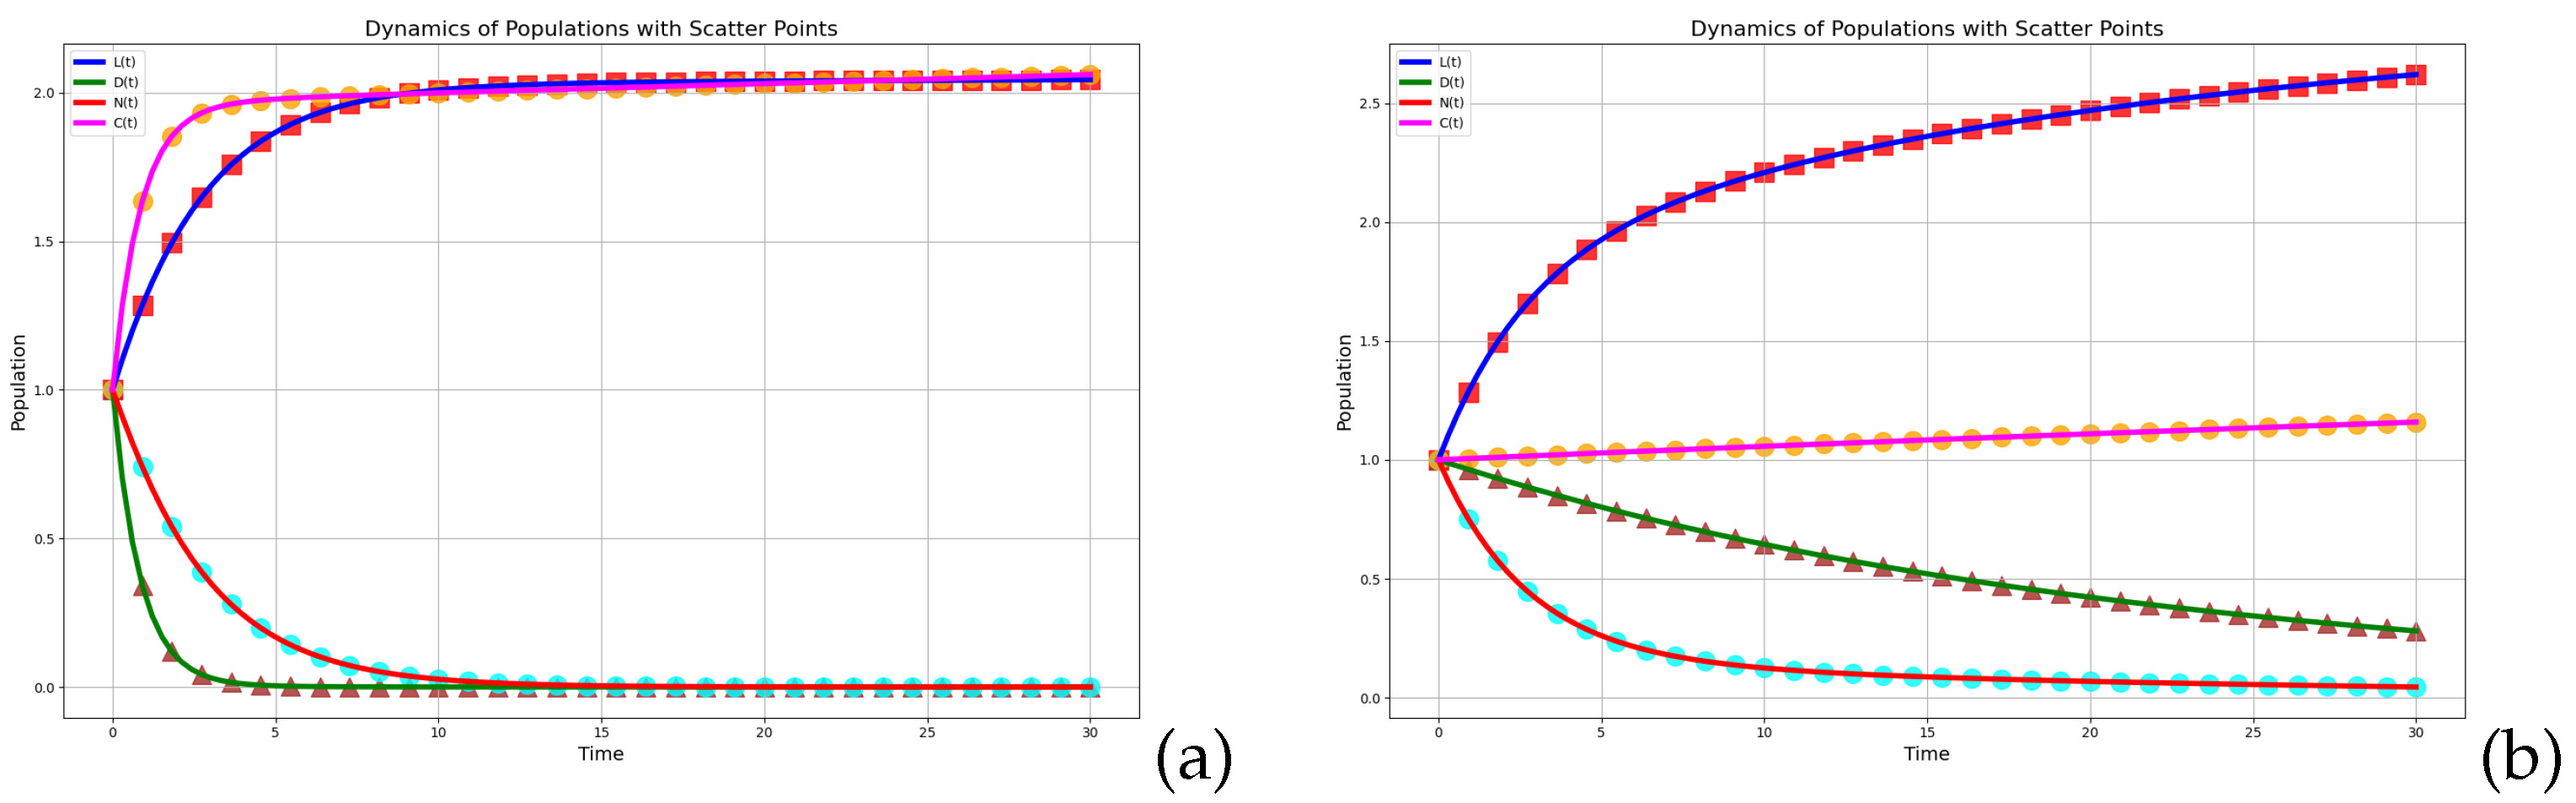
We can observe that, when
(
Figure 3), starting from the equilibrium point
, L(t), D(t), and N can reach a stable state within a certain period of time, indicating that an equilibrium has been achieved among the disseminators, which is also the desired state that we anticipate.
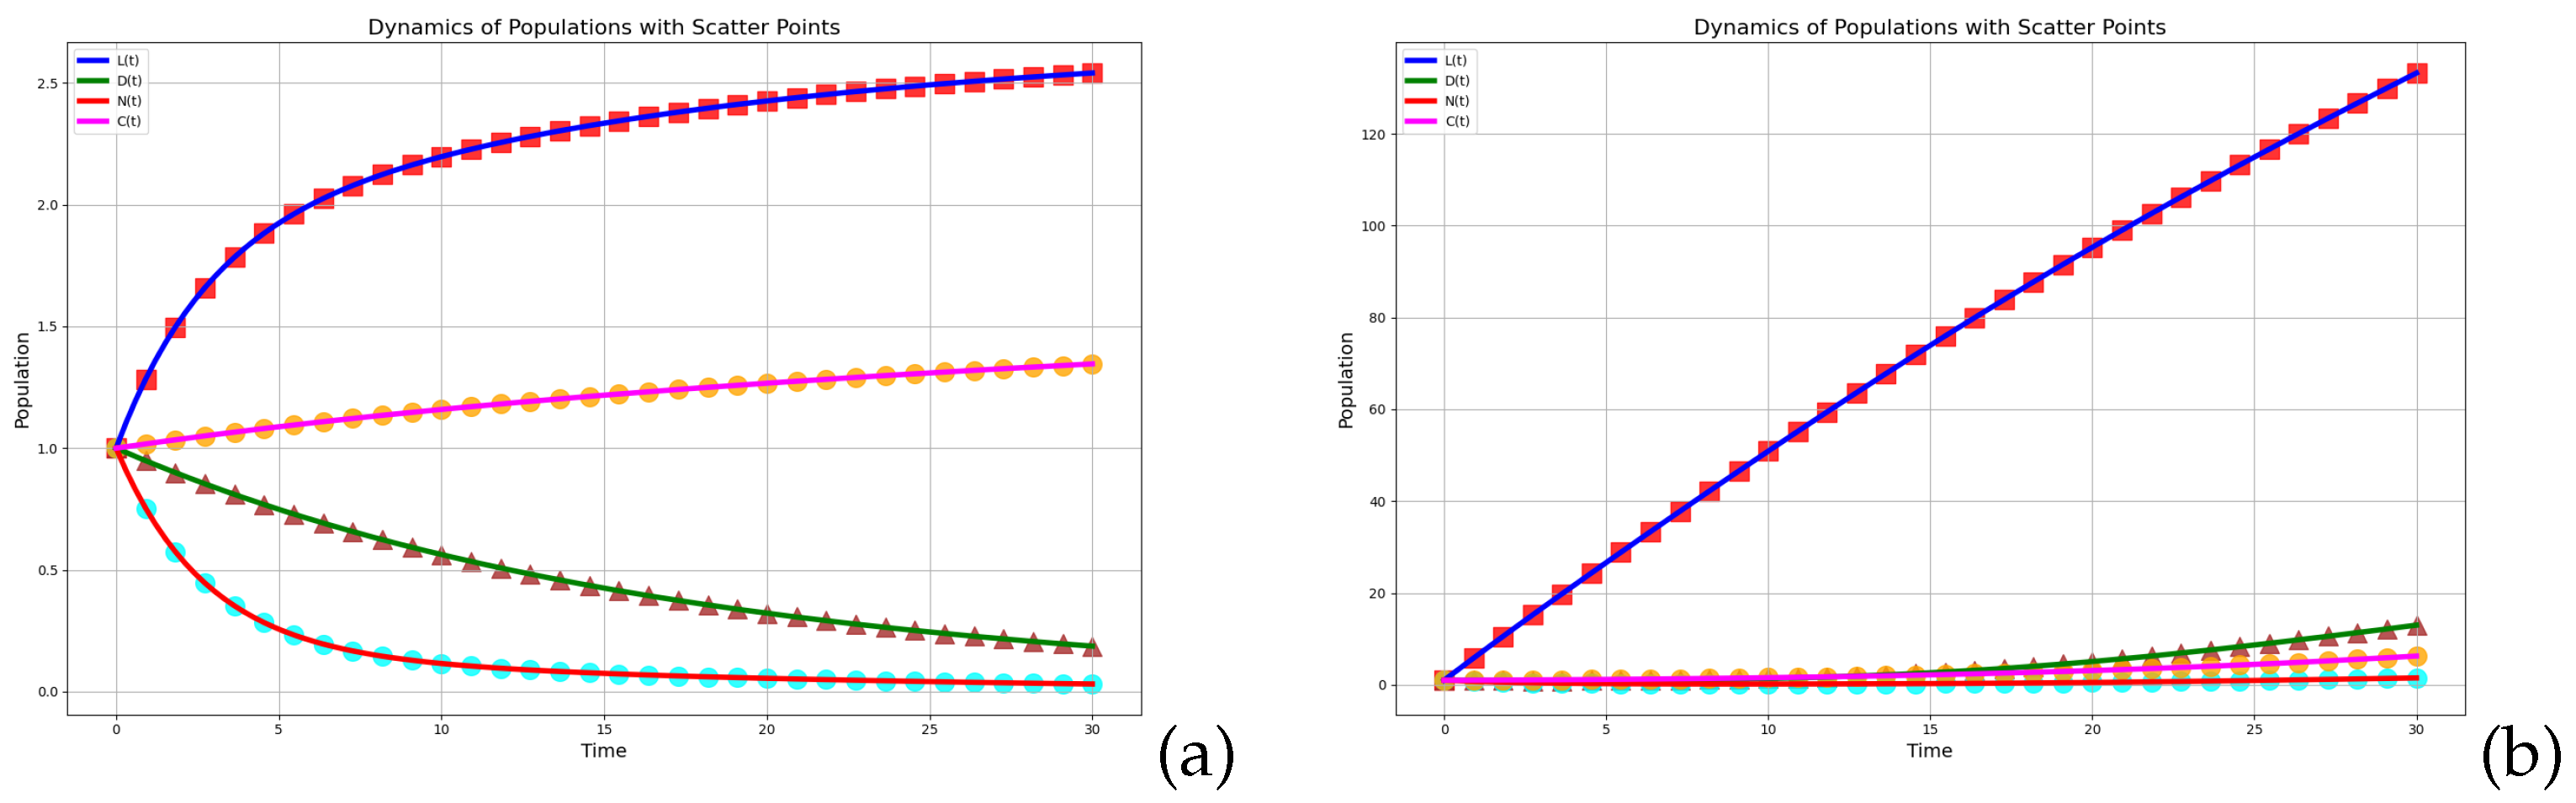
For
, System (
1) is asymptotically stable, and
System (
1) begins to exhibit Hopf bifurcation and is in a critical state,
. From the equilibrium point, a limit cycle bifurcates, generating periodic oscillations, and system (
1) becomes unstable.
When the time delay, , exceeds the critical value, , the system loses stability and exhibits periodic oscillations. This bifurcation phenomenon is associated with symmetry breaking—in which the time delay disrupts the steady-state symmetry of the system, leading to dynamic periodic behavior.
7. The Method of Control Model and Analysis
To minimize the dissemination of rumors, every city is adopting the blocking of the passage of rumors. Social media lockdowns are an intervention strategy aimed at curbing the dissemination of unverified information through the controlled management of online interactions and communication channels, thereby enforcing digital distancing among users. To control the interactions among the
class with
classes are reduced, and consequently, the dissemination rates of rumor must decrease. To include this management effect in the model, we replaced
,
and
with
,
, and
, respectively, where
. Again, to adapt control, each city is facing huge financial losses. To effectively manage the spread of rumors, the losses incurred can be significant, prompting some cities to adopt partial control measures. The parameters
are proportional to the extent of areas under control or the effectiveness of the control measures in place. If no control measures are implemented, then all
values are zero; conversely, if total control is achieved, all
values are equal to 1. This research focuses on developing a dual-objective framework that simultaneously restricts information propagation and optimizes the economic efficiency of containment strategies. To achieve this, we have transformed system (
1) into an optimization model with control parameters, formulated as follows:
In this part, we apply Pontryagin’s maximum principle to the Hamiltonian function to discover the condition for the optimal triple. For the sake of convenience, we use
, and
, and the Hamiltonian is given via
The formulation of our optimization framework requires a precise specification of the objective function to be minimized. Here, we construct the objective functional,
J, which has to be minimized [
34,
35,
36], where,
, The constants
represent the losses associated with the presence of the
,
, and
classes, respectively. Meanwhile, the constants
denote the losses incurred from implementing these management strategies. We assume that all management measures will be in effect during the time interval
and will be discontinued after
. The objective now is to determine the optimal functions [
25,
26]
that satisfy
where ⋃ represents the control set defined as follows.
is the Lebesgue measurable on , for all .
Theorem 4. The control functions exist, for which , and .
Proof. The convexity of the integrand in objective function
is evident. Moreover, the boundedness of the solutions for system (
1) guarantees that Equation (
17) satisfies the Lipschitz condition with respect to the state variables. These mathematical properties guarantee the existence of optimal control solutions, thereby completing the proof of the theorem. □
Theorem 5. The optimal control strategies that yield the minimal value of the objective functional J across domain ⋃ can be expressed as follows:where, are, respectively, and the optimum values of , and are the solution of system (20) with the conditions . Proof. The Lagrangian of the optimal control problem is
. The Hamiltonian function,
H, for our optimization framework is formally constructed as follows:
The derivation of adjoint equations accompanied by their corresponding transversality conditions is achieved through the application of Pontryagin’s maximum principle, generating the subsequent outcomes:
The adjoint variables
are uniquely determined through the specified transversality conditions
, as governed via the subsequent equations:
The adjoint variables are uniquely determined through the specified transversality conditions
. To determine optimal control functions, we use the optimality condition
, and we get
Then,
We end with the following:
where
are, respectively, the optimum values of
, and
is the solution of the system (20) with the conditions
.
Thus, the control functions minimize the objective functional . Hence, the theorem is proved. □
Again, it can be readily demonstrated that the threshold
of the model is
It is evident from the expression for the threshold that the quantities can effectively lower the value of the threshold, indicating that these quantities serve as effective controllers for the dissemination of public opinion. As the values of increase, decreases; this implies that lockdown measures are highly effective in curbing the dissemination of information.
An analysis of the dynamics of spreaders (D(t)) in
Figure 4 graph characteristics: The solid red line represents the change in spreaders,
, without control measures. The dashed blue line shows the change in spreaders,
, when optimal control is applied.
Optimal control significantly reduces the number and duration of spreaders by lowering the transmission rate,
, suppressing the recovery of individuals,
, and enhancing debunking efficiency,
, as shown in in
Table 1.
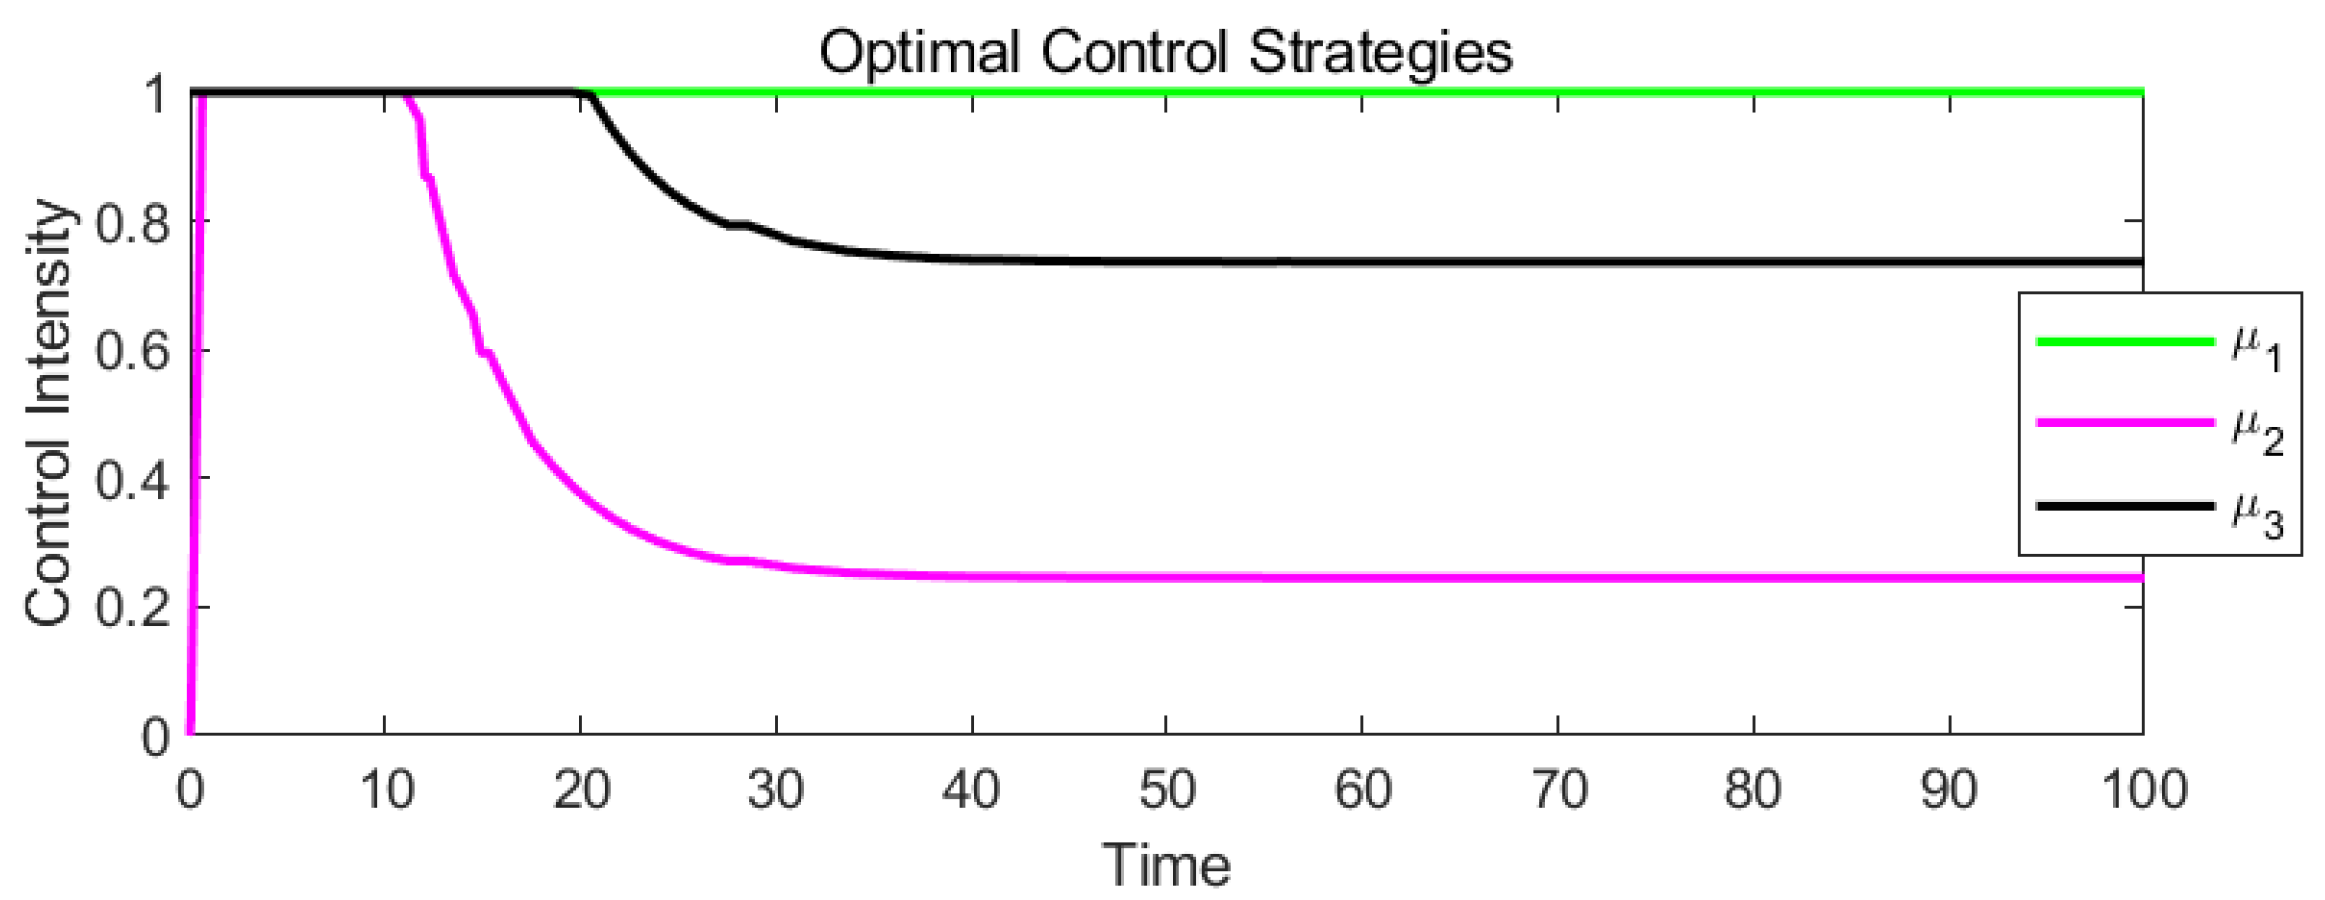
Analysis of optimal control strategy curves
in
Figure 5 graph characteristics: The green line (
) represents the control intensity to reduce the transmission rate
. The magenta line (
) represents the control intensity to suppress the recovery of forgetful individuals
. The black line (
) represents the control intensity to enhance debunking efficiency
.
Dynamics of control strategies: Initial phase : All control measures are rapidly activated (, , rise quickly) to counter the initial spread peak. The middle phase, : and , remains high to continuously suppress spreaders and debunk rumors. gradually decreases as the forgetful population, , diminishes. During the late phase , the control intensity gradually weakens as the system approaches stability.
Control logic: and have a more direct impact on spreaders, , so they are maintained at higher levels for longer. is only effective when is large and becomes less significant later.
Here is a numerical comparison of total costs under different control strategies for the rumor propagation model, analyzing the objective function
, in
Table 2.
When , , , , , , , , . Optimal control increases control costs ( terms) by compared to partial control, but it reduces rumor-related losses ( terms) by . Without control, a cost from rumor damage (D, N, and C populations) is incurred. Optimal control involves a cost from control implementation and 40% from residual rumor effects. If (the spreader cost weight) doubles, the optimal control becomes more cost-effective than no control. When ( cost weight) >2, partial control may outperform optimal control.
Justification is achieved when rumor damage costs, , exceed the control implementation costs. If control resources are limited, (debunking) is prioritized, which provides the highest marginal benefit per cost unit. Real-time monitoring should trigger control intensification when D(t) exceeds of the population. This quantitative framework enables evidence-based decision-making for rumor containment strategies.
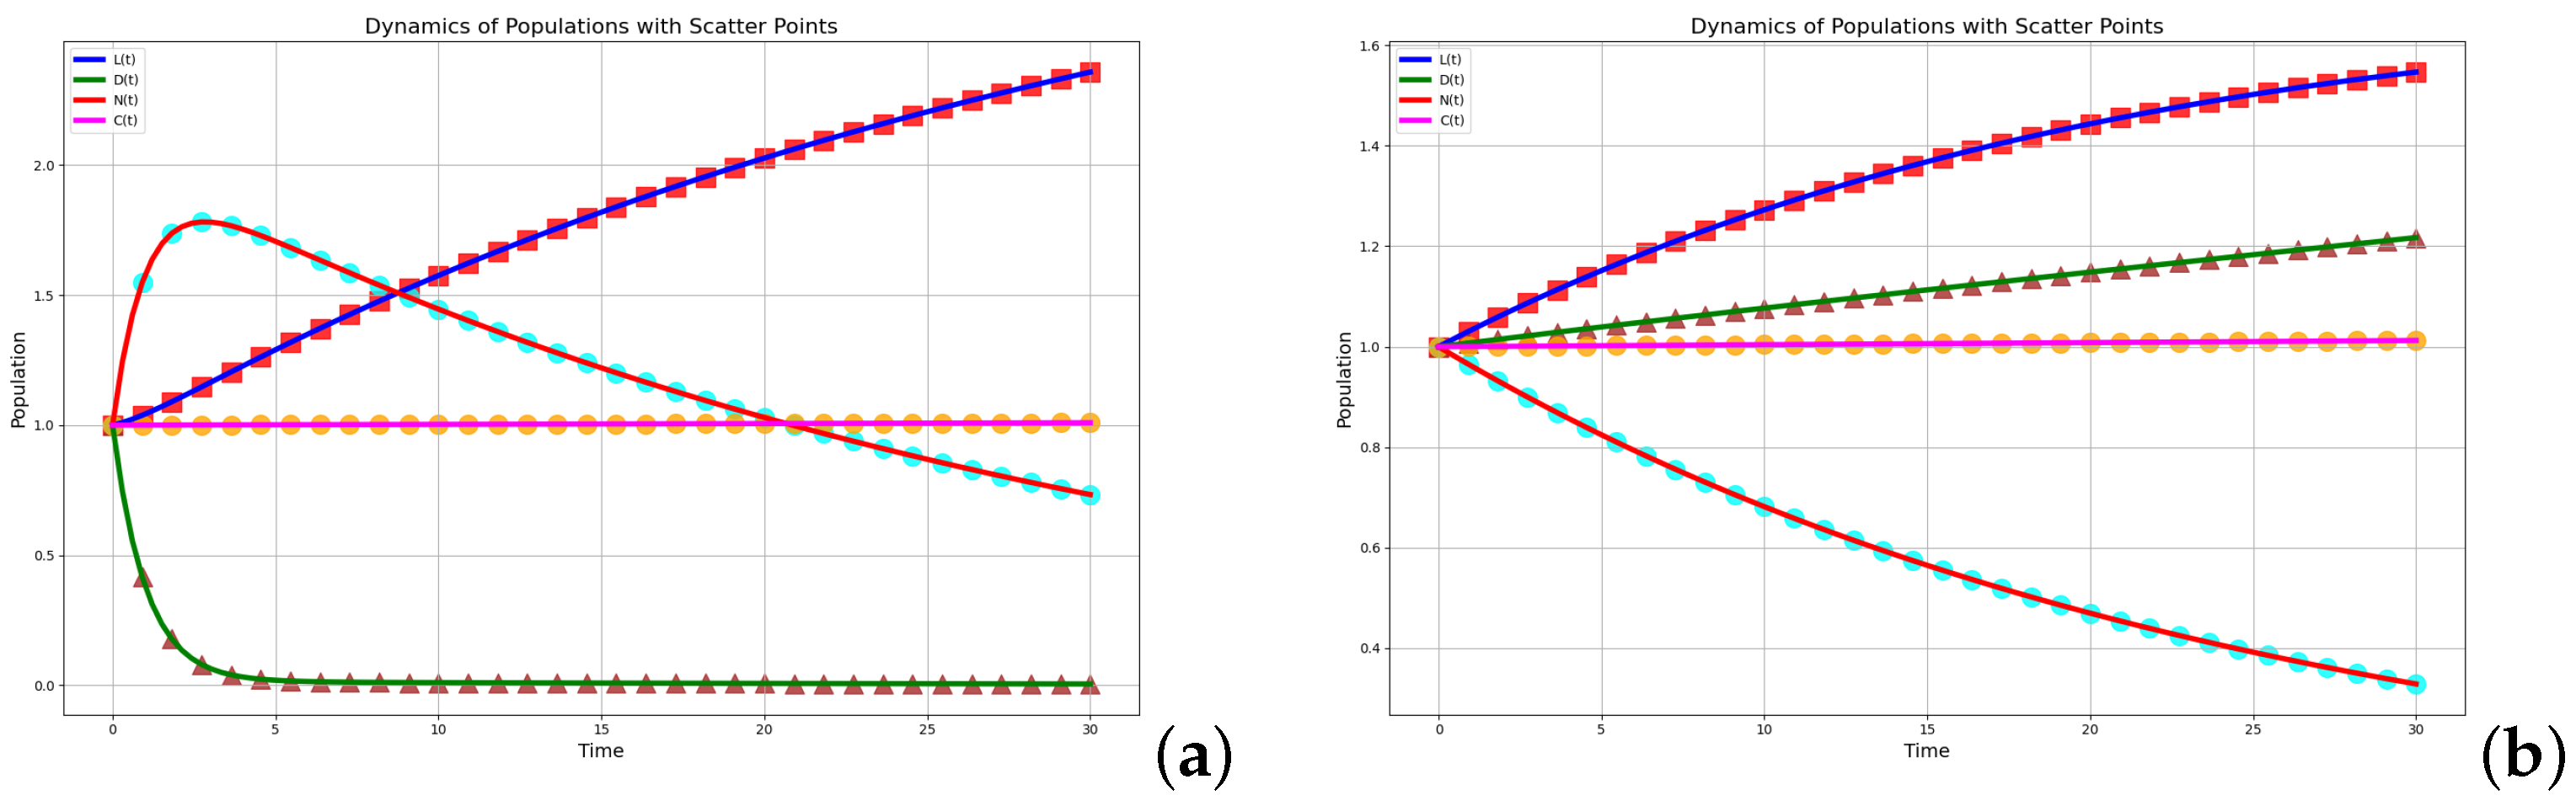
8. Numerical Simulation
In this section, we delve into the influence of diverse parameters on the threshold value. Through Matlab 9.11 and Python 3.13 simulations, we gain a comprehensive understanding of which parameter exerts the most significant influence on
, and
C. We choose
The influence of
and
on
is analyzed by assigning values.
In
Figure 6, the parameter
represents the rate at which population
propagates to population
. It can be seen from (a) to (b) that as
increases,
increases and
decreases.
has the greatest impact on
and
. The dynamics of each variable can be summarized as follows: The growth rate of
slows down over time; Similarly, the increase of
and
will also slow down. Meanwhile,
rises first and then tends to stabilize, while
falls first and then tends to stabilize.
In
Figure 7a,b,
represents the outflow rate of population
and
N to population
C. An increase in
will accelerate the disappearance of all populations
while increasing the accumulation rate of
. The transition from (a) to (b) shows that as
increases,
drops sharply, the peaks of
and
become lower and occur earlier, and
rises rapidly.
quickly approaches 0, and the increase in
directly accelerates the elimination of public opinion. The peak of
is reduced and occurs earlier, with public opinion being largely eliminated before it spreads.
almost disappears.
rises steeply.
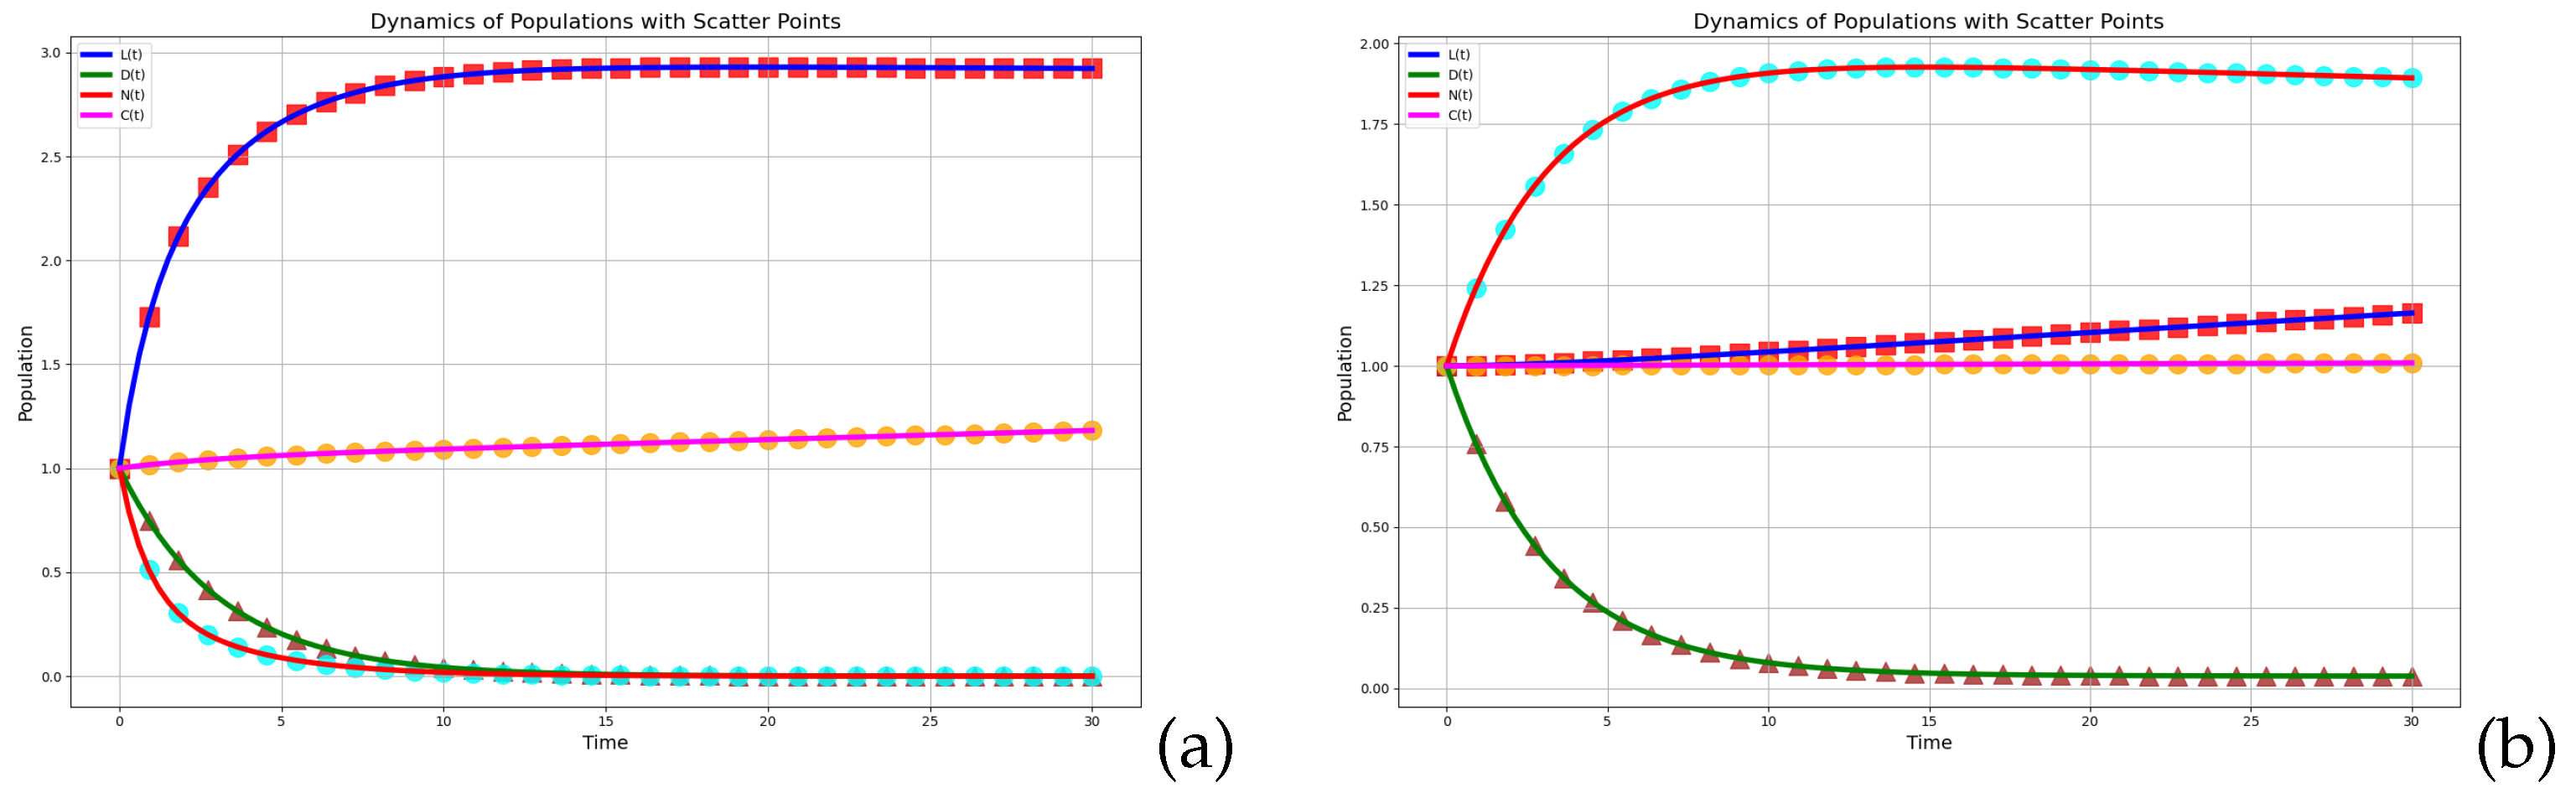
In
Figure 8a,b,
represents the forced removal rate. The transition from (a) to (b) shows that as
increases, it specifically targets the clearance of the epidemic spread
without directly affecting
or
. The peak of
becomes lower and occurs earlier, indicating that the epidemic is rapidly eliminated. Therefore, enhanced forced measures can lead to a faster decline of the epidemic.
exhibits asymptotic growth, with rapid accumulation in the initial stage.
In
Figure 9a,b,
k represents the termination rate of spread from population
D to population
N. The transition from (a) to (b) shows that as
k increases, it enhances both the clearance of the rumor dissemination
and the increase of
.
exhibits a single, steep peak with rapid clearance of the rumor dissemination, without a secondary outbreak and complete elimination of the source of dissemination. The optimal intervention timing is
hour before the peak of
.
In
Figure 10a,b,
represents the termination rate of dissemination from population
to population
. The transition from (a) to (b) shows that as
increases, the maximum amplitude oscillation occurs when
. Increasing
not only promotes the clearance of
but may also enhance repeated transmission. The inter-peak interval of
is reduced to zero, indicating complete clearance.
In
Figure 11a,b, the parameter
has an inhibitory effect on individuals responsible for spreading rumors. The transition from (a) to (b) shows that as
increases, the saturation effect of
becomes dominant, with its peak value decreasing by
.
exhibits a slow and sustained latent transformation.
shows asymptotic growth. In
Figure 12a,b, the parameter
A has an inhibitory effect on individuals responsible for spreading rumors. The transition from (a) to (b) shows that as
A increases, the system exhibits periodic oscillations. The mean value of
shifts upward, and
forms recurring waves of transmission.
undergoes phase-synchronized oscillations, and
shows stepwise growth.
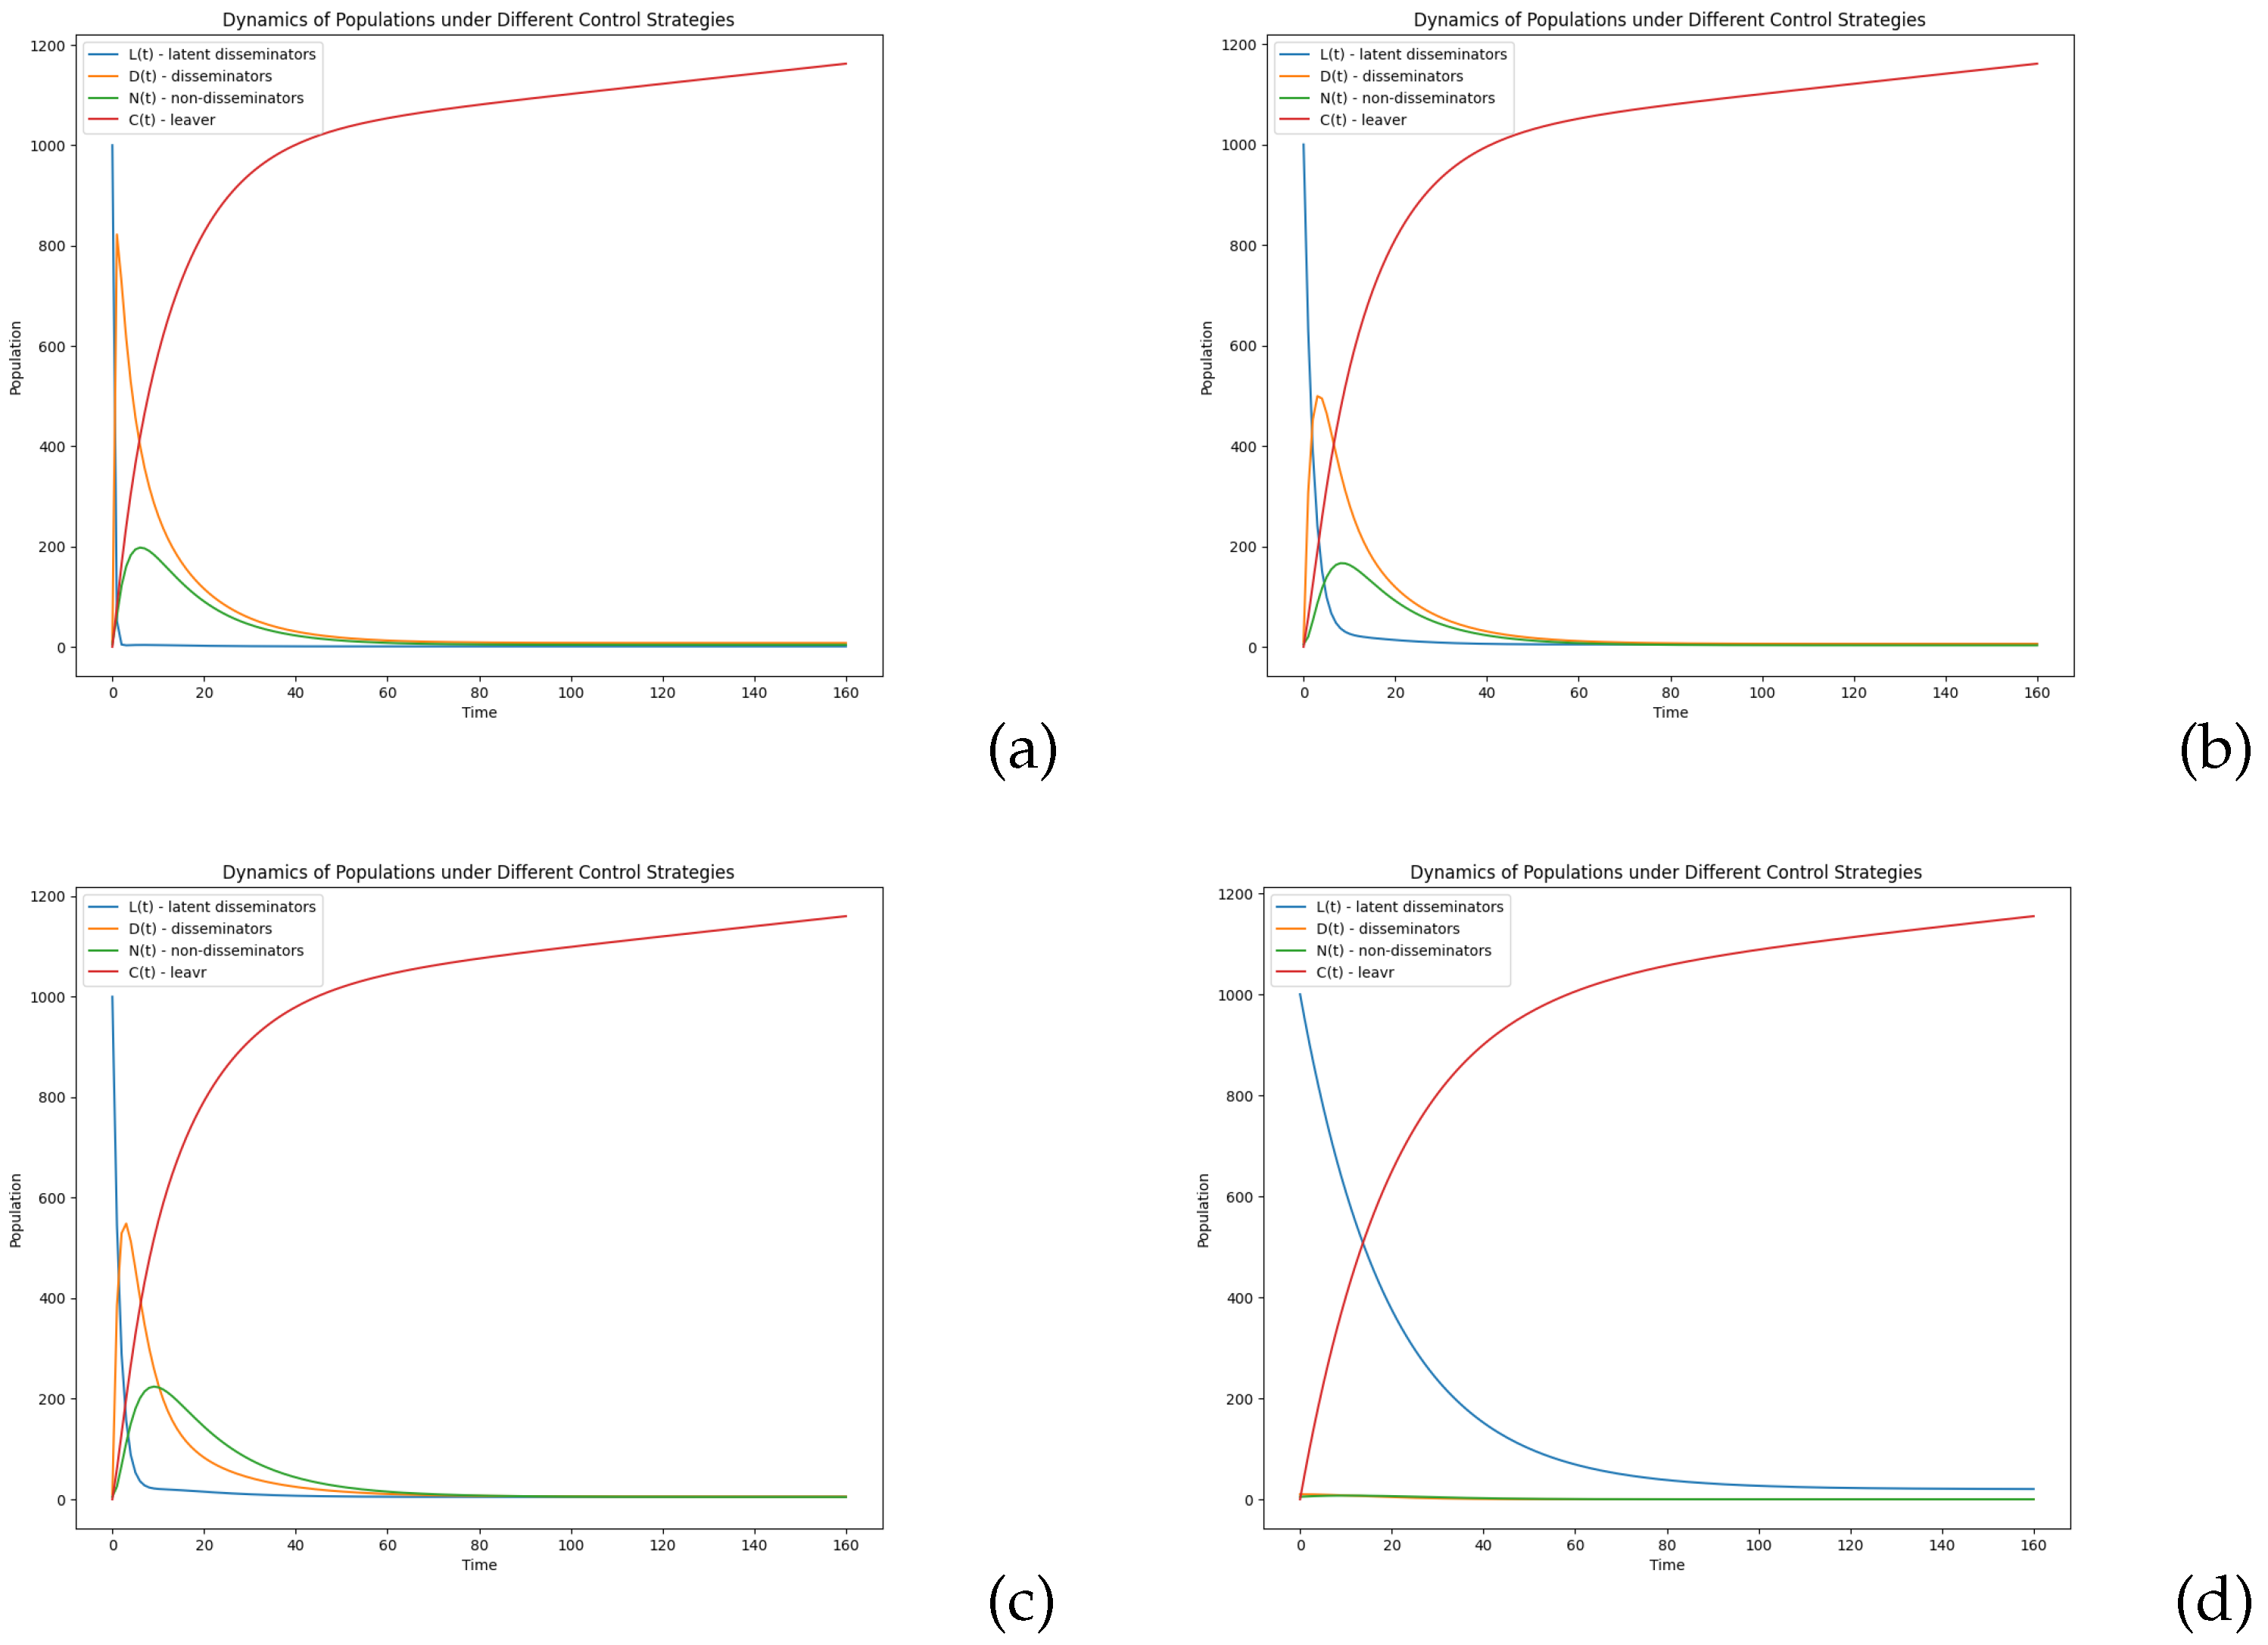
Figure 13 shows the corresponding
, and
curves under different control strategies.
Figure 13a shows an uncontrolled situation:
.
Figure 13b,c shows a situation of single control.
Figure 13d shows a situation of optimal control:
,
,
.
Figure 13 demonstrates the temporal dynamics of population distributions across various parameter configurations, revealing that the implemented optimal control strategy effectively minimizes undesirable elements while enhancing regulatory measures.
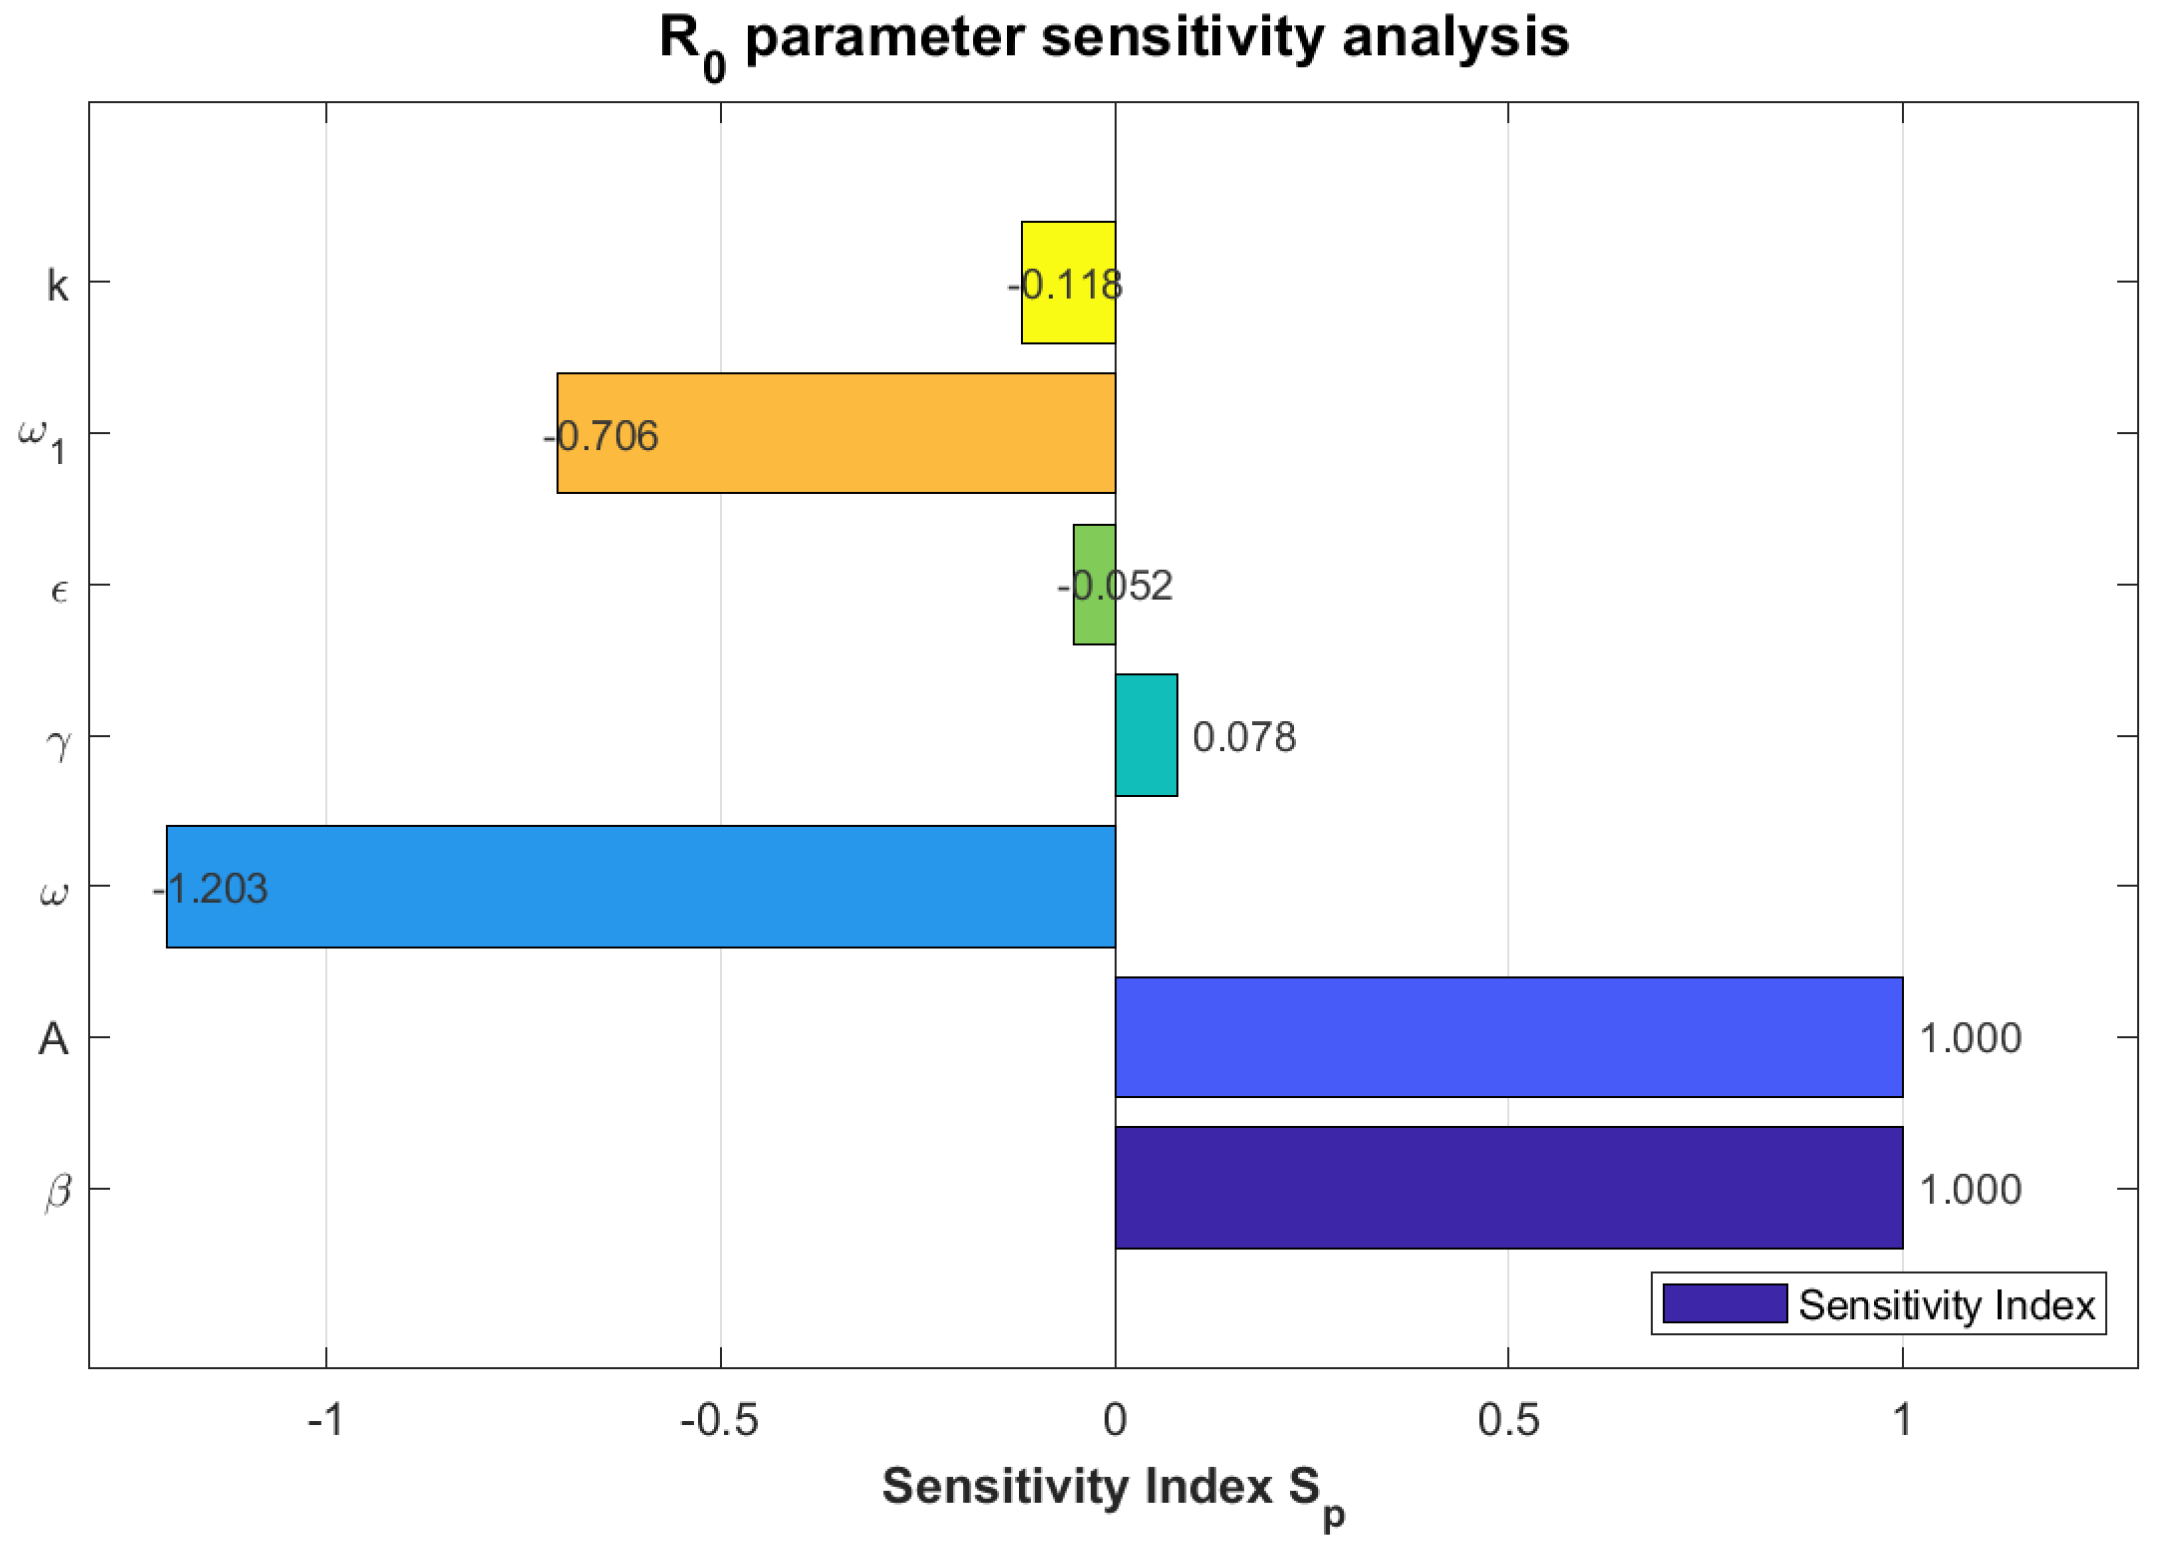
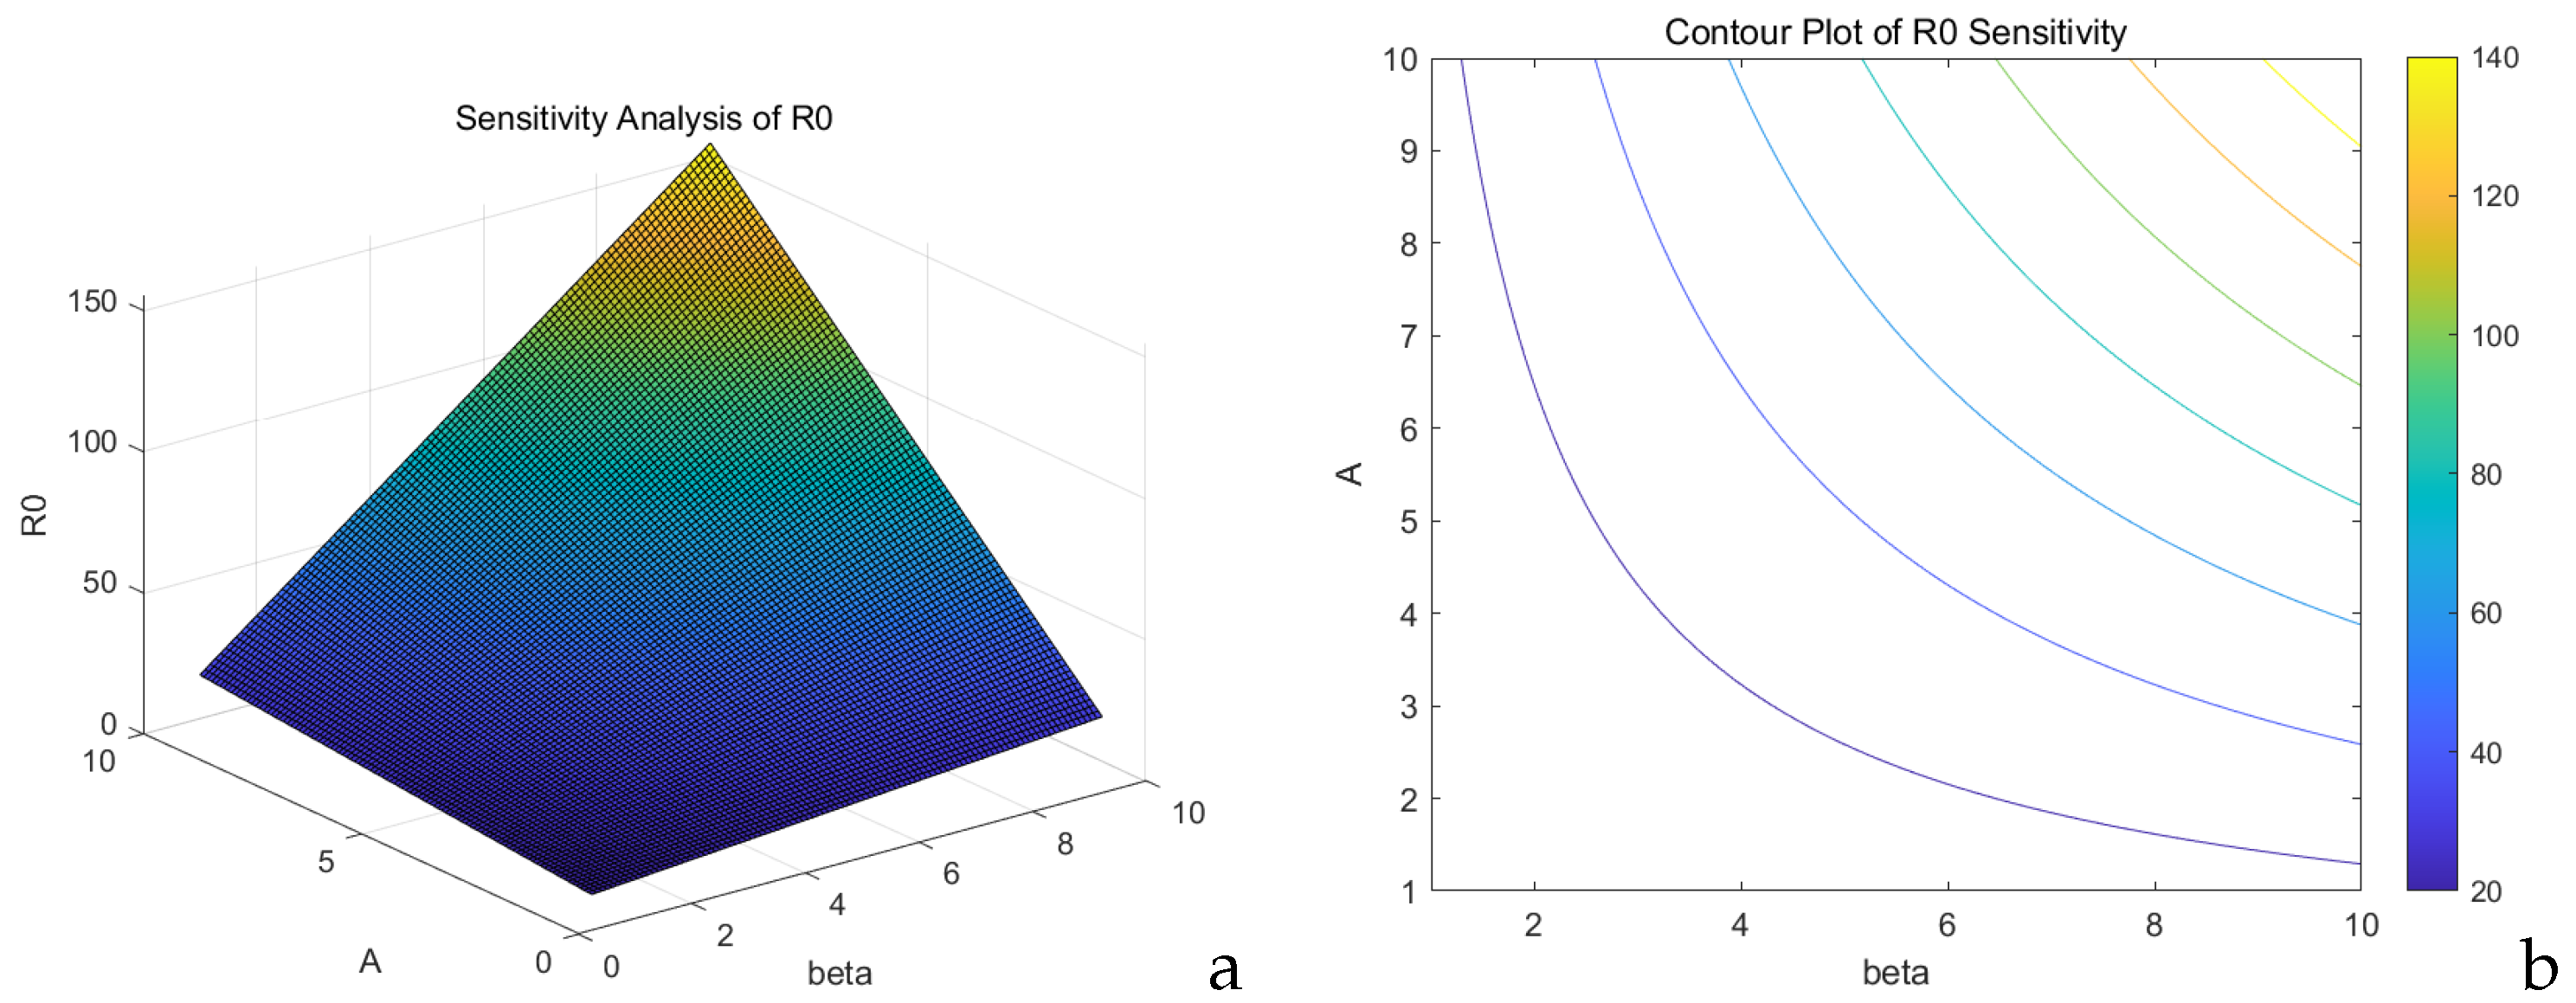
Parameter Sensitivity Analysis
The sensitivity indices in
Table 3 for both the transmission rate,
, and the inflow rate,
A, are
, indicating that a
increase in either parameter leads to a synchronous
increase in
. These two parameters are the dominant factors determining the magnitude of
. For the intervention rate,
, and natural outflow rate,
, a
improvement in
would reduce
by approximately
.
The recurrence rate
and stop rate
k have relatively weaker effects
, while the transition rate
from neutral to susceptible has the minimum impact
.
and
A show perfect proportional sensitivity
.
and
are effective suppression parameters.
and
k are secondary factors.
is negligible in this model configuration. This quantitative analysis reveals that controlling dissemination sources (
) and limiting new susceptible exposure (
A) should be prioritized in rumor containment strategies, while debunking efficiency (
) serves as the most effective intervention measure, as
Figure 14 shows.
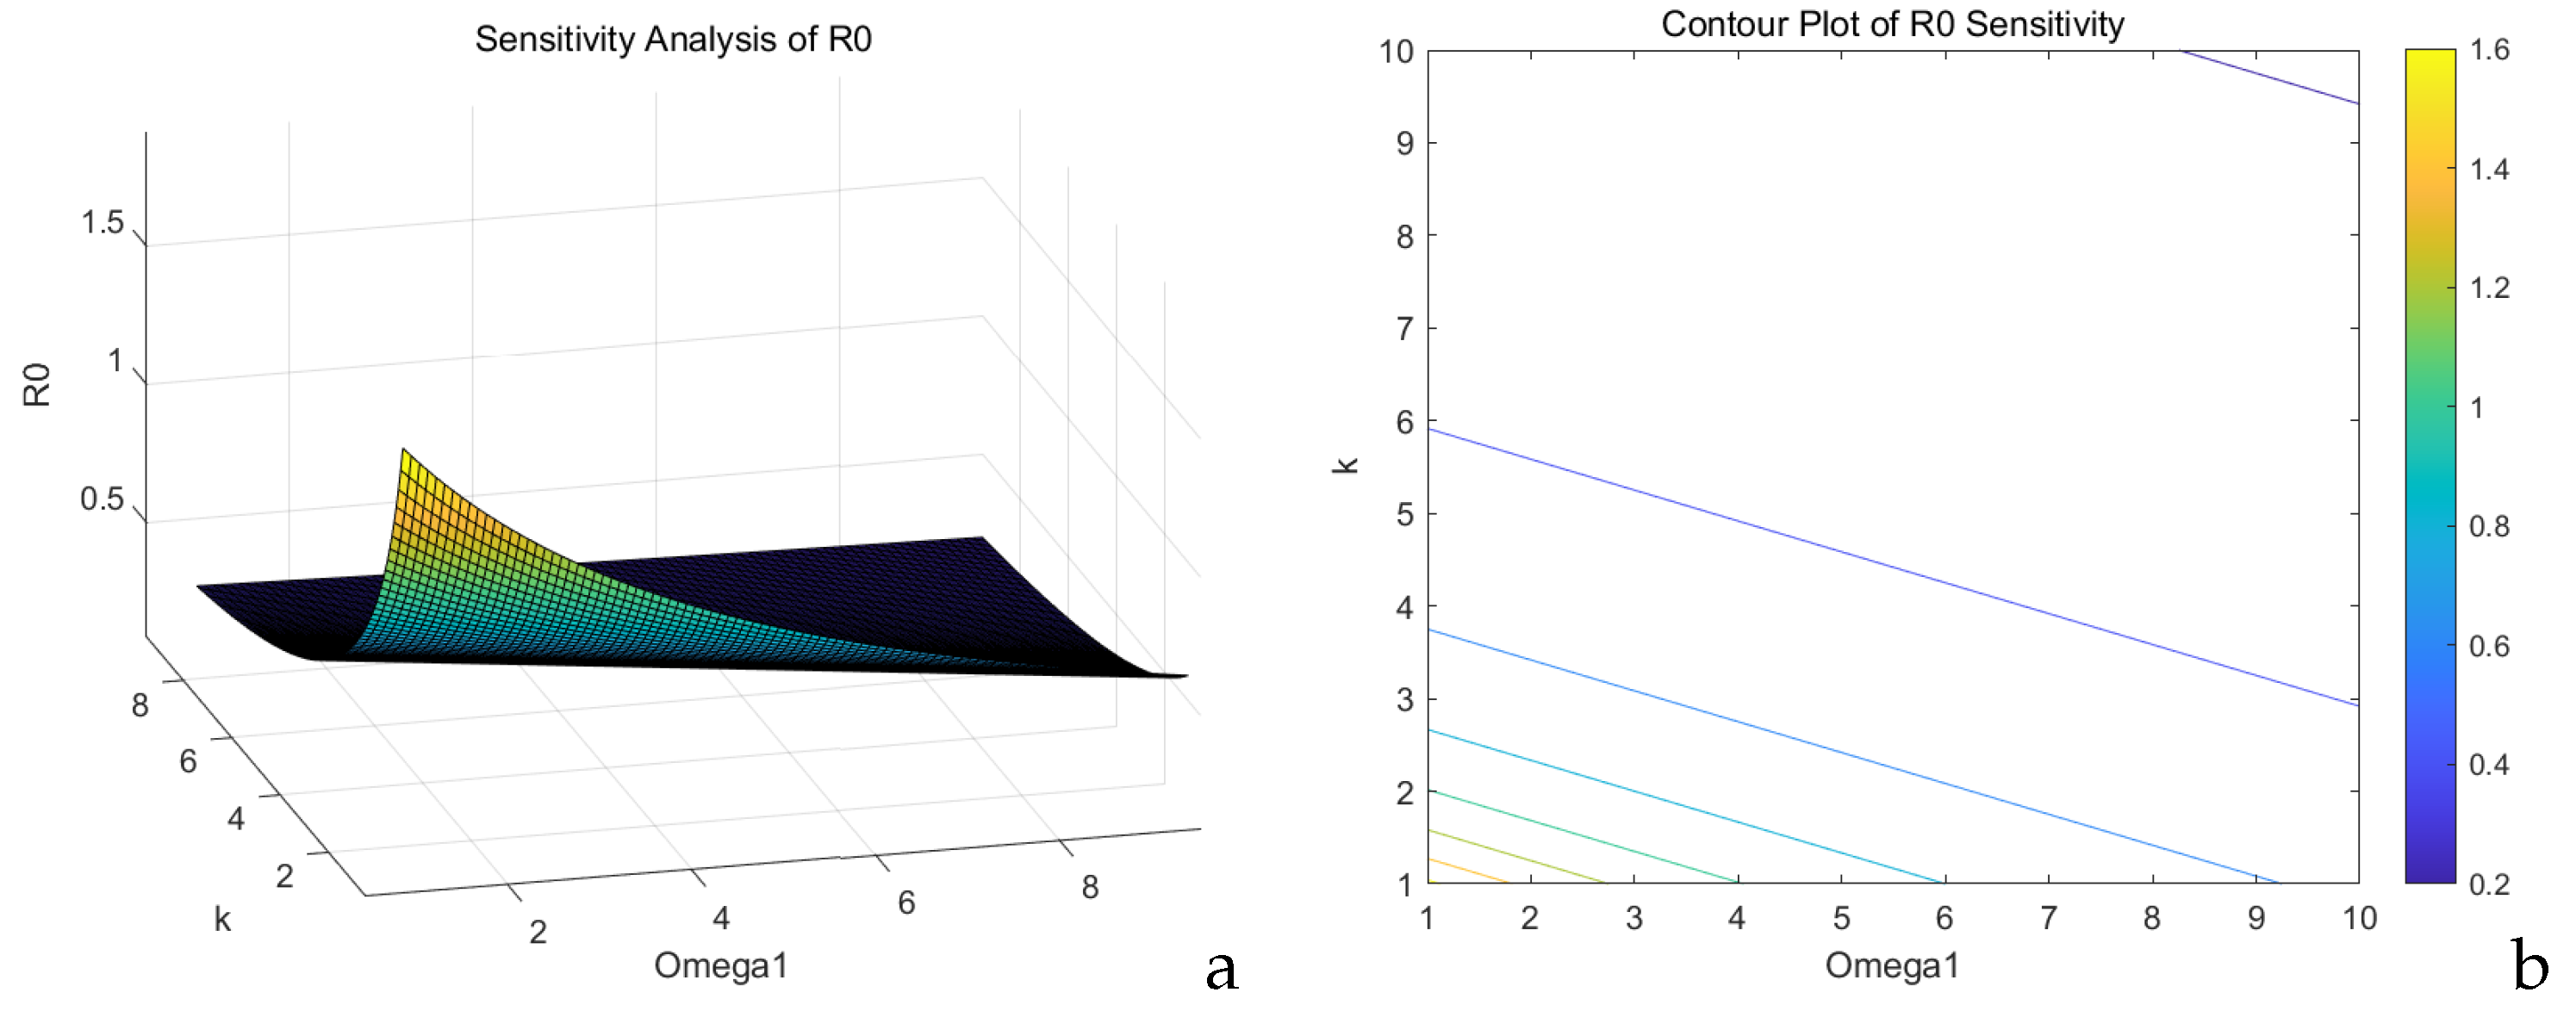
The sensitivity analysis of
and
k on
is shown in
Figure 15a,b.
Figure 15a represents the
cross-section, indicating that the expected
decreases nonlinearly as
k increases from 2 to 8. The figure demonstrates that
is required to control the spread (
).
Figure 15b shows the contour features, with
and
k exhibiting negatively sloped isovalue lines. The range of
values −1.5 (high transmission risk), 1 (critical threshold), and 0.5 (low risk)—indicates significant variation in disease transmission potential with changing parameters. When
, the disease is likely to sustain transmission (subject to an analysis of matching
k values).
decreases with either an increase in
k or a rise in
. Notably, when
exceeds 1.2,
stabilizes below 0.6, suggesting that this intervention threshold can effectively block transmission.
Figure 16a,b presents the sensitivity profiles of parameters
and
with respect to
.
Figure 16a represents the
cross-section, while
Figure 16b represents the
contour lines. The sensitivity is highest when
, which is also the region where the 0.4 contour lines are most densely distributed. Along the vertical line at
: for every increase of 0.1 in
,
decreases by 0.15. Along the horizontal line at
: for every increase of 1 in
,
decreases by 0.08. As
increases,
exhibits a declining trend, suggesting that this parameter may suppress transmission. In contrast, when
rises,
may initially increase before decreasing. The peak
value (0.6) occurs when both
and
are at their lowest levels (near the origin), highlighting their synergistic effect on transmission risk.
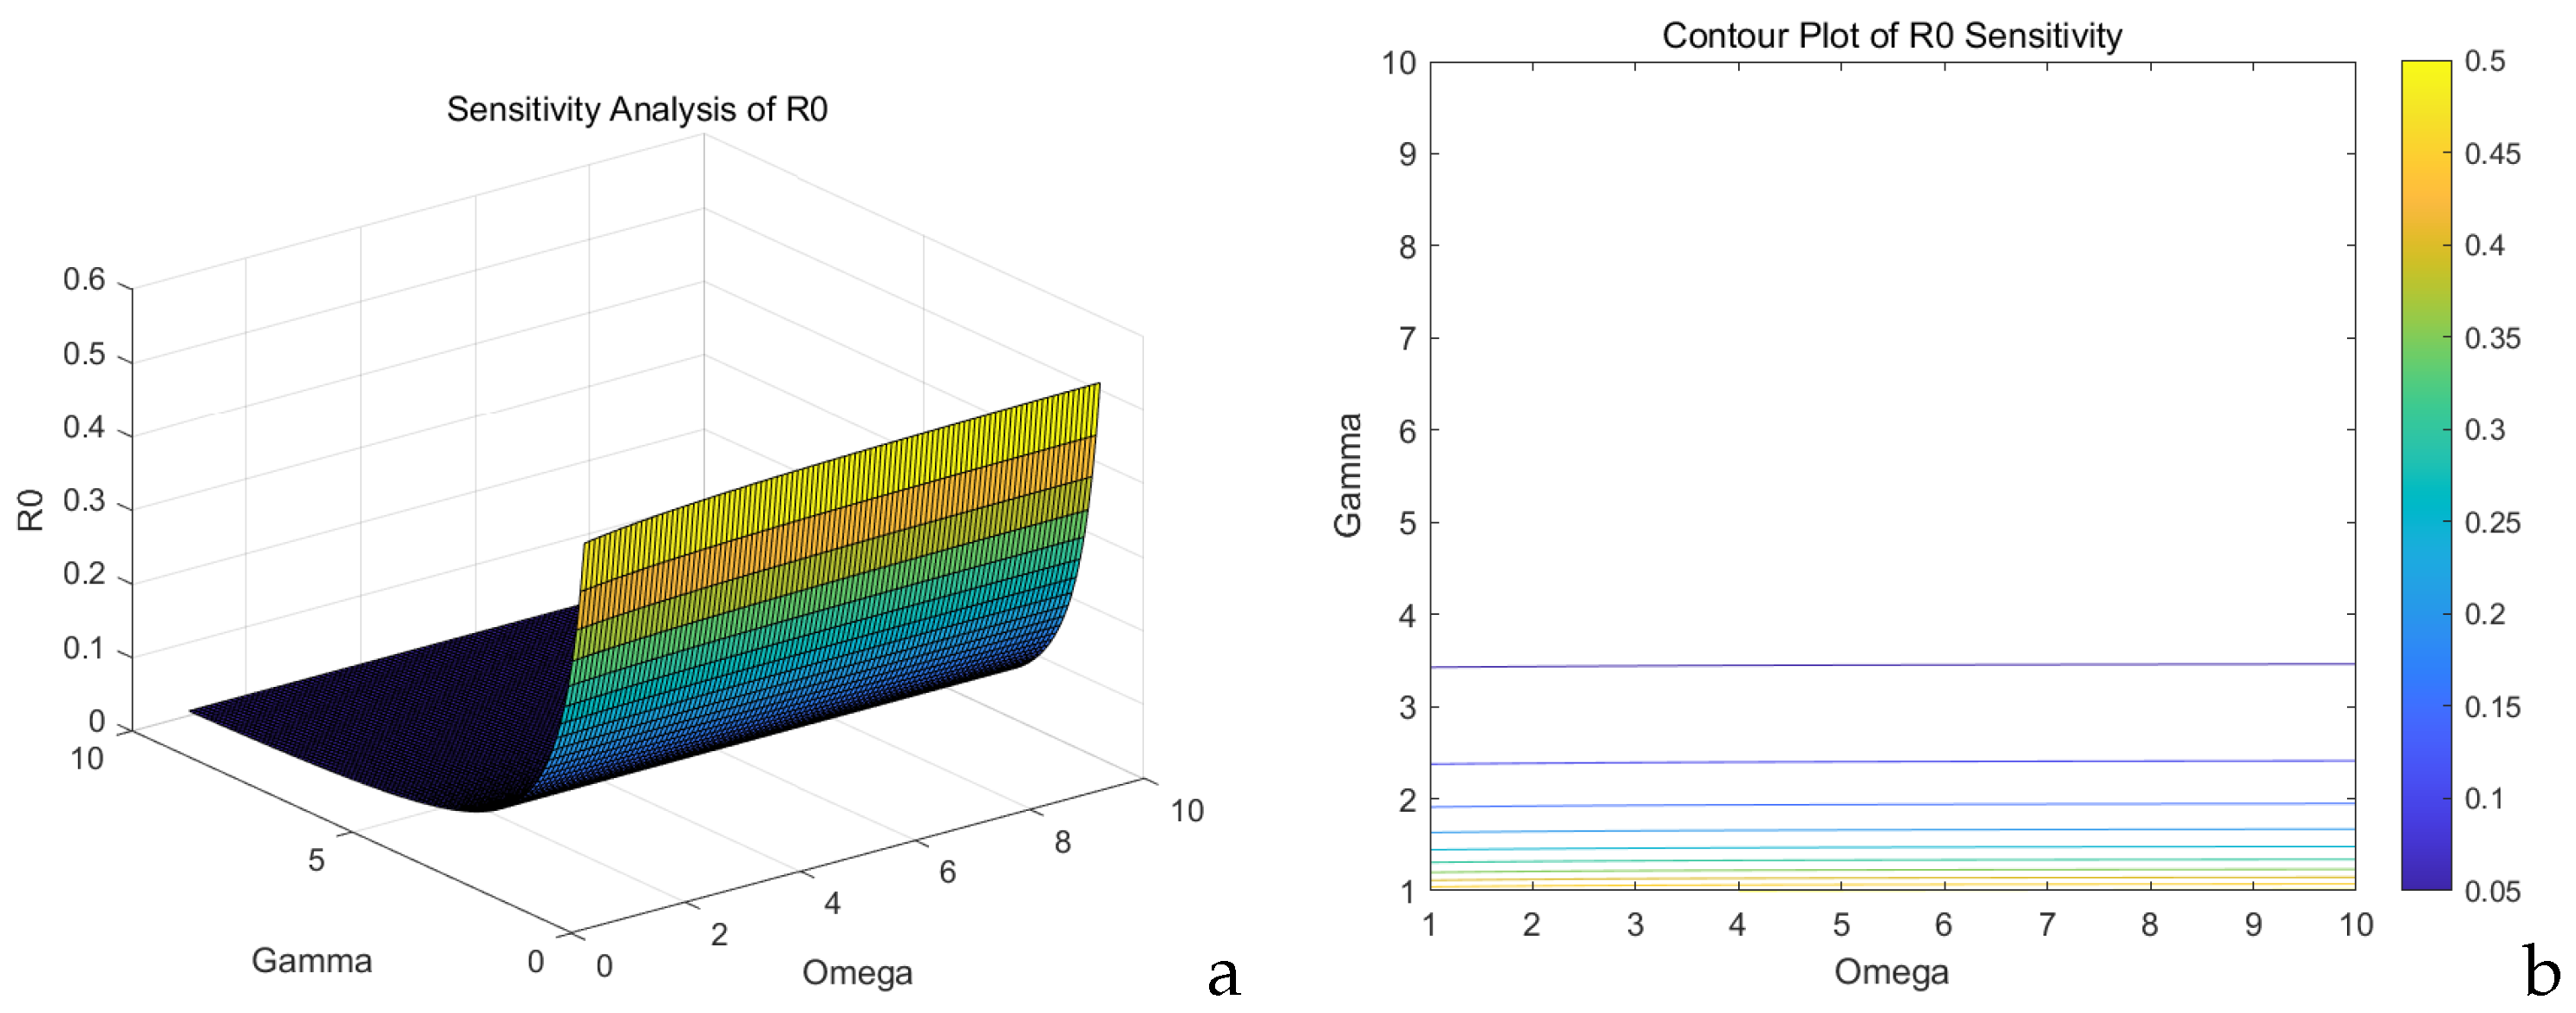
The sensitivity analysis of
and
on
is shown in
Figure 17a,b.
Figure 17a shows the
cross-section, while
Figure 17b shows the
contour lines. There is an inflection point (where the second derivative changes sign) when
. When both variables decline, it suggests that implementing rumor prevention strategies and establishing a set of punitive measures can effectively control the dissemination of rumors.
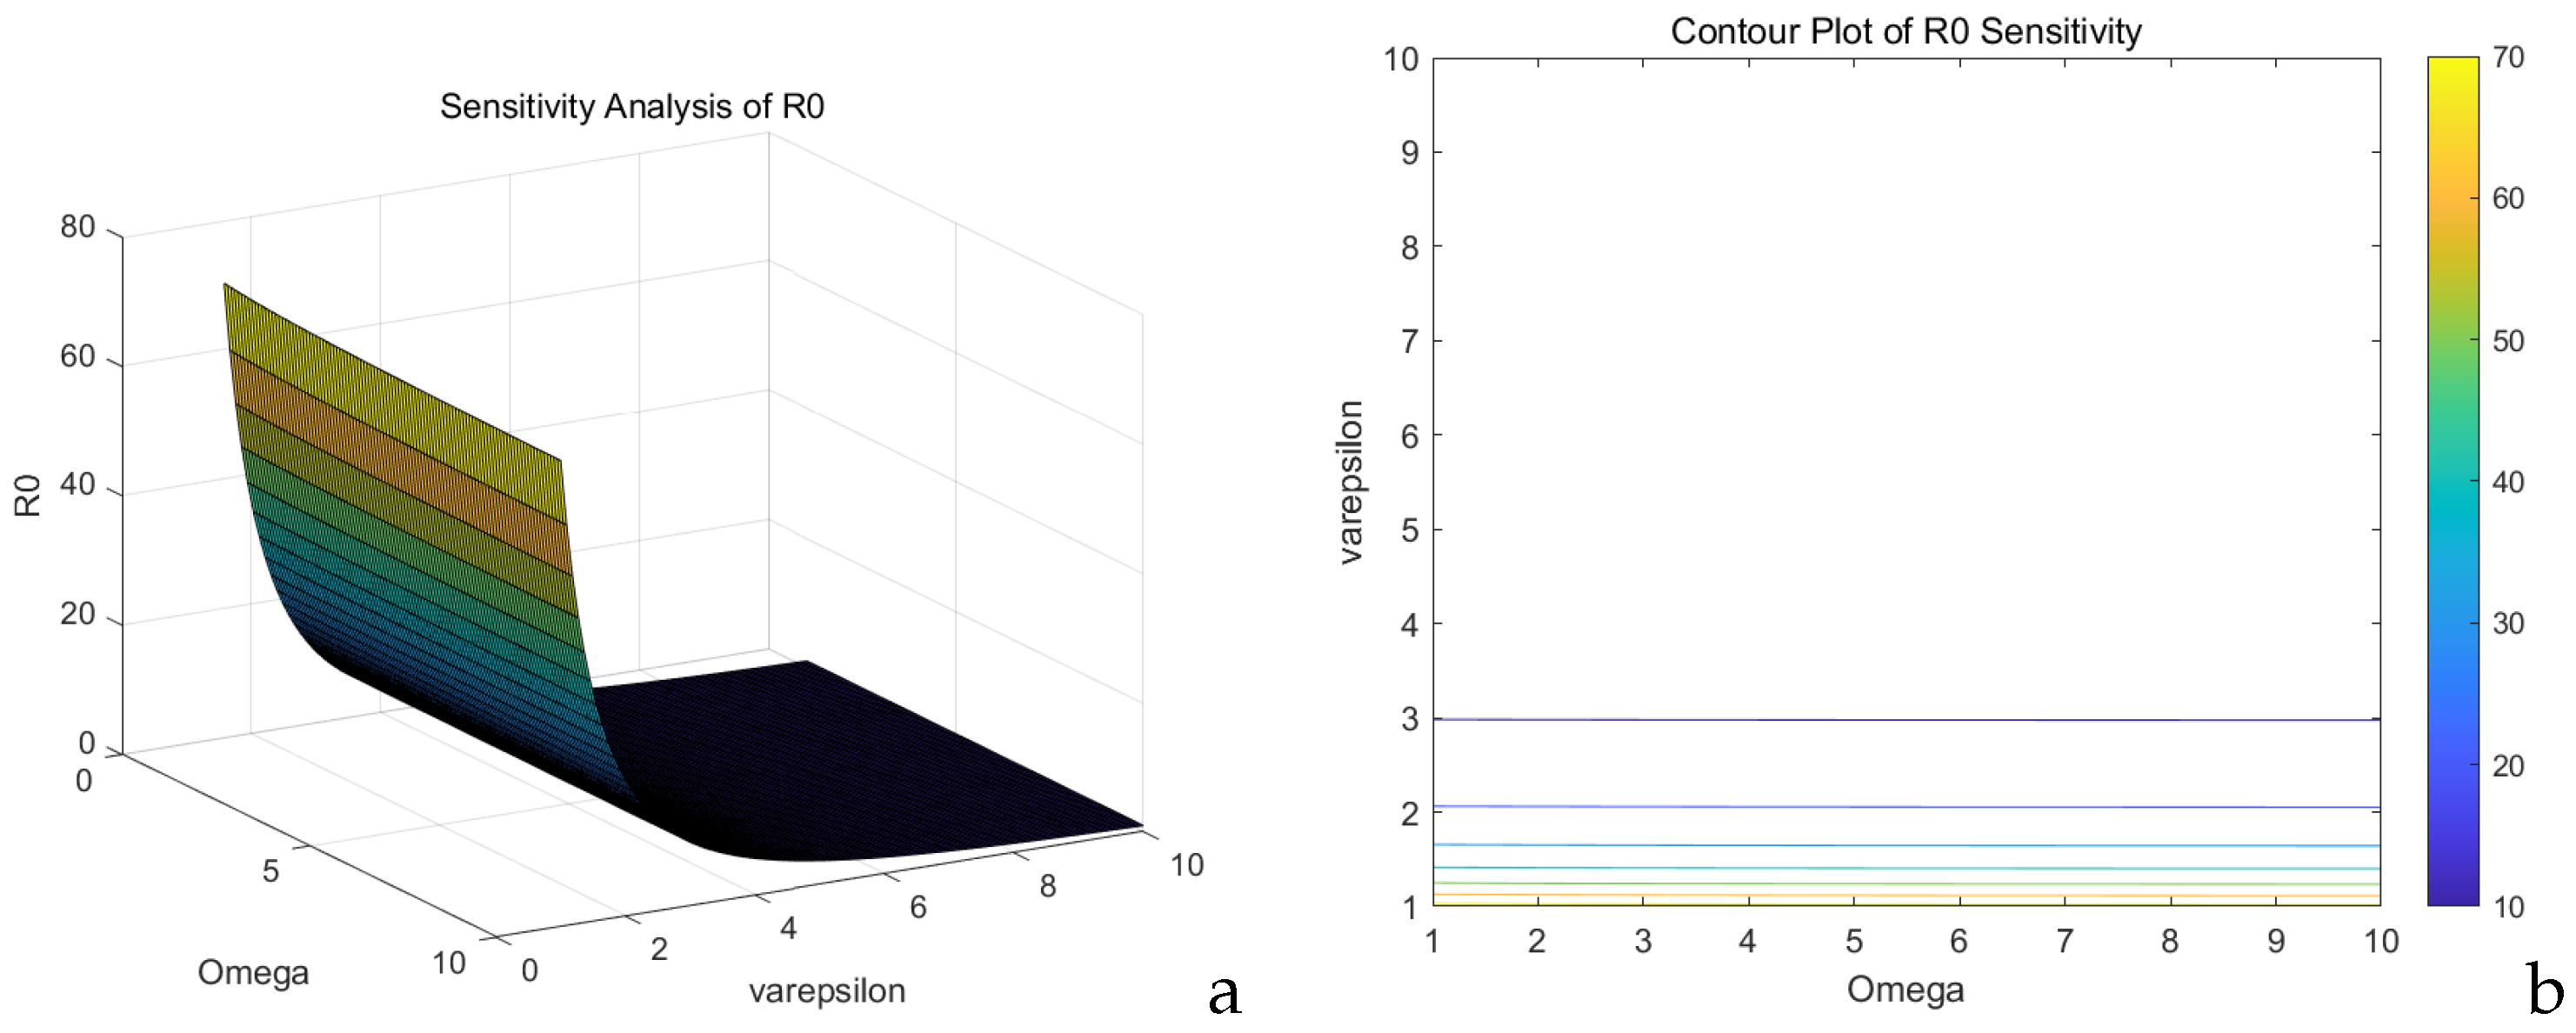
Figure 18a,b displays the corresponding analysis for
and
A regarding their impact on
.
Figure 18a shows the characteristics of the
phase diagram, where
can maintain
.
Figure 18b shows the
contour lines. Along the isovalue line of
: for every decrease of 1 unit in
, the requirement for
A can be reduced by 2.5 units.
is highly sensitive to changes in
, exhibiting a nonlinear rapid increase as
rises. This sensitivity is particularly pronounced when
A is small. However, as
A increases (approaching 5), the overall magnitude of
decreases significantly, suggesting that
A may play a role in suppressing transmission. Controlling
(e.g., through contact reduction) is an effective strategy to reduce
. Notably, increasing
A can substantially mitigate disease spread, especially when
is elevated. This analysis provides a framework for a decision support system in response to major epidemics and suggests establishing a real-time monitoring network for
and
A. When the system enters the red zone, it is necessary to suppress
below the critical value within 14 days to avoid exponential spread. The golden control zone (
,
) can achieve the maximum efficiency of prevention and control.
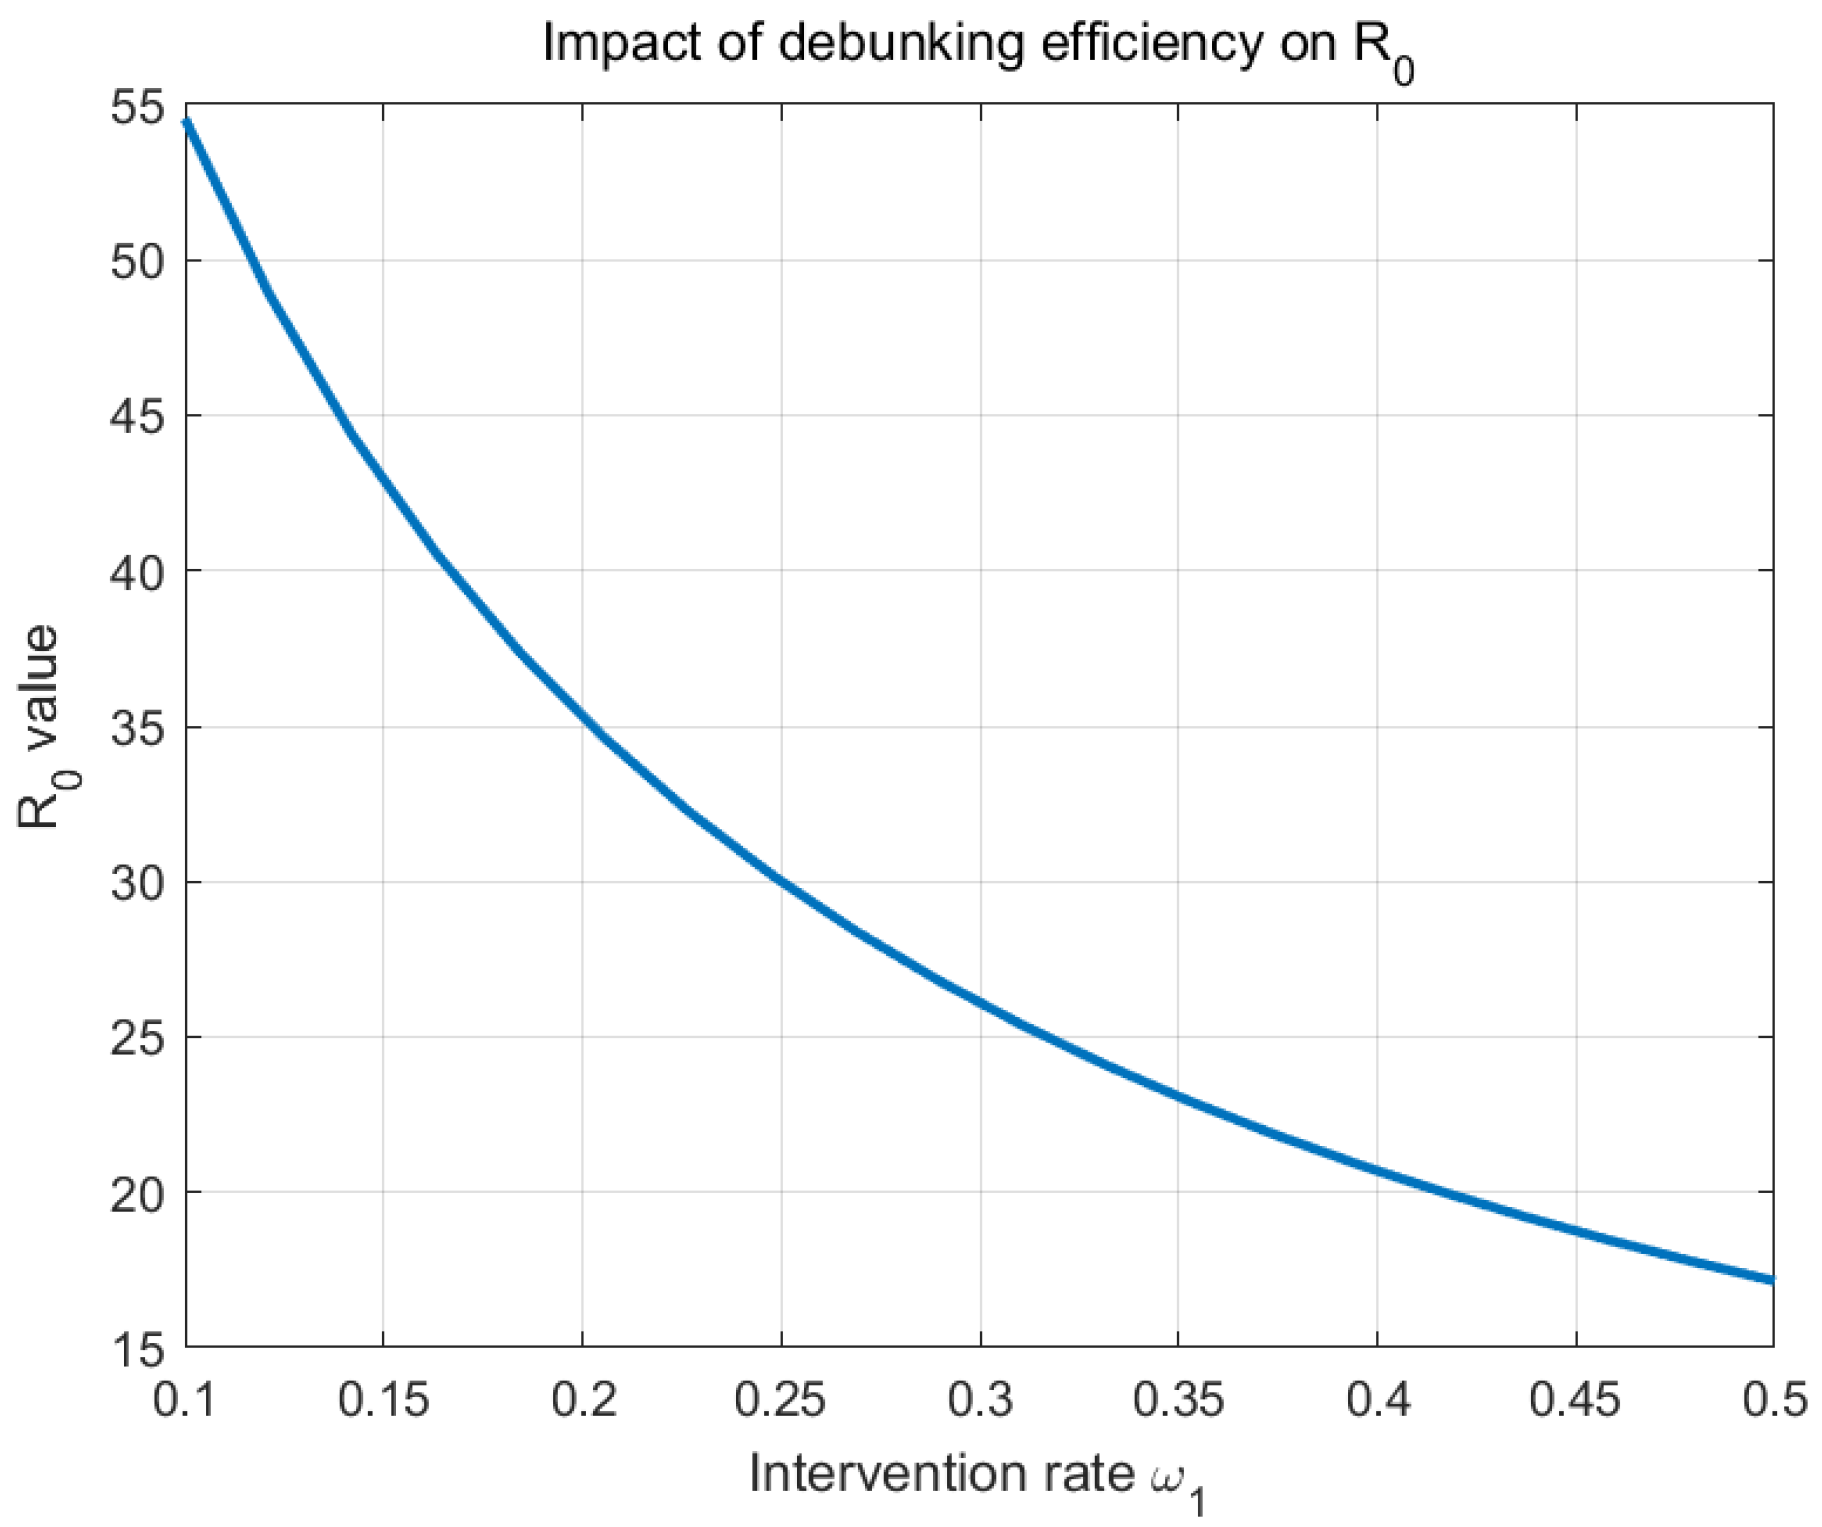
The analysis in
Figure 19 demonstrates that increasing the rumor-debunking efficiency
from 0.2 to 0.5 would reduce
from 1.25 to 0.83, representing a
decrease.
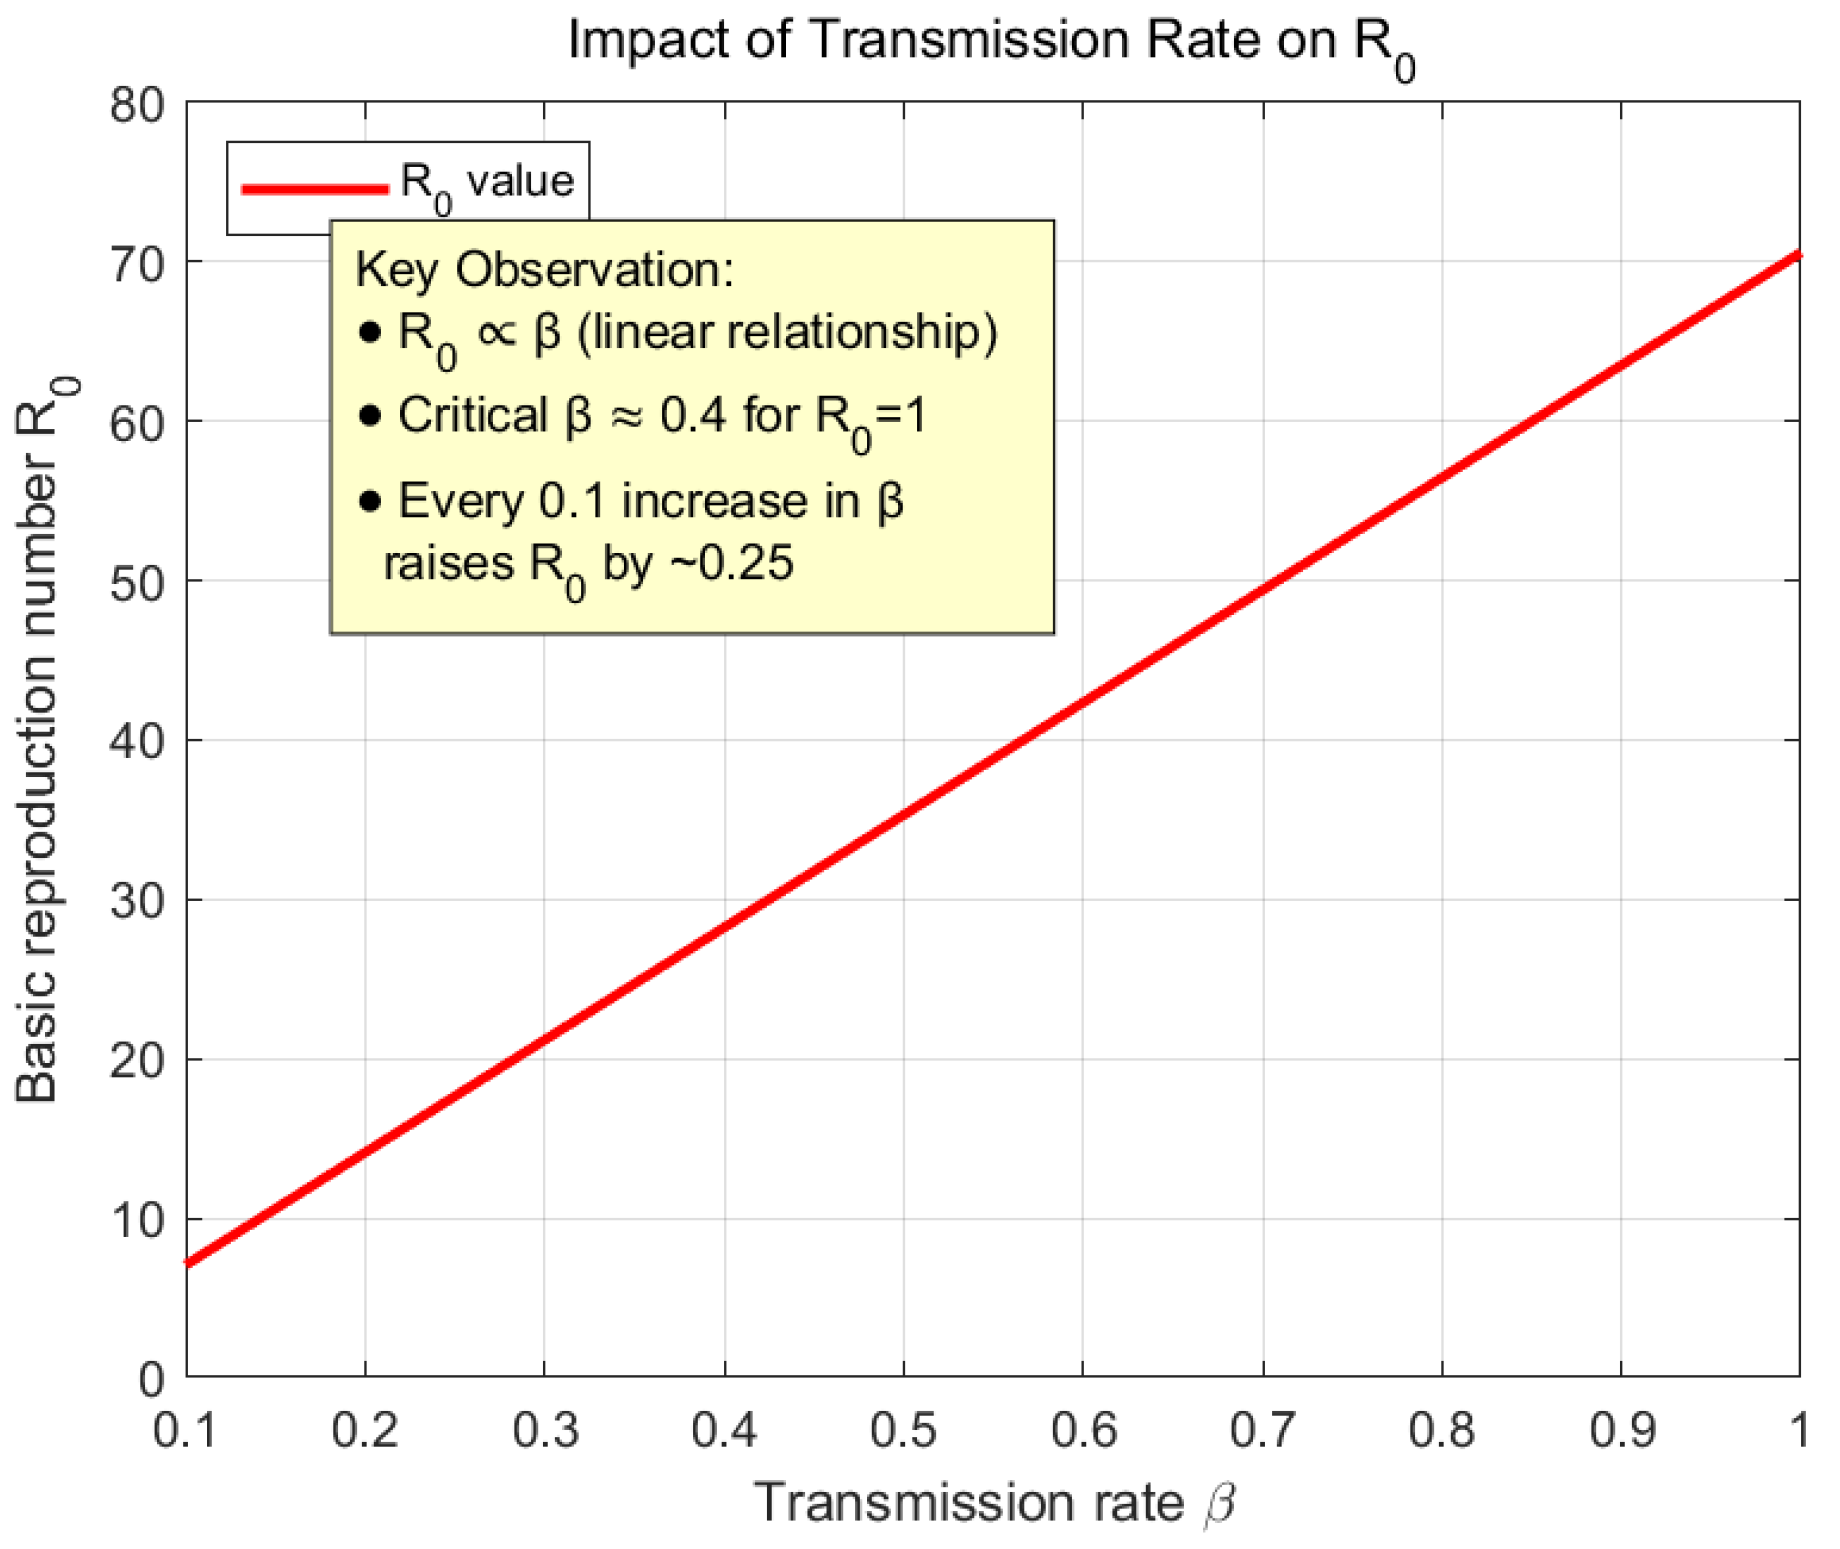
The graph in
Figure 20 will visually demonstrate the proportional relationship between
and
, automatically marking the maximum
value that maintains
. An explanatory note will indicate that every 0.1 increase in
raises
by approximately
. When
, the system achieves
, indicating a natural die-out state of rumor propagation.


