Article

A Failure Touchpoint Identification and Reconfiguration Approach for Enhancing Product–Service Symmetry

1
Key Laboratory of Industrial Design and Ergonomics, Ministry of Industry and Information Technology, Northwestern Polytechnical University, Xi’an 710072, China
2
School of Art & Design, Tianjin University of Technology, Tianjin 300384, China
3
School of Design, Xi’an Technology University, Xi’an 710021, China
*
Authors to whom correspondence should be addressed.
Symmetry 2025, 17(4), 485; https://doi.org/10.3390/sym17040485
Submission received: 4 February 2025 / Revised: 5 March 2025 / Accepted: 20 March 2025 / Published: 24 March 2025
(This article belongs to the Special Issue Symmetry/Asymmetry in Computer-Aided Industrial Design)

Abstract

:
Asymmetry of product–service systems, that is, the presentation of services that does not match the expectations of stakeholders, often leads to inefficient services. To address design asymmetry in service systems, this study proposes a stakeholder-centric methodology for failure touchpoint identification and service reconfiguration. Grounded in the principles of multi-stakeholder value co-creation, the framework involves a three-phase process: systematic identification of failure-prone touchpoints through tripartite analysis (enterprise, service personnel, and user perspectives), generation of reconfiguration alternatives aligned with prioritized stakeholder requirements, and multi-criteria decision-making to optimize service configuration. The methodology achieves design symmetry by integrating stakeholder evaluations across failure diagnosis, causal analysis, and solution validation phases. A case study on a visitor management system demonstrates significant improvements in service quality (overall score increased from 0.70 to 0.81), validating the approach’s efficacy. This research bridges the gap in existing studies by balancing multi-stakeholder interests, offering a novel contribution to service design literature.

1. Introduction

The product–service system is a new type of production system with symmetry formed under the product full life-cycle service mode in product manufacturing enterprises [1]. Against the background of the rapid development of the experience economy, the concept and method of product–service have been widely recognized and applied [2]. In the product–service system, the service touchpoint refers to the critical moment when all participants involved in the service process interact with the service, mainly existing in the interactive activities between the service provider and the service receiver [3]. Good service touchpoint design is the foundation for the high quality and symmetry of the entire product–service system [4]. If the interaction quality of service touchpoints is poor, failing to bring good experience to relevant participants and resulting in the asymmetry of the product–service system, it is called a failure touchpoint. Failure touchpoints seriously affect the quality of the service system [5]. Effectively identifying failure touchpoints and carrying out reconfiguration and design are important ways to improve the quality of the product–service system.
Some achievements have been made in the research on the identification of failure touchpoints and service redesign to solve the asymmetry problem of product–service systems. In terms of failure touchpoint identification, since the failure of touchpoints depends on the subjective experience of service participants, the existing research has mainly adopted expert or user evaluation methods for failure point identification. For example, Wei et al. [6] proposed a service failure evaluation model, which combined the fuzzy failure mode and effect analysis (FMEA) method with the TOPSIS method to construct a human–computer interaction service failure evaluation model. Moosavi et al. [7] aimed at the bus service and selected four reliability indicators to evaluate the bus service system, identifying the service touchpoints with poor reliability. Hao et al. [8], in order to optimize the urban postal service network in Norway, proposed a location optimization model and reallocated the positions of postal counters according to different location characteristics and user needs, improving the accessibility of postal services. The evolution of artificial intelligence (AI) technologies has prompted innovative approaches to service asymmetry challenges. Ozuem et al. [9] analyzed emotional influences on user loyalty and technology adoption efficacy at human–AI touchpoints, Wang et al. [10] established deep learning-driven frameworks for quality prediction and event detection in classification tasks, while Li et al. [11] developed cross-failure-type mechanical fault prediction systems utilizing advanced neural architectures.
Existing studies have employed diverse methods for service system evaluation and failure touchpoint reconfiguration, yet they have predominantly focused on user perspectives, neglecting the multi-stakeholder nature of service design. Wang et al. [12] employed a research-through-design methodology to develop a systematic design modeling framework, while Chen et al. [13] complemented this by proposing the “BEDFITA” model—a smart technology-integrated service touchpoint design paradigm that formalized stakeholder interactions through algorithmic parameterization. Extending this paradigm, Wang’s team further established a failure analysis and reconfiguration framework for service touchpoints, incorporating weighting metrics derived from user perceptual evaluations to quantify failure determinants [14]. However, the above research has mainly evaluated service systems from the perspective of users (service recipients), without considering other stakeholders in the service system. An important distinction between service design and traditional product design is that service design involves more diversified and complex stakeholders during the service execution process [15,16,17]. In service design, stakeholders refer to all people or organizations involved in the entire service cycle and even include quasi-human (service robots) or non-human (such as animals) subjects [18]. Although various stakeholders have different importance in the service system, they are all directly or indirectly affected by the operation process of the service system. A good service system should not only pursue the maximization of the interests of a certain stakeholder but also enhance the comprehensive interests of all stakeholders as much as possible, so as to achieve the symmetry of the system and obtain the higher overall interests of the service system [19,20]. Therefore, unlike the “user-centered” design concept emphasized in the field of product design, the field of service design emphasizes the “stakeholder-centered” or “system-centered” design concept [21]. If a service touchpoint results in low satisfaction of any type of stakeholder, this touchpoint should be regarded as a failure touchpoint and needs to be improved. Therefore, when identifying and reconfiguring failure touchpoints, the interests of all stakeholders should be comprehensively considered so as to improve the overall interests of the service system. Based on this, this paper proposes a failure touchpoint identification and reconfiguration method for the interests of the service system, that is, for the overall interests of stakeholders. Since users, enterprises, and service personnel are the most common and important stakeholders in common service systems [22], and for the universality of the method, only these three types of stakeholders are considered in this method. The proposed method addresses asymmetry in service systems by harmonizing stakeholder interests, thereby achieving design symmetry—a core focus of the Symmetry journal.

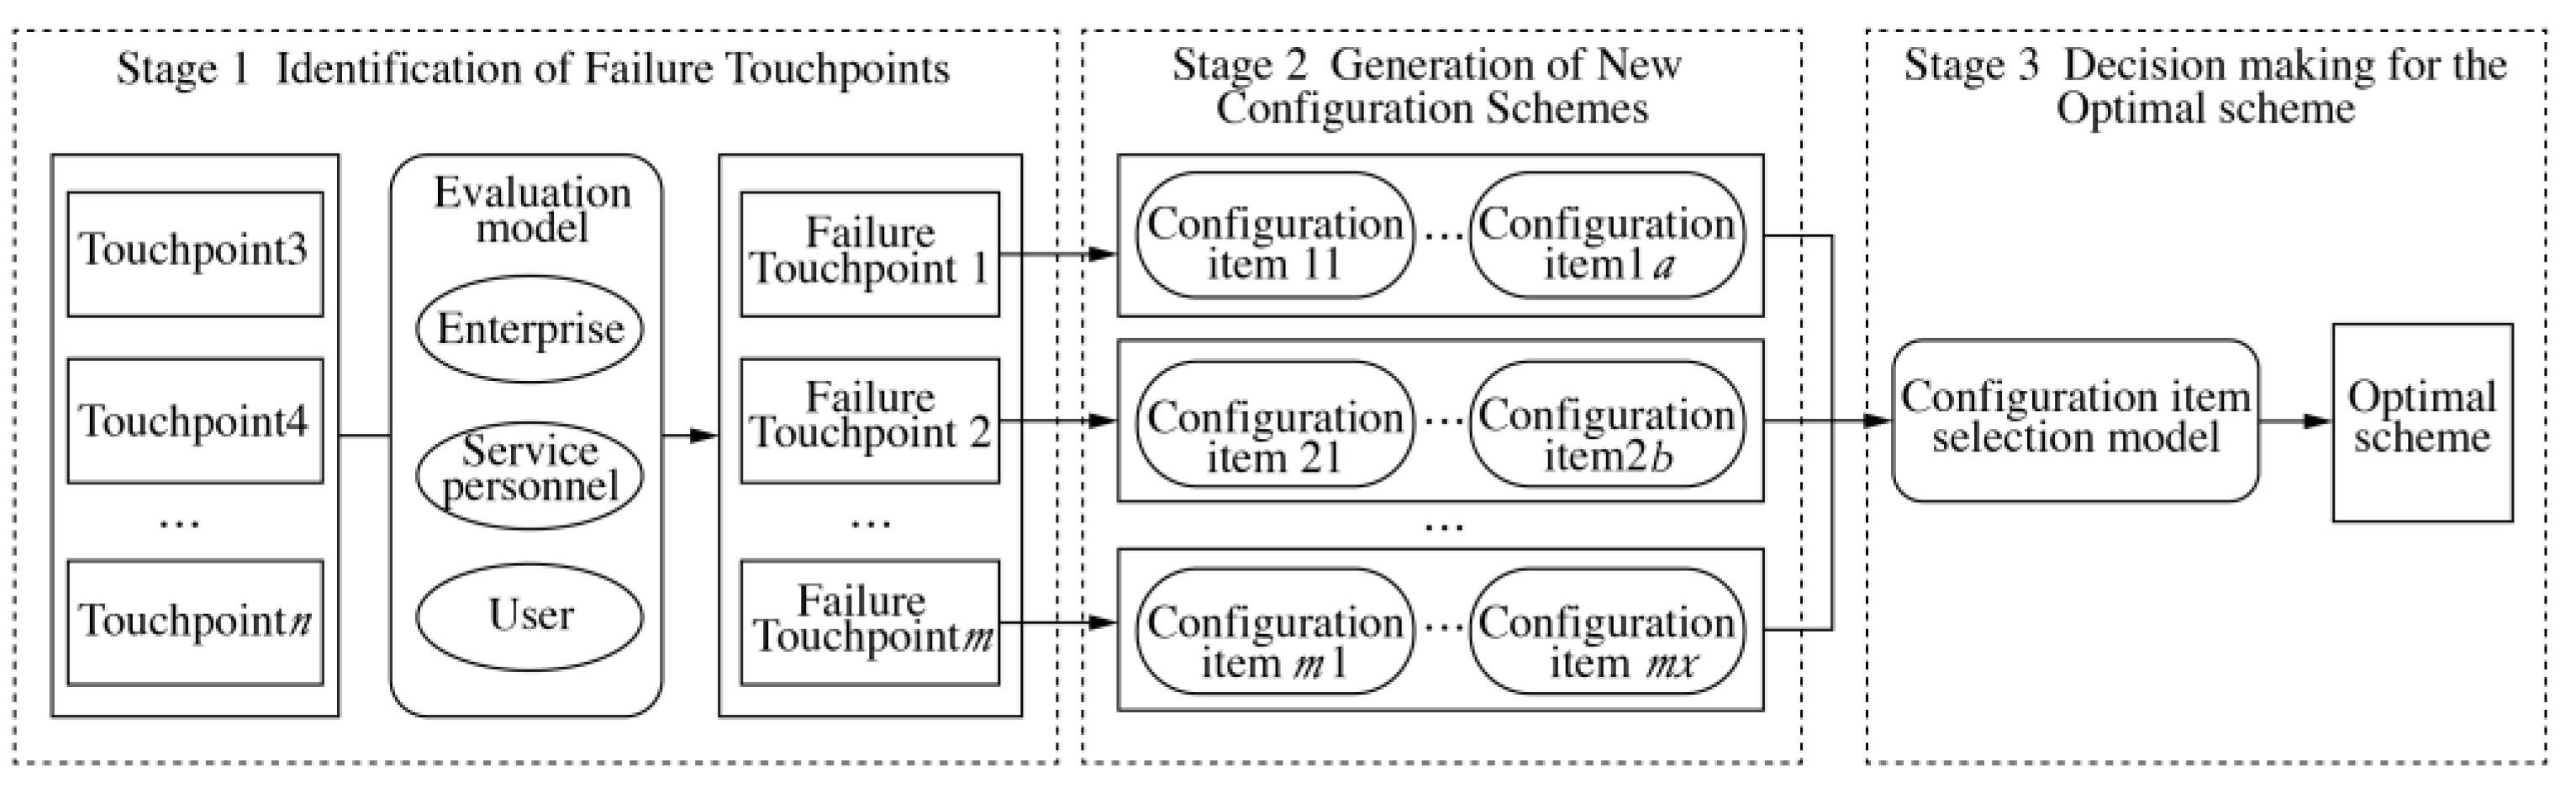
2. Method Construction

Based on the above analysis, a framework for failure touchpoint identification and reconfiguration was proposed. The framework construction follows the idea of “discover the problem-propose the solution-decide the solution”, which is often used in the design field. This framework contributes to the accurate identification and reconstruction of failure contact points in two ways. First, the opinions of all stakeholders were considered in the construction of the framework, and second, evaluation indicators and quantitative evaluation methods with strong operability were proposed according to the characteristics of different stakeholders. The framework is shown in Figure 1.
The method was divided into three stages:
  • Identification of Failure touchpoints: On the basis of sorting out all touchpoints in the service cycle, build evaluation models for different stakeholders, evaluate all touchpoints, and identify the failure touchpoints with poor service quality.
  • Generation of New Configuration Schemes: Analyze the causes of failure at the failure touchpoints, put forward multiple candidate service configuration items in a targeted manner, and generate multiple new service configuration schemes through different combinations of configuration items.
  • Decision-making for the Optimal Scheme: Evaluate the new configuration schemes and make decisions to obtain the optimal one.

2.1. Identify Failed Touchpoints

2.1.1. Sort Out Service Touchpoints

The main methods for sorting out service touchpoints include observations, situational interviews, role-playing, questionnaires, and other methods [23]. After obtaining all the touchpoints, we analyzed the stakeholders involved. If only enterprises and users were involved, it was recorded as P(S); if enterprises, service personnel and users were involved, it was recorded as P(M). We sorted and coded all the touchpoints according to the typical user behavior process to obtain the touchpoint set TP = {P(S)1, P(S)2, , P(S)n, P(M)n+1, P(M)n+2, , P(M)n+m}, where n and m are the number of two types of touchpoints, respectively, and the total number of touchpoints in the service system is n + m. We recorded them in the form of a user journey map or table.

2.1.2. Failure Touchpoint Determination Rules and Evaluation Model Construction

Failure touchpoints refer to service touchpoints with poor interaction quality. When identifying failure touchpoints, the interests of different stakeholders need to be considered simultaneously. For example, a hospital has set up a service process of “official APP appointment registration-sign in to the clinic according to the appointment time-waiting area for a call-medical treatment”. In the touchpoint of “waiting area for a call”, if the patient waits for the doctor on time but fails to see a doctor, this touchpoint does not meet the interests of the patient and is a failure touchpoint. If the patient waits for the doctor on time and visits the doctor, but the doctor’s workload is too large, then this touchpoint does not meet the doctor’s interests, and it is also a failure touchpoint.
Based on the above analysis, two judgment rules for failure touchpoints were formulated:
Rule 1: For the evaluation result of a single touchpoint. If the interests of a certain stakeholder or the comprehensive interests of all stakeholders of the touchpoint are lower than the threshold, this touchpoint will be judged as a failure point.
Rule 2: For the evaluation result of the service system. If the overall interests of the service system are lower than the threshold, in addition to improving the failure points identified by Rule 1, the touchpoints with high importance and low comprehensive interests should also be focused on improving so as to efficiently improve the overall quality of the service system. In this case, the touchpoints with importance higher than the threshold and comprehensive score lower than the threshold will be identified as failure points.
In the service system, three types of stakeholders have different interests. According to the main interests of each stakeholder, the touchpoint evaluation indexes are set, respectively. For enterprises, economic interests are the most important interests, and the operating cost of touchpoints is taken as the evaluation index of economic interests. For service personnel, the job satisfaction index represents their attitude and appeal [24], so obtaining higher job satisfaction is their main interest. According to the literature [25,26,27,28], the factors that affect job satisfaction and are universally applicable to all industries include salary, promotion system, workload and so on. In the case of touchpoints in the service system, the impact of factors such as salary and promotion system on job satisfaction can be ignored. Therefore, the workload is taken as an index to evaluate the job satisfaction of touchpoints. On the basis of the above literature research results, secondary indexes such as total working hours, single cycle working hours, total service population, single cycle service population, physical workload, and mental workload were proposed. For users, the main interest is to achieve the predetermined goals comfortably, efficiently and conveniently through receiving services to meet the needs and realize the value. This paper took user satisfaction as the evaluation index. User satisfaction refers to the comparative value between the actual feeling of users when receiving products and services and their expected degree [29,30], which is a common user evaluation index in the field of service design. Based on several studies on user satisfaction evaluation in service design [31,32,33], target achievement degree, service speed, clarity, comfort, convenience, and economy were set as secondary indicators. In different application scenarios of the service system, the second-level indicators can be adjusted and expanded. Accordingly, the service touchpoint evaluation index system shown in Figure 2 is constructed. In Figure 2, service touchpoint evaluation indicators are sorted out from three dimensions: enterprise, service personnel and users, and two levels of indicators are proposed. The evaluation indicator system can be modified and expanded according to the specific situation.

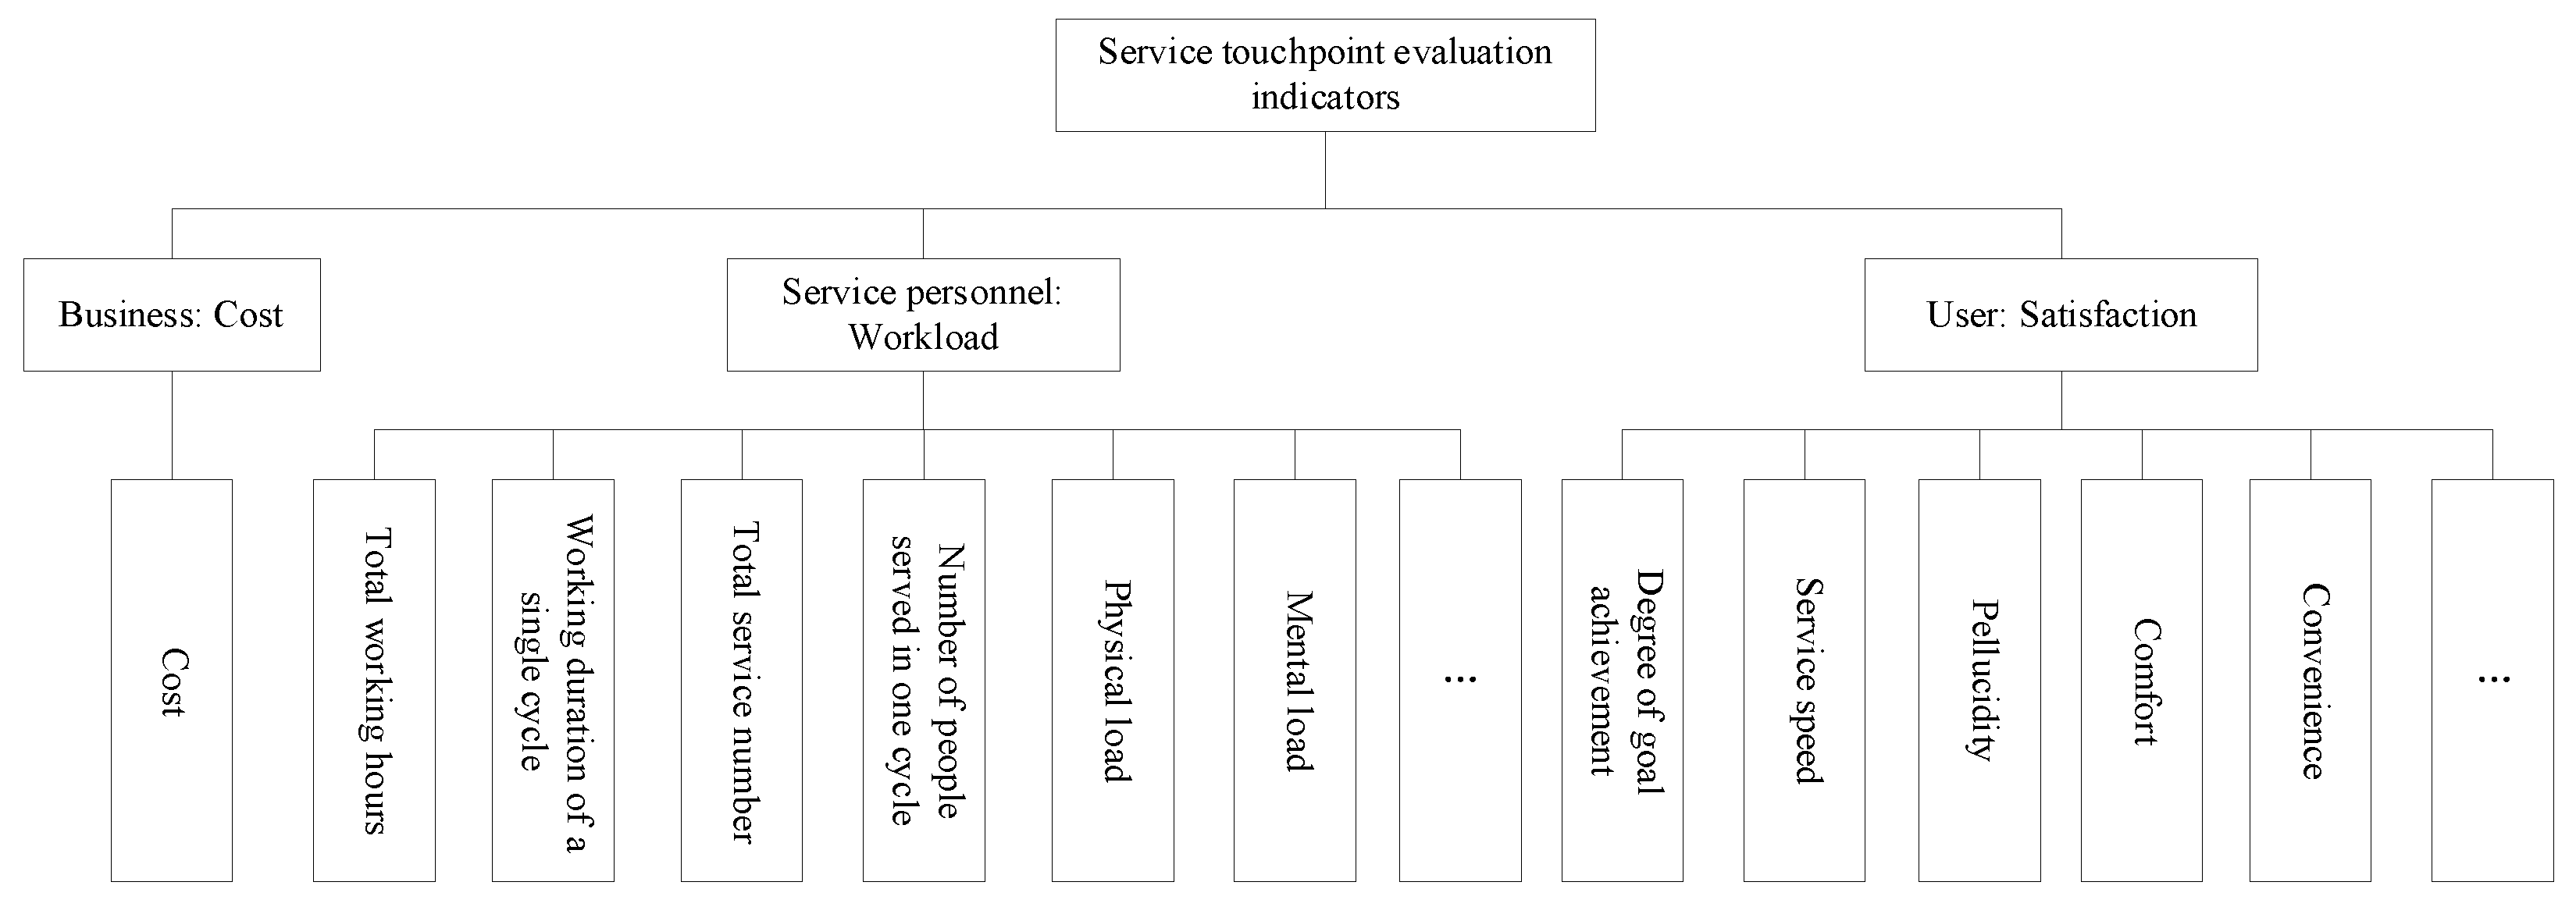
2.1.3. Evaluation of Touchpoints

A certain number of enterprise representatives, service personnel, and users were invited to evaluate the touchpoints based on their respective interests, taking the touchpoint Pi (1 ≤ in + m) as an example.
  • Business Evaluation Method: For enterprises, the cost of evaluation indicators is a quantitative metric. Enterprises calculate the actual operational cost Cir of Pi based on the real operating costs of the service system. According to market analysis results and the business conditions of the enterprise, the maximum tolerable cost for Pi was set as Cimax, and the optimal cost was Cimin. The evaluation score Sic of Pi’s cost was calculated using Equation (1), where 1 represents the best and 0 represents the worst.
S i c = 0 ,        C i r > C i max C i max C i r C i max C i min , C i min < C i r < C i max 1 ,        C i r C i min  
  • Service Personnel Evaluation Methods: For service personnel, there are many evaluation indicators. The weights of each indicator should be evaluated first, and then each indicator is evaluated to obtain the comprehensive evaluation value. Service personnel are more suitable for evaluation with semantic variables rather than precise numerical expressions. Five semantic variables {very important, important, medium, unimportant, very unimportant} were used to evaluate the importance of indicators, and five semantic variables {very good, good, medium, bad, very bad} were used to evaluate the performance of touchpoints under various indicators. This paper used triangular fuzzy numbers to express and process semantic evaluation variables. The relationship between semantic variables and triangular fuzzy numbers is shown in Table 1.
We developed the evaluation method with reference to the method proposed in [34]. There was a total of p service personnel participating in the evaluation of Pi. There were q evaluation indicators, denoted as IF1, IF2, …, IFq. Each service personnel Fj (1 ≤ jp) evaluates the importance and score of each indicator using the above semantic variables. Let w ˜ k j represent the evaluation of the importance of indicator IFk (1 ≤ kq) by service personnel Fj. The group decision value w ˜ k for calculating the importance of the indicators was obtained using the arithmetic mean method:
w ˜ k = 1 p w ˜ k 1 w ˜ k 2 w ˜ k q
Let s ˜ k j represent the evaluation value of the touchpoint Pi under the indicator IFk by service personnel Fj. The group decision value s ˜ k j for calculating the importance of the indicators was obtained using the arithmetic mean method:
s ˜ i k = 1 p s ˜ i k 1 s ˜ i k 2 s ˜ i k q
The evaluation score of touchpoint Pi is given by
S ˜ i f = k = 1 q w ˜ k s ˜ i k
In Formula (4), both w ˜ k and s ˜ k are triangular fuzzy numbers. They need to be converted into precise values. Using Formula (5), we calculated the normalized weight of w ˜ k = w k l , w k m , w k u :
w k = w k l + 2 w k m + w k u i = 1 q w i l + 2 w i m + w i u
Assuming s ˜ i k = s i k l , s i k m , s i k u , we can use Equation (6) to calculate its expected value:
s i k = s i k l + 2 s i k m + s i k u 4
Finally, the precise evaluation score of the touchpoint Pi by the service personnel was obtained as follows:
S i f = k = 1 q w k s i k
  • User Evaluation Method: The user evaluation method is similar to the service personnel evaluation method. Using the same approach, the evaluation score Siu for the touchpoint Pi was calculated.
  • Touchpoint Importance Evaluation: Each touchpoint’s importance to the service system varies. To assess the overall performance of the service system, it was necessary to evaluate the importance of each touchpoint. The touchpoint importance was evaluated by all evaluators using the Analytic Hierarchy Process (AHP), a classical evaluation method [35]. The importance of touchpoint Pi is denoted as Wi. The sum of all touchpoint importance values is equal to 1.

2.1.4. Failure Touchpoint Determination

Through the above process, we have obtained the evaluation results of various touchpoints from the three categories of stakeholders. Considering the evaluations from all three stakeholders, we calculated the comprehensive evaluation results for each touchpoint. If PiP(S), which means the touchpoint does not involve service personnel, its comprehensive evaluation result was calculated as follows:
S i = w s c S i c + w s u S i u
where wsc and wsu, respectively, represent the weights of the enterprise and the user, with wsc + wsu = 1.
If PiP(M), indicating that the touchpoint involves service personnel, its comprehensive evaluation results were calculated as follows:
S i = w m c S i c + w m f S i f + w m u S i u
where wmc, wmf, and wmu, respectively, represent the weights of the enterprise, service personnel, and users, with wmc + wmf + wmu = 1. The determination of the weight can be based on the discussion of the relevant stakeholders, or it can be determined by a more objective group decision-making method [36].
Based on the failure point determination rules established in the previous context, two standard criteria were formulated to determine failure touchpoints:
  • If the evaluation results of Pi are below the set threshold, i.e., if the evaluation results of Pi satisfy Equation (10), then it is determined as a failure point.
S i c < S c min   or   S i f < S f min   or   S i u < S u min   or   S i < S min
where Scmin, Sfmin, Sumi, and Smin, respectively, represent the minimum threshold values for enterprise rating, service personnel rating, user rating, and comprehensive rating.
  • The overall rating of the service system is the weighted sum of the evaluation scores of each touchpoint. If the overall rating of the service system is below the threshold, i.e., it satisfies Equation (11), then touchpoints with higher importance but lower evaluation scores are considered as failure touchpoints.
S o v e r a l l = i = 1 n + m W i S i < S min o v e r a l l
where S min o v e r a l l is the minimum threshold value for the overall rating of the service system. Threshold values Wo and So are set. Under the condition of satisfying Equation (11), if Pi meets Equation (12), then Pi is determined as a failure touchpoint.
W i > W o   and   S i < S o

2.2. Generating New Configuration Plans

After identifying a total of r + s failure touchpoints, they were re-encoded to form the failure point set WTP = {P′(S)1, P′(S)2, , P′(S)r, P′(M)r+1, P′(M)r+2, , P′(M)r+s}. Reconfiguration of service configuration items was performed for the identified failure touchpoints. Firstly, the triggering conditions for the failure touchpoints were analyzed, followed by further analysis of the evaluation results to clarify the failure reasons. Subsequently, service designers proposed several corresponding service configuration items in response to the failure reasons. Multiple service configuration plans could be generated for several failure points, offering various decision options for different stakeholders to make optimal decisions.

2.3. Optimal Decision-Making

To select the best scheme from numerous candidate configuration schemes, it was necessary to predict the evaluation scores of each scheme and choose the scheme with the highest predicted evaluation score as the final scheme.
The scheme evaluation scores were determined by the evaluation scores of the service configuration items selected for each touchpoint, and different methods were used to predict the evaluation results for different stakeholders. For enterprises, the cost of the service configuration items can be more accurately determined by experts based on market analysis and enterprise operation analysis and then converted into points according to Equation (1). For service personnel and users, if conditions permit, a real service system can be constructed for small sample experiments, and the same evaluators can be invited for real evaluation. If there are too many candidate configuration items, or if it is impossible to construct experiments due to cost and other limitations, it is difficult for service personnel and users to have real experience with service configuration items and to give more objective evaluation. In this case, service design experts predict the evaluation results of configuration items based on item performance. Two methods were adopted according to the characteristics of indicators, and the specific methods are as follows:
  • Data-based evaluation indicators, such as total working hours, total number of service personnel, etc.: Let IFk be a data-based evaluation indicator. For the failure point P′i, its actual value of IFk is measured as Nik, and based on Equation (3) and Equation (6), the evaluation score is obtained as Sik. For P′i, the service designers propose a total of g service configuration items, forming the set of configuration items D = (Di1, Di2, , Dig). Based on their experience, the service design experts provide data prediction values for each configuration item under the indicator, denoted as N = (Nik1, Nik2, , Nikg). Assuming that the service configuration item Dia (DiaD) performs the best under this indicator, its score Sika is set to 1. According to existing research, the user experience of a product or service is often linearly related to relevant parameter variables [31,32]. Based on this, if IFk is a cost-type indicator, meaning that lower values are preferable, the predicted evaluation score for the service configuration item Dix (DixDi) under this indicator is:
s i k x = s i k a s i k N i k N i k a N i k x N i k a + s i k
If IFk is a benefit-type indicator, meaning that higher values are preferable, the predicted evaluation score for the service configuration item Dx (DxD) under this indicator is:
s i k x = s i k s i k a N i k N i k a N i k x N i k a + s i k a
  • Experience-based evaluation indicators, such as workload, comfort, convenience, etc.: These types of indicators cannot be evaluated based on quantitative data. Therefore, service design experts use semantic evaluation methods for assessment. They predict the scores of candidate service configuration items under various indicators based on the scores of the current service system’s failure point service configuration items and the performance of candidate service configuration items.
After obtaining the scores of candidate service configuration items under various indicators, the predicted evaluation results of service personnel and users for these items were calculated using Equation (7). Subsequently, based on Equations (8) and (9), the predicted comprehensive evaluation results of each candidate service configuration item were calculated according to the touchpoint type, using Equation (10) to filter the configuration items and eliminate those with scores below the threshold.
Let P′IP(S) be a failure touchpoint, and after filtering, there are a total of ki candidate service configuration items. Similarly, let P′jP(M) be another failure touchpoint, and after filtering, there are a total of kj candidate service configuration items. To maximize the predicted scores of the plans, the service configuration item optimization model was constructed as follows:
max S p = i = 1 r v = 1 k i W i x i v S i + j = 1 s w = 1 k j W j x i w S j = i = 1 r v = 1 k i W i x i v w s c S i c v + w s u S i u v + j = 1 s w = 1 k j W j x i w w m c S j c w + w m f S j f w + w m u S j u w s . t .   v = 1 k i x i v = w = 1 k j x j w = 1 ,   i = 1 ,   2 ,   ,   r ,     j = 1 ,   2 ,   ,   s x i v , x j w 0 , 1
The variables xiv and xjw in the formula are both binary variables with values between 0 and 1. xiv = 1 indicates selecting the v-th candidate service item as the final service configuration item for the failure touchpoint P′i, while xiv = 0 indicates not selecting the v-th candidate service item as the final service configuration item for P′i. Similarly, xjw follows the same interpretation. Wi and Wj represent the importance of touchpoints i and j, respectively, which are evaluated by all evaluators based on AHP. Additionally, there might be compatibility issues among candidate service configuration items for different touchpoints, and specific constraints should be added accordingly.
By solving the service configuration item optimization model, the optimal service configuration plan that maximizes the overall benefits of the service system was determined.

3. Case Validation

To achieve service symmetry in pandemic conditions, we engineered a dual-mode visitor ecosystem, harmonizing digital pre-screening tools with adaptive physical infrastructure, which balanced stakeholder needs (enterprise efficiency, user convenience, and public health compliance). The system has been in operation for several months at a Chinese company. The company attaches more importance to trade secrets, so the management of visitors is stricter. During this period, both visitors and relevant enterprise personnel have expressed dissatisfaction with the operation of the system, believing that there are problems such as inefficiency and chaotic management in the operation process of the system. To enhance the quality of the service system, the methods proposed in this paper were adopted to assess and reconfigure the failure touchpoints.

3.1. Identification of Failure Service Touchpoints

Service design experts reviewed all the touchpoints within the service system and identified 13 touchpoints, assigning unique identifiers to each. Additionally, they documented the corresponding service content and stakeholders for each touchpoint, as shown in Table 2. In this service system, visitors acted as users, while the service personnel consisted of various positions of enterprise employees responsible for providing services at different stages.
Various stakeholders were invited to participate in the study. Among the candidates who accepted the invitation, the users who had used the service system more times were preferentially selected to participate in the case study. In the end, 20 stakeholders who had participated in the service system multiple times were invited to be part of the current service system improvement project. All evaluation participants were informed and consented to this project. This group comprised two enterprise managers; four individuals each for the roles of visitors, approvers, and gatekeepers; and six visitors. A combination of offline interviews and online questionnaires was used to collect their opinions.
The two enterprise managers calculated the costs for each touchpoint based on the service system’s operational data. The costs for each touchpoint varied. For the application access stage, the costs mainly consisted of the development and maintenance expenses of the WeChat mini-program (P(S)1, P(S)2, P(M)6, P(S)3, P(S)4). The touchpoints associated with approvers primarily involved the labor costs of the approval personnel (P(M)7). The costs related to visitors entering and leaving the enterprise encompassed the labor costs of gatekeepers, expenses for developing and maintaining the access control system, as well as design and manufacturing costs for lobby signage in the office building (P(M)9, P(M)10, P(M)11, P(M)13). The costs during the visit stage mainly included dining expenses and other hospitality costs for visitors (P(M)12). The remaining touchpoints were considered to have zero costs (P(M)5, P(M)8). Subsequently, based on the actual situation of the enterprise and relevant market conditions, the enterprise managers provided the maximum tolerable costs and optimal costs for each touchpoint. The evaluation scores for each touchpoint were then calculated using Equation (1).
Considering the unique characteristics of the service system, a comprehensive evaluation indicator system was developed for both service personnel and users. The weights of the evaluation indicators were determined using Equations (2) and (5). For service personnel, the evaluation indicators included working hours, total number of services, number of services during peak hours, and service difficulty, with corresponding weights of 0.28, 0.19, 0.31, and 0.22, respectively. For users, the evaluation indicators comprised target achievement level, service speed, clarity, comfort, and convenience, with corresponding weights of 0.27, 0.24, 0.16, 0.15, and 0.18, respectively. The research participants first used semantic variables to assess the importance of each indicator and then evaluated the quality of the touchpoints related to themselves using semantic variables. Based on Equations (2)–(7), evaluation scores were obtained for each touchpoint.
To assess the reliability of the evaluation data, Kendall’s coefficient of concordance was separately computed for the three categories of service personnel and visitor assessment results. Kendall’s coefficient of concordance is a widely used measure of inter-rater reliability [37], with values closer to 1 indicating higher inter-rater reliability and more reliable assessment results. The data were analyzed using SPSS 22.0 software, and the results are presented in Table 3.
Based on the data presented in Table 3, the Kendall consistency coefficients of the four types of raters were high (all > 0.75) and had significant significance, indicating a high level of consistency and inter-rater reliability among the different evaluators, resulting in more reliable assessment outcomes.
Following this, all evaluators utilized the Analytic Hierarchy Process (AHP) to evaluate the importance of each touchpoint. The comprehensive scores for each touchpoint were subsequently computed using Equations (8) and (9). A focus group was held with the participation of multiple stakeholders and experts, according to which a common view was obtained with equal weight for each stakeholder; thus, in Equation (8), wsc = wsu = 1/2, and in Equation (9), wmc = wmf = wmu = 1/3. Finally, the overall assessment score for the service system was determined using Equation (11).
The evaluation results are summarized in Table 4, which includes the assessment scores assigned by stakeholders for each touchpoint, the total score for each touchpoint. The importance weight of each contact point was calculated according to Equations (2)–(5). The overall score for the service system was calculated according to Equation (11).
Following the established design objectives of the enterprise service system, evaluation thresholds were determined for both stakeholders’ ratings and the total scores of touchpoints, with both thresholds set to 0.70, i.e., S c min = S f min = S u min = S min = 0.70 . Consequently, the threshold for the overall score of the service system was set to 0.75. Using Equation (11), S o v e r a l l = 0.70 < S min o v e r a l l = 0.75 , the threshold values for Equation (12) were set to Wo = 0.10, So = 0.75. Based on the application of Equation (10), the identified failure touchpoints were determined to be P(M)6, P(M)7, P(M)4, P(M)9, P(M)10. Furthermore, employing Equation (12) led to the identification of P(S)2 as an additional failure touchpoint. In total, six failure points were recognized.

3.2. Generating Configuration Plans

Based on the order of failure touchpoints in the service system, they were renumbered and mapped as follows: P(S)2P′(S)1, P(S)4P′(S)2, P(M)6P′(M)3, P(M)7P′(M)4, P(M)9P′(M)5, P(M)10P′(M)6. Service designers analyzed the reasons for the failure points and proposed targeted new service configurations. Taking P′(S)1, the visitor information filling, as an example, its enterprise rating, user rating, and total score all exceeded the thresholds. However, due to its high importance and relatively low total score, it was identified as a failure point according to Equation (12). Therefore, new configurations should be proposed from the perspectives of both enterprise and user stakeholders. After further analysis, it was found that the cost of developing a new small program was high, so the main improvement should focus on the user’s perspective. Based on further user interviews, it was revealed that the main drawbacks of this touchpoint were the redundant visitor information required and a slightly chaotic interface, leading to a poor user experience. Accordingly, four new visitor information filling pages were redesigned as candidate configurations for this failure point. Table 5 lists the candidate service configurations for each failure point. Different combinations of these configurations led to the generation of several new service configuration plans.

3.3. Decision-Making for Optimal Service Configuration Plans

Stakeholders evaluated the candidate configuration options, and the cost of each option was provided by enterprise experts, along with the calculation of their evaluation scores. For the candidate configurations of P′(S)1 and P′(M)3, which involved small program interface designs, an experimental approach was adopted to assess the interface design proposals by visitors and interviewees. However, for the candidate configurations of other touchpoints, due to cost or experimental difficulty constraints, it was challenging to conduct experiments. Therefore, service designers evaluated these configurations following the methods proposed in Section 1. The evaluation scores for all candidate configurations exceeded the threshold. Specific evaluation scores are presented in Table 6.
Upon analysis, there were no mutually exclusive relationships among the candidate configurations of each failure point and between the candidate configurations and the effective touchpoints. Based on the service configuration optimization model, the Lingo 13.0 software was employed to obtain the optimal service configuration plan. The optimization model was a single-objective optimization model, and the objective function was strictly concave, so the optimization model had a unique solution. The selected configurations were D13, D21, D33, D43, D51, and D64, with an objective function value of 0.4724. Considering the effective touchpoints together, the predicted total score for the new service system was 0.82.
Following the configuration plan, the enterprise upgraded the service system. After running the new service system for several weeks, the same evaluation participants were invited to assess the new configured touchpoints, and the evaluation results are shown in Table 7.
Based on Table 7, it can be observed that the evaluation scores of each stakeholder for the newly configured touchpoints were higher than the threshold, indicating a comprehensive improvement over the previous failure points. A comparison between Table 7 and Table 6 reveals that the predicted scores were relatively close to the actual scores. The calculated overall evaluation score for the new service system was 0.81, indicating a significant improvement compared to the previous version. The experimental results demonstrate the feasibility and effectiveness of the proposed approach as presented in this paper.

4. Discussion

In this case, the importance of the three types of stakeholders was set as equal. However, in current service design research, users are mostly regarded as the most important stakeholders. In order to explore the influence of stakeholder importance on failure point identification and configuration item optimization, two groups of sensitivity analysis were carried out, respectively.
  • The influence of stakeholder opinion weight on failure point identification
Three sensitivity analysis experiments were carried out to increase the weight of user opinions and correspondingly reduce the weight of opinions from enterprises and service personnel. In the three groups of experiments, the user weights in Equations (8) and (9) were set to 0.5, 0.6, and 0.7, respectively, and the failure points were re-identified using the method in this paper. The results are shown in Table 8. According to the results in Table 8, the change in stakeholder weights had a minor influence on the total score of the service system and the failure point identification results. The main reason for this result was that, in this case, most of the failure points were identified based on Rule 1, which was independent of the weights of stakeholders.
  • The influence of stakeholder opinion weight on configuration scheme decision-making
Similarly, three sensitivity analysis experiments were carried out. In the three groups of experiments, the user weights in Equations (8) and (9) were set to 0.5, 0.6, and 0.7, respectively, and the preferred decision-making was conducted for the configuration items generated in Section 2.2 using the method in this paper. The results are shown in Table 9. According to Table 9, the change in stakeholder weights affected the selection of configuration items for failure points P′(S)2 and P′(M)4. Combining Table 6, it can be seen that when there was a large score difference among candidate configuration items from a certain type of stakeholders, this influence was relatively significant. In order to obtain the best configuration scheme, it was necessary to determine appropriate stakeholder weights according to the actual situation of the service system. For example, in service systems involving more service personnel, non-profit service systems provided by enterprises (such as the case in this paper), etc., attention should be paid to balancing the interests of different stakeholders. For profit-making service systems of enterprises, the importance of users should be higher so as to enhance user stickiness and attract more users, thus achieving good economic benefits and realizing a win–win situation for all stakeholders.
To verify the superiority of this method, the method proposed in [38] was used to conduct comparative experiments on the same case. The SERVUQAL-AHP-TOPSIS comprehensive evaluation method was established in [38] to evaluate the quality of the service system. SERVUQAL is a widely recognized service quality evaluation scale, which evaluates service design quality in five dimensions: Tangibility, Reliability, Responsiveness, Assurance, and Empathy. In this case, the evaluation object is still the service touchpoint listed in 2. In the approach proposed in [38], the assessment was performed by a single stakeholder. In this case, the service system was evaluated by 10 visitors according to the evaluation model. The evaluation results are shown in Table 10, where the full score of 1. 0.70 was still used as the threshold value.
As can be seen from Table 10, there were four failure contact points obtained by the method proposed in [New 3], which were P(M)7, P(S)4, P(M)9, and P(M)10. There were six failure contact points identified by this method, which were P(M)6, P(M)7, P(S)4, P(M)9, and P(M)10 and P(S)2. The comparison results show that the failure contact points identified by the two methods coincided, but more failure points were identified by this method. The reason for this is that the views of other stakeholders were not taken into account. According to this result, the design of failure points was improved. Obviously, the optimization scheme obtained by this method will be more conducive to the overall quality improvement of the service system.
There are still some deficiencies in this study. Firstly, to ensure the universality, the method was simplified in some respects. For example, only three key stakeholders were considered. However, regulators, competitors, and third-party service providers can also be important in the real world. The framework provided by this approach is extensible and should take into account a wider range of stakeholders in different application areas. The method adopts the single-objective optimization model, which is also a simplification of the real problem. In the service system improvement problem, more goals, such as shorter project completion time and lower economic cost, can also be optimization goals. In this case, the multi-objective optimization model is closer to the reality. Secondly, the evaluations of stakeholders were mostly subjective with low objectivity. Finally, this approach did not take into account the time factor, but the quality of the service system and the opinions of stakeholders were constantly changing over time. In future research, these issues will be addressed emphatically.

5. Conclusions

Based on the stakeholder-centered service design concept, this paper proposed a method for identifying and re-configuring failure points in service systems aimed at improving the overall interests of the service system, that is, enhancing the total interests of all stakeholders. Through the evaluation of the service system by three types of stakeholders, namely enterprises, service personnel, and users, failure points were identified and re-configured. The effectiveness of the method was demonstrated through a case study. Compared with most existing service design research, which has mainly focused on users, this paper comprehensively considered important participants in the service system, which is more in line with the characteristics of service design and is a useful complement to existing research ideas.
For the identification and enhancement of heavy failure contact points in service systems, rapidly evolving AI technology may have an important impact on this field. AI technology can not only improve the efficiency and accuracy of identification but also help to real-time monitoring of service processes, optimize service processes, and promote the development of personalized services. Together, these impacts drive improved service quality and increased customer satisfaction.
This framework is adaptable to diverse service contexts, from health care to smart manufacturing, where stakeholder symmetry is critical. In the future, the generality of the present approach will be tested in different areas.

Author Contributions

Conceptualization, Z.L. and S.Y.; methodology, Z.L.; validation, Z.L., W.D. and F.C.; formal analysis, W.D.; investigation, F.C.; resources, Z.L.; data curation, Z.L. and F.C.; writing—original draft preparation, Z.L. and S.Y.; writing—review and editing, Z.L. and W.D.; visualization, F.C.; supervision, S.Y.; funding acquisition, Z.L. All authors have read and agreed to the published version of the manuscript.

Funding

This work was supported by the Tianjin Art Science Planning Project (B24024).

Data Availability Statement

The original contributions presented in this study are included in the article. Further inquiries can be directed to the corresponding authors.

Conflicts of Interest

The authors declare no conflicts of interest.

References

  1. Song, W.; Cao, J. A rough DEMATEL-based approach for evaluating interaction between requirements of product-service system. Comput. Ind. Eng. 2017, 110, 353–363. [Google Scholar]
  2. Lin, C.J.; Cheng, L.Y. Product attributes and user experience design: How to convey product information through user-centered service. J. Intell. Manuf. 2015, 28, 1743–1754. [Google Scholar]
  3. Yee, R.W.Y.; Yeung, A.C.L.; Cheng, T.C.E. The impact of employee satisfaction on quality and profitability in high-contact service industries. J. Oper. Manag. 2008, 26, 651–668. [Google Scholar] [CrossRef]
  4. Ojiako, U.; Chipulu, M.; Graesser, A. Correlating service touch-point preferences with engagement parameters. Ind. Manag. Data Syst. 2012, 112, 766–785. [Google Scholar] [CrossRef]
  5. Dadfar, H.; Brege, S. Differentiation by improving quality of services at the last touch point. Int. J. Qual. Serv. Sci. 2012, 4, 345–363. [Google Scholar]
  6. Wei, T.; Shi, Y. A service failure assessment model for smart product consumption experience based on customer perception. Sci. Rep. 2024, 14, 23097. [Google Scholar]
  7. Moosavi, S.; Ismail, A.; Yuen, C.W. Using simulation model as a tool for analyzing bus service reliability and implementing improvement strategies. PLoS ONE 2020, 15, e0232799. [Google Scholar]
  8. Yu, H.; Sun, X.; Solvang, W.D.; Laporte, G. Solving a Real-World Urban Postal Service System Redesign Problem. Sci. Program. 2021, 2021, 3058472. [Google Scholar] [CrossRef]
  9. Ozuem, W.; Ranfagni, S.; Willis, M.; Salvietti, G.; Howell, K. Exploring the relationship between chatbots, service failure recovery and customer loyalty: A frustration–aggression perspective. Psychol. Mark. 2024, 41, 2253–2273. [Google Scholar]
  10. Wang, B.; Li, Y.; Luo, Y.; Li, X.; Freiheit, T. Early event detection in a deep-learning driven quality prediction model for ultrasonic welding. J. Manuf. Syst. 2021, 60, 325–336. [Google Scholar] [CrossRef]
  11. Li, Z.; Kristoffersen, E.; Li, J. Deep transfer learning for failure prediction across failure types. Comput. Ind. Eng. 2022, 172, 108521. [Google Scholar]
  12. Wang, X.; Yang, D.; Zha, L.; Liao, B. Enhancing Income as a Starting Point for Designing Sustainable Health Product-Service Systems for Chronically Ill Elderly in Rural Areas. Sustainability 2023, 15, 14404. [Google Scholar] [CrossRef]
  13. Chen, J.; Li, Z.; Wang, W.; Wang, Y.; He, Z. Research on a Service Touchpoint Design Model Driven by Smart Technology Based on Kano–Failure Modes and Effects Analysis. Sensors 2024, 24, 7854. [Google Scholar] [CrossRef] [PubMed]
  14. Wang, W.; Song, J.; Chen, J.; Wang, Y.; Yang, Y.; Liao, K. Failure analysis method in the service design user touchpoint reconstruction process. Comput. Integr. Manuf. Syst. 2022, 28, 1524–1536. [Google Scholar]
  15. Yu, G.D.; Yang, Y.; Liu, A.J. Joint optimization of complex product variant design responding to customer requirement changes. J. Intell. Fuzzy Syst. 2015, 30, 397–408. [Google Scholar]
  16. Naude, K.; Andrew, N.E.; Srikanth, V.; Parker, E.; Marsh, L.; Beare, R.; McNaney, R.; Snowdon, D.A. Using a multi-stakeholder co-design process to develop a health service organisation-wide patient reported outcome measure collection system. Qual. Life Res. 2024, 33, 619–636. [Google Scholar] [PubMed]
  17. Collins, M.; Higgs, P. Improving suicide awareness in rural service providers: Some considerations arising from stakeholder consultations. Aust. J. Rural Health 2021, 29, 999–1001. [Google Scholar]
  18. Krucken, L.; Meroni, A. Building stakeholder networks to develop and deliver product-service-systems: Practical experiences on elaborating pro-active materials for communication. J. Clean. Prod. 2006, 14, 1502–1508. [Google Scholar]
  19. Jaakkola, E.; Alexander, M. The Role of Customer Engagement Behavior in Value Co-Creation: A Service System Perspective. J. Serv. Res. 2014, 17, 247–261. [Google Scholar] [CrossRef]
  20. Touloum, K.; Idoughi, D.; Seffah, A. User Experience in Service Design: A Case Study from Algeria. It Prof. 2017, 19, 56–58. [Google Scholar]
  21. Demartini, M.; Ferrari, M.; Govindan, K.; Tonelli, F. The transition to electric vehicles and a net zero economy: A model based on circular economy, stakeholder theory, and system thinking approach. J. Clean. Prod. 2023, 410, 137031. [Google Scholar] [CrossRef]
  22. O’Sullivan, B.G.; Giddings, P.; Mcgrail, M.R. Perceived stakeholder benefits of continuously training general practitioners in the same rural or remote practice: Interviews exploring the Remote Vocational Training Scheme. Med. J. Aust. 2024, 221, S29–S34. [Google Scholar] [CrossRef]
  23. Clatworthy, S. Service innovation through touch-points: Development of an innovation toolkit for the first stages of new service development. J. Exerc. Sci. Physiother. 2011, 5, 15–28. [Google Scholar]
  24. Daoud, H.; Sellami, I.; Ben Chabene, C.; Haddar, A.; Ghrab, M.A.; Hammami, K.J.; Hajjaji, M.; Masmoudi, M.L. Assessment of job satisfaction and work ability in a confectionery factory: A Cross-Sectional Study. Eur. Psychiatry 2024, 67 (Suppl. S1), S596. [Google Scholar] [CrossRef]
  25. Atefi, N.; Lim Abdullah, K.; Wong, L.P.; Mazlom, R. Factors influencing job satisfaction among registered nurses: A questionnaire survey in Mashhad, Iran. J. Nurs. Manag. 2015, 23, 448–458. [Google Scholar] [CrossRef]
  26. Akintola, O.; Chikoko, G. Factors influencing motivation and job satisfaction among supervisors of community health workers in marginalized communities in South Africa. Hum. Resour. Health 2016, 14, 54. [Google Scholar] [CrossRef] [PubMed]
  27. Chen, P.; Sparrow, P.; Cooper, C. The relationship between person-organization fit and job satisfaction. J. Manag. Psychol. 2016, 31, 946–959. [Google Scholar] [CrossRef]
  28. Tadese, T.; Mohamed, A.; Mengistie, A. Assessment of factors influencing job satisfaction among health care providers, federal police referral hospital, Addis Ababa, Ethiopia. Ethiop. J. Health Dev. 2015, 29, 119–126. [Google Scholar]
  29. Ami, M.A.; Abou-Ashour, M.A.; Al-Shanwany, S. Measuring user’s satisfaction for open aggregate spaces within malls in Egypt. NeuroQuantology 2023, 21, 638–656. [Google Scholar]
  30. Fu, Y.; Wang, J.; Lu, L.; Tang, Q.; Zhang, S. Reputation-based joint optimization of user satisfaction and resource utilization in a computing force network. Front. Inf. Technol. Electron. Eng. 2024, 25, 685–700. [Google Scholar] [CrossRef]
  31. Mao, H.F.; Chen, W.Y.; Yao, G.; Huang, S.L.; Lin, C.; Huang, W.N.W. Cross-cultural adaptation and validation of the Quebec User Evaluation of Satisfaction with Assistive Technology (QUEST 2.0): The development of the Taiwanese version. Clin. Rehabil. 2010, 24, 412–421. [Google Scholar] [CrossRef]
  32. Gil-Gómez, J.-A.; Manzano-Hernández, P.; Albiol-Pérez, S.; Aula-Valero, C.; Gil-Gómez, H.; Lozano-Quilis, J.A. USEQ: A Short Questionnaire for Satisfaction Evaluation of Virtual Rehabilitation Systems. Sensors 2017, 17, 1589. [Google Scholar] [CrossRef]
  33. Du, Y.; Liu, D.; Morente-Molinera, J.A.; Herrera-Viedma, E. A data-driven method for user satisfaction evaluation of smart and connected products. Expert Syst. Appl. 2022, 210, 118392. [Google Scholar]
  34. Dong, J.; Wan, S. A new method for multi-attribute group decision making with triangular intuitionistic fuzzy numbers. Kybernetes 2016, 45, 158–180. [Google Scholar] [CrossRef]
  35. Violante, M.G.; Vezzetti, E. Virtual interactive e-learning application: An evaluation of the student satisfaction. Comput. Appl. Eng. Educ. 2015, 23, 72–91. [Google Scholar] [CrossRef]
  36. Fan, J.; Yu, S.; Chu, J.; Chen, D.; Yu, M.; Wu, T.; Chen, J.; Cheng, F.; Zhao, C. Research on multi-objective decision-making under cloud platform based on quality function deployment and uncertain linguistic variables. Adv. Eng. Inform. 2019, 42, 100932.1–100932.16. [Google Scholar] [CrossRef]
  37. Franceschini, F.; Maisano, D. Aggregating multiple ordinal rankings in engineering design: The best model according to the Kendall’s coefficient of concordance. Res. Eng. Des. 2021, 32, 91–103. [Google Scholar] [CrossRef]
  38. Ma, P.; Yao, N.; Yang, X. Service Quality Evaluation of Terminal Express Delivery Based on an Integrated SERV-QUAL-AHP-TOPSIS Approach. Math. Probl. Eng. 2021, 2021, 8883370. [Google Scholar] [CrossRef]
Figure 1. The framework for failure touchpoint identification and reconfiguration.
Symmetry 17 00485 g001
Figure 2. Evaluation indicator system for service touchpoints.
Symmetry 17 00485 g002
Table 1. Conversion relationship between semantic evaluation variables and triangular fuzzy numbers.
Semantic Evaluation VariablesVery ImportantImportantModerateUnimportantVery Unimportant
Triangular Fuzzy Numbers(0.7, 1, 1)(0.5, 0.7, 0.9)(0.3, 0.5, 0.7)(0, 0.3, 0.5)(0, 0, 0.3)
Table 2. Summary of service touchpoints.
Service StageTouchpoint IDService TouchpointService ContentStakeholders
Preparing for VisitP(M)5Confirming the visit requirementsInforming the visitors about the visit application processEnterprise, Visitors, Interviewees
Apply for VisitP(S)1Mini-program registrationMini-program registration interfaceEnterprise, Visitors
P(S)2Fill in visitor informationVisitor Information Entry InterfaceEnterprise, Visitors
P(M)6Entry of Interviewee InformationEntry of Interviewee Information InterfaceEnterprise, Visitors, Interviewees
P(S)3Filling COVID-19 InformationCOVID-19 Related Information FormEnterprise, Visitors
Approval for VisitP(M)7ApprovalApproval personnel review the visit applicationEnterprise, Visitors, Approvers
P(S)4Notification of approval resultNotification to the visitor of the approval resultEnterprise, Visitors
Arrival at the companyP(M)8Proceed to visitAssist visitors in planning their itinerary and routeEnterprise, Visitors, Interviewees
P(M)9Enter the company premisesEnter the company premises through the access control systemEnterprise, Visitors, Security guards
P(M)10Information registrationRecording visitor informationEnterprise, Visitors, Security guards
P(M)11Waiting for the person to be visitedGuiding the visitor to the rest area to waitEnterprise, Visitors, Security guards
visitingP(M)12Receiving the visitorEscorting the visitor to the relevant departmentEnterprise, Visitors, Interviewees
endingP(M)13DepartureThe host escorts the visitor to leave the companyEnterprise, Visitors, Interviewees
Table 3. Inter-rater reliability test.
ScorersKendall’s Coefficient of Concordancep
Interviewees0.796<0.001
Approvers0.875<0.001
Security guards0.824<0.001
Visitors0.759<0.001
Table 4. Evaluation results.
Touchpoint (Pi)Enterprise Rating (Sic)Service Personnel
Rating (Sif)
User Rating (Siu)Total Score of Touchpoints (Si)Importance Weight of Touchpoints (Wi)Total Score of Service System (Si)
P(M)510.790.880.890.020.70
P(S)10.72-0.750.740.04
P(S)20.72-0.770.750.11
P(M)60.720.640.860.740.09
P(S)30.72-0.880.800.13
P(M)70.810.530.430.590.08
P(S)40.82-0.380.600.11
P(M)810.760.800.850.03
P(M)90.580.660.490.580.05
P(M)100.760.440.540.510.13
P(M)110.760.850.710.770.06
P(M)120.740.780.920.810.13
P(M)1310.900.810.900.02
Table 5. Candidate service configuration options for failure points.
Evaluation Results’ Failure PointCandidate Configuration Options
P′(S)1D11: Visitor Information Entry Interface Option 1D12: Visitor Information Entry Interface Option 2D13: Visitor Information Entry Interface Option 3D14: Visitor Information Entry Interface Option 4
P′(S)2D21: Enterprise WeChat NotificationD22: SMS NotificationD23: SMS and WeChat NotificationD24: Phone Call Notification
P′(S)3D31: Visited Person Information Entry Interface Scheme 1D22: Visited Person Information Entry Interface Scheme 2D33: Visited Person Information Entry Interface Scheme 3
P′(S)4D41: 2 approvers, approval cycle within 1 h.D42: 2 approvers, approval cycle within 0.5 h.D43: 3 approvers, approval cycle within 1 h.D44: 3 approvers, approval cycle within 0.5 h.
P′(S)5D51: Access control system upgrade plan 1D52: Access control system upgrade plan 2
P′(S)6D61: 2 security guards, information registration form Scheme 1.D62: 2 security guards, information registration form Scheme 2.D63: 3 security guards, information registration form Scheme 1.D64: 3 security guards, information registration form Scheme 2.
Table 6. Evaluation results of candidate service configuration options.
Failure Point (P′i)Configuration Item (Di)Enterprise Score (Sic)Service Personnel Score (Sif)User Score (Siu)Total Score (Si)
P′(S)1D110.72-0.750.74
D120.72-0.810.77
D130.72-0.860.79
D140.72-0.790.76
P′(S)2D211-0.750.88
D220.86-0.870.87
D230.77-0.920.85
D240.73-0.860.80
P′(M)3D310.720.740.760.74
D320.720.820.800.78
D330.720.790.870.79
P′(M)4D410.760.780.890.81
D420.760.740.940.81
D430.710.920.890.84
D440.710.870.940.84
P′(M)5D510.750.910.880.85
D520.700.840.850.80
P′(M)6D610.760.720.750.74
D620.760.790.870.81
D630.710.780.820.77
D640.710.860.910.83
Table 7. Actual ratings of new configured touchpoints.
Touchpoint (Pi)Enterprise Rating (Sic)Service Personnel Rating (Sif)User Rating (Siu)Total Score (Si)
P(S)20.72-0.830.78
P(S)41-0.740.87
P(M)60.720.850.890.82
P(M)70.710.840.820.79
P(M)90.720.760.810.76
P(M)100.710.860.830.80
Table 8. User importance sensitivity analysis experiment 1.
Weight ValueService System Total ScoreFailure Point
Original weight0.70P(S)2, P(S)4, P(M)6, P(M)7, P(M)9, P(M)10
wsu = wmu = 0.5, wsc = 0.5, wmc = wmf = 0.250.71P(S)2, P(S)4, P(M)6, P(M)7, P(M)9, P(M)10
wsu = wmu = 0.6, wsc = 0.4, wmc = wmf = 0.20.71P(S)4, P(M)6, P(M)7, P(M)9, P(M)10
wsu = wmu = 0.7, wsc = 0.3, wmc = wmf = 0.150.71P(S)4, P(M)6, P(M)7, P(M)9, P(M)10
Table 9. User importance sensitivity analysis experiment 2.
Weight ValueConfiguration Item Selection ResultsObjective Function Value
Original weightD13, D21, D33, D43, D51, D640.4724
wsu = wmu = 0.5, wsc = 0.5, wmc = wmf = 0.25D13, D21, D33, D44, D51, D640.4797
wsu = wmu = 0.6, wsc = 0.4, wmc = wmf = 0.2D13, D22, D33, D44, D51, D640.4827
wsu = wmu = 0.7, wsc = 0.3, wmc = wmf = 0.15D13, D23, D33, D44, D51, D640.4912
Table 10. Evaluation results based on two methods.
TouchpointEvaluation Score Base on [38]
P(M)50.86
P(S)10.80
P(S)20.72
P(M)60.86
P(S)30.80
P(M)70.63
P(S)40.48
P(M)80.76
P(M)90.62
P(M)100.68
P(M)110.76
P(M)120.88
P(M)130.84
Disclaimer/Publisher’s Note: The statements, opinions and data contained in all publications are solely those of the individual author(s) and contributor(s) and not of MDPI and/or the editor(s). MDPI and/or the editor(s) disclaim responsibility for any injury to people or property resulting from any ideas, methods, instructions or products referred to in the content.

