Abstract
The power system’s dynamic frequency stability is affected by common-mode ultra-low-frequency oscillation and differential-mode low-frequency oscillation. Traditional frequency control based on generators is facing the problem of capacity reduction. It is urgent to explore new regulation resources such as photovoltaics. To address this issue, this paper proposes a distributed active support method based on photovoltaic systems via state–disturbance observation and dynamic surface consensus control. A three-layer distributed control framework is constructed to suppress low-frequency oscillations and ultra-low-frequency oscillations. To solve the high-order problem of the regional grid model and to obtain its unmeasurable variables, a regional observer estimating both system states and external disturbances is designed. Furthermore, a distributed dynamic frequency stability control method is proposed for wide-area photovoltaic clusters based on the dynamic surface control theory. In addition, the stability of the proposed distributed active support method has been proven. Moreover, a parameter tuning algorithm is proposed based on improved chaos game theory. Finally, simulation results demonstrate that, even under a 0–2.5 s time-varying communication delay, the proposed method can restrict the frequency deviation and the inter-area frequency difference index to 0.17 Hz and 0.014, respectively. Moreover, under weak communication conditions, the controller can also maintain dynamic frequency stability. Compared with centralized control and decentralized control, the proposed method reduces the frequency deviation by 26.1% and 17.1%, respectively, and shortens the settling time by 76.3% and 42.9%, respectively. The proposed method can effectively maintain dynamic frequency stability using photovoltaics, demonstrating excellent application potential in renewable-rich power systems.
1. Introduction
In renewable-rich power systems, dynamic frequency stability is increasingly threatened by common-mode ultra-low-frequency oscillation (ULFO) and differential-mode low-frequency oscillations (LFOs) under source–load asymmetry disturbances [1]. In 2005, inter-area LFOs accompanied by a ULFO (0.015 Hz) occurred in the European power grid, leading to the loss of synchronization of multiple synchronous units, large-scale power outages and economic losses. In 2020, a 0.5 Hz LFO with a 0.02 Hz ULFO were observed in the UK power grid, leading to grid frequency deviation that exceeded ±0.2 Hz.
Currently, LFO control primarily relies on additional damping control, such as power system stabilizers (PSSs). However, their effective bandwidth spans only 0.1–2.5 Hz, and ULFOs remain beyond their reach [2,3]. ULFOs are typically mitigated via long-term power regulation (e.g., GPSS). However, GPSS’s response speed is too slow to match the rapid dynamics of LFOs [4,5]. Moreover, related studies suggest that ULFO and LFO are in fact coupled [6]. Ultra-low-frequency power swings can excite LFO modes, whose fast dynamics in turn disturb ULFO control [7]. In 2021, though ULFOs at the Hami PV plant in Xinjiang were successfully controlled, the 0.8 Hz LFO persisted and drove the frequency deviation beyond ±0.2 Hz. Therefore, coordinated control of both ULFO and LFO is essential, and single-band methods alone cannot solve the problem.
In power systems increasingly dominated by new energy, the decreasing proportion of synchronous machines has led to a rapid deterioration in system regulation capabilities [8,9]. Now photovoltaic (PV) systems, as the leading new energy source, offer millisecond-level power regulation (<100 ms). Thus, PV systems can rapidly inject or absorb power during grid disturbances, providing advantages in suppressing ULFO and LFO. In addition, the China National Energy Administration’s Notice [10] requires centralized PV systems to feature enhanced frequency regulation and real-time operational data reporting. Therefore, a critical technical challenge is how to leverage the active and rapid power support capabilities of PV clusters for dynamic frequency stability.
Currently, there are three main methods for dynamic frequency stability control: centralized, decentralized, and distributed control. Centralized control centralizes decision-making in a single controller to achieve global optimization. Ref. [11] proposed a VSC-HVDC frequency control method by centrally regulating the output of VSC-HVDC. Ref. [12] designed a centralized H∞ controller to suppress ULFO and LFO in hydro–solar complementary systems. Ref. [13] proposes a centralized model predictive controller for frequency stability in microgrids. However, the inherent defects of centralized control are particularly prominent in high-proportion PV power systems: ① A central controller failure will cripple the network’s oscillation suppression, and the large-scale PV plants will further amplify the fault impact. ② Centralized control relies on wide-area communication networks. Since PV plants are widely distributed and numerous, any large communication delay can significantly reduce the control performance. ③ The need for centralized controllers to process real-time status from all grid PV units creates a computational burden that grows exponentially with installed capacity (from GW to TW). This makes real-time control infeasible.
Decentralized control operates by dividing system into multiple locally communicating subsystems, thereby removing reliance on global communication. Ref. [14] proposes decentralized event-triggered load frequency control to address excessive communication burden associated with centralized control. Ref. [15] proposes a decentralized load frequency control based on the differential evolution algorithm for multi-region systems. Despite this advantage, decentralized control still struggles to utilize PV systems to suppress ULFO/LFO: ① Relying solely on local data, photovoltaic controllers struggle to identify and suppress inter-area LFOs. ② Without effective communication and coordination, controllers may conflict and amplify oscillations.
Distributed control can significantly enhance system flexibility and adaptability by assigning tasks to multiple computing nodes that communicate. Addressing those challenges, ref. [16] introduces a leader–follower distributed control strategy for faster voltage control response. Ref. [17] proposes a sliding mode control-based adaptive algorithm for PV primary frequency regulation. However, distributed frequency control still has shortcomings: (1) It focuses on suppressing a single oscillation type without addressing ULFO and LFO concurrently. (2) It requires high-quality communication. (3) It lacks specific applications designed for large-scale PV clusters to provide effective active frequency support.
To address these challenges, this paper proposes a distributed active frequency support method based on photovoltaic systems. A three-layer distributed control framework is constructed to suppress LFOs and ULFOs. To solve the high-order problem of regional grid and to obtain its unmeasurable variables, a regional observer estimating both system states and external disturbances is designed. Furthermore, a distributed dynamic frequency stability control method is proposed for wide-area PV clusters based on the dynamic surface control theory. In addition, the stability of the proposed distributed active support method has been proven. Moreover, a parameter tuning algorithm is proposed based on improved chaos game theory. Finally, simulation results demonstrate that the proposed method can effectively maintain dynamic frequency stability using photovoltaics, demonstrating excellent application potential in renewable-rich power systems.
Main contributions of this paper include the following: ① This paper proposes a regional observer with dual observation for state and disturbance variables. This approach effectively tackles key challenges in wide-area power system with large-scale PVs, including high model order, multiplicity of elements, and the presence of unmeasurable variables.
② To date, the PV-based approach has not yet been established for dynamic frequency stability control in multi-area power systems. We propose a distributed dynamic frequency stability control method for wide-area photovoltaic clusters, which effectively leverages photovoltaics to maintain system frequency stability with high performance.
③ Existing distributed frequency control strategies struggle to simultaneously suppress LFO and ULFO and rely heavily on communication. This paper proposes a new distributed PV frequency control approach by integrating the multi-agent consensus algorithm (MAC) and dynamic surface control (DSC), which can effectively suppress both oscillations even with weak communications and large delays.
④ In contrast to existing control methods for which parameter tuning often relies on ad hoc trial and error, we not only prove the stability of the proposed method but also propose a parameter tuning algorithm based on chaos game optimization (CGO).
2. Cloud Control Architecture for Dynamic Frequency Active Support of Wide-Area Photovoltaic Clusters
2.1. Cloud-Based Control Architecture for Dynamic Frequency Active Support of Wide-Area Photovoltaic Clusters
- (1)
- Photovoltaic Participation in Frequency Regulation Structure and Dynamic Frequency Stability Issues
The structure of photovoltaic participation in power system frequency regulation is shown in Figure 1. When a power deficit occurs in the power system, the frequency of the center of inertia (CoI) of region i, calculated using synchronous phasor measurement units (PMUs), will experience a deviation. Based on the WAMS system, the photovoltaic cluster detects and rapidly adjusts the photovoltaic output power through active frequency droop control at each power station, achieving a rapid response to the frequency deviation and thereby accelerating the power system frequency recovery process.
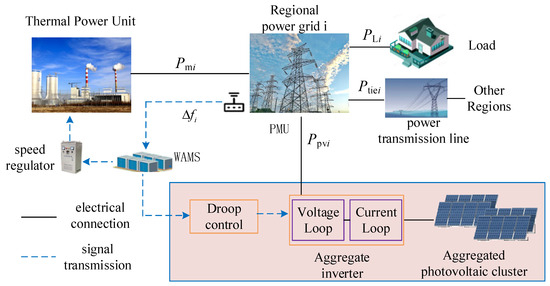
Figure 1.
Primary frequency regulation process of PV in i-th regional power system.
The above process primarily addresses single-frequency tuning issues and does not consider frequency oscillation issues. Taking a typical two-region interconnected system as an example, the simulation results are shown in Figure 2. When power disturbances occur in the region, the system’s frequency response exhibits significant common-mode ultra-low-frequency and differential-mode low-frequency oscillations, threatening the system’s frequency stability. Therefore, this paper focuses on the issue of dynamic frequency stability and, based on a photovoltaic-participating system frequency regulation structure, further investigates a distributed dynamic frequency stability active support control method for a wide-area photovoltaic cluster.
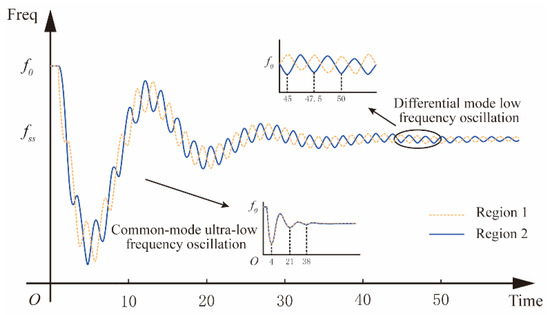
Figure 2.
Common-mode ULFO and differential-mode LFO in power systems.
- (2)
- Cloud control architecture actively supported by a wide-area photovoltaic cluster
Based on the similarity of frequency changes at various nodes in the power system and the geographical interconnection structure, large power grids can typically be divided into multiple interconnected regional systems. The dynamic frequency active support cloud control architecture for PV clusters in wide-area power systems consists of three layers: terminal, edge, and cooperative control layers, as shown in Figure 3. The relationships among the three layers in each area are as follows.
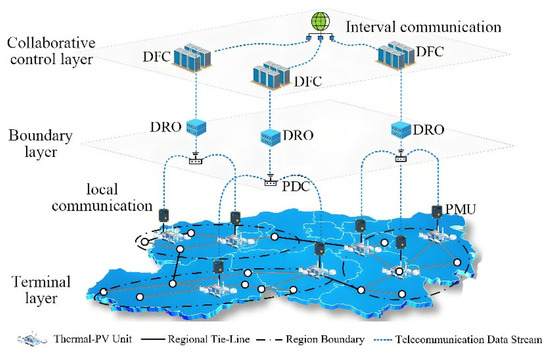
Figure 3.
Three-layer framework for distributed frequency stability control.
In terms of the control hierarchy architecture, each area consists of a terminal layer, an edge layer, and a collaborative control layer. The control relationships among the three layers in each area are as follows:
At the terminal layer, each region uses PMUs to measure regional frequency deviations and tie-line power deviations, which are transmitted to the regional phasor data concentrator (PDC) at the edge layer.
At the edge layer, the DRO utilizes the data collected by the PDC from various measurement points to calculate the CoI frequency of the region as input, and outputs the state variables and disturbance variables of the frequency response model for photovoltaic participation in frequency regulation. The observation results are then transmitted to the regional controller.
At the collaborative control layer, the distributed frequency controller (DFC) exchanges frequency information with other regional DFCs via WAMS, and comprehensively considers the state variables and disturbance variables provided by the DROs of each region to formulate control signals through multi-region collaboration. The control signals are then transmitted in reverse through the edge layer to the inverter control chips of photovoltaic power plants at the terminal layer, dynamically adjusting photovoltaic output to suppress frequency oscillations and enhance system frequency dynamic stability.
2.2. Fundamental Model for Dynamic Frequency Active Support
- (1)
- Physical system model
This subsection focuses on PV clusters and establishes their system frequency response (SFR) model for participation in power system frequency regulation. The voltage control and current control modules of the PV cluster are aggregated and modeled as first-order inertial elements, represented by the time constants and [18], respectively. Considering the time delay in acquiring the aggregated CoI frequency for region i, this delay is modeled as a first-order inertial element with an equivalent time constant [19]. Given that the mechanical power change of thermal power units is relatively slow and of small magnitude, it can be collectively treated as an external disturbance along with tie-line power deviation and load power deviation . denotes the equivalent inertia of region i, and represents its equivalent damping. The equivalent inertia synthesizes the virtual inertia from the rapid power regulation of PV units and the mechanical inertia of conventional thermal units. The equivalent damping integrates the active damping provided by the PV droop control and the natural damping characteristics of thermal units. The overall inertial response and damping effect of the area against frequency disturbances are ultimately characterized by the transfer function . Based on this modeling framework, the SFR model for region i is illustrated in Figure 4.
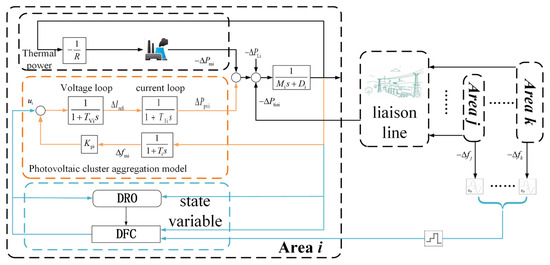
Figure 4.
Frequency response model of PV systems participating in frequency regulation in regional power systems.
In Figure 4, the SFR model of photovoltaic clusters participating in power system frequency regulation can be established as the state space equation shown in Equation (1):
where is the aggregated frequency deviation accounting for the CoI frequency. is the aggregated frequency deviation that accounts for the inter-area communication delay. , , and are the aggregated CoI frequency deviation, the aggregated change in PV output active power, and the aggregated current reference value for region i, respectively. is the equivalent droop coefficient of the PV cluster in region i. is the aggregated value of the control inputs from all PV plants within region i, where and are the capacities of PV plant j and region i, respectively.
The dependency relationships among the state variables in Equation (1) are complex, which is inconvenient for control design. Therefore, a linear transformation operator, Equation (2), is employed to convert Equation (1) into the strict-feedback system described by Equation (3). It can be observed that Equation (3) exhibits a cascaded form, where the dynamics of each state variable depend only on the state variables themselves and external inputs, thereby facilitating control design.
where , , .
The error in the dynamic equation of the state variable is further modeled. Compared to the actual frequency, the regional frequency deviation (i.e., ) inevitably exhibits an error . The disturbance variable, incorporating this error, is defined as: Consequently, Equation (3) can be modified as:
- (2)
- Information Communication Model
In the control framework of this paper, there are mainly two types of time delays in the information system: regional delay and inter-region delay.
Regional delay corresponds to the delay in frequency measurement by PMUi in region i and its transmission to DROi and DFCi, which includes PMU measurement, PMU-to-PDC signal transmission, DRO model calculation, and DRO-to-DFC signal transmission.
The regional delay encompasses the time delay in frequency measurement by PMUi in region i and its subsequent transmission to PDCi, DROi and DFCi, and the calculation time of DRO. Since this delay occurs between PMUs and DFCs within the same region, it is typically small and is therefore ignored in this paper.
The inter-region delay refers to the delay produced during the transmission of the frequency signal Δfj from PMUj to DFCj in Region j and then onward to DFCi in Region i, as illustrated in Figure 5. It shows the inter-region delay is primarily influenced by the longer communication delays between DFCs, making it a significant and non-negligible factor.
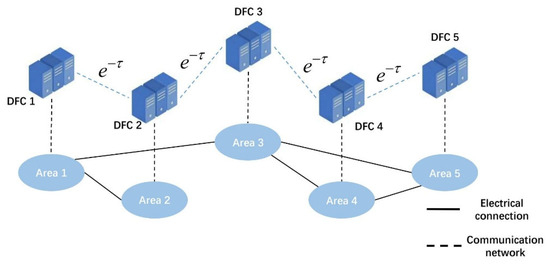
Figure 5.
Communication Structure of distributed frequency stability control system.
The inter-region delay is modeled as follows. Differences in signal delays across different regions can make it difficult for the DFC to perform unified calculations. Therefore, a signal holder is used to retain the signal at time k, ensuring that all necessary regional signals are received before commencing calculations, so that inter-region delay can be modeled as an interval delay with an upper bound, i.e., .
Figure 6 takes DFC4 as an example and specifically demonstrates the synchronization mechanism of the signal holder. At time k, DFC4 caches the input signals from each region via the signal holder until all associated signals arrive. The final delay is determined by the transmission time of the latest arriving signal, thereby eliminating the impact of delay differences.
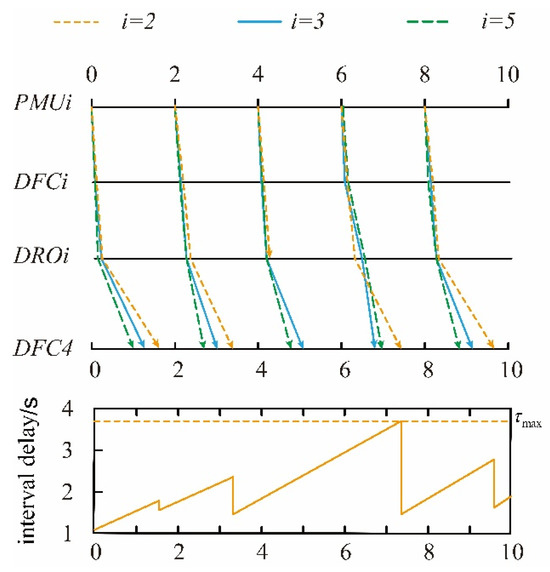
Figure 6.
Transmission process of the inter-region signal and the corresponding inter-region delay.
3. Dual Observer for State and Disturbance
The problem of photovoltaic participation in power system frequency control involves the coupled dynamics of photovoltaic and thermal power units. Direct controller design suffers from issues such as multiple elements, high order, and unmeasurable variables. Therefore, this paper focuses on the photovoltaic entities participating in frequency control and uses an observer to construct a frequency response model for photovoltaic participation in frequency control.
Regarding the variables in Equation (1), the regional frequency deviation signal obtained from WAMS calculations is known, and the PV output power can be obtained from its own power measurement devices. However, the aggregated values , , and from each region are difficult to measure, resulting in the inability to directly measure , , , , , and in Equation (4). Therefore, this section proposes a distributed regional observer (DRO) with dual observation functions for state and disturbance based on the input decoupling approach [20].
The state-space model corresponding to Equation (4) is:
where , , , , .
The dynamic equation of the DRO for the system in (5) is:
where and are auxiliary variables for the state observation and disturbance observation , respectively. denotes the observed value of state . represents the observed value of disturbance . Matrices , , , and are parameters to be designed for the state observer. is the parameter to be designed for the disturbance observer.
The observed state and observed disturbance in the actual system can be obtained based on the dynamic model of these auxiliary variables. In the designed DRO, they exhibit the following relationship:
Based on Equations (6) and (7), the structure of the DRO designed in this paper can be obtained, as shown in Figure 7. The observer uses the input of the original system, i.e., the control signal , and the output of the original system , i.e., the regional frequency deviation signal , as the input of the observer, and outputs the unknown state variables and disturbance quantity observation values and .
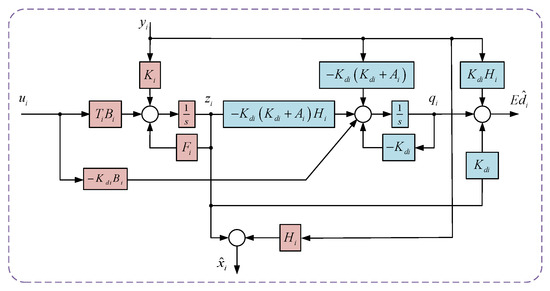
Figure 7.
DRO block diagram structure.
Substituting the observed results from Equation (7) into Equation (4) yields the observed values , , , , and , and the observed error is:
Here , and are the observation errors of , and , respectively, and .
Observation errors are significantly affected by relevant parameters, and parameters must be reasonably designed to eliminate the influence of unknown inputs and ensure stable convergence of observations. Therefore, Theorem 1 will be used to ensure the stability of this observer, and a parameter design method will be proposed.
Theorem 1.
By reasonably designing the parameter matrices , , , and to satisfy Equation (9), the state observation error can be guaranteed to converge asymptotically. Additionally, by designing , the disturbance observation error can be guaranteed to be a bounded quantity and arbitrarily small within the closed set . The larger the value of , the smaller the disturbance observation error.
Proof.
The proof is given in Appendix A. □
For the state observer, according to Theorem 1, when the parameters satisfy Equation (9), the state observation part and the input part can be decoupled. Through observability decomposition and the pole placement method, the gain matrix can be set to satisfy the necessary and sufficient conditions for state observation, thereby achieving the asymptotic stability of the state observation error.
For the disturbance observer, it can be seen from Equations (9) and (A7) that the observation error is not only related to the state observer but also mainly related to . Therefore, the coefficient can be designed as a diagonal matrix with all diagonal elements being positive values, and the larger is, the smaller the disturbance observation error will be.
Based on the above analysis, we propose the following Algorithm 1:
| Algorithm 1. Parameter calculation of DRO |
| Input: System matrix Output: Observer gain 1: if rank(CE) ≠ rank(E) 2: Output “UIO does not exist” 3: end if 4: H ← E * inv(CE’ * CE) * CE’ 5: T ← I − H * C 6: A1 ← T * A 7: if (C, A1) is observable 8: Calculate K1 using pole placement and calculate F and K according to Equations (9)–(11) 9: end if 10: Wo ← obsv(C, A1) 11: n1 ← rank(Wo) 12: while True 13: P1 ← the first n1 rows of Wo 14: P2 ← Randomly generate an matrix 15: P ← [P1; P2] 16: If det(P) ≠ 0 17: return P 18: PAP_inv ← P * A * inv(P) 19: CP_inv ← C * inv(P) 20: A11 ←The upper-left n1 × n1 submatrix of PAP_inv 21: A12 ←The lower-left n1 × (n − n1) submatrix of PAP_inv 22: A22 ←The lower-right (n − n1) × (n − n1) submatrix of PAP_inv 23: Kp ← place(A11, C(1:n1, :), expected poles) 24: K1 ← inv(P) * Kp 25: K2 ← randomly generate an (n − n1) * m matrix 26: K ← K1 + K2 27: F ← A1 − K1 * C 28: return F, K, T, H |
4. Photovoltaic-Based Distributed Frequency Controller
In this section, the distributed DFC is designed based on the strict feedback system observation model provided by DRO for the cooperative control layer for PV. The MAC is employed to construct error surfaces to drive the system to its desired equilibrium. Subsequently, the DSC is utilized to construct the energy function of the error surface in a step-by-step manner, followed by the derivation of the virtual control law. Specifically, an initial error surface is constructed from the control objective, and the associated energy function is defined for . To stabilize the derivative of , a virtual control law is designed. Then a second error surface and a virtual law is derived to stabilize . This iterative procedure continues until the derivative of is obtained. At this stage, there is no need to define a new error surface. The final control law is derived directly by stabilizing thereby completing the design.
4.1. Error Surface Design Based on MAC
The error surface is designed using the MAC method. The design of the error surface will simultaneously consider the suppression of low-frequency oscillations and ultra-low-frequency oscillations. Considering that the regional aggregated frequency is observable for ultra-low-frequency oscillations, while the inter-regional aggregated frequency difference is observable for inter-area low-frequency oscillations, is designed as follows.
where , and are the adjacency weights and reference signal weights, respectively, which must satisfy the condition that the weights of mutually communicating nodes are not zero.
According to the definition of node out-degree in algebraic graph theory: , Equation (10) can be further rearranged as:
where .
In addition, the expected dynamics of state variables and are virtual control laws and , respectively. In backstepping control, their deviations are typically defined as error surfaces and :
where .
However, defining errors and using Equation (12) would introduce high-order differentiation in the control law, leading to the “differential explosion” problem. Therefore, the DSC method is adopted, where and are input into the following first-order low-pass filter to obtain and :
where is the filter time constant,
By replacing and with and , the differential operations in the control law design are transformed into algebraic operations. Consequently, and are defined as:
Comparing Equations (12) and (14), it follows that the error surface equals the error surface minus the filtering error :
If we denote , the dynamics of the filter output error can be expressed as:
Since in Equation (15) must be obtained via the DRO, the observed value of the error surface is:
Substituting Equation (8) into Equation (16) yields the relationship:
4.2. Control Law Design Based on DSC
Control Law Design
This section designs control laws to ensure that the system state moves according to each virtual control law, guaranteeing stable convergence of the defined error surface and thereby suppressing low-frequency and ultra-low-frequency oscillations. The control laws are designed by constructing the energy function of the error surface and compensating for interference step by step.
- (1)
- Design virtual control rate for .
For error in Equation (11), define the Lyapunov function:
By taking the derivative of Equation (18) and incorporating Equations (4), (10) and (14), we can obtain:
To stabilize Equation (19), the virtual control law is designed as follows:
where is a parameter to be designed.
Substituting into Equation (19) and considering Young’s inequality, we obtain:
Equation (21) indicates that while contributes to stability, convergence of is coupled with error surface and filtering error , necessitating further energy function construction and design of virtual control rate .
- (2)
- Design virtual control rate for .
Define the Lyapunov function for the first term in Equation (14):
Taking the derivative of Equation (22) and combining Equations (4), (14) and (15) yields:
To stabilize Equation (23), design the virtual control law as follows:
where is a parameter to be designed.
Substituting into Equation (23) and considering Young’s inequality, we obtain:
Equation (25) indicates that the stability of , , and is influenced by error surfaces , , and other factors, necessitating further construction of an energy function and design of control law .
- (3)
- Design Control Law
Define the Lyapunov function for the second term in Equation (14):
Taking the derivative of Equation (26) and combining Equations (4) and (14) yields:
To stabilize Equation (27), design the control law :
where is a parameter to be designed.
Substituting into Equation (27) and considering Young’s inequality, we obtain:
The control law design is now complete. Using error surfaces (12), (14) and control laws (20), (24), (28), the photovoltaic-based distributed cooperative frequency controller is realized.
The flowchart of the proposed control method is shown in Figure 8. The overall view of the design and application process are shown in Figure 8a and the detailed information transmission process is given in Figure 8b. And the final control structure of DFC is depicted in Figure 9. In the PV-based distributed cooperative frequency control system, the measurement devices and DROs provide necessary information for DFCs to calculate its outputs. By integrating regional with neighborhood information, control signals for ULFO and LFO can be computed. This approach fully leverages the potential of PV plants to enhance dynamic frequency stability in wide-area power systems.
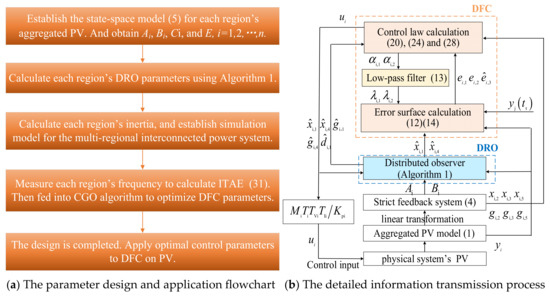
Figure 8.
The flowchart of the proposed control method.
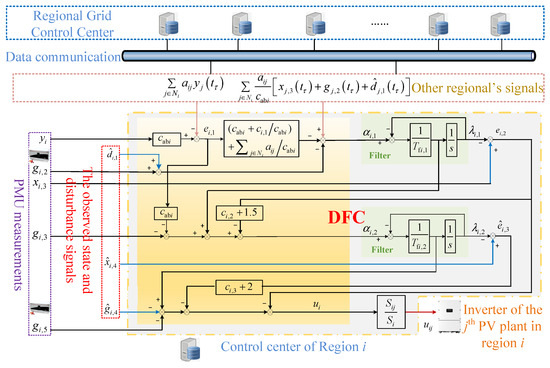
Figure 9.
The detailed structure of DFC.
4.3. Control Law Parameter Design
As evident from the expressions of designed control law, the closed-loop stability performance of the entire system is critically dependent on parameter design. Therefore, this section first derives Theorem 2 on the stability of the distributed photovoltaic DFC, then proposes a parameter design method for the control law based on Theorem 2.
Theorem 2.
For each regional controlled system (1) under the action of DRO-based DFC, if the design parameters and satisfy Equation (30), then for any there exists a bounded compact set such that when , all signals in the closed-loop system are semi-globally uniformly ultimately bounded, where ,.
Proof.
The proof is given in Appendix B. □
From Theorem 2, it can be seen that the design of distributed observer parameters ensures stable convergence of state observation error and bounded disturbance observation error.
Based on Theorem 2, a parameter optimization model is proposed. Considering that the integral of time multiplied absolute error (ITAE) can evaluate the deviation between the controller and the expected dynamics, the minimization of ITAE of frequency is taken as the objective to suppress the ULFO. At the same time, in order to suppress LFOs, the objective is designed to minimize the absolute frequency deviation between region i and its neighbors. Thus, the final multi-objective optimization problem is established as shown in Equation (31).
The range of control law parameter values is set to ensure that the values are reasonable, save computation and speed up the optimization search process:
Owing to the fact that fixed upper and lower bounds for (32) can slow the convergence speed, we propose an adaptive boundary determination method using Theorem 2. The upper and lower bounds of (32) are updated after each population update. For population with m current candidates, is estimated to the average value , which is computed by using its definition in Theorem 2. Since a larger value of can accelerate the solution process, is estimated to be by the minimum value within the population by utilizing the following expression.
where , is the minimum value of the time-domain curve for the th error surface in region i corresponding to candidate solution . is the minimum value of the time-domain curve for the filtering error in region i corresponding to candidate solution .
Based on the condition in Theorem 2, is updated by the following equation.
After computing for the current population, constraint boundaries and can be updated according to Theorem 2’s definition , which serve as constraints for the optimization:
To determine the constraint boundaries and in the optimization, the following characteristics are considered. Since larger values (within a certain range) improve system’s dynamics, can be set moderately high. For , smaller values reduce filtering error. However, excessively small prolongs simulation time and reduces iteration efficiency. Thus, should satisfy Theorem 2’s requirement and avoid being too small.
As to solve the above optimization problem, we adopt the CGO algorithm [21], which employed the Sierpinski triangle algorithm to integrate chaos theory with game theory to improve search efficiency. The main concepts and equations of CGO are as follows.
Assume that in current population, there are m current candidate solutions with expression as follows.
where d is the number of parameters that need to be optimized, and includes all parameters to be optimized (, ), which are randomly generated within the search space by Equation (38).
where denotes the j-th decision variable of the i-th point in the search space, and represent the upper bound and lower bounds of decision variables, respectively, and is a random number within the interval [0, 1].
The Sierpinski triangle algorithm is the main approach to update the candidate solutions , which is formed by four seeds as follows.
where stands for the optimal candidate solution in the current state within the search space, is the average value of randomly selected initial qualified points, represents the i-th candidate solution, denotes a random number generated in a certain manner, and are random integers that are either 0 or 1, and R is a random number within the range of [0, 1].
Each candidate solution is regarded as an independent player. These players select the optimal action and update their own states according to their current states and the states of other players. The pseudocode of the optimization process is provided as in Algorithm 2.
| Algorithm 2. Optimization process of CGO |
|
Input: , and Equation (31) Output: The optimal candidate solution (DFC parameters) ① First, generate random initial points in the search space. ② Calculate the fitness (degree of proximity to the target) by substituting the initial solutions into the objective function. ③ Obtain the optimal candidate solution in the current state. ④ Enter the following loop: While (t < maximum number of iterations) for i = 1: number of candidate solutions Generate by randomly selecting initial qualified points Generate a temporary triangle from , , and Generate new seeds using the calculation formulas for the four seeds Calculate the fitness of the new seeds if the fitness value of the new seed is better than that of the worst candidate solution Replace the worst candidate solution with the new seed end If there is a better candidate solution, update end t = t + 1 end ⑤ Obtain the optimal solution So far, the optimization of parameters using CGO has been completed. |
5. Case Study and Analysis
In this subsection, the control effect of the proposed method on the dynamic frequency stabilization of the power system is verified by two multi-regional interconnected test systems.
5.1. Case Study and Analysis via a Two-Region Interconnected System
This subsection verifies the effectiveness and superiority of PV DRO and DFC, respectively, based on a two-region interconnected arithmetic system shown in Figure 10. Within each region, four thermal units and six PV units are set up, where each thermal unit has a capacity of 70 MW and each PV unit has a capacity of 20 MW [22,23].The equivalent model parameters are calculated based on [24], and listed in Table 1 and Table 2, and the coefficient of tie-line between the two regions is p.u.
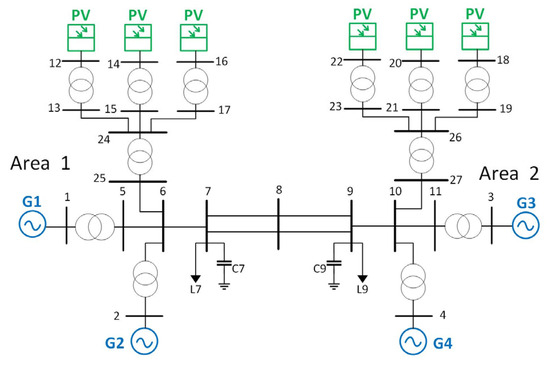
Figure 10.
Two-region interconnected test system.

Table 1.
Parameters of six photovoltaic systems.

Table 2.
Parameters of the aggregated photovoltaic system, and the region’s inertia and damping.
At t = 1 s, a step load of 0.06 p.u. is applied to Region 1. The frequency deviation curve of Region 1 without additional dynamic frequency controller is shown in Figure 11a. It can be observed that the system frequency exhibits two oscillatory modes, namely, a low-frequency oscillation at 0.4 Hz and an ultra-low-frequency oscillation at 0.059 Hz. Both oscillations are of weak damping.
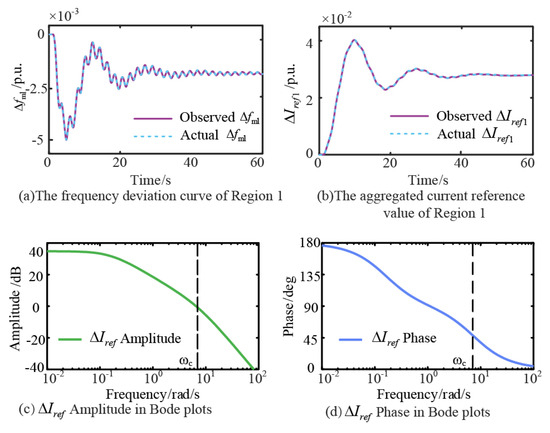
Figure 11.
Observed results and Bode plot of DRO.
- (1)
- Observer Performance Analysis
To test the performance of the proposed observer, Figure 11a,b illustrate the comparison between the observed and actual values of the two aggregated states and in Region 1. During the observation process, the maximum error of the state observer was 1.6 × 10⁻⁴ p.u., and the steady-state tracking error converged to 6 × 10⁻⁵ p.u. Figure 11c,d show a frequency domain analysis of the observation of signals using Bode plots. The DRO can effectively perform observations in the low-frequency band, and its amplitude gain attenuates at a rate of −40 dB/dec in the high-frequency band, ensuring that the observation results are not affected by high-frequency noise from the sensors.
Figure 12a,b show the comparison between the actual and observed values of disturbances and in two regions, respectively. As shown in Figure 12a, the observed values rapidly track the actual values in approximately 0.2 s after the disturbance occurs. Figure 12b further demonstrates that the steady-state error converges to 1.5 × 10⁻⁴ p.u through the global time-domain response. The accuracy and speed of the observation results demonstrate the good observation performance of the proposed photovoltaic DRO.
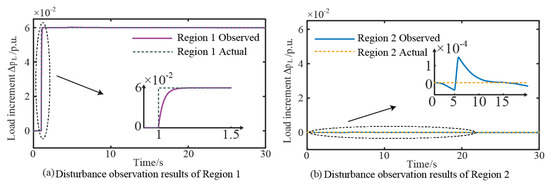
Figure 12.
Disturbance observation results.
- (2)
- Dynamic frequency stabilization control effect
To test the performance of the proposed DFC, Figure 13 shows the dynamic frequency response process of the proposed DFC under a 0.06 p.u. step disturbance of load in Region 1. Figure 13a,b show the control effects after optimizing the controller parameters Via CGO. The simulation results indicate that the proposed control method effectively limits the system’s maximum frequency deviation to within 0.17 Hz. And, within 12 s after the disturbance, it effectively suppresses both low-frequency and ultra-low-frequency oscillations. The steady-state frequency deviation ultimately converges to 1 × 10⁻⁸ Hz.
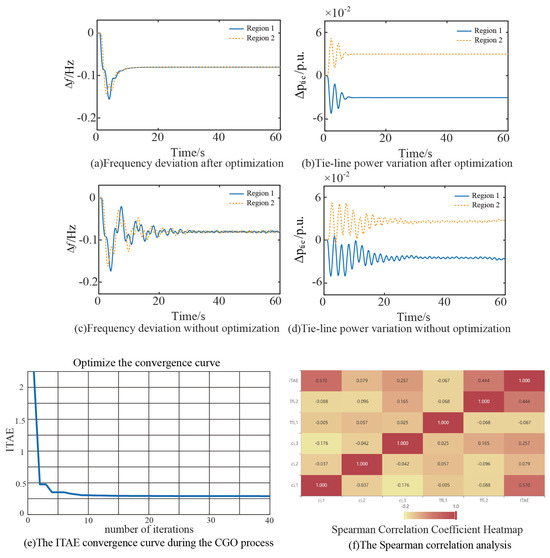
Figure 13.
Controller and CGO Effect Verification.
Figure 13c,d present the control effects when the controller parameters are set based on experience. When the controller parameters are not optimized Via the CGO algorithm, neither the frequency nor the tie-line power variations have fully converged at t = 60 s. Through comparison, it is evident that the control effect of the controller without CGO is far inferior to that with CGO.
Figure 13e is the ITAE convergence curve during the CGO process, from which it can be seen that the ITAE value decreases steadily during optimization.
Furthermore, we also randomly selected 100 sets of parameters for Spearman correlation analysis, and the results are presented in Figure 13f. The analysis results indicate that and are the controller parameters that have a relatively significant impact on the ITAE evaluation. Their correlation coefficients are 0.570 and 0.444, respectively, which are much higher than those of other controller parameters. This finding helps us accurately identify the key parameters and provides data support for the subsequent optimization of control performance.
- (3)
- Comparative analysis with centralized control
Comparative experiments are conducted between the proposed method and the centralized frequency control [23]. A maximum communication time lag was set between the two regions. At t = 1 s, a 0.06 p.u. step load is applied to Region 1. Figure 14 shows the resulting frequency response curves of both regions, along with the dynamic variation in the total output power of the tie-line.
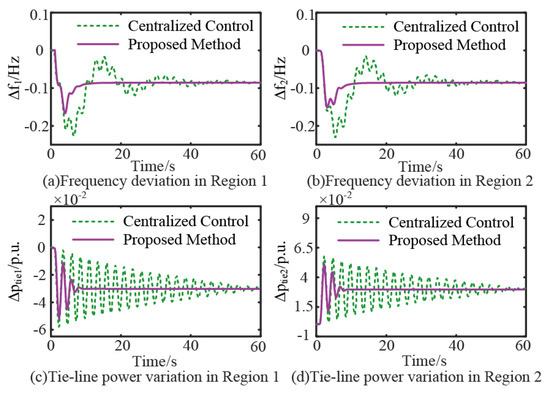
Figure 14.
Dynamic response processes of the system under centralized and the proposed approaches.
As shown in Figure 14a,b, compared with the centralized control, the proposed method reduces the maximum frequency deviation from 0.23 Hz to 0.17 Hz, with a reduction of 26.1%. The settling time is shortened from 50.6 s to 12 s with a reduction of 76.3%.
To quantify the performance of regional coordinated control, the inter-area frequency deviation index is defined as . The experimental data in Figure 14 show that, during the system’s gradual frequency recovery, the centralized frequency regulation yields a large inter-area frequency cumulative deviation with . Since centralized control requires a double data communication task from the actor and the control center, which amplifies the time delay, which compromises the effect of centralized control.
Under the same communication condition, the proposed controller achieves a significantly smaller of merely 0.014. This indicates the proposed DFC with reduced communication latency can effectively minimize inter-area frequency difference and gain good control performance.
5.2. Case Study of the Four-Region System
This subsection tests the synergy effect of the proposed method using a four-region interconnected system. It also analyzes the impact on the synergy effect under different communication conditions. The corresponding parameter settings are shown in Table 3. Among them, is the time constant of the equivalent voltage outer loop of the photovoltaic aggregated PV inverter in the local area, is the time constant of the equivalent current inner loop of the photovoltaic inverter in the local area, is the equivalent droop coefficient of the photovoltaic cluster in the local area, M is the equivalent inertia of the local area, and D is the equivalent damping of the local area.

Table 3.
Four region frequency system parameters.
During the design phase of the observer, matrices , , , and are the to-be-designed parameters of the state observer, and is the to-be-designed parameter of the disturbance observer
During the design phase of the controller, we have considered parameters as follows.
① The adjacency weight , the reference signal weight : these parameters are the design parameters to build error surface . They are used in the calculation of Equation (10).
② Filter time parameter : they are design parameters to calculate error surfaces and , which is used in Equation (13).
③ Parameters , and (control law design parameters): these parameters enable the system states to evolve in accordance with various virtual control laws and ensure the stable convergence of the defined error surface. They are used in Equations (20), (24) and (28), respectively.
Figure 15 illustrates the communication topology among the interconnected system regions under both strong and weak communication conditions. The dashed line representing inter-area communication with a maximum communication time lag of 2.5 s.

Figure 15.
Communication topology of interconnected systems: (a) strong communication and (b) weak communication.
- (1)
- Comparative Analysis with Decentralized Control
Using the strong interconnection communication topology shown in Figure 15a, the control effects of the traditional decentralized control [14] are compared with the proposed method under good communication environment. At t = 1 s, a step disturbance of load with an amplitude of 0.06 p.u. is synchronously applied to regions 1 and 4. The corresponding frequency response curves of each region are shown in Figure 16, and the dynamic curves of the total output power of the tie-line is illustrated in Figure 17.
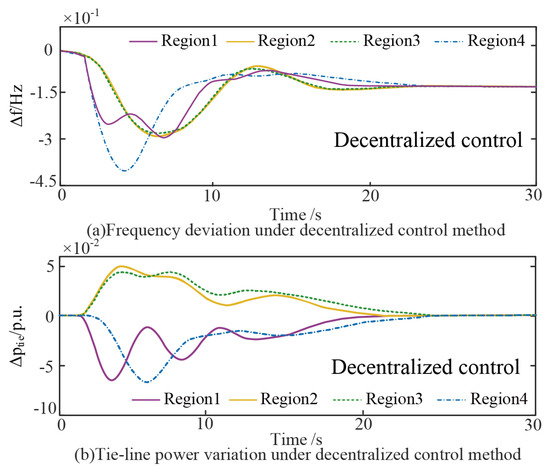
Figure 16.
Dynamic response process of four-region interconnected system by using decentralized control.
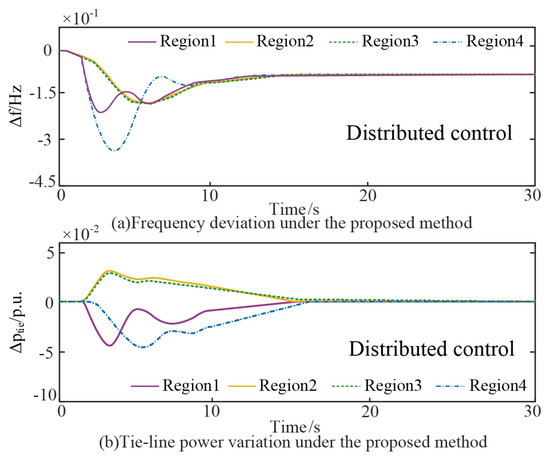
Figure 17.
Dynamic response process of four-region interconnected system by using the proposed DFC.
As can be seen in Figure 16, after the load disturbance, each region presents independent response characteristics, resulting in significant frequency differences between regions 1 and 4. The maximum instantaneous frequency difference between the two reaches 0.19 Hz. Stability was regained after 23.46 s following the load disturbance. Given that region 4 is only interconnected with region 1 and exhibits the largest frequency deviation, it was selected for observation. Its maximum frequency offset ultimately reached 0.41 Hz. The amplitude of the maximum power fluctuation of the entire tie-line reaches 0.07 p.u.
In contrast, the method in this paper realizes inter-region dynamic synergy through the multi-agent consensus algorithm. The frequency deviation of regions 1–4 converges synchronously, the maximum frequency offset of region 4 is suppressed to 0.34 Hz, and is quickly suppressed within 13.4 s. Compared with decentralized control, this approach resulted in a 17.1% reduction in frequency deviation and a 42.9% shortening of the settling time.
To facilitate the comparison of the performance among centralized control, decentralized control, and the control method proposed in this paper, we have compiled Table 4 to compare the key parameters. This table contrasts the three methods in terms of settling time and maximum frequency deviation, allowing for a clear identification of the performance differences between the centralized control, decentralized control, and the method proposed in this paper.

Table 4.
Comparison of key performance metrics.
- (2)
- Controller performance analysis under different communication conditions
This subsection evaluates the control performance of the proposed control method under both strong and weak communication topologies. Using the topologies shown in Figure 15a,b as examples, a 0.06 p.u. step load is applied to regions 1 and 4 at t = 1 s and t = 20 s, respectively. Under the conditions of strong communication and random communication delays, the frequency response curves of each region and the dynamic process of the total output power of the contact line are shown in Figure 18a,b. Under the proposed controller, the dynamic process of the system transitions to the steady state rapidly. And, with the inter-region frequency offsets stabilized, the tie-line power fluctuation also tends to stabilize.
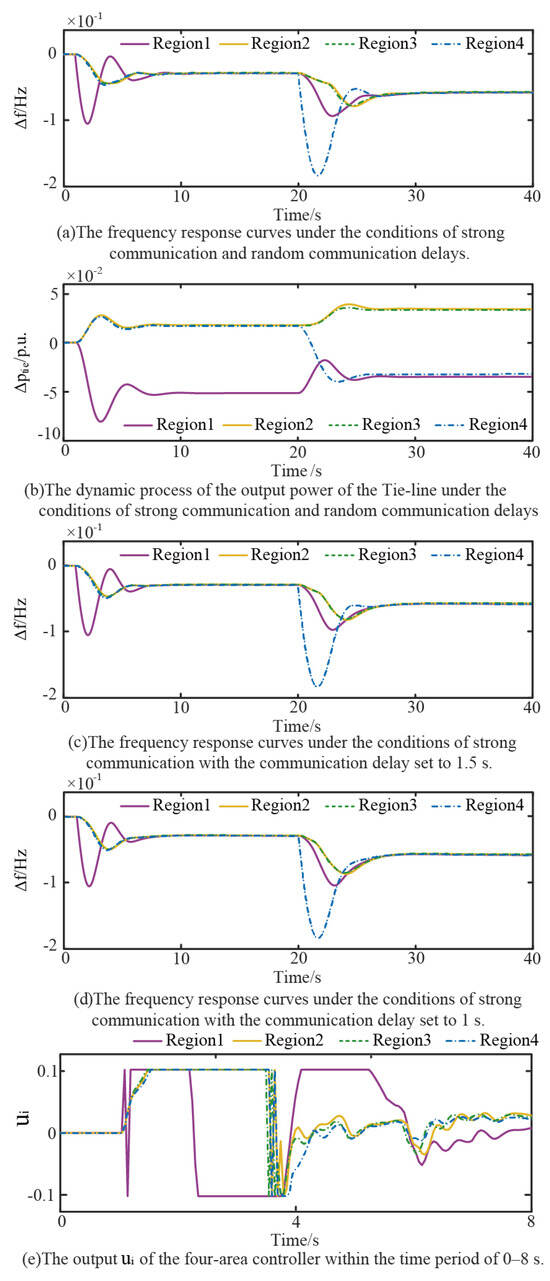
Figure 18.
Dynamic of four-region interconnected test system under strong communication.
Under strong communication conditions, with the communication delay set to fixed values of 1.5 s and 1 s, the frequency response curves of each region are shown in Figure 18c,d. It can be observed that all frequencies can converge quickly and stably. However, the convergence speed and convergence effect under the condition of fixed time delay are better than those under random time delay. Moreover, as the fixed time delay decreases, both the convergence speed and convergence effect improve.
To demonstrate the transient characteristics of the controller, under the condition of strong communication random time delay, we present the output of the four-area controller within the time period of 0–8 s. Figure 18e shows that the controllers responded rapidly to the disturbance. The clipping module effectively suppressed the signal surge in the first two cycles, ensuring stable oscillation control. Subsequently, the control signals fell below the clipping amplitude by the third cycle. This effective response resulted in satisfactory performance by t = 8 s, as further evidenced by the frequency response in Figure 18a.
Figure 19a,b demonstrate the dynamic response curve of the system with the weak communication topology shown in Figure 15b using the proposed controller. It is shown that the frequency oscillation can also be narrowed down and eventually converge to a steady state.
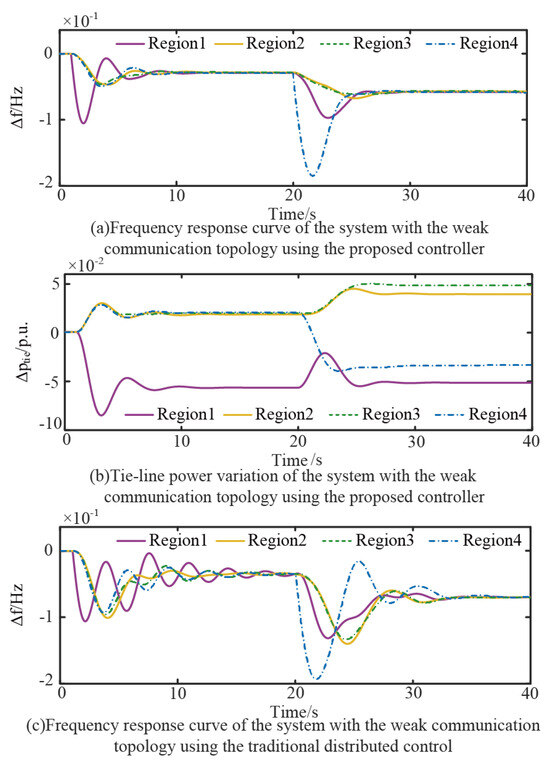
Figure 19.
Dynamic of four-region interconnected test system under weak communication.
Figure 19c shows the frequency dynamic diagram obtained by using the traditional distributed control method under weak communication conditions. After the first disturbance at t = 1 s, the frequency under the traditional distributed control failed to fully converge even by t = 20 s. After the disturbance at t = 20 s, it took 18 s to reach a stable state. The convergence speed of the traditional distributed control is much slower than that of the control method proposed in this paper. It can be clearly seen that the control effect is far inferior to that of the control method proposed in this paper.
Table 5 shows the change in outflow power Via the tie-line after the perturbation in regions 1 and 4 under strong and weak communications, respectively. Analysis of the data in Table 5 reveals that under strong communication conditions (Figure 15a), all regions achieve full interconnection. As shown in Table 5, the tie-line power support received by Region 1 and Region 4 is remarkably similar under these conditions (The additional power flowing into Region 4 Via the tie-line is 95.3% of that into Region 1). This indicates that with favorable communication, the proposed coordinated control mechanism can achieve the allocation of cross regional power with the goal of minimizing ITAE in Equation (31), allowing the load disturbance to be shared more evenly across a broader area. Consequently, the overall frequency response performance is further optimized, evidenced by faster recovery and reduced oscillations as depicted in Figure 18a.

Table 5.
Power support by tie-lines.
In contrast, under weak communication conditions, a significant disparity exists in the power support received by different regions (The additional power flowing into Region 4 via the tie-line is 65.1% of that into Region 1). However, as shown in Figure 19a, the proposed controller can also effectively suppress both low-frequency and ultra-low-frequency oscillations across all four regions. This phenomenon demonstrates that even in extreme situations characterized by non-ideal communication topologies, resulting in information asymmetry and uneven power allocation, and significant max delay conditions of up to 2.5 s, the controller can still maintain dynamic frequency stability, demonstrating the superiority of the distributed control algorithm based on state–disturbance observation and dynamic surface consensus control proposed in this paper.
6. Conclusions
This paper addresses the dynamic frequency stability challenges in wide-area interconnected power systems by proposing a distributed photovoltaic frequency controller based on a multi-agent consensus algorithm and dynamic surface control methodology. The principal conclusions are summarized as follows:
- (1)
- The PV-based control strategy proposed in this paper can suppress both low-frequency oscillations and ultra-low-frequency oscillations simultaneously and also achieves favorable performance even under weak communication conditions.
- (2)
- A three-layer distributed cloud control framework of terminal–edge–collaboration is constructed, which realized double high-precision observation of state variables and external perturbations through decentralized regional observer. The maximum error of the state observer is 1.6 × 10⁻⁴ p.u. and the steady state tracking error converges to 6 × 10⁻⁵ p.u.
- (3)
- A distributed frequency controller (DFC) is proposed using the MAC and DSC method, which can effectively limit the maximum frequency deviation of the system to 0.17 Hz, and the steady state frequency deviation converges to 1 × 10⁻⁸ p.u.
- (4)
- The parameter adjustment strategy based on CGO is proposed to achieve frequency deviation suppression. Simulation results show that the frequency deviation can be suppressed to ±0.17 Hz under the condition of communication delay of 2.5 s.
- (5)
- The test results show that compared with that of the traditional centralized control, the proposed dynamic frequency active support method can reduce the frequency deviation by 26.1% and the regulation time by 76.3%. And compared with that of the decentralized control, the proposed method can reduce the frequency deviation by 17.1% and the regulation time by 42.9%.
- (6)
- The PV-based control method proposed in this study can effectively suppress low-frequency and ultra-low-frequency oscillations, significantly enhancing the power grid’s capacity to accommodate high-proportion clean energy and its stability.
There remains room for further research regarding the finite-time convergence of the control method and we will conduct in-depth studies on this issue in the future. In addition, in our follow-up studies, we will also carry out in-depth research on issues including computational requirements, communication infrastructure needs, and potential integration challenges with existing control systems.
Author Contributions
Conceptualization, Y.Z. (Yichen Zhou), Y.G. and Y.L. (Yifei Liu); methodology, Y.Z. (Yichen Zhou), Y.L. (Yifei Liu) and Y.T.; software, Y.G. and Y.L. (Yifei Liu); validation, Y.Z. (Yichen Zhou), Y.G. and Y.L. (Yifei Liu); formal analysis, Y.G. and Y.T.; investigation, Y.Z. (Yichen Zhou), Y.G., Y.L. (Yifei Liu), L.T. and Y.L. (Yuyan Liu); resources, Y.T., L.T., Y.L. (Yuyan Liu) and J.Y.; data curation, Y.G., Y.Z. (Yifei Zhang) and R.C.; writing—original draft preparation, Y.L. (Yifei Liu); writing—review and editing, Y.Z. (Yichen Zhou), Y.G., Y.T., Y.L. (Yifei Liu), L.T., Y.Z. (Yifei Zhang), Y.L. (Yuyan Liu), X.Z., J.Y. and R.C.; visualization, Y.T., L.T., Y.L. (Yuyan Liu) and J.Y.; supervision, Y.Z. (Yichen Zhou) and Y.T.; project administration, Y.T.; funding acquisition, Y.Z. (Yichen Zhou). All authors have read and agreed to the published version of the manuscript.
Funding
This research was funded by China Southern Grid Digital Grid Funding, grant number DPGCSG-2024-KF-21. The APC was funded by China Southern Grid Digital Grid Funding.
Data Availability Statement
The original contributions presented in this study are included in the article. Further inquiries can be directed to the corresponding author.
Acknowledgments
The authors extend their sincere gratitude to North China Electric Power University for the support and resources provided during this study.
Conflicts of Interest
Author Yujia Tang was employed by the company National Energy Power Grid Technology R&D Centre, Guangzhou 510663, China. Author Tu Liang was employed by the company National Energy Power Grid Technology R&D Centre, Guangzhou 510663, China. Author Yuyan Liu was employed by the company National Energy Power Grid Technology R&D Centre, Guangzhou 510663, China. Author Jiawei Yu was employed by the company National Energy Power Grid Technology R&D Centre, Guangzhou 510663, China. The remaining authors declare that the research was conducted in the absence of any commercial or financial relationships that could be construed as a potential conflict of interest. The authors declare that this study received funding from China Southern Grid Digital Grid Funding, grant number DPGCSG-2024-KF-21. The funder had the following involvement with the study: study design, interpretation of data.
Appendix A
This appendix presents the proof of Theorem 1, and the key steps are as follows.
Theorem A1.
By reasonably designing the parameter matrices , , , and to satisfy Equation (9), the state observation error can be guaranteed to converge asymptotically. Additionally, by designing , the disturbance observation error can be guaranteed to be a bounded quantity and arbitrarily small within the closed set . The larger the value of , the smaller the disturbance observation error.
Proof.
Let be the state of the system. Combining the dynamic Equation (5) with Equations (6) and (7), we obtain the following relationship for the state observation error of the designed observer:
When the design matrix parameters satisfy the conditions of Equation (9), Equation (A2) can be simplified to . At this point, the state observation can be decoupled from the input. As long as the design of ensures that is a Hurwitz matrix, the state observation error will be progressively stable.
For the disturbance observation error, its dynamic equation is:
Define the Lyapunov function:
For power systems, disturbances are bounded. Assume that and the first-order derivative of the disturbance is bounded. Differentiate Equation (A4) and combine it with Equation (A3) and Young’s inequality to obtain:
where , and , denote the smallest eigenvalues of the matrix. Design to satisfy , then .
Solve the first-order linear differential equation shown in Equation (A5) to obtain:
Global consistency is ultimately bounded. Combining Equation (A4), we obtain:
Therefore, according to Equation (A7), there exists a positive constant such that the interference observation error converges to the closed set , indicating that the designed DRO interference observation error is bounded.
It can be seen from Equation (A7) that when designing the DRO, the value of can be controlled through , thereby ensuring that the interference observation error is arbitrarily small. Q.E.D. □
Appendix B
Theorem A2.
For each regional controlled system (1) under the action of DRO-based DFC, if the design parameters and satisfy Equation (30), then for any there exists a bounded compact set such that when , all signals in the closed-loop system are semi-globally uniformly ultimately bounded, where ,.
Proof.
For the interconnected system, define the Lyapunov function as:
Differentiating Equation (A9) and incorporating the error surfaces (12), (14), the filter (13), and the constructed control laws (20), (24), (28) with Young’s inequality yields:
Assuming stability, all observation error terms in Equation (A10) are quadratic. For analytical convenience, let the maximum observation error term represent the observation error for region i. For any , there exists a set: , where has an upper bound in the bounded compact set , denoted as [25]. This implies , with being a positive constant. Within this set, the maximum error value for regional frequency deviation is . Defining , we can further bound Equation (A10) on the compact set :
Define: . Let the design parameters and satisfy and . Denoting , it follows that and .
Since:, Rearranging Equation (A11) yields:
Setting , we have . When , it follows that , implying . Thus, is an invariant set, and all signals in the closed-loop system are semi-globally uniformly ultimately bounded. Q.E.D. □
References
- National Grid ESO. Technical Report on the Low Frequency Demand Disconnection (LFDD) Event; National Grid ESO: Warwick, UK, 2020. [Google Scholar]
- Islam, M.R.; Azam, M.S.; Hossen, M.S.; Islam, M.S.; Worku, M.Y.; Shahriar, M.S.; Shafiullah, M. Power system stability enhancement through optimal PSS design. e-Prime—Adv. Electr. Eng. Electron. Energy 2024, 9, 100735. [Google Scholar] [CrossRef]
- Xu, T.; Sun, S.; Zhou, Z.; Feng, H.; Deng, H.; Chen, Y.; Li, B. The principle and influence analysis of suppressing ultra-low frequency oscillation by using additional GPSS control. In Proceedings of the 2023 3rd International Conference on Intelligent Power and Systems (ICIPS), Shenzhen, China, 20–22 October 2023; pp. 250–254. [Google Scholar]
- Sun, W.; Ma, Z. Mechanistic Analysis of Ultra-Low-Frequency Oscillation Accompanied by Low-Frequency Oscillation in Hydropower System. In Proceedings of the 2024 3rd International Conference on Energy and Electrical Power Systems (ICEEPS), Guangzhou, China, 14–16 July 2024; pp. 564–567. [Google Scholar]
- Zhong, W.; Li, Z.; Tang, Z.; Du, Y.; Yang, X.; Feng, C.; Li, G. An ultra-low frequency oscillation suppression method for hydropower units based on GPSS parameter optimization. In Proceedings of the 2023 10th International Forum on Electrical Engineering and Automation (IFEEA), Nanjing, China, 3–5 November 2023; pp. 726–731. [Google Scholar]
- Yang, L.; Huang, W.; Zhang, D.; He, P.; Meng, X.; Cao, P.; Yang, B. Comprehensive suppression strategies for low frequency and ultra-low frequency oscillations of the Yunnan power grid under asynchronous interconnection. Power Syst. Prot. Control 2021, 49, 133–140. [Google Scholar] [CrossRef]
- Guang, X.; Fang, Y.; Li, Z.; Wu, X.; Liu, F.; Li, W. Phenomenon and Mechanism of Inter-area Tie-line Power Oscillation in Ultra-low Frequency Oscillation. Autom. Electr. Power Syst. 2020, 44, 69–77. [Google Scholar]
- Cao, T.; Ye, Z.; Wu, Q.; Wan, X.; Wang, J.; Li, D. A Review of Adaptive Control Methods for Grid-Connected PV Inverters in Complex Distribution Systems. Energies 2025, 18, 473. [Google Scholar] [CrossRef]
- Ali, J.S.; Qiblawey, Y.; Alassi, A.; Massoud, A.M.; Muyeen, S.M.; Abu-Rub, H. Power System Stability with High Penetration of Renewable Energy Sources: Challenges, Assessment, and Mitigation Strategies. IEEE Access 2025, 13, 39912–39934. [Google Scholar] [CrossRef]
- National Energy Administration. Notice of the National Energy Administration on Improving the Grid-Related Security Capabilities of New Energy and New Grid-Connected Entities to Serve the High-quality Development of New Power Systems. 2024-09-30. 00019705/2024-00320. Available online: https://zfxxgk.nea.gov.cn/2024-09/30/c_1310787050.htm (accessed on 4 September 2025).
- Pan, W.; Li, Y.; Cao, Y.; Xin, J. Frequency control of grid-connection system based on VSC-HVDC for large-scale centralized wind farm. Electr. Power Autom. Equip. 2015, 35, 94–99. [Google Scholar] [CrossRef]
- Wu, X.; Wang, J.; Wang, S.; Xu, Y. Research on Multi-band Robust Supplementary Control of PV for Coordinated Suppression of Ultra-low Frequency/Low Frequency Oscillations. Proc. CSEE 2024, 1–19. Available online: https://link.cnki.net/urlid/11.2107.tm.20241202.1138.002 (accessed on 4 September 2025).
- Heins, T.; Joševski, M.; Gurumurthy, S.K.; Monti, A. Centralized Model Predictive Control for Transient Frequency Control in Islanded Inverter-Based Microgrids. IEEE Trans. Power Syst. 2023, 38, 2641–2652. [Google Scholar] [CrossRef]
- Shangguan, X.C.; He, Y.; Zhang, C.K.; Jin, L.; Yao, W.; Jiang, L.; Wu, M. Control Performance Standards-Oriented Event-Triggered Load Frequency Control for Power Systems Under Limited Communication Bandwidth. IEEE Trans. Control Syst. Technol. 2022, 30, 860–868. [Google Scholar] [CrossRef]
- Pijian, C.; Wen, T.; Yi, H. Decentralized load frequency control using DE optimized linear auto disturbance rejection controller for multi-area power systems. In Proceedings of the 2015 34th Chinese Control Conference (CCC), Hangzhou, China, 28–30 July 2015; pp. 217–222. [Google Scholar]
- Le, J.; Zhao, L.; Wang, C.; Zhou, Q.; Wang, Y. Leader-follower Optimal Selection Method for Distributed Control System in Active Distribution Networks. CSEE J. Power Energy Syst. 2024, 10, 314–323. [Google Scholar] [CrossRef]
- Li, Z.; Cheng, Z.; Si, J.; Zhang, S.; Dong, L.; Li, S.; Gao, Y. Adaptive Power Point Tracking Control of PV System for Primary Frequency Regulation of AC Microgrid with High PV Integration. IEEE Trans. Power Syst. 2021, 36, 3129–3141. [Google Scholar] [CrossRef]
- Zhang, Z.; Du, E.; Teng, F.; Zhang, N.; Kang, C. Modeling Frequency Dynamics in Unit Commitment with a High Share of Renewable Energy. IEEE Trans. Power Syst. 2020, 35, 4383–4395. [Google Scholar] [CrossRef]
- Wang, B.; Zhu, S.; Cai, G.; Yang, D.; Chen, Z.; Ma, J.; Sun, Z. Sparse Measurement-Based Modelling Low-Order Dynamics for Primary Frequency Regulation. IEEE Trans. Power Syst. 2024, 39, 681–692. [Google Scholar] [CrossRef]
- Alhelou, H.H.; Golshan, M.E.H.; Hatziargyriou, N.D. Deterministic Dynamic State Estimation-Based Optimal LFC for Interconnected Power Systems Using Unknown Input Observer. IEEE Trans. Smart Grid 2020, 11, 1582–1592. [Google Scholar] [CrossRef]
- Talatahari, S.; Azizi, M. Optimization of constrained mathematical and engineering design problems using chaos game optimization. Comput. Ind. Eng. 2020, 145, 106560. [Google Scholar] [CrossRef]
- Wang, M.; Guo, J.; Ma, S.; Wang, T.; Zhang, X.; Luo, K.; Wang, G. Review of Transient Frequency Stability Analysis andFrequency Regulation Control Methods for Renewable Power Systems. Proc. CSEE 2023, 43, 1672–1694. [Google Scholar] [CrossRef]
- Jietan, Z.; Linan, Q.; Pestana, R.; Fengkui, L.; Libin, Y. Dynamic frequency support by photovoltaic generation with “synthetic” inertia and frequency droop control. In Proceedings of the 2017 IEEE Conference on Energy Internet and Energy System Integration (EI2), Beijing, China, 26–28 November 2017; pp. 1–6. [Google Scholar]
- Shi, Q.; Li, F.; Cui, H. Analytical Method to Aggregate Multi-Machine SFR Model with Applications in Power System Dynamic Studies. IEEE Trans. Power Syst. 2018, 33, 6355–6367. [Google Scholar] [CrossRef]
- Yoo, S.J. Connectivity-Preserving Consensus Tracking of Uncertain Nonlinear Strict-Feedback Multiagent Systems: An Error Transformation Approach. IEEE Trans. Neural Netw. Learn. Syst. 2018, 29, 4542–4548. [Google Scholar] [CrossRef] [PubMed]
Disclaimer/Publisher’s Note: The statements, opinions and data contained in all publications are solely those of the individual author(s) and contributor(s) and not of MDPI and/or the editor(s). MDPI and/or the editor(s) disclaim responsibility for any injury to people or property resulting from any ideas, methods, instructions or products referred to in the content. |
© 2025 by the authors. Licensee MDPI, Basel, Switzerland. This article is an open access article distributed under the terms and conditions of the Creative Commons Attribution (CC BY) license (https://creativecommons.org/licenses/by/4.0/).
