
Symmetry and Asymmetry of the Antegonial Notch

 , , ,
, , ,  ,
,
Abstract
:1. Introduction
- (a)
- deviations of an internal nature, concerning the asymmetry of internal organs, both even and odd. These are morphological asymmetries: size, shape, position, structure (e.g., two and three lobes of the lungs) and in the case of paired organs-asymmetries regarding function (e.g., the ovaries) [6];
- (b)
- deviations of an external nature, mainly concerning the asymmetry of the limbs and paired sense organs, as well as other phenomena related to them. Among humans, this group of deviations is strongly related to the dominance of one hemisphere of the brain [2].
2. Materials and Methods
2.1. Study Material
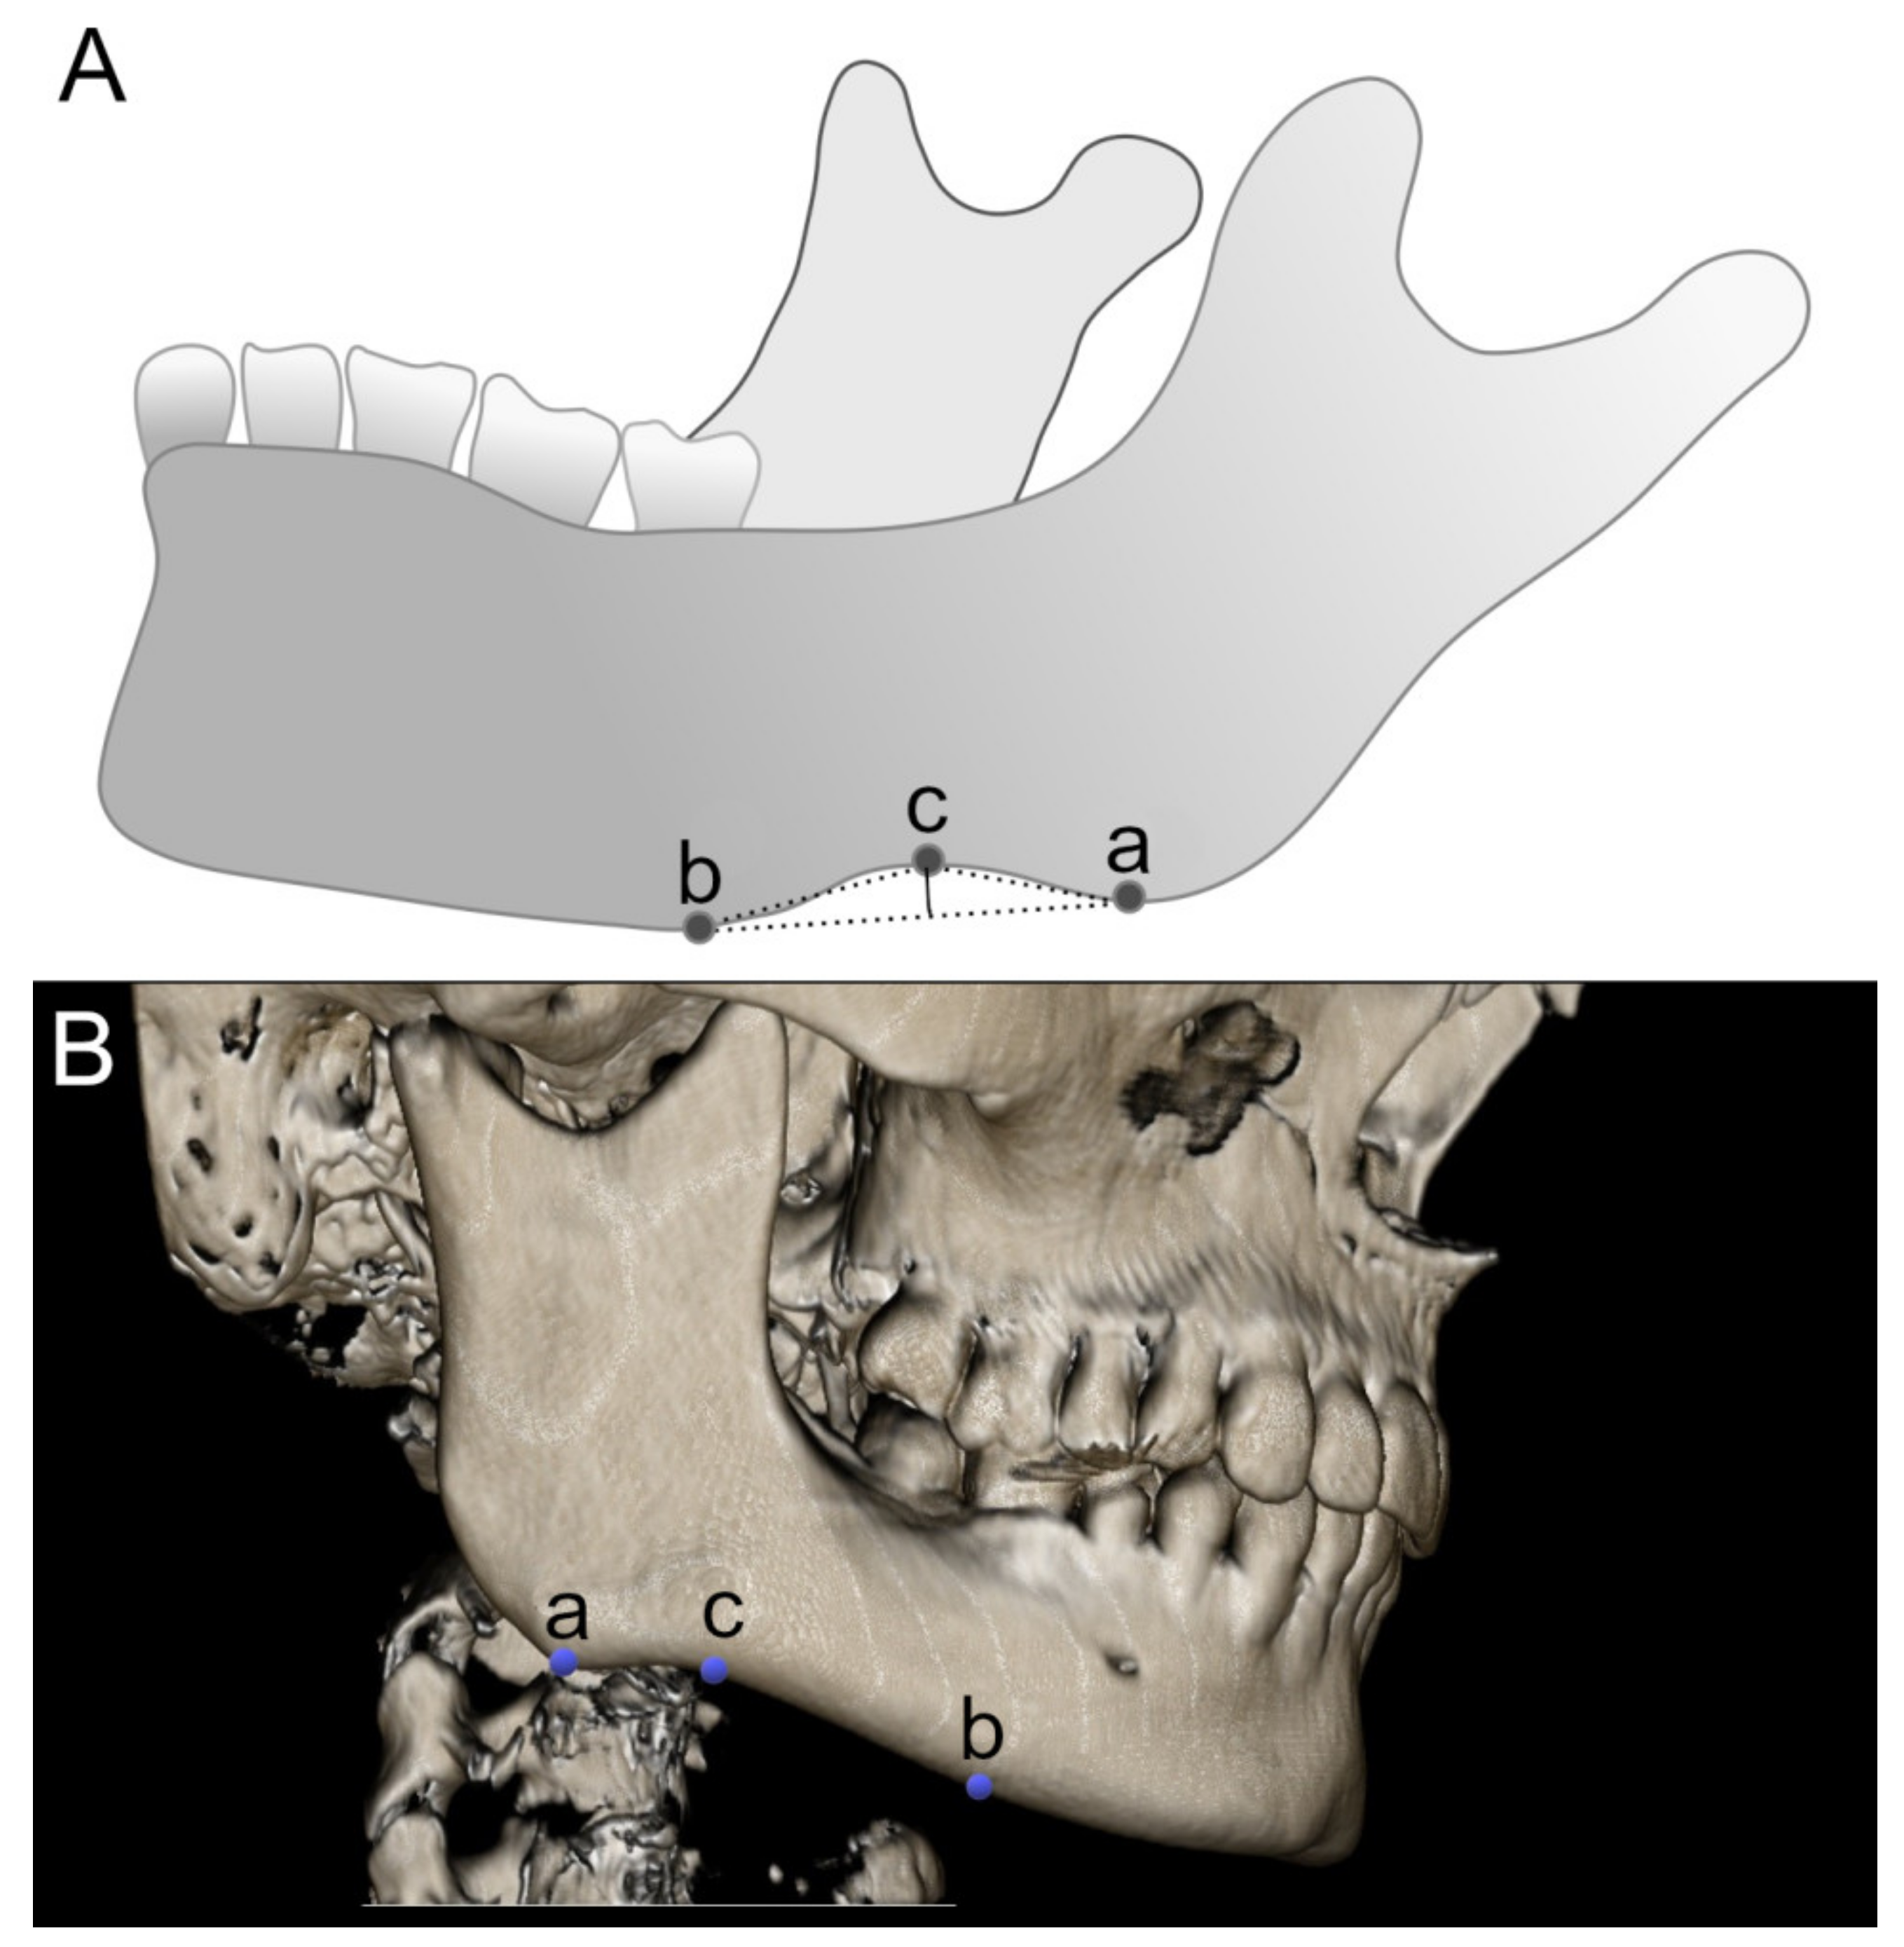
2.2. Measurement of the Antegonial Notch
2.3. Asymmetry Calculation
2.4. Statistical Methods
3. Results
FA1 and FA2 Indices
4. Discussion
5. Conclusions
Author Contributions
Funding
Data Availability Statement
Acknowledgments
Conflicts of Interest
References
- Little, M.H.; McMahon, A.P. Mammalian Kidney Development: Principles, Progress, and Projections. Cold Spring Harb. Perspect. Biol. 2012, 4, a008300. [Google Scholar] [CrossRef] [PubMed]
- Duboc, V.; Dufourcq, P.; Blader, P.; Roussigné, M. Asymmetry of the Brain: Development and Implications. Annu. Rev. Genet. 2015, 49, 647–672. [Google Scholar] [CrossRef] [PubMed]
- Grey, S.; Tanner, D.; van Hell, J.G. How right is left? Handedness modulates neural responses during morphosyntactic processing. Brain Res. 2017, 1669, 27–43. [Google Scholar] [CrossRef] [PubMed]
- Gawlikowska-Sroka, A.; Dabrowski, P.; Szczurowski, J.; Dzieciolowska-Baran, E.; Staniowski, T. Influence of physiological stress on the presence of hypoplasia and fluctuating asymmetry in a medieval population from the village of Sypniewo. Int. J. Paleopathol. 2017, 19, 43–52. [Google Scholar] [CrossRef]
- Graham, J.; Özener, B. Fluctuating Asymmetry of Human Populations: A Review. Symmetry 2016, 8, 154. [Google Scholar] [CrossRef] [Green Version]
- Smith, P.; Wilhelm, D.; Rodgers, R.J. Development of mammalian ovary. J. Endocrinol. 2014, 221, R145–R161. [Google Scholar] [CrossRef] [Green Version]
- Gawlikowska-Sroka, A.; Dąbrowski, P.; Szczurowski, J.; Staniowski, T. Analysis of interaction between nutritional and developmental instability in mediaeval population in Wrocław. Anthropol. Rev. 2013, 76, 51–62. [Google Scholar] [CrossRef] [Green Version]
- Maloney, S.J. The Relationship Between Asymmetry and Athletic Performance: A Critical Review. J. Strength Cond. Res. 2019, 33, 2579–2593. [Google Scholar] [CrossRef]
- Gateño, J.; Jones, T.L.; Shen, S.G.F.; Chen, K.C.; Jajoo, A.; Kuang, T.; English, J.D.; Nicol, M.; Teichgraeber, J.F.; Xia, J.J. Fluctuating asymmetry of the normal facial skeleton. Int. J. Oral Maxillofac. Surg. 2018, 47, 534–540. [Google Scholar] [CrossRef]
- Palestis, B.G.; Trivers, R. A longitudinal study of changes in fluctuating asymmetry with age in Jamaican youth. Symmetry 2016, 8, 154. [Google Scholar] [CrossRef] [Green Version]
- De Coster, G.; Van Dongen, S.; Malaki, P.; Muchane, M.; Alcántara-Exposito, A.; Matheve, H.; Lens, L. Fluctuating Asymmetry and Environmental Stress: Understanding the Role of Trait History. PLoS ONE 2013, 8, e57966. [Google Scholar] [CrossRef] [Green Version]
- Palmer, A.R. What determines direction of asymmetry: Genes, environment or chance? Philos. Trans. R. Soc. B Biol. Sci. 2016, 371, 20150417. [Google Scholar] [CrossRef] [Green Version]
- Little, A.C.; Jones, B.C. Attraction independent of detection suggests special mechanisms for symmetry preferences in human face perception. Proc. R. Soc. B Biol. Sci. 2006, 273, 3093–3099. [Google Scholar] [CrossRef] [Green Version]
- Sobieska, E.; Walerzak, M.; Molińska, M. Facial asymmetry—Aetiology, classification and diagnostics based on the literature. Orthod. Forum 2020, 15, 138–158. [Google Scholar] [CrossRef]
- Bührer, C.; Zimmermann, A. Cleft palate. Neonatal Emergencies Pract. Guid. Resusc. Transp. Crit. Care Newborn Infants 2009, 1, 460–463. [Google Scholar] [CrossRef]
- Monasterio, F.O.; Taylor, J.A. Major craniofacial clefts: Case series and treatment philosophy. Plast. Reconstr. Surg. 2008, 122, 534–543. [Google Scholar] [CrossRef]
- da Fontoura, C.S.G.; Miller, S.F.; Wehby, G.L.; Amendt, B.A.; Holton, N.E.; Southard, T.E.; Allareddy, V.; Moreno Uribe, L.M. Candidate Gene Analyses of Skeletal Variation in Malocclusion. J. Dent. Res. 2015, 94, 913–920. [Google Scholar] [CrossRef] [Green Version]
- Jackson, T.H.; Mitroff, S.R.; Clark, K.; Proffit, W.R.; Lee, J.Y.; Nguyen, T.T. Face symmetry assessment abilities: Clinical implications for diagnosing asymmetry. Am. J. Orthod. Dentofac. Orthop. 2013, 144, 663–671. [Google Scholar] [CrossRef] [Green Version]
- Baldi, A.; Comba, A.; Michelotto Tempesta, R.; Carossa, M.; Pereira, G.K.R.; Valandro, L.F.; Paolone, G.; Vichi, A.; Goracci, C.; Scotti, N. External Marginal Gap Variation and Residual Fracture Resistance of Composite and Lithium-Silicate CAD/CAM Overlays after Cyclic Fatigue over Endodontically-Treated Molars. Polymers 2021, 13, 3002. [Google Scholar] [CrossRef]
- Pozzan, M.C.; Grande, F.; Mochi Zamperoli, E.; Tesini, F.; Carossa, M.; Catapano, S. Assessment of Preload Loss after Cyclic Loading in the OT Bridge System in an “All-on-Four” Rehabilitation Model in the Absence of One and Two Prosthesis Screws. Materials 2022, 15, 1582. [Google Scholar] [CrossRef]
- Pellegrino, G.; Basile, F.; Relics, D.; Ferri, A.; Grande, F.; Tarsitano, A.; Marchetti, C. Computer-Aided Rehabilitation Supported by Zygomatic Implants: A Cohort Study Comparing Atrophic with Oncologic Patients after Five Years of Follow-Up. J. Clin. Med. 2020, 9, 3254. [Google Scholar] [CrossRef]
- Mizushima, N.; Kohsaka, H.; Miyasaka, N. Ceramide, a mediator of interleukin 1, tumour necrosis factor alpha, as well as Fas receptor signalling, induces apoptosis of rheumatoid arthritis synovial cells. Ann. Rheum. Dis. 1998, 57, 495–499. [Google Scholar] [CrossRef] [Green Version]
- Lezcano, M.F.; Dias, F.J.; Chuhuaicura, P.; Navarro, P.; Fuentes, R. Symmetry of mandibular movements: A 3D electromagnetic articulography technique applied on asymptomatic participants. J. Prosthet. Dent. 2020, 125, 746–752. [Google Scholar] [CrossRef]
- Wiȩckiewicz, M.; Paradowska, A.; Kawala, B.; Wiȩckiewicz, W. SAPHO syndrome as a possible cause of masticatory system anomalies - A review of the literature. Adv. Clin. Exp. Med. 2011, 20, 521–525. [Google Scholar]
- Celeghin, G.; Franceschetti, G.; Mobilio, N.; Fasiol, A.; Catapano, S.; Corsalini, M.; Grande, F. Complete-Arch Accuracy of Four Intraoral Scanners: An In Vitro Study. Healthcare 2021, 9, 246. [Google Scholar] [CrossRef]
- Ortensi, L.; Sigari, G.; La Rosa, G.R.M.; Ferri, A.; Grande, F.; Pedullà, E. Digital planning of composite customized veneers using Digital Smile Design: Evaluation of its accuracy and manufacturing. Clin. Exp. Dent. Res. 2022, 8, 537–543. [Google Scholar] [CrossRef]
- Porwolik, M.; Porwolik, K.; Domagala, Z.A.; Woźniak, S.; Dąbrowski, P.; Kacala, R.; Kordecki, H.; Chmielewski, P.; Abu Faraj, S.; Gworys, B. Typology of the antegonial notch in the human mandible. Folia Morphol. 2015, 74, 365–371. [Google Scholar] [CrossRef] [Green Version]
- Kolodziej, R.P.; Southard, T.E.; Southard, K.A.; Casko, J.S.; Jakobsen, J.R. Evaluation of antegonial notch depth for growth prediction. Am. J. Orthod. Dentofac. Orthop. 2002, 121, 357–363. [Google Scholar] [CrossRef]
- Ghosh, S.; Vengal, M.; Pai, K.; Abhishek, K. Remodeling of the antegonial angle region in the human mandible: A panoramic radiographic cross-sectional study. Med. Oral Patol. Oral y Cir. Bucal 2010, 15, e802–e807. [Google Scholar] [CrossRef] [Green Version]
- Park, K.-R.; Kim, S.-Y.; Kim, G.-J.; Park, H.-S.; Jung, Y.-S. Anatomic study to determine a safe surgical reference point for mandibular ramus osteotomy. J. Cranio-Maxillofacial. Surg. 2014, 42, 22–27. [Google Scholar] [CrossRef]
- Klain, D.A. An Intuitive Derivation of Heron’s Formula. Am. Math. Mon. 2004, 111, 709–712. [Google Scholar] [CrossRef] [Green Version]
- Palmer, R. Fluctuating Asymmetry Analyses: A Primer. In Developmental lnstability: Its Origins and Evolutionary Implications; Springer: Dordrecht, The Netherlands, 1994; pp. 335–364. ISBN 9789401043571. [Google Scholar]
- Chole, R.H.; Patil, R.N.; Balsaraf Chole, S.; Gondivkar, S.; Gadbail, A.R.; Yuwanati, M.B. Association of Mandible Anatomy with Age, Gender, and Dental Status: A Radiographic Study. ISRN Radiol. 2013, 2013, 453763. [Google Scholar] [CrossRef] [PubMed] [Green Version]
- Kaczkowski, H.; Porwolik, K.; Porwolik, M.; Noga, L.; Woyton, H.; Domagala, Z.; Gworys, B. Anatomical analysis of preangular mandibular notch in humans. Folia Morphol. 2012, 71, 100–104. [Google Scholar]
- Polak, M. Developmental Instability: Causes and Consequences; Oxford University Press: Oxford, UK, 2003. [Google Scholar]
- Lorentowicz-Zagalak, M.; Przystańska, A.; Woźniak, W. The development of Meckel’s cartilage in staged human embryos during the 5th week. Folia Morphol. 2005, 64, 23–28. [Google Scholar]
- Parada, C.; Chai, Y. Mandible and Tongue Development. In Craniofacial Development; Elsevier: Amsterdam, The Netherlands, 2015; pp. 31–58. [Google Scholar]
- Wang, M. Antegonial Notching and the Pattern of Vertical Facial Growth. Ph.D. Thesis, University of Washington: Seattle, WA, USA, 2012. [Google Scholar]


| Feature | Mean [mm or mm2] | Min-Max [mm or mm2] | SD | Normality of Distribution |
|---|---|---|---|---|
| AB right | 37.75 | 17.56–56.00 | 6.81 | Yes |
| AC right | 24.26 | 9.38–47.21 | 6.10 | Yes |
| BC right | 13.88 | 6.73–23.25 | 3.21 | Yes |
| surface area right | 47.13 | 2.90–142.54 | 29.66 | No |
| indentation depth right | 2.37 | 0.16–5.73 | 1.21 | Yes |
| AB left | 36.52 | 16.81–61.06 | 6.99 | Yes |
| AC left | 23.72 | 10.69–53.25 | 6.40 | Yes |
| BC left | 13.15 | 5.76–45.16 | 3.78 | Yes |
| surface area left | 42.66 | 1.56–137.52 | 26.92 | Yes |
| indentation depth left | 2.20 | 0.12–40.69 | 3.09 | No |
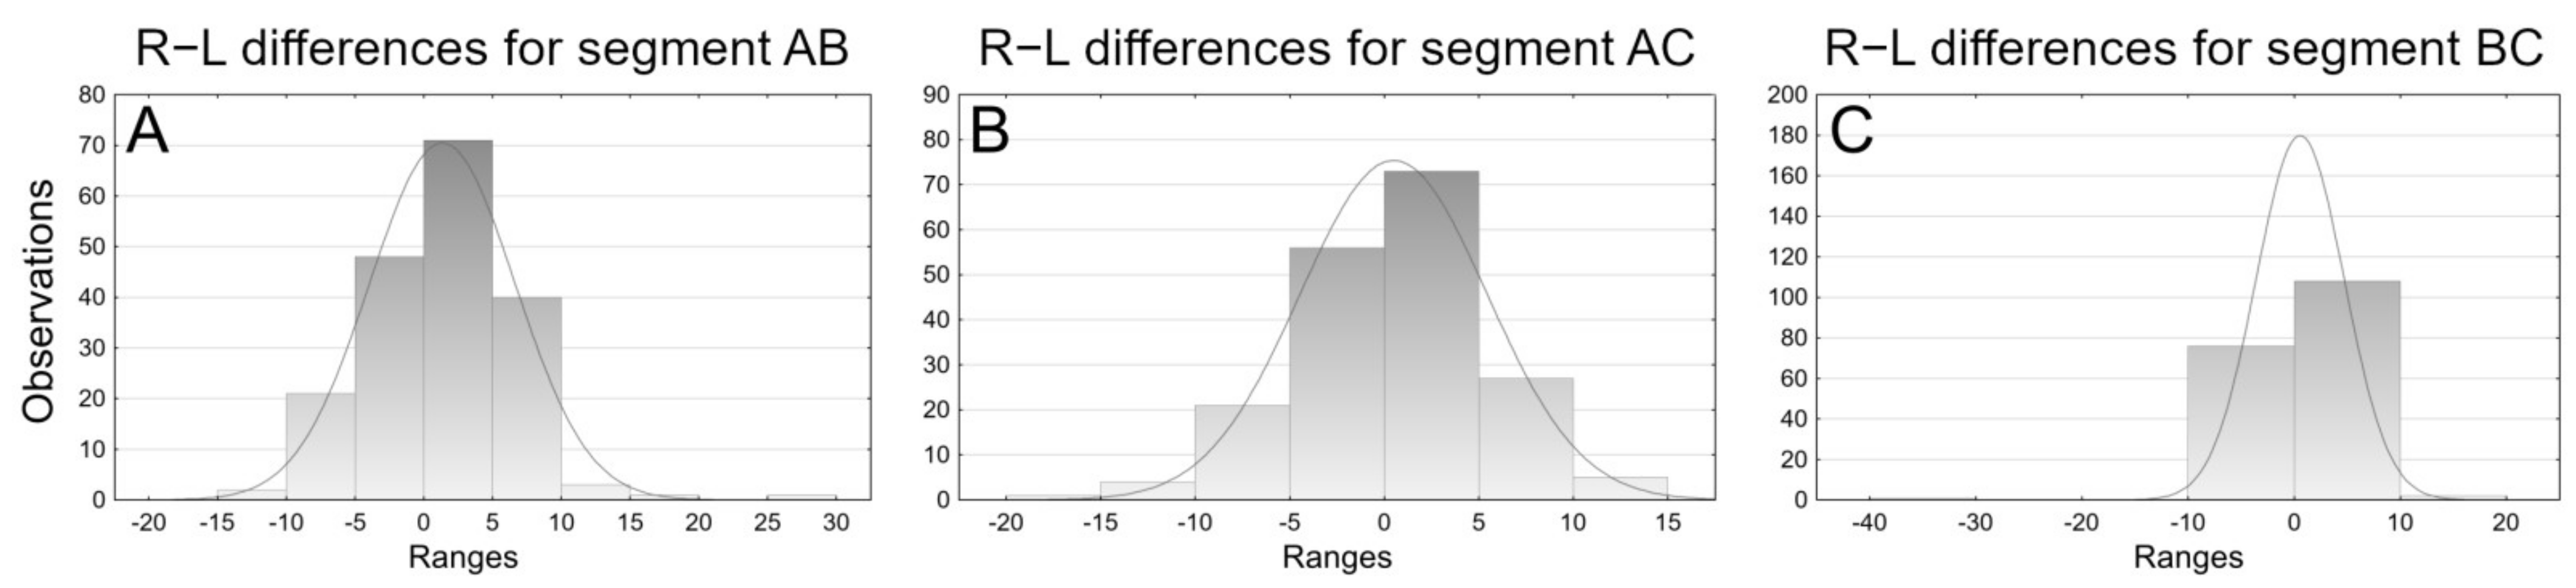
| Variable | Mean | Min-Max [mm] | SD [mm] |
|---|---|---|---|
| AB | 1.22 | −12.18–27.40 | 5.29 |
| AC | 0.54 | −15.97–11.81 | 4.94 |
| BC | 0.73 | −34.99–11.16 | 4.14 |
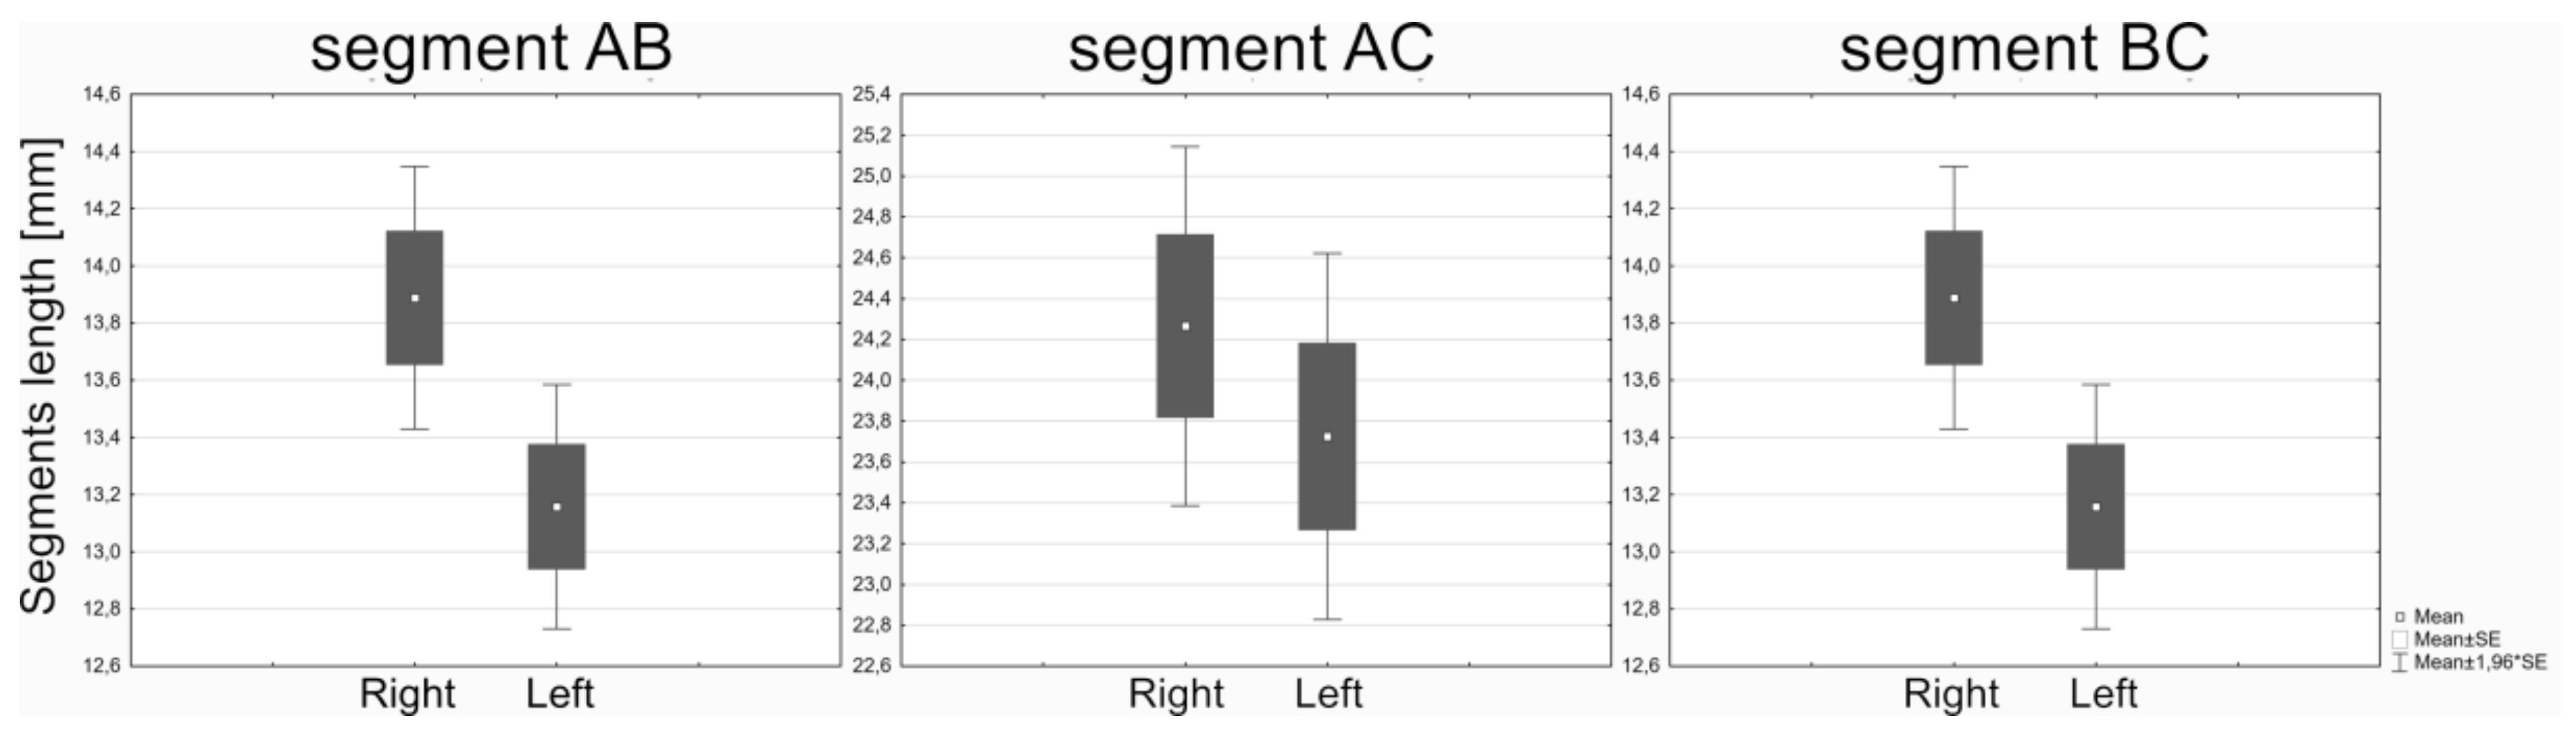
| Variable | Mean [mm] | SD [mm] | Mean Difference [mm] | t-Value | p | |
|---|---|---|---|---|---|---|
| Segment AB | Right side | 37.75 | 6.81 | |||
| Left side | 36.52 | 6.99 | 1.22 | 1.72 | 0.086 | |
| Segment AC | Right side | 24.26 | 6.10 | |||
| Left side | 23.72 | 6.40 | 0.54 | 0.84 | 0.399 | |
| Segment BC | Right side | 13.88 | 3.21 | |||
| Left side | 13.15 | 3.78 | 0.73 | 2.28 | 0.022 |
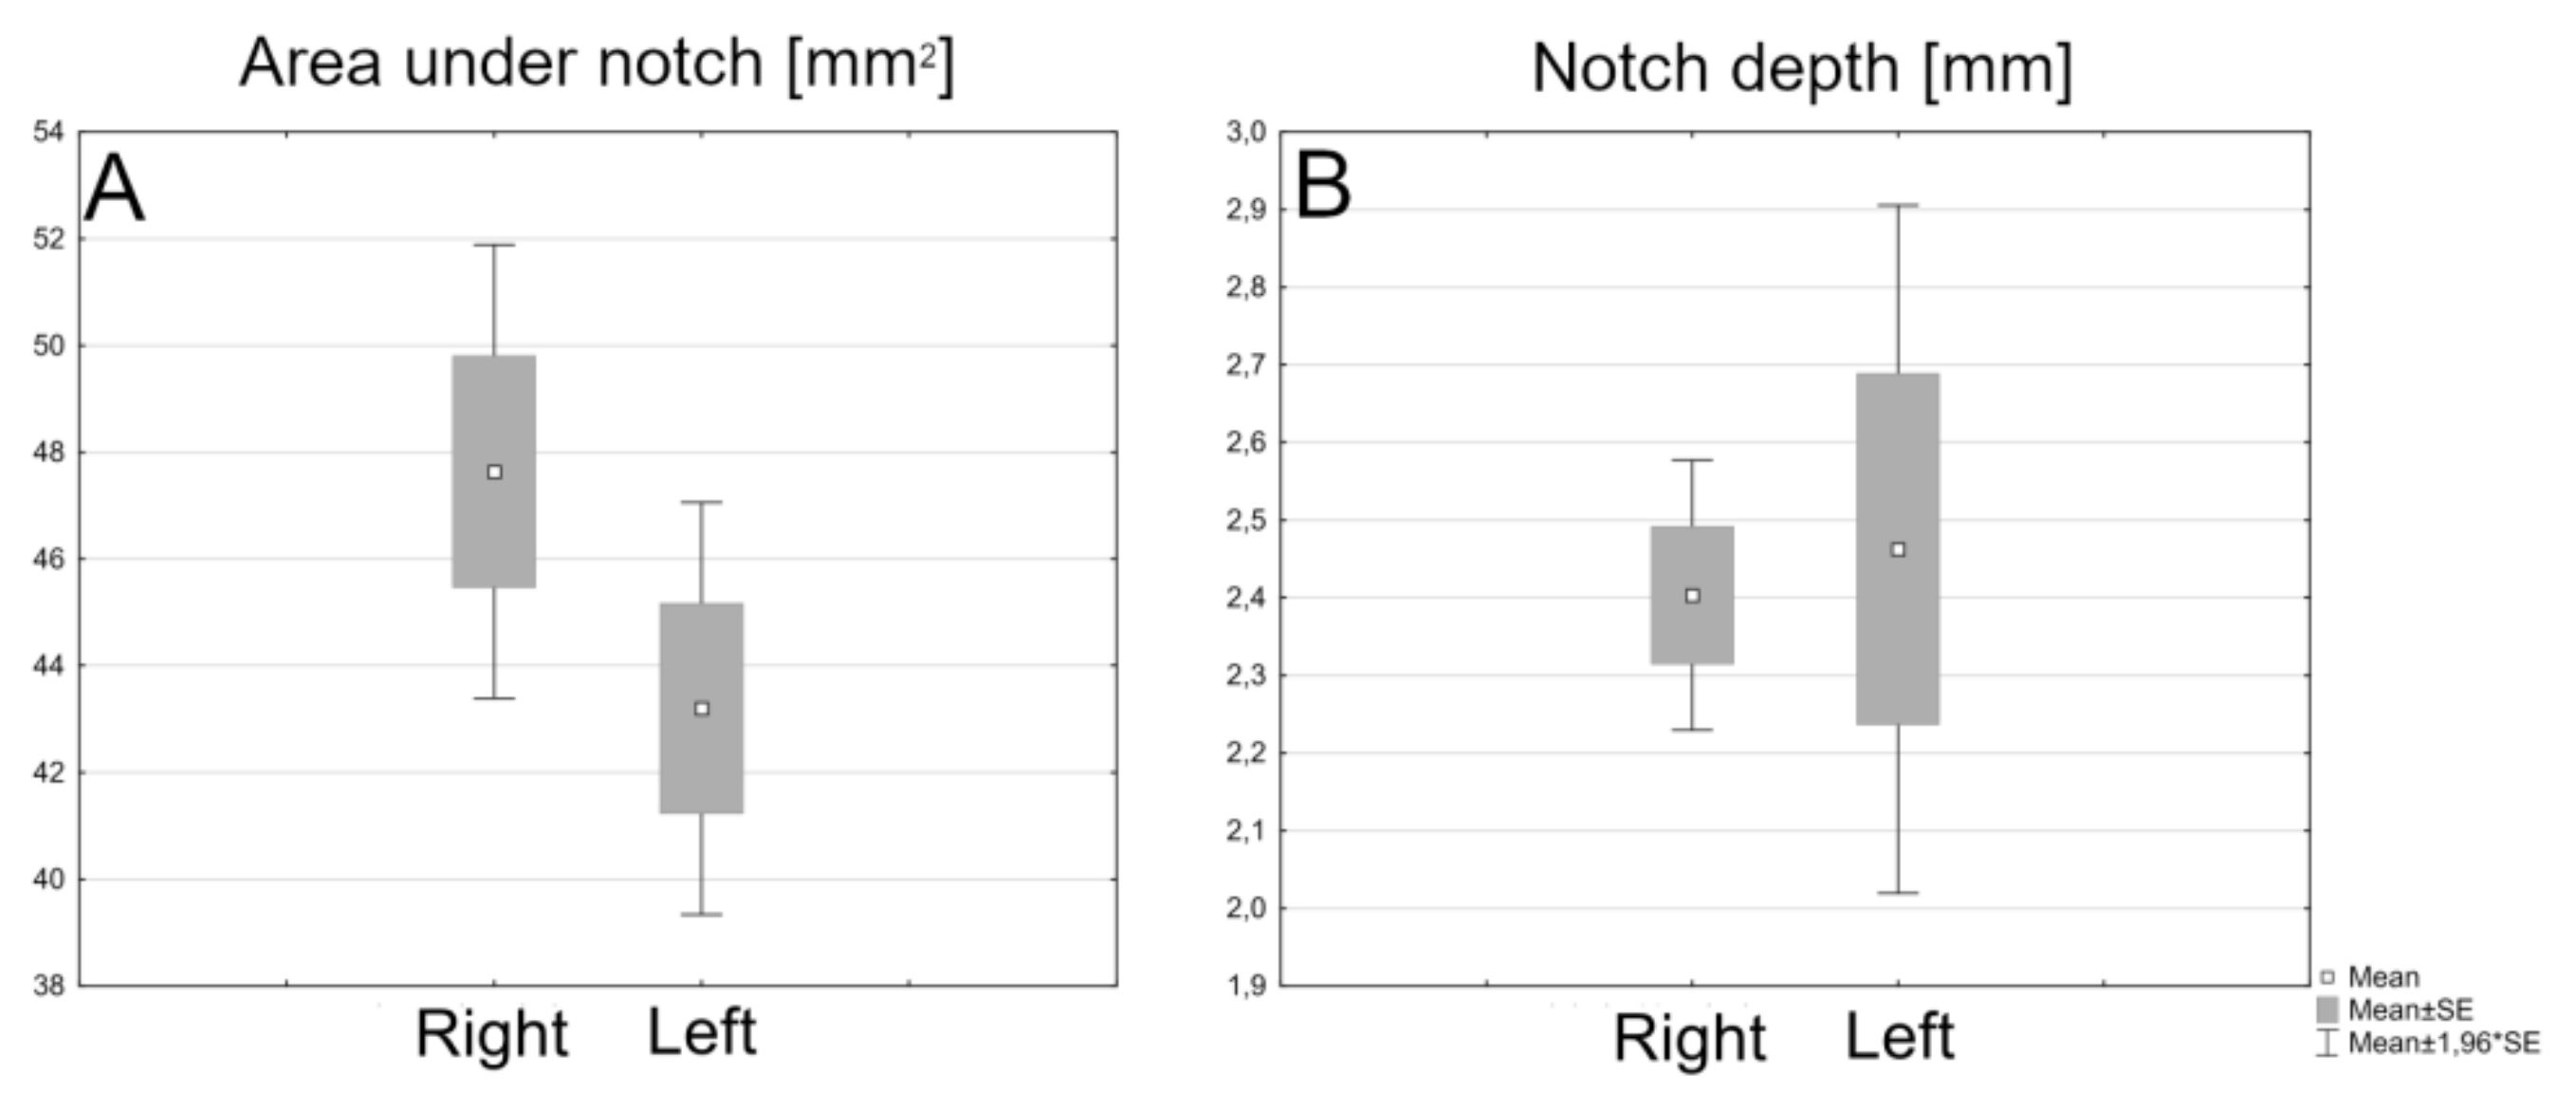
| Variable | N | Mean Diff. (SD) | T | Z | p |
|---|---|---|---|---|---|
| Area under notch [mm2] | 187 | 4.48 (24.53) | 7030.0 | 2.265 | 0.030 |
| Notch depth [mm] | 187 | 0.09 (1.03) | 7247.0 | 1.970 | 0.071 |
| Variable | Mean [mm or mm²] | Min-Max | Std.Dev. |
|---|---|---|---|
| FA1 for segment AB | 4.16 | 0.06–15.31 | 2.93 |
| FA1 for segment AC | 3.83 | 0.00–13.73 | 2.87 |
| FA1 for segment BC | 2.54 | 0.00–11.16 | 2.08 |
| FA1 for notch area | 18.50 | 0.30–91.87 | 16.68 |
| FA1 for notch depth | 0.80 | 0.00–3.66 | 0.68 |
| FA2 for segment AB | 0.11 | 0.00–0.36 | 0.08 |
| FA2 for segment AC | 0.16 | 0.00–0.51 | 0.11 |
| FA2 for segment BC | 0.19 | 0.00–0.72 | 0.14 |
| FA2 for notch area | 0.47 | 0.01–1.66 | 0.37 |
| FA2 for notch depth | 0.41 | 0.00–1.62 | 1.62 |
Publisher’s Note: MDPI stays neutral with regard to jurisdictional claims in published maps and institutional affiliations. |
© 2022 by the authors. Licensee MDPI, Basel, Switzerland. This article is an open access article distributed under the terms and conditions of the Creative Commons Attribution (CC BY) license (https://creativecommons.org/licenses/by/4.0/).
Share and Cite
Mączka, G.; Kulus, M.J.; Grzelak, J.; Dobrzyński, M.; Staniowski, T.; Skośkiewicz-Malinowska, K.; Dąbrowski, P. Symmetry and Asymmetry of the Antegonial Notch. Symmetry 2022, 14, 1558. https://doi.org/10.3390/sym14081558
Mączka G, Kulus MJ, Grzelak J, Dobrzyński M, Staniowski T, Skośkiewicz-Malinowska K, Dąbrowski P. Symmetry and Asymmetry of the Antegonial Notch. Symmetry. 2022; 14(8):1558. https://doi.org/10.3390/sym14081558
Chicago/Turabian StyleMączka, Grzegorz, Michał Jerzy Kulus, Joanna Grzelak, Maciej Dobrzyński, Tomasz Staniowski, Katarzyna Skośkiewicz-Malinowska, and Paweł Dąbrowski. 2022. "Symmetry and Asymmetry of the Antegonial Notch" Symmetry 14, no. 8: 1558. https://doi.org/10.3390/sym14081558
APA StyleMączka, G., Kulus, M. J., Grzelak, J., Dobrzyński, M., Staniowski, T., Skośkiewicz-Malinowska, K., & Dąbrowski, P. (2022). Symmetry and Asymmetry of the Antegonial Notch. Symmetry, 14(8), 1558. https://doi.org/10.3390/sym14081558