Article

Numerical Model Validation for Detection of Surface Displacements over Twin Tunnels from Metro Line 1 in the Historical Area of Seville (Spain)

by
Maziyar Bahri
1,
Emilio J. Mascort-Albea
1,*,
Rocío Romero-Hernández
1,
Mohammadreza Koopialipoor
2,
Cristina Soriano-Cuesta
1 and
Antonio Jaramillo-Morilla
1
1
Departamento de Estructuras de la Edificación e Ingeniería del Terreno, Escuela Técnica Superior de Arquitectura, Instituto Universitario de Arquitectura y Ciencias de la Construcción, Universidad de Sevilla, Avenida de Reina Mercedes 2, 41012 Sevilla, Spain
2
Department of Civil and Environmental Engineering, Amirkabir University of Technology, Tehran 15914, Iran
*
Author to whom correspondence should be addressed.
Symmetry 2022, 14(6), 1263; https://doi.org/10.3390/sym14061263
Submission received: 20 May 2022 / Revised: 14 June 2022 / Accepted: 15 June 2022 / Published: 18 June 2022
(This article belongs to the Special Issue Applied Mechanics, Engineering and Modeling)

Abstract

:
In order to solve connectivity problems in metropolitan areas, the development of underground metro lines constitutes an unquestionable requirement. However, the construction work thereof encounters unfavourable circumstances when surface excavations must be carried out that cross historical areas of the city, due to the need to control surface movements. The design of the metro in the city of Seville (Spain) from 2004 to 2006 provides a representative example of this situation and triggered major upheavals that exerted repercussions on historical buildings. For these reasons, the excavation stages of Line 1 of this metro have been simulated by numerical methods using FLAC3D software and validated with the results provided by the real conditions. Consequently, various surface settlements have been evaluated by taking not only variates of the main parameters that characterise the soil of Seville, but also of the various load situations and excavation conditions. Notable results have been achieved through calibration of 54 variants of the same model corresponding to Line 1, and their comparison with the real results obtained in nine critical areas of the itinerary. The results obtained have made it possible to determine the effects of excavation on the subsoil of the city of Seville with great accuracy, since the percentage error of calculated vertical surface movements varies from 0.1% to 5.3%.

1. Introduction

Today, 55% of the world’s population lives in cities and highly densified metropolitan environments; an upward trend thereof has been predicted by major international organisations [1]. The obvious problems resulting from this population concentration materialise as traffic congestion, air pollution, and greenhouse gas emissions, which have led to a global climate emergency. For these reasons, the use of the subsoil holds the key to sustainability strategies for urban environments, through underground mobility [2] and the use of underground urban space [3,4].
Nevertheless, the construction of underground tunnels inherently results in varying degrees of ground movement towards excavation, thereby generating settlements of the ground surface [5]. This type of excavation can exert a detrimental effect on adjacent structures and pose environmental hazards if the produced horizontal and vertical movements are not controlled [6]. Such circumstances can be detected through the identification of critical areas in urban environments [7].
This problem is accentuated in historical cities due to the remarkable number of old buildings with highly vulnerable structures and construction systems [8]. In this type of context, the limitation of movements caused by underground excavations can become a key factor when operations are carried out in environments in close proximity to monumental complexes of great heritage value [9,10]. Consequently, there are numerous examples of recent research that have investigated historical structures that have been damaged during mechanised excavation [11,12,13,14]. These issues were revealed during the excavation work for Line 1 of the Seville metro (Spain) undertaken between 2004 and 2006. In this case, the excavated tunnels crossed the consolidated city through points of its main historical area, some of which were in close proximity to its UNESCO World Heritage Site. The damage caused by the movements produced was significant at certain critical points along the route [15]. This explains the need for strategies to be established to control the movements caused on the surface by means of predictive methods that enable the critical areas of future excavations in historical urban environments to be determined.
Among the main calculation methods developed in recent years, the use of empirical methods, capable of generating simplified formulations, stands out. Additionally noteworthy is the use of numerical models, the different variants of which are currently widely used. In both cases, one of the most illustrative results is the calculation of the surface settlement curve, which can reflect the surface influence of the excavation [16]. Highly accurate values of the settlement curve can be obtained by using sophisticated numerical models that are capable of considering a notable set of parameters for their calculation. These models are based on numerical methods that have similarities and differences through a common mathematical approach [17]. These include the use of Finite Difference Method (FDM), Finite Element Method (FEM), and Finite Volume Method (FVM).
Recent advances in computational technologies have made it possible to implement such methods for the modelling of complex geotechnical problems [18]. Consequently, through the development of different software, it is possible to determine the calculation of surface settlement curves through the application of FDM [19], FEM [20], and FVM [21] through different approaches and computer software. The accuracy of the results obtained shows that the simulated cases can be very specific, and that the range of parameters and criteria to be used is strongly conditioned by the conditions of each investigation. Consequently, one of the most important issues in the design of numerical calculation models is the selection of the parameters and calculation conditions utilised in obtaining the surface settlement curve. In this respect, the main factors to be considered are those related to the geometry of the tunnels, the excavation processes and the properties of the soil.
The most influential tunnel design conditions in the simulation excavation process in numerical modeling are related to the geometry of the lining. For instance, curve lining has to deal with more stress and strain. Hence, the surface settlement thereof is greater than in other places. Regarding this issue, the analysis of the interaction and settlement in a curved section in mechanised excavation constitutes a highly relevant research topic [22,23,24]. Another main geometric factor for the calculation of tunnels is the dimension of tunnels. In these situations, conditions such as the depth, diameter, and distance of the tunnels constitute the essential parameters for this question in numerical modeling [25,26]. Initially, the excavation depth of tunnels is a decisive factor in the generation of surface settlement, and a threshold value of 16 m depth is determined for their mitigation [27]. Similarly, the existence of shallow tunnels is considered from excavation depth values of 10 m [28]. Concerning the diameter factor, Chakeri et al. [29] showed that mechanised excavation of a tunnel with a large diameter leads to increased maximum surface settlement. In this respect, Zheng et al. [30] studied the interaction between large-diameter tunnels and small-diameter tunnels, and illustrated the difference in bending moment and stress interaction of different diameters. Finally, the separation between tunnels should be indicated as a further factor to be considered. In this respect, Suwansawat and Einstein [31] studied the relationship between the maximum values of the surface settlements provided by the Gaussian curves and the distance between tunnels. Similarly, recent research illustrates that the spacing of twin tunnels is also a relevant factor when the separation thereof is less than 20 m [32,33,34].
All mechanised excavation of TBM methods follows steps through a procedure that can be simulated in numerical modelling. In the estimation of the surface settlement induced by mechanised excavation using EPB techniques, the stages of the excavation should be simulated in a highly accurate way since the tunnelling-related risk scenarios. Additionally, the weight of EPB, and the properties of the lining are also implemented in the numerical models. By bearing all these factors in mind, high-precision surface settlement and interaction parameters can be determined over twin tunnels in shallow urban areas by simulation in the numerical models, through investigations that have been conducted to simulate EPB excavations and the interaction effect thereof in underground areas [35,36,37,38,39,40,41]. Face pressure and grout pressure are the main effective factors of mechanised excavation in EPB-TBM. In this regard, very recent studies illustrate the influence of these factors on the instability of the face of excavation and on tension interaction with soil [42,43]. Furthermore, Forsat et al. [32] showed that surface settlement has an indirect relationship with face pressure and grout pressure of EPB. There are also other factors in the excavation process that can be considered in the simulation results. Certain properties of the EPB machinery, such as the weight of its components and the lifting forces, have been included in research focused on the simulation of surface settlements [40,44]. Alongside excavation factors, the lining precast must be simulated precisely. In this case, the interaction between segments, the interface stiffness, and the axial joint of the lining have additionally been considered in underground excavation in recent research [45,46].
Soil properties and constitutive models of soil are important factors to consider in the numerical simulation of tunnel excavations. In this respect, Mohr–Coulomb models have been widely used in designing underground excavation in soil [8,18,41]. Several researchers have used a modified Cam–Clay model for the development of their numerical simulations [47,48,49], while others have analysed numerical models using the Plastic-Hardening (PH) model. This model is usually adopted as the constitutive model of soft clay and was established for tunnelling excavation problems [50,51,52]. Likewise, groundwater conditions must not be overlooked as a clear influencing factor. Shivaei et al. [53] studied both the drainage condition of the grout layer in mechanised excavation and the difference in surface settlement by changing the soil permeability and water table level. They concluded that with lowering the water table, the surface settlement decreased. Complementarily, Mu et al. [27] investigated the soil parameters and ground settlement during the excavation for the metro with EPB, and they declared that the rate of soil friction angle and soil cohesion have an indirect relationship with ground displacement.
Finally, it must be mentioned that the interaction between tunnel lining and surface condition acts on the loading of the tunnel lining and ground displacement. One of the most evident factors involves the burden loads from buildings and traffic, which have been widely analysed [8,54,55,56]. Concerning this parameter, Chakeri et al. [29] divided the surface load into traffic load and building loads and applied all these loads as surcharges to the surface of the 3D numerical model, by considering 20 kN/m2 and 30 kN/m2, respectively. Similarly, the geometric, structural, and constructional properties of the pre-existing building that is located above ground can also be considered through the use of stiffness factors [57,58].
In this research, surface settlement changes during the range of excavation properties and soil properties were studied during the underground excavation by EPB in Seville. One of the innovations of this paper compared to previous research is studying the surface settlement based on the real soil and excavation properties of Seville. Thus, this research aims to evaluate the predictive potential of the results from numerical model calculations of surface settlement in historic urban environments caused by EPB-TBM twin tunnel excavation processes. In this way, and in anticipation of the future execution of Lines 2, 3, and 4 of the Seville metro, which will affect the city even more extensively, this research raises awareness for the need to develop predictive strategies that will enable detection of those more critical areas. For this reason, a numerical model based on the monitoring data gathered during the construction of Seville metro Line 1 has been designed to simulate the executed excavations.
This paper is therefore organised as follows: an introduction regarding the selected parameters and the characteristics of the case study (Section 2) are first given, followed by an explanation of the processes developed for the simulation of the numerical model (Section 3), and a discussion of the results attained regarding the validation of the model and the statistical potential of the data obtained for the detection of vulnerability zones in historical cities (Section 4). Conclusions are then drawn, with a view to the future lines of research generated by this work (Section 5).

2. Case Study: Critical Points from Line 1 of the Metro of Seville

The city of Seville, with a metropolitan population of approximately 1,500,000 inhabitants and an area of 4905.04 km2 [59], is the fourth largest metropolitan area in Spain and the capital of the autonomous region of Andalusia. Historically conditioned by the Guadalquivir River, Seville contains one of the most extensive and valued historical sites in Europe and hosts a UNESCO World Heritage Site in its urban centre [60], as well as numerous heritage buildings and archaeological remains.
In this respect, its metropolitan conditions imply the need to improve its territorial connectivity through the development of an underground connection network project [61]. Nevertheless, since the second half of the 20th century, the development of this work has experienced numerous interruptions and delays due to a variety of causes, including the historical nature of the city and the conditions of its subsoil [62].

2.1. Geotechnical Site Characterisation

The metropolitan territory of Seville is located on soft alluvial soils found in the valley of the Guadalquivir River. In this respect, the city of Seville has a flat topography and is situated at an average height of 7 m above sea level. Local and regional geotechnical studies agree on the determination of a typical stratigraphic profile to define the composition of the subsoil in the study area [63,64], and this approach was assumed in the design models used in the construction of Line 1 of the Seville metro [65].
These studies also indicate that there is marked variability in the ranges of values that characterise the defined strata, and assume that the sequence of the layers indicated undergoes variations as a consequence of the different modifications made to the course of the Guadalquivir River as it passed through the city of Seville. By means of the above assumptions and based on the geotechnical studies derived from the different project phases of the Seville underground network, it can be affirmed that the stratigraphy employed in the development of this research shows the mechanical and resistant parameters as indicated in Table 1.
In this respect, it is worth highlighting the great importance of the thickness of the layer of anthropic fills in the main areas of the historical city, which can record building remains more than two millennia old. This layer is composed of heterogeneous materials whose behaviour is difficult to control. In the same way, it is common for the strata relating to clays and sands to appear intermixed, and with usually medium and low values of resistance. The resistance increases with the presence of the gravel strata at a greater depth, and additionally, the presence of loams of high resistance and very low permeability constitute the geological substratum that forms the base of these alluvial soils. Finally, it should be pointed out that the proximity to the river, the low average height and the existence of numerous aquifers mean that the presence of groundwater is usually in very close proximity to the surface.

2.2. Seville Metro Line 1 Main Difficulties

Based on the aforementioned conditions, the general design of the Seville metro network was drafted at the beginning of the 21st century [66]. The complete proposal comprised a total of four metro lines, the layout of which is organised as follows: Lines 1 and 2 cross the metropolitan area in an east-west direction, by going to the Guadalquivir River, with the particularity that Line 2 crosses the central area of the city of Seville completely and Line 1 is displaced to the south. In a complementary manner, Line 3 has a north-south orientation and Line 4 has an annular and closed geometry (Figure 1). Twenty years later, the implementation of the project is still incomplete and only Line 1 has been executed (years 2004 and 2006). This experience has illustrated the main difficulties faced by the project and the challenge it still poses today.
The twin tunnels of Seville metro Line 1 have a diameter of 6.35 m and a separation distance of 6.00 m, with a longitudinal development that allows a maximum slope of 4% in the steepest sectors. Based on these geometrical conditions, the tunnels were excavated to a shallow depth using an EPB-TBM LOVAT machine with a maximum thrust of 40,000 kN and a maximum torque of 600 kN × m. During this process, the lining of the tunnel was reinforced with precast concrete, and each circular ring of the tunnel lining comprised six quadrilaterals with a thickness of 0.25 m and a length of 1.6 m [67]. Additionally, the most peripheral sections of the route were designed to lie above ground and the excavation of the various stations was carried out using reinforced concrete screens [65]. In this respect, the main adversities encountered during the excavation work were related to the underground crossing of the river and the main civil infrastructures, the interruptions in excavation, the influence of groundwater, the difficulties caused by the existence of archaeological remains in the areas of the historical city, and the many movements caused in numerous buildings in close proximity to the excavation route [15].

2.3. Selection of Critical Areas

The aforementioned circumstances made it possible to identify the main problems to be solved for the future construction of Lines 2, 3, and 4 of the Seville metro. In this way, a set of critical areas belonging to the completed Line 1 has been established that are representative of the problems addressed in this research (Figure 2).
An analysis of critical areas has long been recognised as a necessary step in the study of ground displacement. Six zones have been selected as the starting point for this research, and corresponding numerical models were developed and validated in these locations using real data. These areas are in densely populated areas adjacent to historical locations or metro stations where real-time ground displacement was monitored, and these critical points demonstrate the validity of the numerical model. Nervión (A), San Bernardo (B), San Sebastián (C), Puerta de Jerez (D), Plaza de Cuba (E), and Parque de los Príncipes (F) are the selected critical areas.
Moreover, it should be borne in mind that the Seville metro tunnel was excavated through different soil layers. The tunnel’s depth and the type of soil in which it is excavated are listed in Figure 3b. The thickness of the soil layer varies in each critical area, which has been considered in the various models. Three points were chosen on the surface to be monitored; two were placed along the tunnel’s central axis, and the third was placed at the centre point between the tunnels showing a symmetrical geometry (Figure 3a).
Finally, it has been considered that several previous studies have employed the Mohr–Coulomb and Cam–Clay constitutive models to describe the soil layer [24,46,68,69,70,71]. Despite the Hardening Soil model (HS) being recommended for the prediction of the behaviour of soils during geotechnical excavations [8,72], the Mohr–Coulomb constitutive model was employed in this research to simplify the numerical calculation. Nevertheless, the precast lining was assumed to have an elastic constitutive model. The properties of the soil layers, the segmental lining, and the EPB characteristics are summarised in Table 2 and Table 3.

2.4. Dimensions of the Model and Boundary Conditions

The model’s dimensions were critical in this study, since they needed to be sufficiently large to avoid boundary effects in numerical simulations. Previous researchers have employed the following values to estimate the model’s minimum dimensions: H + 4D for the height of the model, H + 3D for its length, and 6H for the width of the model [68], where H denotes the depth of the model’s axis, and D denotes its diameter. FLAC3D was utilised to create a complete three-dimensional layout of the twin tunnels of the first line of the Seville metro, which measures 55 m in height, 86 m in width, and 40 m in length. The 3D finite-volume model of the tunnel and excavation area was designed with height Z, length Y, and width X. Additionally, the tunnel was excavated in the direction of Y in the model’s centre (Figure 4).
Each of the six geometries of underground simulation has a different number of nodes. Nevertheless, the size ratio of these meshes throughout the geometry remains the same. The model of San Bernardo (B), with 260,640 zone numbers and 271,350 grid points, covers most of the zone and grid points. On the other hand, the model of Plaza de Cuba (E) and Parque de los Príncipes (F) has fewer zone and grid points, with 242,080 zone numbers and 252,234 grid points, respectively.
The surface of the model is left free, thereby allowing for the measurement of vertical movement on the surface, while considering the boundary condition. The Y-Z-plane boundary nodes (X = −49 and X = 37) and the X-Z-plane boundary nodes (Y = 0 and Y = 40) are fixed in the normal direction, while the lower boundary is fixed in the vertical direction. It should be noted that the mesh density was increased around the tunnel and decreased as one moved away from the tunnel. This would improve the model’s accuracy and speed [40,46].
The 1 centres of the first and second tunnels are located at X = 0 and X = −12, respectively. Therefore, X = −6 is located in the twin tunnels’ centre point: these points are highlighted in Figure 2. Study points are assigned to the surface of each geometry at X = 0, −6, and −12 to investigate surface settlement in this study. On the surface of the numerical model, the uniform traffic load (live load) and the building load (dead load) are considered. Additionally, in each model, a different load is applied (20, 70, and 130 kPa). Thus, 130 kPa is assumed in the densely populated area, while 70 kPa is assumed in the normally populated area of Seville, and 20 kPa is recommended for locations with the lowest rate of buildings and traffic. To this end, it has been assumed that this method simplifies the creation of a model [53]. Two distinct methods are considered when determining the weight of the buildings [29,57]. Moreover, pore pressure is used to simulate the water condition in excavation simulations.

3. Simulation Processes

Mechanised tunnelling in shallow soil requires careful excavation in stages. This process entails the penetration of the EPB Shield, by applying face pressure to the soil and the injection of grout, and by installing the precast lining. These factors must be considered when simulating mechanised excavation in FLAC3D. Multiple researchers have incorporated these variables into their numerical model [73,74,75,76,77]. The progression of EPB advancement in Seville has been modelled in this study, and an attempt has been made to model it using significant factors from the step-by-step excavation. The following summarises the simulation of the mechanised excavation in Seville.
The metro system in Seville consists of twin tunnels, each of which is excavated in 50 steps, giving a total of 100 steps. When twin tunnels were excavated with two EPB machines in the same direction but with a delay, the distance between the shields of the two EPB machines was critical in the simulation [78]. In contrast, the twin tunnels in the Seville metro were excavated by a single EPB machine in a time-delayed manner. Using this method, one of the tunnels (Tunnel A) was excavated by an EPB machine, and the EPB machine returned in the opposite direction of Tunnel A, subsequently excavating Tunnel B. Thus, it is clear that the surface and ground had time to rebalance between the excavations of Tunnel A and Tunnel B, since the time interval between the two excavations exceeded one whole year, as determined by monitor data. In the end, two tunnels were excavated symmetrically. The twin tunnels were excavated in the Y-axial direction, 6 m apart. The EPB shield penetrated the soil in the first step of the excavation, and face pressure was applied (Figure 5a). Since the length of the EPB machine is 15 m following this portion of the excavation (Figure 5b), soft grout was added behind the EPB shield (Figure 5c). The precast lining was subsequently installed with a length of 1.6 m, as shown in Figure 5d. After one further step of excavation, the grouting pressure was removed, and the grout began to dry. This cycle was repeated until the EPB machine could be removed from the geometry and the tunnel lining was completely implanted (Figure 5e,f). Face pressure, grout pressure, the lining, and the EPB shield are illustrated in Figure 6, whereby dried grout and injected grout are highlighted in red and yellow, respectively. Moreover, the EPB shield is drawn with a blue line.

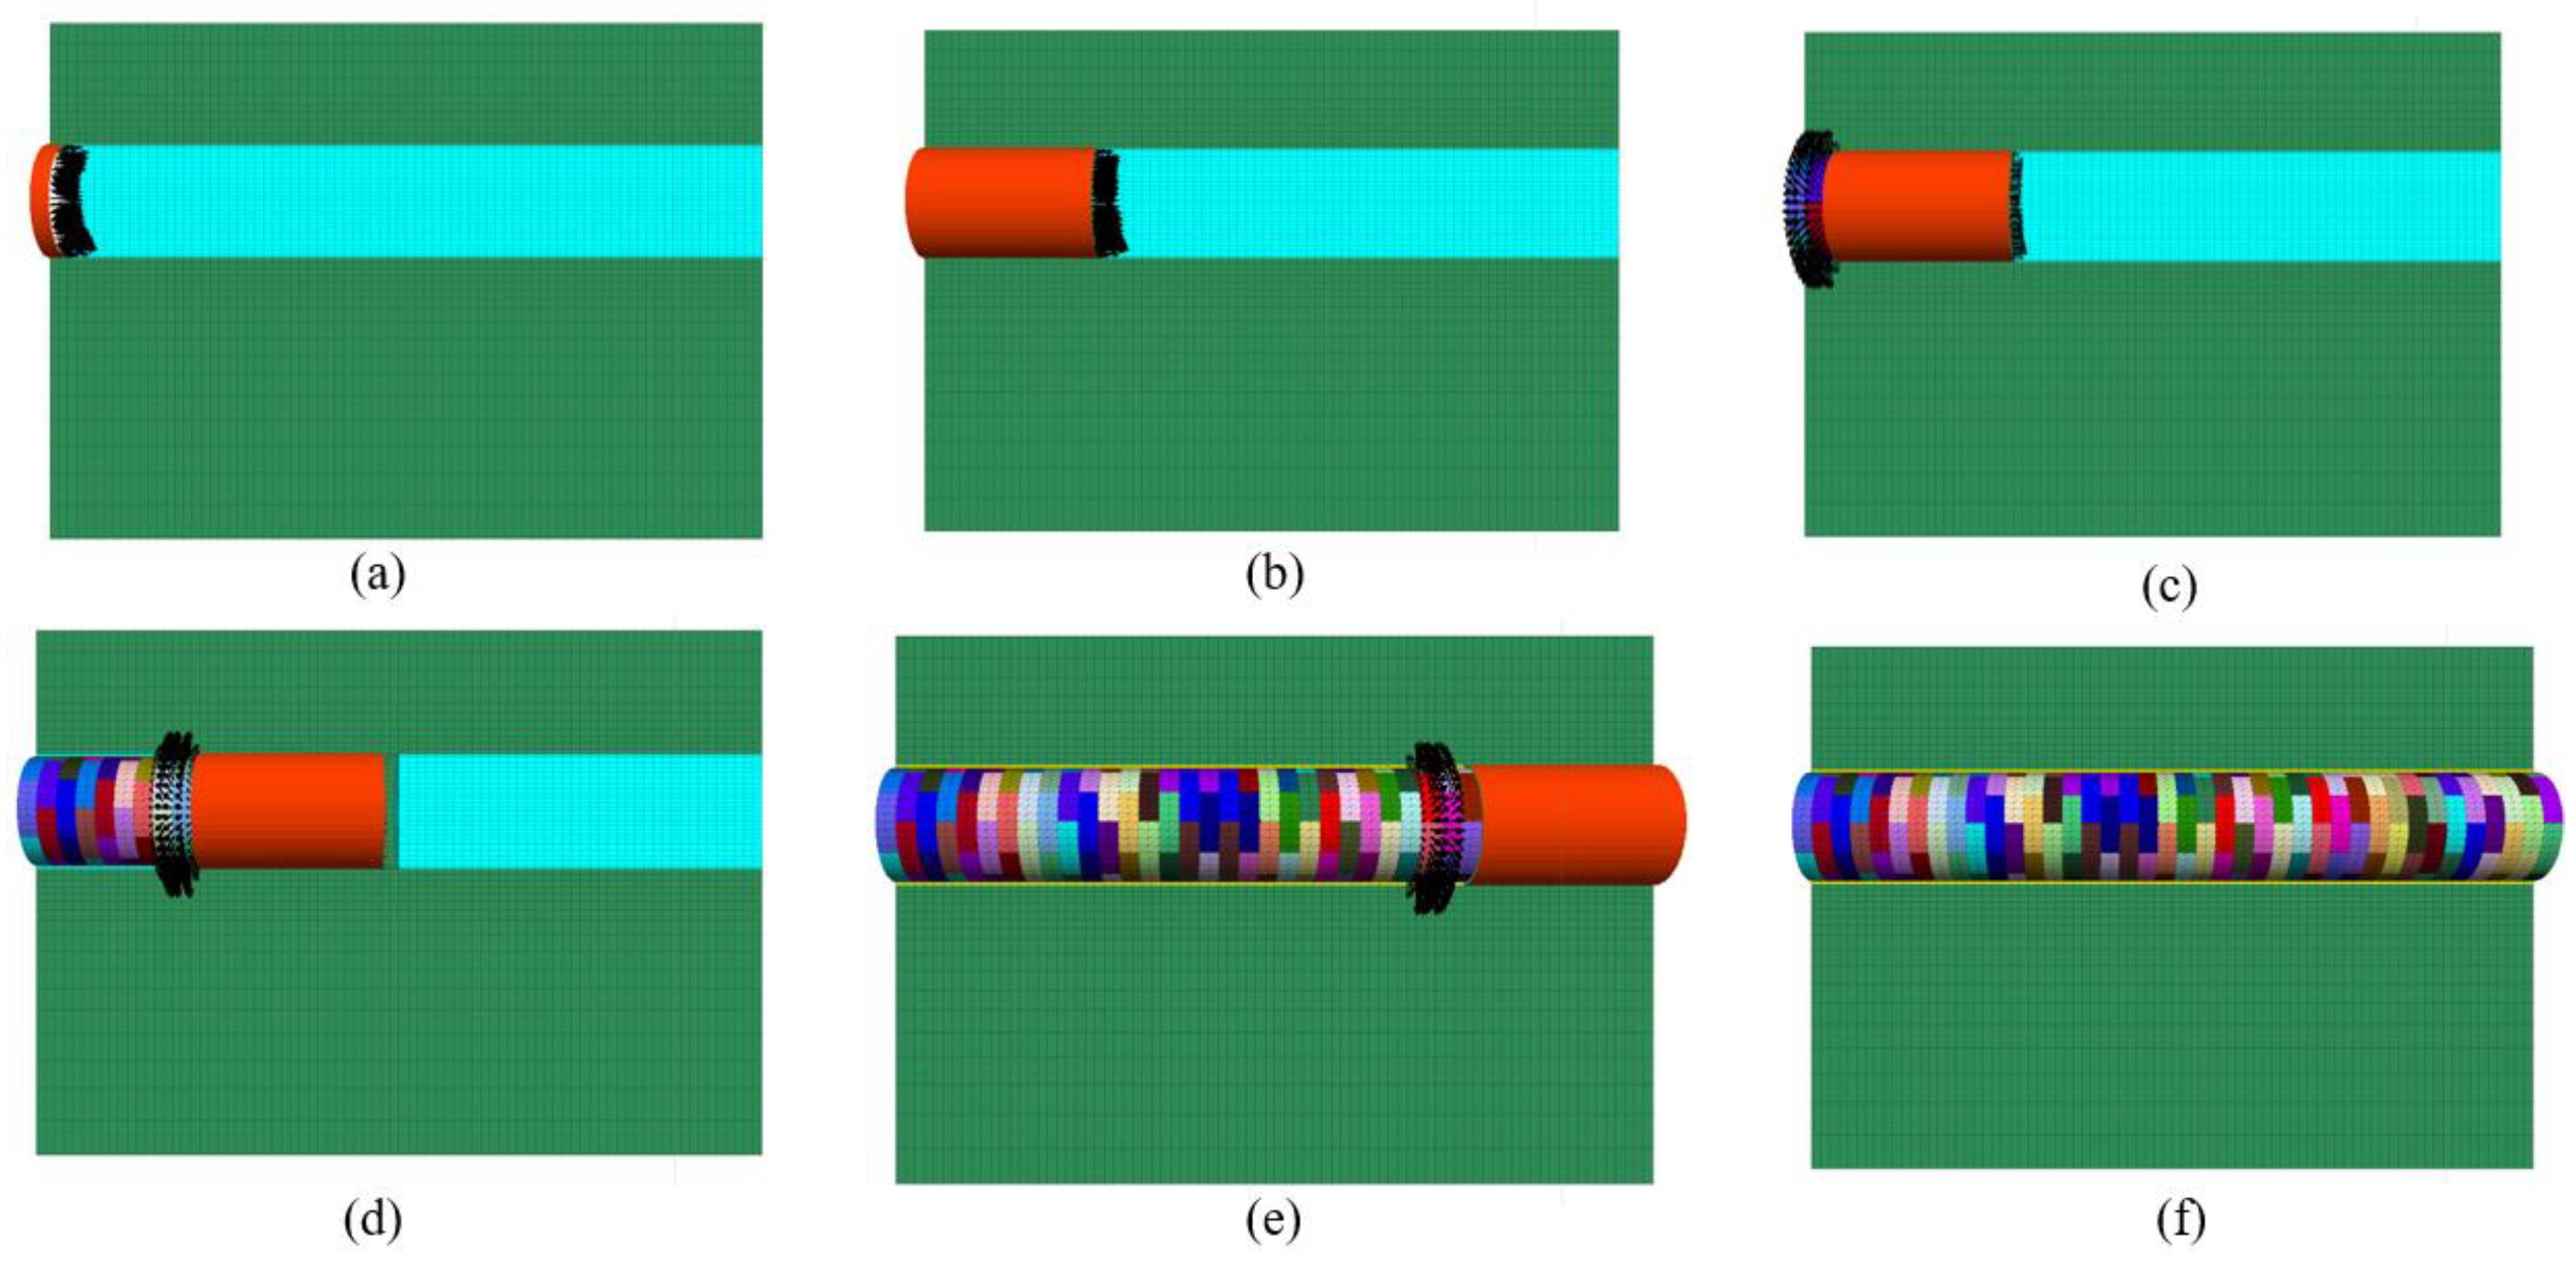
3.1. Numerical Simulation of the EPB’s Shield

During mechanised excavation, the stability of the tunnel face is critical, especially in the shallow tunnels. Since the EPB shield is subject to the stress and strain of excavation, it must be simulated precisely [25]. Face pressure and EPB shape are two parameters that can be investigated for the EPB shield.
The EPB face pressure has been simulated by applying a trapezoidal distribution of horizontal stress to the tunnel face; this pressure should prevent the surface of tunnels from collapsing and should be greater than the pore pressure and vertical stress [53,69,79]. In numerical studies, the standard method to ascertain the EPB face pressure involves the use of the vertical stress ( σ v ) on the excavation area applied in the horizontal direction at the tunnel axis. This applied pressure ( σ t ) is denoted by the equation σ t = K 0 + σ v , where K 0 is the coefficient of lateral earth pressure, and σ v is the overburden pressure [33,80,81,82]. According to our study, the face pressure at the tunnel axis is 250 kPa, and its gradient is 1500 Kg/m3, based on reporting data from previous excavations and a study on the EPB effect on ground displacement. However, in order to investigate the effects of EPB on vertical displacements, the axial pressure in the centre was increased to 300 kPa. Figure 6 illustrates the trapezoidal spread of the face pressure applied.
The EBP shield comes into direct contact with the soil during the excavation, and hence modelling the interaction of the EPB shield with the soil was critical to this research. As previously stated, the EPB shield is conical in shape, and it is recommended to vary the EPB stiffness in each section of excavation when modelling this aspect of the EPB shield. This aspect can be modelled by changing Young’s modulus of EPB and multiplying it by ten in each section. Certain researchers have recently published a relevant paper expressing this viewpoint, and the findings are consistent with data collected during the actual excavation [40,53]. The EPB shield is divided into several sections in this method, and the conical shape is simulated by varying Young’s modulus in each section. To this end, the Young’s modulus value of the front shield should be lower than that of the surrounding soil; as a result, Young’s modulus values of the other shield’s components should be increased. The shell is divided into five equal-length sections (2 m) for this study. Young’s modulus varies between 0.21 GPa and 210 GPa. The weight of the EPB machine has been simulated by uniformly distributed pressure applied in a 90-degree direction across the shield length. The weight of the EPB machine is assumed to be 3486 KN in this study.

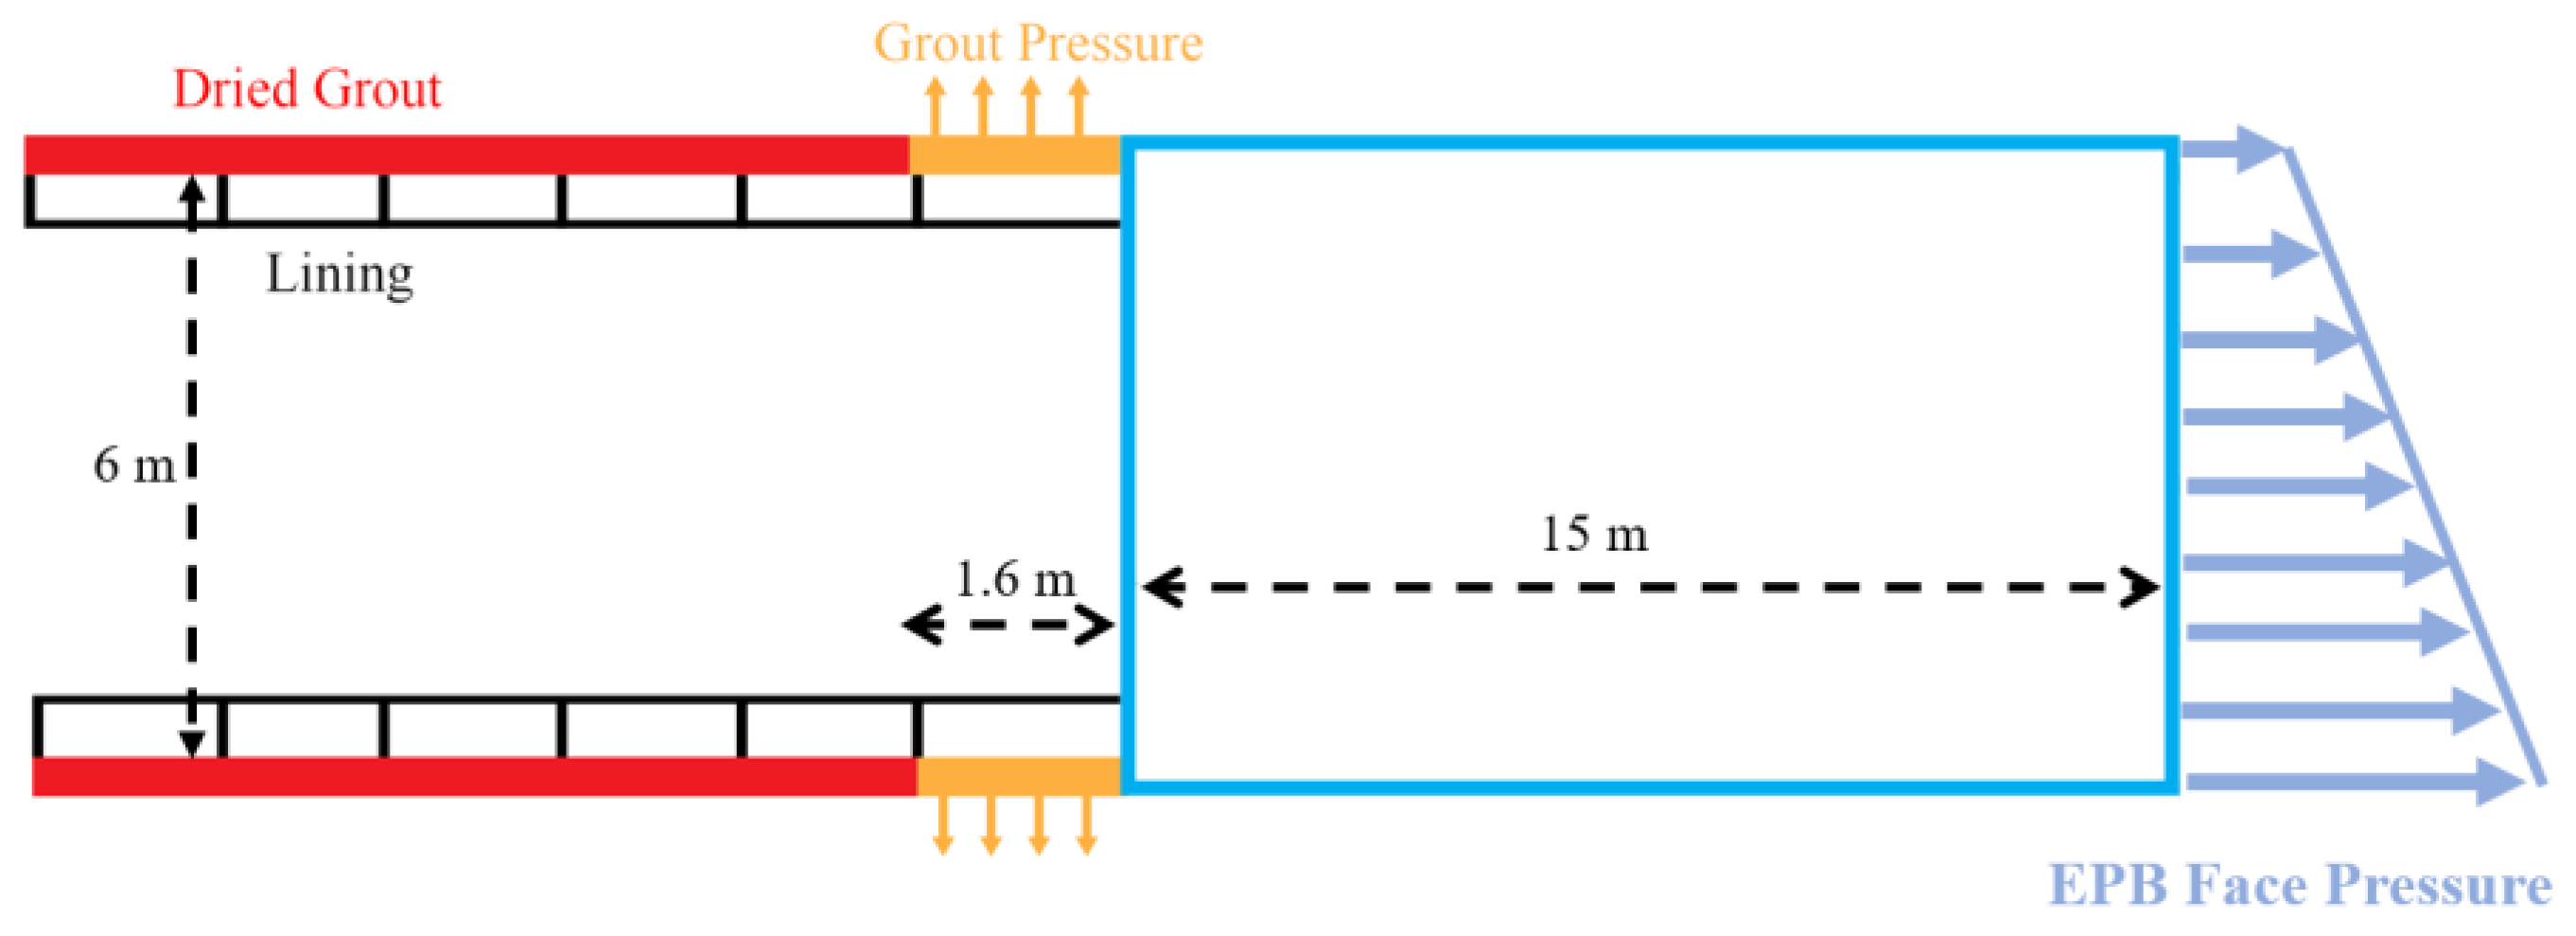
3.2. Numerical Simulation of the Grout Injection

Grout also plays a critical role in controlling ground displacement during mechanised excavation; in this research, the grouting pressure and consolidation of the liquid grout are accurately simulated. Other researchers have researched this issue via numerical model simulation and grout consolidation [33,38,53,80,83,84]. After two steps of applying liquid grout and grouting pressure, the grout becomes consolidated, and its properties change to that of hardened grout. A linear elastic material was assumed to simulate hardened grout [80]. Several researchers examined the modelling of grouting pressure using numerical simulations, and assumed that the grouting pressure on the crown of the tunnel ( σ v ) would be 1.2 times the overburden pressure [33,85,86]. To simplify the simulation of EPB properties in this study, we assumed that the grouting pressure is 50 kPa greater than the face pressure at the corresponding depth and that its gradient is 1500 Kg/m3 [84]. Table 2 summarises these properties. This assumption is based on data from the Seville metro excavation monitoring system. As a result, in this article, face pressure and grouting pressure are referred to as EPB pressure. Figure 6 shows grout pressure, grout liquids, and dried grout.

3.3. Numerical Simulation of the Lining

Simulation of precast concrete lining should retain its natural shape and properties. The presence of joints between segments in a ring is a necessary characteristic of segment lining. The joints between segments exert a significant effect on the behaviour of the tunnel lining. The lining has been modelled in this simulation using a linear structure. This structure was chosen over the shell structure because the shell structure is rigidly connected to the zone and lacks any interface with the soil, which is unrealistic.
Seville’s lining pattern is typical; it is not oblique. The length of the precast lining is 1.6 m, the thickness is 25 cm, and the lining’s properties are listed in Table 3. In Figure 7, the segments have been shaped, and the segments’ joints have been brought together. The links between segments are indicated by yellow dots in Figure 7.
A pioneering linear structural element was employed to model tunnel linings in [33,82]. The lining element provides two links for each node in this method, which can be used to model segment-segment and grout-segment interactions, respectively. The effect of the grout-lining interaction was investigated using normal spring stiffness (Kn) and shear spring stiffness (Ks). The values of Kn and Ks are 100 times the stiffness of the attached zone [87]. The apparent stiffness of an attached zone can be calculated as the maximum of ( K + 4 3 G ) Δ Z m i n , where G and K represent the shear and bulk modulus, respectively. ΔZ min is the zone’s smallest typical dimension of grout attached [69,74].
Each ring of the lining in Seville has six segments, and each lining node has two links: one connects to the grout, and the other to the other segments and rings. Six-degree-freedom node-to-node links are implemented and represented by six springs to simulate the segmental joints. Each spring is available in four different attachment states: free, rigid, linear, and bi-linear. The joint parameters of the lining of the numerical model are summarised in Table 4. Notably, the concepts of joint lining, stiffness, and degrees of freedom are strictly followed [46,86].

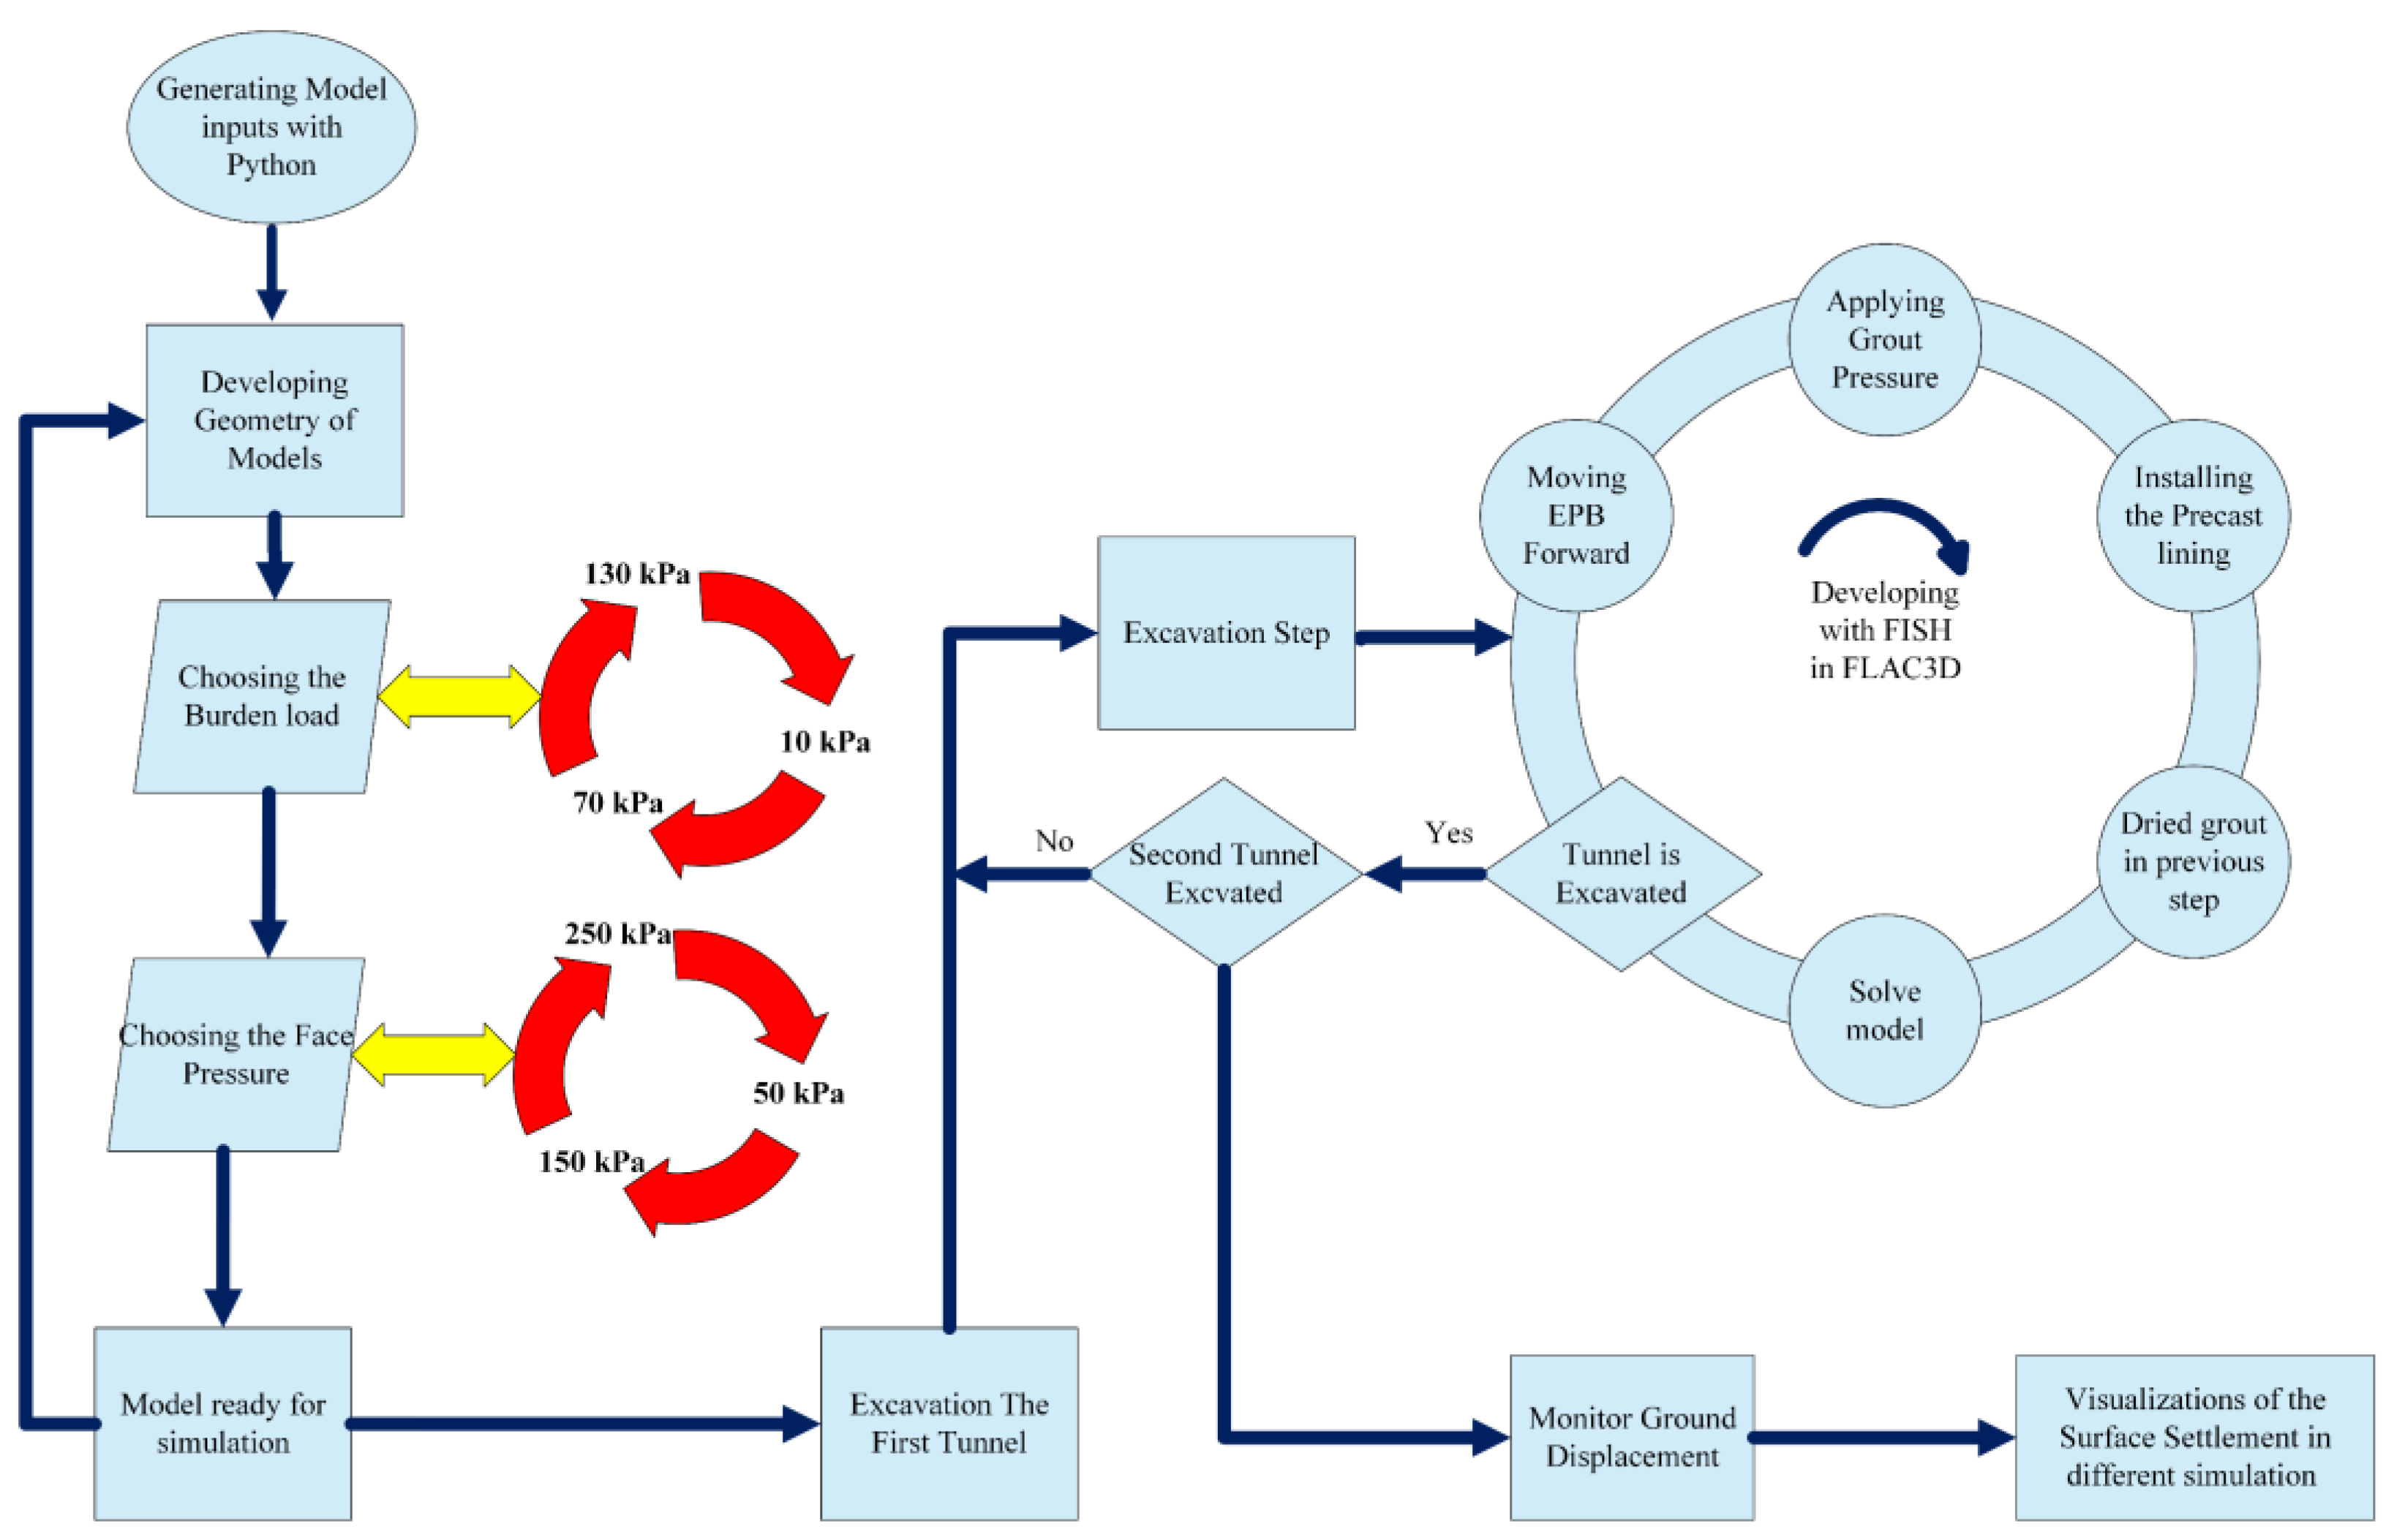
3.4. The Procedure of Developing Models

These simulations employed several new features in FLAC3D version 7 to create various geometries and to alter the excavation properties during the excavation. Python and FISH codes were employed in FLAC3D to develop these models. FISH is a powerful scripting language that enables the manipulation of model components, the parameterisation of models, the control of model runs, the creation of new model outputs, the monitoring of model results, and the post-processing of model runs. Additionally, Python programming is embedded in FLAC3D, and this tool is utilised in the modification of the condition of the model. As a result, other models could be simulated much more quickly in this manner. For example, FISH is employed to assign geometry and material properties. On the other hand, the Python feature has refined the procedure for requesting excavation steps and assigning new excavation properties and changing the soil layers [87].
In this study, nine models are simulated at each critical point (six geometries) by varying the excavation and geometry properties. The excavation process is divided into several distinct stages that are interconnected. As mentioned in Section 3.1, the second tunnel was excavated in the opposite direction of the first with the same excavation properties. Moreover, excavation steps are generated cyclically, and excavation properties affect the surface settlement. The order and cycle of this simulation are depicted in Figure 8. After choosing the burden load and face pressure, the excavation process of the first tunnel was started; and upon finishing the first tunnel, the second tunnel was then excavated. On completion of the excavation of both tunnels, the surface settlement was reported. The sections for reporting the result and choosing the geometry properties and excavation properties have been developed with Python. The changing range of face pressure, grout pressure, and burden load is illustrated in Table 5.

4. Results and Discussion

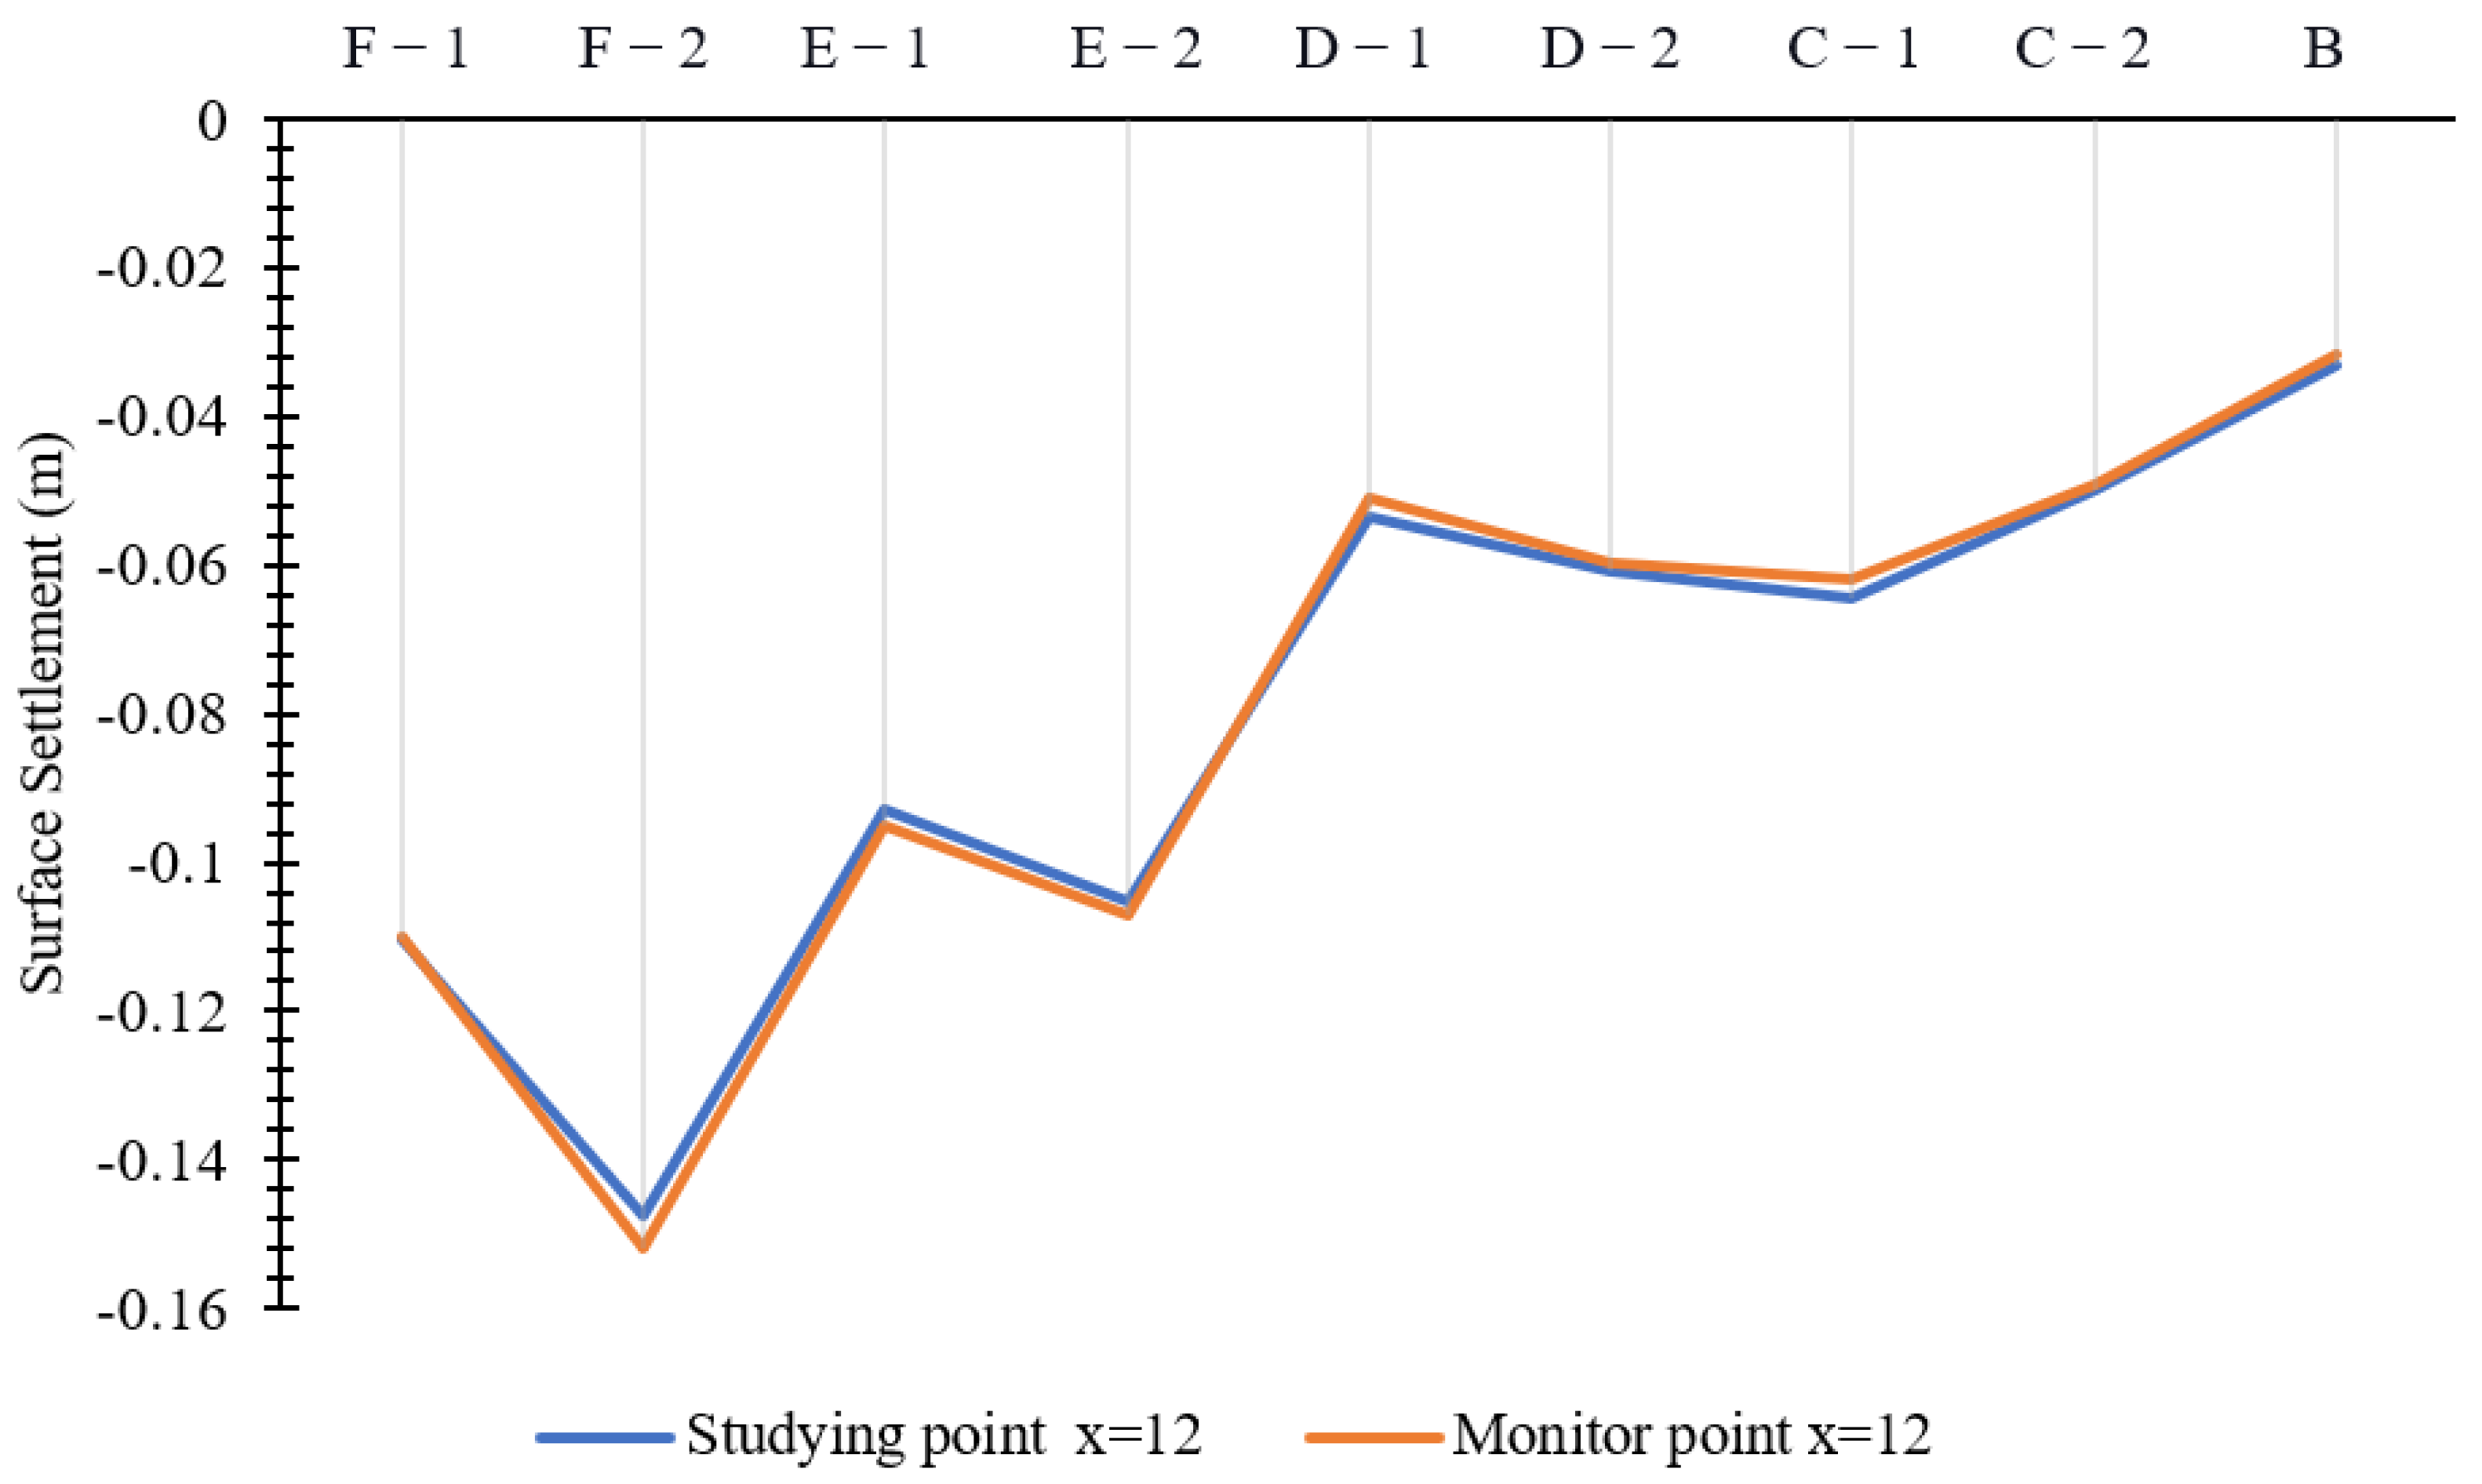
4.1. Validation of the Numerical Model

The advisory group conceptualised each of these excavations (GEOCISA and INTECSA-INARSA). The Vorsevi company controlled the ground displacement during and after the excavation. Table 5 shows the data thereof. The burden load and traffic load were calculated using a simplified method in this study. This load varies in value according to the district in which Seville is located. For an area with scattered buildings and only traffic load to consider, a pressure of 20 kPa is assumed; for a specific area with average buildings, a pressure of 70 kPa is assumed; and for a crowded area with average buildings and traffic congestion, 130 kPa is assumed [24,84,88]. Additionally, EPB records indicate that the face pressure varied between 50 and 250 kPa during the excavation. Unfortunately, the ground displacement and EPB face pressure were not recorded in the dataset for Nervion, denoted as point (A). As a result, the model is validated using the remaining five critical points. Since several points were excavated with different face pressure, those points were simulated under two conditions. For example, the face pressure was 250 kPa in the first section of Plaza de Cuba; the face pressure was then reduced to 150 kPa for the remainder of the excavation at that point. However, the face pressure of EPB in the entire San Bernardo excavation was 250 kPa.
Table 5 summarises the excavation data for the first tunnel. Furthermore, it is worth noting that the FLAC3D models place the study point at Y = 20. Since the boundary effect is eliminated in the middle of the geometry, the possibility of error is reduced [87].
As previously stated in Figure 4, in the x-axis, the centre of the first tunnel is located at X = 0, while the centre of the second tunnel is located at X = −12. Thus, the real surface settlement is compared to the ground movement displacement of the simulation at these two points in order to validate the model after the excavation of each tunnel. These two points are included in the report of the company responsible for the excavation of the metro in Seville. On the other hand, the monitor points that are chosen in the x-axis of the geometry in FLAC3D are located at X = 0, X = 6, and X = −12. These points are highlighted in bold in Figure 4. As already mentioned above, the boundary condition monitor point in the Y-axis should be selected in the middle of the geometry (Y = 20), and validation points are selected at X = 6, and X = −12. Therefore, for the first excavation and second excavation points, (6, 20) and (−12, 20) are selected for the validation of surface settlement in simulation with FLAC3D.
Figure 9 and Figure 10 demonstrate that the first tunnel and second tunnel excavation adhered to the surface settlement procedure satisfactorily. For the first excavation, the greatest deviation from monitoring data is 4 mm (Points E and F), while the smallest deviation is 1 mm (Point D). In Figure 10, the surface settlement at Point F following the second excavation presents the most significant error, with a difference of 4 mm.

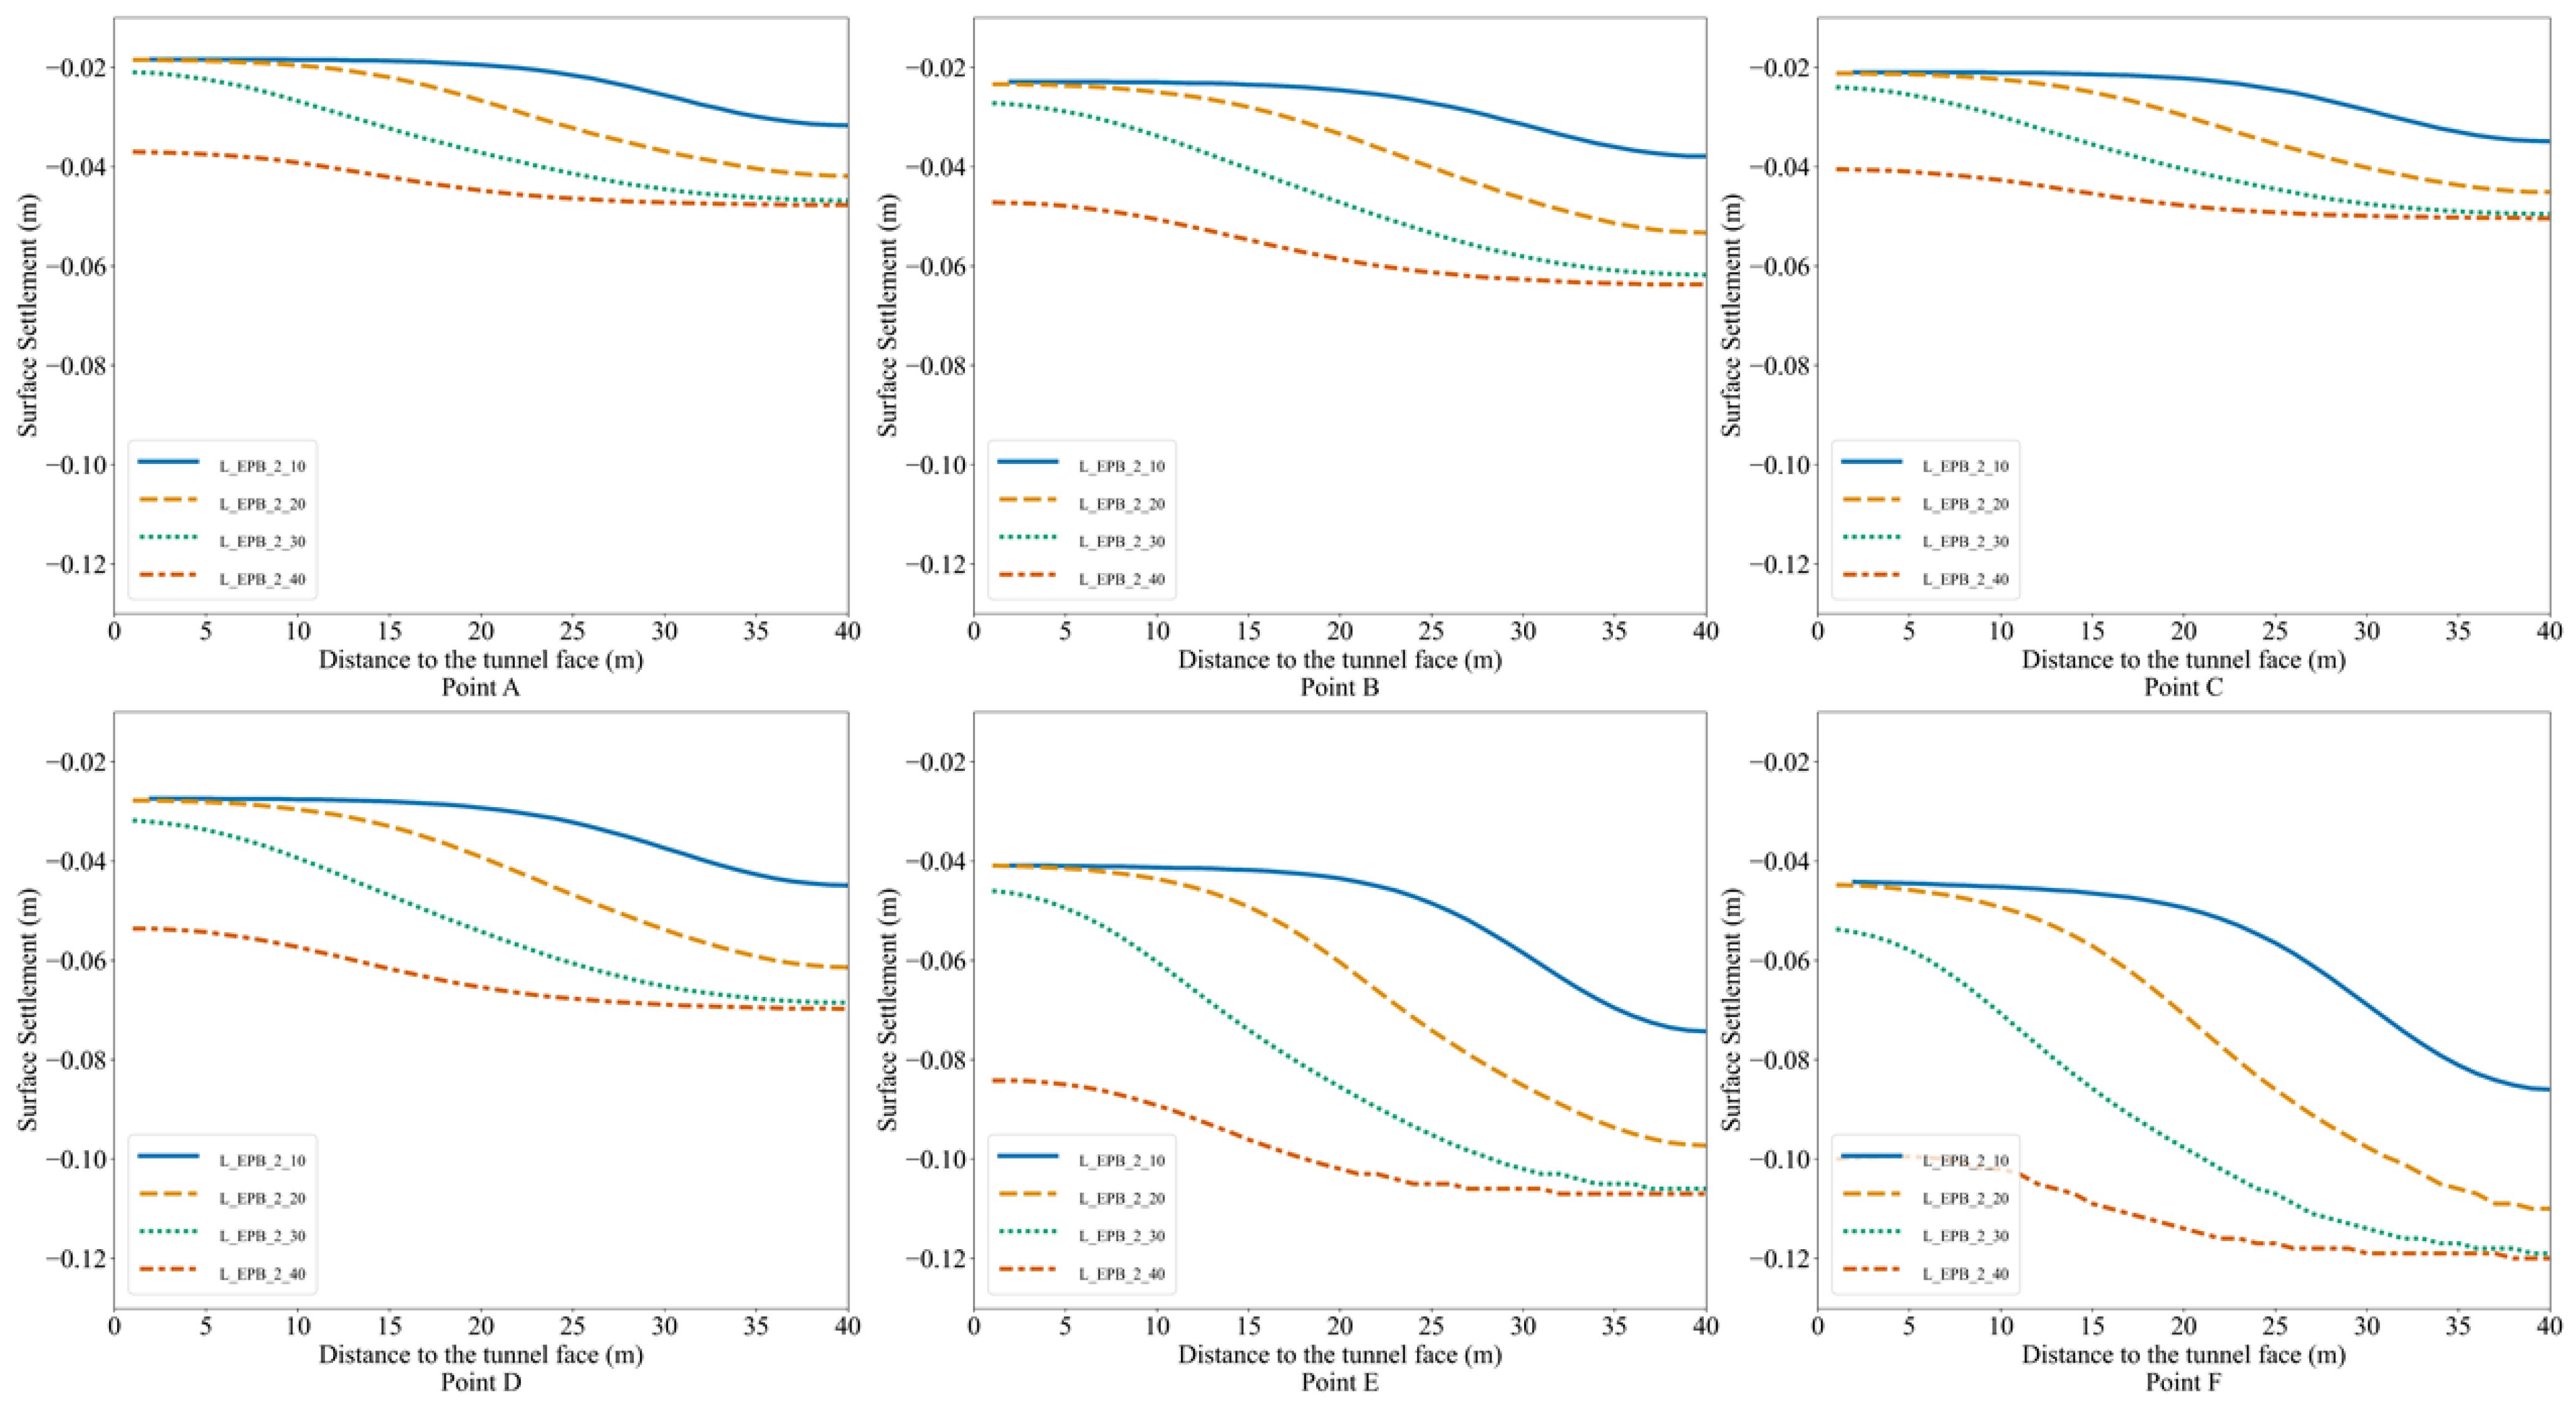
4.2. Influence of the Excavation Parameter on the Ground Displacement

Figure 9 and Figure 10 demonstrate that ground settlement is greater at Points E and F than at other critical points. These points were excavated into the sand, with a burden load of 130 kPa at these two critical validation points. One could argue that soil properties and burden load are critical factors in increasing ground settlement. Notably, differential geometry must be considered when examining these points. The geometry of each critical point is then developed using three different burden loads. This enables the interaction between two critical points the investigation of be studied with varying geometries but with the same excavation property.
Throughout the mechanised excavation in Seville, the EPB pressure was altered in various areas, and the most frequent face pressure was used in this study. As shown in Figure 9, the face pressure of EPB was 250 kPa, 150 kPa, and 50 kPa at these critical points. Thus, the schematic diagram in Figure 9 states that nine numerical models were simulated in FLAC3D for each geometry.
Figure 11 illustrates the burden load effect; it is evident that increasing the burden load from 20 kPa to 130 kPa increases the model’s surface settlement. In Figure 11, either the trend of surface settlement is rising or surface settlement is generally proportional to burden load and is approximately 180% increased in all conditions.
Additionally, grouting pressure and face pressure are critical parameters when it comes to ground displacement. These parameters are be examined in the following section. Injecting large volumes of high-pressure grout into the soil leads to hydraulic fracture and volumetric expansion in the soil. Simple methods for the calculation of the ground displacement caused by jet grouting have been studied in [89], wherein a decent range is mentioned for grout pressure. As a result, the grouting pressure range in this study was chosen to correspond to the face pressure of the EPB. As previously stated, the face pressure in the Seville metro was varied between 50 and 250 kPa, and, for the sake of simplification, the grouting pressure is assumed to be 50 kPa greater than the face pressure in this paper. Thus, the grouting pressure was varied between 100 and 300 kPa. As demonstrated in the preceding section (validation of the numerical model), this assumption is valid, since FLAC3D’s numerical results closely match the real data. Ground displacement increased in the excavation simulation mentioned above when the grouting pressure decreased.
This phenomenon is illustrated in Figure 11 for three different grouting pressures, with black lines annotating the range of burden load. This demonstrates that the surface settlement increased by reducing grout or face pressure in each specific burden load. The procedure depicted in Figure 11 demonstrates this approach. Hence, ground displacement has an indirect relationship with grout pressure, face pressure, and burden load. These findings are consistent with other pertinent studies [19,29,90].

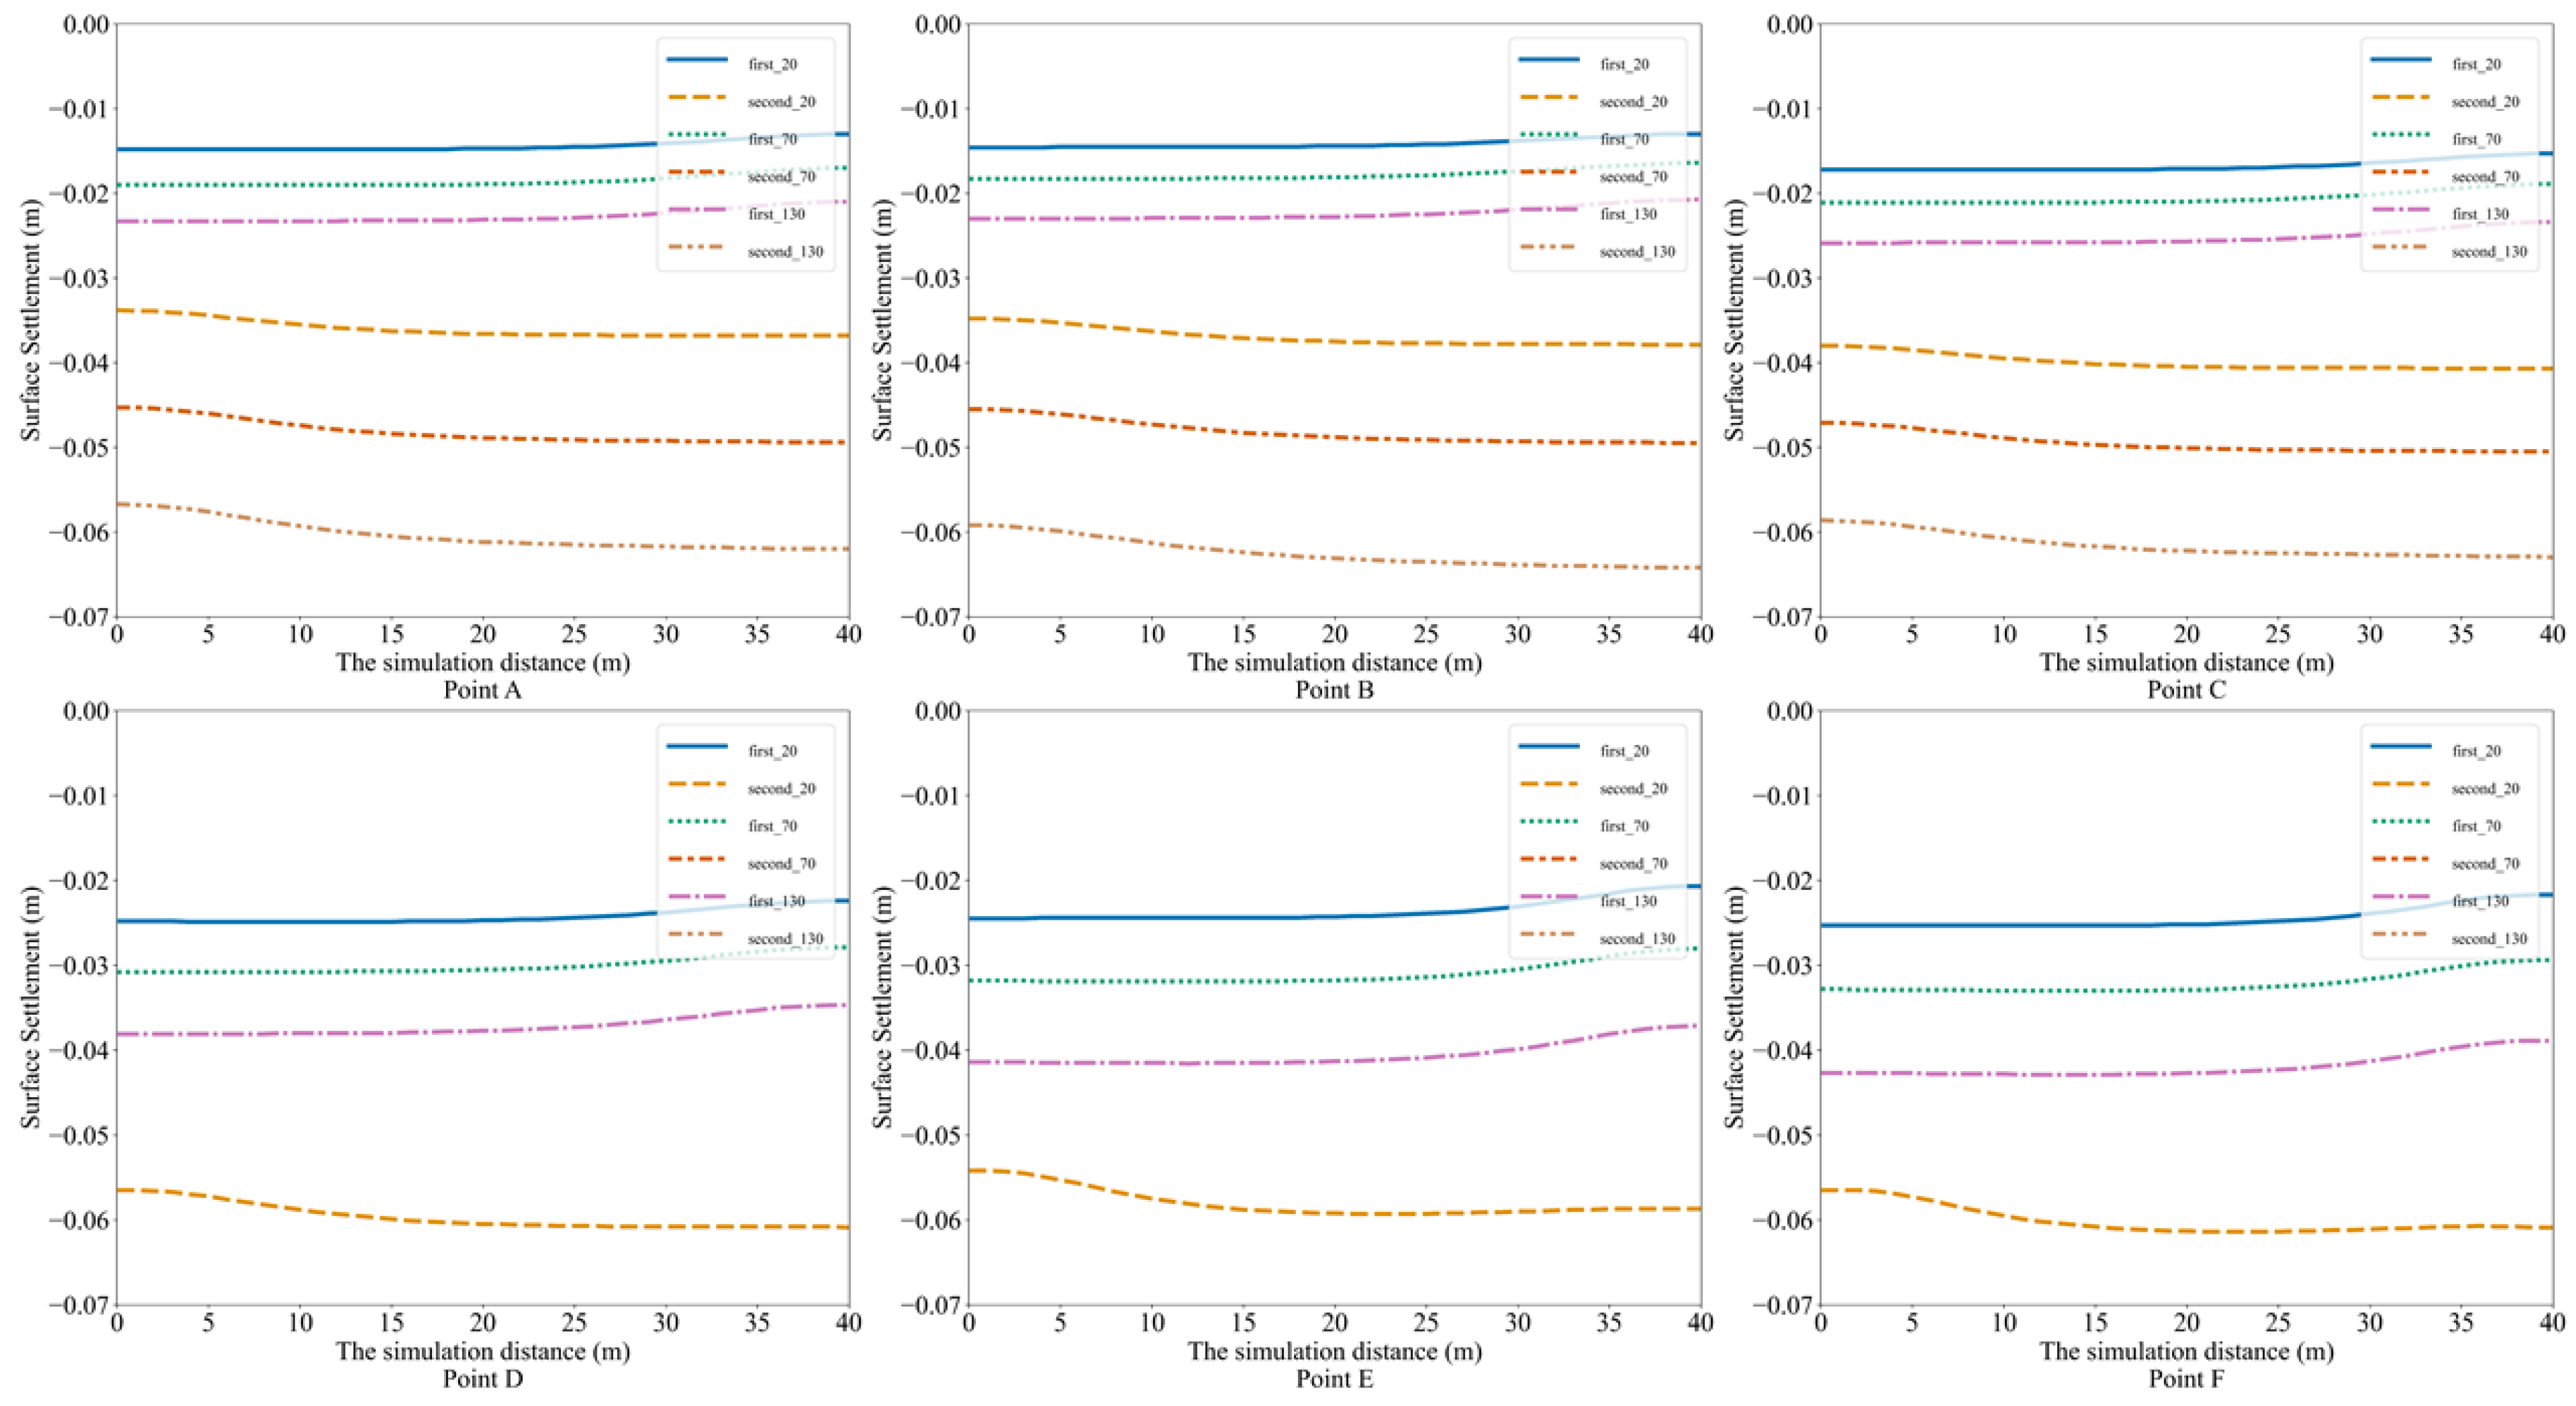
4.3. Twin Tunnel Excavation and Stages of Excavation

As mentioned earlier, Line 1 of the Seville metro was excavated in the form of two parallel tunnels. First, one of the tunnels was excavated with LOVAT EPB. Then, the second tunnel was excavated in the opposite direction at a distance of six meters. The second tunnel was excavated following the completion of the first tunnel in this simulation from Y = 0 to Y = 40. Therefore, the machinery and grouting pressure were removed after having excavated the first tunnel, and the grouting turned to consolidate, and the second excavation was started from Y = 40 to Y = 0. The lagging distance between the two excavation faces when two EPB machines are excavating consecutively from a different perspective was studied by [86]. The ground displacement at the crown of the tunnel is shown in Figure 12, and the surface settlement profile is presented in Figure 13. Notably, the burden loads in the plots of Figure 12 and Figure 13 are chosen at different numbers. The burden load in Point A, E, and F has been assumed to be 130 kPa, while in Point B and D it is chosen at 20 kPa, and in Point C it is assumed to be 70 kPa. Furthermore, these plots are juxtaposing in the Y = 20 of the geometry. Figure 12 and Figure 13 show different ground displacements with changes in the face pressure and the grouting pressure of the mechanised excavation. It can be observed that, at first glance, the surface settlement has an indirect relationship with face pressure and grout pressure. These plots also show the change in ground displacement from a V-shape to a W-shape after the second tunnel excavation. Figure 13 shows that the ground settlement on the surface, which is U-shaped, became wider after the second tunnel had been excavated.
Several studies have addressed changes in the settlement value in various excavation stages: for this notion, the simulation should be studied on the longitude profile of EPB excavation. Research was carried out by [37,46], and Ref. [91] regarding the relationship between the grouting properties and settlement, or regarding the fault effect when crossing the tunnel. In their studies, they focused on the longitude profile of EPB excavation in the moving direction in each stage of excavation.
Therefore, Figure 14 and Figure 15 display the progress in the EPB and the change in the ground displacement in various stages of excavations. As shown in these figures, the ground movement was in the critical points. Each critical point was excavated with one condition in these figures to show this progress more explicitly. The burden load in Points A, E, and F has been assumed to be 130 kPa, in Points B and D it is chosen at 20 kPa, and in Point C it is assumed to be 70 kPa. Moreover, the face pressure at Points A, B, and C was assumed to be 250 kPa, and at Points D and E it was presumed to be 150 kPa, while at Point F it was taken at 50 kPa.
Figure 14 shows the advancement of the EPB into the geometry from Y = 0 for the excavation of the first tunnel in six critical points. When the entire length of the EPB machine is advanced into the soil, the surface starts to settle dramatically (L_EPB_1_10 in Figure 14). In the subsequent steps, the EPB is immediately applied to the grouting pressure and the precast lining.
Therefore, the ground displacement speed decreases (L_EPB_1_10 in Figure 14). L_EPB_1_30 in Figure 14 indicates the EPB position after 30 m of excavation. Finally, line L_EPB_1_40 in Figure 14 illustrates the last step of the excavation whereby the EPB is excluded from the model, and the grouting pressure has been added to the last part of the model. It is obvious that the consolidated grouting and the implantation of the lining precast control the ground movement. Even though the EPB cutter head is highlighted in each section with the same colour, the EPB is absent in the last section of the model.
Nevertheless, Figure 15 indicates the ground movement during the excavation of the second tunnel. Since these tunnels were excavated in opposite directions, their progress is reversed. Moreover, the first tunnel graphs show the excavation progress from left to right (from 0 to 40). The second tunnel has been excavated from right to left (from 40 to 0). Figure 14 and Figure 15 indicate the surface settlement in the middle distance of the twin tunnels (x = −6), and they show the surface settlement graph when EPB has penetrated 10, 20, 30, and 40 m into the models. Additionally, Figure 16 shows the diagram of the surface settlement after 50 steps of excavation, and the ground displacement is steadied. Figure 14 and Figure 15 indicate that the ground movement decreased subsequent to the first 30 m of the excavation, and most of the significant ground displacement occurred in the first 30 m. Notably, the first 10 m of the excavation can be attributed to the EPB length. For the next 20 m, considerable ground displacement has occurred. This progress was similar to all critical points with different excavation properties.
The ground displacement increased due to the increase in the burden load, and therefore they have a direct relationship. Figure 16 demonstrates this principle in the Y longitude after having excavated the model completely and having removed the grouting pressure. Those lines with the same colour show the surface settlement with the same burden load. After the excavation of the second tunnel, the amount of ground displacement increased. The ground displacement also increased dramatically when the burden load increased. The average ground displacement at Point E, at longitude direction was 5.8 cm when the burden load was 20 kPa. The burden load was then increased to 70 kPa, and the average settlement reached 7.84 cm. Finally, when the burden load was 130 KPa, the average ground displacement was 10.45 cm. These results show the burden load effect when the mechanised properties are the same, and the tunnel is excavated with constant face pressure (250 KPa) and grouting pressure (300 kPa). As already mentioned, Points E and F have the greatest ground displacement. During the excavation of those areas, various geotechnical issues arose, and the process of excavation was halted [92]. Moreover, Figure 16 clearly shows the changing surface during the excavation of the first and second tunnels with the same excavation properties. It should be borne in mind that Figure 16 shows line in X = −6, whereas Figure 2 shows this point location on the surface.

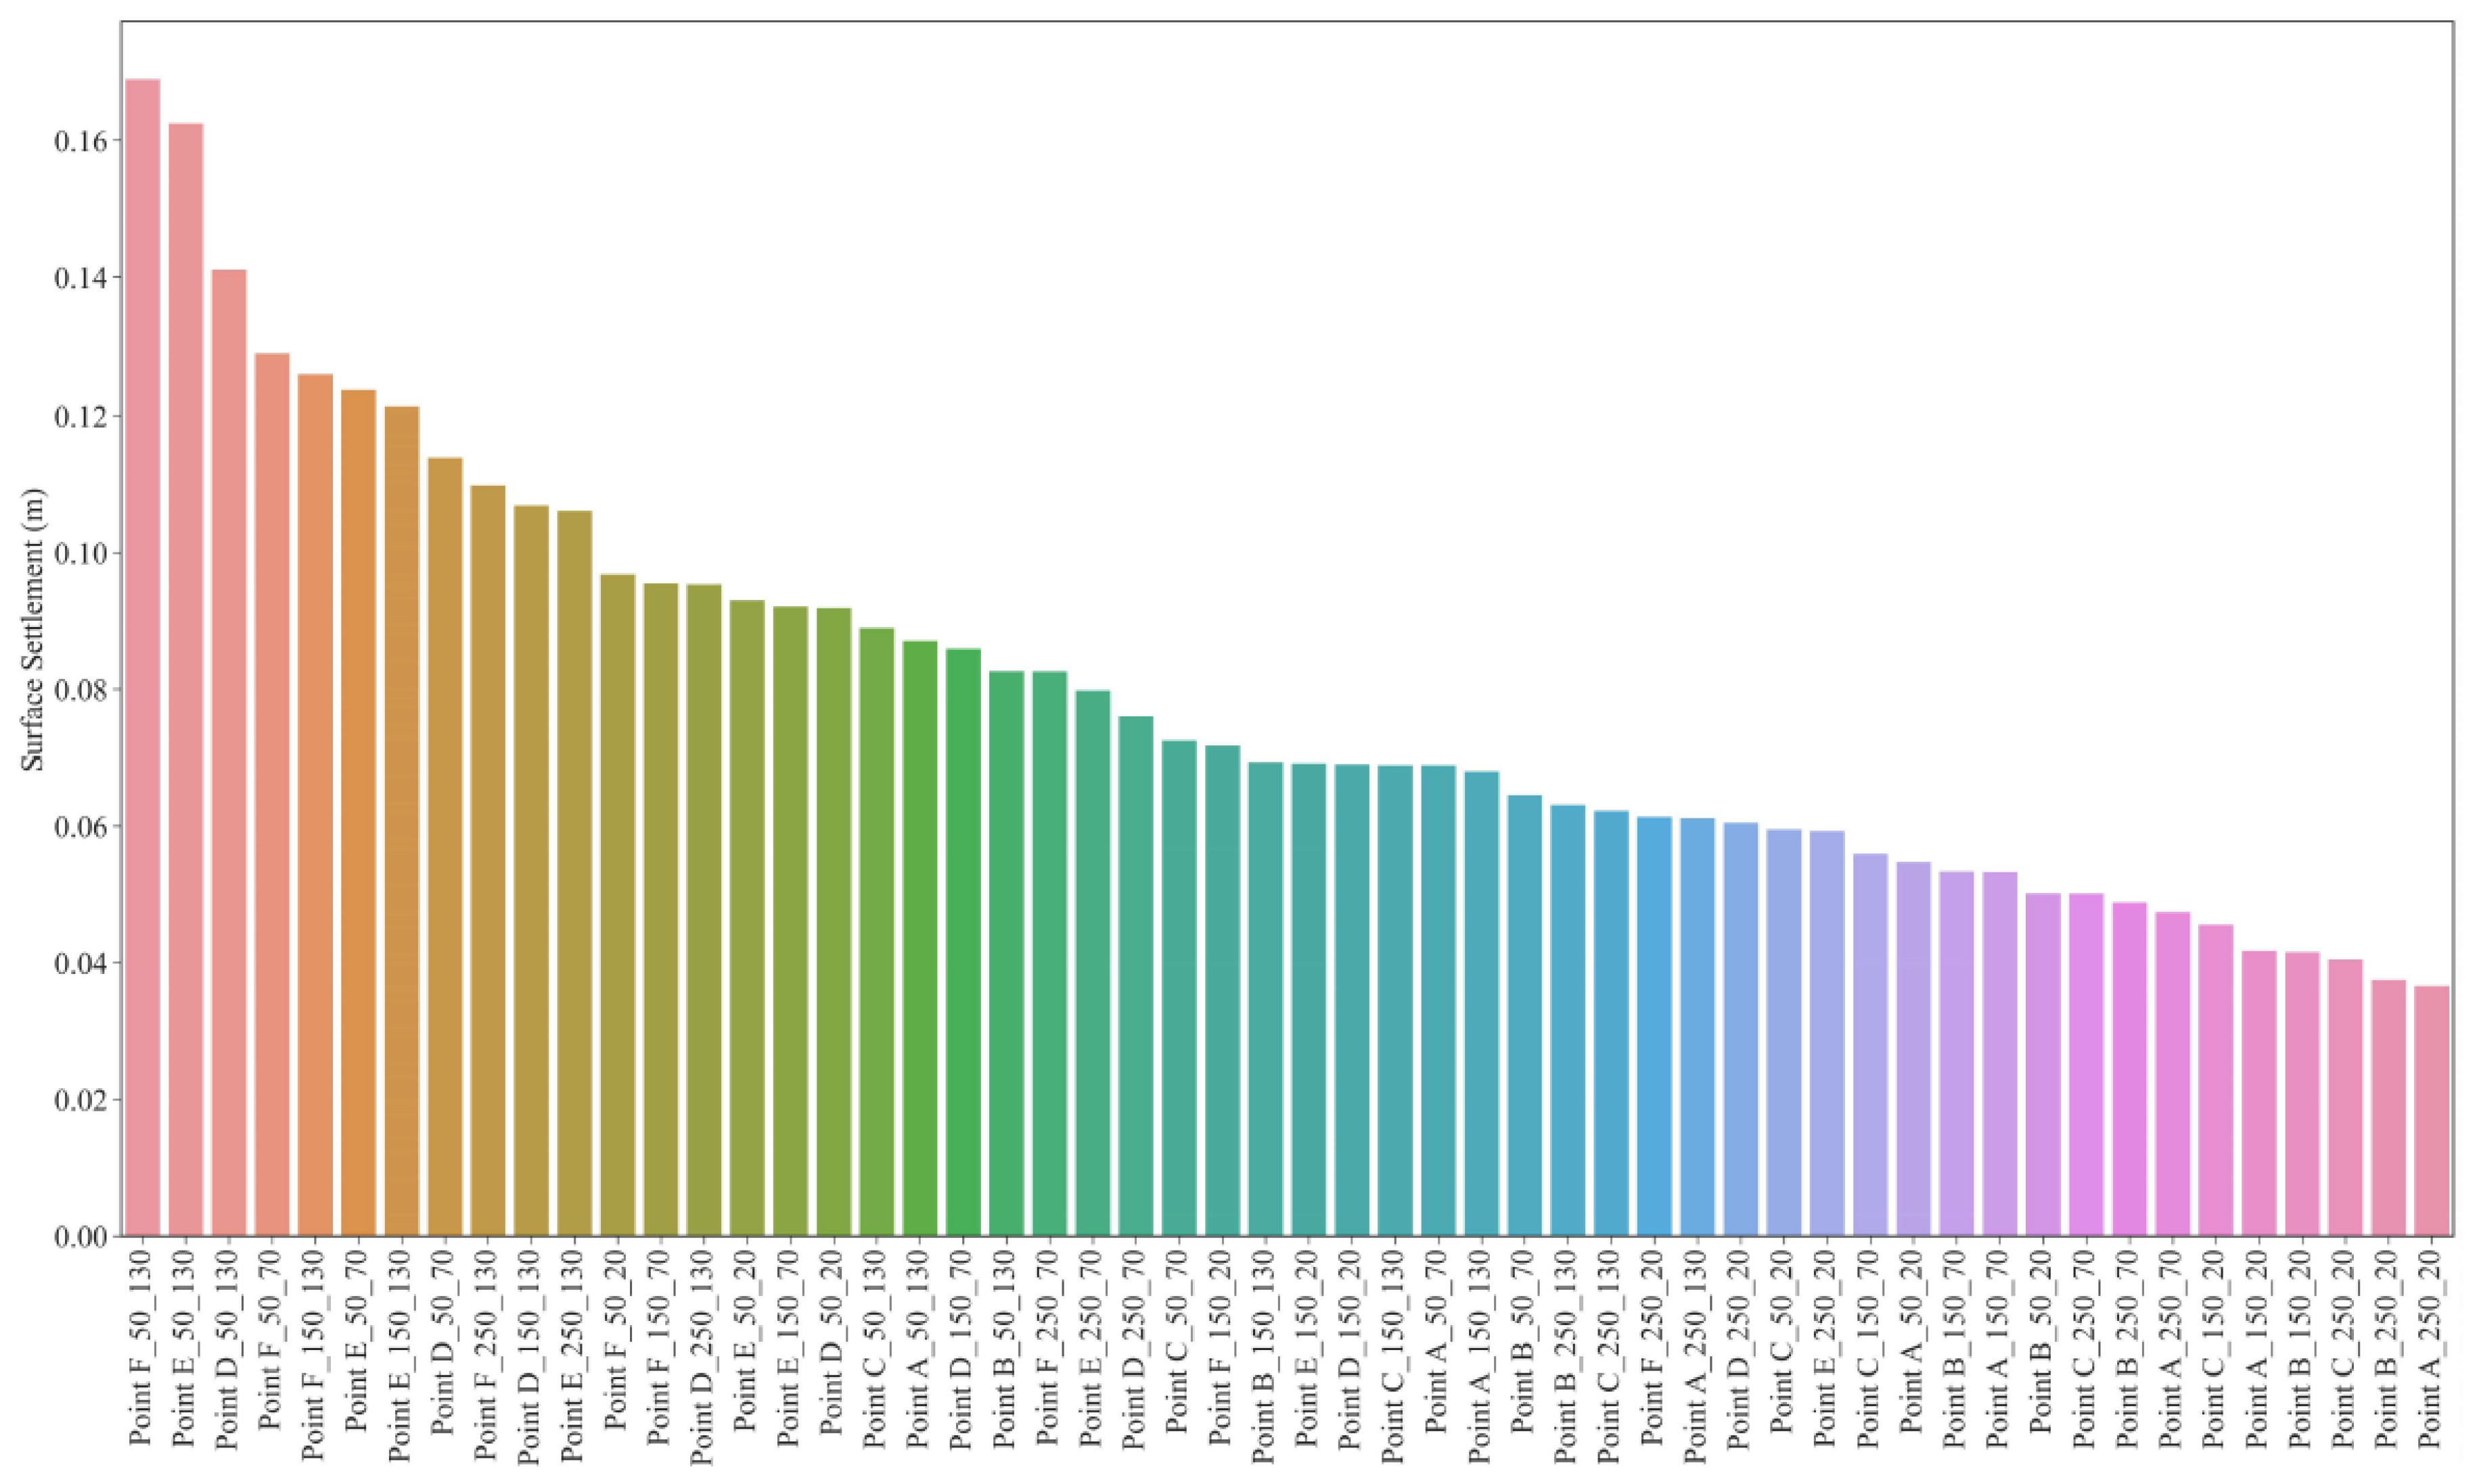
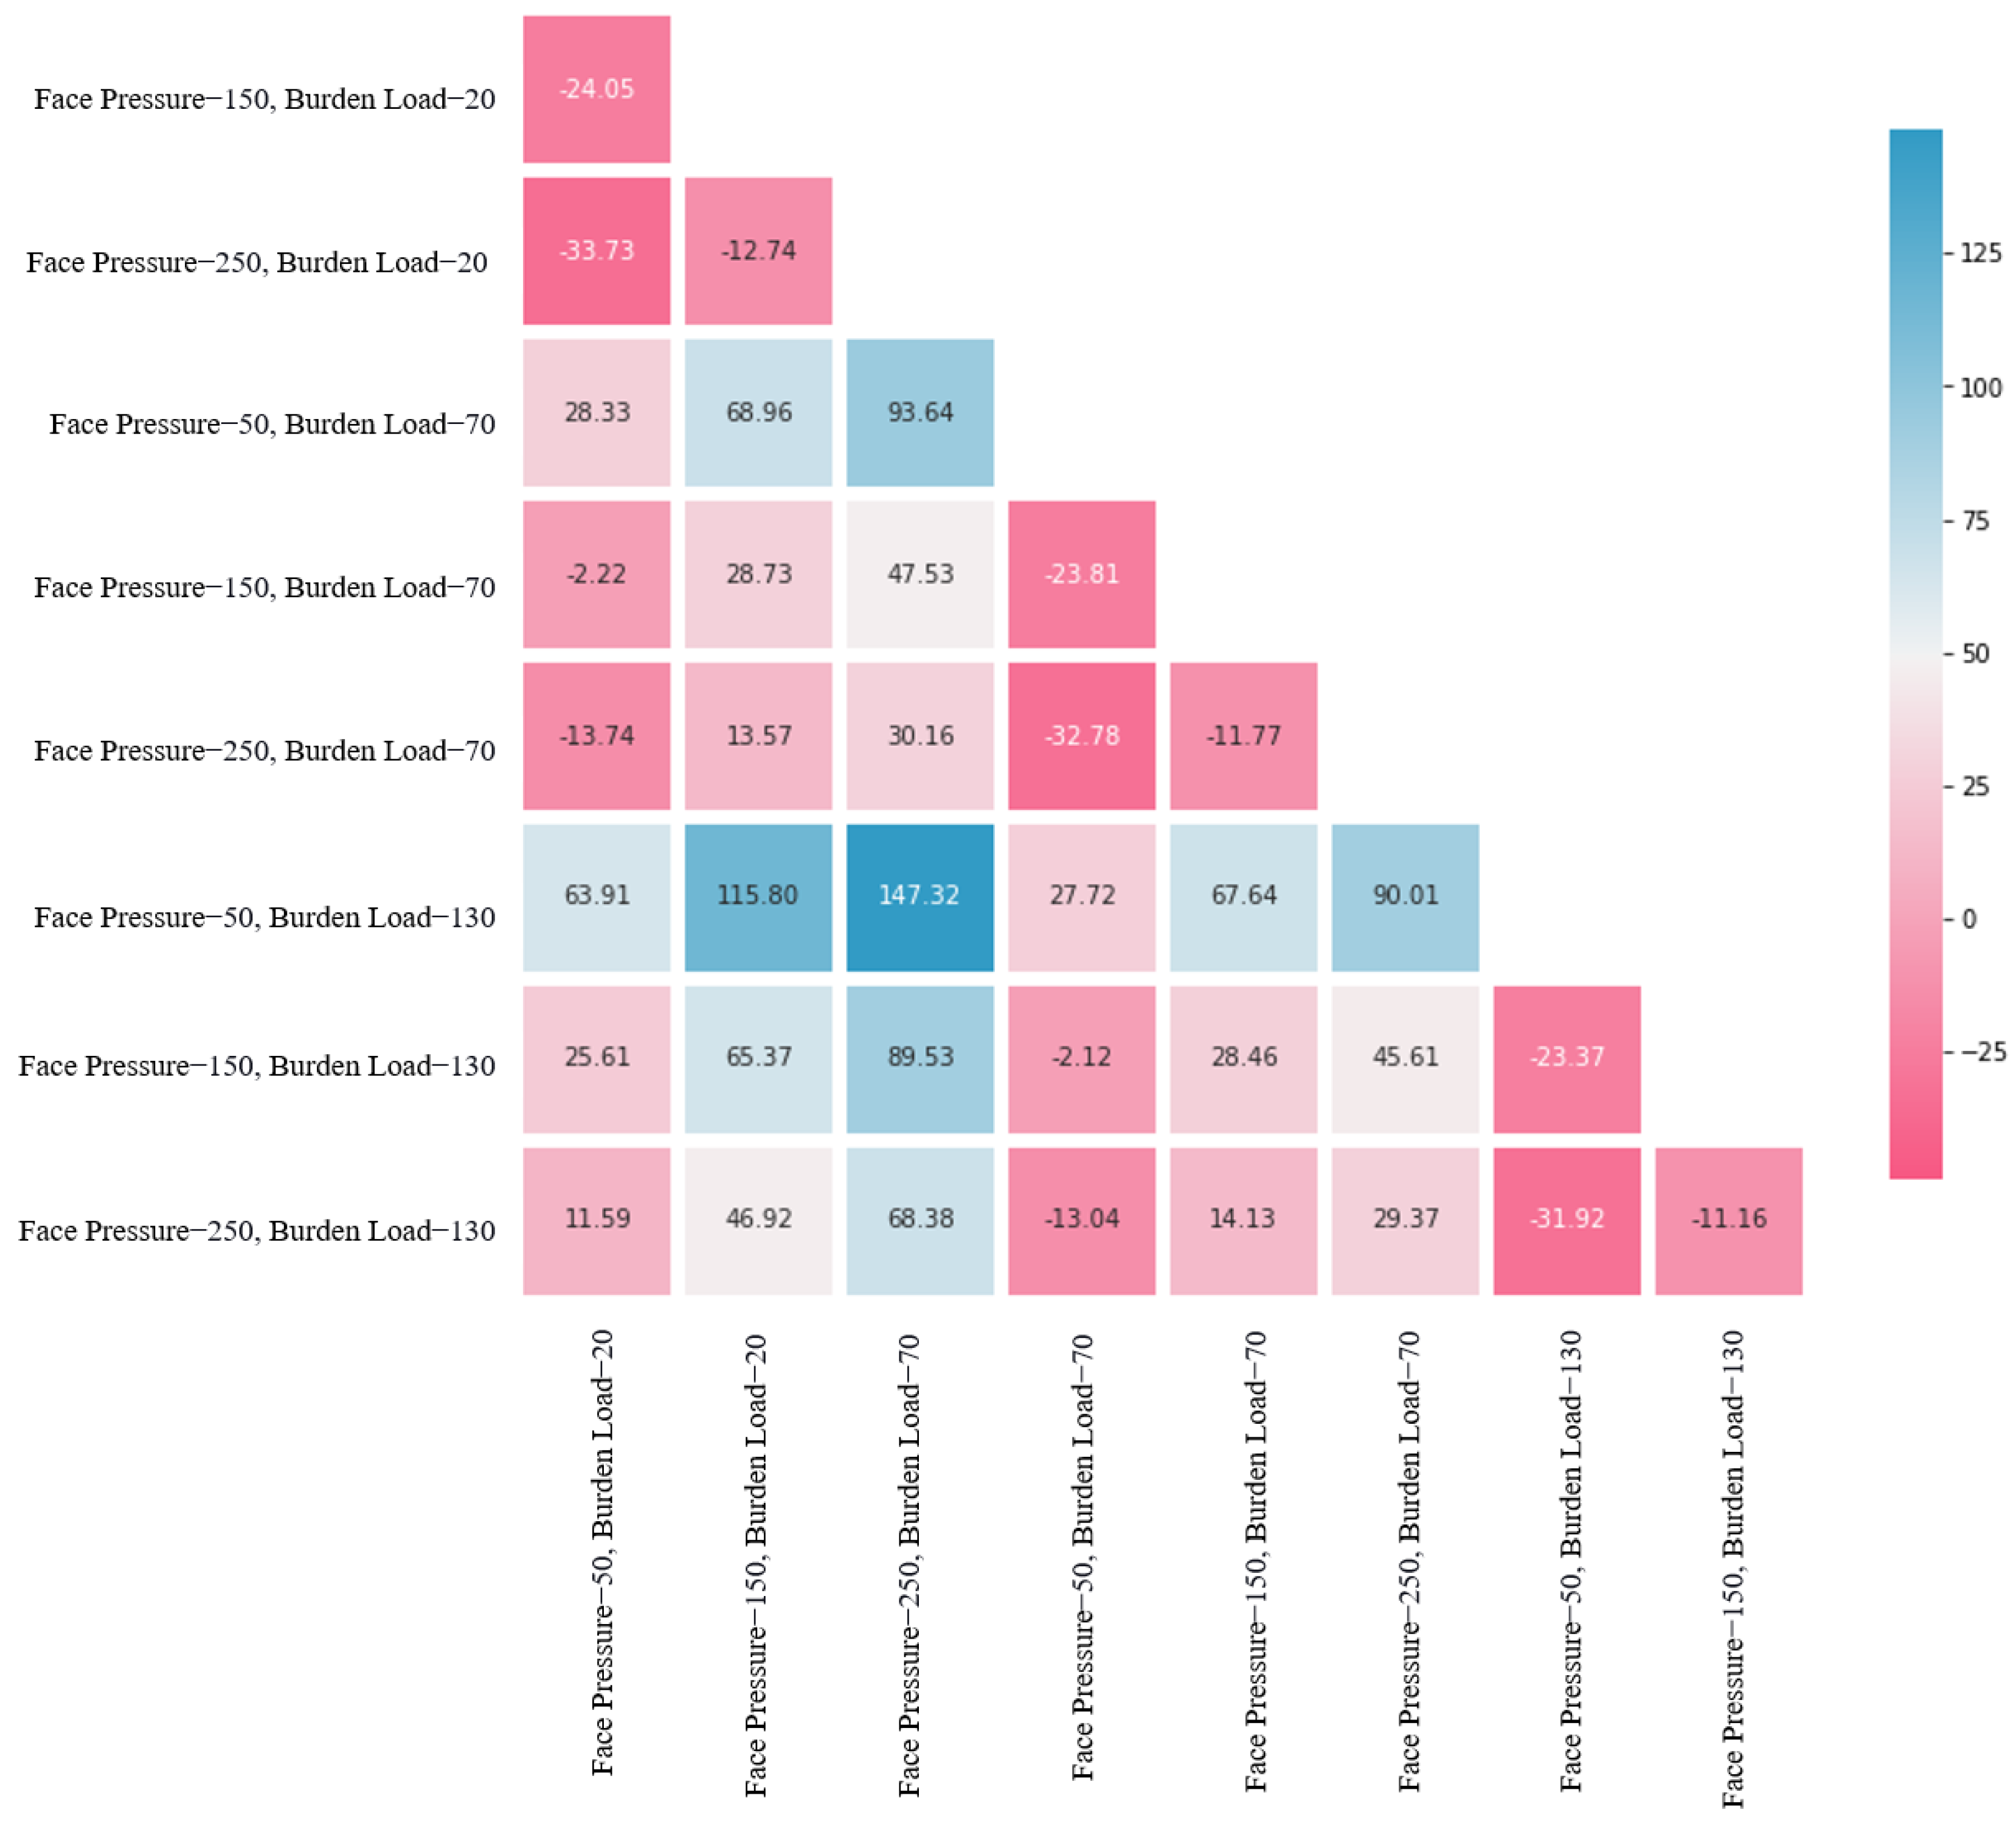
4.4. Statistical Analysis on Results of Extra Models

Nine simulations were developed based on the real situation, and 45 models were developed for additional studies with changes made in the excavation properties and boundary conditions, thereby producing 54 models. By relaying these extra models, the surface settlement has been investigated for a wide variety of excavation properties and geometry. A statistical study has been carried out for those surface settlements mentioned in the previous section. This statistical study reveals the surface settlement relation with excavation properties and geometry. As shown in Figure 11, Figure 12, Figure 13, Figure 14, Figure 15 and Figure 16, as the excavation properties and burden load in all critical points changed, ground displacement also changed. Furthermore, the critical points in this paper present several major differences in their soil layers, water table, and geometry. In one case, Point F of the Seville metro was excavated into the sand layer at 10 m, while Point B was excavated into marl at 14 m. Moreover, the water table has different levels in these critical points. The water table in Point D was located 1 m below the surface; in other points, this water table was approximately 4–5 m from the surface. Figure 17 shows the various surface settlements that include different face and burden pressures. Figure 17 sorts the height of the surface settlement from the highest value down to lowest: the greatest surface settlements are highlighted in red and low surface settlements are pink.
Table 6 shows the average surface settlement across all the critical points, where they have the same burden load and face pressure. In this part, the difference in geometry has been waived, and the study has focused solely on face pressure and burden load, whereby all simulations that excavated with the same face pressure and burden load are located in the same group and the average of surface settlement is reported. Table 6 illustrates the lowest average of surface settlement when the face pressure and burden loads are 250 kPa and 20 kPa, respectively. On the other hand, the highest average of surface settlement is for 50 kPa face pressure and 130 kPa burden load. The highest and lowest average surface settlement is 0.121866 m and 0.049275 m, respectively.
The percentage difference between the highest and lowest average of surface settlement is 84.83%. In the simulations where burden load is assumed at 20 kPa, the average surface settlement increased by 50.9% when the face pressure decreases from 250 kPa to 50 kPa. Moreover, when the face pressure is assumed to be 250 kPa, the burden load increases from 20 to 130 kPa and the average surface settlement reaches 68.4%.
Figure 18 shows the percentage changes between average surface settlement with changing the face pressure and burden load. The percentage changes are evaluated by V 2 V 1 V 1 × 100 , where V denotes different numbers. The negative and positives values in this table indicate an increment or decrement of surface settlement. It has been observed that the average surface settlement increases to 147.32% if face pressure changes from 250 kPa to 50 kPa and the burden load increases from 20 kPa to 130 kPa. In contrast, the lowest percentage changes occur in various models where either the face pressure or the burden load remains constant. Furthermore, if the face pressure and burden load change from 150 kPa and 20 kPa to 50 kPa and 130 kPa, the surface settlement increases to 115.8%.
Figure 19 and Figure 20 show the separate effects of the points and the face pressure and burden load effects on surface settlement. Figure 19 and Figure 20 reveal that the surface settlement in Points A, B, and C differs from that in Points D, E, and F. Surface settlement in Points A, B, and C is generally lower than in Points D, E, and F. The surface settlement in Points A, B, and C changed from 0.037 to 0.089 m. However, surface settlement for Points D, E, and F changed from 0.059 to 0.169 m. Furthermore, varying the span is estimated to be 0.052 m for Points A, B, and C and 0.109 m for Points C, D, and E. This difference is related to the geometry of these points. Points A, B, and C are located in gravel and marl, while Point D is located in three different soil layers (clay, sand, and gravel), and Points E and F are located in the sand layer.
Figure 19 and Figure 20 support the previous assumption that the surface settlement has a direct relationship with the burden load. These assumptions are shown in all the points. However, the changing surface settlement in Points C, D, and E is considerably more scattered. Moreover, surface settlement in Points D, E, and F is much more scattered when either the face pressure is 50 kPa or the burden load is 130 kPa, which comes from the soil layer effect.
Below, the models have been divided into four categories based on the excavated soil. The X axial in Figure 21 is shown, with an increase in Young’s modulus the surface settlement decreased after excavation of both tunnels in comparison with lower Young’s modulus. Moreover, excavation into the sand and clay with lower Young’s modulus leads simulation to more ground displacement. Figure 21 shows the tunnel depth effect on the simulation. As shown, most of the models were developed within the 14 m to 12 m range and only 18 models were developed at the depth of 10 m. However, Figure 21 indicates that the distribution of the tunnel excavated 10 m deep was greater than in other points. Furthermore, Figure 21 illustrates the effect of Young’s modulus for the tunnel excavated at different depths. Tunnels were placed into the 13 m depth and excavated in two different Young’s moduli; tunnels excavated in the lower Young’s modulus experienced greater surface settlement. Notably, tunnels excavated into sand are located 10 m deep. These simulations had more scatter results to estimate surface settlement than other simulations. In Figure 22, points with the greatest surface settlement were Points E and F. Additionally, the burden load was 130 kPa, and EPB face pressure was 50 kPa.
Surface settlement for Points D, E, and F has more dispersion than Points A, B, and C. The variance for Points A, B, C, D, E, and F is 2.42 × 10⁻⁴, 2.06 × 10⁻⁴, 2.23 × 10⁻⁴, 6.15 × 10⁻⁴, 1.01 × 10⁻³ and 1.10 × 10⁻³. Figure 22 shows the dispersion of surface settlement in each point.
The water table models are divided into three categories containing nine models, whereby (Point D) water table is placed at a depth of 1 m, and the other models of the water table are placed at approximately 4 and 5 m in depth. Figure 23 presents these criteria. On the other hand, models where the water table was placed at a depth of 1 m are found to suffer from more ground displacement. However, outliers reported in Figure 23 show more surface settlement in Points E and F. Therefore, this research presents certain limitations regarding generalisations on the water table and surface settlement.

5. Conclusions

During the excavation of the tunnels for the metro of Seville, engineers faced many issues, with surface displacement setting a tremendous challenge. This study strives to highlight its location and the main reason the surface displacement increased during excavation.
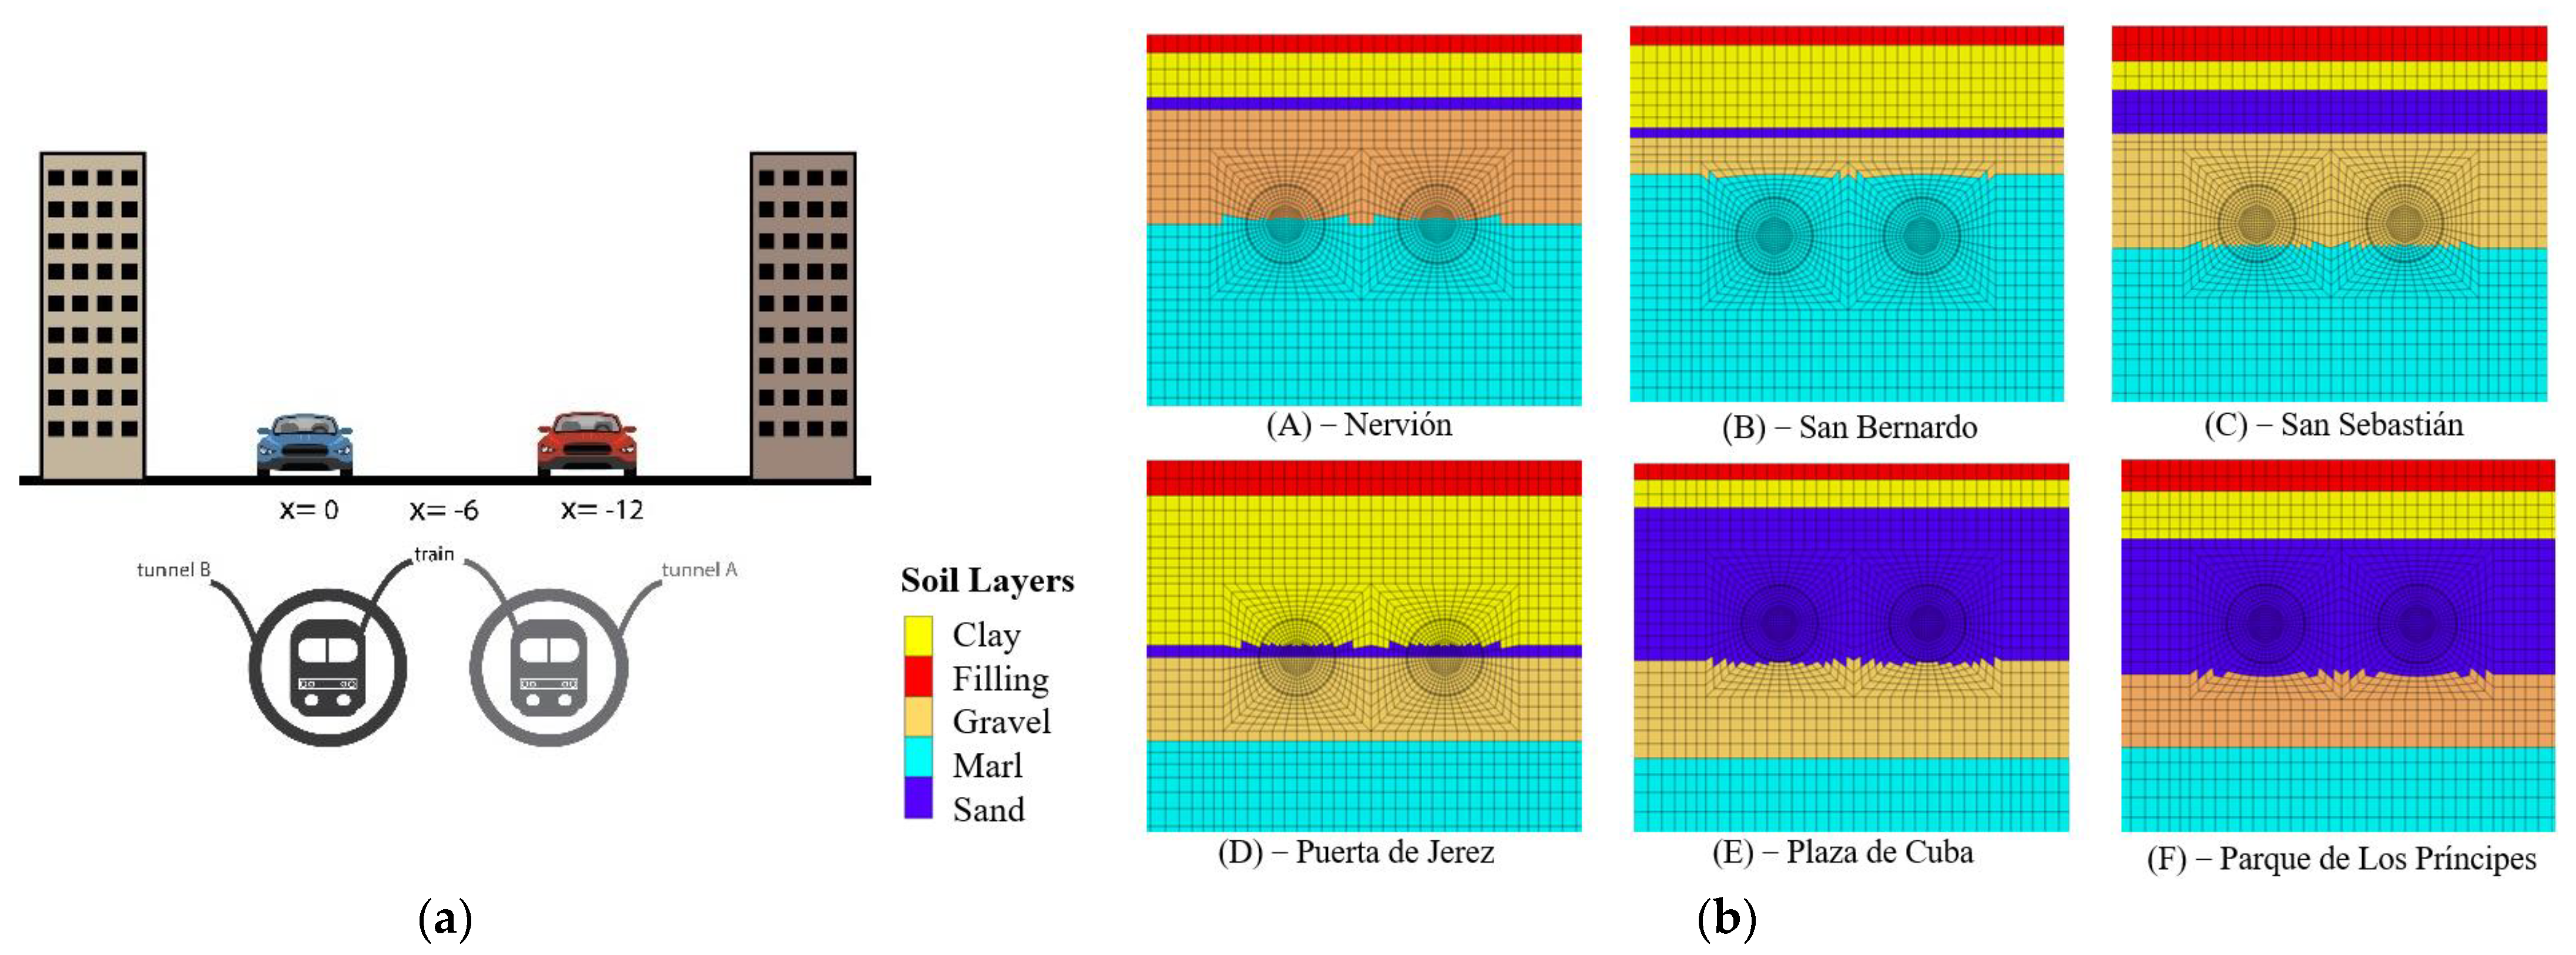
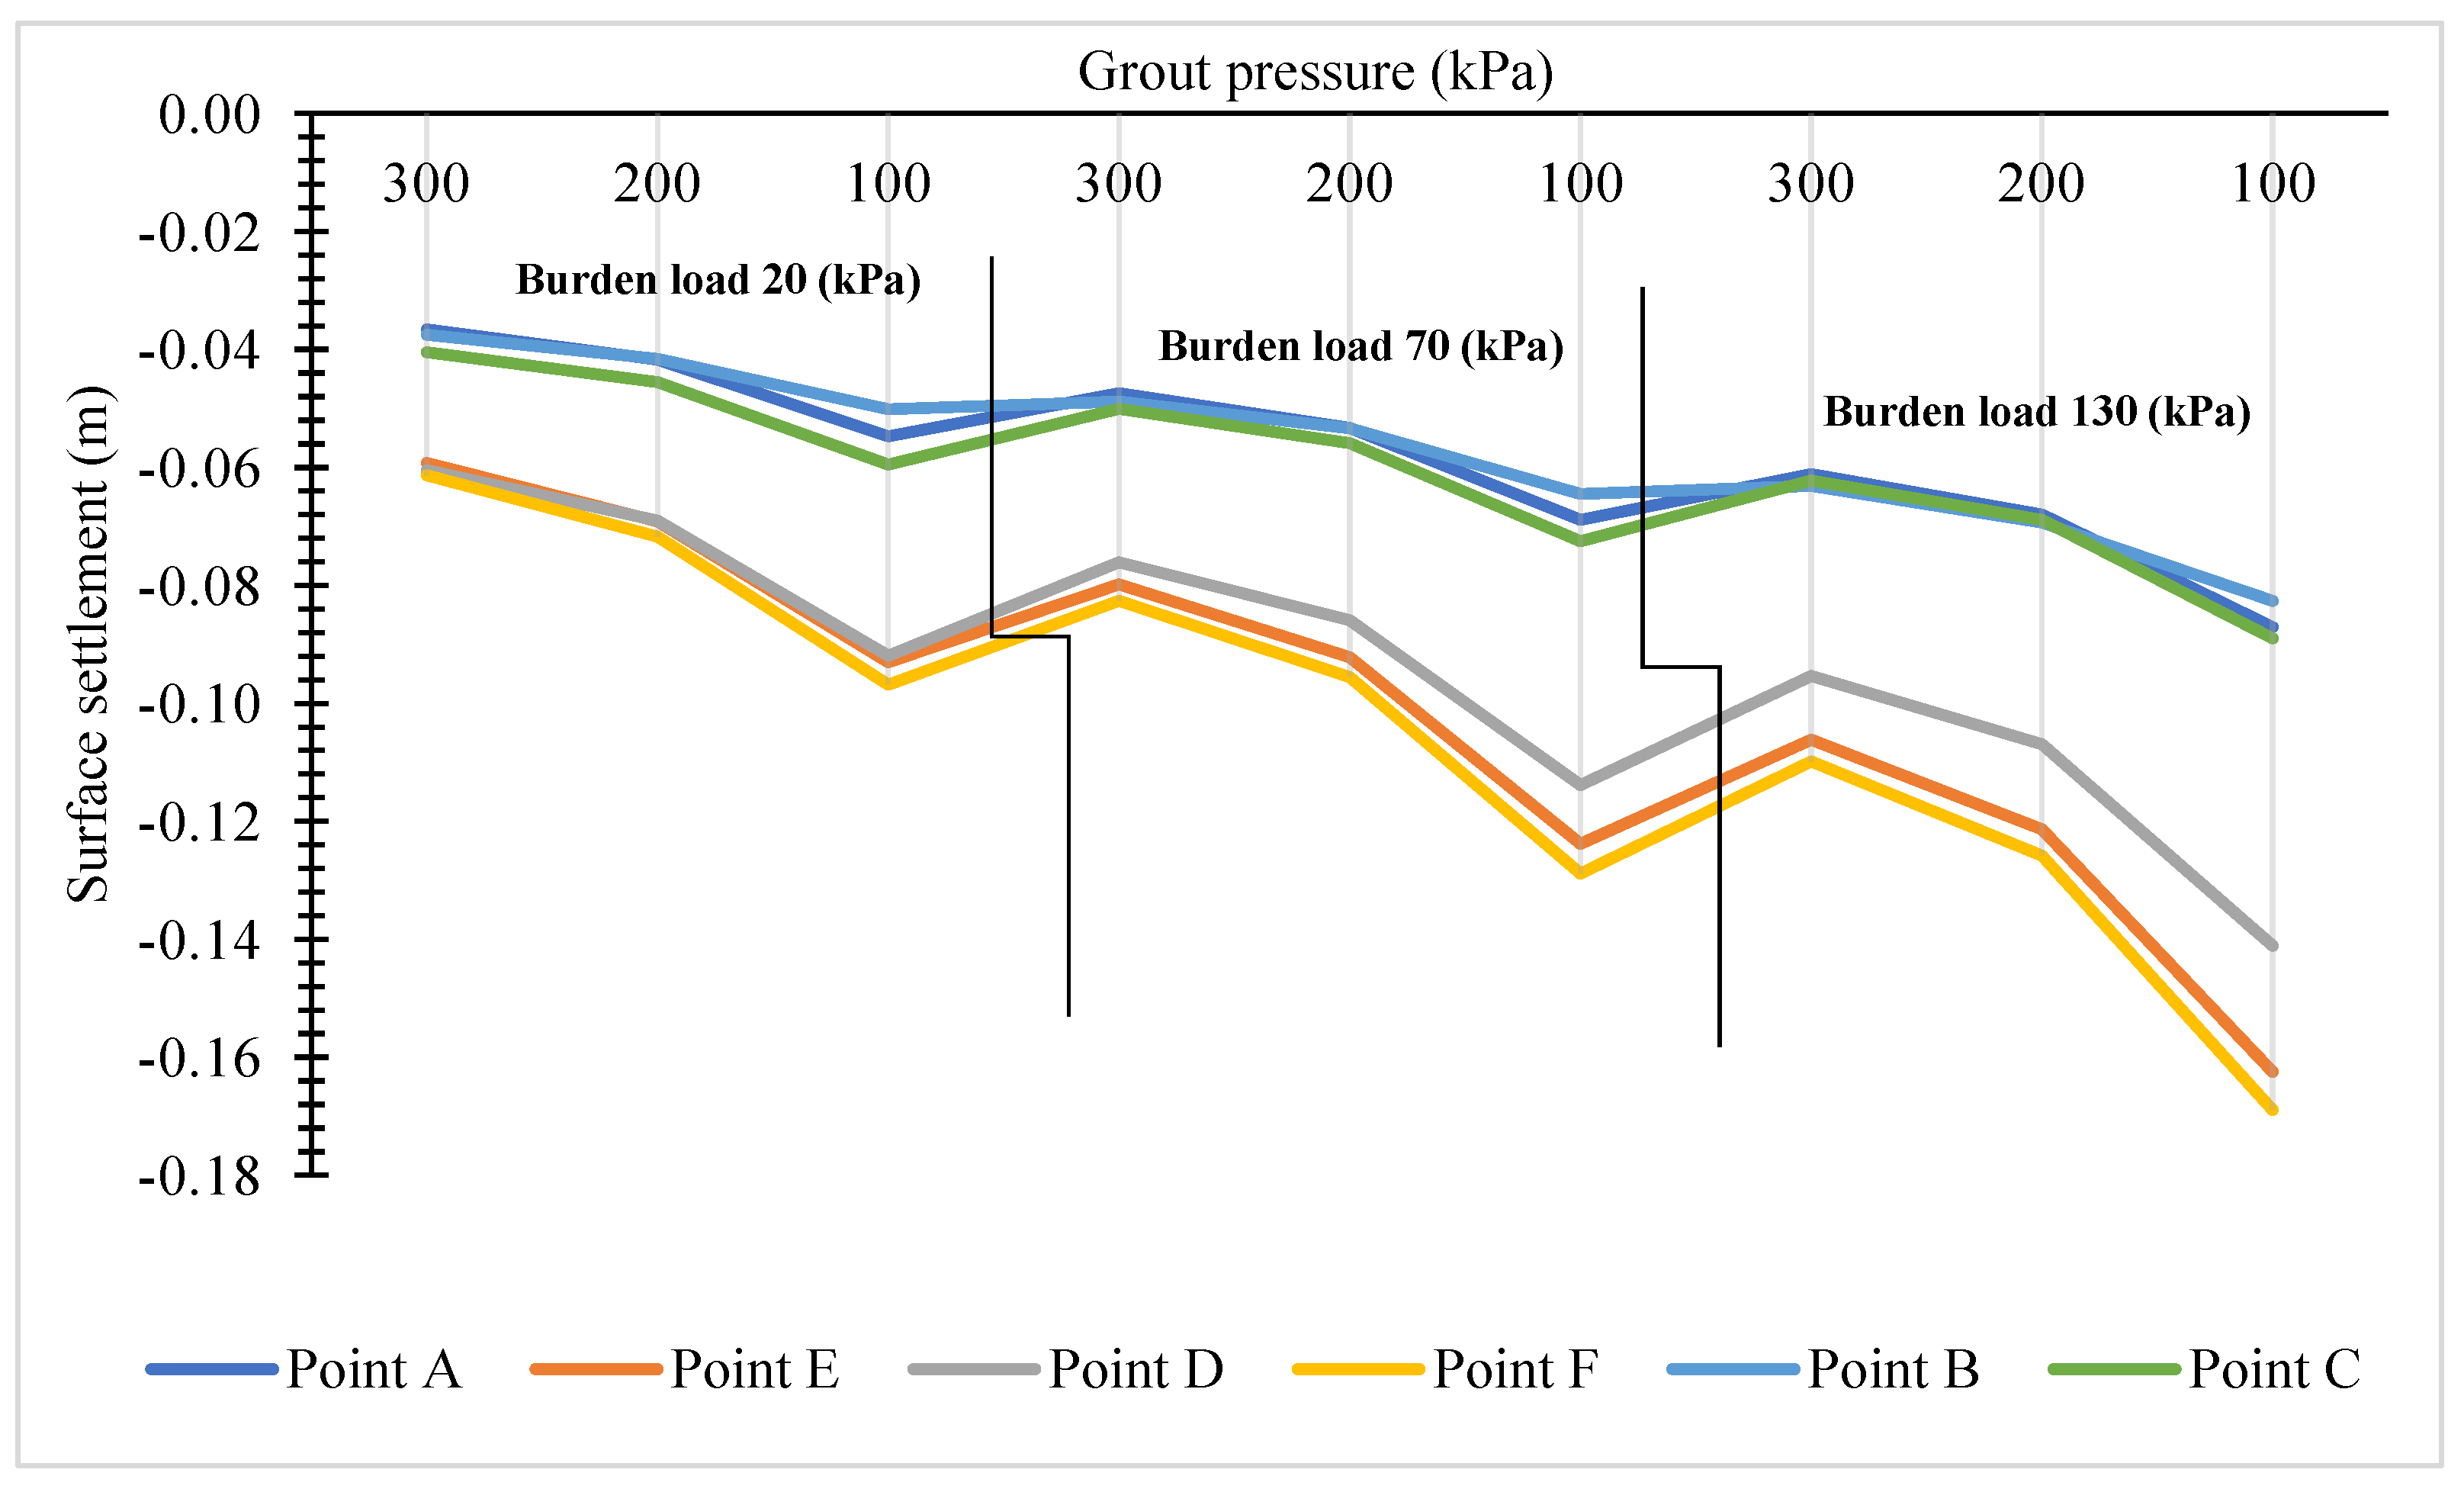
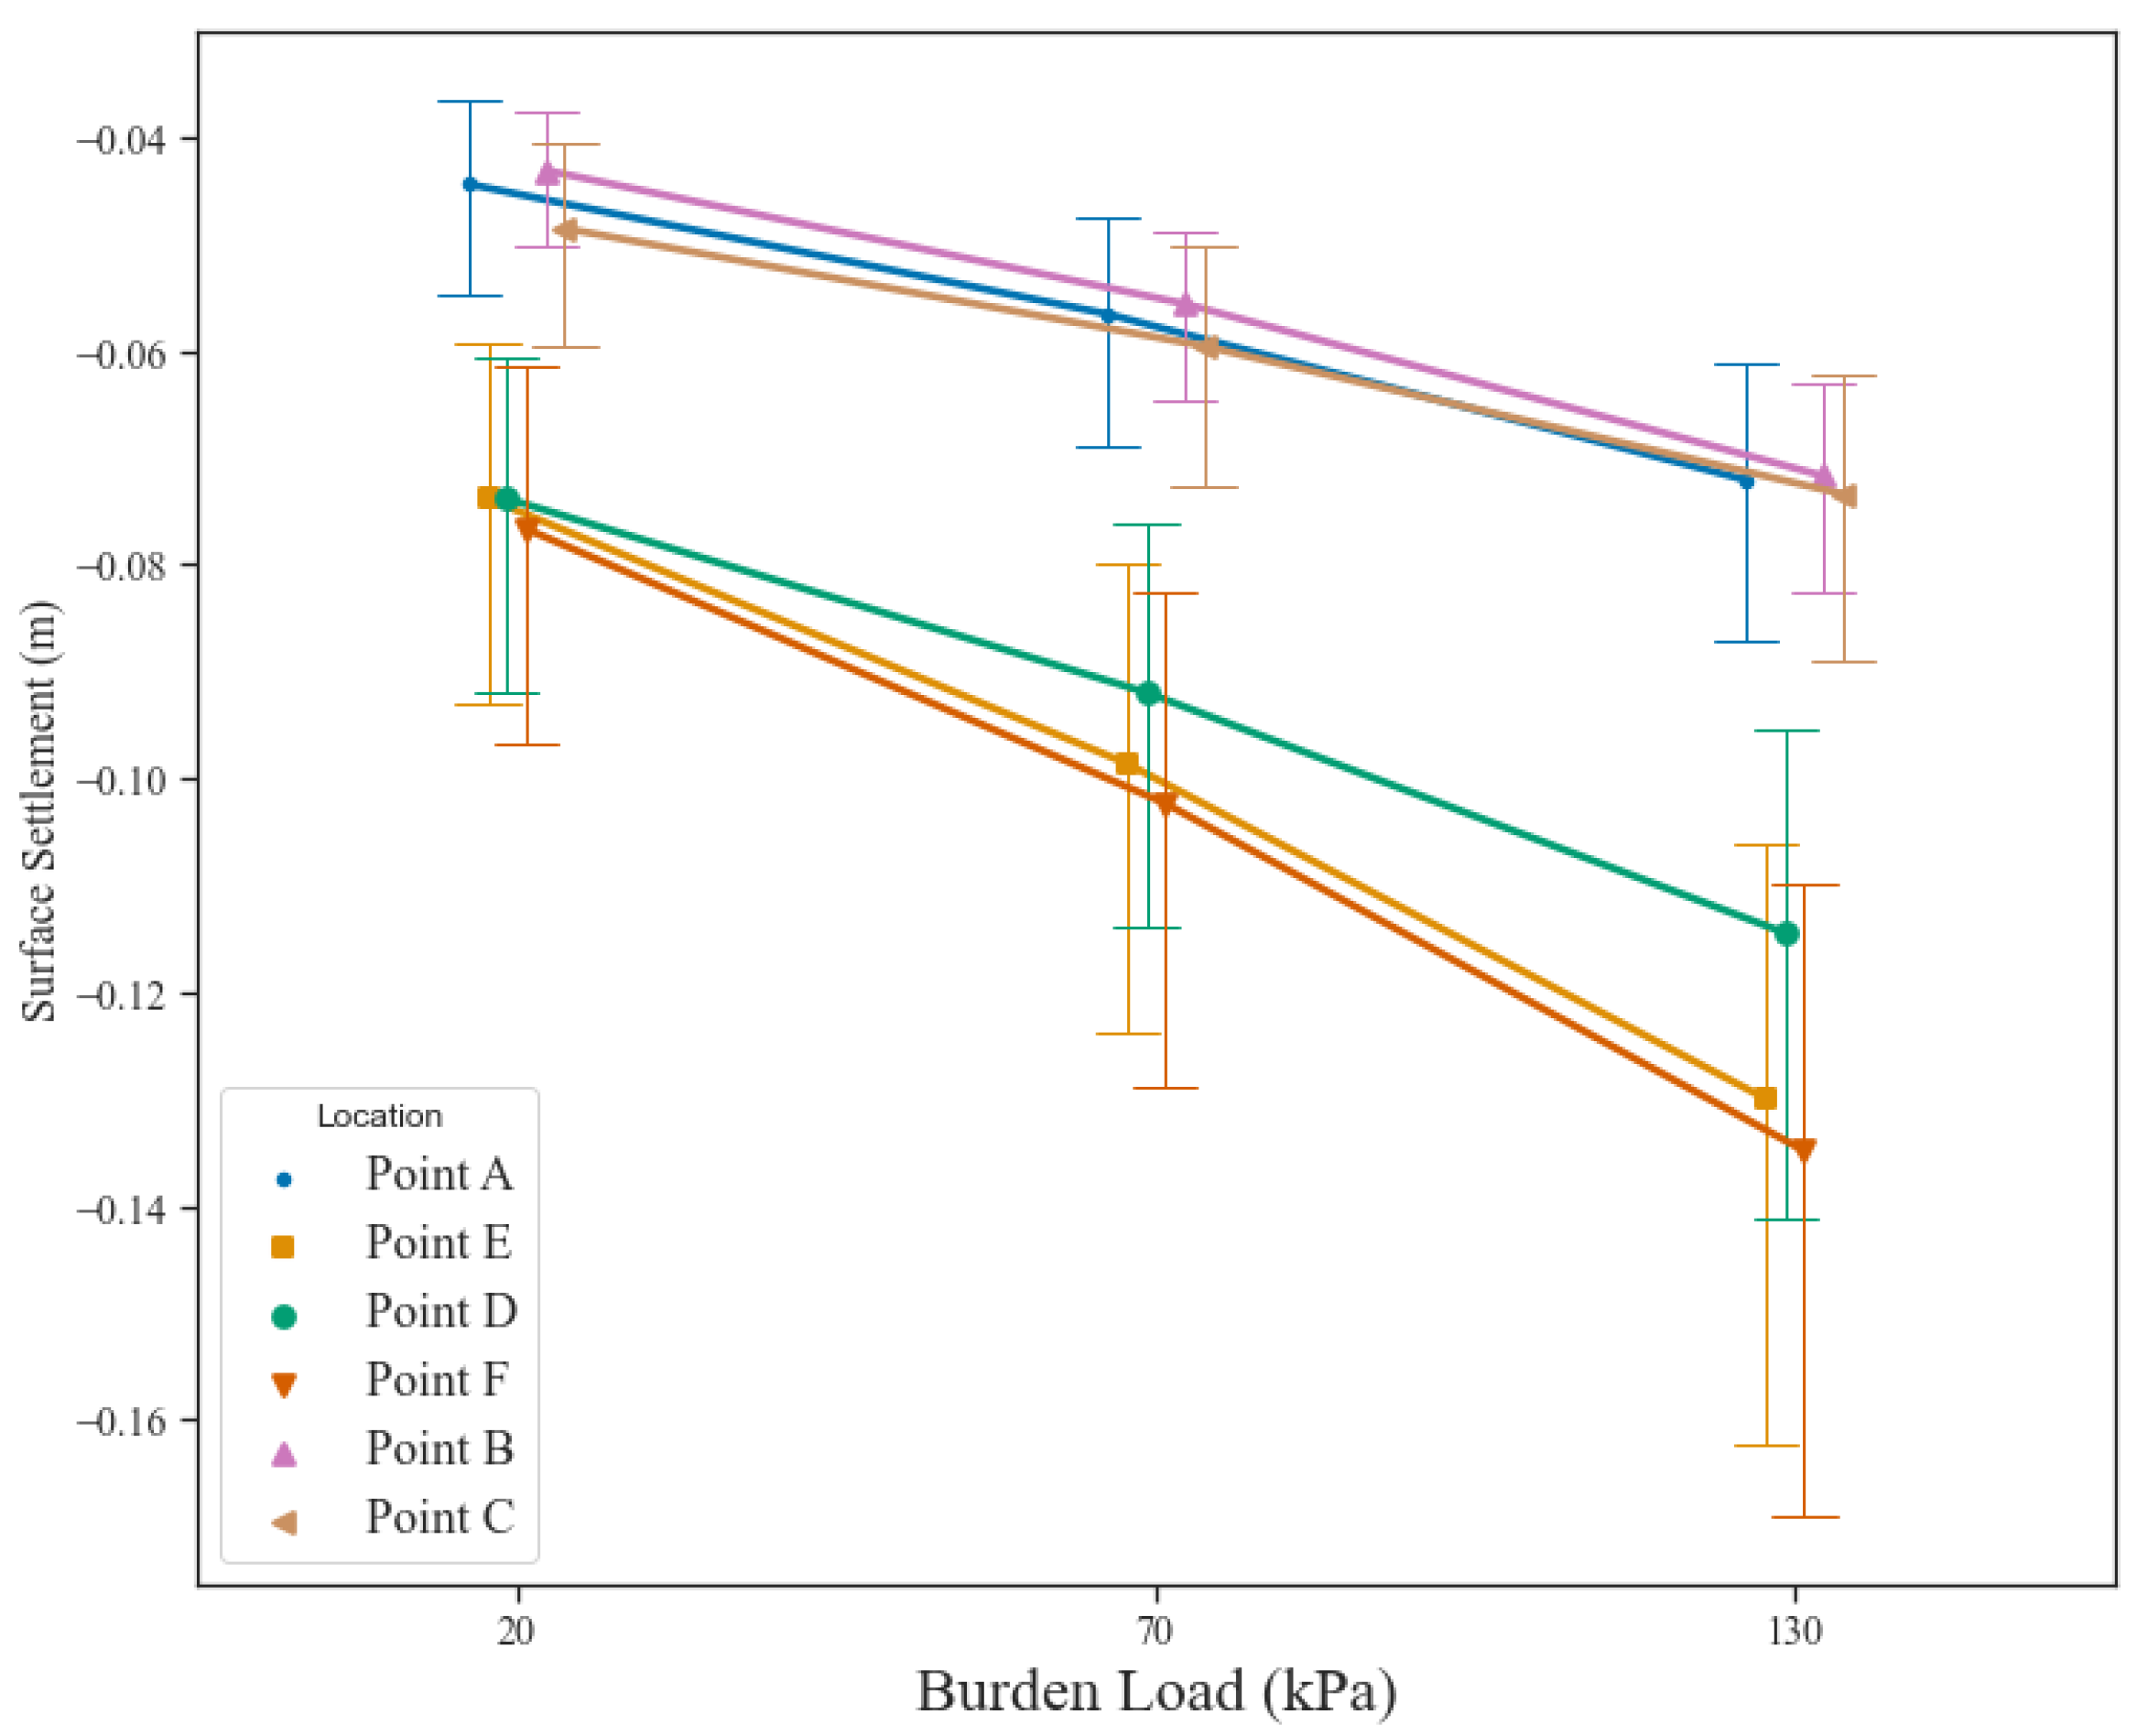
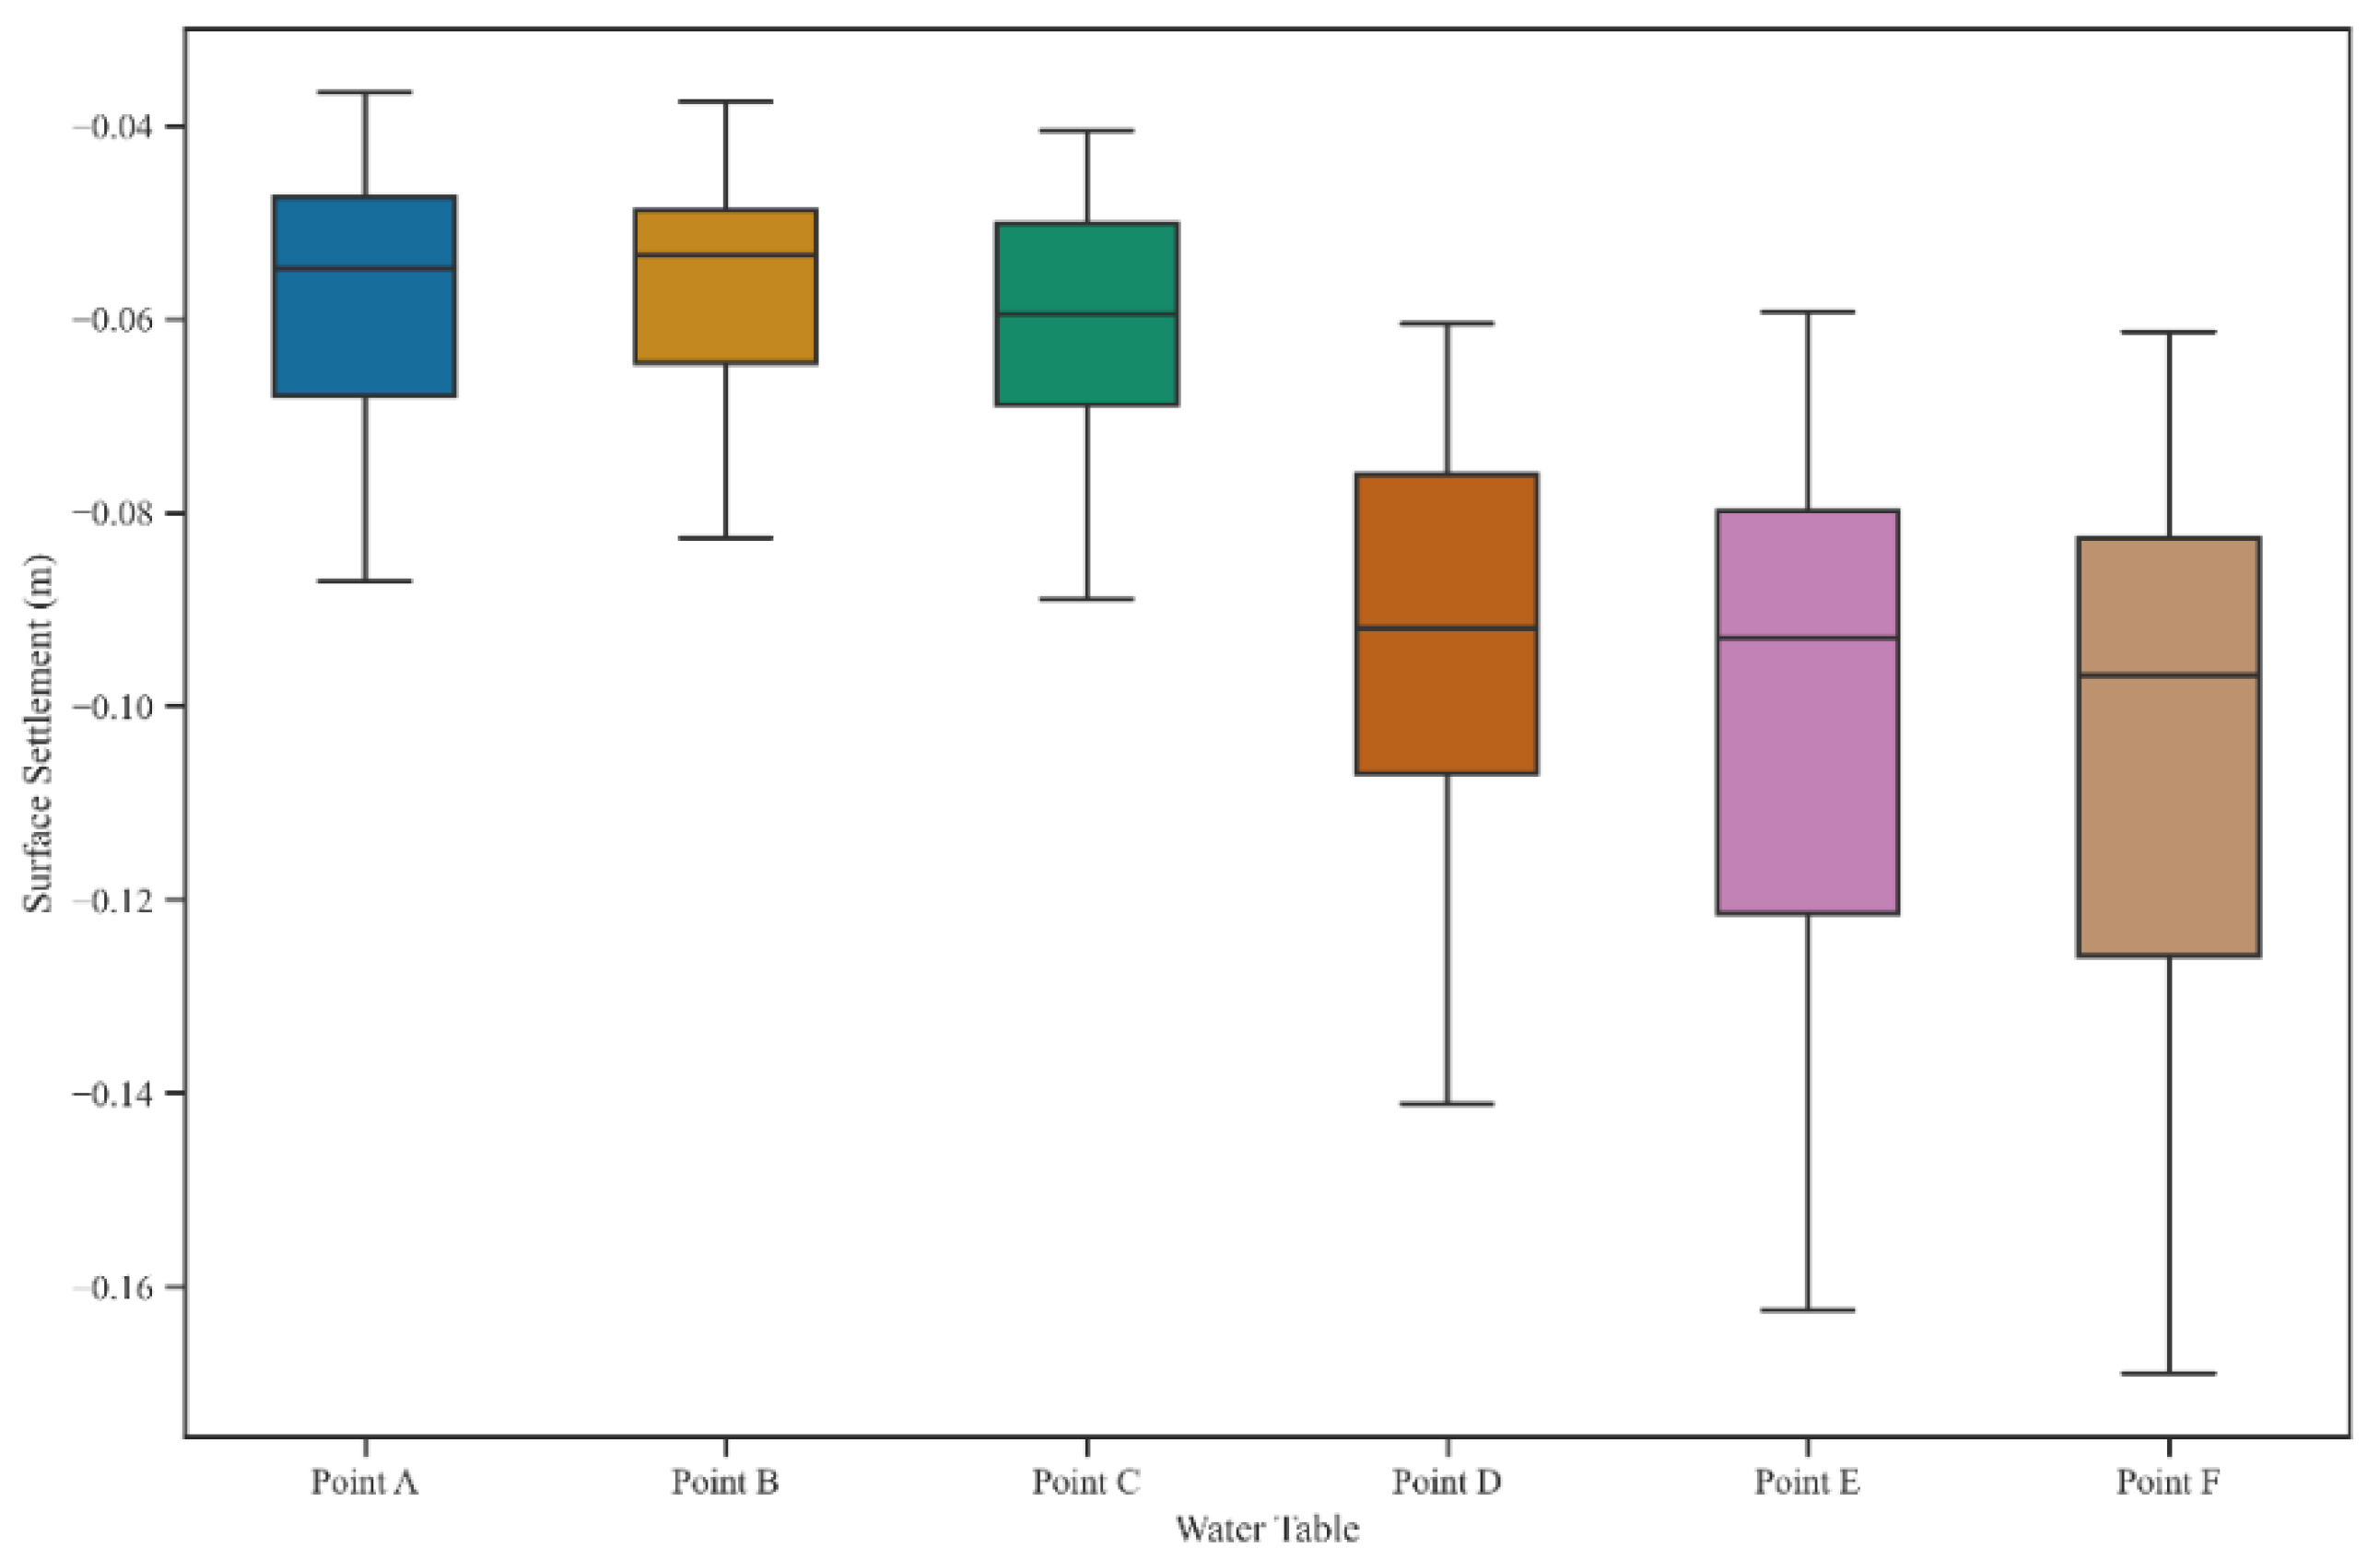
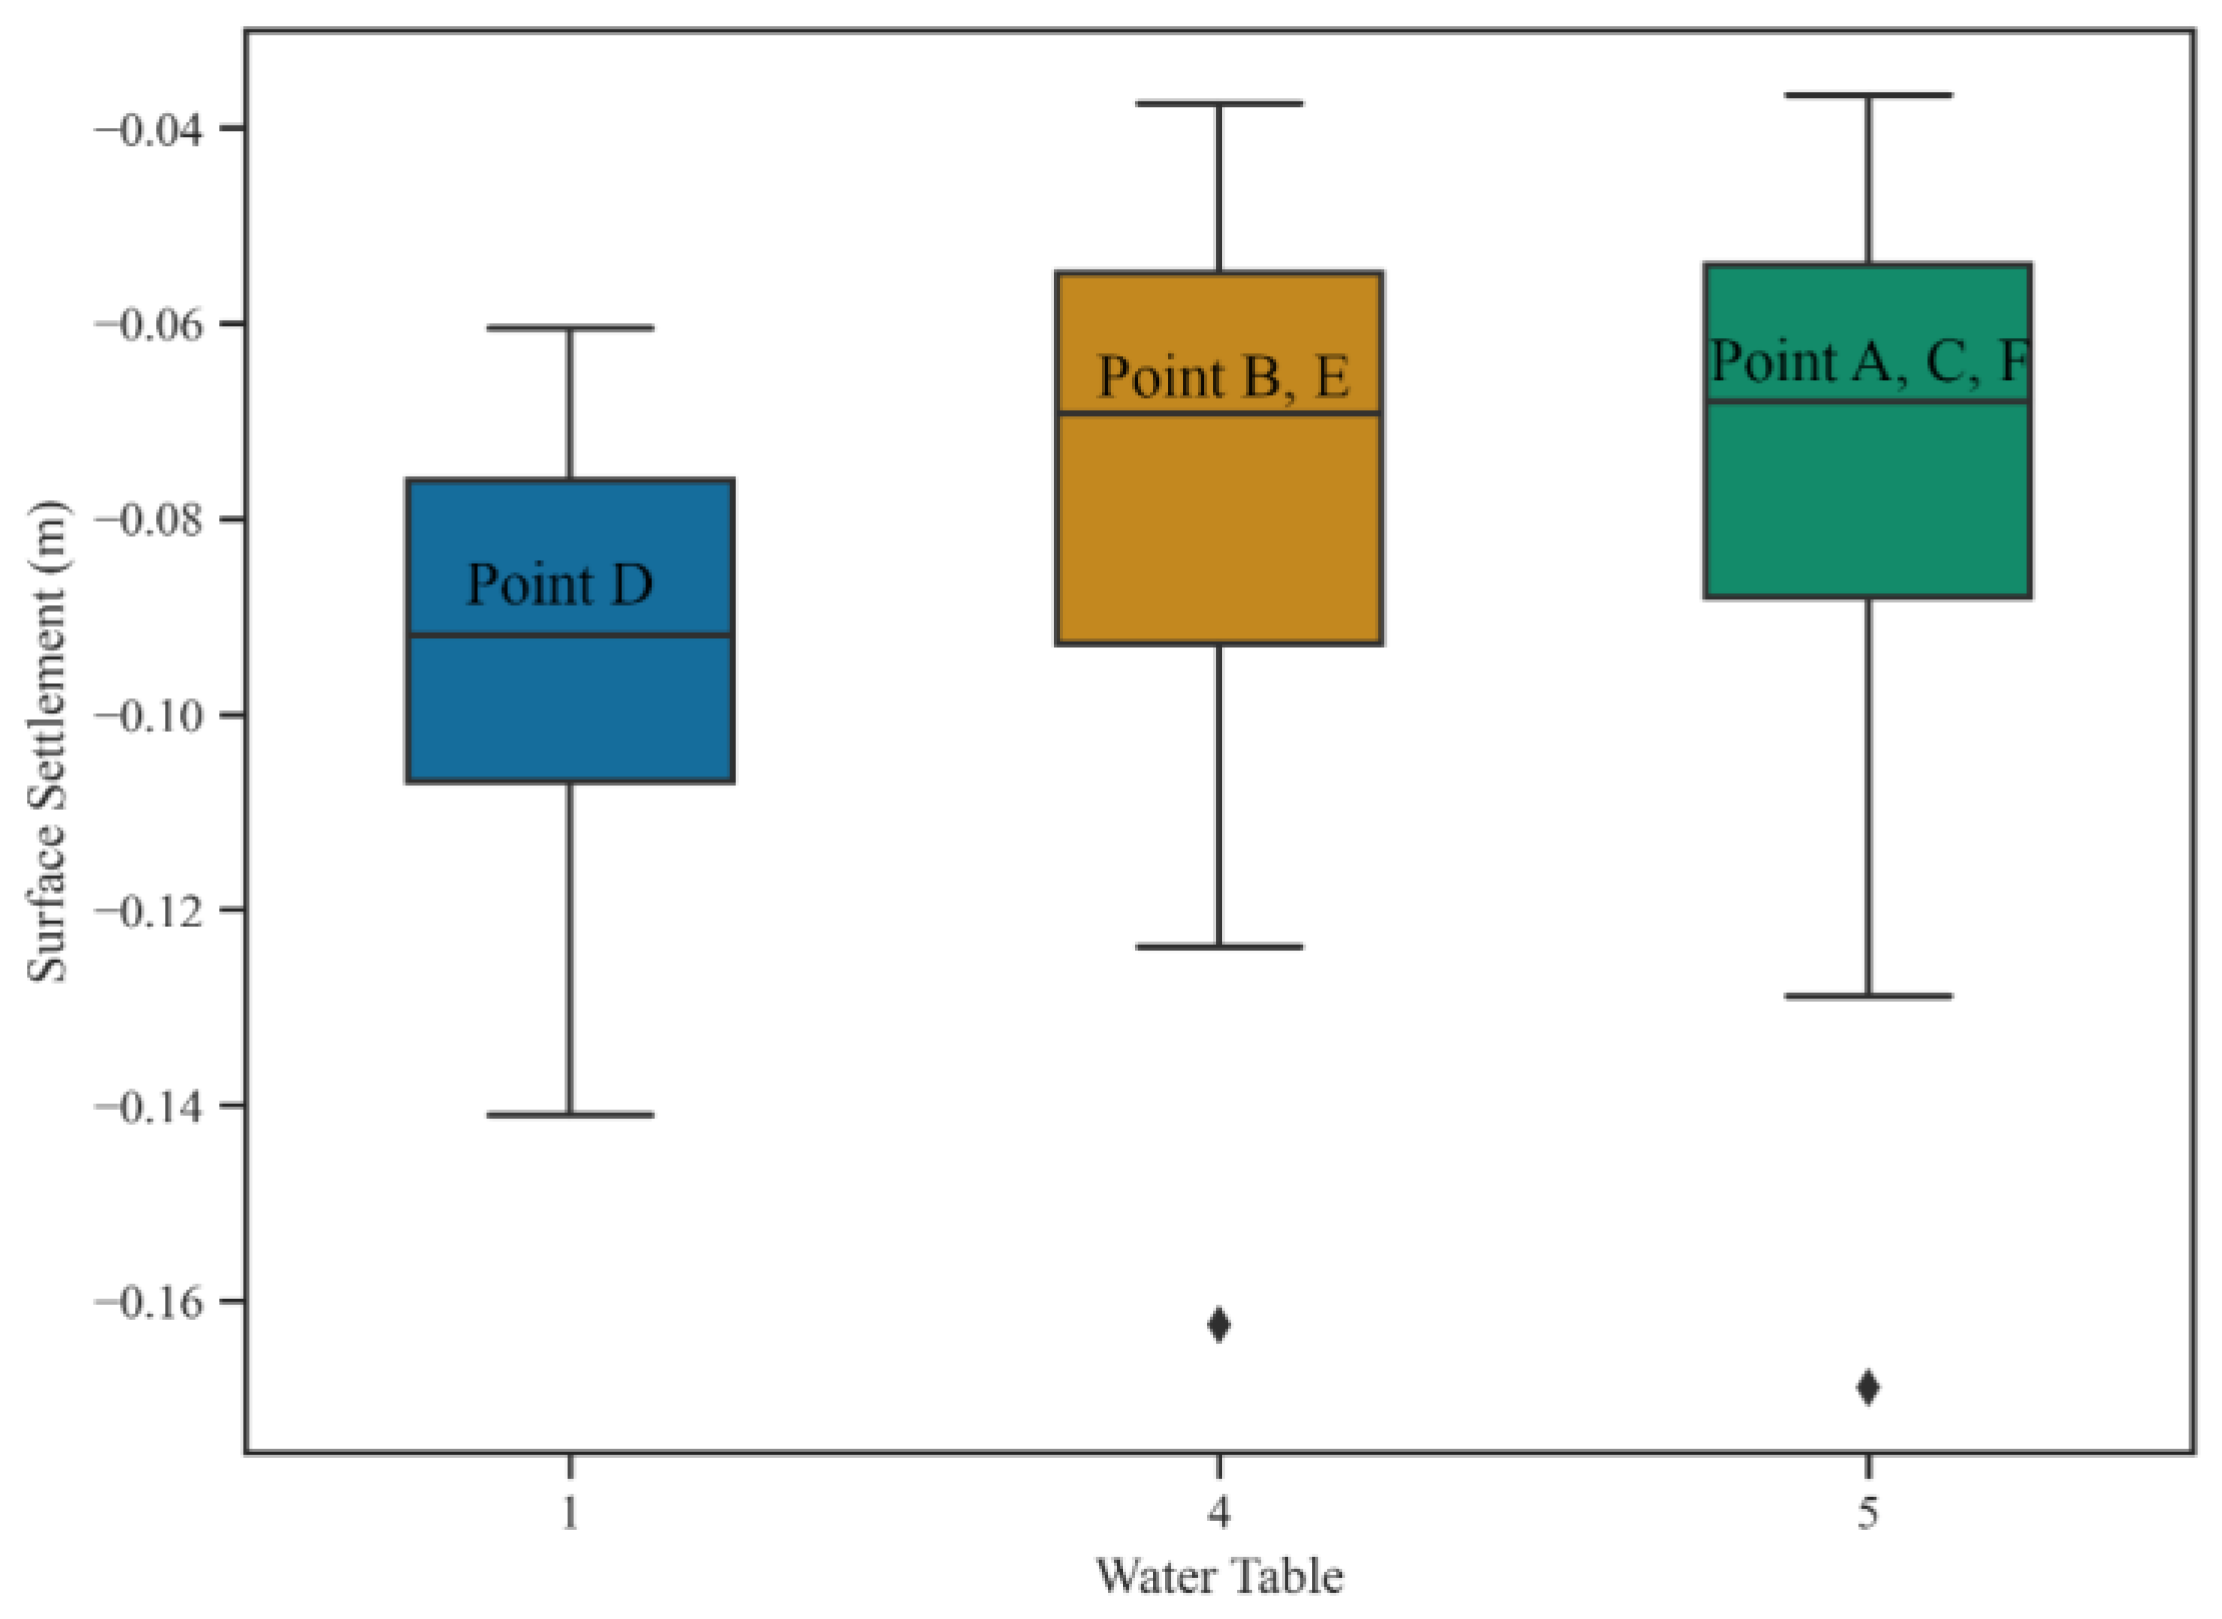
  • The ground displacement in crowded locations should be controlled and measured step by step, particularly where twin tunnels in the crowded location are excavated into sand. For instance, in this study, Points E and F were placed in sand. The average surface settlement for Points A, B, and C was −0.058, −0.057, and −0.06 m, respectively. However, the surface settlement average in Points D, E, and F were −0.093, −0.101, and −0.105 m, respectively. Moreover, the average surface settlement in Point F is 1.8 times more than in Point A, and the average surface settlement in Point D is 1.5 times greater than that in Point C.
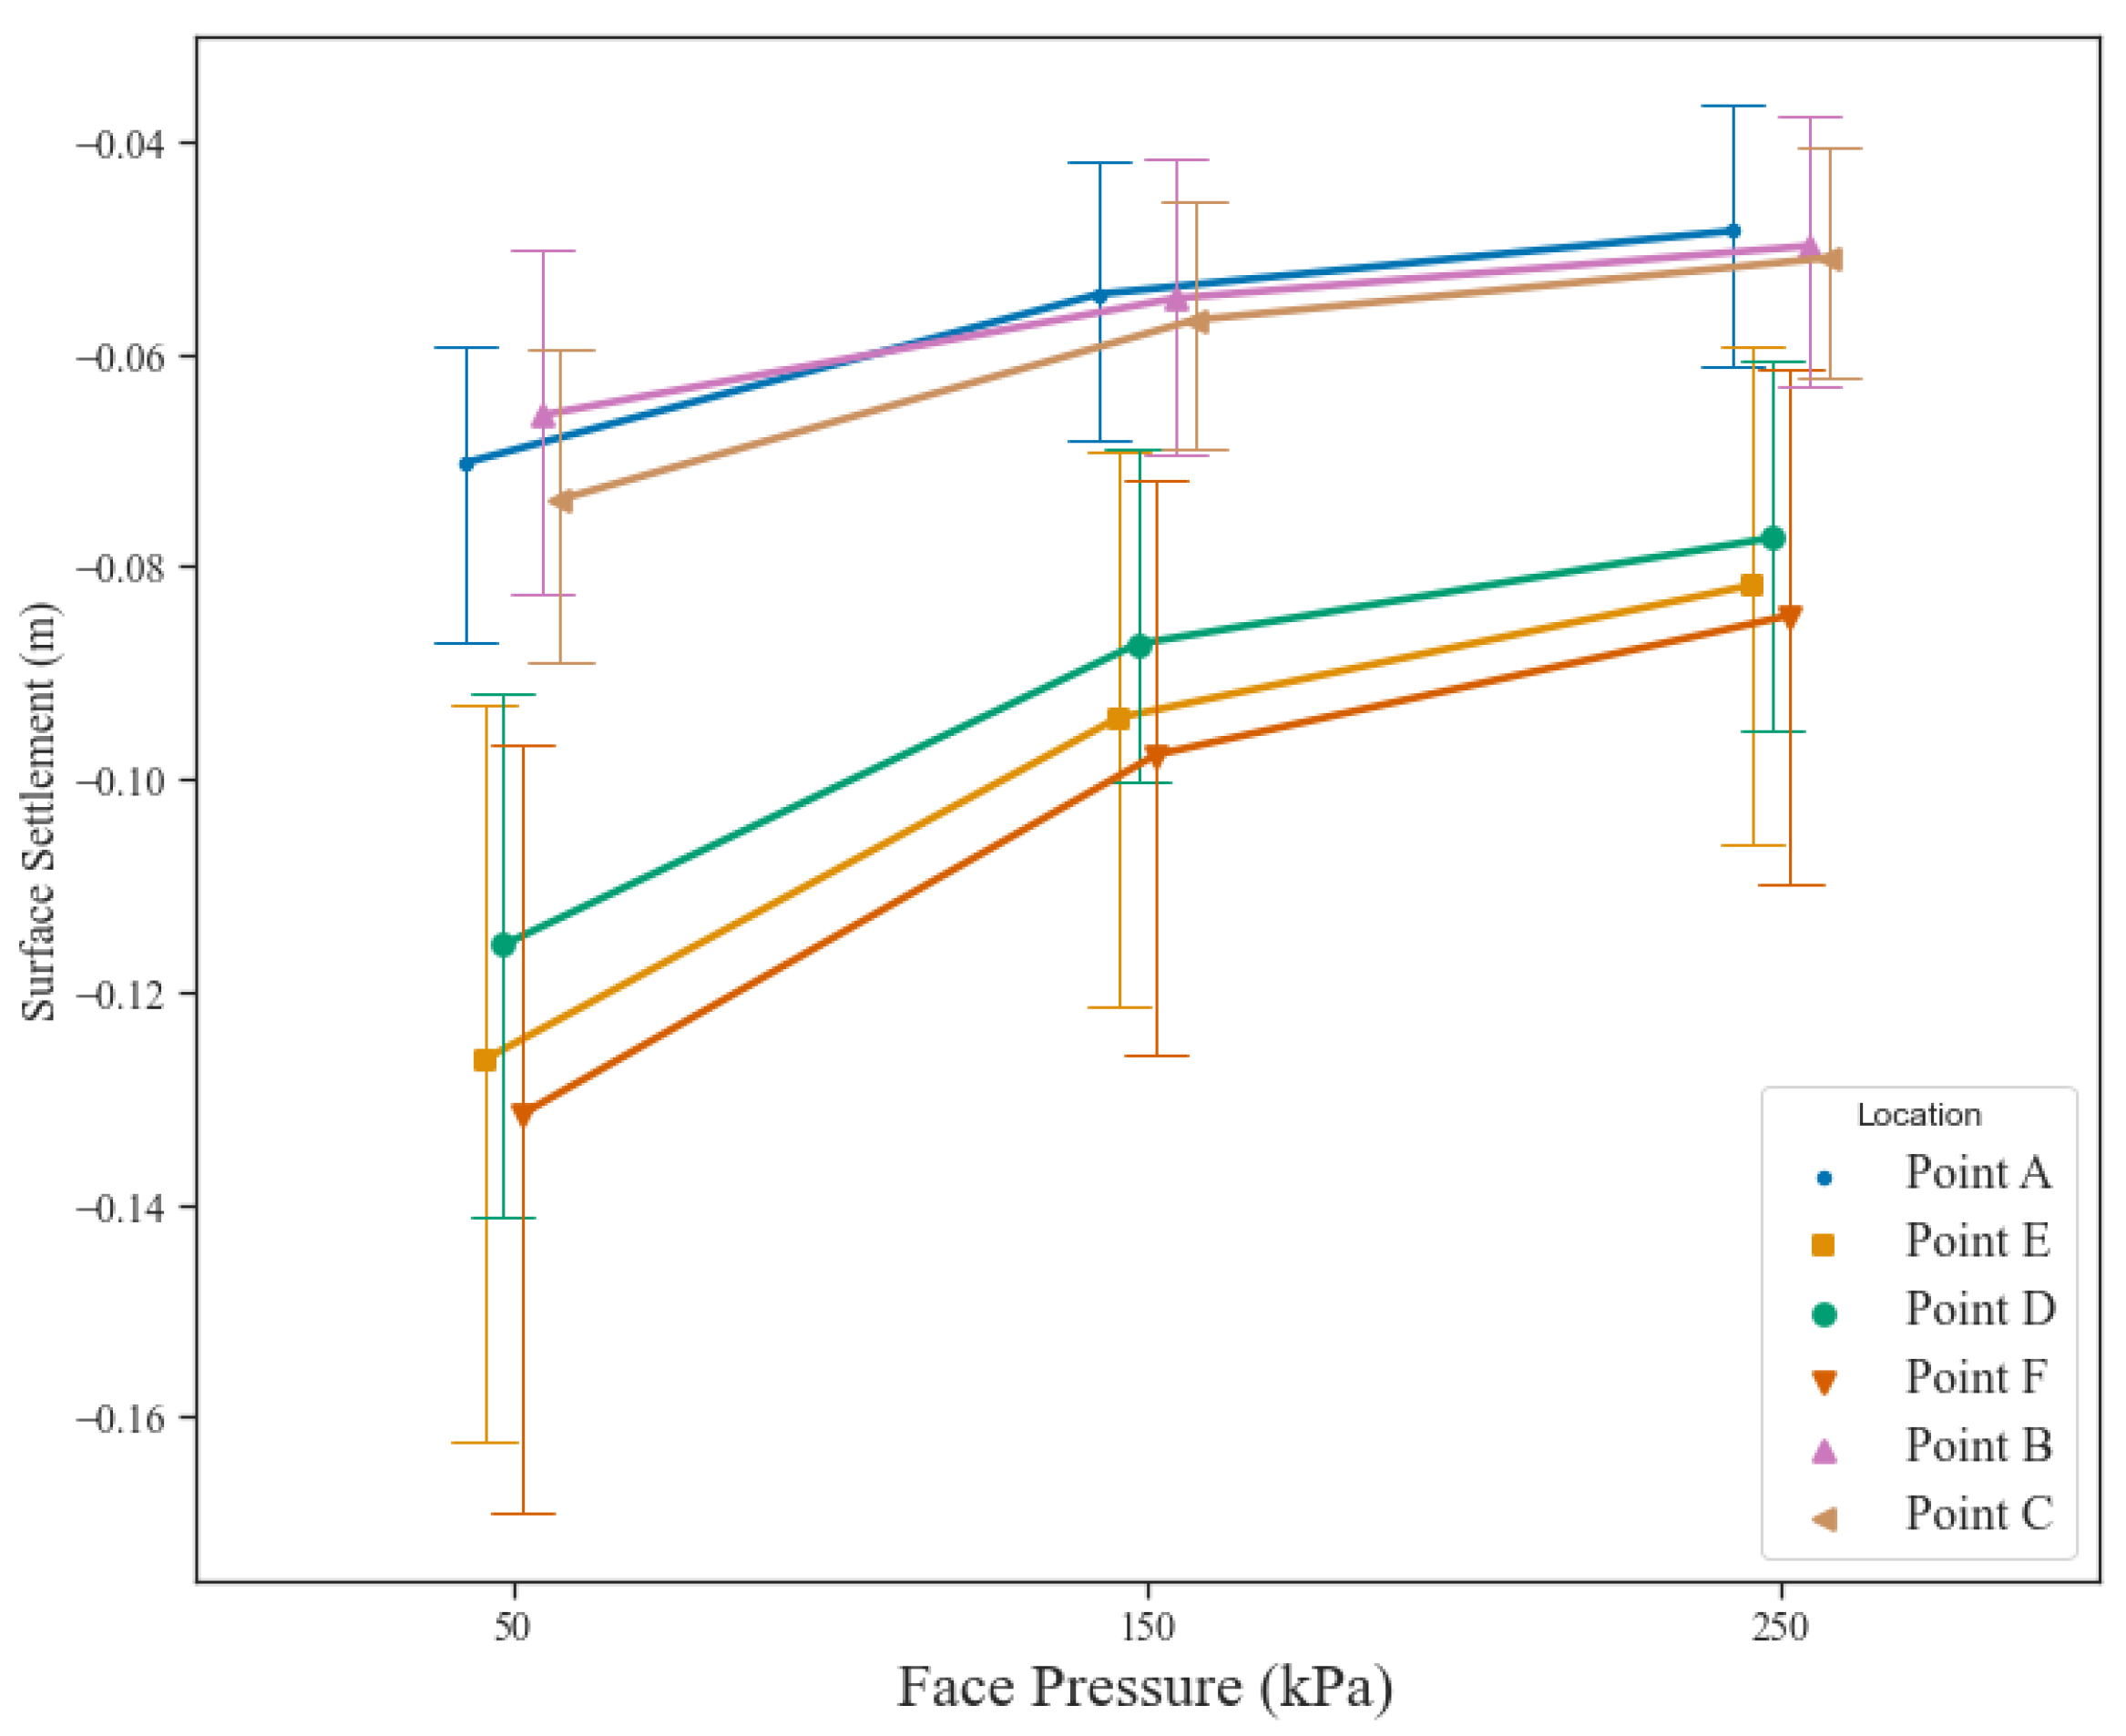
  • Face pressure and grout pressure have an indirect relationship with the surface settlement, and this study shows with increasing these pressures the surface settlement is decreased; it is notable that this pressure must be measured in a decent range because increasing the EPB face pressure and grouting pressure can cause swelling on the surface or hydraulic fracture in the soil.
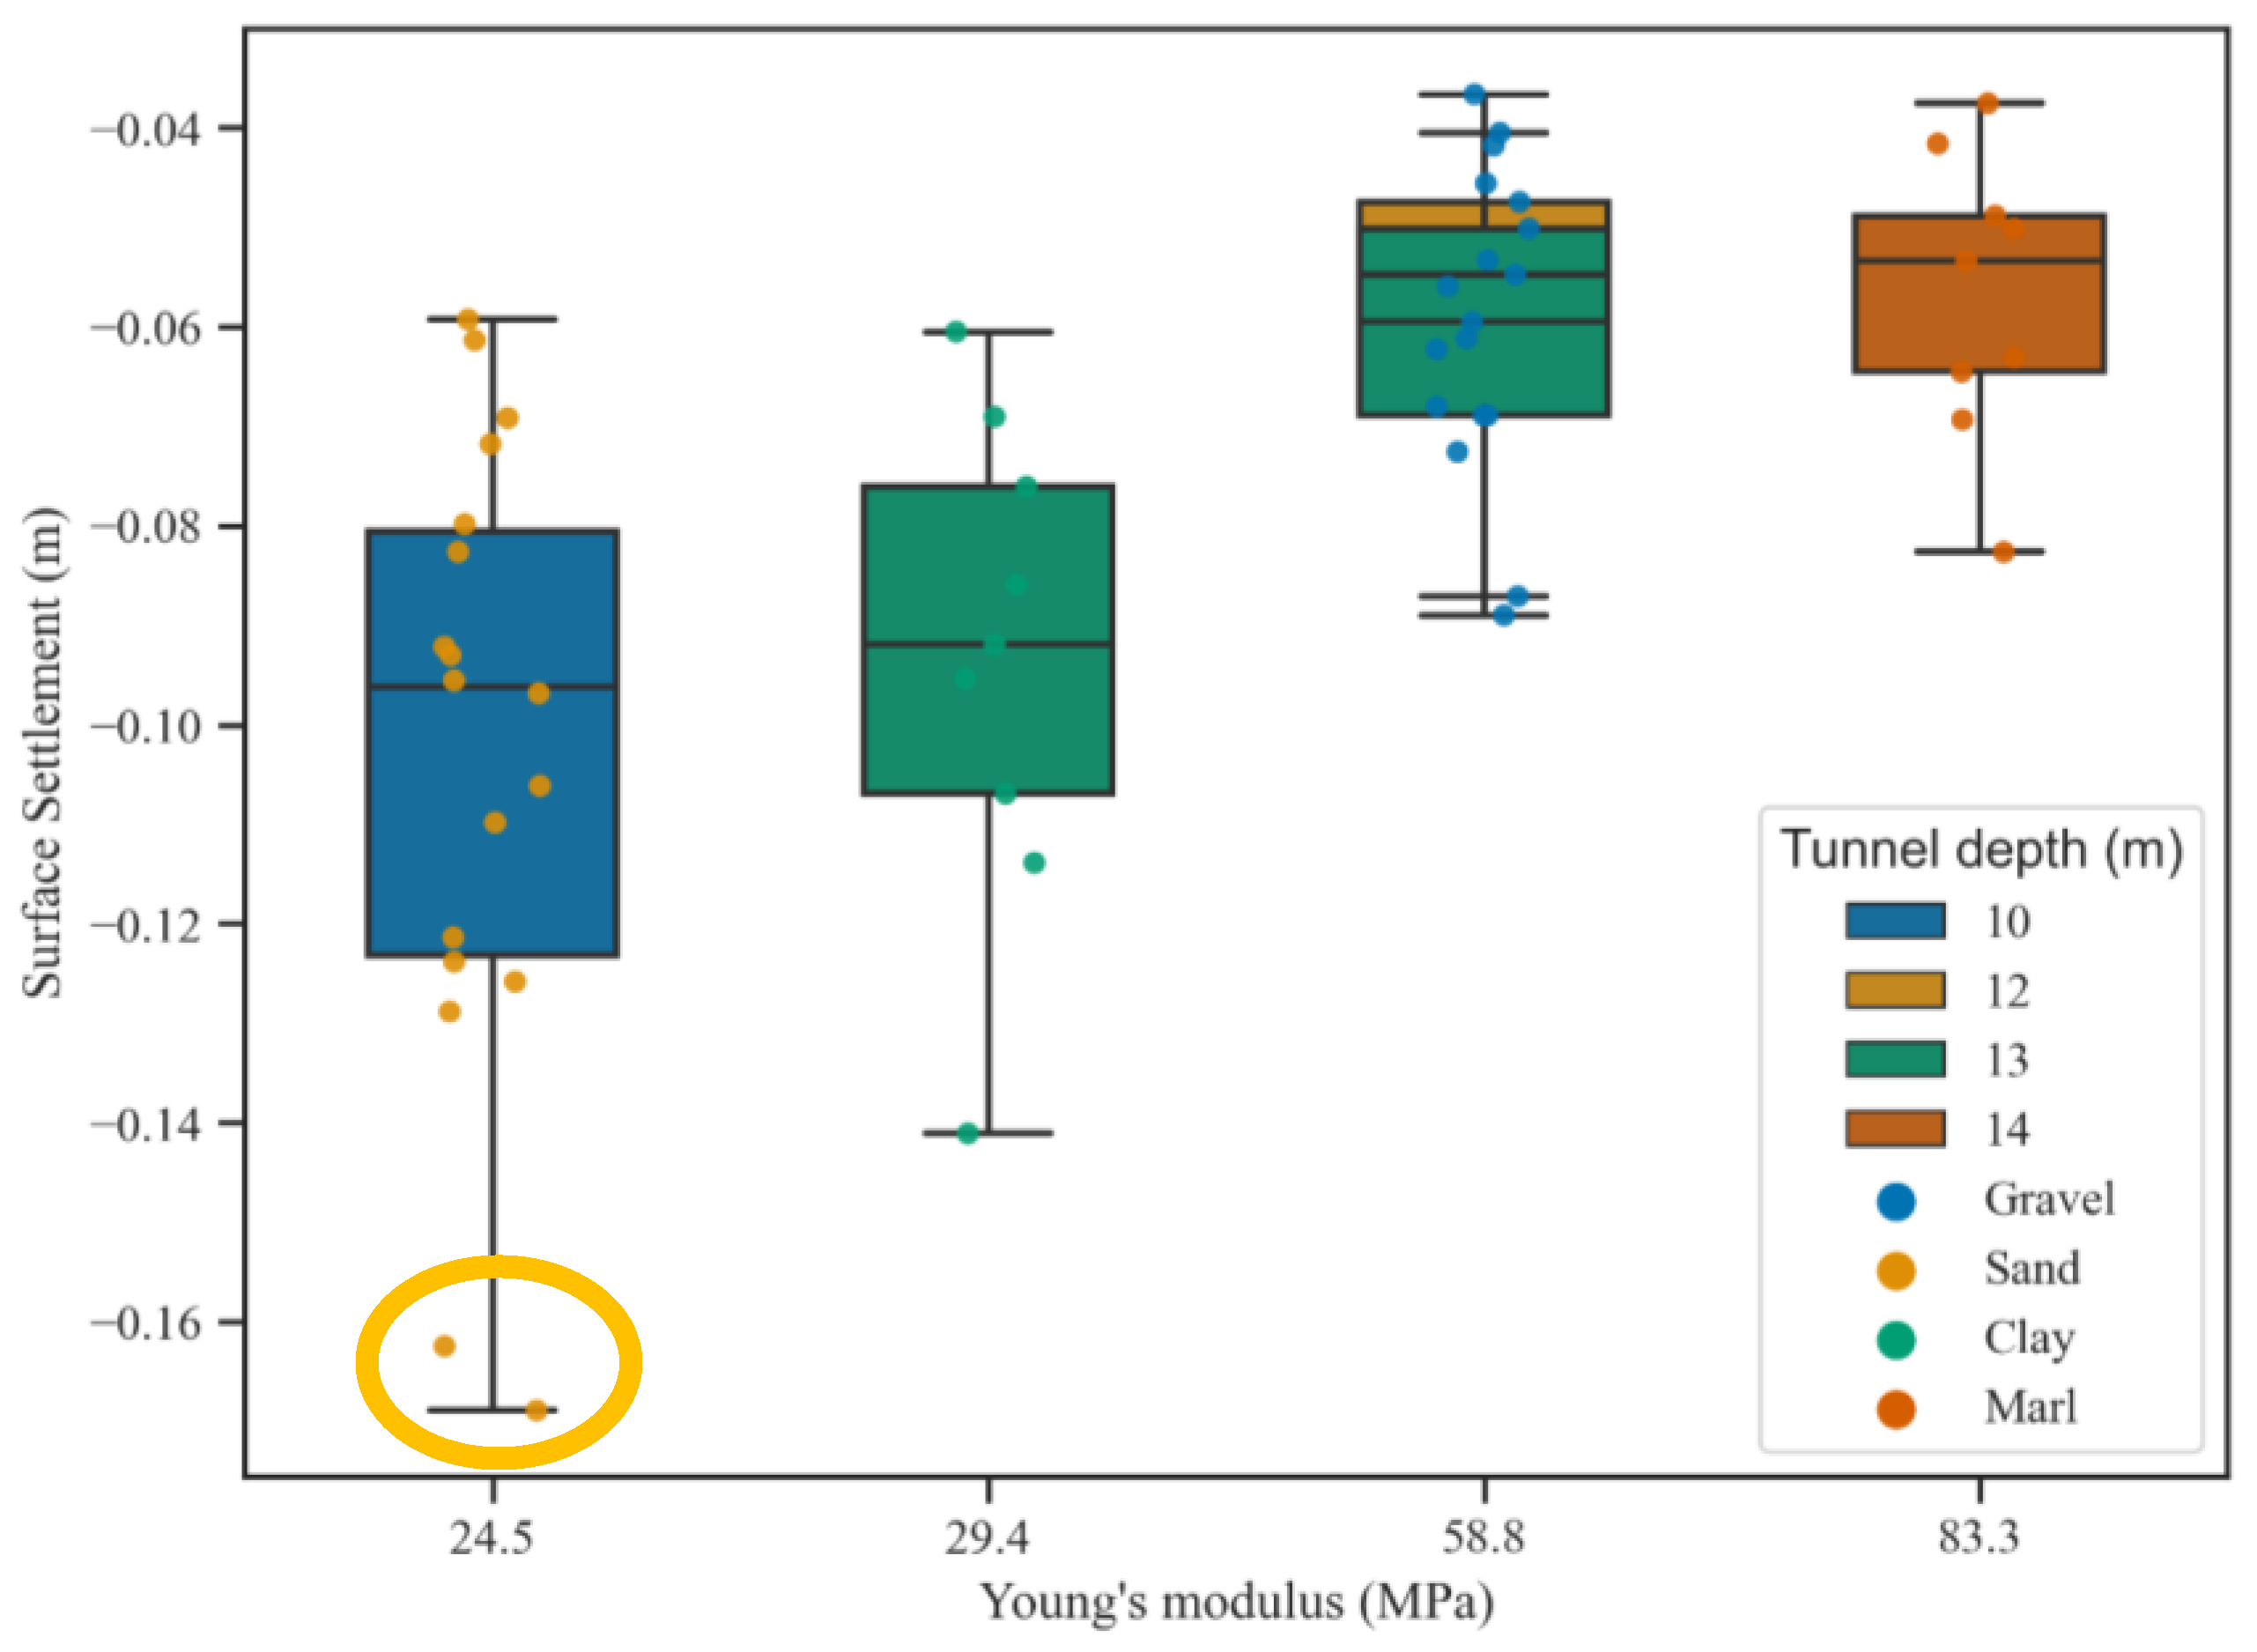
  • Excavating tunnels at greater depths or in stronger soil types (high Young’s modulus) would decrease the surface settlement in the tunnels of the metro of Seville. It can be observed that, in Points F and E, the shallower and weaker the soil is at the excavation site, the higher the variance. The range of surface settlement was changing approximately between 0.04 and 0.08 m, where Young’s modulus was 83.3 and 58.8. On the other hand, surface settlement was changing between 0.06 and 0.16 m when the Young’s modulus was set at 24.5. However, changing the depth of the tunnel could impact the results of this study. It is recommended that for tunnel excavation in the soft soil of Seville in the future, with increasing the depth of tunnel and grout pressure or assuming the ground treatment, the surface settlement would be reduced.
  • The water table and pore pressure of the soil also commands high priority. The existence of a shallow water table in gravel leads to a high amount of ground displacement into the crown of the tunnel and increases the surface settlement. For instance, the excavation process in Seville was halted for months in Point D for this reason. Moreover, ground treatment is suggested for dealing with the location where the water table is high. It is also recommended to decelerate EPB until the grouting has enough time to harden.
  • In tunnels excavated at a lower depth, surface settlement would be greater than in tunnels excavated at a deeper depth. The result was clear tunnels located on 10 m of surface that have more surface settlement than other tunnels. However, the soil properties have to be considered too.
  • In these simulations, when tunnels are excavated in the E and F, the burden load, face pressure, and grout pressure were 130, 50, and 100 kPa, respectively. The surface displacement at both points was 0.16 m. This amount of surface displacement is too high. Therefore, it is recommended when tunnels want to be excavated in these areas and the burden load is 130 kPa. The face pressure and grout pressure would be increased to 250 kPa and 300 kPa, respectively. Then the numerical study in FLAC3D shows that the surface displacement is reduced to approximately 0.10 m. Therefore, this sample shows the importance of face pressure and grout pressure in the underground excavation with EPB and controlling the surface displacement.
Finally, an increase in EPB pressure is also recommended for future excavation for other metro lines in crowded areas with a high burden load. It is clear that all parameters of excavation and soil properties should be considered next to each other because these parameters have an impact on each other.

Author Contributions

Conceptualisation, M.B., E.J.M.-A., R.R.-H. and A.J.-M.; Data curation, M.B.; Funding acquisition, M.B. and E.J.M.-A.; Investigation, M.B. and E.J.M.-A.; Methodology, E.J.M.-A. and R.R.-H.; Resources, R.R.-H. and C.S.-C.; Software, M.B.; Supervision, E.J.M.-A., R.R.-H., C.S.-C. and A.J.-M.; Validation, E.J.M.-A., R.R.-H., M.K., C.S.-C. and A.J.-M.; Visualization, M.K.; Writing—original draft, M.B.; Writing—review & editing, E.J.M.-A., M.K. and C.S.-C. All authors have read and agreed to the published version of the manuscript.

Funding

This research received no external funding.

Institutional Review Board Statement

Not applicable.

Informed Consent Statement

Not applicable.

Data Availability Statement

Not applicable.

Acknowledgments

This research has been supported by Itasca Consulting Group through its Itasca Educational Partnership (IEP) Programme, under whose framework the FLAC3D software licence used for the research has been provided. Therefore, the authors would like to thank the ITASCA consulting group for their support and guidance. Additionally, the authors would like to thank Pedro Arozamena-Cagigal for his assistance and support in this research.

Conflicts of Interest

The authors declare no conflict of interest.

References

  1. Department of Economic & Social Affairs of United Nations. World Urbanization Prospects: The 2018 Revision; United Nations: New York, NY, USA, 2019; Volume 12. [Google Scholar]
  2. Williams, M.; Edgeworth, M.; Zalasiewicz, J.; Waters, C.N.; Steffen, W.; Wolfe, A.P.; Minter, N.J.; Cearreta, A.; Gałuszka, A.; Haff, P.; et al. Underground metro systems. A durable geological proxy of rapid urban population growth and energy consumption during the Anthropocene. In The Routledge Companion to Big History; Routledge, Taylor & Francis Group: London, UK, 2019; pp. 434–455. [Google Scholar]
  3. Qiao, Y.-K.; Peng, F.-L.; Sabri, S.; Rajabifard, A. Socio-environmental costs of underground space use for urban sustainability. Sustain. Cities Soc. 2019, 51, 101757. [Google Scholar] [CrossRef]
  4. Li, X.; Li, C.; Parriaux, A.; Wu, W.; Li, H.; Sun, L.; Liu, C. Multiple resources and their sustainable development in Urban Underground Space. Tunn. Undergr. Space Technol. 2016, 55, 59–66. [Google Scholar] [CrossRef]
  5. Mahajan, S.; Ayothiraman, R.; Sharma, K.G. A Parametric Study on Effects of Basement Excavation and Foundation Loading on Underground Metro Tunnel in Soil. Indian Geotech. J. 2019, 49, 667–686. [Google Scholar] [CrossRef]
  6. Hellawell, E.E.; Hawley, J.; Pooley, A.J.; Eskesen, S.D.; Garrod, B.; Leggett, M. Metros under construction around the world. Geotech. Eng. 2001, 149, 29–39. [Google Scholar] [CrossRef]
  7. Topal, C.; Mahmutoğlu, Y. Assessment of surface settlement induced by tunnel excavations for the Esenler–Başakşehir (Istanbul, Turkey) Subway Line. Environ. Earth Sci. 2021, 80, 188. [Google Scholar] [CrossRef]
  8. Gong, C.; Ding, W.; Xie, D. Twin EPB tunneling-induced deformation and assessment of a historical masonry building on Shanghai soft clay. Tunn. Undergr. Space Technol. 2020, 98, 103300. [Google Scholar] [CrossRef]
  9. Masini, L.; Gaudio, D.; Rampello, S.; Romani, E. Observed Performance of a Deep Excavation in the Historical Center of Rome. J. Geotech. Geoenvironmental Eng. 2021, 147, 05020015. [Google Scholar] [CrossRef]
  10. Papastamos, G.; Stiros, S.; Saltogianni, V.; Kontogianni, V. 3-D strong tilting observed in tall, isolated brick chimneys during the excavation of the Athens Metro. Appl. Geomat. 2014, 7, 115–121. [Google Scholar] [CrossRef]
  11. Qiu, J.; Qin, Y.; Feng, Z.; Wang, L.; Wang, K. Safety Risks and Protection Measures for City Wall during Construction and Operation of Xi’an Metro. J. Perform. Constr. Facil. 2020, 34, 04020003. [Google Scholar] [CrossRef]
  12. Lai, J.; Zhou, H.; Wang, K.; Qiu, J.; Wang, L.; Wang, J.; Feng, Z. Shield-driven induced ground surface and Ming Dynasty city wall settlement of Xi’an metro. Tunn. Undergr. Space Technol. 2019, 97, 103220. [Google Scholar] [CrossRef]
  13. Golpasand, M.-R.B.; Do, N.A.; Dias, D. Impact of pre-existent Qanats on ground settlements due to mechanized tunneling. Transp. Geotech. 2019, 21, 100262. [Google Scholar] [CrossRef]
  14. Namazi, E.; Hajihassani, M.; Gilani, S.O.; Zolfegharifar, S.Y. Risk Assessment of Building Damage Induced by Tunnelling Through a Gene Expression Programming Model. Geotech. Geol. Eng. 2022, 40, 2357–2370. [Google Scholar] [CrossRef]
  15. Mazo, C.O.; Cagigal, P.A.; Saavedra, F.M.; Álvarez, R. Geotechnical problems during the soil boring in the Seville underground (Spain). In Proceedings of the 17th International Conference on Soil Mechanics and Geotechnical Engineering: The Academia and Practice of Geotechnical Engineering, Alexandria, Egypt, 5–9 October 2009; Volome 3; pp. 2461–2464. [Google Scholar] [CrossRef]
  16. Islam, S.; Iskander, M. Twin tunnelling induced ground settlements: A review. Tunn. Undergr. Space Technol. 2021, 110, 103614. [Google Scholar] [CrossRef]
  17. Peiró, J.; Sherwin, S. Finite Difference, Finite Element and Finite Volume Methods for Partial Differential Equations. In Handbook of Materials Modeling; Springer: Dordrecht, The Netherlands, 2005; pp. 2415–2446. [Google Scholar]
  18. Chheng, C.; Likitlersuang, S. Underground excavation behaviour in Bangkok using three-dimensional finite element method. Comput. Geotech. 2018, 95, 68–81. [Google Scholar] [CrossRef]
  19. Chakeri, H.; Unver, B.; Ozcelik, Y. A novel relationship for predicting the point of inflexion value in the surface settlement curve. Tunn. Undergr. Space Technol. 2014, 43, 266–275. [Google Scholar] [CrossRef]
  20. Huang, K.; Sun, Y.; Huang, X.; Li, Y.; Jiang, M.; Liu, R. Effects of Different Construction Sequences on Ground Surface Settlement and Displacement of Single Long Pile due to Twin Paralleled Shield Tunneling. Adv. Civ. Eng. 2021, 2021, 1–14. [Google Scholar] [CrossRef]
  21. Darvishpour, A.; Seifabad, M.C.; Wood, D.A.; Ghorbani, H. Wellbore stability analysis to determine the safe mud weight window for sandstone layers. Pet. Explor. Dev. 2019, 46, 1031–1038. [Google Scholar] [CrossRef]
  22. Deng, H.; Fu, H.; Shi, Y.; Huang, Z.; Huang, Q. Analysis of Asymmetrical Deformation of Surface and Oblique Pipeline Caused by Shield Tunneling along Curved Section. Symmetry 2021, 13, 2396. [Google Scholar] [CrossRef]
  23. Hao, D.; Zhu, R.; Wu, K.; Chen, R. Analysis of Ground Settlement Caused by Double-line TBM Tunnelling under Existing Building. Geotech. Geol. Eng. 2021, 40, 899–911. [Google Scholar] [CrossRef]
  24. Zhang, M.; Li, S.; Li, P. Numerical analysis of ground displacement and segmental stress and influence of yaw excavation loadings for a curved shield tunnel. Comput. Geotech. 2019, 118, 103325. [Google Scholar] [CrossRef]
  25. Hu, X.; He, C.; Lai, X.; Walton, G.; Fu, W.; Fang, Y. A DEM-based study of the disturbance in dry sandy ground caused by EPB shield tunneling. Tunn. Undergr. Space Technol. 2020, 101, 103410. [Google Scholar] [CrossRef]
  26. Lin, Q.; Tian, Y.; Lu, D.; Gong, Q.; Du, X.; Gao, Z. A prediction method of ground volume loss variation with depth induced by tunnel excavation. Acta Geotech. 2021, 16, 3689–3707. [Google Scholar] [CrossRef]
  27. Mu, B.; Xie, X.; Li, X.; Li, J.; Shao, C.; Zhao, J. Monitoring, modelling and prediction of segmental lining deformation and ground settlement of an EPB tunnel in different soils. Tunn. Undergr. Space Technol. 2020, 113, 103870. [Google Scholar] [CrossRef]
  28. Hajjar, M.; Hayati, A.N.; Ahmadi, M.M.; Sadrnejad, S.A. Longitudinal Settlement Profile in Shallow Tunnels in Drained Conditions. Int. J. Géoméch. 2015, 15, 04014097. [Google Scholar] [CrossRef]
  29. Chakeri, H.; Ozcelik, Y.; Unver, B. Effects of important factors on surface settlement prediction for metro tunnel excavated by EPB. Tunn. Undergr. Space Technol. 2013, 36, 14–23. [Google Scholar] [CrossRef]
  30. Zheng, H.; Li, P.; Ma, G.; Zhang, Q. Experimental investigation of mechanical characteristics for linings of twins tunnels with asymmetric cross-section. Tunn. Undergr. Space Technol. 2021, 119, 104209. [Google Scholar] [CrossRef]
  31. Suwansawat, S.; Einstein, H.H. Describing Settlement Troughs over Twin Tunnels Using a Superposition Technique. J. Geotech. Geoenvironmental Eng. 2007, 133, 445–468. [Google Scholar] [CrossRef]
  32. Forsat, M.; Taghipoor, M.; Palassi, M. 3D FEM Model on the Parameters’ Influence of EPB-TBM on Settlements of Single and Twin Metro Tunnels During Construction. Int. J. Pavement Res. Technol. 2022, 15.3, 525–538. [Google Scholar] [CrossRef]
  33. Do, N.-A.; Dias, D.; Oreste, P.; Djeran-Maigre, I. Three-dimensional numerical simulation for mechanized tunnelling in soft ground: The influence of the joint pattern. Acta Geotech. 2014, 9, 673–694. [Google Scholar] [CrossRef]
  34. Moeinossadat, S.R.; Ahangari, K. Estimating maximum surface settlement due to EPBM tunneling by Numerical-Intelligent approach—A case study: Tehran subway line 7. Transp. Geotech. 2018, 18, 92–102. [Google Scholar] [CrossRef]
  35. Chapman, D.; Metje, N.; Stärk, A. Tunnel construction techniques. In Introduction to Tunnel Construction; CRC Press: Boca Raton, FL, USA, 2017; pp. 117–242. [Google Scholar]
  36. Bilgin, N.; Copur, H.; Balci, C. Mechanical Excavation in Mining and Civil Industries; CRC Press: Boca Raton, FL, USA, 2013; pp. 103–123. [Google Scholar]
  37. Zhong, Z.; Li, C.; Liu, X.; Fan, Y.; Liang, N. Analysis of ground surface settlement induced by the construction of mechanized twin tunnels in soil-rock mass mixed ground. Tunn. Undergr. Space Technol. 2021, 110, 103746. [Google Scholar] [CrossRef]
  38. Qi, W.; Yang, Z.; Jiang, Y.; Shao, X.; Yang, X.; He, Q. Structural Deformation of Existing Horseshoe-Shaped Tunnels by Shield Overcrossing. KSCE J. Civ. Eng. 2021, 25, 735–749. [Google Scholar] [CrossRef]
  39. Fang, Q.; Zhang, D.; Li, Q.; Wong, L.N.Y. Effects of twin tunnels construction beneath existing shield-driven twin tunnels. Tunn. Undergr. Space Technol. 2015, 45, 128–137. [Google Scholar] [CrossRef]
  40. Nematollahi, M.; Dias, D. Interaction between an underground parking and twin tunnels—Case of the Shiraz subway line. Tunn. Undergr. Space Technol. 2019, 95, 103150. [Google Scholar] [CrossRef]
  41. Epel, T.; Mooney, M.A.; Gutierrez, M. The influence of face and shield annulus pressure on tunnel liner load development. Tunn. Undergr. Space Technol. 2021, 117, 104096. [Google Scholar] [CrossRef]
  42. Huang, M.; Li, Y.; Shi, Z.; Lü, X. Face stability analysis of shallow shield tunneling in layered ground under seepage flow. Tunn. Undergr. Space Technol. 2021, 119, 104201. [Google Scholar] [CrossRef]
  43. Li, P.; Wei, Y.; Zhang, M.; Huang, Q.; Wang, F. Influence of non-associated flow rule on passive face instability for shallow shield tunnels. Tunn. Undergr. Space Technol. 2021, 119, 104202. [Google Scholar] [CrossRef]
  44. Hasanpour, R. Advance numerical simulation of tunneling by using a double shield TBM. Comput. Geotech. 2014, 57, 37–52. [Google Scholar] [CrossRef]
  45. Liu, X.; Zhang, Y.; Bao, Y.; Song, W. Investigation of the structural effect induced by stagger joints in segmental tunnel linings: Numerical explanation via macro-level structural modeling. Tunn. Undergr. Space Technol. 2021, 120, 104284. [Google Scholar] [CrossRef]
  46. Zaheri, M.; Ranjbarnia, M.; Dias, D.; Oreste, P. Performance of segmental and shotcrete linings in shallow tunnels crossing a transverse strike-slip faulting. Transp. Geotech. 2020, 23, 100333. [Google Scholar] [CrossRef]
  47. Wei, Y.-H.; Wang, Y.-Q.; Mao, Y.; Chen, L.-L.; Wang, M. Effect of Shield-Tunnel Excavation on Adjacent-Pile Foundation Based on Modified Cam-Clay Model. J. Highw. Transp. Res. Dev. 2020, 14, 84–92. [Google Scholar] [CrossRef]
  48. Zheng, G.; Fan, Q.; Zhang, T.; Zhang, Q. Numerical study of the Soil-Tunnel and Tunnel-Tunnel interactions of EPBM overlapping tunnels constructed in soft ground. Tunn. Undergr. Space Technol. 2022, 124, 104490. [Google Scholar] [CrossRef]
  49. Jin, H.; Yuan, D.; Zhou, S.; Zhao, D. Short-Term and Long-Term Displacement of Surface and Shield Tunnel in Soft Soil: Field Observations and Numerical Modeling. Appl. Sci. 2022, 12, 3564. [Google Scholar] [CrossRef]
  50. Guo, P.; Gong, X.; Wang, Y.; Lin, H.; Zhao, Y. Minimum cover depth estimation for underwater shield tunnels. Tunn. Undergr. Space Technol. 2021, 115, 104027. [Google Scholar] [CrossRef]
  51. Yang, W.; Zheng, J.; Zhang, R.; Liu, H. An empirical model for characterizing 3D deformation at the face of shield tunnel in soft clay. Tunn. Undergr. Space Technol. 2021, 112, 103862. [Google Scholar] [CrossRef]
  52. Yi, S.; Ke, W.; Huang, X.; Xiao, M.; Chen, J.; Huang, J. Simulating the effects of braced excavation on the adjacent tunnel using numerical method. J. Phys. Conf. Ser. 2020, 1654, 012121. [Google Scholar] [CrossRef]
  53. Shivaei, S.; Hataf, N.; Pirastehfar, K. 3D numerical investigation of the coupled interaction behavior between mechanized twin tunnels and groundwater—A case study: Shiraz metro line 2. Tunn. Undergr. Space Technol. 2020, 103, 103458. [Google Scholar] [CrossRef]
  54. Bai, Y.; Yang, Z.; Jiang, Z. Key protection techniques adopted and analysis of influence on adjacent buildings due to the Bund Tunnel construction. Tunn. Undergr. Space Technol. 2014, 41, 24–34. [Google Scholar] [CrossRef]
  55. Comodromos, E.M.; Papadopoulou, M.C.; Konstantinidis, G.K. Numerical Assessment of Subsidence and Adjacent Building Movements Induced by TBM-EPB Tunneling. J. Geotech. Geoenvironmental Eng. 2014, 140, 04014061. [Google Scholar] [CrossRef]
  56. Piciullo, L.; Ritter, S.; Lysdahl, A.O.K.; Langford, J.; Nadim, F. Assessment of building damage due to excavation-induced displacements: The GIBV method. Tunn. Undergr. Space Technol. 2020, 108, 103673. [Google Scholar] [CrossRef]
  57. Katebi, H.; Rezaei, A.; Hajialilue-Bonab, M.; Tarifard, A. Assessment the influence of ground stratification, tunnel and surface buildings specifications on shield tunnel lining loads (by FEM). Tunn. Undergr. Space Technol. 2015, 49, 67–78. [Google Scholar] [CrossRef]
  58. Dimmock, P.S.; Mair, R.J. Effect of building stiffness on tunnelling-induced ground movement. Tunn. Undergr. Space Technol. 2008, 23, 438–450. [Google Scholar] [CrossRef]
  59. Fuentes, D.S.; Mascort-Albea, E.J.; Hidalgo, B.d.; Hidalgo-Sánchez, F.M.; Gutiérrez, M.A. Spatial data for the design of critical cartographies in the metropolitan area of Seville (Spain). In Reciprociudad: Design Diplomacy in Seville Design Diplomacy in Seville; Recolectores Urbanos: Sevilla, Spain, 2021; pp. 251–264. [Google Scholar]
  60. Diz-Mellado, E.; Mascort-Albea, E.J.; Romero-Hernández, R.; Galán-Marín, C.; Rivera-Gómez, C.; Ruiz-Jaramillo, J.; Jaramillo-Morilla, A. Non-destructive testing and Finite Element Method integrated procedure for heritage diagnosis: The Seville Cathedral case study. J. Build. Eng. 2021, 37, 102134. [Google Scholar] [CrossRef]
  61. Castillo-Manzano, J.I.; López-Valpuesta, L. Urban retail fabric and the metro: A complex relationship. Lessons from middle-sized Spanish cities. Cities 2009, 26, 141–147. [Google Scholar] [CrossRef]
  62. De Justo Alpañés, J.L. Pasado y Presente del Metro de Sevilla; Editorial Universidad de Sevilla: Sevilla, Spain, 1994. [Google Scholar]
  63. Carvajal, J.R. Los Suelos de la Ciudad de Sevilla: Caracterización Geotécnica y Propiedades Mineralógicas de su Fracción Arcilla. Ph.D. Thesis, Universidad de Sevilla, Sevilla, Spain, 1985. [Google Scholar]
  64. Mascort-Albea, E.J.; Canivell, J.; Jaramillo-Morilla, A.; Romero-Hernández, R.; Ruiz-Jaramillo, J.; Soriano-Cuesta, C. Action Protocols for Seismic Evaluation of Structures and Damage Restoration of Residential Buildings in Andalusia (Spain): “IT-Sismo” APP. Buildings 2019, 9, 104. [Google Scholar] [CrossRef] [Green Version]
  65. Cagigal, P.A. Comportamiento del Terreno Durante Las Obras de Construcción de la Línea 1 del Metro de Sevilla en Los Tramos de Túnel Entre Pantallas y Las Estaciones Subterráneas. Ph.D. Thesis, Universidad de Sevilla, Sevilla, Spain, 2013. [Google Scholar]
  66. De Sevilla, S.A.M. Proyecto básico general de la red de metro de Sevilla y programación de fases. Estudio de impacto Ambiental. 2001.
  67. Saavedra, F.M.; Escribano, P.G.; Delgado, J.I.S. Escudos EPB en terrenos no cohesivos bajo carga de agua: Últimas experiencias en la Línea 1 del Metro de Sevilla. Rev. Obras Publicas 2008, 155, 13–28. [Google Scholar]
  68. Lambrughi, A.; Rodríguez, L.M.; Castellanza, R. Development and validation of a 3D numerical model for TBM–EPB mechanised excavations. Comput. Geotech. 2012, 40, 97–113. [Google Scholar] [CrossRef]
  69. Nematollahi, M.; Dias, D. Three-dimensional numerical simulation of pile-twin tunnels interaction—Case of the Shiraz subway line. Tunn. Undergr. Space Technol. 2018, 86, 75–88. [Google Scholar] [CrossRef]
  70. Founta, V.; Ninić, J.; Whittle, A.J.; Meschke, G.; Stascheit, J. Numerical Simulation of Ground Movements Due to EPB Tunnelling in Clay. In Proceedings of the EURO:TUN 2013, 3rd International Conference on Computational Methods in Tunnelling and Subsurface Engineering, Bochum, Germany, 17–19 April 2013; pp. 1–12. [Google Scholar]
  71. Ninić, J.; Koch, C.; Vonthron, A.; Tizani, W.; König, M. Integrated parametric multi-level information and numerical modelling of mechanised tunnelling projects. Adv. Eng. Inform. 2019, 43, 101011. [Google Scholar] [CrossRef]
  72. Peng, F.-L.; Wang, H.-L.; Tan, Y.; Xu, Z.-L.; Li, Y.-L. Field Measurements and Finite-Element Method Simulation of a Tunnel Shaft Constructed by Pneumatic Caisson Method in Shanghai Soft Ground. J. Geotech. Geoenviron. Eng. 2011, 137, 516–524. [Google Scholar] [CrossRef]
  73. Kavvadas, M.; Litsas, D.; Vazaios, I.; Fortsakis, P. Development of a 3D finite element model for shield EPB tunnelling. Tunn. Undergr. Space Technol. 2017, 65, 22–34. [Google Scholar] [CrossRef]
  74. Marwan, A.; Gall, V.E.; Alsahly, A.; Meschke, G. Structural forces in segmental linings: Process-oriented tunnel advance simulations vs. conventional structural analysis. Tunn. Undergr. Space Technol. 2021, 111, 103836. [Google Scholar] [CrossRef]
  75. Qu, T.; Wang, S.; Fu, J.; Hu, Q.; Zhang, X. Numerical Examination of EPB Shield Tunneling–Induced Responses at Various Discharge Ratios. J. Perform. Constr. Facil. 2019, 33, 04019035. [Google Scholar] [CrossRef]
  76. Melis, M.; Medina, L.; Rodríguez, J.M. Prediction and analysis of subsidence induced by shield tunnelling in the Madrid Metro extension. Can. Geotech. J. 2002, 39, 1273–1287. [Google Scholar] [CrossRef]
  77. Ye, Z.; Liu, H. Mechanism and Countermeasure of Segmental Lining Damage Induced by Large Water Inflow from Excavation Face in Shield Tunneling. Int. J. Géoméch. 2018, 18, 04018163. [Google Scholar] [CrossRef]
  78. Do, N.A.; Dias, D.; Oreste, P. 3D numerical investigation on the interaction between mechanized twin tunnels in soft ground. Environ. Earth Sci. 2014, 73, 2101–2113. [Google Scholar] [CrossRef]
  79. Zizka, Z.; Schoesser, B.; Thewes, M. Investigations on transient support pressure transfer at the tunnel face during slurry shield drive part 1: Case A—Tool cutting depth exceeds shallow slurry penetration depth. Tunn. Undergr. Space Technol. 2021, 118, 104168. [Google Scholar] [CrossRef]
  80. Mollon, G.; Dias, D.; Soubra, A.-H. Probabilistic analyses of tunneling-induced ground movements. Acta Geotech. 2013, 8, 181–199. [Google Scholar] [CrossRef] [Green Version]
  81. Mollon, G. Etude Déterministe et Probabiliste du Comportement Des Tunnels; INSA de Lyon: Villeurbanne, France, 2012. [Google Scholar]
  82. Do, N.-A.; Dias, D.; Oreste, P.; Djeran-Maigre, I. 2D Tunnel Numerical Investigation: The Influence of the Simplified Excavation Method on Tunnel Behaviour. Geotech. Geol. Eng. 2014, 32, 43–58. [Google Scholar] [CrossRef]
  83. Li, H.; Ma, E.; Lai, J.; Wang, L.; Xu, S.; Wang, K.; Liu, T. Tunnelling-Induced Settlement and Treatment Techniques for a Loess Metro in Xi’an. Adv. Civ. Eng. 2020, 2020, 1–20. [Google Scholar] [CrossRef]
  84. Nikakhtar, L.; Zare, S.; Abad, H.M.N. Numerical Modelling of Backfill Grouting Approaches in EPB Tunneling. J. Min. Environ. 2020, 11, 301–314. [Google Scholar] [CrossRef]
  85. Bezuijen, A.; Talmon, A. Grout pressures around a tunnel lining, influence of grout consolidation and loading on lining. In Tunnelling. A Decade of Progress. GeoDelft 1995–2005; Taylor & Francis: Abingdon-on-Thames, UK, 2006; pp. 109–114. [Google Scholar]
  86. Nematollahi, M.; Molladavoodi, H.; Dias, D. Three-dimensional numerical simulation of the Shiraz subway second line—Influence of the segmental joints geometry and of the lagging distance between twin tunnels’ faces. Eur. J. Environ. Civ. Eng. 2020, 24, 1606–1622. [Google Scholar] [CrossRef]
  87. Itasca Consulting Group. Fast Lagrangian Analysis of Continua (FLAC3D). Version 7. User’s Manual, HTTP. 2017. Available online: http://docs.itascacg.com/flac3d700/contents.html (accessed on 20 September 2021).
  88. Kempfert, H.-G.; Gebreselassie, B. Excavations and Foundations in Soft Soils; Springer: Berlin/Heidelberg, Germany, 2006. [Google Scholar]
  89. Wang, Z.-F.; Shen, S.-L.; Modoni, G. Enhancing discharge of spoil to mitigate disturbance induced by horizontal jet grouting in clayey soil: Theoretical model and application. Comput. Geotech. 2019, 111, 222–228. [Google Scholar] [CrossRef]
  90. Afifipour, M.; Sharifzadeh, M.; Shahriar, K.; Jamshidi, H. Interaction of twin tunnels and shallow foundation at Zand underpass, Shiraz metro, Iran. Tunn. Undergr. Space Technol. 2011, 26, 356–363. [Google Scholar] [CrossRef]
  91. Sharghi, M.; Chakeri, H.; Ozcelik, Y. Investigation into the effects of two component grout properties on surface settlements. Tunn. Undergr. Space Technol. 2017, 63, 205–216. [Google Scholar] [CrossRef]
  92. Oteo Mazo, C.; Moreno Jiménez, J.D.D.; Arozamena Cagigal, P.; Diez Fernández, J.E. Problemas geotécnicos en la línea 1 del metro de sevilla. Rev. Obras Publicas 2009, 156, 43–64. [Google Scholar]
Figure 1. UNESCO World Heritage Sites and planned network lines for the Metro of Seville.
Symmetry 14 01263 g001
Figure 2. (a) Restoration works in sector C–D during 2004 (b) Critical areas and excavation directions of the route of Line 1 (Critical areas are annotated as A–F).
Symmetry 14 01263 g002
Figure 3. (a) Monitored surface points. (b) Soil layer distributions for the critical areas chosen.
Symmetry 14 01263 g003
Figure 4. Main dimension parameters of the simulated models, representing twin tunnelling.
Symmetry 14 01263 g004
Figure 5. Excavation steps timeline: (a) EPB penetrate soil step 1, (b) the entire EPB shield is penetrated, (c) the lining and grouting pressure is applied, (d) the EPB pressure is removed after 2, and the grout hardens, (e) EPB and lining are visible, and (f) after 50 steps of excavation.
Symmetry 14 01263 g005
Figure 6. The face pressure and grouting pressure on the EPB tailing.
Symmetry 14 01263 g006
Figure 7. Detail of the lining modelling, with the segments and their joints (showed as yellow dots).
Symmetry 14 01263 g007
Figure 8. Schematic diagram of the excavation step with varying burden load and face pressure.
Symmetry 14 01263 g008
Figure 9. Surface displacement schema for the first tunnel of Seville metro.
Symmetry 14 01263 g009
Figure 10. Surface displacement schema for the second tunnel of Seville metro.
Symmetry 14 01263 g010
Figure 11. Schema of the ground displacement with different grouting pressure.
Symmetry 14 01263 g011
Figure 12. Profile of the ground displacement at the crown of the tunnel at Y = 20 (Critical areas are mentioned as A–F).
Symmetry 14 01263 g012
Figure 13. Profile of the ground displacement on the surface at Y = 20 (Critical areas are mentioned as A–F).
Symmetry 14 01263 g013
Figure 14. Diagram of the surface settlement in the middle of the first twin tunnel based on step excavation (Critical areas are mentioned as A–F).
Symmetry 14 01263 g014
Figure 15. Diagram of the surface settlement in the middle of the second twin tunnel based on step excavation (Critical areas are mentioned as A–F).
Symmetry 14 01263 g015
Figure 16. Longitudinal profile with the same face pressure and changing the burden load after excavation of both tunnels (Critical areas are mentioned as A–F).
Symmetry 14 01263 g016
Figure 17. Surface settlement for 54 simulations with different EPB face pressure (first suffix number) and burden load (second suffix number).
Symmetry 14 01263 g017
Figure 18. Percentage change from average surface settlement.
Symmetry 14 01263 g018
Figure 19. The relationship of burden load with surface settlement.
Symmetry 14 01263 g019
Figure 20. The relationship of face pressure with surface settlement.
Symmetry 14 01263 g020
Figure 21. Boxplots showing surface settlements for different values of Young’s Modulus: Changing soil properties and tunnel depth.
Symmetry 14 01263 g021
Figure 22. Boxplots showing surface settlements for different locations.
Symmetry 14 01263 g022
Figure 23. Boxplot showing surface settlement for three different depths of water table.
Symmetry 14 01263 g023
Table 1. Ranges of soil properties along the route of Line 1 of the Metro in Seville.
Soil UnitDensity (kg/m3)Young’s Modulus (MPa)Poisson’s
Ratio
Cohesion
(kPa)
Friction Angle (Degrees)Permeability (cm/s)
Min.Max.Min.Max.Min.Max.Min.Max.Min.Max.Min.Max.
Filling2.101.807.012.60.20.62.06.024.026.0-
Clay2.202.0029.045.00.20.44.010.030.040.02 × 10−92 × 10−7
Sand2.201.8020.029.00.20.417.050.026.029.02 × 10−52 × 10−2
Gravel2.202.0040.070.00.20.40.00.035.039.05 × 10−65 × 10−2
Marl2.21.9070.0100.00.20.432.044.026.028.02 × 10−93 × 10−9
Table 2. Selected soil properties for the research critical areas.
Soil UnitDensity (kg/m3)Young’s Modulus (MPa)Poisson’s RatioCohesion (kPa)Friction Angle (Degrees)Permeability (cm/s)
Filling20009.80.304.9025-
Clay210029.40.309.81321.01 × 10−8
Sand200024.50.3519.60289.5 × 10−3
Gravel210058.80.300.00379.09 × 10−4
Marl200583.30.3539.2282.83 × 10−9
Table 3. EPB’s shield, tailing of the EPB properties.
MaterialDensity (kg/m3)Young’s Modulus (MPa)Poisson’s RatioThickness (m)External Diameter (m)Length (m)
EPB’s shield78402 × 1050.200.106.310.0
The precast lining 250029 × 1030.200.256.01.6
Injected grout1800--28.001.7-
Hardened grout1800--103.0071.0-
Table 4. Segment joint parameters in the numerical model. References values from [86].
ParameterSymbolUnitValue
Axial stiffnessKaxiMN/m550
Radial StiffnessKradMN/m3960
Rotational StiffnessKrotMN m/rad/m83
Maximum bending momentum at segment jointKyieldKN m/m115
Table 5. Varying excavation properties in five monitoring points of the first and second tunnels.
CodeLocationBurden Load (kPa)Face Pressure (kPa)Grouting Pressure (kPa)Vertical Displacement of the First Tunnel (cm) at (X, Y) = (0, 20)
FLAC3DReal Monitored
BSan Bernardo20250300−1.9−1.7
C-1San Sebastián70250300−2.9−2.7
C-270150200−3.2−3.4
D-1Puerta de Jerez20250300−3.3−3.1
D-220150200−3.7−3.6
E-1Plaza de Cuba130250300−6.2−6.5
E-2130150200−6.9−7.3
F-1Parque de los Príncipes130150200−7.2−7.4
F-213050100−9.4−9.8
Table 6. Average surface settlement.
Burden Load (kPa)Face Pressure (kPa)Average Surface Settlement (m)
20500.074351
1500.056472
2500.049275
70500.095415
1500.072697
2500.064137
130500.121866
1500.093389
2500.082971
Publisher’s Note: MDPI stays neutral with regard to jurisdictional claims in published maps and institutional affiliations.

