1. Introduction
Error is an often-elusive object with many defining characteristics and is certainly one with a wide breadth of implications in modern scientific inquiry. Whether in the context of experimental or observational data, inter-rater agreement (IRA) is a key estimand whose method of estimation is not always agreed upon. This is evident from the abundance of distinct agreement coefficients that have been presented over the last century, ranging from the often misunderstood correlation coefficient [
1] to the now-standard Cohen’s Kappa [
2], all the way to more recent advances such as Gwet’s AC1 statistic [
3].
Inter-rater agreement has been well established to quantify how well two or more raters agree over a set of observations. In the clinical context, for example, there are many methods for establishing the accuracy and sensitivity of a particular test; however, the error derived from the individual’s interpretation of the test is not as well understood and not as frequently examined as other sources of error. Multiple experts reviewing the results corresponding to a set of patients may disagree. If they cannot agree on what the results mean, the test in question may have little or no value. Of course, in the medical context, we would expect clinicians’ or medical experts’ evaluations to be in high correspondence and thus have a high inter-rater agreement, but just how high is a quantity of interest? The difficulty in quantifying this value follows from the lack of consensus on its calculation. This lack of consensus is observed through the multitude of statistics proposed over the years, many of which are critically different in their calculation of the IRA, and each with varying criteria for how to validate it—see [
4,
5] for a few examples.
When considering IRA, Cohen’s Kappa statistic—one of the most widely used measures of quantifying agreement—will often come to mind. Although Cohen’s Kappa is commonly used to measure IRA, it is well known that it has several shortcomings. For example, one of the most frequently noted limitations is the so-called Kappa Paradox, characterized by high agreement but a low Kappa value (i.e., sensitivity to the marginal distribution of a set of ratings). Due to such shortcomings, each of the many IRA statistics finds themselves competing based on some improvement or another. Consequently, when the need for reporting IRA arises in a given study, it is often not clear which statistic to use, thus resulting in a high degree of variability in the literature. However, when inferences relying on IRA statistics affect clinical guidelines or public policy, it is imperative to have a rigorous understanding of the statistics being used and of how to mitigate the present levels of heterogeneity.
A result of obtaining a rigorous characterization of commonly used IRA statistics is the ability to establish an evidence-based framework to recommend the use of one IRA statistic over another. This has been moderately studied in the case of two raters and, in some cases, three raters [
6], yet much less so in the case of larger numbers of raters [
7]. We therefore hope that the work presented here may serve as a step in closing this gap.
In an endeavor to close the knowledge gap, we have conducted an empirical review of four principal methods of calculating IRA—Fleiss’ Kappa, Light’s Kappa, Conger’s Kappa, and Gwet’s AC1. From this, we provide an evidence-based prescription of IRA statistics based on the data of a given study, particularly with multiple raters.
2. Background
One of the principal motivations of inter-rater agreement is to determine how well two clinicians coincide in their diagnoses over a set of observations. Other motivations include the inter-coder agreement between machine learning algorithms, the agreement between a caregiver and a physician, and that between a patient and a physician [
8]. These problems can, of course, be generalized to any number of observations and categories. The two-rater case has been reasonably analyzed [
9]; thus, except for the Kappa paradox, which we have simulated, in this work, we will concentrate on the three-, four-, and five-rater cases with a binary outcome.
2.1. The Estimand
This estimand, referred to by various names (i.e., inter-coder agreement, inter-observer agreement), is distinct from related estimands of reliability (i.e., inter-rater reliability, inter-coder reliability, inter-observer reliability), and the abuse of nomenclature has caused confusion in the past. Although this has been pointed out in the hopes of delineating the differences [
10], we note (anecdotally) that this issue persists. In this regard, we adopt the definition of Krippendorff [
10] in that we are interested in inter-rater agreement—the measure of the extent to which two or more raters agree, and not in any reliability thereof.
At first glance, it may seem reasonable to simply take the proportion of agreement between the observed rating of various raters as might be tabulated in a contingency table. However, using this to measure agreement is insufficient. Firstly, it fails to account for chance agreement; this has been the focus of many IRA statistics. Moreover, there are other sources of error that various authors have suggested as being necessary for any reasonable estimate of IRA, such as validation against a gold standard or correct set of responses [
11] and rater uncertainty [
3]. Furthermore, the sensitivity of Cohen’s Kappa to the marginal distribution of the ratings has been noted as a severe limitation to the statistic. Subsequently, several authors have taken this as an essential criterion for which IRA statistics should account [
12,
13]. However, as with many statistics, we have an idea of what the estimand is. However, we cannot agree upon the definitive set of additional information that ought to be accounted for (i.e., other sources of bias), much less find a natural way to estimate it while accounting for said additional sources of information. Nevertheless, statistics are continually used, developed, and improved, so a rigorous comparison is needed.
2.2. A Very Brief History
Throughout, we will be discussing five IRA statistics—Cohen’s Kappa, Fleiss’ Kappa, Light’s Kappa, Conger’s Kappa, and Gwet’s AC1 (the subject of our simulations below). Therefore, it is important to put them in their historical context.
In 1960, Cohen published his seminal paper: A Coefficient of Agreement for Nominal Scales on the Kappa statistic [
2]. This work described a method of accounting for the chance agreement, which set the functional approach to many subsequent IRA statistics. Following this chronologically, a publication by Cohen eight years later features the well-known Weighted Kappa statistic [
14] for the calculation of Kappa in the case of multiple categories with (or without) equal weights. In both publications, the statistics only allowed the calculation of the IRA between two independent raters.
In 1971, to remediate the limitation of the number of raters, two new measures of IRA were brought forward, the more popular being the Fleiss Kappa [
15] and the second being Light’s Kappa [
11]. The former case provided the additional theoretical advantage (or disadvantage, depending on the context) of computing the IRA with a priori knowledge of the true rating (or some gold standard). Last in the chronology of Kappas, Conger’s Kappa [
16] was then proposed in 1980 as a unification of all of the hitherto proposed Kappa statistics, thereby providing a generalized Kappa statistic.
In a similar view toward a unified statistic, Krippendorff’s alpha statistic was put forth in 1970, providing an alternative generalized coefficient [
17] (though not a generalization of the Kappa family). One of the most recent in the long line of statistics proposed for IRA, Gwet’s AC1 statistic [
3] has been proposed to improve the then-incumbent methods. Gwet’s AC1 incorporates the chance agreement between two raters and rater error associated with rater uncertainty (uncertainty in classifying an observation). Though still not exhaustive and much less studied than the other statistics that have benefitted from nearly half a century of research, Gwet’s AC1 provides a promising step toward a more robust IRA statistic. See the
Supplementary Materials for more details on the mathematical underpinnings of the Kappa statistics and Gwet’s AC1 statistics.
3. Materials and Methods
3.1. Simulation 1: Kappa Paradox
We have mentioned the significance of the Kappa Paradox as one of the major criticisms of Cohen’s Kappa statistic. Given the importance of this issue, we have run a simulation to assess the Kappa Paradox—or, more generally, the sensitivity of the statistics to the marginal distribution of agreement. To do so, we generated a matrix with a fixed level of agreement (80%) and a 10% disagreement on each off-diagonal (with a sample size of n = 100). We then computed Cohen’s Kappa and AC1 for each integer combination of the agreement distribution (keeping 80% constant but varying the allocation across the principal diagonal). Having done so, we observe the range of values of the statistic over the iterations. It should be noted that this does not provide an exhaustive simulation on the Kappa Paradox, but does give a “small simulation” or heuristic.
3.2. Simulation 2: IRA Variance
In an endeavor to have an in-depth understanding of inter-rater agreement, we conducted a simulation for inter-rater agreement in the case of two, three, four, and five raters using Fleiss’ Kappa, Light’s Kappa, Conger’s Kappa, and Gwet’s AC1, each for the binary case with varying numbers of observations and observers. This was done by:
Generating a set of correlated vectors Xi from a multivariate normal distribution (where i is the number of raters from a multivariate normal distribution)
The multivariate distribution has parameters and compound symmetric correlation matrix R (with pairwise correlation ), where was defined from 0 to 1 with a step size of 0.001.
For each of the resulting vectors, the vector elements were dichotomized such that the final simulated vectors
, are given by
where
is the vector corresponding to the
th rater over each observation, and
is the cut-off (
in simulation 2.1 and
in simulation 2.2).
From the resulting vectors, we compute Fleiss’ Kappa, Light’s Kappa, Conger’s Kappa, and Gwet’s AC1.
This entire process was then repeated for each value of at various sample sizes (n = 20, 50, 300, 500) with 1000 replications.
We subsequently computed the empirical variance for each sample size, number of raters, and each replication over the values of . The empirical variance over the replications was then computed, thus yielding a single estimate for each rater number/observation number pair. The specific value of c = 0.5 was chosen to model a small difference in the prevalence of the ratings. Therefore, over the range of , we were able to run our simulation with a joint probability of a “positive rating” between 0 and approximately 0.685.
3.3. Simulation 3: IRA Expected Value
Further to the Kappa Paradox and the variance simulation, we conducted a third simulation to estimate the empirical average value of each statistic for each combination of (1) the number of observations and (2) the number of raters. The resulting values were compared to the value of corresponding to the undichotomized (latent) data.
4. Results
4.1. Kappa Paradox
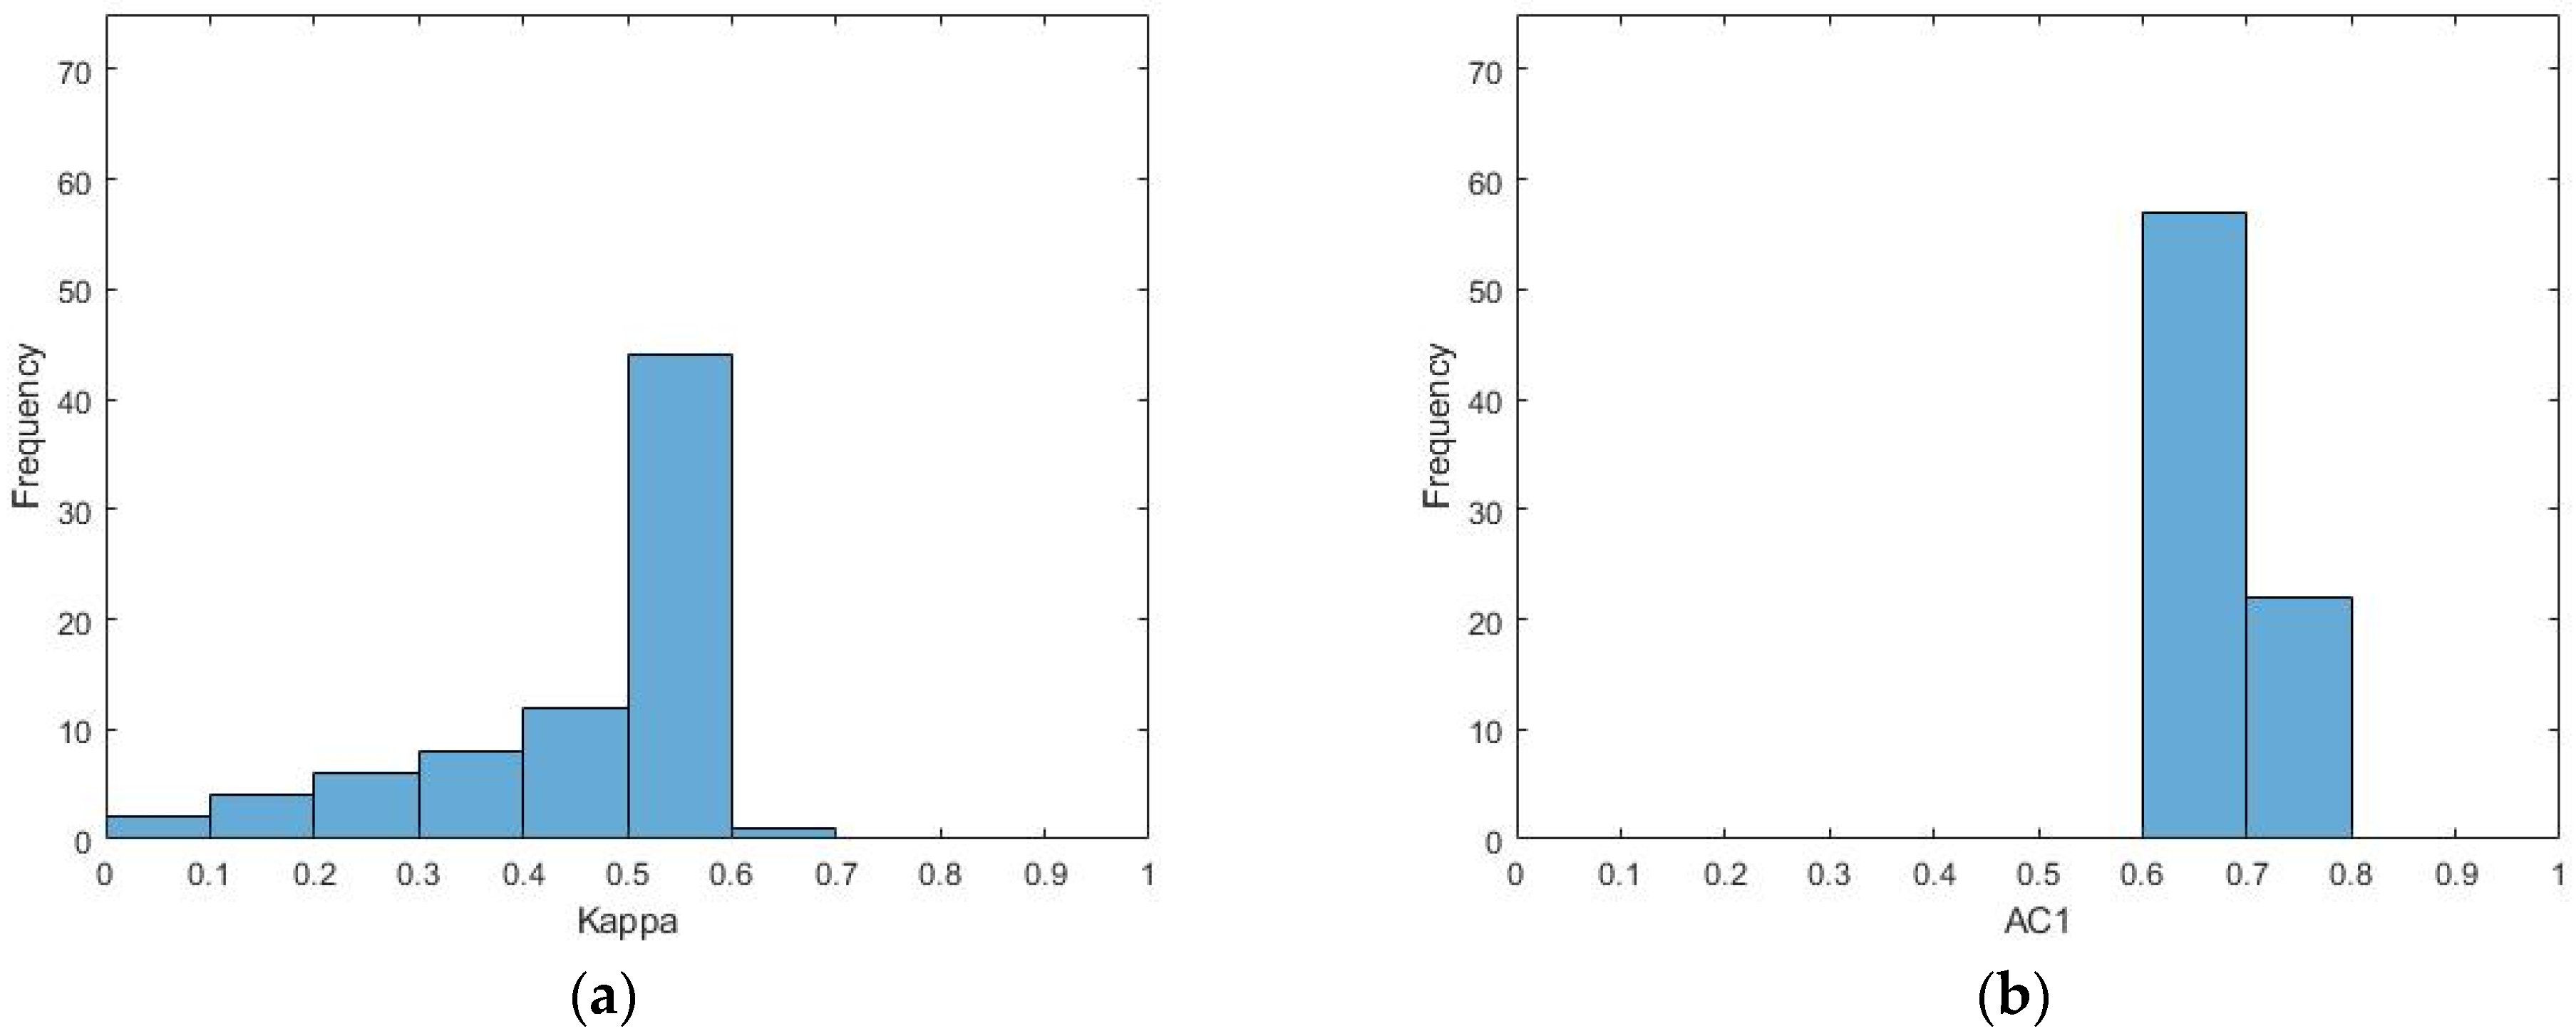
Following the procedure of the first simulation, it can be seen in
Figure 1 that in the case of Cohen’s Kappa, given a constant proportion of raw agreement of 80% and 20% disagreement (with a varying allocation of agreement between categories), the observed coefficients have a mean statistic of 0.46 and a standard deviation of 0.17. In contrast, AC1 is much less variable, with a mean statistic of 0.66 and a standard deviation of 0.05.
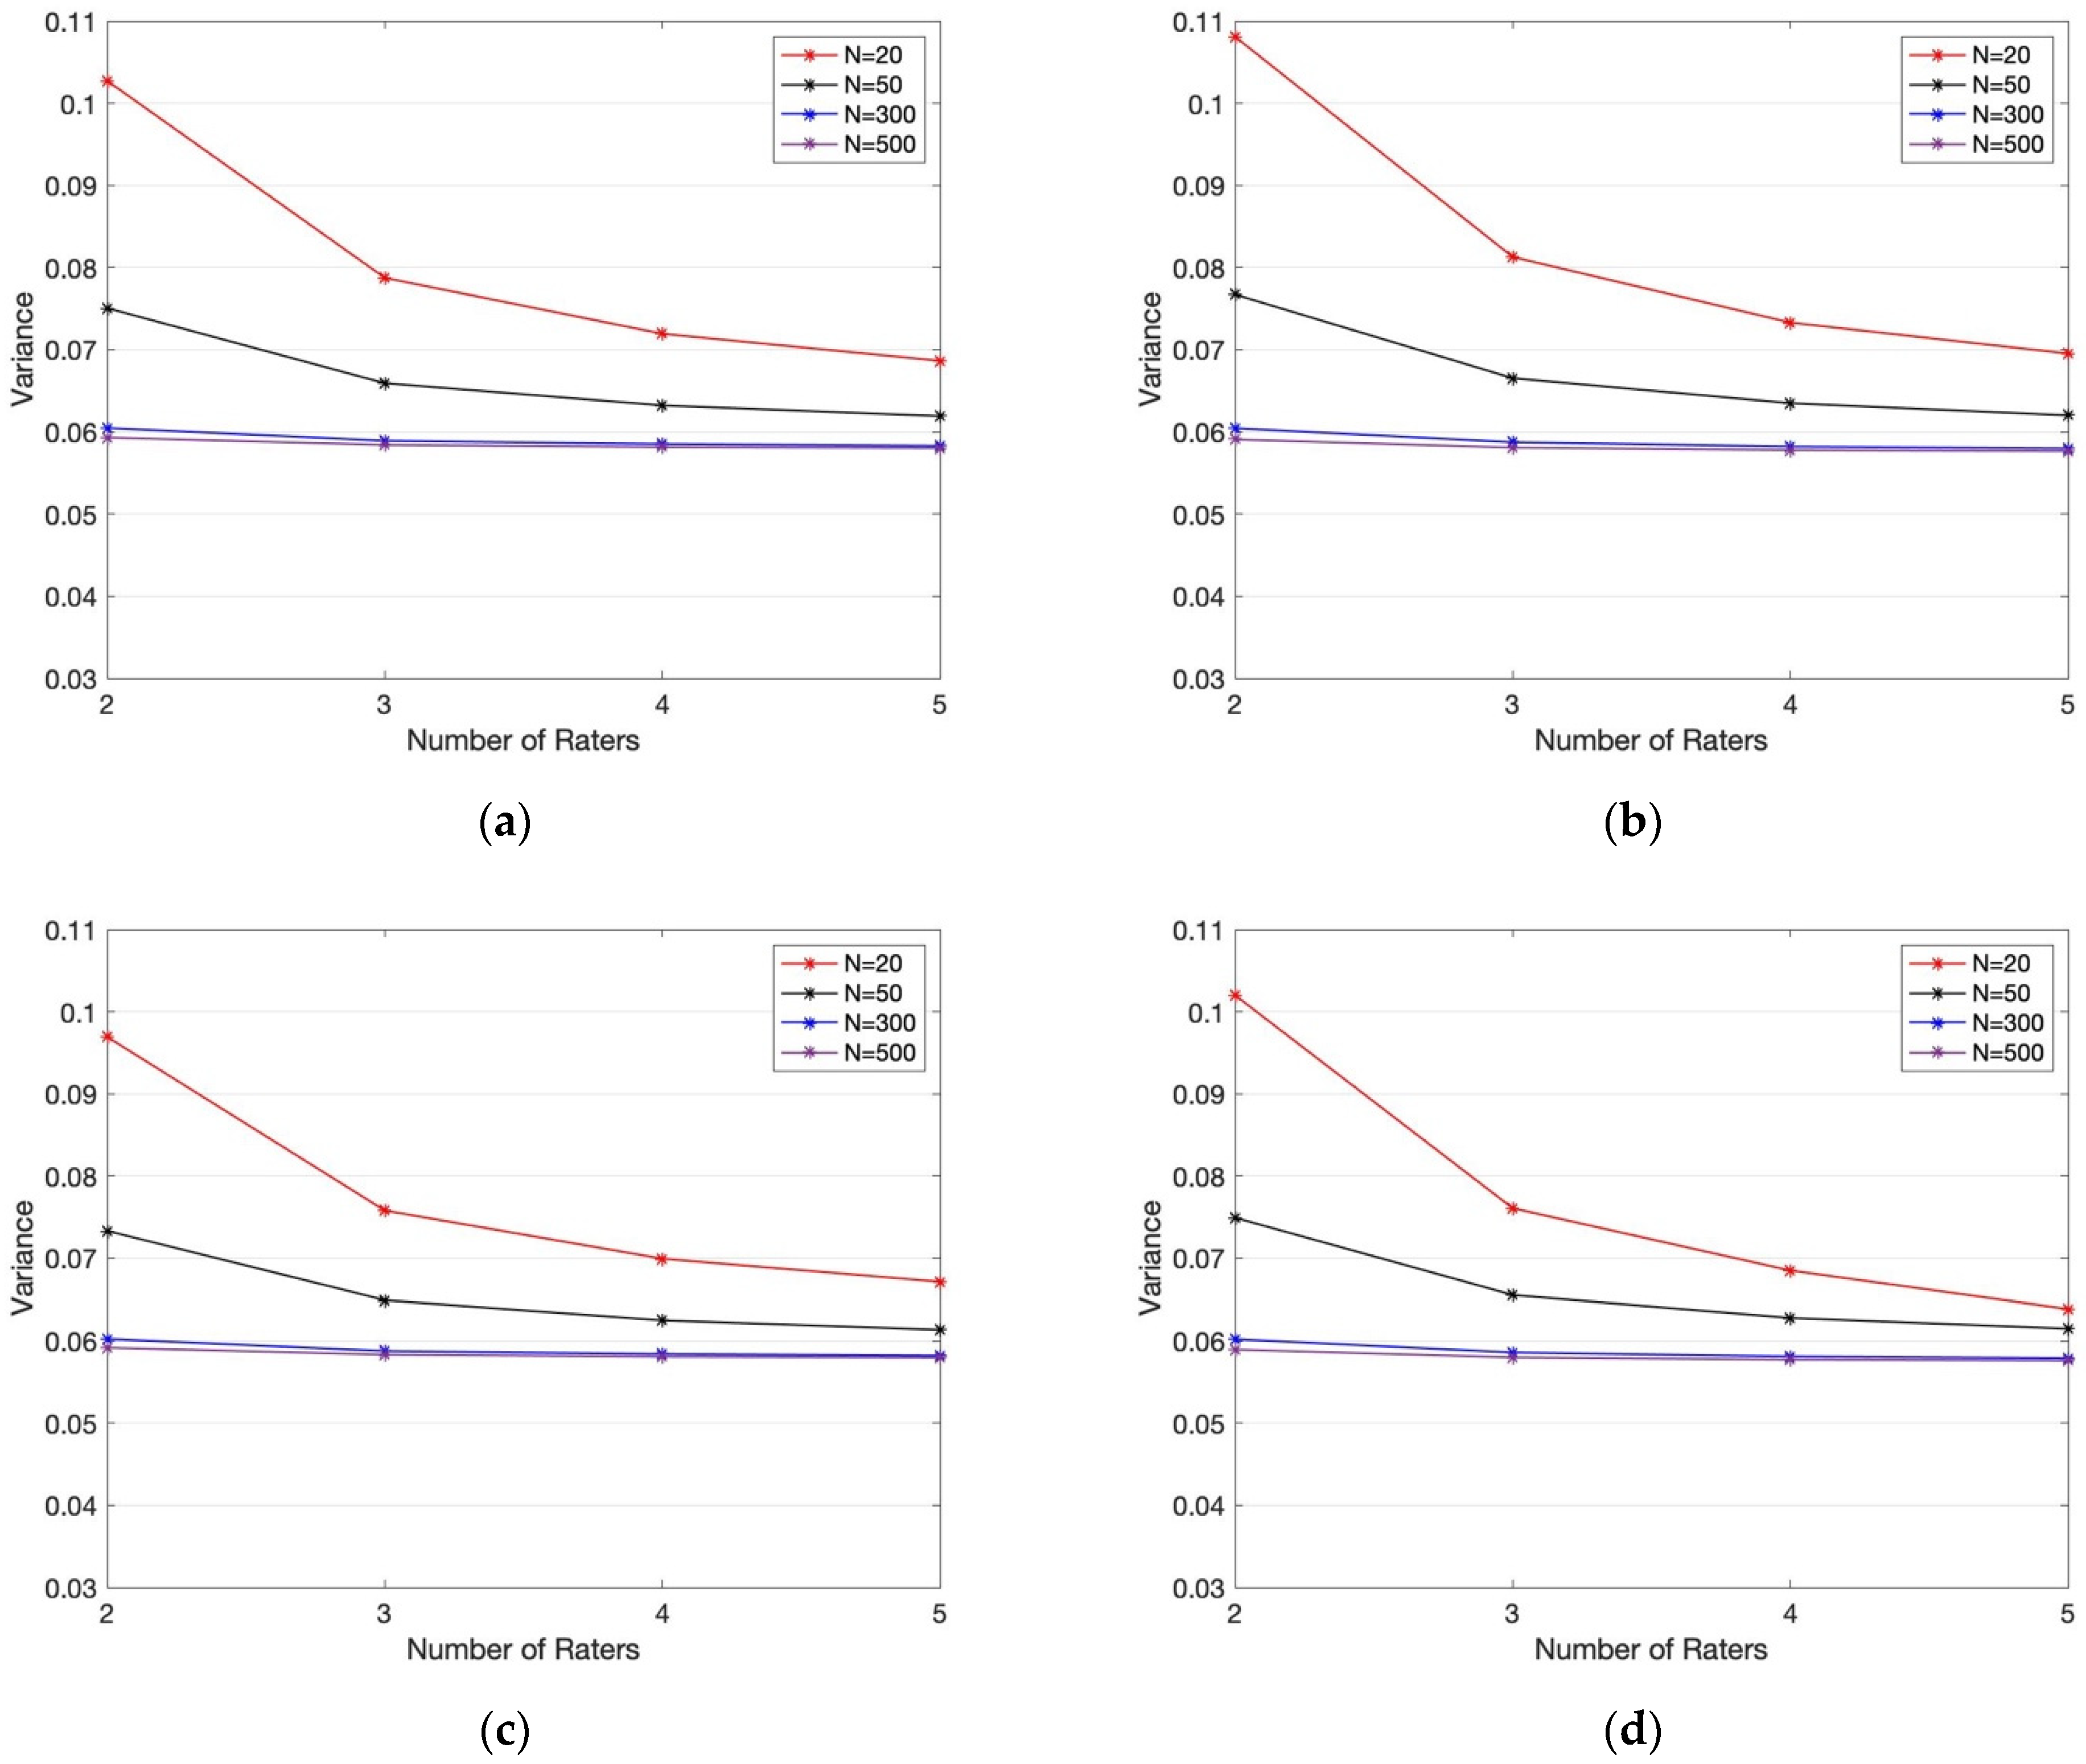
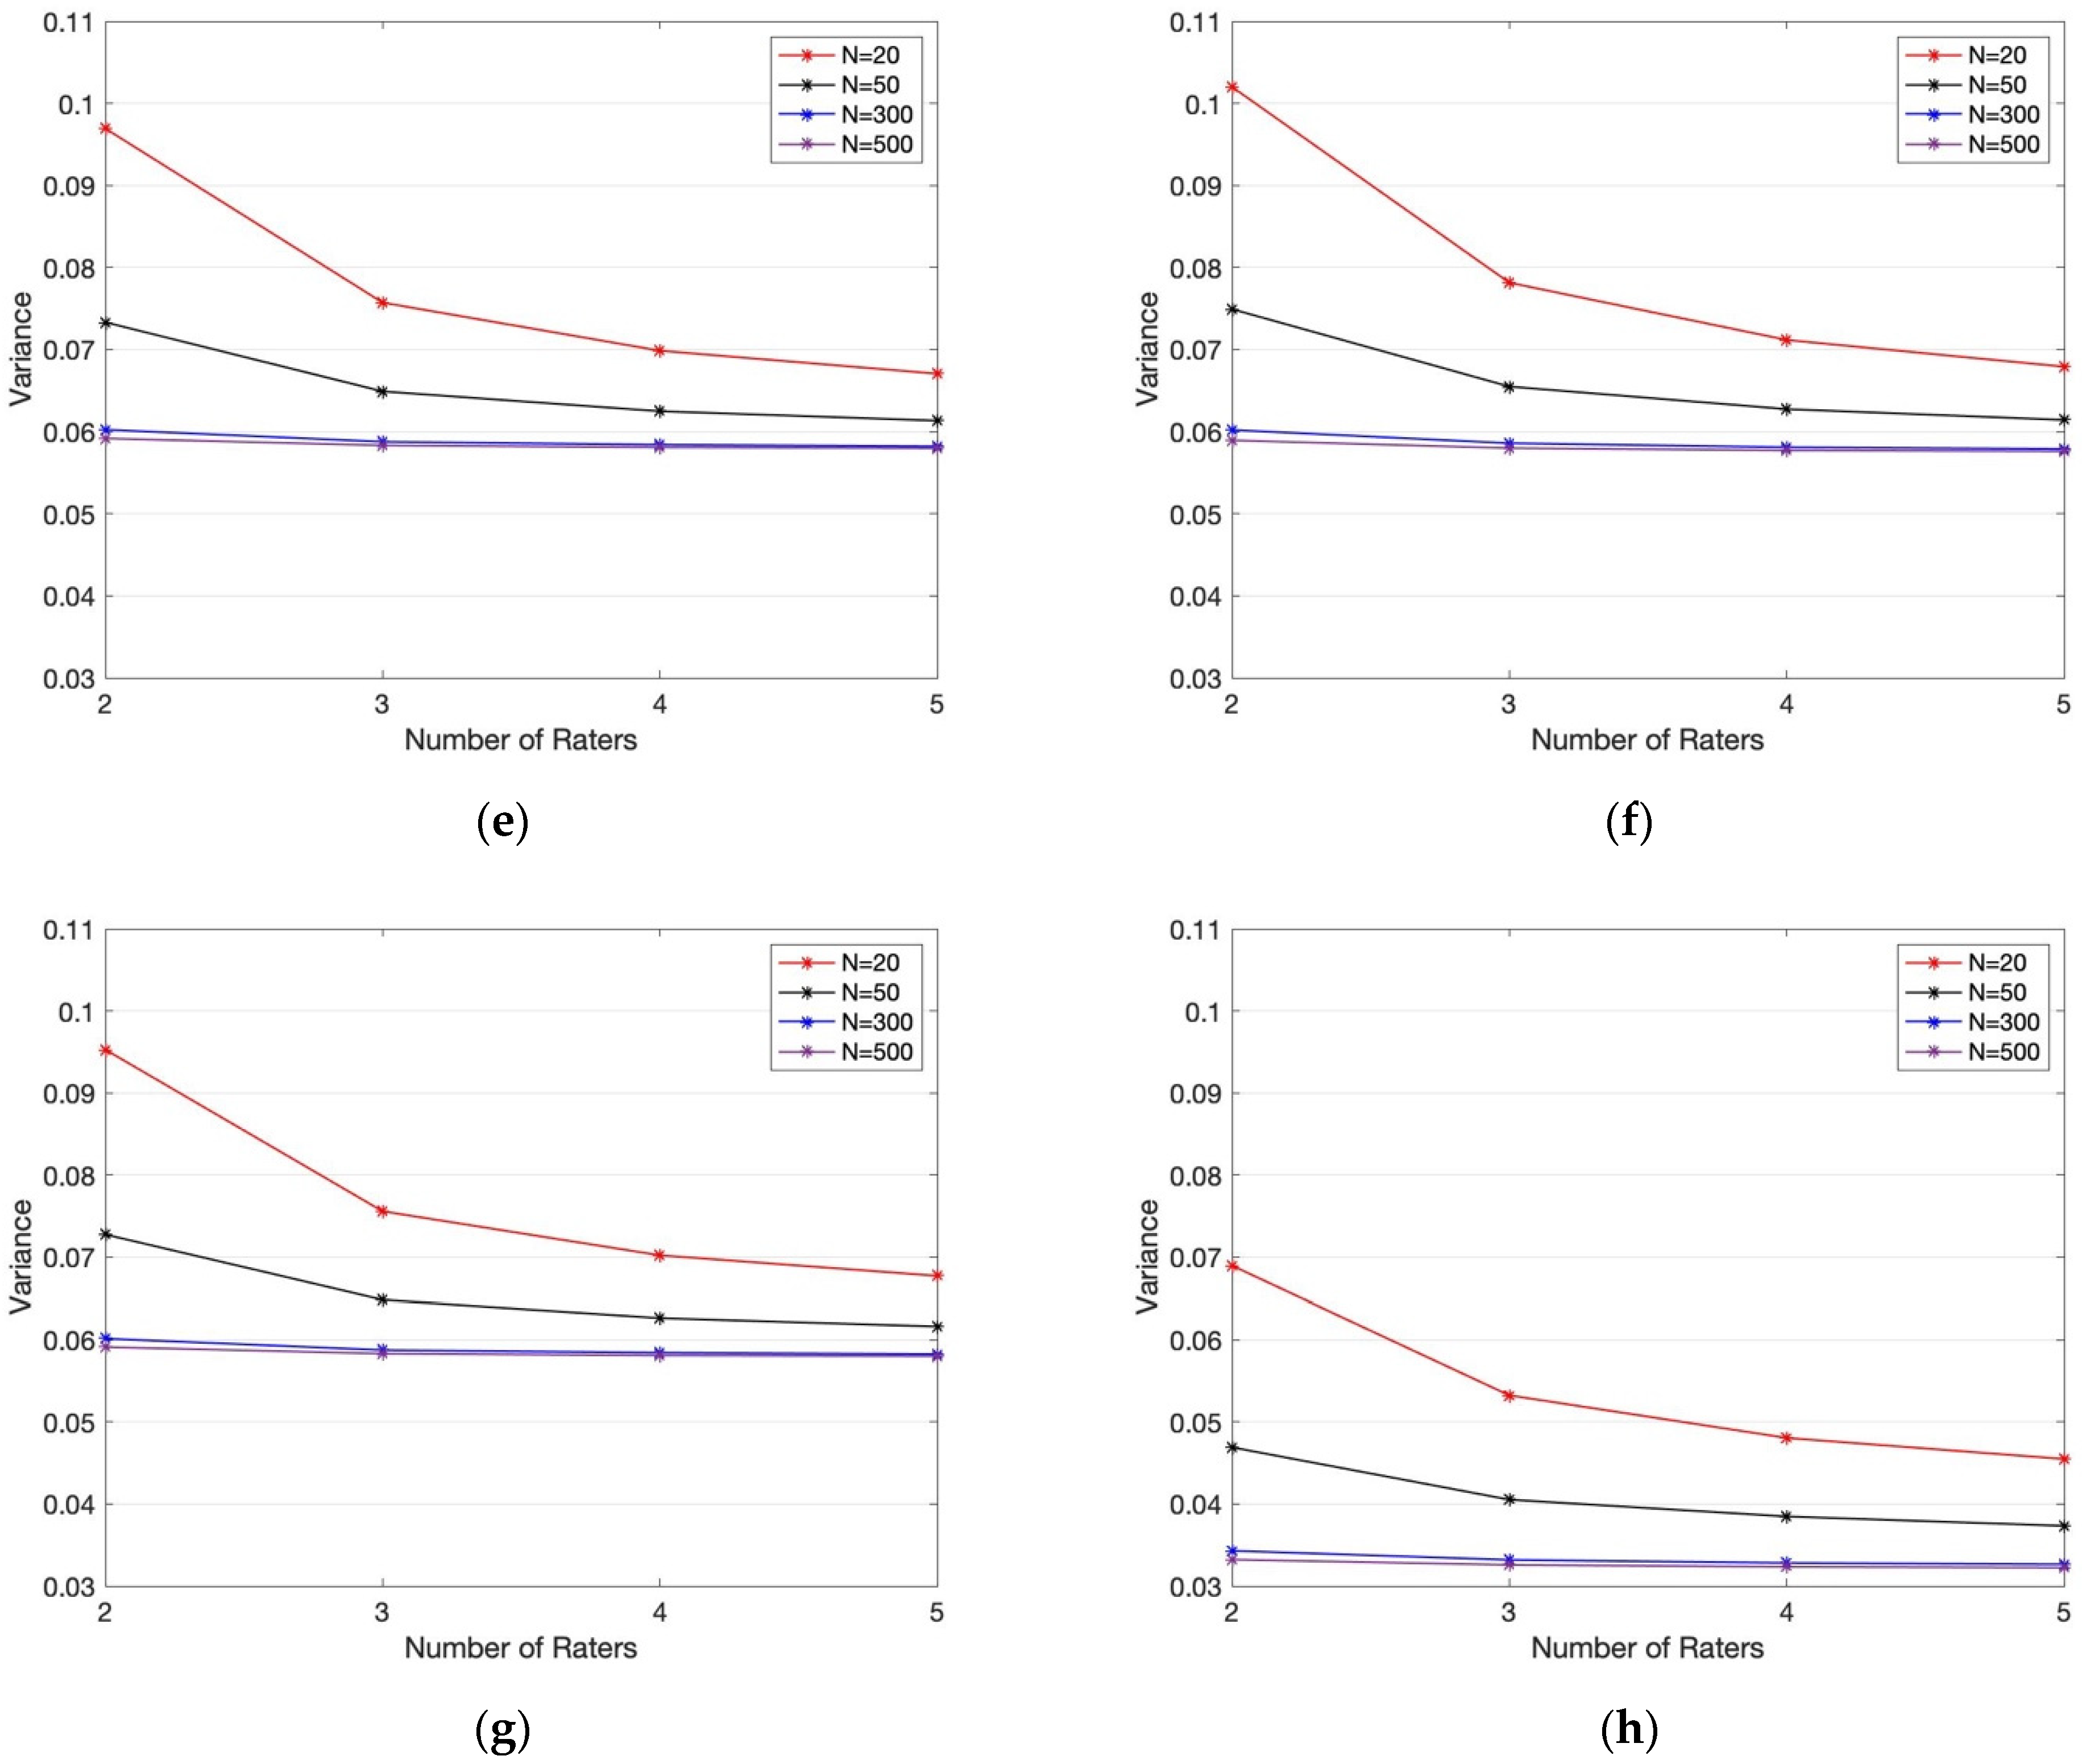
4.2. IRA Variance
From the simulation described in the previous section, we observe that the variance of the number of observations decreases over the number of raters and the number of observations (
Figure 2). Moreover, for the symmetric case (where the cut-off of the latent vectors is at 0), the empirical variance corresponding to Fleiss’ Kappa is higher than those of the other three statistics, followed by Light’s Kappa and Conger’s Kappa with approximately equal variance. Although in the symmetric case, Gwet’s AC1 has the lowest empirical variance, the difference in the empirical variance of AC1 and the other three statistics is small (mean relative error of 1.36% between AC1 and Fleiss and 0.31% between AC1 and each of Conger and Light), thus suggesting that for practical purposes, the benefit of using one statistic over another is negligible. It is worth noting that while the overall trend in the skewed simulation (where the cut-off of the latent vectors was 0.5) was the same as the trend discussed above in the symmetric case, Gwet’s AC1 statistic had a significantly smaller empirical variance in each case. Therefore, we conclude that based on this simulation, Gwet’s AC1 provides a more stable statistic when one of two events is more likely.
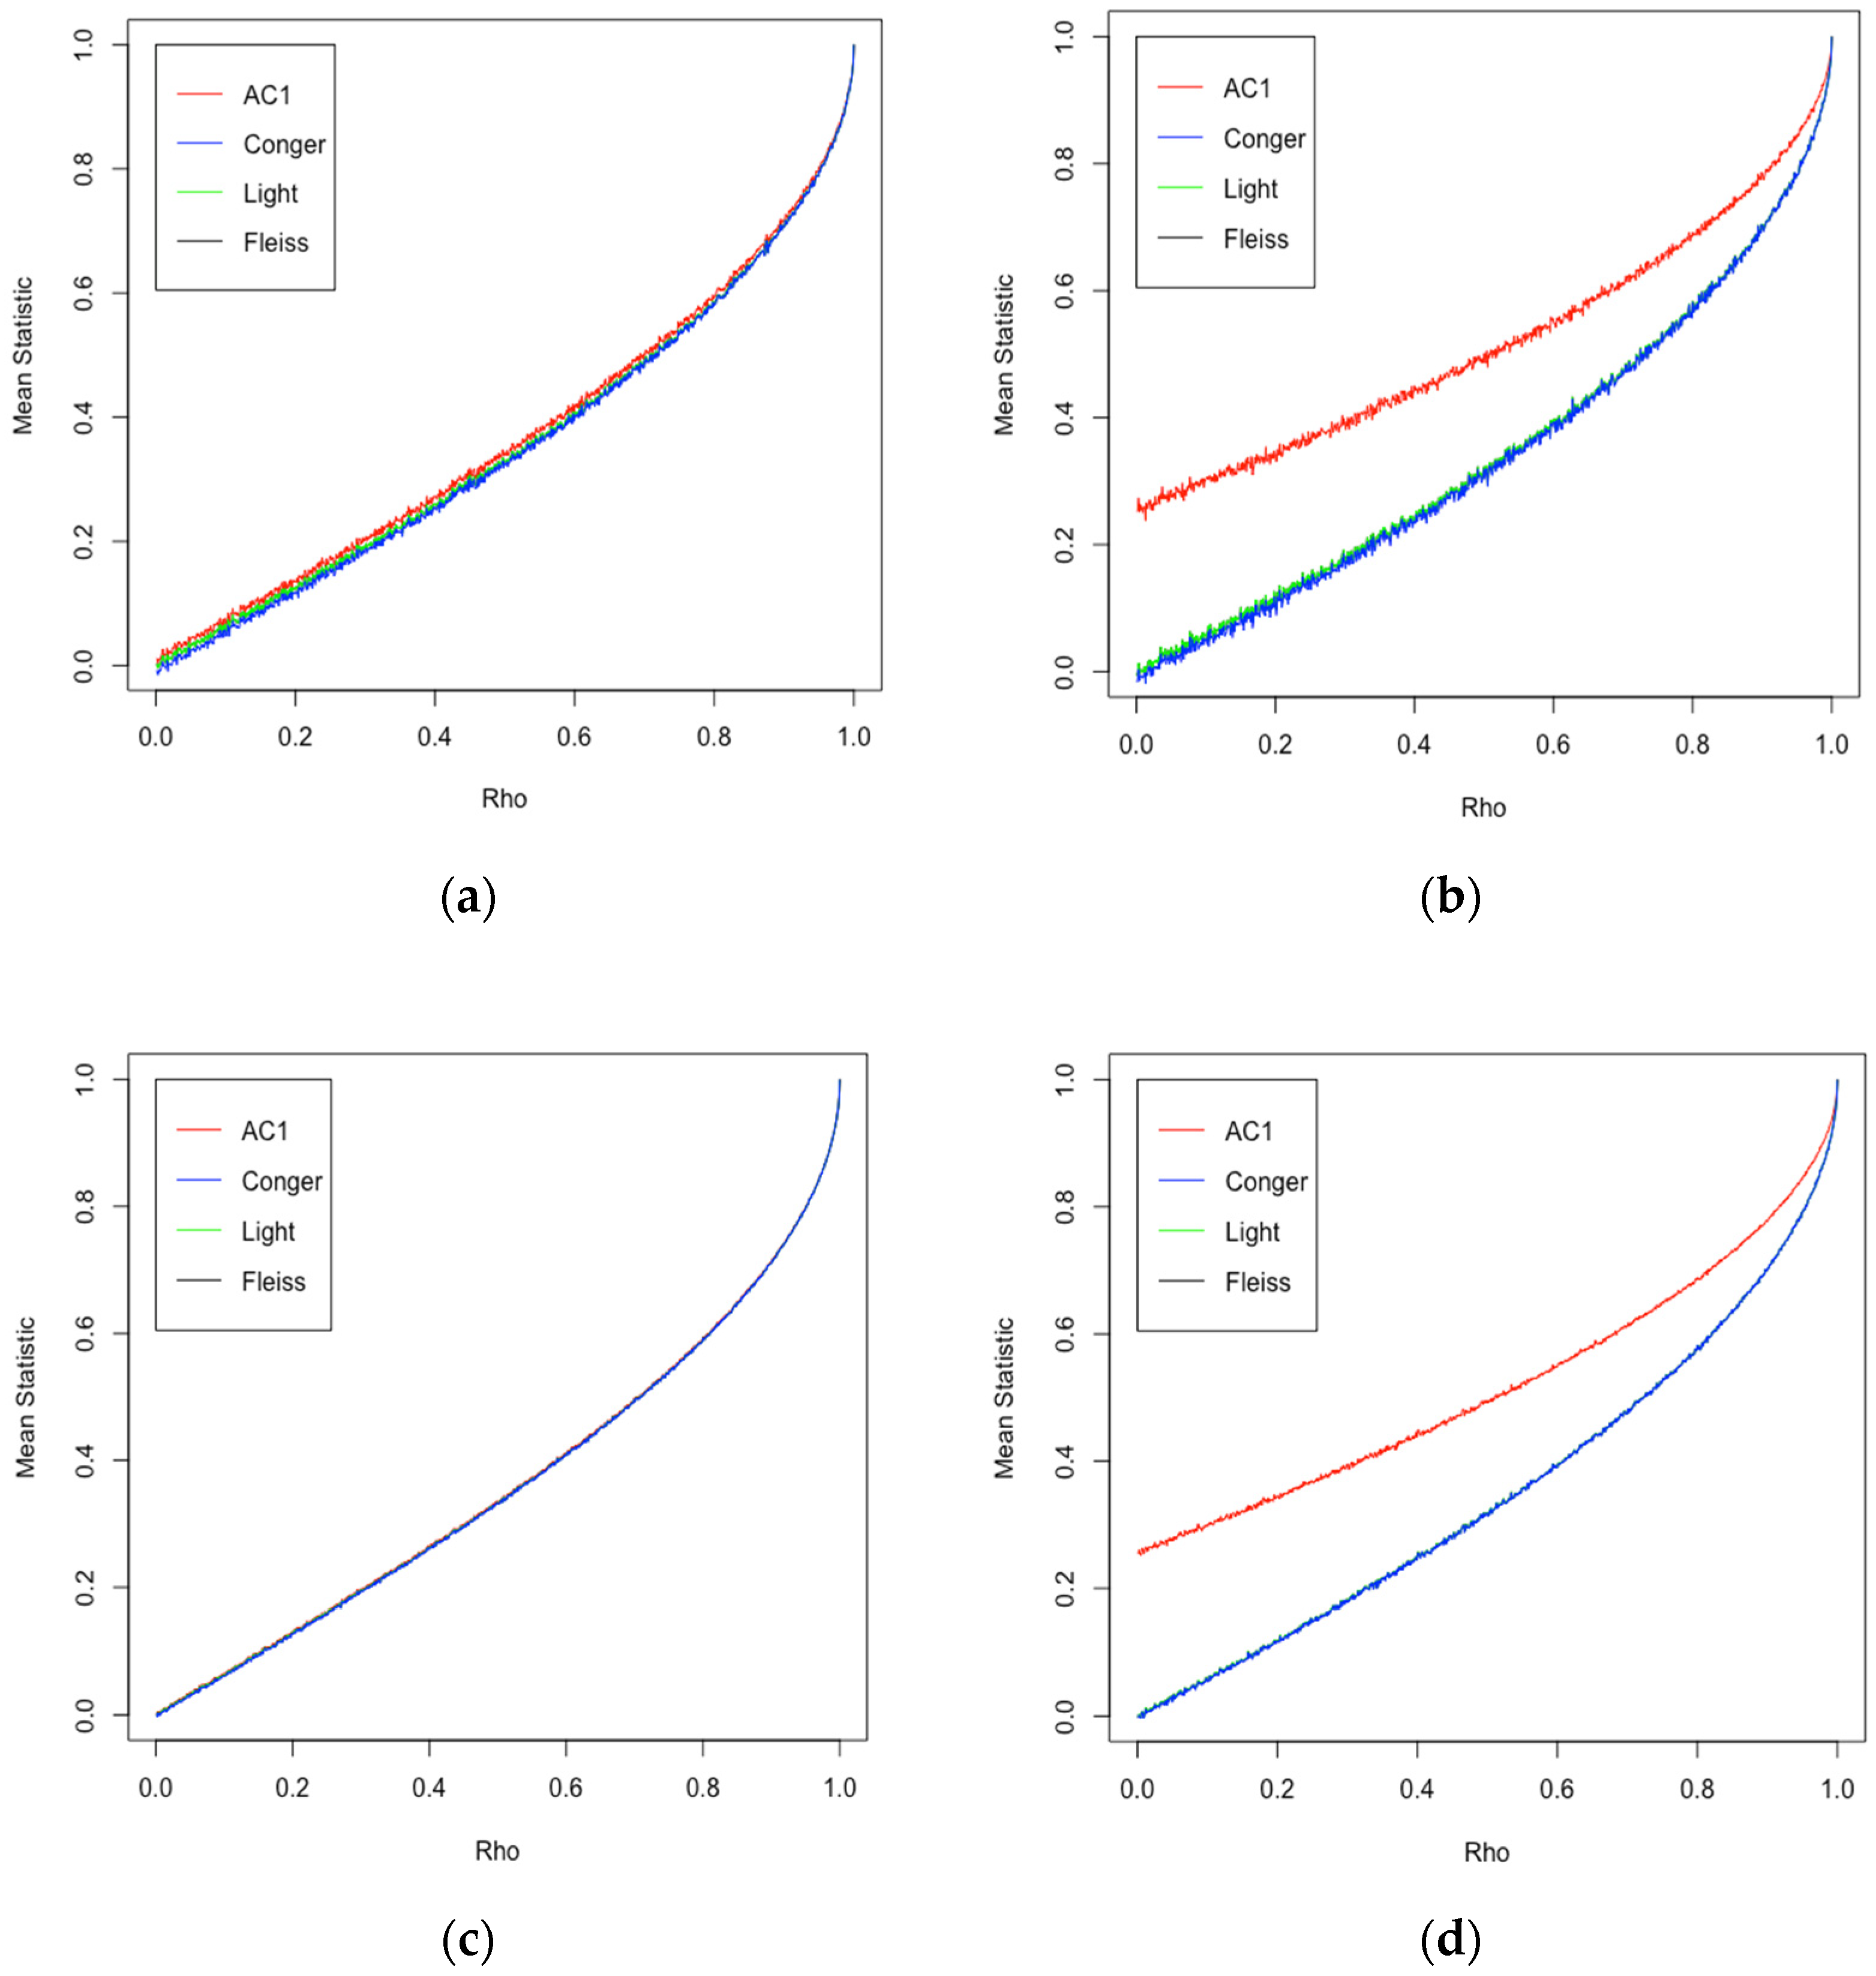
4.3. Expected IRA Value
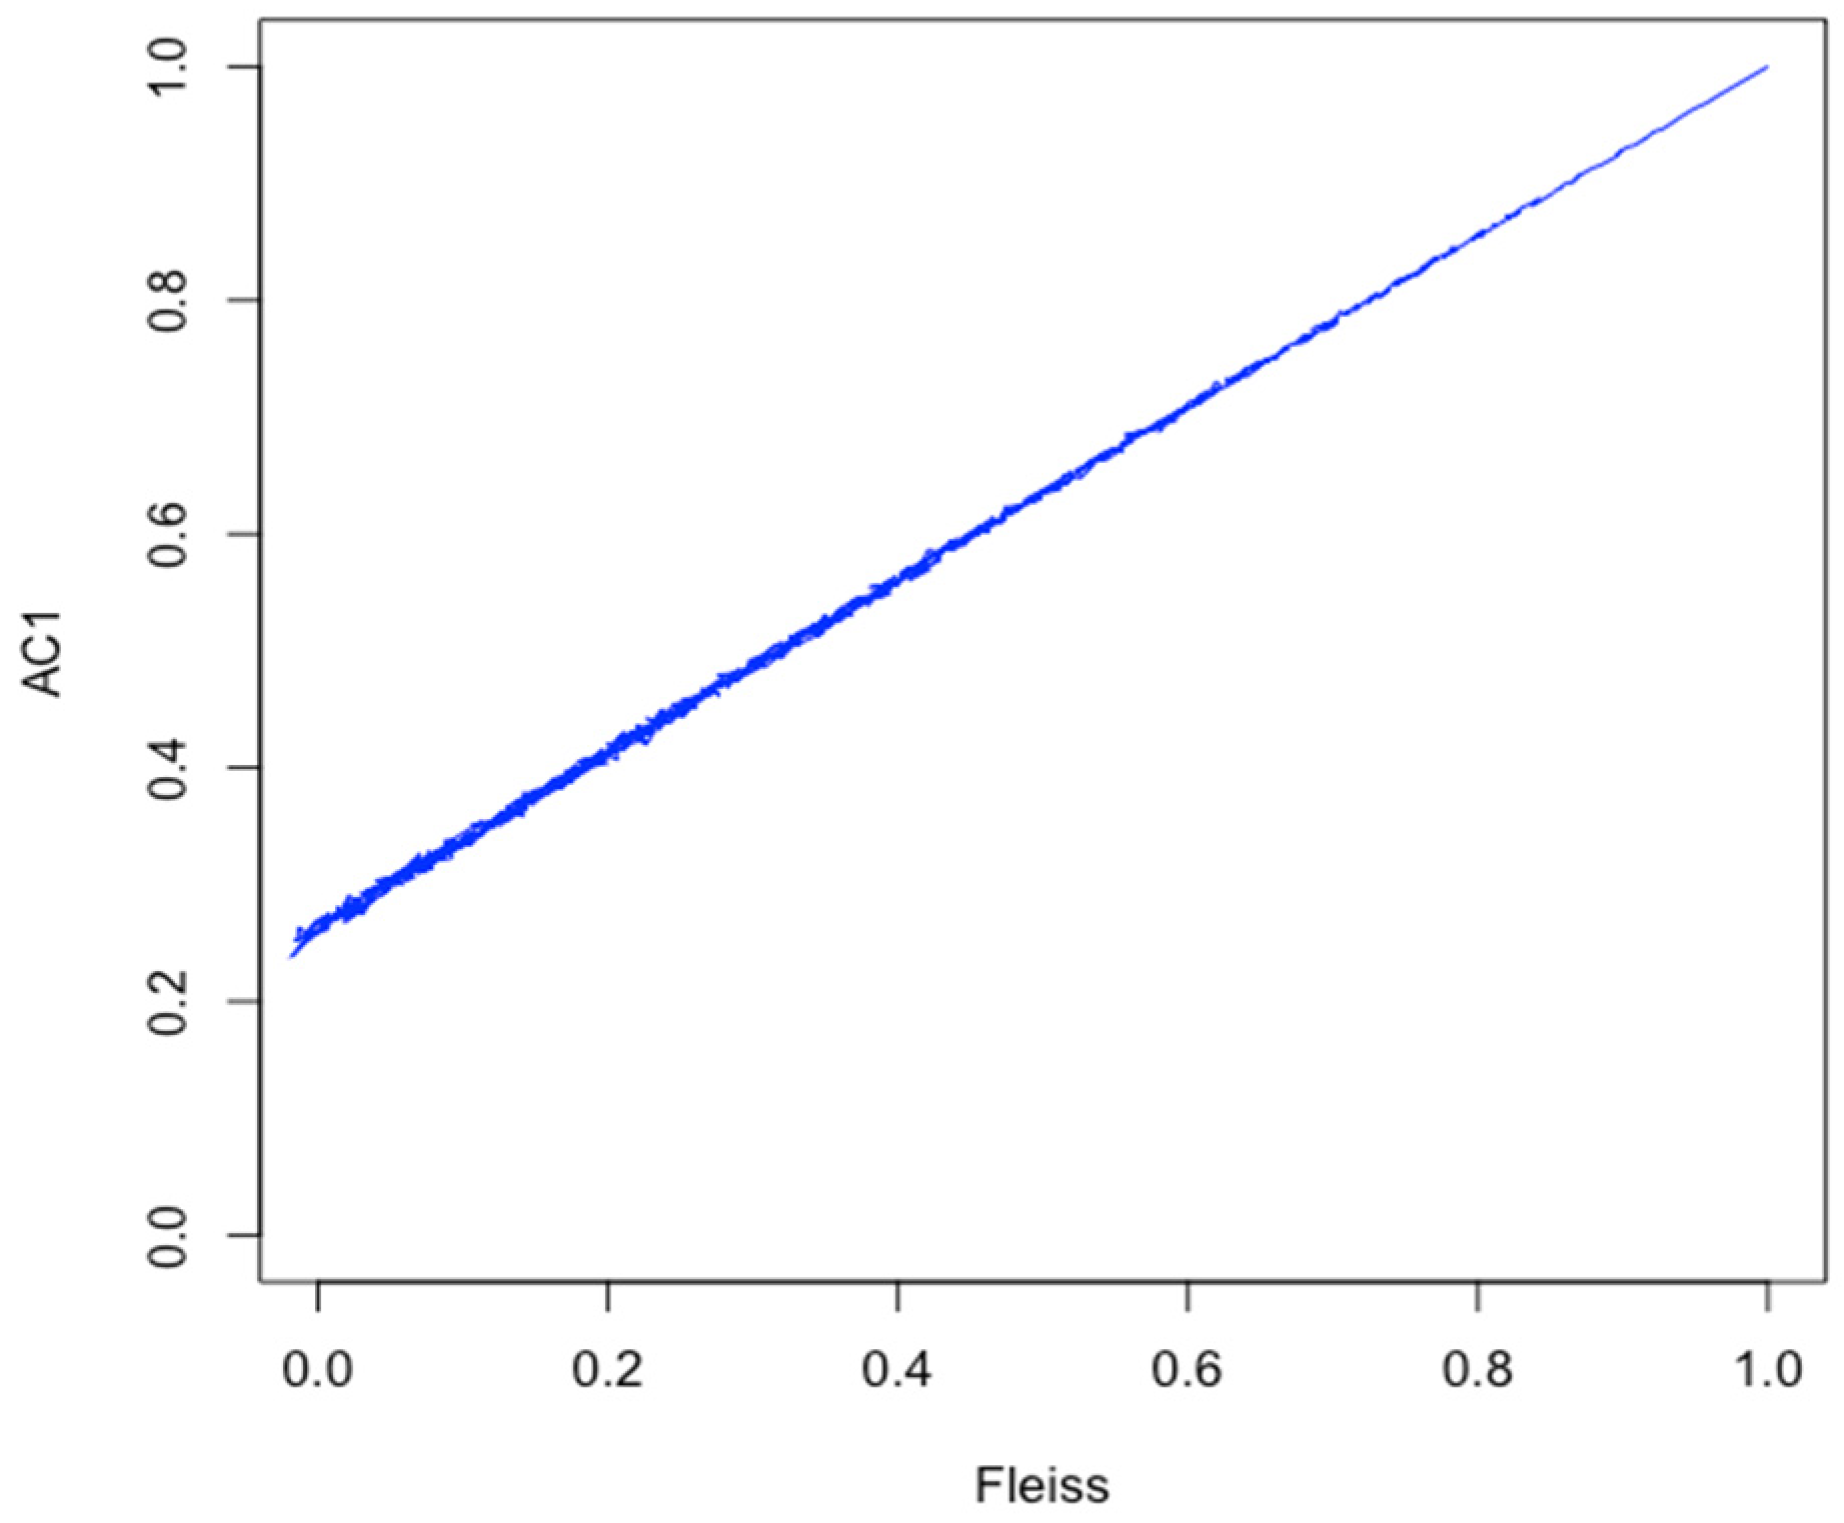
From the third simulation, we find two key observations. Firstly, taking the latent correlation as a reference, we observe that all four statistics increase monotonically (as is reasonably expected). Although the relationship between the latent correlation and the statistics is not linear, there is a bijection (
Figure 3 and
Figure 4). Secondly, we observe a substantial overlap between the estimated expected values in the symmetric case, suggesting limited practical differences between the four statistics. However, in the asymmetric case, we observe a notable divergence between Gwet’s AC1 and the Kappa statistics, such that the AC1 statistic provides a consistently higher estimated expected value for the IRA. The divergence does taper off at higher values of the latent correlation; however, this suggests that the Kappas, while consistent among themselves, are not compatible with AC1.
5. Discussion
Based on the three simulations discussed above, we would like to make a few general remarks. Firstly, the results corresponding to the Kappa Paradox simulation (Simulation 1) suggest that Kappa is sensitive to the distribution of concordance between raters. As such, we yield to AC1, given its overall stability with respect to the marginal distributions. These results are further validated by other works [
9,
18]. Additionally, the variance simulation demonstrated that under ideal (symmetric prevalence–
) circumstances, although Gwet’s AC1 provides a consistently smaller variance, there is no practically significant difference between the empirical variances of the four statistics. On the other hand, in the non-symmetric case (
), Gwet’s AC1 obtains a significantly lower variance. Thus, even though the improvement by using Gwet’s AC1 over the other statistics in the symmetric case is small, the fact that it provides a marked improvement in the skewed case allows us to recommend (based on variance) that AC1 is the preferred statistic, particularly as the population prevalence is unlikely to be known a priori in general.
Furthermore, with respect to the expected value simulation, the four statistics yield approximately the same value (with an R squared value of 1) under the symmetric case. Although possibly not surprising in the context of the three Kappa statistics, it is indeed striking in AC1, given that it is believed to be a significant conceptual deviation from the conventional statistics (in what it captures). In contrast, in the non-symmetric case, these relationships, though still strongly linear, no longer followed a one-to-one correspondence, thereby suggesting a need for some adjustment to the statistic if the direct comparison is desired.
Cumulatively, the variance and average simulations, in conjunction with the first simulation on the Kappa Paradox, suggest that under symmetry, there is no significant benefit of using one statistic over another. Under non-symmetric cases with possible differences in the marginal distributions, AC1 is the superior statistic. However, Cohen’s Kappa remains the most frequently used statistic.
The rest of this section will be dedicated to providing a series of case studies from the domains of evidence synthesis and epidemiology in order to contextualize the results of our simulations.
5.1. Critical Appraisal and Quality Assessment
Within the context of various review processes (e.g., systematic review and scoping reviews), critical appraisal of potentially included studies against some set of inclusion and exclusion criteria is a necessary step [
19,
20,
21,
22]. Additionally, the included studies are typically assessed against a set of quality criteria (e.g., the Cochrane Risk of Bias Tools for randomized and non-randomized control studies) [
19,
23,
24].
As part of these (and other) fundamental steps in the evidence synthesis process, in recent years, studies have begun to advocate for the calculation assessment of agreement or reliability between the two individuals conducting the appraisals or assessments [
25,
26,
27,
28]. However, in each context, the choice of IRA statistics may have implications in their final interpretations, which are further exacerbated by the lack of such reporting.
For example, Belur et al. [
28] chose a random sample of 100 evidence syntheses from a pool of 328 possible articles in which crime reduction outcomes were selected. Of these, only 49 contained any mention of IRR (IRA), from which 31 reported no statistical information on IRA. Though the authors elaborated on what constituted statistical information, relevant quantitative information was absent. Of the observed studies for which there was sufficient information, Fleiss’ Kappa was reported to be the most common measure of IRR (IRA); however, it was not the only statistic. Thus, in an endeavor to establish an acceptable baseline for what constitutes an acceptable IRA, how might this be done with multiple, possibly incompatible IRA statistics?
Firstly, we would like to draw attention to the fact that there is still no clear consensus on which IRA statistic should be used. Undoubtedly, Cohen’s Kappa is the most common in the two-rater context; however, it is not the only such statistic being used. Correspondingly, in establishing how high the IRA between two critical appraisers should be, a critical threshold of, say, 0.65 (possibly acceptable for Kappa) may not be acceptable for another statistic. For example, in our third simulation, in the non-symmetric case, AC1 was uniformly higher than the three Kappa statistics. As such (given the example in
Figure 4), a value of 0.6 for Kappa corresponds to approximately 0.7 for AC1. In this case (threshold 0.65), we would infer that by using AC1, the synthesis reached the critical level of IRA; however, by using Kappa, it did not. Which is correct?
To have any meaningful standard, a clear mapping from one statistic to another must be established, or methods must be limited to specific statistics (e.g., only using Kappa). The latter may be unnecessarily restrictive, since we empirically demonstrated the linearity between AC1 and the Kappa statistics. For example, in the case illustrated in
Figure 4, we observe the following estimated linear relationship:
The question then remains: What influences the linear relationship, and by how much? More generally, what is their relationship for any two pair of statistics parametrized by the number of raters and number of observations? Our simulation demonstrated the change in the relationship by altering the cut-off (a means of changing the prevalence). In the symmetric case, the relationship was approximately one to one; however, this was not so in the asymmetric case. Indeed, we attribute the increased AC1 under a skewed prevalence to the mathematical formulation of AC1. That is, when the prevalence of one group is low, then the agreement of the other group (the prevalent group) will be high, thereby driving down the change agreement and increasing the overall statistic. This is, however, only one factor that may influence the point estimate of an IRA statistic, and given their multi-factorial nature, we believe that rigorous guidelines around not only when to use them and how to report them, but also how to compare IRA statistics are necessary.
5.2. Adverse Drug Events
Adverse drug events (ADEs) have been estimated to account for approximately one in every nine emergency department visits and are a major cause of death [
29,
30,
31]. While it is generally agreed upon that ADEs pose a severe risk to population health, prevalence estimates of preventable ADEs remain highly variable [
32,
33,
34]. Of the three principal categories into which ADE assessments may be categorized, we are interested in one, namely, those based on best medical practice. For preventability assessments based on best practices, evaluations will invariably be biased by the rater’s prior beliefs about the ADE in question, among which the prevalence (believed or actual) in the population will be a factor [
35].
In this regard, it has been noted that IRA statistics are susceptible to distributions of population prevalence [
36,
37,
38], effectively biasing the estimate. Subsequently, there has been much debate around appropriately mitigating or minimizing these shortcomings [
38,
39,
40]; however, a unified approach has yet to be agreed upon. Given the possible implications of rating prevalence (often unknown) on (i) the estimation of IRA statistics and (ii) the clinical importance this may have on possibly rare ADEs and other diseases, having a rigorous basis by which to evaluate commonly used IRA statistics with respect to rating prevalence is of the utmost importance.
Consider Steven Johnson Syndrome/Toxic Epidermal Necrolysis (SJS/TEN), an adverse drug reaction occurring in approximately 1 out of every 1–1.4 million individuals [
41]. A study evaluated the inter-rater agreement of seven experts, each of whom administered three causality assessment tools (CATs) to evaluate the certainty around the causality of 30 potential drugs on SJS/TEN [
42]. We first observe that the IRA in this study was measured using Cohen’s Kappa, such that the Kappa Paradox, if present, could artificially drive the IRA down (compared to AC1), a well-known phenomenon and one that was further validated in our first simulation. Furthermore, one of the CATs that was used was the Naranjo scale, a scale in which the plausibility of other causes of the disease is assessed. The plausibility, is however, influenced in part by the ADE population prevalence [
43], which could also drive the IRA down. In this regard, while the study arrived at a low IRA statistic, our simulations suggest that this value may be significantly higher (depending on the data and prevalence of SJS/TEN). In such cases where the CATs could be used as a tool for future lines of investigation (e.g., the pharmacological basis for SJS/TEN), such considerations as ADE prevalence, rating distributions, and the IRA statistic being used should be given due consideration, as the alternative could be very costly.
5.3. Meta-Analysis
Meta-analysis is a method of (statistically) aggregating the treatment effects from various studies to arrive at a summary result. This may be done for any number of interventions and many outcome types. An outcome reported much less in the clinical context but that is certainly relevant in psychology and psychiatry is IRA (often reported as IRR). The scarcity of reporting methods in reliability studies causes interpretation and synthesis thereof difficult [
44]. In an endeavor to remediate such inconsistencies as study design, sample collection, estimate reporting, and variability, the Guidelines for Reporting Reliability and Agreement Studies (GRRAS) proposed a set of guidelines [
44]. However, despite their conceptual clarity and obvious benefit, the flexibility they allow for such studies means that different methods of measurement (IRA/IRR) might be reported for a given type of trial or study where multiple competing statistics may be used interchangeably.
It follows, then, that a single estimand may be of interest. However, multiple studies may report on different measures if IRA or IRR, thus rendering a synthesis infeasible without the use of subgroup analyses or the risk of significant heterogeneity. For example, in Duffy et al. (2013) the authors conducted a systematic review and meta-analysis to evaluate the IRA of the Barthel Index to assess stroke survivors [
45]. Briefly, the Barthel Index, developed in 1955, is a 10-item index of daily living used to assess the daily activity after rehabilitation, and is often used for clinical stroke trials [
46,
47,
48]. In their meta-analysis, Duffy et al. (2013) synthesized IRA estimates from 10 studies, each reporting on weighted Kappa or the intra-class correlation (converted to weighted Kappa). In this case, the estimates from a set of studies reported on compatible estimates; however, this may not generally hold when other IRA estimates are introduced. Indeed, in another context, in Meng et al. (2015), the authors did not undergo a meta-analysis of the IRA statistics in part because of the varying outcomes (i.e., types of IRA statistics) [
49], likely underpowering their meta-analysis. Thus, in estimating a specific estimand (e.g., a pooled effect), it may be of particular interest to understand how and when indirect (or different) estimates of the same estimand may be synthesized, both to allow such pooling and to reduce subsequent biases or ensure the validity of the subsequent estimate.
A quick review of meta-analyses reporting on IRA suggests that meta-analyses typically consist of the synthesis of studies reporting upon a single statistic (often one of the Kappa statistics). This is not unreasonable, given the hitherto unknown relationship between statistics. Thus, the argument from the first two case studies holds, in that to compare (in this case synthesize) different IRA statistics, the relationship between them needs to be known. Once this relationship is known, a transformation may be applied to the estimate and the corresponding variance. The effect may then be estimated through typical methods, such as fixed-effects or random-effects models [
18,
50,
51] or multilevel models [
52].
The work of Duffy et al. (2013) did not suffer from this problem, since the IRA statistics were converted into a quadratic weighted Kappa. However, in the presence of other IRA statistics, such as Gwet’s AC1, this would not have been possible—a problem that will likely manifest itself in other meta-analyses; this was an inhibiting factor in Meng et al. (2015) [
49]. In this regard, a fundamental assumption of meta-analysis is that pooled estimates are conducted for
sufficiently similar outcomes. Thus, if the estimates pooled in a meta-analysis fail to satisfy this condition (as may be the case under different IRA statistics), the subsequent estimate may be invalid or introduce significant heterogeneity and bias. Several methods have been established for estimating the statistical heterogeneity for Kappa and AC1 [
53,
54]; however, more work is needed to understand how these (and possibly other) formulations are affected by the pooling of transformed estimates.
6. Conclusions
The applications of inter-rater agreement are both vast and significant in many scientific disciplines. We have discussed the general motivation for computing inter-rater agreement and touched upon four commonly used ways of doing so. The four methods (Fleiss’ Kappa, Light’s Kappa, Conger’s Kappa, and Gwet’s AC1) are different in many ways, both in their mathematical frameworks and in their underlying assumptions. Though the frameworks have been very well developed since their inceptions, it is often unclear which statistic should be used in practice under particular data conditions.
The first and second simulations found that AC1 outperformed the other three statistics in terms of the observed variance (particularly when the prevalence of ratings was not equal at the population level). This is further substantiated by the overall stability of AC1 regarding the marginal distribution of the concordance between raters (Kappa paradox). AC1 yields a uniformly higher estimate of IRA with respect to the latent correlation, a fact which may be of some concern at low levels of agreement in which the IRA is appreciable, but the latent (or even actual) correlation is negligible. This is certainly something that ought to be investigated; however, from a conservative standpoint, AC1 ought to be the statistic of choice.
Author Contributions
Conceptualization, M.K., X.G. and L.W.L.; methodology, M.K., X.G. and L.W.L.; software, M.K. and X.G.; validation, M.K., X.G. and L.W.L.; formal analysis, M.K., X.G. and L.W.L. investigation, M.K., X.G. and L.W.L.; resources, X.G.; data curation, M.K., X.G. and L.W.L.; writing—original draft preparation, M.K., X.G. and L.W.L.; writing—review and editing, M.K., X.G. and L.W.L.; visualization, M.K., X.G. and L.W.L.; supervision, X.G. and L.W.L.; project administration, X.G.; funding acquisition, X.G. All authors have read and agreed to the published version of the manuscript.
Funding
This research was funded by the Natural Sciences and Engineering Research Council of Canada (NSERC).
Institutional Review Board Statement
Not applicable.
Informed Consent Statement
Not applicable.
Acknowledgments
M.K. would like to acknowledge Bertha Acevedo for comments on the manuscript.
Conflicts of Interest
The authors declare no conflict of interest. The funders had no role in the design of the study; in the collection, analyses, or interpretation of data; in the writing of the manuscript, or in the decision to publish the results.
References
- Martin Bland, J.; Altman, D. Statistical Methods for Assessing Agreement Between Two Methods of Clinical Measurement. Lancet 1986, 327, 307–310. [Google Scholar] [CrossRef]
- Cohen, J. A Coefficient of Agreement for Nominal Scales. Educ. Psychol. Meas. 1960, 20, 37–46. [Google Scholar] [CrossRef]
- Gwet, K.L. Handbook of Inter-Rater Reliability, 4th ed.; Advanced Analytics: Gaithersburg, MD, USA, 2014; ISBN 978-0-9708062-8-4. [Google Scholar]
- Berry, K.J.; Mielke, P.W. A Generalization of Cohen’s Kappa Agreement Measure to Interval Measurement and Multiple Raters. Educ. Psychol. Meas. 1988, 48, 921–933. [Google Scholar] [CrossRef]
- Blood, E.; Spratt, K.F. Disagreement on Agreement: Two Alternative Agreement Coefficients. SAS Glob. Forum 2007, 186, 1–12. [Google Scholar] [CrossRef]
- Gisev, N.; Bell, J.S.; Chen, T.F. Interrater agreement and interrater reliability: Key concepts, approaches, and applications. Res. Soc. Adm. Pharm. 2013, 9, 330–338. [Google Scholar] [CrossRef] [PubMed]
- Zapf, A.; Castell, S.; Morawietz, L.; Karch, A. Measuring inter-rater reliability for nominal data—Which coefficients and confidence intervals are appropriate? BMC Med. Res. Methodol. 2016, 16, 93. [Google Scholar] [CrossRef]
- Tang, B.; Giuliani, M.; Le, L.W.; Higgins, J.; Bezjak, A.; Brade, A.; Cho, B.C.J.; Sun, A.; Hope, A.J. Capturing Acute Toxicity Data During Lung Radiotherapy by Using a Patient-Reported Assessment Tool. Clin. Lung Cancer 2013, 14, 108–112. [Google Scholar] [CrossRef]
- Wongpakaran, N.; Wongpakaran, T.; Wedding, D.; Gwet, K.L. A comparison of Cohen’s Kappa and Gwet’s AC1 when calculating inter-rater reliability coefficients: A study conducted with personality disorder samples. BMC Med. Res. Methodol. 2013, 13, 61. [Google Scholar] [CrossRef]
- Krippendorff, K. Misunderstanding Reliability. Methodology 2016, 12, 139–144. [Google Scholar] [CrossRef][Green Version]
- Light, R.J. Measures of response agreement for qualitative data: Some generalizations and alternatives. Psychol. Bull. 1971, 76, 365–377. [Google Scholar] [CrossRef]
- Byrt, T.; Bishop, J.; Carlin, J.B. Bias, prevalence and Kappa. J. Clin. Epidemiol. 1993, 46, 423–429. [Google Scholar] [CrossRef]
- Agresti, A.; Ghosh, A.; Bini, M. Raking Kappa: Describing Potential Impact of Marginal Distributions on Measures of Agreement. Biom. J. 1995, 37, 811–820. [Google Scholar] [CrossRef]
- Cohen, J. Weighted Kappa: Nominal scale agreement provision for scaled disagreement or partial credit. Psychol. Bull. 1968, 70, 213–220. [Google Scholar] [CrossRef] [PubMed]
- Fleiss, J. Measuring Nominal Scale agreement amongst many raters. Psychol. Bull. 1971, 76, 378–382. [Google Scholar] [CrossRef]
- Conger, A.J. Integration and generalization of kappas for multiple raters. Psychol. Bull. 1980, 88, 322–328. [Google Scholar] [CrossRef]
- Krippendorff, K. Estimating the Reliability, Systematic Error and Random Error of Interval Data. Educ. Psychol. Meas. 1970, 30, 61–70. [Google Scholar] [CrossRef]
- Xie, Q. Agree or Disagree? A Demonstration of An Alternative Statistic to Cohen’ s Kappa for Measuring the Extent and Reliability of Agreement between Observers. FCSM Res. Conf. 2013, 3, 7–9. [Google Scholar]
- Higgins, J.P.; Thomas, J.; Chandlerr, J.; Cumpston, M.; Li, T.; Page, M.J.; Welch, V.A. (Eds.) Cochrane Handbook for Systematic Reviews of Interventions, 2nd ed.; John Wiley & Sons, Ltd.: Chichester, UK, 2019; ISBN 9780470712184. [Google Scholar]
- Garritty, C.; Gartlehner, G.; Kamel, C.; King, V.J.; Nussbaumer-Streit, B.; Stevens, A.; Hamel, C.; Affengruber, L. Cochrane Rapid Reviews; Interim Guidence Cochrane Rapid Reviews Methods Group; Cochrane Community: London, UK, 2020; pp. 1–2. [Google Scholar]
- Munn, Z.; Peters, M.D.J.; Stern, C.; Tufanaru, C.; McArthur, A.; Aromataris, E. Systematic review or scoping review? Guidance for authors when choosing between a systematic or scoping review approach. BMC Med. Res. Methodol. 2018, 18, 143. [Google Scholar] [CrossRef]
- Kastner, M.; Tricco, A.C.; Soobiah, C.; Lillie, E.; Perrier, L.; Horsley, T.; Welch, V.; Cogo, E.; Antony, J.; Straus, S.E. What is the most appropriate knowledge synthesis method to conduct a review? Protocol for a scoping review. BMC Med. Res. Methodol. 2012, 12, 114. [Google Scholar] [CrossRef]
- Sterne, J.A.C.; Savović, J.; Page, M.J.; Elbers, R.G.; Blencowe, N.S.; Boutron, I.; Cates, C.J.; Cheng, H.-Y.; Corbett, M.S.; Eldridge, S.M.; et al. RoB 2: A revised tool for assessing risk of bias in randomised trials. BMJ 2019, 366, l4898. [Google Scholar] [CrossRef]
- Sterne, J.A.; Hernán, M.A.; Reeves, B.C.; Savović, J.; Berkman, N.D.; Viswanathan, M.; Henry, D.; Altman, D.G.; Ansari, M.T.; Boutron, I.; et al. ROBINS-I: A tool for assessing risk of bias in non-randomised studies of interventions. BMJ 2016, 355, i4919. [Google Scholar] [CrossRef] [PubMed]
- Pieper, D.; Jacobs, A.; Weikert, B.; Fishta, A.; Wegewitz, U. Inter-rater reliability of AMSTAR is dependent on the pair of reviewers. BMC Med. Res. Methodol. 2017, 17, 98. [Google Scholar] [CrossRef] [PubMed]
- Jeyaraman, M.M.; Rabbani, R.; Al-Yousif, N.; Robson, R.C.; Copstein, L.; Xia, J.; Pollock, M.; Mansour, S.; Ansari, M.T.; Tricco, A.C.; et al. Inter-rater reliability and concurrent validity of ROBINS-I: Protocol for a cross-sectional study. Syst. Rev. 2020, 9, 12. [Google Scholar] [CrossRef]
- Hartling, L.; Hamm, M.; Milne, A.; Vandermeer, B.; Santaguida, P.L.; Ansari, M.; Tsertsvadze, A.; Hempel, S.; Shekelle, P.; Drydem, D.M. Validity and Inter-Rater Reliability Testing of Quality Assessment Instruments; Agency for Healthcare Research and Quality: Rockville, MD, USA, 2012. [Google Scholar]
- Belur, J.; Tompson, L.; Thornton, A.; Simon, M. Interrater Reliability in Systematic Review Methodology. Sociol. Methods Res. 2021, 50, 837–865. [Google Scholar] [CrossRef]
- Woo, S.A.; Cragg, A.; Wickham, M.E.; Peddie, D.; Balka, E.; Scheuermeyer, F.; Villanyi, D.; Hohl, C.M. Methods for evaluating adverse drug event preventability in emergency department patients. BMC Med. Res. Methodol. 2018, 18, 160. [Google Scholar] [CrossRef]
- Hohl, C.M.; Yu, E.; Hunte, G.S.; Brubacher, J.R.; Hosseini, F.; Argent, C.P.; Chan, W.W.Y.; Wiens, M.O.; Sheps, S.B.; Singer, J. Clinical decision rules to improve the detection of adverse drug events in emergency department patients. Acad. Emerg. Med. 2012, 19, 640–649. [Google Scholar] [CrossRef]
- Hohl, C.M.; Badke, K.; Zhao, A.; Wickham, M.E.; Woo, S.A.; Sivilotti, M.L.A.; Perry, J.J. Prospective validation of clinical criteria to identify emergency department patients at high risk for adverse drug events. Acad. Emerg. Med. 2018, 25, 1015–1026. [Google Scholar] [CrossRef]
- Budnitz, D.S.; Lovegrove, M.C.; Shehab, N.; Richards, C.L. Emergency hospitalizations for adverse drug events in older Americans. N. Engl. J. Med. 2011, 365, 2002–2012. [Google Scholar] [CrossRef]
- Zed, P.J.; Abu-Laban, R.B.; Balen, R.M.; Loewen, P.S.; Hohl, C.M.; Brubacher, J.R.; Wilbur, K.; Wiens, M.O.; Samoy, L.J.; Lacaria, K. Incidence, severity and preventability of medication-related visits to the emergency department: A prospective study. CMAJ 2008, 178, 1563–1569. [Google Scholar] [CrossRef]
- Hamilton, H.J.; Gallagher, P.F.; O’Mahony, D. Inappropriate prescribing and adverse drug events in older people. BMC Geriatr. 2009, 9, 5. [Google Scholar] [CrossRef]
- Leeflang, M.M.G.; Bossuyt, P.M.M.; Irwig, L. Diagnostic test accuracy may vary with prevalence: Implications for evidence-based diagnosis. J. Clin. Epidemiol. 2009, 62, 5–12. [Google Scholar] [CrossRef] [PubMed]
- Hoehler, F.K. Bias and prevalence effects on Kappa viewed in terms of sensitivity and specificity. J. Clin. Epidemiol. 2000, 53, 499–503. [Google Scholar] [CrossRef]
- Mitani, A.A.; Freer, P.E.; Nelson, K.P. Summary measures of agreement and association between many raters’ ordinal classifications. Ann. Epidemiol. 2017, 27, 677–685.e4. [Google Scholar] [CrossRef]
- Verducci, J.S.; Mack, M.E.; DeGroot, M.H. Estimating multiple rater agreement for a rare diagnosis. J. Multivar. Anal. 1988, 27, 512–535. [Google Scholar] [CrossRef]
- Mitani, A.A.; Nelson, K.P. Modeling Agreement between Binary Classifications of Multiple Raters in R and SAS. J. Mod. Appl. Stat. Methods 2017, 16, 277–309. [Google Scholar] [CrossRef]
- Nelson, K.P.; Mitani, A.A.; Edwards, D. Evaluating the effects of rater and subject factors on measures of association. Biom. J. 2018, 60, 639–656. [Google Scholar] [CrossRef]
- Goldman, J.L.; Chung, W.-H.; Lee, B.R.; Chen, C.-B.; Lu, C.-W.; Hoetzenecker, W.; Micheletti, R.; Yasuda, S.U.; Margolis, D.J.; Shear, N.H.; et al. Adverse drug reaction causality assessment tools for drug-induced Stevens-Johnson syndrome and toxic epidermal necrolysis: Room for improvement. Eur. J. Clin. Pharmacol. 2019, 75, 1135–1141. [Google Scholar] [CrossRef]
- Kottner, J.; Audigé, L.; Brorson, S.; Donner, A.; Gajewski, B.J.; Hróbjartsson, A.; Roberts, C.; Shoukri, M.; Streiner, D.L. Guidelines for Reporting Reliability and Agreement Studies (GRRAS) were proposed. J. Clin. Epidemiol. 2011, 64, 96–106. [Google Scholar] [CrossRef]
- Duffy, L.; Gajree, S.; Langhorne, P.; Stott, D.J.; Quinn, T.J. Reliability (Inter-rater Agreement) of the Barthel Index for Assessment of Stroke Survivors. Stroke 2013, 44, 462–468. [Google Scholar] [CrossRef]
- Quinn, T.J.; Dawson, J.; Walters, M.R.; Lees, K.R. Functional outcome measures in contemporary stroke trials. Int. J. Stroke 2009, 4, 200–205. [Google Scholar] [CrossRef]
- Quinn, T.J.; Langhorne, P.; Stott, D.J. Barthel index for stroke trials: Development, properties, and application. Stroke 2011, 42, 1146–1151. [Google Scholar] [CrossRef] [PubMed]
- Mahoney, F.I.; Barthel, D.W. Functional evaluation: The Barthel Index: A simple index of independence useful in scoring improvement in the rehabilitation of the chronically ill. Md. State Med. J. 1965, 14, 61–65. [Google Scholar] [PubMed]
- Meng, Z.; Chen, C.; Zhu, Y.; Zhang, S.; Wei, C.; Hu, B.; Yu, L.; Hu, B.; Shen, E. Diagnostic performance of the automated breast volume scanner: A systematic review of inter-rater reliability/agreement and meta-analysis of diagnostic accuracy for differentiating benign and malignant breast lesions. Eur. Radiol. 2015, 25, 3638–3647. [Google Scholar] [CrossRef] [PubMed]
- Ghislain, P.; Roujeau, J. Treatment of severe drug reactions: Stevens-Johnson syndrome, toxic epidermal necrolysis and hypersensitivity syndrome. Dermatol. Online J. 2002, 8, 5. [Google Scholar] [CrossRef] [PubMed]
- Gallagher, R.M.; Kirkham, J.J.; Mason, J.R.; Bird, K.A.; Williamson, P.R.; Nunn, A.J.; Turner, M.A.; Smyth, R.L.; Pirmohamed, M. Development and Inter-Rater Reliability of the Liverpool Adverse Drug Reaction Causality Assessment Tool. PLoS ONE 2011, 6, e28096. [Google Scholar] [CrossRef]
- DerSimonian, R.; Laird, N. Meta-analysis in clinical trials. Control. Clin. Trials 1986, 7, 177–188. [Google Scholar] [CrossRef]
- Sun, S. Meta-analysis of Cohen’s Kappa. Health Serv. Outcomes Res. Methodol. 2011, 11, 145–163. [Google Scholar] [CrossRef]
- Bornmann, L.; Mutz, R.; Daniel, H.-D. A Reliability-Generalization Study of Journal Peer Reviews: A Multilevel Meta-Analysis of Inter-Rater Reliability and Its Determinants. PLoS ONE 2010, 5, e14331. [Google Scholar] [CrossRef]
- Honda, C.; Ohyama, T. Homogeneity score test of AC1 statistics and estimation of common AC1 in multiple or stratified inter-rater agreement studies. BMC Med. Res. Methodol. 2020, 20, 20. [Google Scholar] [CrossRef]
- Kraemer, H.C.; Bloch, D.A.; Donner, A.; Eliasziw, M. A goodness-of-fit approach to inference procedures for the kappa statistic: Confidence interval construction, significance-testing and sample size estimation. Stat. Med. 1994, 13, 876–880. [Google Scholar] [CrossRef]
- Warrens, M.J. Inequalities between multi-rater kappas. Adv. Data Anal. Classif. 2010, 4, 271–286. [Google Scholar] [CrossRef]
- Banerjee, M.; Capozzoli, M.; Mcsweeney, L.; Sinha, D. Beyond kappa: A rev interrater agreemen. Can. J. Stat. 2019, 27, 3–23. [Google Scholar] [CrossRef]
- Grassano, L.; Pagana, G.; Daperno, M.; Bibbona, E.; Gasparini, M. Asymptotic distributions of kappa statistics and their differences with many raters, many rating categories and two conditions. Biom. J. 2018, 60, 146–154. [Google Scholar] [CrossRef] [PubMed]
- Gwet, K.L. Computing inter-rater reliability and its variance in the presence of high agreement. Br. J. Math. Stat. Psychol. 2008, 61, 29–48. [Google Scholar] [CrossRef] [PubMed]
| Publisher’s Note: MDPI stays neutral with regard to jurisdictional claims in published maps and institutional affiliations. |
© 2022 by the authors. Licensee MDPI, Basel, Switzerland. This article is an open access article distributed under the terms and conditions of the Creative Commons Attribution (CC BY) license (https://creativecommons.org/licenses/by/4.0/).


