Abstract
The extent of failure evaluation depends on the complexity and significance of electronic products. However, traditional failure mode and effect analysis (FMEA) has many shortcomings, which brings large difficulty to failure evaluating work. This paper uses the double hierarchy hesitant fuzzy linguistic term set (DHHFLTS) and the K-means clustering algorithm to improve the shortcomings of traditional FMEA. The DHHFLTS is a set of language terms based on the symmetry method and uniform language granularity. Firstly, we determine the product failure mode and set up an evaluation team after formulating an evaluation symmetrical language set. The psychological changes of the evaluators can be truly expressed by using the DHHFLTS. Secondly, the entropy weight method is used to calculate the weight of the evaluation members. The evaluation information of the evaluation personnel on the failure mode is aggregated based on the weight of the evaluation members. Then, the K-means clustering algorithm is used to calculate the distance between failure modes and each cluster center point by using the normalized weight of influencing factors and the evaluation distance of each evaluator. Finally, the evaluation of an electromagnet failure mode is taken as an example to prove the objectivity and practicability of the new method.
1. Introduction
With the increasing competition for electronic products, people’s consumption ideas are becoming pragmatic, and quality and reliability have become the main factors for products to occupy the market share. The failure evaluation quality of the judges directly affects the working performance of electronic products. An accurate and comprehensive failure evaluation has proven to be the best measure of success for product design and development. Thus, in order to achieve the goal of improving the quality and reliability of products, the first important measure for identifying and sorting the potential failure modes is the correct prevention and optimization method. Most importantly, many evaluation methods and their tools provide instant feedback so that we can react in real time to the quality parameters of electronic products. At present, the research on reliability analysis has produced a lot of achievements. Zhang et al. [1] proposed a reliability model based on the Bayesian network and Marshall–Olkin Weibull distribution to analyze the reliability of product dynamics. These research results provide new ideas for the research of reliability analysis, but these methods are not suitable for the actual use of enterprises because of their large amount of data processing and complex calculation [2].
As a common method of reliability analysis, FMEA is widely used in the design and production stage of various products, such as offshore wind turbines [3], furniture manufacturing [4], semiconductor design [5], and other industries. FMEA identifies all potential failure modes by analyzing the subsystems and parts that make up the product and each step of the product’s design process. It is a systematic activity to analyze its possible consequences and take necessary measures in advance to improve the quality and reliability of products [6]. Compared with other reliability analysis methods, the calculation process is simple and suitable for the actual production process of enterprises [7]. With the increase in FMEA frequency and scene, its own problems are also exposed. Firstly, the FMEA evaluation process uses accurate numbers to evaluate the failure mode, which does not conform to people’s language habits when evaluating. Secondly, the weight of the influencing factors in the FMEA evaluation is equally divided, without considering the relative importance of the influencing factors. In addition, the weight of the evaluation members is also subjectively specified, which will lead to unreal evaluation results. Thirdly, the risk priority number (RPN) is used to sort the final results. RPN includes severity (S), occurrence (O), and detection (D), which will lead to the same RPN value, and the values of each influencing factor may be different. However, for enterprises, compared with the failure mode with high frequency and a low detection degree, the failure mode with high severity needs more preventive measures in advance, so traditional FMEA cannot guide the production of enterprises well.
In view of the shortcomings of traditional FMEA, many scholars have made improvements. On the one hand, intuitionistic fuzzy sets (IFSs) can replace accurate numbers in the evaluation language and better express people’s fuzzy psychology in the evaluation process. Chang et al. [8] used IFSs to evaluate the reliability of an octane system and to some extent improve the evaluation language, but IFSs can only describe the members’ fuzzy psychology. They cannot express the hesitation of evaluation members; for example, some evaluators believe that the severity should be between high and high language sets, which is impossible to express for the IFS. The rest, such as trapezoidal [9] and triangular fuzzy numbers [10], can only express ambiguity, but they cannot express hesitation very well. Relative to fuzzy linguistic sets (FLSs), hesitation fuzzy linguistic sets (HFLSs) can not only express the fuzziness of evaluation, but also the hesitation of evaluation. Zhang et al. [11] used probabilistic interval-valued hesitant fuzzy sets (PIV-HFSs) to express the evaluation information of evaluation members, and using interval-valued fuzzy sets can include the real thoughts of evaluation members. Liu et al. [12] added two-tuple semantics to an HFLS. When they were used to process the HFLS for integration, the integration results exceeded the linguistic terms set, and language information was lost. In addition, triangular hesitant fuzzy sets [13], hesitant Z-numbers [14], and intermediate two-tuple fuzzy sets [15] can express the hesitant mentality of the evaluators, which is particularly important for reliability analysis in the context of dynamic production [16]. However, these methods are very large for the partition interval of language sets and cannot express sentences that are a little higher. In addition, more data are needed to express language sets, such as triangular hesitant fuzzy numbers, which need a, b, and c data to determine triangular fuzzy numbers. The DHHFLTS is composed of double hierarchy linguistic term sets (DHLTSs) and HFLTSs. It divides the first hierarchy linguistic set by using the second hierarchy linguistic set to shorten the interval length of the linguistic set. Its double hierarchy language set is based on the concept of symmetry, so it can really depict bipolar psychology during the evaluation process. The final evaluation information is to select a limited and orderly continuous linguistic term set from the DHHFLTS to form a hesitant interval [17]. So far, based on the existing FMEA evaluation forms and research background, this paper holds that the DHHFLTS can concisely express the complex psychology of the evaluator [18].
On the other hand, there are many ways to confirm the influencing factors and the weight of evaluation members in many research fields. Pang et al. [19] used the similarity measure method to calculate the distance between evaluation information and its center point, normalized it to obtain the weight of evaluation members, and constructed a nonlinear programming model to solve the weight of influencing factors according to the pairwise comparison matrix of influencing factors. Boral et al. [20] used the fuzzy analytic hierarchy process (FAHP) and modified fuzzy multi-attribute ideal real comparative analysis (modified FMAIRCA) to calculate the fuzzy relative importance among the influencing factors so as to obtain the weight of the influencing factors. Tian et al. [21] used fuzzy best-worst and relative entropy methods to calculate the weight of influencing factors and evaluation members. Firstly, the fuzzy best difference of the interval evaluation value of influencing factors was calculated to obtain the weight of influencing factors. Then, based on fuzzy proximity and fuzzy similarity entropy methods, the fuzzy distance between the evaluation method of each evaluation member and the central scheme was calculated to obtain the weight of FMEA team members. In addition, the entropy weight method [22], fuzzy metric [23], the multi-objective optimization model [24], and other methods can calculate the influencing factors and evaluate the weight of members. However, by observing these methods, it is found that it is quite common to find the evaluation information center point and calculate the distance between the evaluation information and the center point to obtain the weight information. Therefore, when choosing the weight solution method, it should be close to the mainstream idea and simple calculation process. The K-means clustering algorithm determines the center point of each clutter through calculation and calculates the distance between each evaluation information and the center point by using the weight. The calculation process is simple, and it can also avoid the situation that the evaluation result is not true due to the large gap in evaluation information [25]. Therefore, this paper is based on the K-means clustering algorithm and entropy weight method to solve the influencing factors and evaluate the weight of members.
The K-means clustering algorithm was first proposed in 1967 and has been widely studied and applied in different disciplines. It has the advantages of simplicity, high efficiency, and is suitable for dealing with large data sets. It is the most widely used and mature clustering analysis method so far [26]. It is widely used in data processing [27], image processing [28], market analysis [29], and many other research fields [30]. The K-average clustering algorithm is the core thought in the center of the data set to choose K-class data clustering and the clustering center according to the calculated attribute value, and the value of the minimum Euclidean distance principle can be divided into K classes. The average of each category data is calculated as a new clustering center for the next iteration until the clustering center is no longer changed. The value of each cluster center is redivided and updated successively until the optimal clustering result is obtained [31]. Clustering the evaluation information of failure modes can find the central point around the evaluation process of all evaluation members. Then, by calculating the distance between the evaluation information and the final center point, it is easy to obtain the weight of the influencing factors. Compared with other weight calculation methods, the K-means clustering algorithm is simpler, and the data needed for solving are all from the data collected, so the results are more reliable [32]. As mentioned above, the K-means clustering algorithm is an iterative clustering analysis algorithm. Compared with other weight-solving methods, it can not only calculate the weight based on current failure modes, but also predict the weight of influencing factors of future failure modes [33]. Since the DHHFLTS sets language granularity based on symmetric concepts, it may lead to a large gap in evaluation information among evaluators by using the DHHFLTS. Furthermore, the K-means clustering algorithm can reduce the gap between the evaluating variables.
The rest of this paper is organized as follows. In Section 2, we introduce the definition and calculation rules of the DHHFLTS. In Section 3, we introduce the calculation flow of the K-means clustering algorithm and the calculation idea of the entropy weight method combined with the cluster center to solve the influencing factors with the weight of the evaluators. In Section 4, we expound on the whole context of the new method. An example of an electromagnet is used to prove the objectivity and applicability of the method, and the final calculation results are analyzed in Section 5. In Section 6, we summarize the advantages of the proposed new method in the context of work and point out future research directions.
2. Double Hierarchy Hesitant Fuzzy Linguistic Term Set
According to classical theory, the DHHFLTS is composed of DHLTSs and HFLTSs. Therefore, it can not only express complex semantics like the DHLTS, but also express fuzzy and hesitant semantics like the HFLTSs [34]. In this part, we introduce the definition, form and calculation rules of the DHLTSs, HFLTSs and DHHFLTSs in turn.
2.1. Double Hierarchy Linguistic Term Set
As in our daily life, when we need to express the good or bad of a thing, we will use the needs of “good”, “bad”, and “general”. We assume that the existing linguistic term set (LTS) S is as follows, and the language granularity of LTS is symmetric and uniform.
However, when we want to express “a little good” or “excellent”, the LTS cannot accurately express such semantics. Therefore, some scholars have defined a DHLTS, and the specific expression form is as follows.
where and are the first and second LTS, respectively, and and is the subscript symmetry number of LTS.
For a DHLTS, you can express kinds of semantics, , . Let , . and a little good can be expressed as .
In order to ensure the logic of the evaluation language, the subscript symmetric number is specified as follows.
- (1).
- If , then .
- (2).
- If , then .
- (3).
- If , then .
- (4).
- If , then .
2.2. Hesitant Fuzzy Linguistic Terms Set
Torra proposed the concept of intuitionistic fuzzy sets in 2010 [35]. If is the universe, finite and non-empty, is said to be a hesitant fuzzy set on , where is a hesitant fuzzy element (HFE), consisting of some values in [0, 1] interval [36].
For example,, , then the hesitation fuzzy set (HFS) A can be expressed as . On this basis, some scholars put forward the concept of HFLTS by marking as a continuous and orderly language set [37]. Let be fixed and be LTS. So, HFLTS can be expressed as
where L is the number of linguistic terms in and in each is the continuous terms in [38], and indicates the possibility, belongs to and is called a hesitant fuzzy linguistic element (HFLE).
Moreover, the expression mechanism of the HFLE is closer to people’s logical thinking, and can clearly express fuzzy semantics. Generally, it participates in the confirmation of the final result in two ways: one is through direct participation in fuzzy language, and the other is through the transformation of fuzzy language into digital form [39]. In this paper, we convert the language set into numerical values to participate in the determination of the final results because this will make our final evaluation results more intuitive. The 2-tuple linguistic model and the linguistic alphabet are common methods to transform language sets [40,41]. In order to hesitate about the rationality of fuzzy language set transformation, Gou et al. developed the concept of equivalent function, and the specific calculation formula is as follows [42].
Let be LTS, be an HFLE with L is the number of linguistic terms in . Suppose is an HFE. If and of the linguistic term express the same meaning at symmetric language granularity, the mutual transformation functions between them are and . The specific expression is given as follows.
where is a linguistic term, and is the membership degree.
Based on Equations (4) and (5), the transformation functions between HFLTS and HFE are as follows.
where is LTS and is the set of all HFLEs.
The basic following functions and the operation formula of the HFLTS are as follows.
Let and are two HFLTSs.
- (1).
- ;
- (2).
- ;
- (3).
- ;
- (4).
- .
In the formula, represents a real number.
2.3. Double Hierarchy Hesitant Fuzzy Linguistic Term Set
On this basis, we propose the DHHFLTS, , . It also divides language granularity based on symmetric concepts, with L being the subscript symmetry number of LTS in , as shown in Figure 1.
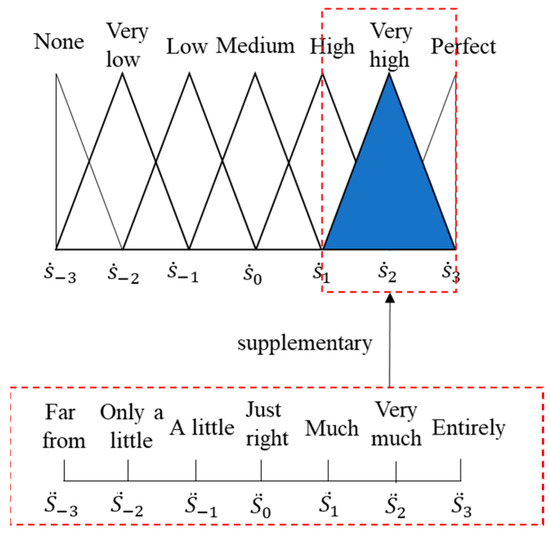
Figure 1.
The second hierarchy LTS subscript symmetry number of (very high).
In Figure 1, let , then the first hierarchy LTS is , the second hierarchy LTS is , and the second hierarchy LTS is a supplement to the first hierarchy LTS.
Next, based on the transformation functions and operation formula of the HFLTS, we formulate the transformation functions and operation formula of the DHHFLTS. Let is DHHFLTS, . Suppose is an HFE. If and of the linguistic term express the same meaning, the mutual transformation functions between them are and . The specific expression is as follows.
where and are the subscript numbers of the first hierarchy LTS and the second hierarchy LTS, respectively, and represents the rounding symbol.
Based on Equations (8) and (9), the transformation functions between DHHFLTS and HFE is as follows.
where and is LTS and is the set of all HFLEs.
The operation formula of the DHHFLTS is as follows. Let and are two DHHFLTSs, with .
where of calculation rule refers to the calculation of Equation (11), represents the weight in the actual calculation process of this paper, and are the HFLEs of the DHHFLTSs and , respectively.
3. Weight of Evaluation Members and Influencing Factors
3.1. Entropy Weight Method for Evaluating Personnel Weight
According to the definition of information entropy, the entropy value of an index can be determined by using the dispersion of the index. The smaller the information entropy value included, the greater the influence of the index on the comprehensive evaluation. If the values of an index are all equal, the index will not play a role in the comprehensive evaluation [43].
The idea of the entropy weight method is presented in this paper. There is a big difference between the evaluation results of evaluation members and those of other evaluation members when evaluating an influencing factor. According to the definition of information entropy, it can be determined that the evaluation dispersion of this evaluation member is large. Therefore, the greater the impact of evaluation members on the comprehensive evaluation, the greater the weight. Based on this idea, we obtain the formula for calculating the weight of evaluation members as follows.
In Equation (16), is the number of influencing factors,, is the number of failure modes, , and is the number of evaluation members, .
In Equation (17), L is the number of LTS.
3.2. Using K-Means Clustering Algorithm to Calculate the Weight of Influencing Factors
K-means clustering is a clustering algorithm based on sample set partition. K-means clustering divides the sample set into K subsets to form K classes. n samples are divided into K classes. The center distance from each sample to its class is the smallest. Each sample belongs to only one class [44].
Let is a given dataset containing D-dimensional data, where . The K-means clustering algorithm to the data object for the class K clusters, namely . For dividing cluster , the initial cluster center is . The Euclidean distance between data object and cluster center in space is calculated as follows:
where is number of clusters. Similarly, calculate the distance from the data point to the center point of each cluster. According to the principle of minimum distance, the center point of the cluster is obtained from the new cluster division. Assuming that the new cluster is , the calculation formula of the new cluster center is as follows.
where N is the number of new cluster data.
This process will be repeated until the termination conditions are met to obtain the final cluster . Assuming that the final cluster center point of cluster is , the formula for calculating the weight of influencing factors is as follows.
Firstly, the evaluation information of influencing factor of all evaluation members of failure mode in the cluster is normalized.
where is the weight of the evaluation member , is the evaluation of the evaluation member on the influence factor of the failure mode by the DHHFLTS, and is the number of failure modes, .
Then calculate the distance between the normalized evaluation information and the cluster center point .
Finally, calculate the ratio between the and . is the distance between the evaluation information of each influencing factor of the evaluator and the center point .
In Equation (23), is the distance from the evaluation data to the final cluster point of in each cluster. Similarly, where is the distance between the evaluator’s evaluation of occurrence and the center point .
Based on the idea of traditional FMEA to calculate the RPN value and sort it, we calculate the failure mode score value. The calculation formula is as follows.
where is the failure mode.
4. The Proposed FMEA Model
In the previous section, we described the definitions and calculation formulas of the DHHFLTS and the K-means clustering algorithm. This section mainly introduces the calculation steps of the new method proposed in this paper.
Step 1: Preparation in advance
Firstly, we collect failure modes and establish an evaluation team and determine the evaluation language set. Then, the evaluator uses the DHHFLTS to evaluate the failure mode.
Step 2: Solving the weight of evaluation members
The DHHFLTS given by evaluation members is standardized, and its information entropy is calculated. The entropy weight method is used to calculate the weight of evaluation personnel.
Step 3: Using the K-means clustering algorithm by finding the center of evaluation information.
Step 3.1: The aggregated evaluation information is taken as the sample of the K-means clustering algorithm, and the K initial center values are randomly selected.
Step 3.2: We initialize the algorithm by using random K initial center values, and calculate the distance between each failure mode evaluation information and the initial center point.
Step 3.3: The failure mode with the shortest distance from the initial center point is selected to be classified into one category. The average value of evaluation information in each category is calculated, and the center point is updated.
Step 3.4: We judge whether the center point changes. If it changes, return to Step 3.2. If it does not change, output the final center point.
Step 4: Calculating the weight of influencing factors
We calculate the distance between the failure mode assessment information and the final center point, and normalize to obtain the weight of the influencing factors. If the weight calculation of influencing factors does not reach the consensus of evaluation members, return to Step 2.
Step 5: Obtaining the evaluation results
The evaluation information of the failure mode is aggregated, the evaluation information of the failure mode is accumulated, and the risk is sorted.
The detailed calculation process is shown in Figure 2.
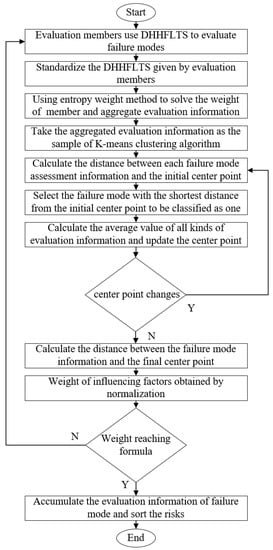
Figure 2.
FMEA model based on DHHFLTS and K-means clustering algorithm.
5. A Case Study
This section is divided into two: Section 5.1 shows that an electronic technology company used the new method to analyze the design process of an electromagnet product. The results calculated by this method and compared with other methods are analyzed in Section 5.2.
5.1. A Case Analysis
An electronic technology company plans to produce a batch of electromagnet products for blood collection equipment. The design diagram of the product is shown in Figure 3. The design scheme of the product is analyzed from three aspects: structure, function, and failure. Nine failure modes are sorted out based on the consensus points of the three aspects, FM1–FM9, as shown in Table 1. The company selects three engineers from R&D, production, sales, and three parts to form an evaluation team, which is recorded as TM1–TM3, and analyzes nine failure modes.
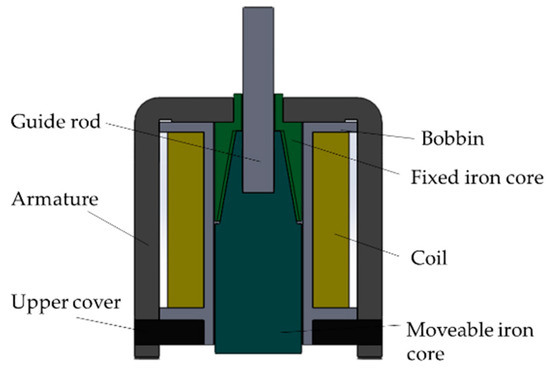
Figure 3.
Structure diagram of pilot-type electromagnet.

Table 1.
Failure Mode Summary.
The first step is to determine the evaluation DLS, making , so the set of double hesitation fuzzy languages is , . The assessment members use DHHFLTS to assess the failure mode according to the assessment criteria. The results are shown in Table 2. The first hierarchy LTS determines the evaluation range, while the second hierarchy LTS is a supplement to the first hierarchy LTS, that is, a fine delimitation of the large range of the first-level language. Therefore, the first hierarchy LTS is more important than the second hierarchy LTS in the evaluation process, so the evaluation criteria given in this paper are based on the first hierarchy LTS. The evaluation criteria of severity S, occurrence O, and detection D are shown in Table 3, Table 4 and Table 5.

Table 2.
DHHFLTS to evaluate the failure mode.

Table 3.
Severity assessment criteria.

Table 4.
Occurrence assessment criteria.

Table 5.
Detection assessment criteria.
Table 2 is transformed into a membership degree through Equations (8) and (10). For example, =. Similarly, all DHHFLTSs in Table 2 are calculated, as shown in Table 6.

Table 6.
Membership to evaluate the failure mode.
According to the calculation Equations (12)–(17), the weights of three evaluation members are , , and . Table 3 is aggregated based on the weight of evaluation members. For example, the aggregation of influencing factors S of failure mode F1 is . The aggregated data are normalized to obtain the input samples of K-means clustering, as shown in Table 7.

Table 7.
Clustering initial sample data.
We classify data into two categories: one is high-risk failure mode, and the other is low-risk failure mode. According to Equations (18) and (19), after 5 times, two types of final cluster centers are obtained, namely high-risk cluster center and low-risk cluster center , as shown in Figure 4.
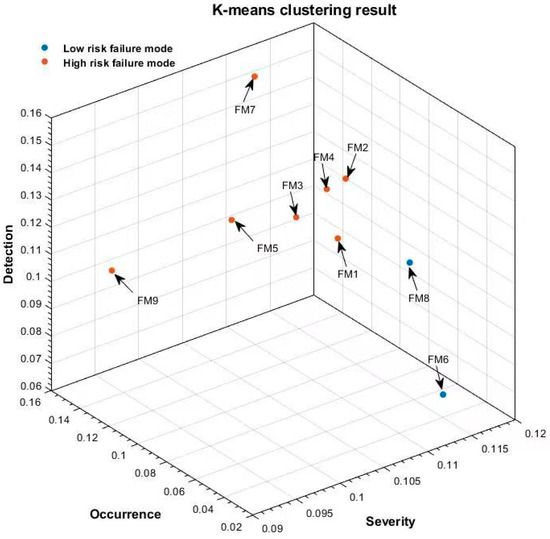
Figure 4.
Clustering result graph.
According to Equations (20)–(23), the weight of the influencing factors is . Then, the score of FM1 is . Similarly, we calculate the scores of other failure modes, as shown in Table 8.

Table 8.
Failure mode score.
According to the analysis results, the top three failure modes of risk ranking are optimized. In order to eliminate the harm caused by insufficient retention force, we use a tensile machine to spot check the retention force of finished products in the laboratory to ensure that the retention force of each outgoing product meets the requirements. Firstly, we use the upper and lower collect to fix the test parts, use the console to control the hydraulic stay rod to squeeze the test sample, and read the retention force of the parts on the monitor. The product test diagram is shown in Figure 5.
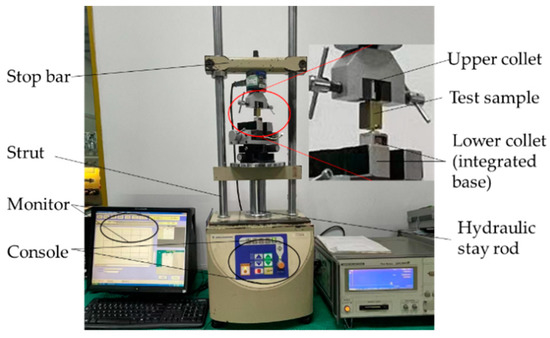
Figure 5.
Tensile machine test diagram.
In order to eliminate residual magnetism, we use the heating method, which is to heat the parts to a certain temperature and keep them warm for a certain time to realize demagnetization. In order to improve the processing accuracy of products, we use a CMM to measure the surface roughness of the product. Firstly, we use the thermostat to heat and insulate the product. The specific steps are to put the product into the storage box, switch on the power, adjust the temperature to 600°, and heat it for one hour. After heating, keep the temperature for one hour and take out the product. Then, we send the product to the CMM to start the roughness test. Next, we fix the product on the support plate, operate the test probe, evenly select five points on the measuring surface for testing, and monitor the product surface roughness in real time to facilitate product screening. The test platform is shown in Figure 6.
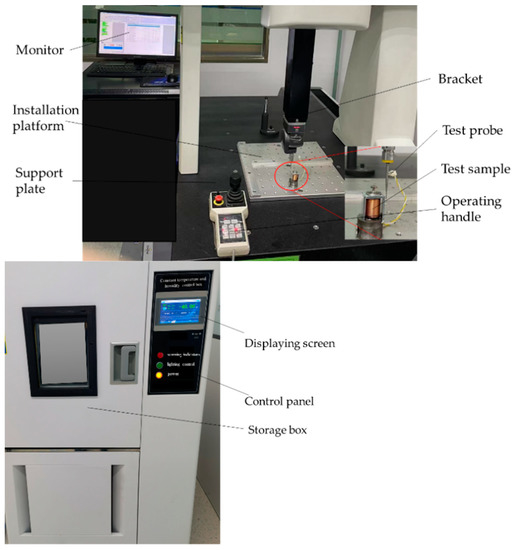
Figure 6.
Comprehensive test platform: CMM (top); thermostat (bottom).
Through the analysis results of the newly proposed method, we formulate optimization measures for high-risk failure modes in advance to minimize the possibility of failure in the enterprise product design and production stage.
5.2. Comparative Analysis and Discussion
In order to show the advantages of the proposed method, FMEA is proposed for comparative analysis. For these nine failure modes, we use the calculation results of three methods for comparison. The first is the new method proposed in this paper, the second is the method used in Reference [19], and the last is traditional FMEA. They are, respectively, recorded as Sort 1, Sort 2, and Sort 3, as shown in Figure 7.
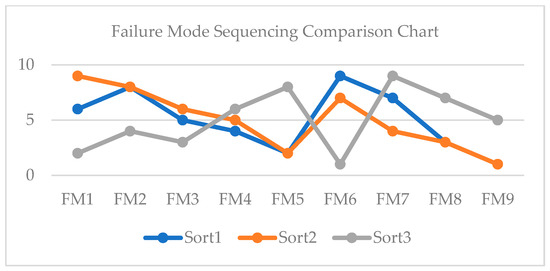
Figure 7.
Sorting comparison chart.
Based on Figure 7, we analyze Sorting 1 and Sorting 2. These two methods have the same sorting for the four failure modes 9, 5, 8, and 2. Failure Modes 9, 5, and 8 are high-risk failure modes. This proves that these two methods can analyze the failure modes that need to be prevented most. As for the ranking of the later failure modes, the reason is that the weights of the influencing factors calculated by the two methods are different [19] by comparing the matrix of influencing factors in pairs. In this case, we compared the new proposed method.
The results of traditional FMEA calculation are quite different whether compared with the results of the new method or the results of the literature. This is mainly because when traditional FMEA calculates the RPN, the default influencing factors and the weight of evaluation members are equally divided. In the actual evaluation process, the weight of severity S is far greater than that of occurrence O and detection D. For example, the calculation result of the influence factor weight of the newly proposed method is , and the calculation result of the influence factor weight is . Therefore, there is a big difference between the calculation results of traditional FMEA and those of the other two methods.
6. Conclusions
In order to reflect the evaluation psychology of evaluation members, the symmetrical concepts of the DHHFLTS are used to construct evaluation language sets. Based on the idea of the entropy weight method and the K-means clustering algorithm, this paper also solves the influencing factors and weights of evaluation members. We know that the entropy weight method and the K-means clustering algorithm are the most commonly used methods to solve weights. The high-frequency utilization rate proves the practicability of these two methods. In addition, the calculation process of these two methods is relatively simple, which is more suitable for promotion in electronic enterprises.
In addition, this paper borrows the idea of traditional FMEA to sort the failure modes by calculating the RPN, and then comprehensively calculates the risk ranking of failure modes based on the influencing factors and evaluation member weights. This does not only lose objectivity, but can also avoid the disadvantage of inaccurate risk ranking of failure models due to repeated calculation results to the greatest extent. This paper evaluates a single value based on the evaluation of double-level hesitant fuzzy sets, and whether it can be evaluated by two values in the future. If such an evaluation form is adopted, its corresponding calculation rules, and the calculation formulas of other related methods need to be innovated. Breakthroughs can be found in all these aspects in the future.
In the future, we will further optimize the application using the model revision technology to the new method. The next step in our research is to focus on the computing platform software system of data process and complex computation by using familiar tools. Moreover, the approved method is extended to other electronic products to increase research and application in this area, and further research of the DHHFLTS and the K-means clustering algorithm will have great theoretical value and practical significance.
Author Contributions
Data curation, J.D.; Funding acquisition, J.P.; Methodology, J.D. and Q.L.; Project administration, J.P.; Resources, Q.H.; Software, Q.L.; Supervision, J.P.; Validation, Q.L.; Visualization, Q.H.; Writing—original draft, J.D.; Writing—review and editing, J.P. All authors have read and agreed to the published version of the manuscript.
Funding
This work was supported by the National Natural Science Foundation of China (Nos. 72271167, 72071149).
Institutional Review Board Statement
Not applicable.
Informed Consent Statement
Not applicable.
Data Availability Statement
Not applicable.
Conflicts of Interest
The authors declare no conflict of interest.
References
- Zhang, L.; Xu, A.; An, L.; Li, M. Bayesian inference of system reliability for multicomponent stress-strength model under Marshall-Olkin Weibull distribution. Systems 2022, 10, 196. [Google Scholar] [CrossRef]
- Chen, P.; Ye, Z.S. Estimation of field reliability based on aggregate lifetime data. Technometrics. 2017, 59, 115–125. [Google Scholar] [CrossRef]
- Duan, C.Y.; Chen, X.Q.; Shi, H. A new model for failure mode and effects analysis based on k-means clustering within hesitant linguistic environment. IEEE Trans. Eng. Manag. 2019, 69, 1837–1847. [Google Scholar] [CrossRef]
- Boran, S.; Gökler S, H. A novel FMEA model using hybrid ANFIS–Taguchi method. Arab. J. Sci. Eng. 2020, 45, 2131–2144. [Google Scholar] [CrossRef]
- Cabanes, B.; Hubac, S.; Le Masson, P. Improving reliability engineering in product development based on design theory: The case of FMEA in the semiconductor industry. Res. Eng. Des. 2021, 32, 309–329. [Google Scholar] [CrossRef]
- Tang, M.; Liao, H. Failure mode and effect analysis considering the fairness-oriented consensus of a large group with core-periphery structure. Reliab. Eng. Syst. Saf. 2021, 215, 107821–107833. [Google Scholar] [CrossRef]
- Xu, A.; Zhou, S.; Tang, Y. A unified model for system reliability evaluation under dynamic operating conditions. IEEE Trans. Reliab. 2021, 70, 65–72. [Google Scholar] [CrossRef]
- Chang, K.H.; Cheng, C.H.; Chang, Y.C. Reprioritization of failures in a silane supply system using an intuitionistic fuzzy set ranking technique. Soft Comput. 2010, 14, 285–298. [Google Scholar] [CrossRef]
- Huang, W.; Li, Y.; Kou, X. Using a FMEA–TIFIAD approach to identify the risk of railway dangerous goods transportation system. Group Decis. Negot. 2021, 30, 63–95. [Google Scholar] [CrossRef]
- Yuan, Y.; Tang, Y. Fusion of expert uncertain assessment in FMEA based on the negation of basic probability assignment and evidence distance. Sci. Rep. 2022, 12, 8424. [Google Scholar] [CrossRef]
- Zhang, G.; Wang, J.Q.; Wang, T.L. Multi-criteria group decision-making method based on TODIM with probabilistic interval-valued hesitant fuzzy information. Expert Syst. 2019, 36, 12424. [Google Scholar] [CrossRef]
- Liu, H.C.; You, J.X.; Li, P. Failure mode and effect analysis under uncertainty: An integrated multiple criteria decision making approach. IEEE Trans. Reliab. 2016, 65, 1380–1392. [Google Scholar] [CrossRef]
- Yazdani, M.; Mohammed, A.; Bai, C. A novel hesitant-fuzzy-based group decision approach for outsourcing risk. Expert Syst. Appl. 2021, 184, 115517–115530. [Google Scholar] [CrossRef]
- Das, S.; Garg, A.; Khorania, Y. Dual hesitant Z-number (DHZN), correlated distance, and risk quantification. Int. J. Intell. Syst. 2022, 37, 625–660. [Google Scholar] [CrossRef]
- Li, X.; Xu, Z.; Wang, H. Three-way decisions based on some hamacher aggregation operators under double hierarchy linguistic. Environ. Int. J. Intell. Syst. 2021, 36, 7731–7753. [Google Scholar] [CrossRef]
- Luo, C.; Shen, L.; Xu, A. Modelling and estimation of system reliability under dynamic operating environments and lifetime ordering constraints. Reliab. Eng. Syst. Saf. 2022, 218, 108136. [Google Scholar] [CrossRef]
- Qin, J.; Xi, Y.; Pedrycz, W. Failure mode and effects analysis (FMEA) for risk assessment based on interval type-2 fuzzy evidential reasoning method. Appl. Soft Comput. 2020, 89, 106134–106148. [Google Scholar] [CrossRef]
- Gou, X.; Liao, H.; Xu, Z. Double hierarchy hesitant fuzzy linguistic term set and MULTIMOORA method: A case of study to evaluate the implementation status of haze controlling measures. Inf. Fusion 2017, 38, 22–34. [Google Scholar] [CrossRef]
- Pang, J.; Dai, J.; Qi, F. A potential failure mode and effect analysis method of electromagnet based on intuitionistic fuzzy number in manufacturing systems. Math. Probl. Eng. 2021, 2021, 1–12. [Google Scholar] [CrossRef]
- Boral, S.; Howard, I.; Chaturvedi, S.K. An integrated approach for fuzzy failure modes and effects analysis using fuzzy AHP and fuzzy MAIRCA. Eng. Fail. Anal. 2020, 108, 104195–104211. [Google Scholar] [CrossRef]
- Tian, Z.P.; Wang, J.Q.; Zhang, H.Y. An integrated approach for failure mode and effects analysis based on fuzzy best-worst, relative entropy, and VIKOR methods. Appl. Soft Comput. 2018, 72, 636–646. [Google Scholar] [CrossRef]
- Song, W.; Ming, X.; Wu, Z. Failure modes and effects analysis using integrated weight-based fuzzy TOPSIS. Int. J. Comput. Integr. Manuf. 2013, 26, 1172–1186. [Google Scholar] [CrossRef]
- Zhou, X.; Tang, Y. Modeling and fusing the uncertainty of FMEA experts using an entropy-like measure with an application in fault evaluation of aircraft turbine rotor blades. Entropy 2018, 20, 864. [Google Scholar] [CrossRef] [PubMed]
- Lin, Y.H.; Li, Y.F.; Zio, E. A framework for modeling and optimizing maintenance in systems considering epistemic uncertainty and degradation dependence based on PDMPs. IEEE Trans. Ind. Inform. 2017, 14, 210–220. [Google Scholar] [CrossRef]
- Zhuang, L.; Xu, A.; Wang, B.; Xue, Y.; Zhang, S. Data analysis of progressive-stress accelerated life tests with group effects. Qual. Technol. Quant. Manag. 2022; in press. [Google Scholar] [CrossRef]
- Fränti, P.; Sieranoja, S. K-means properties on six clustering benchmark datasets. Appl. Intell. 2018, 48, 4743–4759. [Google Scholar] [CrossRef]
- Hossain, M.Z.; Akhtar, M.N.; Ahmad, R.B. A dynamic K-means clustering for data mining. Indones. J. Electr. Eng. Comput. Sci. 2019, 13, 521–526. [Google Scholar] [CrossRef]
- Maiti, A.; Choudhary, A.; Chakravarty, D. A k-means clustering–based approach for 3D mapping and characterization of rock faces using digital images. Arab. J. Geosci. 2021, 14, 1–16. [Google Scholar] [CrossRef]
- Capo, M.; Perez, A.; Lozano, J. An efficient Split-Merge re-start for the K-means algorithm. IEEE Trans. Knowl. Data Eng. 2022, 34, 1618–1627. [Google Scholar] [CrossRef]
- Abo-Elnaga, Y.; Nasr, S. K-means cluster interactive algorithm-based evolutionary approach for solving bilevel multi-objective programming problems. Alex. Eng. J. 2022, 61, 811–827. [Google Scholar] [CrossRef]
- Abdullah, D.; Susilo, S.; Ahmar, A.S. The application of K-means clustering for province clustering in Indonesia of the risk of the COVID-19 pandemic based on COVID-19 data. Qual. Quant. 2022, 56, 1283–1291. [Google Scholar] [CrossRef] [PubMed]
- Zhang, S.; Li, S.; Hu, J. An iterative algorithm for optimal variable weighting in K-means clustering. Commun. Stat. 2019, 48, 1346–1365. [Google Scholar] [CrossRef]
- Hu, J.W.; Chen, P. Predictive maintenance of systems subject to hard failure based on proportional hazards model. Reliab. Eng. Syst. Saf. 2020, 196, 106707–106730. [Google Scholar] [CrossRef]
- Krishankumar, R.; Subrajaa, L.S.; Ravichandran, K.S.; Kar, S.; Saeid, A.B. A framework for multi-attribute group decision-making using double hierarchy hesitant fuzzy linguistic term set. Int. J. Fuzzy Syst, 2019; 21, 1130–1143. [Google Scholar]
- Torra, V. Hesitant fuzzy sets. Int. J. Intell. Syst. 2010, 25, 529–539. [Google Scholar] [CrossRef]
- Farzamnia, E.; Babolghani, M.B. Group decision-making process for supplier selection using MULTIMOORA technique under fuzzy environment. Kuwait Chapter Arab. J. Bus. Manag. Rev. 2014, 33, 1–16. [Google Scholar] [CrossRef][Green Version]
- Liao, H.; Xu, Z.; Zeng, X.J. Qualitative decision making with correlation coefficients of hesitant fuzzy linguistic term sets. Knowl.-Based Syst. 2015, 76, 127–138. [Google Scholar] [CrossRef]
- Rodriguez, R.M.; Martinez, L.; Herrera, F. Hesitant fuzzy linguistic term sets for decision making. IEEE Trans. Fuzzy Syst. 2011, 20, 109–119. [Google Scholar] [CrossRef]
- Rajati, M.R.; Mendel, J.M. Novel weighted averages versus normalized sums in computing with words. Inf. Sci. 2013, 235, 130–149. [Google Scholar] [CrossRef]
- Herrera, F.; Martínez, L. A 2-tuple fuzzy linguistic representation model for computing with words. IEEE Trans. Fuzzy Syst. 2000, 8, 746–752. [Google Scholar]
- Xu, Z.; Wang, H. On the syntax and semantics of virtual linguistic terms for information fusion in decision making. Inf. Fusion 2017, 34, 43–48. [Google Scholar] [CrossRef]
- Gou, X.; Xu, Z.; Liao, H. Multiple criteria decision making based on Bonferroni means with hesitant fuzzy linguistic information. Soft Comput. 2017, 21, 6515–6529. [Google Scholar] [CrossRef]
- Xu, T.; Zhang, H.; Li, B. Pythagorean fuzzy entropy and its application in multiple-criteria decision-making. Int. J. Fuzzy Syst. 2020, 22, 1552–1564. [Google Scholar] [CrossRef]
- Xia, S.; Peng, D.; Meng, D.; Zhang, C.; Wang, G.; Giem, E.; Wei, W.; Chen, Z. Ball k-means: Fast adaptive clustering with no bounds. IEEE Trans. Pattern Anal. Mach. Intell. 2022, 44, 87–99. [Google Scholar] [PubMed]
Publisher’s Note: MDPI stays neutral with regard to jurisdictional claims in published maps and institutional affiliations. |
© 2022 by the authors. Licensee MDPI, Basel, Switzerland. This article is an open access article distributed under the terms and conditions of the Creative Commons Attribution (CC BY) license (https://creativecommons.org/licenses/by/4.0/).