
On the Development of Triple Homogeneously Weighted Moving Average Control Chart


Abstract
1. Introduction
2. Design Structure of the HWMA and the Proposed Triple HWMA Schemes
2.1. Design of HWMA Scheme
2.2. Design of DHWMA Scheme
2.3. Design of the Proposed THWMA Scheme
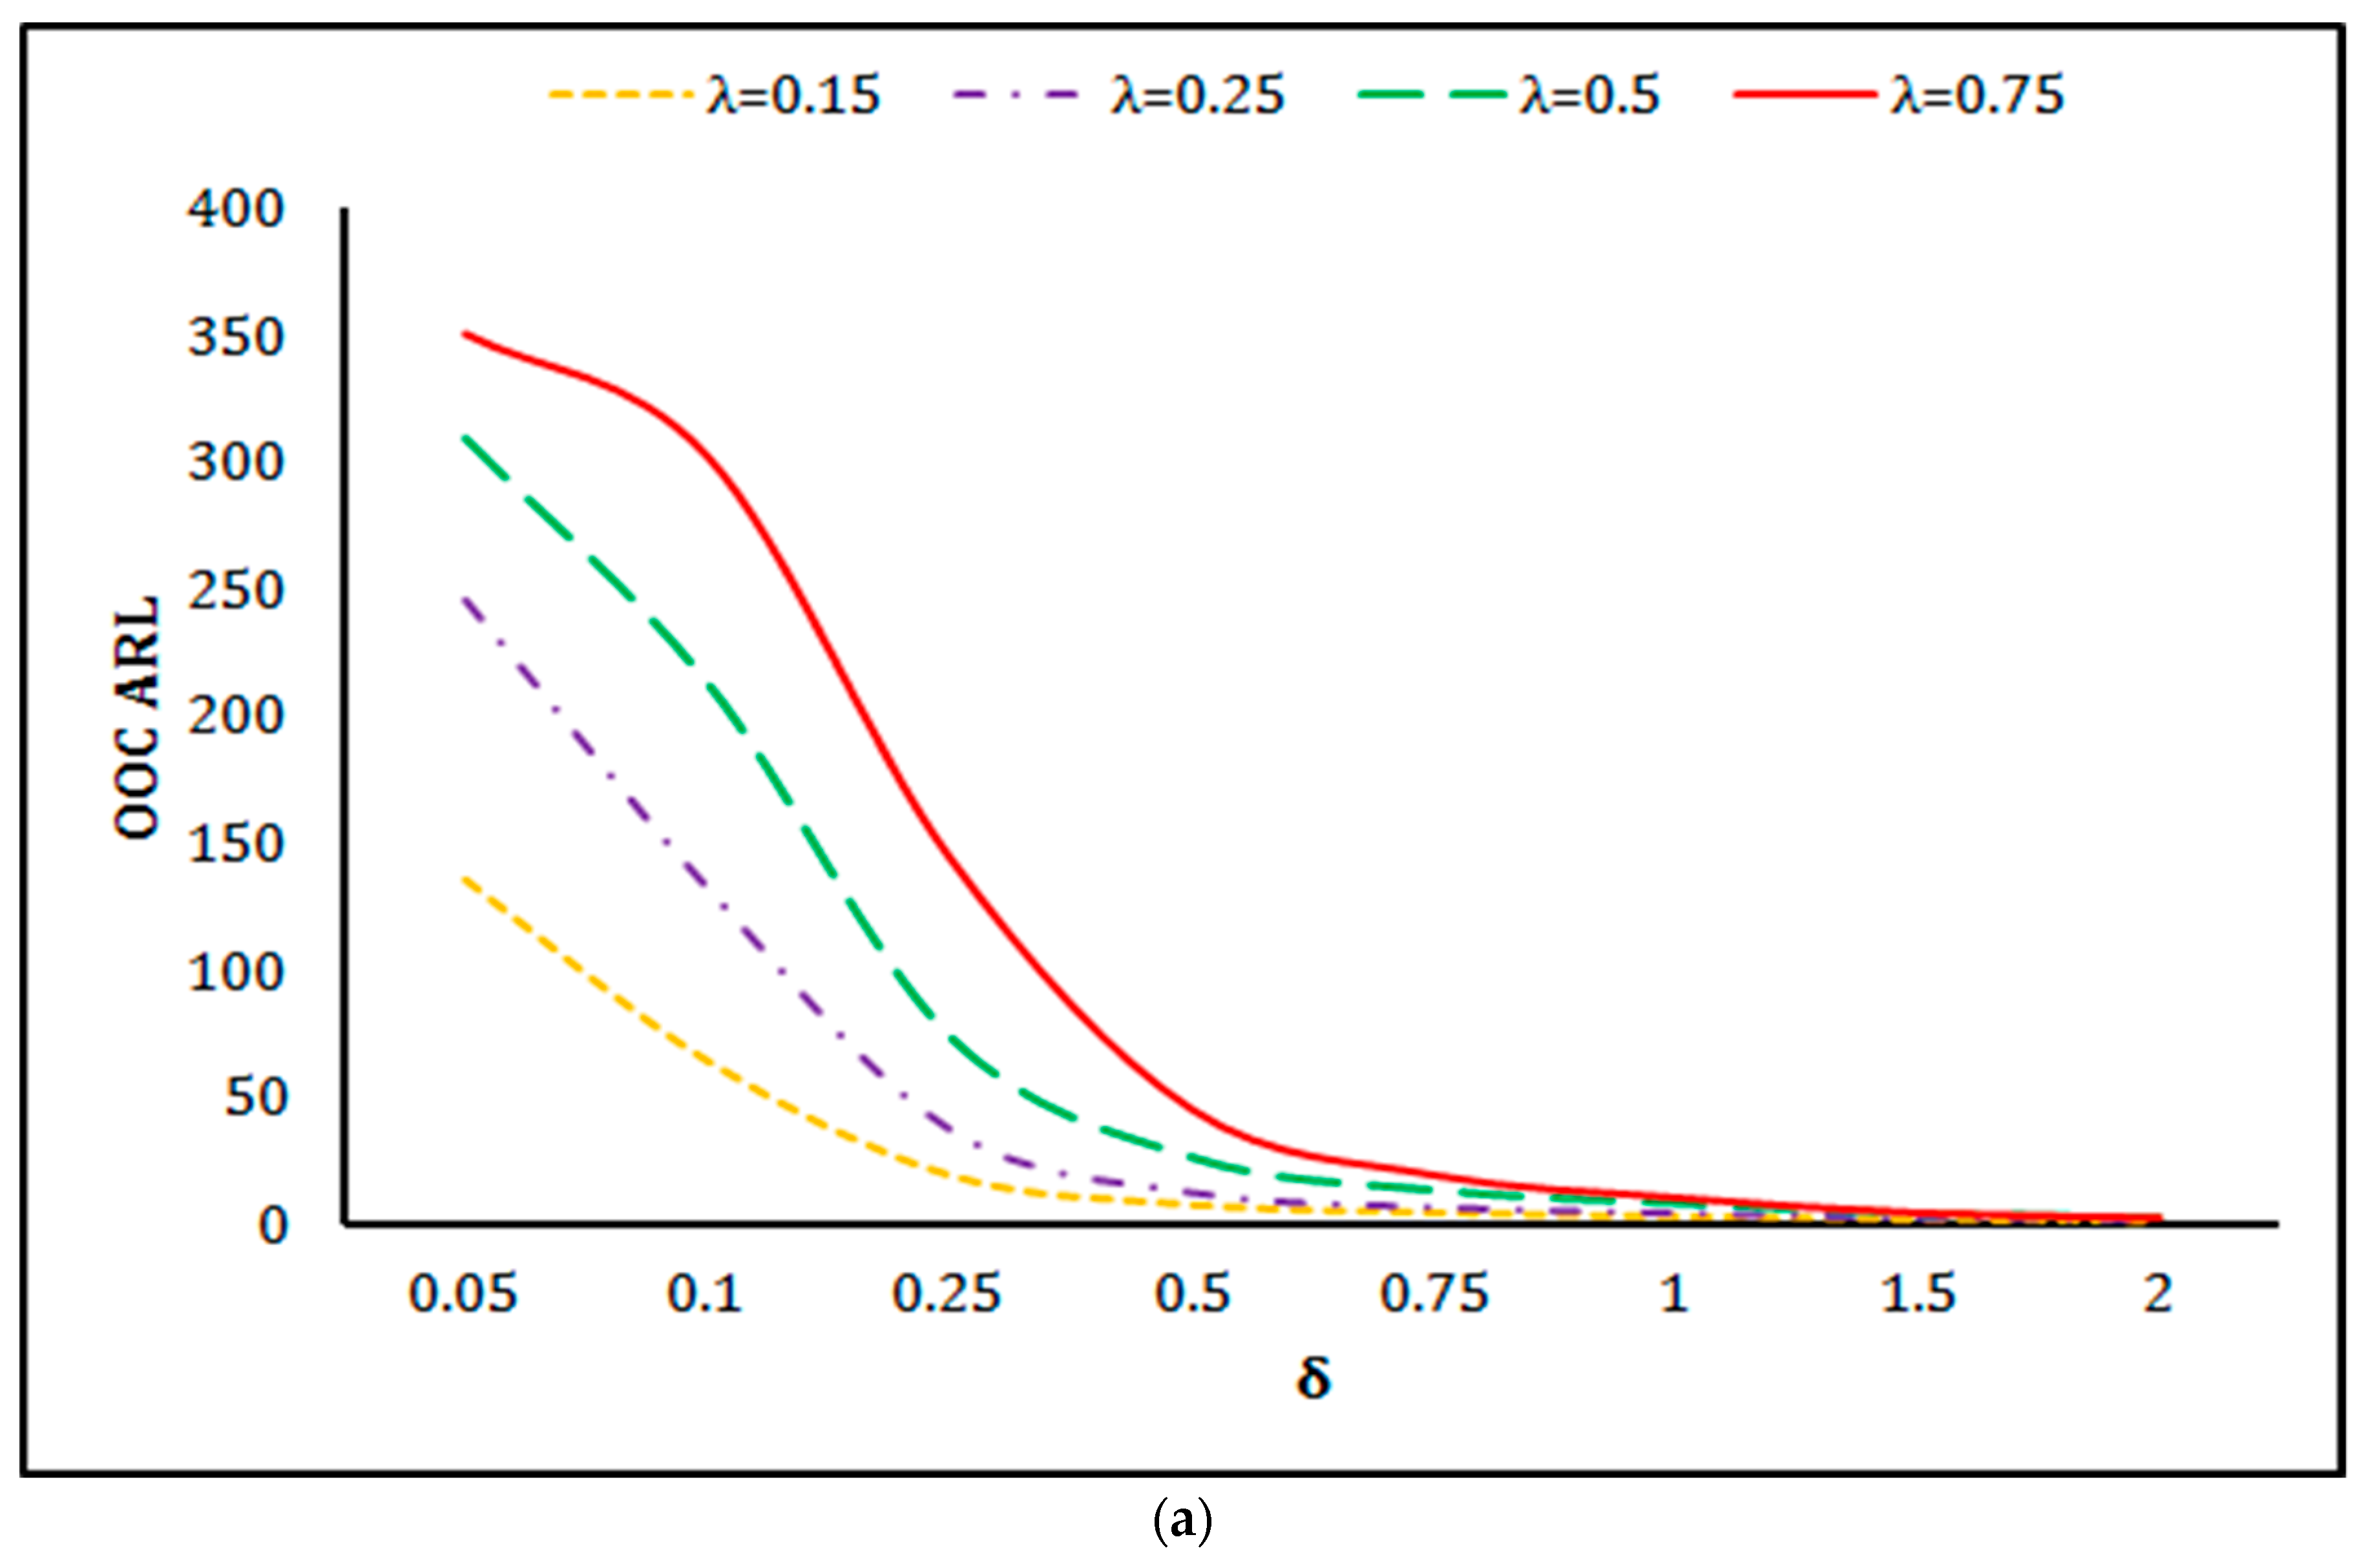
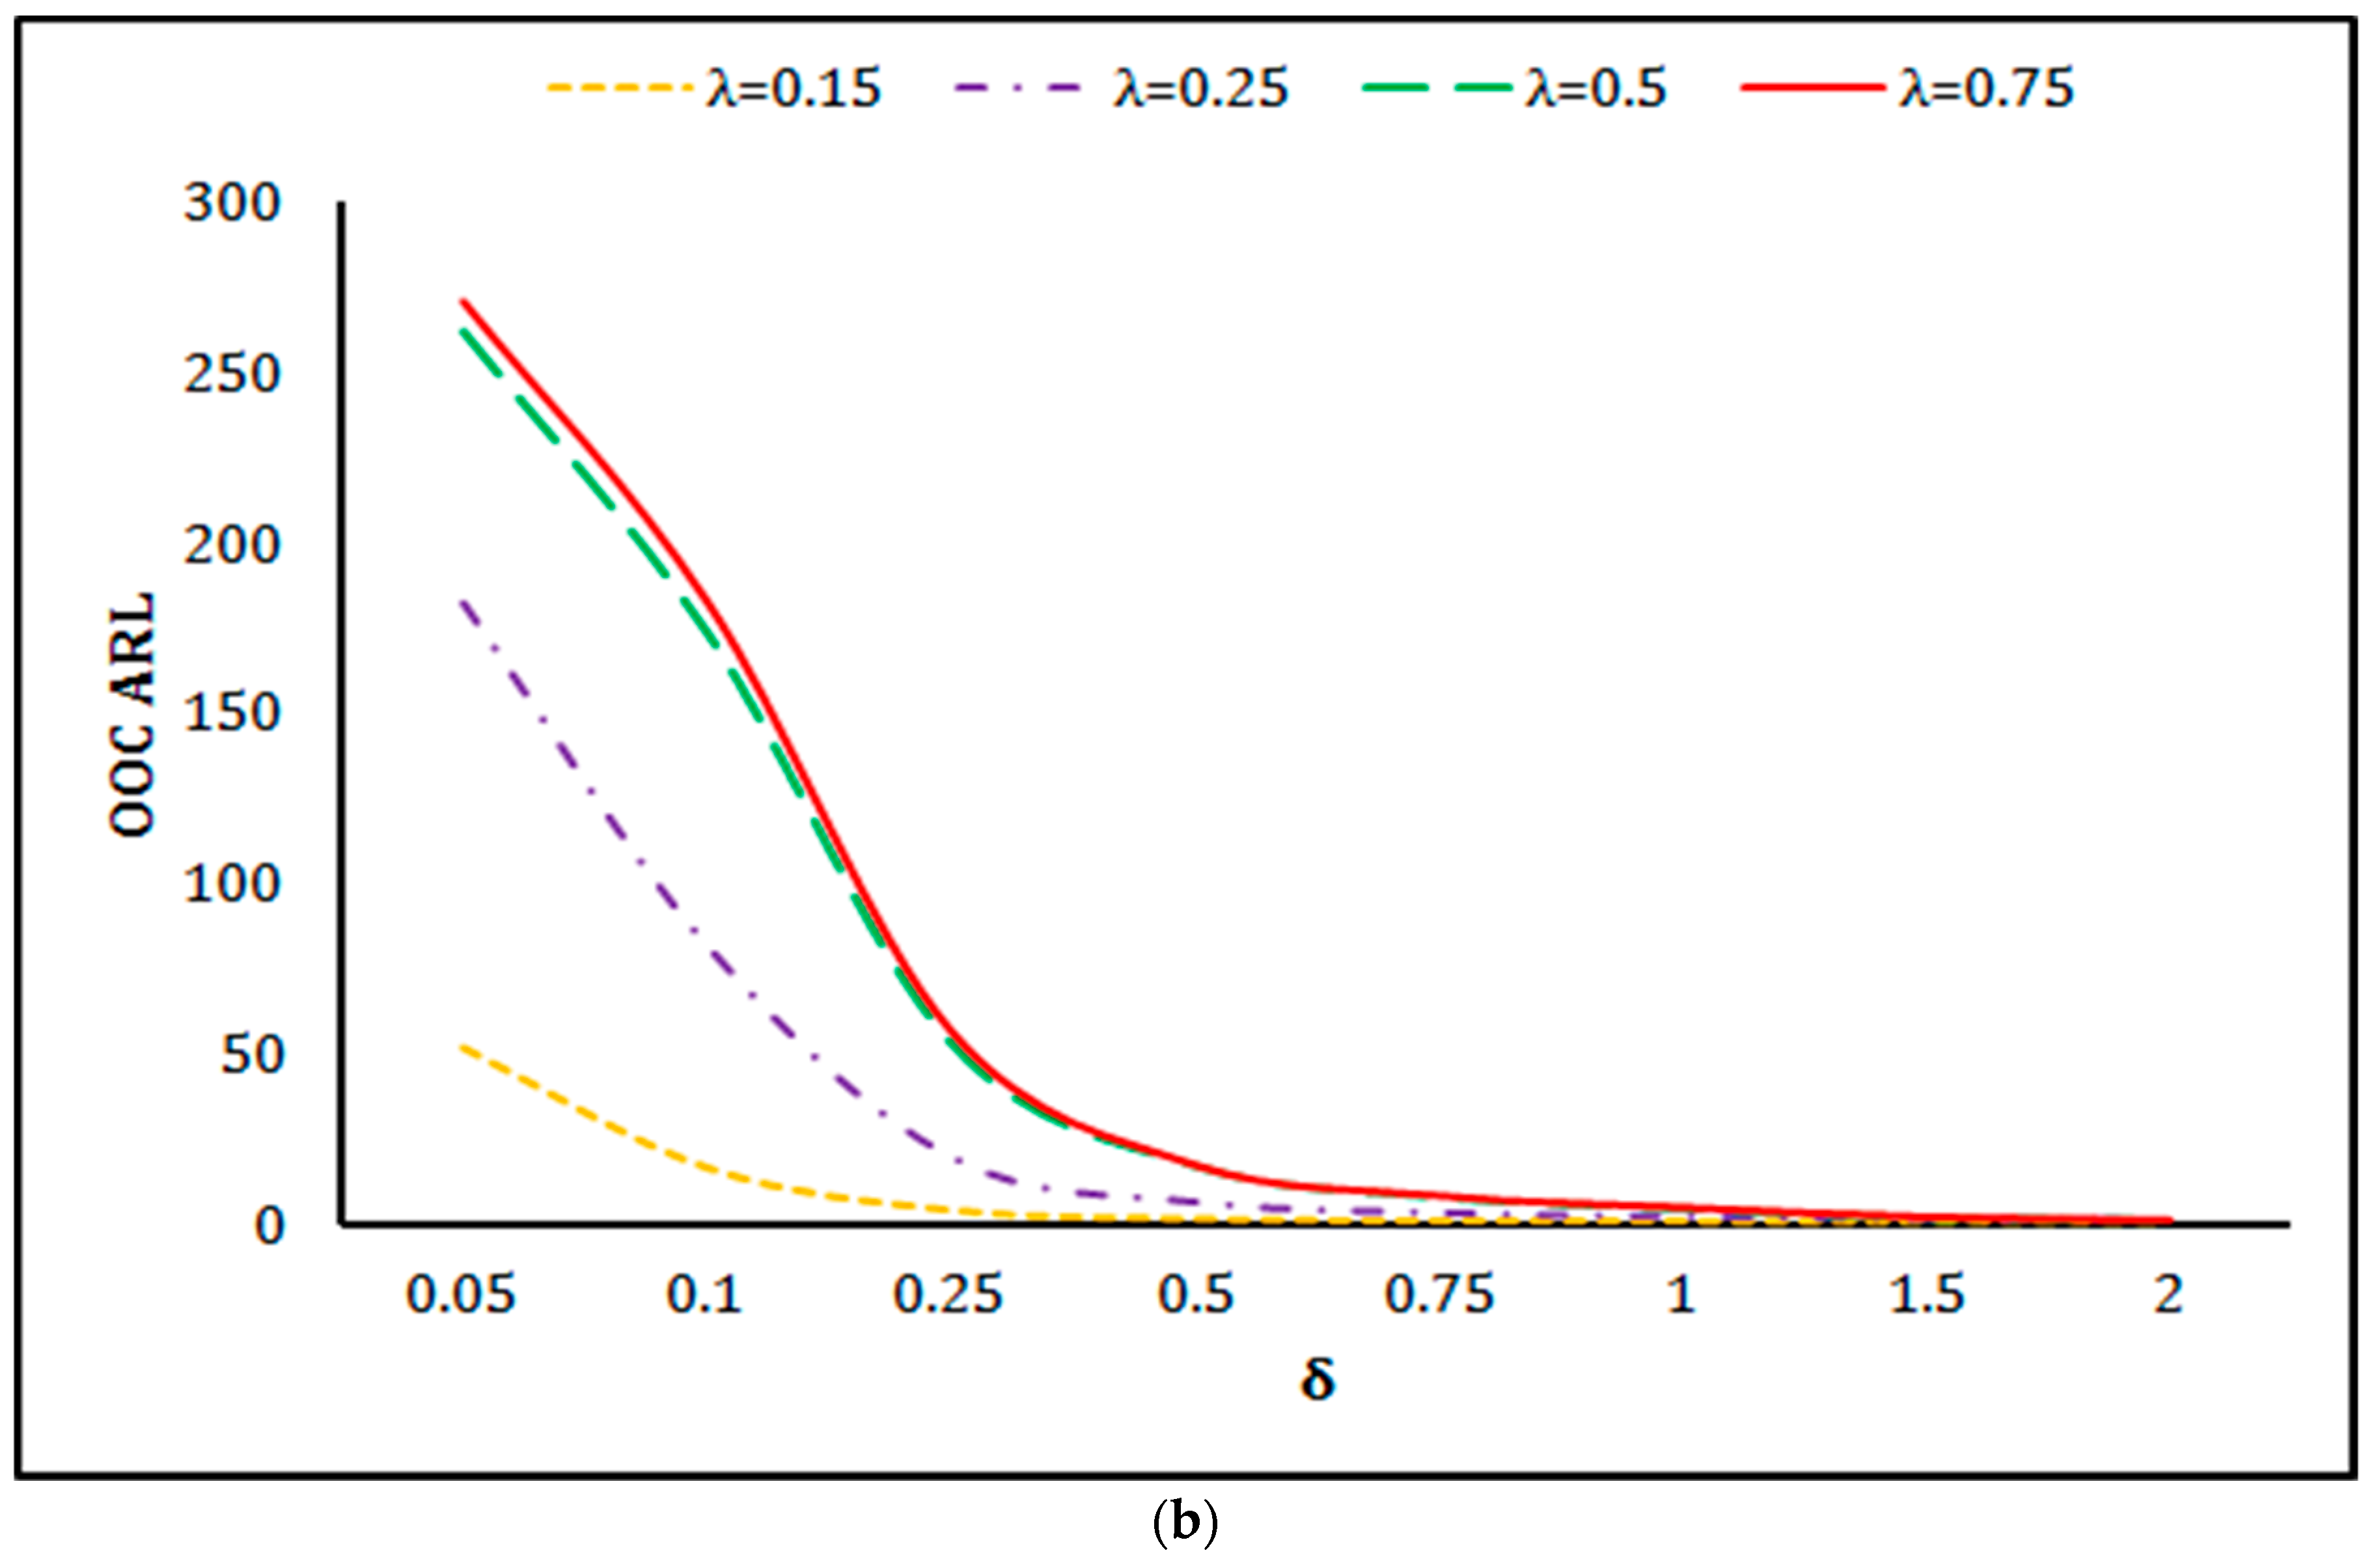
3. Evaluation of Proposed THWMA Chart
3.1. Robustness of the Proposed THWMA Scheme against Non-Normality
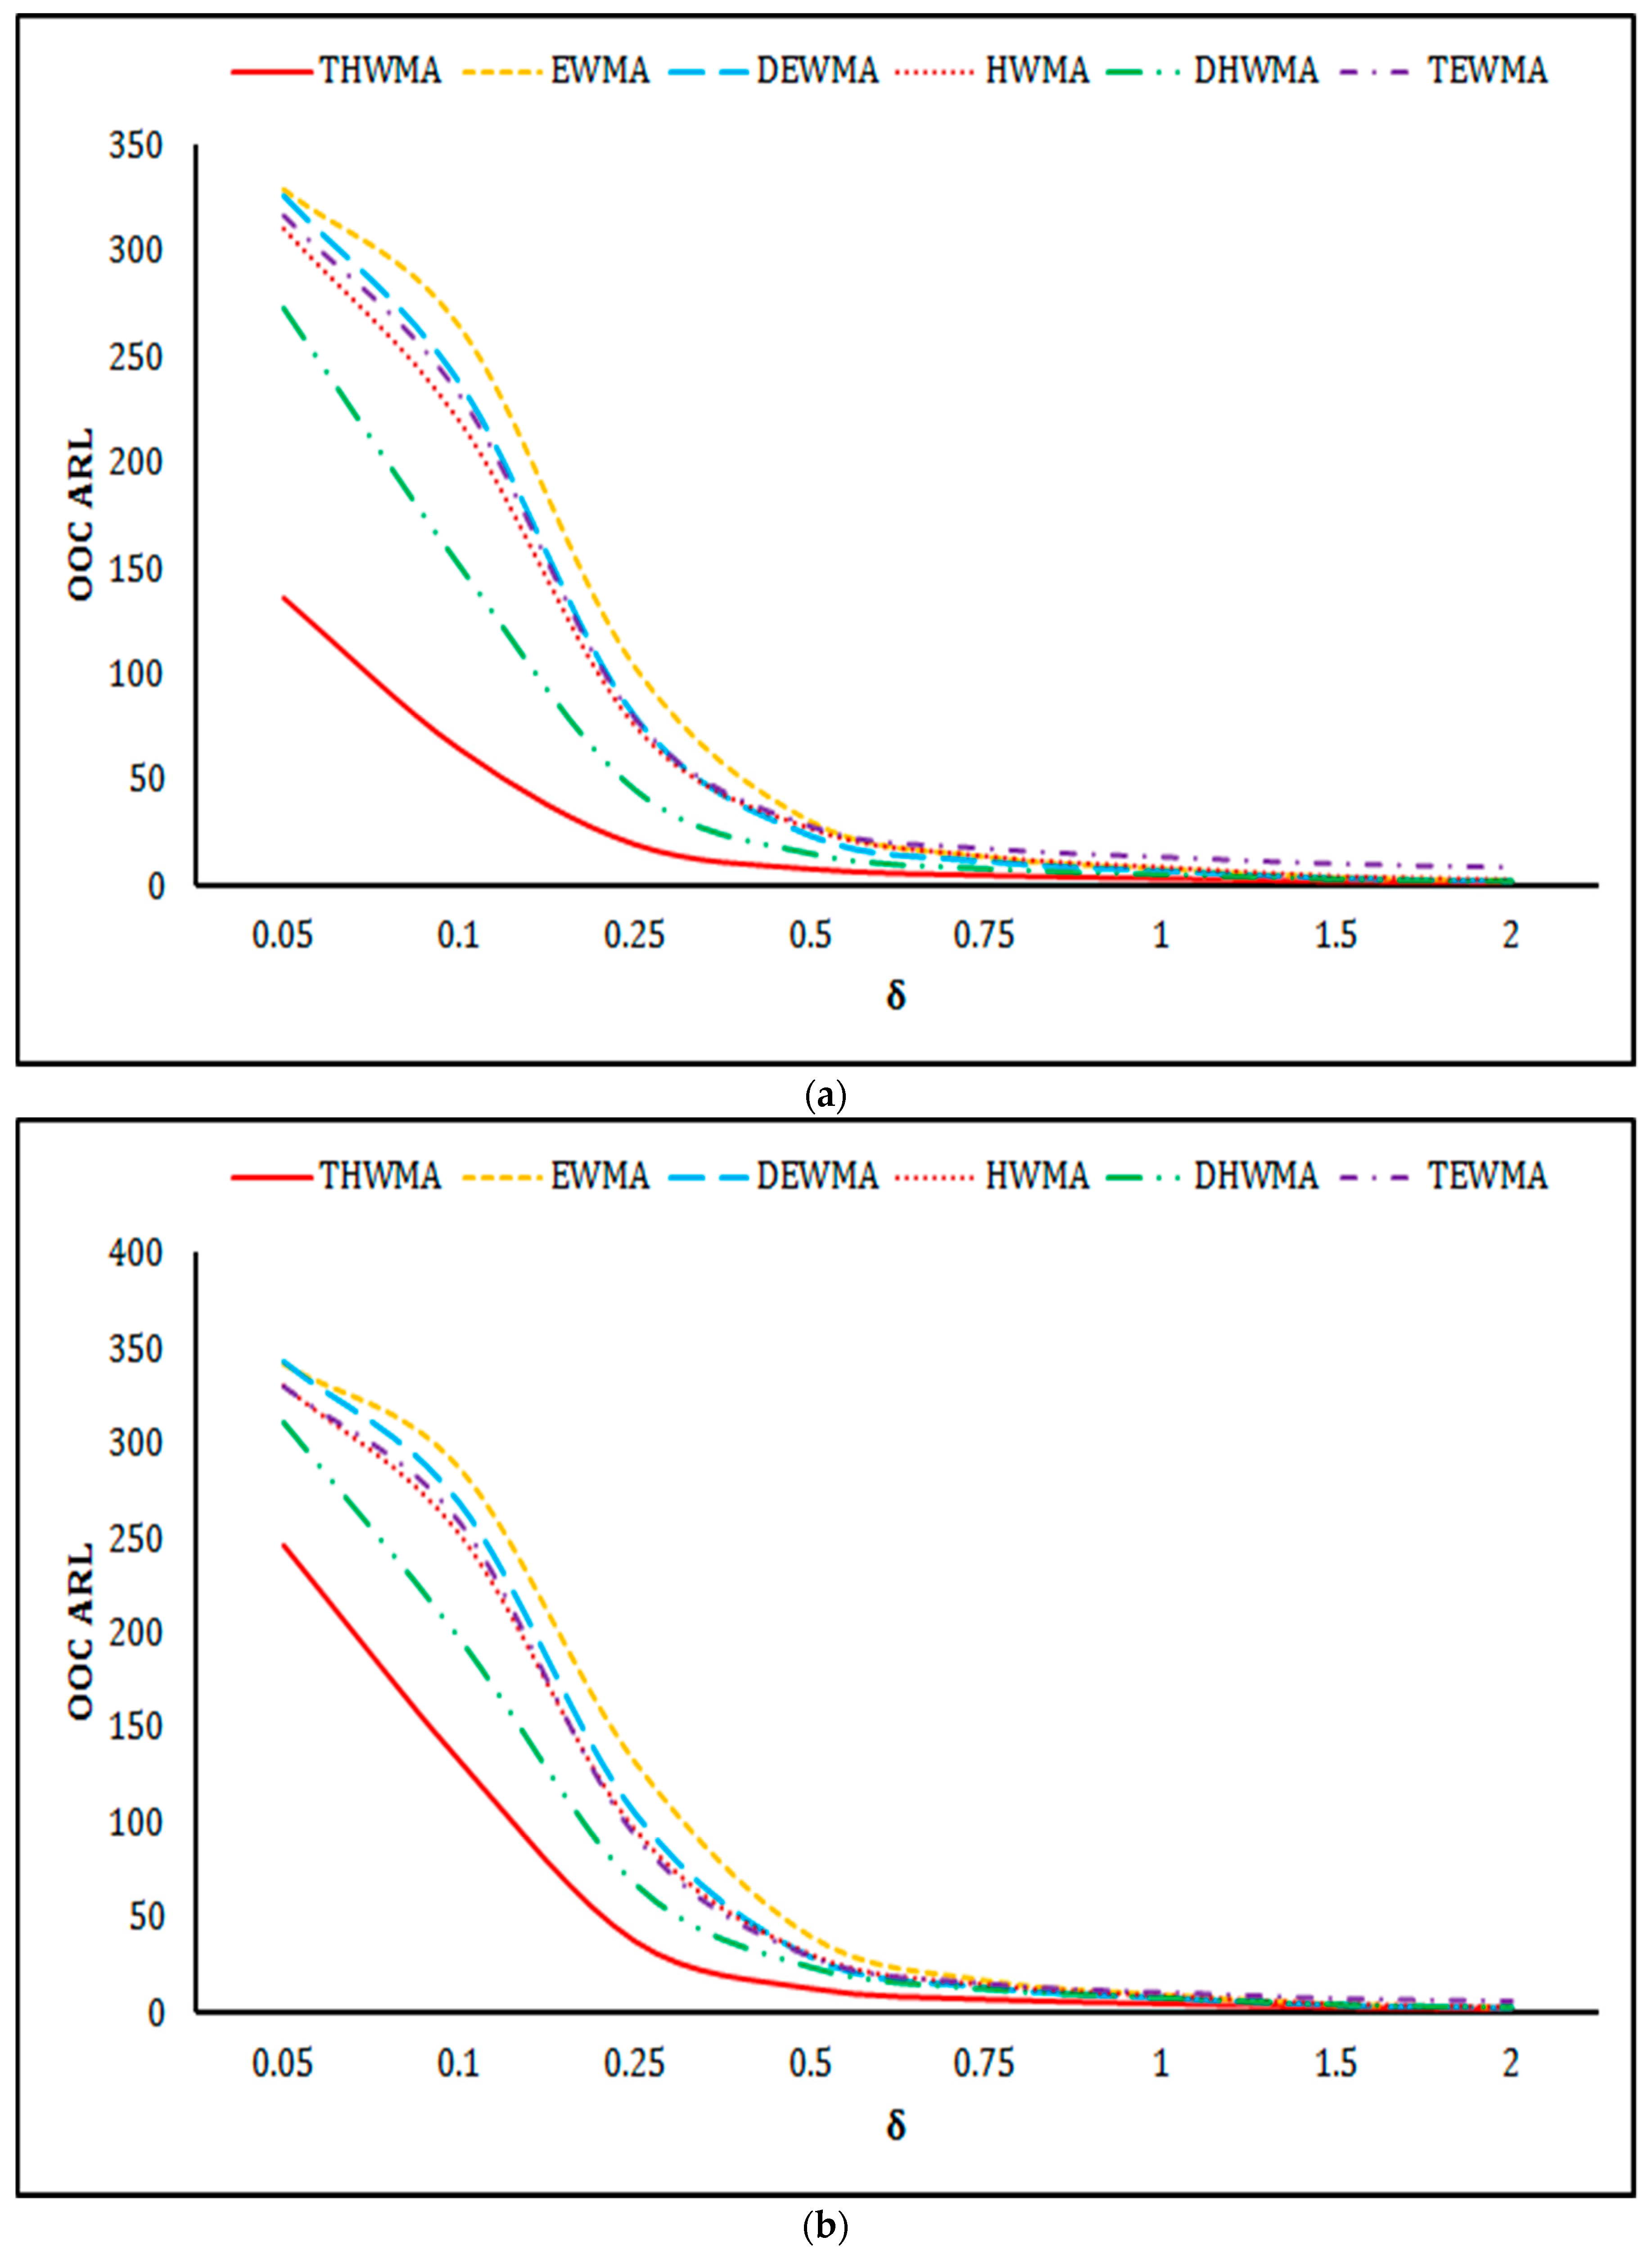
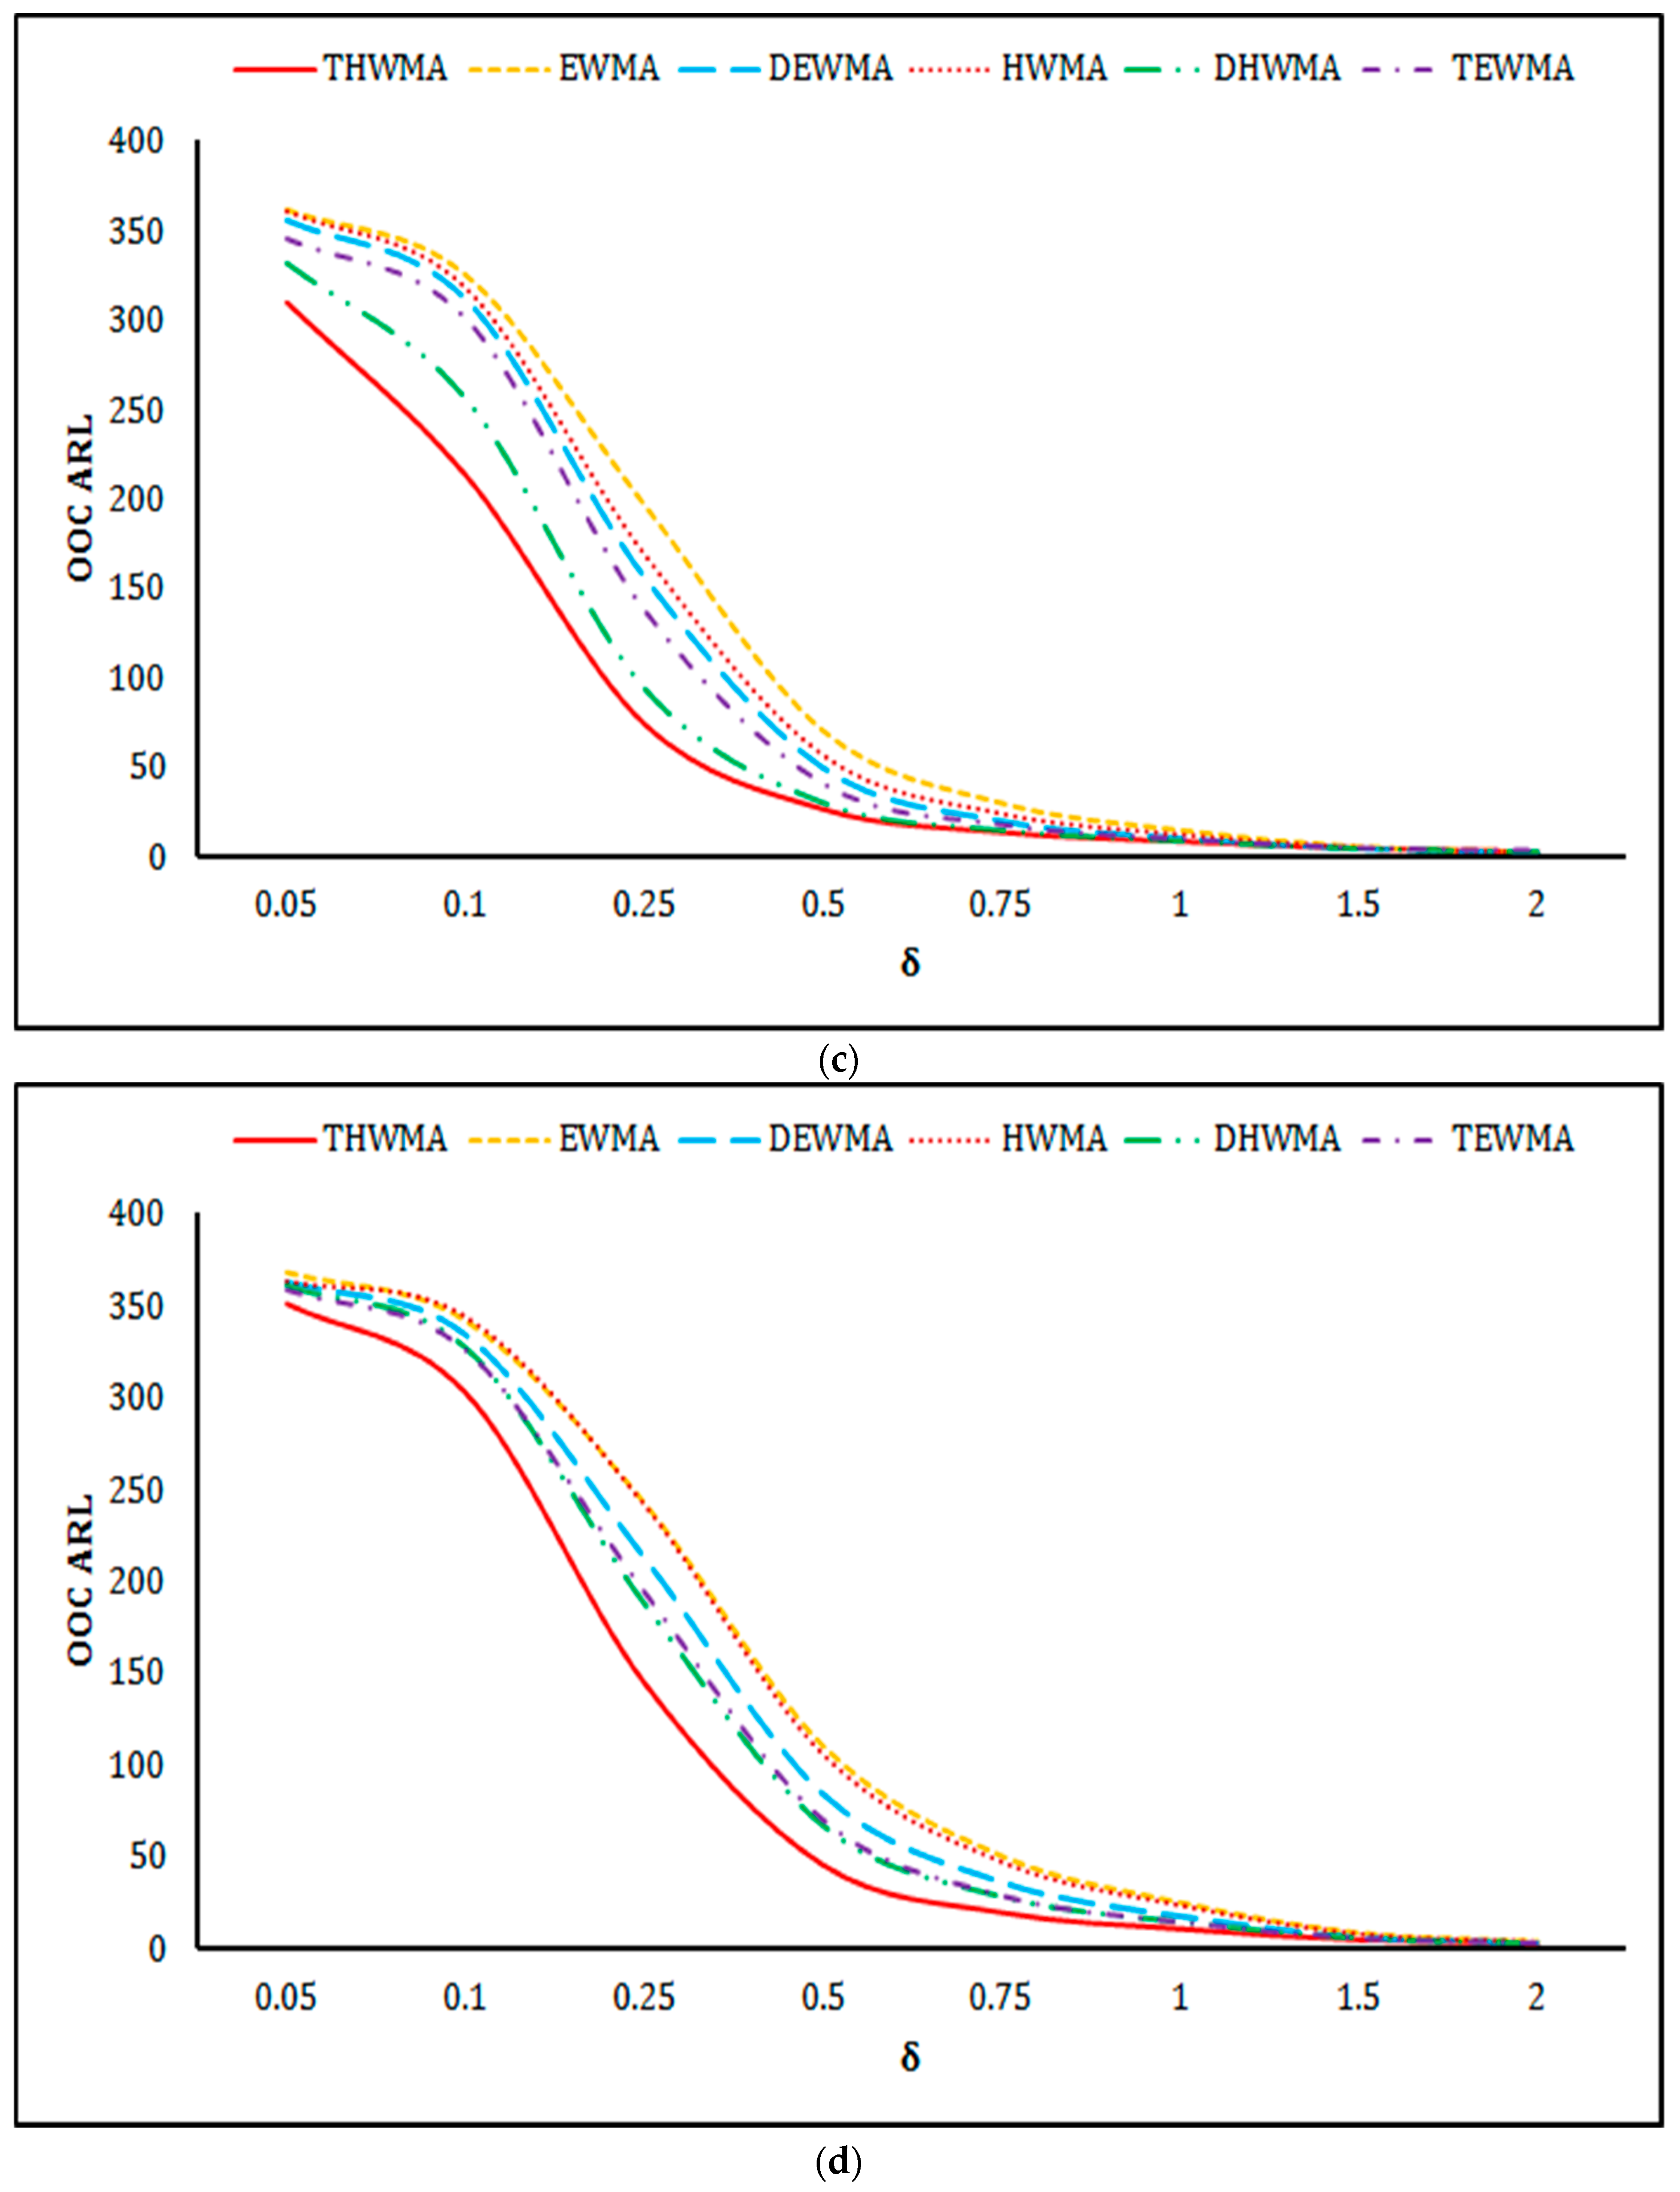
3.2. Comparison of the Proposed THWMA Chart with Existing Competitors
3.2.1. Proposed THWMA Chart versus EWMA Chart
3.2.2. Proposed THWMA Chart versus DEWMA Chart
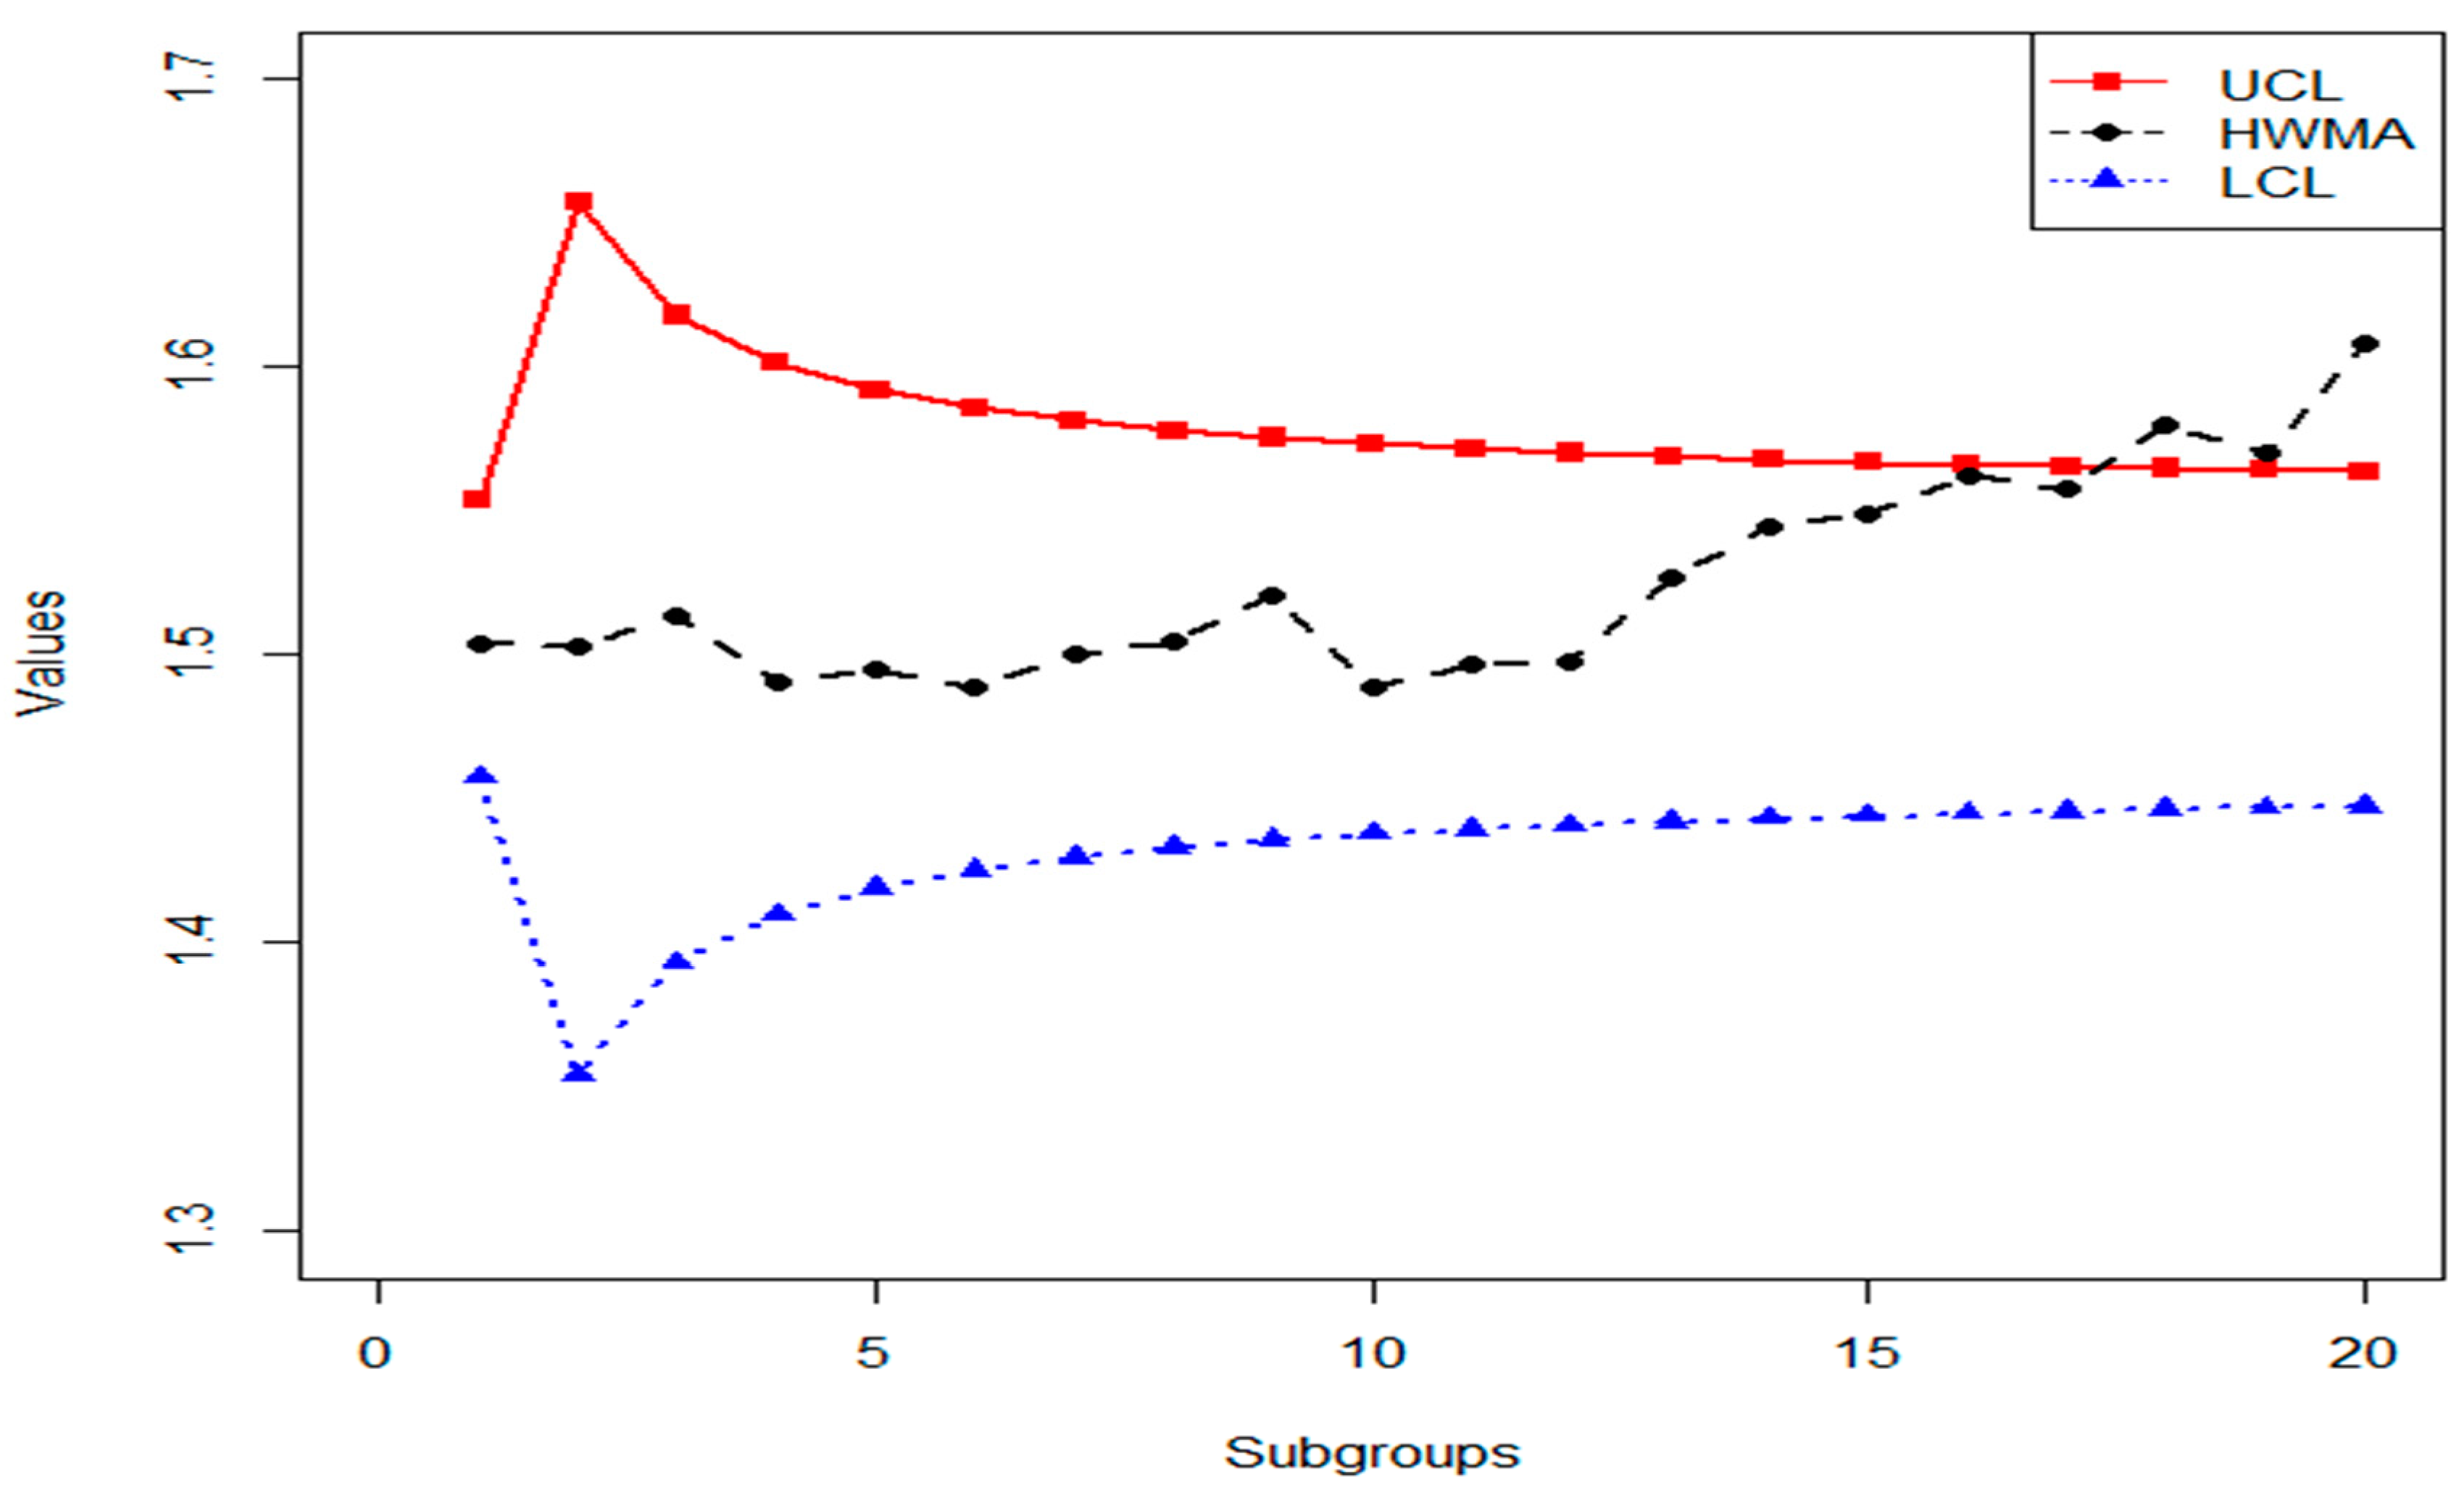
3.2.3. Proposed THWMA Chart versus HWMA Chart
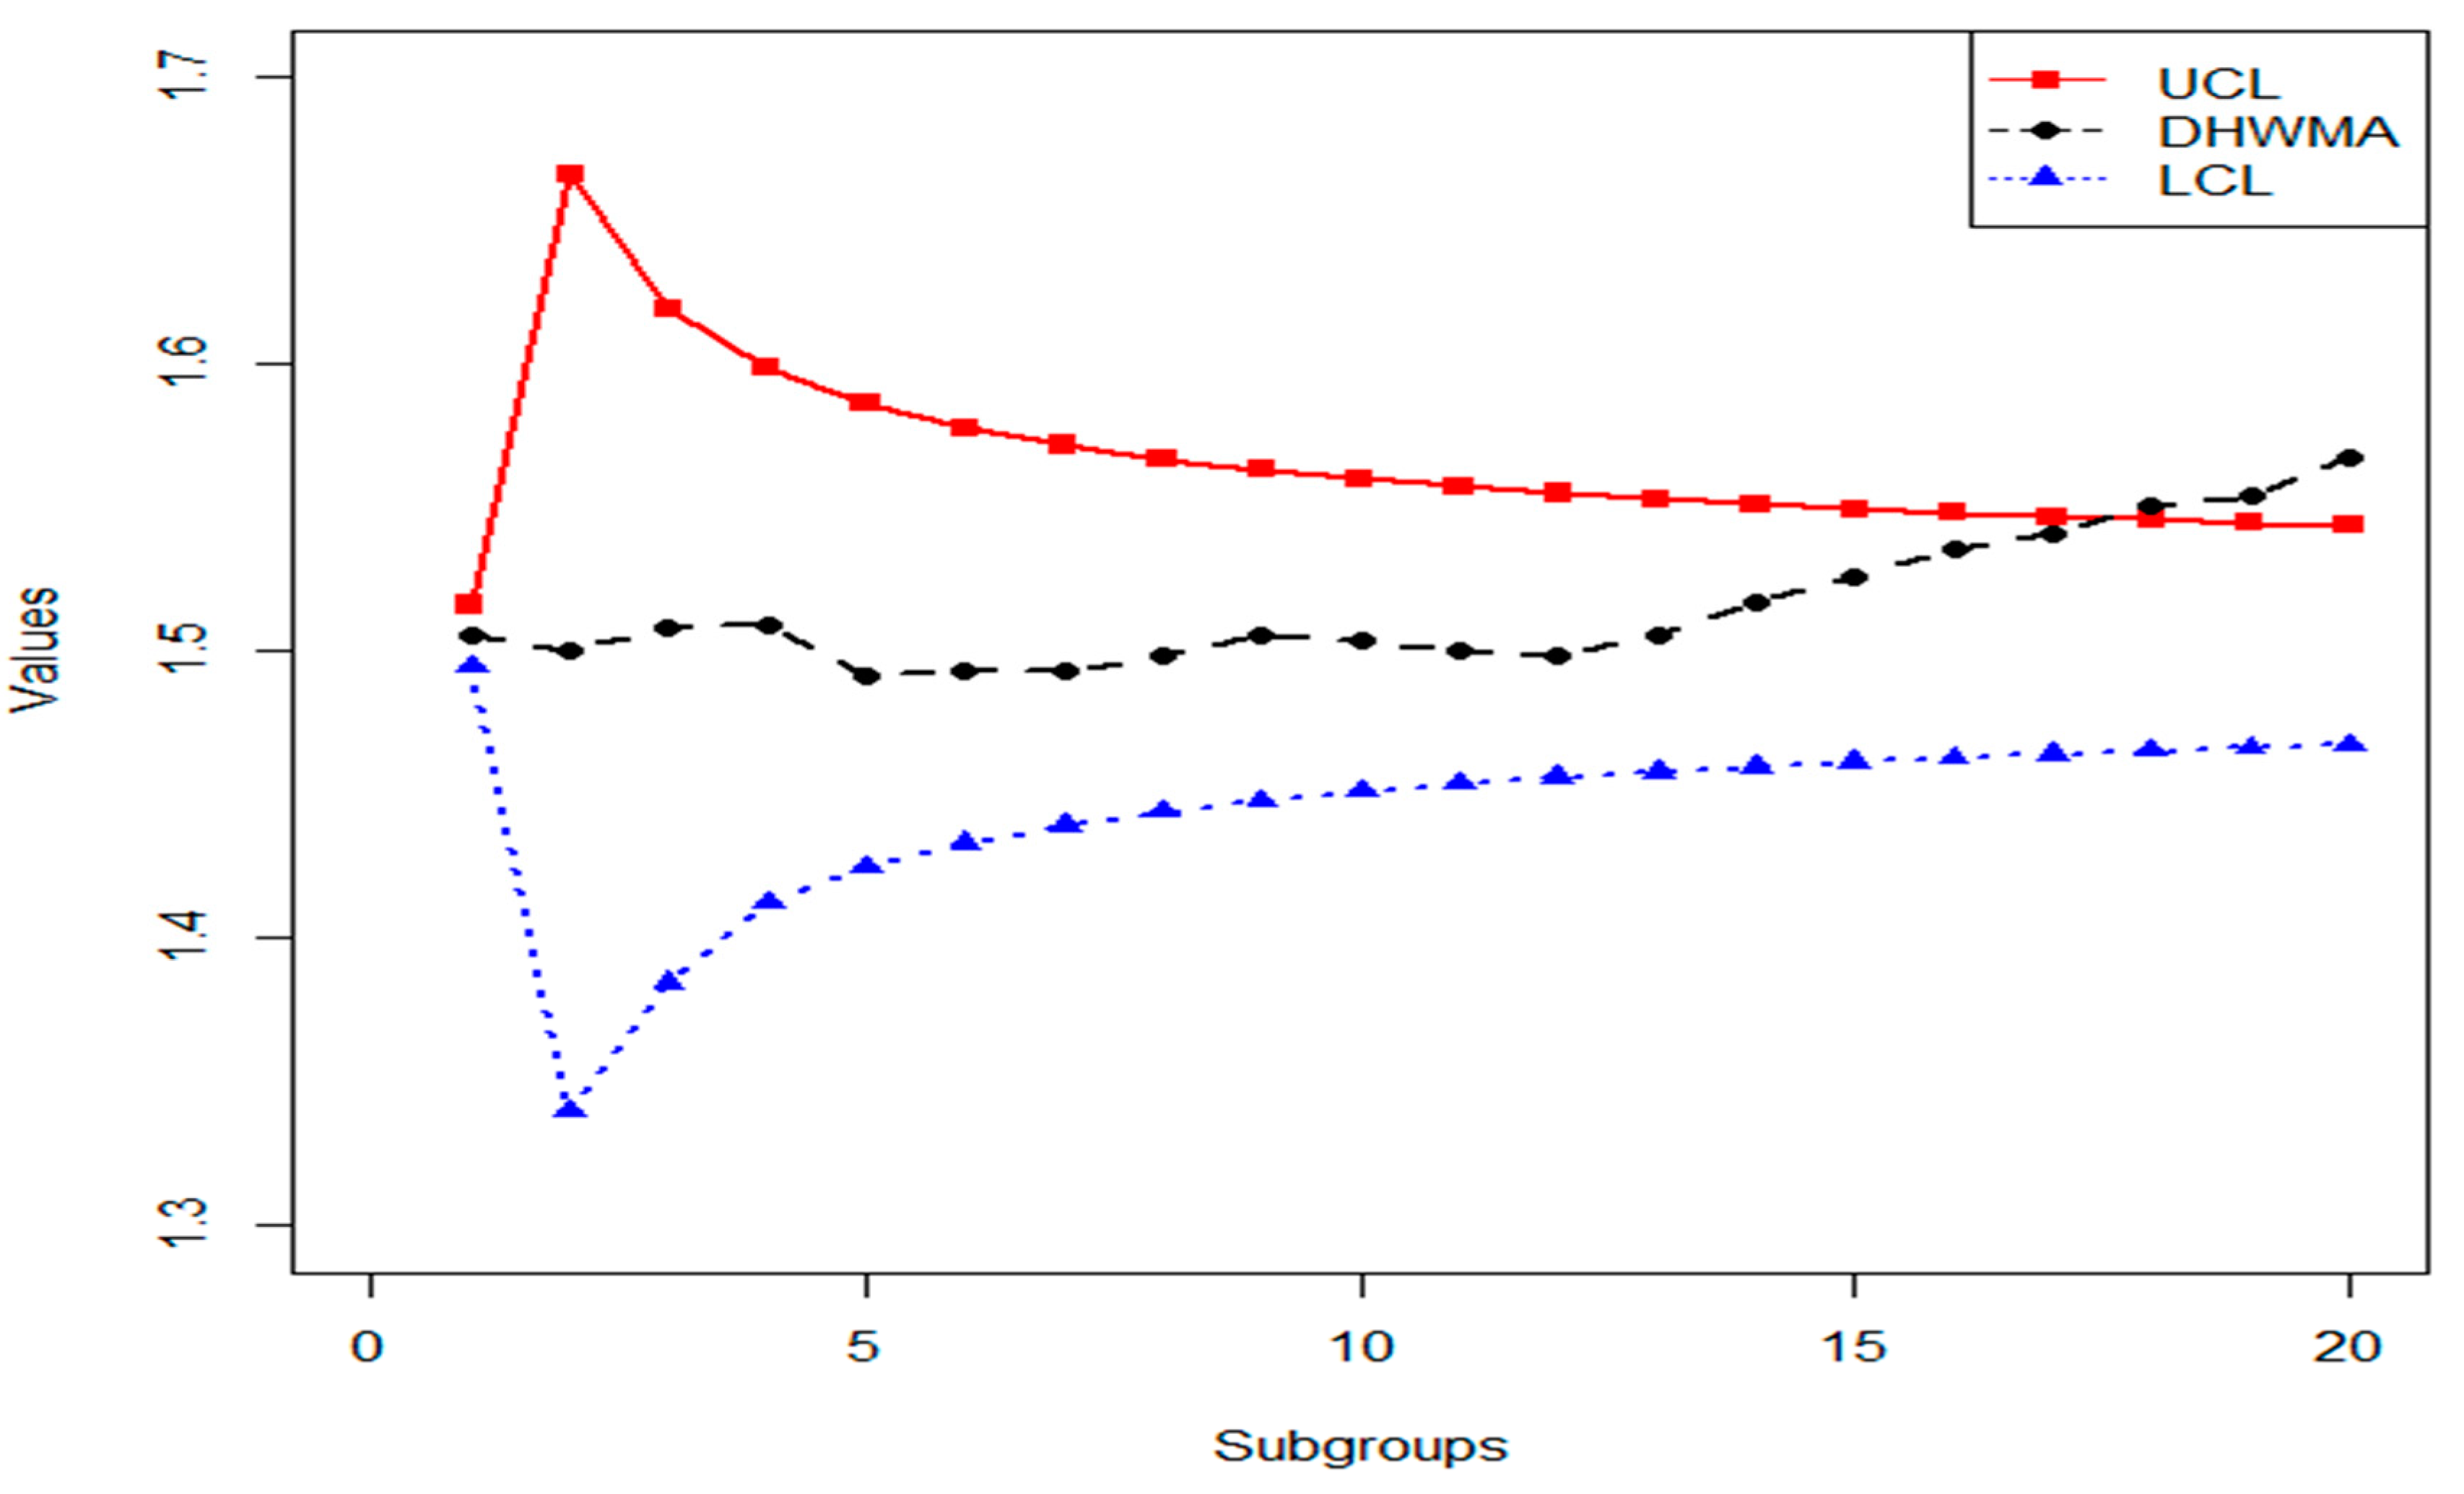
3.2.4. Proposed THWMA Chart versus DHWMA Chart
3.2.5. Proposed THWMA Chart versus TEWMA Chart
3.2.6. Graphical Presentation
4. Application of the Proposed THWMA and Existing Charts
5. Concluding Remarks
Author Contributions
Funding
Institutional Review Board Statement
Informed Consent Statement
Data Availability Statement
Acknowledgments
Conflicts of Interest
Appendix A
Appendix A.1
Appendix A.2
Appendix B
Appendix B.1
Appendix B.2
Appendix C
Appendix C.1
Appendix C.2
Appendix D
Appendix D.1
Appendix D.2
References
- Page, E.S. Continuous inspection schemes. Biometrika 1954, 41, 100–115. [Google Scholar] [CrossRef]
- Roberts, S. Control chart tests based on geometric moving averages. Technometrics 1959, 42, 239–250. [Google Scholar] [CrossRef]
- Montgomery, D.C. Introduction to Statistical Quality Control, 7th ed.; John Wiley & Sons: New York, NY, USA, 2012. [Google Scholar]
- Abbas, N. Homogeneously weighted moving average control chart with an application in substrate manufacturing process. Comput. Ind. Eng. 2018, 120, 460–470. [Google Scholar] [CrossRef]
- Lucas, J.M. Combined Shewhart-CUSUM quality control schemes. J. Qual. Technol. 1982, 14, 51–59. [Google Scholar] [CrossRef]
- Lucas, J.M.; Saccucci, M.S. Exponentially weighted moving average control schemes: Properties and enhancements. Technometrics 1990, 32, 1–12. [Google Scholar] [CrossRef]
- Runger, G.C.; Montgomery, D.C. Adaptive sampling enhancements for Shewhart control charts. IIE Trans. 1993, 25, 41–51. [Google Scholar] [CrossRef]
- Shamma, S.E.; Shamma, A.K. Development and evaluation of control charts using double exponentially weighted moving averages. Int. J. Qual. Reliab. Manag. 1992, 9, 18–25. [Google Scholar] [CrossRef]
- Abbas, N.; Riaz, M.; Does, R.J. Mixed exponentially weighted moving average–cumulative sum charts for process monitoring. Qual. Reliab. Eng. Int. 2013, 29, 345–356. [Google Scholar] [CrossRef]
- Zaman, B.; Riaz, M.; Abbas, N.; Does, R.J. Mixed cumulative sum–exponentially weighted moving average control charts: An efficient way of monitoring process location. Qual. Reliab. Eng. Int. 2015, 31, 1407–1421. [Google Scholar] [CrossRef]
- Abbas, Z.; Nazir, H.Z.; Akhtar, N.; Riaz, M.; Abid, M. An enhanced approach for the progressive mean control charts. Qual. Reliab. Eng. Int. 2019, 35, 1046–1060. [Google Scholar] [CrossRef]
- Abbas, Z.; Nazir, H.Z.; Akhtar, N.; Riaz, M.; Abid, M. On developing an exponentially weighted moving average chart under progressive setup: An efficient approach to manufacturing processes. Qual. Reliab. Eng. Int. 2020, 36, 2569–2591. [Google Scholar] [CrossRef]
- Riaz, M.; Abbas, Z.; Nazir, H.Z.; Akhtar, N.; Abid, M. On Designing a Progressive EWMA Structure for an Efficient Monitoring of Silicate Enactment in Hard Bake Processes. Arab. J. Sci. Eng. 2020. [Google Scholar] [CrossRef]
- Abid, M.; Shabbir, A.; Nazir, H.Z.; Sherwani, R.A.K.; Riaz, M. A double homogeneously weighted moving average control chart for monitoring of the process mean. Qual. Reliab. Eng. Int. 2020, 36, 1513–1527. [Google Scholar] [CrossRef]
- Raza, M.A.; Nawaz, T.; Han, D. On Designing Distribution-Free Homogeneously Weighted Moving Average Control Charts. J. Test. Eval. 2020, 48, 3154–3171. [Google Scholar] [CrossRef]
- Aslam, M.; Rao, G.S.; Al-Marshadi, A.H.; Jun, C.-H. A Nonparametric HEWMA-p Control chart for variance in monitoring processes. Symmetry 2019, 11, 356. [Google Scholar] [CrossRef]
- Chen, J.-H.; Lu, S.-L. A New Sum of Squares Exponentially Weighted Moving Average Control Chart Using Auxiliary Information. Symmetry 2020, 12, 1888. [Google Scholar] [CrossRef]
- Alevizakos, V.; Chatterjee, K.; Koukouvinos, C. The triple exponentially weighted moving average control chart. Qual. Technol. Quant. Manag. 2020. [Google Scholar] [CrossRef]
- Shewhart, W.A. Quality control charts. Bell Syst. Tech. J. 1926, 5, 593–603. [Google Scholar] [CrossRef]
- Abbasi, S.A. On the performance of EWMA chart in the presence of two-component measurement error. Qual. Eng. 2010, 22, 199–213. [Google Scholar] [CrossRef]
- Hussain, S.; Mei, S.; Riaz, M.; Abbasi, S.A. On Phase-I Monitoring of Process Location Parameter with Auxiliary Information-Based Median Control Charts. Mathematics 2020, 8, 706. [Google Scholar] [CrossRef]
- Graham, M.A.; Chakraborti, S.; Human, S.W. A nonparametric EWMA sign chart for location based on individual measurements. Qual. Eng. 2011, 23, 227–241. [Google Scholar] [CrossRef]
- Abbas, Z.; Nazir, H.Z.; Akhtar, N.; Abid, M.; Riaz, M. On designing an efficient control chart to monitor fraction nonconforming. Qual. Reliab. Eng. Int. 2020, 36, 547–564. [Google Scholar] [CrossRef]
- Radson, D.; Boyd, A.H. Graphical representation of run length distributions. Qual. Eng. 2005, 17, 301–308. [Google Scholar] [CrossRef]
- Rocke, D.M. Robust control charts. Technometrics 1989, 31, 173–184. [Google Scholar] [CrossRef]
- Human, S.W.; Kritzinger, P.; Chakraborti, S. Robustness of the EWMA control chart for individual observations. J. Appl. Stat. 2011, 38, 2071–2087. [Google Scholar] [CrossRef]
- Steiner, S.H. EWMA control charts with time-varying control limits and fast initial response. J. Qual. Technol. 1999, 31, 75–86. [Google Scholar] [CrossRef]
- Zhang, L.; Chen, G. An extended EWMA mean chart. Qual. Technol. Quant. Manag. 2005, 2, 39–52. [Google Scholar] [CrossRef]


| Zero-State | Steady-State | Zero-State | Steady-State | ||||||||||||
|---|---|---|---|---|---|---|---|---|---|---|---|---|---|---|---|
| ARL | SDRL | MDRL | ARL | SDRL | MDRL | ARL | SDRL | MDRL | ARL | SDRL | MDRL | ||||
| 0.15 | 0 | 371.030 | 1265.878 | 12 | 365.061 | 2577.145 | 1 | 0.25 | 0 | 372.437 | 495.525 | 24 | 373.612 | 854.312 | 1 |
| 0.05 | 135.990 | 362.937 | 3 | 52.209 | 328.816 | 1 | 0.05 | 246.025 | 336.123 | 10 | 182.599 | 434.295 | 1 | ||
| 0.1 | 64.628 | 136.391 | 3 | 16.961 | 103.007 | 1 | 0.1 | 132.728 | 172.495 | 9 | 82.054 | 190.151 | 1 | ||
| 0.25 | 19.702 | 29.226 | 3 | 4.506 | 20.074 | 1 | 0.25 | 37.743 | 42.484 | 7 | 20.074 | 43.808 | 1 | ||
| 0.5 | 8.132 | 8.691 | 3 | 1.946 | 5.278 | 1 | 0.5 | 12.880 | 12.154 | 4 | 6.880 | 13.001 | 1 | ||
| 0.75 | 4.977 | 4.298 | 1 | 1.425 | 2.267 | 1 | 0.75 | 7.037 | 5.641 | 3 | 3.770 | 6.002 | 1 | ||
| 1 | 3.571 | 2.723 | 1 | 1.278 | 1.445 | 1 | 1 | 4.831 | 3.516 | 3 | 2.657 | 3.491 | 1 | ||
| 1.5 | 2.212 | 1.539 | 1 | 1.147 | 0.743 | 1 | 1.5 | 2.852 | 1.822 | 1 | 1.866 | 1.733 | 1 | ||
| 2 | 1.602 | 1.049 | 1 | 1.114 | 0.521 | 1 | 2 | 1.997 | 1.271 | 1 | 1.561 | 1.084 | 1 | ||
| K | 1.392 | 2.092 | K | 1.788 | 2.3149 | ||||||||||
| Zero-state | Steady-state | Zero-state | Steady-state | ||||||||||||
| ARL | SDRL | MDRL | ARL | SDRL | MDRL | ARL | SDRL | MDRL | ARL | SDRL | MDRL | ||||
| 0.5 | 0 | 370.568 | 311.521 | 292 | 365.638 | 321.614 | 287 | 0.75 | 0 | 368.600 | 362.027 | 258 | 369.089 | 366.744 | 260 |
| 0.05 | 309.743 | 262.260 | 119 | 307.048 | 271.068 | 238 | 0.05 | 350.780 | 348.269 | 104 | 348.114 | 347.537 | 244 | ||
| 0.1 | 213.366 | 173.874 | 86 | 210.562 | 182.994 | 164 | 0.1 | 302.505 | 296.107 | 89 | 299.835 | 299.883 | 209 | ||
| 0.25 | 74.489 | 53.675 | 35 | 72.810 | 57.141 | 60 | 0.25 | 144.829 | 139.342 | 46 | 143.743 | 140.280 | 101 | ||
| 0.5 | 26.823 | 17.586 | 14 | 25.579 | 17.810 | 23 | 0.5 | 45.673 | 40.861 | 17 | 45.649 | 40.712 | 34 | ||
| 0.75 | 13.833 | 8.403 | 8 | 13.370 | 8.794 | 12 | 0.75 | 19.760 | 16.079 | 8 | 19.455 | 16.130 | 15 | ||
| 1 | 8.770 | 4.974 | 5 | 8.413 | 5.273 | 8 | 1 | 10.898 | 8.002 | 5 | 10.679 | 8.021 | 9 | ||
| 1.5 | 4.711 | 2.356 | 3 | 4.423 | 2.548 | 4 | 1.5 | 4.856 | 3.003 | 3 | 4.791 | 3.019 | 4 | ||
| 2 | 3.152 | 1.468 | 2 | 2.915 | 1.573 | 3 | 2 | 2.958 | 1.550 | 2 | 2.893 | 1.583 | 3 | ||
| K | 2.875 | 2.891 | K | 2.994 | 2.997 | ||||||||||
| Distributions | Distributions | Distributions | |||||||||
|---|---|---|---|---|---|---|---|---|---|---|---|
| ARL | SDRL | MDRL | ARL | SDRL | MDRL | ARL | SDRL | MDRL | |||
| G(0.5,1) | 295.112 | 329.444 | 25 | G(0.5,1) | 110.492 | 87.189 | 48 | G(0.5,1) | 53.347 | 49.969 | 18 |
| G(1,1) | 309.656 | 370.771 | 17 | G(1,1) | 133.482 | 104.345 | 57 | G(1,1) | 66.370 | 61.783 | 23 |
| G(3,1) | 339.675 | 433.475 | 13 | G(3,1) | 190.835 | 156.269 | 79 | G(3,1) | 99.763 | 95.619 | 32 |
| G(5,1) | 349.235 | 456.900 | 12 | G(5,1) | 224.897 | 188.031 | 90 | G(5,1) | 125.633 | 118.940 | 40 |
| G(10,1) | 359.884 | 472.647 | 11 | G(10,1) | 277.701 | 237.102 | 107 | G(10,1) | 167.310 | 158.575 | 54 |
| G(50,1) | 357.163 | 480.190 | 10 | G(50,1) | 349.796 | 298.003 | 133 | G(50,1) | 288.609 | 291.201 | 86 |
| t(4) | 253.608 | 275.976 | 15 | t(4) | 127.741 | 92.877 | 60 | t(4) | 81.641 | 75.930 | 27 |
| t(8) | 290.136 | 355.799 | 11 | t(8) | 181.372 | 134.984 | 82 | t(8) | 125.067 | 120.172 | 39 |
| t(10) | 303.648 | 375.747 | 11 | t(10) | 200.297 | 150.050 | 91 | t(10) | 144.353 | 137.568 | 46 |
| t(15) | 329.355 | 413.455 | 11 | t(15) | 235.836 | 181.738 | 101 | t(15) | 181.719 | 175.007 | 57 |
| t(20) | 334.823 | 433.328 | 10 | t(20) | 260.030 | 204.274 | 109 | t(20) | 209.941 | 202.419 | 64 |
| t(30) | 348.384 | 458.280 | 10 | t(30) | 291.806 | 231.041 | 118 | t(30) | 244.841 | 241.664 | 74 |
| t(50) | 355.546 | 470.796 | 10 | t(50) | 319.119 | 258.962 | 127 | t(50) | 283.961 | 282.601 | 84 |
| Logistic | 301.520 | 372.471 | 10 | Logistic | 181.429 | 135.769 | 83 | Logistic | 122.558 | 117.043 | 39 |
| CN(0.05) | 245.864 | 270.822 | 14 | CN(0.05) | 128.205 | 95.707 | 58 | CN(0.05) | 87.147 | 82.787 | 29 |
| CN(0.10) | 239.400 | 255.590 | 16 | CN(0.10) | 103.151 | 71.620 | 51 | CN(0.10) | 60.326 | 55.763 | 20 |
| K | 1.788 | K | 2.875 | K | 2.994 | ||||||
| ARL | SDRL | MDRL | ARL | SDRL | MDRL | |
|---|---|---|---|---|---|---|
| 0 | 368.981 | 361.872 | 249 | 369.983 | 362.991 | 253 |
| 0.05 | 329.126 | 336.645 | 223 | 341.441 | 340.172 | 242 |
| 0.1 | 264.598 | 265.336 | 182 | 286.797 | 287.244 | 199 |
| 0.25 | 103.460 | 98.204 | 73 | 132.096 | 128.241 | 93 |
| 0.5 | 30.576 | 26.276 | 23 | 40.270 | 36.486 | 29 |
| 0.75 | 13.770 | 10.335 | 11 | 16.992 | 14.141 | 13 |
| 1 | 8.205 | 5.406 | 7 | 9.489 | 6.882 | 8 |
| 1.5 | 4.109 | 2.379 | 4 | 4.438 | 2.656 | 4 |
| 2 | 2.655 | 1.388 | 2 | 2.787 | 1.456 | 3 |
| K | 2.801 | 2.898 | ||||
| ARL | SDRL | MDRL | ARL | SDRL | MDRL | |
| 0 | 369.378 | 366.234 | 251 | 371.058 | 374.606 | 269 |
| 0.05 | 361.513 | 358.958 | 250 | 367.950 | 370.758 | 256 |
| 0.1 | 325.146 | 325.230 | 222 | 341.726 | 336.992 | 237 |
| 0.25 | 196.909 | 195.767 | 139 | 242.720 | 243.731 | 167 |
| 0.5 | 70.700 | 69.458 | 50 | 110.468 | 109.113 | 77 |
| 0.75 | 30.220 | 28.570 | 22 | 50.605 | 49.362 | 36 |
| 1 | 15.045 | 13.031 | 11 | 25.250 | 23.939 | 18 |
| 1.5 | 5.774 | 4.285 | 5 | 8.741 | 7.681 | 6 |
| 2 | 3.188 | 1.953 | 3 | 4.097 | 3.116 | 3 |
| K | 2.977 | 2.999 | ||||
| ARL | SDRL | MDRL | ARL | SDRL | MDRL | |
|---|---|---|---|---|---|---|
| 0 | 372.316 | 385.571 | 258 | 370.974 | 384.942 | 262 |
| 0.05 | 326.201 | 332.922 | 221 | 342.680 | 350.643 | 237 |
| 0.1 | 237.948 | 235.761 | 166 | 268.452 | 268.838 | 189 |
| 0.25 | 80.165 | 76.636 | 57 | 105.014 | 102.420 | 73 |
| 0.5 | 23.803 | 19.353 | 19 | 29.580 | 25.645 | 22 |
| 0.75 | 11.741 | 8.188 | 10 | 13.378 | 9.927 | 11 |
| 1 | 7.213 | 4.823 | 6 | 7.912 | 5.381 | 7 |
| 1.5 | 3.716 | 2.318 | 3 | 3.992 | 2.367 | 4 |
| 2 | 2.318 | 1.353 | 2 | 2.551 | 1.435 | 2 |
| K | 2.417 | 2.635 | ||||
| ARL | SDRL | MDRL | ARL | SDRL | MDRL | |
| 0 | 371.217 | 376.282 | 262 | 375.177 | 369.784 | 264 |
| 0.05 | 355.595 | 353.364 | 247 | 362.690 | 365.308 | 250 |
| 0.1 | 311.614 | 312.472 | 215 | 333.963 | 339.223 | 229 |
| 0.25 | 156.589 | 153.773 | 109 | 212.931 | 214.642 | 147 |
| 0.5 | 49.976 | 47.670 | 36 | 84.303 | 82.613 | 59 |
| 0.75 | 20.193 | 17.973 | 15 | 36.356 | 35.051 | 26 |
| 1 | 10.533 | 8.403 | 8 | 17.807 | 16.751 | 13 |
| 1.5 | 4.591 | 2.886 | 4 | 6.286 | 4.928 | 5 |
| 2 | 2.782 | 1.462 | 3 | 3.317 | 2.157 | 3 |
| K | 2.895 | 2.985 | ||||
| ARL | SDRL | MDRL | ARL | SDRL | MDRL | |
|---|---|---|---|---|---|---|
| 0 | 371.214 | 331.701 | 285 | 370.150 | 358.381 | 268 |
| 0.05 | 310.565 | 270.989 | 237 | 330.153 | 319.227 | 237 |
| 0.1 | 219.797 | 188.487 | 172 | 252.100 | 238.662 | 182 |
| 0.25 | 75.654 | 56.937 | 61.5 | 96.407 | 81.103 | 73 |
| 0.5 | 27.144 | 17.859 | 23 | 30.714 | 22.770 | 25 |
| 0.75 | 14.115 | 8.519 | 12 | 14.821 | 9.795 | 13 |
| 1 | 8.926 | 4.968 | 8 | 9.093 | 5.526 | 8 |
| 1.5 | 4.710 | 2.318 | 4 | 4.691 | 2.454 | 4 |
| 2 | 3.170 | 1.462 | 3 | 3.071 | 1.452 | 3 |
| K | 2.918 | 2.978 | ||||
| ARL | SDRL | MDRL | ARL | SDRL | MDRL | |
| 0 | 372.821 | 372.503 | 261 | 372.065 | 381.146 | 266 |
| 0.05 | 360.620 | 360.747 | 252 | 362.956 | 370.576 | 256 |
| 0.1 | 317.891 | 312.963 | 223 | 343.823 | 345.620 | 237 |
| 0.25 | 169.303 | 168.807 | 118 | 241.691 | 241.470 | 168 |
| 0.5 | 56.996 | 53.051 | 42 | 105.827 | 104.086 | 75 |
| 0.75 | 24.320 | 20.956 | 18 | 47.286 | 46.000 | 33 |
| 1 | 12.645 | 10.188 | 10 | 23.709 | 22.235 | 17 |
| 1.5 | 5.249 | 3.500 | 4 | 8.070 | 7.019 | 6 |
| 2 | 3.036 | 1.713 | 3 | 3.891 | 2.949 | 3 |
| K | 3 | 3.004 | ||||
| ARL | SDRL | MDRL | ARL | SDRL | MDRL | |
|---|---|---|---|---|---|---|
| 0 | 368.408 | 394.537 | 230 | 371.707 | 289.696 | 334 |
| 0.05 | 272.996 | 307.303 | 163 | 310.763 | 239.253 | 263 |
| 0.1 | 151.420 | 167.837 | 94 | 197.143 | 156.138 | 162 |
| 0.25 | 45.558 | 46.302 | 31 | 67.936 | 49.347 | 58 |
| 0.5 | 15.378 | 13.640 | 11 | 24.147 | 16.676 | 21 |
| 0.75 | 8.203 | 6.391 | 7 | 12.509 | 8.157 | 11 |
| 1 | 5.453 | 3.716 | 5 | 7.920 | 4.754 | 7 |
| 1.5 | 3.146 | 1.931 | 3 | 4.304 | 2.273 | 4 |
| 2 | 2.151 | 1.330 | 1 | 2.933 | 1.489 | 3 |
| K | 1.9599 | 2.599 | ||||
| ARL | SDRL | MDRL | ARL | SDRL | MDRL | |
| 0 | 372.337 | 359.860 | 269 | 371.382 | 382.775 | 263 |
| 0.05 | 331.647 | 316.396 | 239 | 360.709 | 355.639 | 255 |
| 0.1 | 256.163 | 241.736 | 186 | 326.932 | 321.572 | 230 |
| 0.25 | 94.419 | 81.630 | 71 | 187.965 | 185.973 | 132 |
| 0.5 | 30.411 | 22.551 | 25 | 67.122 | 66.105 | 47 |
| 0.75 | 14.990 | 9.986 | 13 | 28.464 | 25.936 | 21 |
| 1 | 9.074 | 5.429 | 8 | 14.680 | 12.295 | 11 |
| 1.5 | 4.708 | 2.434 | 4 | 5.679 | 4.122 | 5 |
| 2 | 3.044 | 1.443 | 3 | 3.153 | 1.914 | 3 |
| K | 2.9785 | 2.9985 | ||||
| ARL | SDRL | MDRL | ARL | SDRL | MDRL | |
|---|---|---|---|---|---|---|
| 0 | 368.228 | 359.753 | 260 | 369.008 | 363.287 | 259 |
| 0.05 | 316.836 | 302.952 | 222 | 329.676 | 321.241 | 234 |
| 0.1 | 232.258 | 213.346 | 164 | 258.400 | 250.014 | 182 |
| 0.25 | 79.158 | 65.794 | 58 | 93.410 | 84.511 | 68 |
| 0.5 | 28.261 | 15.533 | 24 | 29.592 | 20.978 | 23 |
| 0.75 | 17.798 | 6.050 | 16 | 15.417 | 7.987 | 13 |
| 1 | 13.763 | 3.155 | 13 | 10.835 | 3.988 | 10 |
| 1.5 | 10.535 | 1.538 | 10 | 7.525 | 1.586 | 7 |
| 2 | 8.881 | 0.985 | 9 | 6.145 | 0.958 | 6 |
| K | 2.192 | 2.437 | ||||
| ARL | SDRL | MDRL | ARL | SDRL | MDRL | |
| 0 | 369.059 | 364.868 | 261 | 375.231 | 372.008 | 262 |
| 0.05 | 345.297 | 337.036 | 242 | 358.307 | 359.957 | 246 |
| 0.1 | 300.853 | 298.590 | 208 | 325.569 | 324.921 | 223 |
| 0.25 | 138.118 | 133.428 | 97 | 194.381 | 190.287 | 139 |
| 0.5 | 41.147 | 36.532 | 30 | 70.248 | 68.009 | 49 |
| 0.75 | 18.118 | 14.093 | 14 | 29.030 | 26.793 | 21 |
| 1 | 10.192 | 6.658 | 8 | 14.586 | 12.677 | 11 |
| 1.5 | 5.250 | 2.253 | 5 | 5.799 | 4.001 | 5 |
| 2 | 3.804 | 1.101 | 4 | 3.295 | 1.715 | 3 |
| K | 2.775 | 2.958 | ||||
Publisher’s Note: MDPI stays neutral with regard to jurisdictional claims in published maps and institutional affiliations. |
© 2021 by the authors. Licensee MDPI, Basel, Switzerland. This article is an open access article distributed under the terms and conditions of the Creative Commons Attribution (CC BY) license (http://creativecommons.org/licenses/by/4.0/).
Share and Cite
Riaz, M.; Abbas, Z.; Nazir, H.Z.; Abid, M. On the Development of Triple Homogeneously Weighted Moving Average Control Chart. Symmetry 2021, 13, 360. https://doi.org/10.3390/sym13020360
Riaz M, Abbas Z, Nazir HZ, Abid M. On the Development of Triple Homogeneously Weighted Moving Average Control Chart. Symmetry. 2021; 13(2):360. https://doi.org/10.3390/sym13020360
Chicago/Turabian StyleRiaz, Muhammad, Zameer Abbas, Hafiz Zafar Nazir, and Muhammad Abid. 2021. "On the Development of Triple Homogeneously Weighted Moving Average Control Chart" Symmetry 13, no. 2: 360. https://doi.org/10.3390/sym13020360
APA StyleRiaz, M., Abbas, Z., Nazir, H. Z., & Abid, M. (2021). On the Development of Triple Homogeneously Weighted Moving Average Control Chart. Symmetry, 13(2), 360. https://doi.org/10.3390/sym13020360