Abstract
One of barriers for the present heat pump system’s application in an electric vehicle was decreased performance under cold ambient conditions due to the lack of evaporating heat source. In order to improve the heat pump’s performance, a high-pressure side chiller was additionally installed, and the tested heat pump system was modified with respect to refrigerant flow direction along with operating modes. In the present work, the performance characteristics of the heat pump system with a high-pressure side chiller for light-duty commercial electric vehicles were studied experimentally under hot and cold ambient conditions, reflecting real road driving. The high-pressure side chiller was located after the electric compressor so that the highest refrigerant temperature transferred the heat to the coolant. The controlled coolant with discharged refrigerant from the electric compressor was used to heat up the cabin, transferring heat to the inlet air like the internal combustion engine vehicle’s heating system, except with unused engine waste heat. In the cooling mode, for the exterior air temperature of 35 °C and interior air temperature of 25 °C, cooling performance along with the compressor speed showed that the system efficiency decreased by 16.4% on average, the cooling capacity increased by 8.0% on average and the compressor work increased by 27% on average. In heating mode, at the exterior and interior air temperature of −6.7 °C, compressor speed and coolant temperature variation with steady conditions were tested with respect to heating performance. In transient mode, to increase coolant temperature with a closed loop from −6.7 °C, tested system characteristics were studied along the compressor speed with respect to heating up the cabin. As the inlet air of the HVAC was maintained at −6.7 °C, even though the heat-up rate of the cabin room was a little slow, the cabin temperature reached 20 °C within 50 min and the temperature difference with the ambient air attained 28.7 °C.
1. Introduction
The development of efficient and ecofriendly engines which emit less waste heat is the focus of recent research to overcome the environmental issues of global warming and CO2 emission [1]. Therefore, in the last decade, the research trend is shifting towards the development of efficient electric vehicles [2]. The challenge associated with full commercialization of electric vehicles is their lower driving range due to high power consumption by the thermal management system. The gasoline engines are using waste heat for cabin heating during cold climatic conditions but in the case of electric vehicles, cabin heating energy is consumed from the battery, which reduces the driving range of the vehicles more in cold climatic conditions [3]. Currently, gasoline vehicles and electric vehicles are using positive temperature coefficient (PTC) heaters widely for heating purposes despite its higher cost above 2 kW and higher power consumption. The driving range of electric vehicles with PTC heaters has reduced up to 24% more than that of electric vehicles without PTC heaters [4]. Heat pumps are the best and efficient alternative for the PTC heater because the second law of thermodynamics states that the coefficient of performance of the heat pump is above 1.0. However, the heating performance of a heat pump system decreases drastically in cold climatic conditions for electric vehicles [5]. To overcome this limitation and develop an efficient heat pump system for cold regions, several studies of an improved model of heat pump system for electric vehicles are presented.
Zhang et al. have proposed an R134a-based economized vapor injection heat pump system for electric vehicles to eliminate the key issues of drainage associated with external heat exchangers and the decrease in heating performance during cold weather conditions. The proposed heat pump system showed a 57.7% improvement in heating capacity, 2097 W of maximum capacity and coefficient of performance of 1.25 under the ambient temperature of −20 °C [5]. Qin et al. have developed refrigerant injection air-source heat pump for electric vehicle to overcome the poor heating performance, high battery power consumption and operational safety of traditional air-source heat pump systems in cold climate conditions. The electric scroll compressor of the refrigerant injection air-source heat pump was provided with injection portholes and the effect of the size and shape of these injection portholes was analyzed with respect to the system performance. The larger injection portholes showed enhancement in heating capacity and the refrigerant injection air-source heat pump presented 28.6% higher heating performance compared with the traditional air-source heat pump [6,7]. To develop the efficient heat pump system with less battery power consumption and extended driving range for electric vehicles in cold weather conditions, Qin et al. have proposed air-source heat pumps with refrigerant injection. Under the ambient temperature of −20 °C, the heating performance of the heat pump was tested for various in-car inlet temperatures and different fresh-air ratios. In addition, the effects of refrigerant injection and dryness were also tested on the heating performance of the heat pump. The proposed heat pump showed 31% improved heating capacity compared with the traditional heat pump above a −10 °C in-car inlet temperature [8]. Qin et al. have proved that the air-source heat pump is a potential candidate to heat up the cabin of electric vehicle in cold weather conditions. The experimental study on the proposed heat pump showed coefficient of performance above 1.7 at the ambient temperature of −20 °C [9]. Zhou et al. have developed a heat pump system with defrost technology for the thermal management of electric vehicles under low temperature and high humidity ambient conditions. With the proposed heat pump system with defrost technology, the defrosting time of external heat exchanger could be controlled within 100 s at the ambient conditions of temperature of −20 °C and relative humidity of 80% [10]. Ahn et al. have investigated the heating performance of a dual source heat pump which used a combination of air and waste heat as the heat sources in electrical vehicles. At lower ambient temperatures, the proposed dual heat source heat pump showed better heating performance compared with a single heat source heat pump which used air or waste heat as heat source [11]. Jung et al. have developed a simulation model to analyze the coefficient of performance and isentropic efficiency of an R134a heat pump with vapor injection. At an ambient temperature of −10 °C, the heat pump with single injection port and dual injection port has shown the coefficient of performance higher by 7.5% and 9.8%, respectively, and the isentropic efficiency higher by 11.2% and 22.9%, respectively, compared with the conventional heat pump [12]. Zhang et al. have proposed a desiccant integrated heat pump system to reduce the heat demand inside the cabin of electric vehicles. At an ambient temperature of −20 °C, the proposed heat pump system has shown reductions of 42% and 38% in cabin heat load and compressor electric power, respectively, compared with the traditional heat pump system [13]. Choi et al. have designed heat pump system with vapor injection to evaluate the maximum heating capacity and coefficient of performance at lower ambient temperatures under the influence of various injection positions and different intermediate pressures [14]. Lee et al. have experimentally analyzed the heating and cooling performances of hybrid heat pump which uses waste heat of electric devices for heating and air source for cooling of electric bus. The proposed hybrid heat pump shows a cooling capacity of 23 kW and heating coefficient of performance of 2.4 [15]. Kwon et al. have presented experimental and numerical studies on the heating performance of a heat pump system with vapor injection for electric vehicles in cold weather conditions. Compared with the Joule heating system for electric vehicles, vapor injection heat pump systems enabled the extended driving range with less battery power consumption and improved heating performance in cold weather conditions [16]. Liu et al. have proposed a propane-based heat pump system to improve the heating performance for electric vehicles in cold ambient conditions. The influences of compressor speed, outside ambient temperature, inside circulated air percentage, inside air volume flow rate and outside air velocity were experimentally investigated with respect to the performance of propane-based heat pump system. The propane-based heat pump system shows effective performance above the ambient temperature of −10 °C [17]. Li et al. have developed an R1234yf-based heat pump system and compared its performance with an R134a-based heat pump system for an electric vehicle under cold ambient conditions. The comparison of both heat pump systems was conducted for outside temperature, outside air velocity, inside temperature, inside air mass flow rate, compressor speed, charge, inner condenser width and economized vapor injection [18]. Ahn et al. have analyzed the heating performance and coefficient of performance of dehumidifying heat pump integrated with additional heat source for electric vehicles with less occupancy [19]. Bellocchi et al. have proposed a heat pump integrated with regenerative heat exchanger for electric vehicle HVAC which decreases the power consumption by 17–52% and driving range reduction up to 6% [20]. Lee et al. have experimentally investigated air-source heat pump system for electric vehicles to evaluate the steady state performances of heating capacity and coefficient of performance and transient temperature for cabin heating performance. The proposed air-source heat pump system presents heating capacity of 3.10 kW and coefficient of performance of 3.26 at the ambient temperature of −10 °C [21]. Li et al. have developed a hybrid model of an air-cycle heat pump system with turbocharger, blower and regenerated heat exchanger for electric vehicles. The performance of air-cycle heat pumps was numerically examined for three different positions of blower and results show that the blower installed before the compressor achieves higher coefficient of performance and heating capacity. Under the same operating conditions of electric vehicles, the air-cycle heat pump system with turbocharger power 23% compared with the positive temperature coefficient (PTC) system [22]. Cho et al. have analyzed the heating performance of an R-134a based heat pump system which uses waste heat of electrical devices for an electric bus. The behaviors of compressor work, heating capacity and coefficient of performance are investigated for the outdoor temperature and volume flow rate [23]. Lee et al. have developed R744 based electric air conditioning system for fuel cell electric vehicles which showed superior performance characteristics compared with the conventional R-134a-based air conditioning system. The developed system presented cooling capacity of 6.4 kW and coefficient of performance of 2.5 [24]. Lee et al. have proposed R744-based heat pump system with stack coolant heat source to reduce the power consumption and improve the driving range of fuel cell electric vehicles in cold climatic conditions. The proposed system showed heating capacity of 5 kW for coolant flow rate of 5 L/min and ambient temperature of −20 °C [25]. Shi et al. have presented the experimental study to analyze the performance of economized vapor injection heat pump system with R32 refrigerant. The effect of injection pressure on heat capacity and power consumption of system was analyzed. The economized vapor injection heat pump system with R32 refrigerant shows better performance than that with R410A refrigerant [26].
From the conducted literature review, the issues associated with the efficient performance of heat pump system of electric vehicle need to be addressed in future for full commercialization of electric vehicles. To improve the performance of heat pump systems of light-duty commercial vehicles, an additional high-pressure side chiller is installed at the discharge end of the electric compressor. The main objective of the present work is to experimentally investigate the cooling and heating performance characteristics of the heat pump system with a high-pressure side chiller for light-duty commercial electric vehicle under the real road driving conditions.
2. Experimental Method
The experimental set-up of the heat pump system with a high-pressure side chiller is shown in Figure 1. In order to get the heat from the highest temperature condition and give it to the coolant, the developed chiller was installed at the discharge side of the compressor, hence it is called the high-pressure side chiller. The experimental set-up mainly comprised of electric compressor, condenser, evaporator, expansion device, chiller and heater core. The specifications of the primary components of the experimental set-up is presented in Table 1. The experimental set-up had three fluid circulation loops, namely the refrigerant circulation loop, coolant circulation loop and air circulation loop. To control the ambient conditions for the experiments, the experimental set-up was housed inside a psychometric calorimeter which consisted of a cooling coil, heating coil and humidifier and was controlled using a PID controller. Using this facility, the experimental test conditions were set to a temperature of 120 °C and pressure of 2500 kPa. The scroll-type electric compressor was driven using a compressor driver at a specific frequency and current. The power input measured by a power meter and current were used to evaluate the compressor work. The refrigerant loop comprised an electric compressor, chiller, condenser, expansion valve and evaporator, while the coolant loop consisted of a chiller, water pump and receiver tank. The chiller was the additional component in the heat pump system and the common component in the refrigerant loop and coolant loop which was located next to the electric compressor. The high-pressure and high-temperature refrigerant discharges from the electric compressor transferred the heat to the coolant in the chiller. The coolant, which carried the heat from the refrigerant, circulated in the coolant loop and transferred the heat to the air in heater core. The heated air in the heater core passed through the cabin of the electric vehicle for the heating purposes. To measure the flow rates of the refrigerant and coolant, a mass flow meter and coolant flow rate meter were installed in the refrigerant loop and coolant loop, respectively. The refrigerant loop consisted of auxiliary components, namely, an accumulator, electronic expansion valve with driver and three-way valve. The temperatures and pressures of the refrigerant and coolant were measured using temperature and pressure sensors which were installed at the inlet and outlet of the electric compressor, chiller, condenser, evaporator, heater core, electronic expansion valve and accumulator. The measured temperature and pressure data were monitored in a data logger and recorded in a computer. The range and accuracy of each instrument is presented in Table 2.
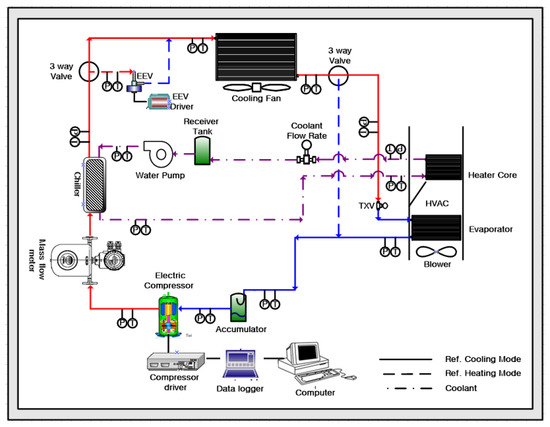
Figure 1.
Experimental set-up of the heat pump system with a high-pressure side chiller.

Table 1.
The specifications of primary components of the experimental set-up.

Table 2.
Range and accuracy of each instrument.
The experiments were performed in two modes, namely, cooling mode and heating mode. In cooling mode, the inlet air conditions to HVAC were set to temperature of 25 °C, relative humidity of 60% and flow rate of 450 m3/h, the compressor speed was varied from 4000 rpm to 6000 rpm, the coolant inlet temperature was varied from 35 °C to 55 °C and the coolant volume flow rate was varied from 10 L/min to 20 L/min to evaluate the performance of heat pump system with a high-pressure side chiller. In the heating mode, the ambient air temperature and air temperature were set to −6.7 °C, air volume was fixed to 300 m3/h, coolant flow rate was set to 10 L/min, air velocity was varied from 3 m/s to 5 m/s, compressor speed was varied from 2000 rpm to 6000 rpm and the coolant temperature was varied from −6.7 °C to 50 °C to evaluate the performance of the heat pump system with a high-pressure side chiller.
3. Uncertainty Analysis and Data Reduction
3.1. Uncertainty Analysis
The measured values of various parameters deviated from their actual values. The deviation between the measured value and the actual value of any parameter is termed as uncertainty associated with that parameter [27]. The accuracies of measuring instruments and errors during the measurements are the primary reasons for the uncertainties in various measuring and manipulating parameters [28]. The uncertainty analysis was conducted to assure the accuracy and reliability of the experimental data associated to the heat pump system with a high-pressure side chiller. The temperature, pressure, humidity, flow rate, air velocity and compressor speed were the measuring parameters during the experiments on the heat pump system with a high-pressure side chiller. The accuracies of the measuring instruments for various measuring parameters were the uncertainties associated with them, whereas the cooling capacity, coefficient of performance, chiller heat transfer rate, compressor power consumption, system efficiency and heater core performance were the performance (manipulating) parameters which were deducted from the experimental data of measuring parameters. The uncertainties in the performance parameters were evaluated using the concept of linearized fractional approximation which was proposed by Holman and Gajda [27,28]. Using this concept, the uncertainties in various performance (dependent) parameters due to uncertainties of various measuring (independent) parameters are evaluated by Equation (1) [29,30].
where, , , ,… are the independent parameters, is the dependent parameter, , , , … are the uncertainties associated with independent parameters and is the total uncertainty associated with dependent parameter.
The uncertainties associated with measuring parameters, temperature, pressure, humidity, coolant flow rate and air flow rate were 2.2%, 0.2%, 0.2%, 0.7% and 2.0%, respectively. Whereas, the uncertainties associated with performance (manipulating) parameters, cooling capacity, coefficient of performance, chiller heat transfer rate, compressor power consumption and heater core performance were 3.02%, 3.06%, 0.60%, 0.38% and 5.08%, respectively.
3.2. Data Reduction
Based on the measured data, the refrigerant-side heat transfer rate of the chiller was calculated by Equation (2) using the refrigerant enthalpy method (ASHRAE Standard 116, 1983). The air-side heat transfer rate is calculated by Equation (3) using both the air flow rate and enthalpy difference. The compressor power consumption was calculated using voltage and current values as expressed by Equation (4). The coefficient of performance (COP) of the tested system was calculated by Equation (5) using the compressor power consumed by compressor work. The heat transfer rate of coolant in the chiller was calculated based on its volume flow rate, density, temperature gain and specific heat capacity of coolant, as presented by Equation (6). The pressure ratio in cooling and heating modes was calculated using Equation (7) as the ratio of high pressure to low pressure.
where, is the refrigerant side heat transfer rate of chiller (kW), is mass flow rate of refrigerant (kg/s), is the enthalpy difference for refrigerant (kJ/kg), is the air side heat transfer rate (kW), is the mass flow rate of air (kg/s), is the enthalpy difference for air (kJ/kg), is the compressor work (kW), is voltage (v), is current (A), is the coefficient of performance of the tested system, is coolant heat transfer rate in chiller, is volume flow rate of coolant (L/min), is density of coolant (kg/m3), is specific heat capacity of coolant (kJ/kg·K), is coolant inlet temperature (°C), is coolant outlet temperature (°C), and and are high pressure (MPa) and low pressure (MPa).
4. Results and Discussion
The experimental behaviors of cooling and heating performance characteristics of the heat pump system with a high-pressure side chiller under various realistic conditions are elaborated in this section.
4.1. Performance of Heat Pump System with a High-Pressure Side Chiller in Cooling Mode
This section explains the performance characteristics of the heat pump system with a high-pressure side chiller, namely, cooling capacity, compressor work, coefficient of performance and pressure characteristics for various compressor speeds, coolant inlet temperatures and coolant volume flow rates in cooling mode.
4.1.1. Cooling Capacity, Compressor Work and COP at Various Compressor Speeds
The effect of compressor speed on cooling capacity, compressor work and coefficient of performance (COP) of the heat pump system with a high-pressure side chiller during the cooling mode is shown in Figure 2a. The variation of cooling capacity, compressor work and coefficient of performance with compressor speed were experimentally recorded at HVAC inlet air conditions of temperature of 25 °C, relative humidity of 60% and flow rate of 450 m3/h, air velocity of 3 m/s and coolant inlet conditions of 35 °C and volume flow rate of 10 L/min. As presented in Figure 2a, the cooling capacity increased from 3.8 kW to 4.7 kW with the rise in the compressor speed from 4000 rpm to 6000 rpm. The cooling capacity increased with compressor speed due to the increase in refrigerant flow rate [31]. The cooling capacity increased from 3.8 kW to 4.4 kW with an enhancement of 15.8% for the increase in the compressor speed from 4000 rpm to 5000 rpm. However, the cooling capacity increased from 4.4 kW to 4.7 kW with an enhancement of 6.82% for the increase in the compressor speed from 5000 rpm to 6000 rpm. Beyond the compressor speed of 5000 rpm, the increase in the cooling capacity reduced due to the rapid rise in the pressure ratio [31]. The rise in the pressure ratio affected the cycle capacity by increasing the degree of superheat associated with vapor refrigerant discharges from compressor and reducing the degree of subcooling of liquid refrigerant discharges from the condenser. In addition, the pressure ratio affected the compressor work. As presented in Figure 2a, the compressor work also increased with the increase in compressor speed. With the increase in the compressor speed from 4000 rpm to 5000 rpm, the compressor work increased from 1.07 kW to 1.37 kW with an enhancement of 28.0%. The compressor work increased from 1.37 kW to 1.71 kW with an enhancement of 24.8% for the increase in the compressor speed from 5000 rpm to 6000 rpm. Unlike cooling capacity, the percentage enhancement in compressor work was not reduced drastically with the rise in compressor speed. The variations of cooling capacity and compressor work with various compressor speeds affected the coefficient of performance. The coefficient of performance is the ratio of cooling capacity to compressor work. With the increase in the compressor speed, the percentage enhancement in the cooling capacity decreased drastically but the percentage enhancement in compressor work was not decreased drastically. Therefore, the coefficient of performance decreased with the increase in the compressor speed as shown in Figure 2a. With the increase in the compressor speed from 4000 rpm to 5000 rpm, the coefficient of performance decreased from 3.54 to 3.21 with a reduction of 9.32%, whereas, the coefficient of performance decreased from 3.21 to 2.75 with a reduction of 14.3% for the increase in the compressor speed from 5000 rpm to 6000 rpm. The percentage reduction in the coefficient of performance increased beyond a compressor speed of 5000 rpm due to characteristic variations of cooling capacity and compressor work with compressor speed, as presented in Figure 2a. The working of the heat pump system with a high-pressure side chiller for various compressor speeds is shown on a P-h diagram in Figure 2b. With respect to the P-h diagram for the refrigeration cycle, as compressor speed increased, low-side pressure decreased to under 2 bar. However, high-side pressure was stable due to similar coolant conditions to be supplied. The portion of heat transfer rate between a refrigerant and a coolant at the developed chiller showed about one-third of the condensing heat capacity along with compressor speed.
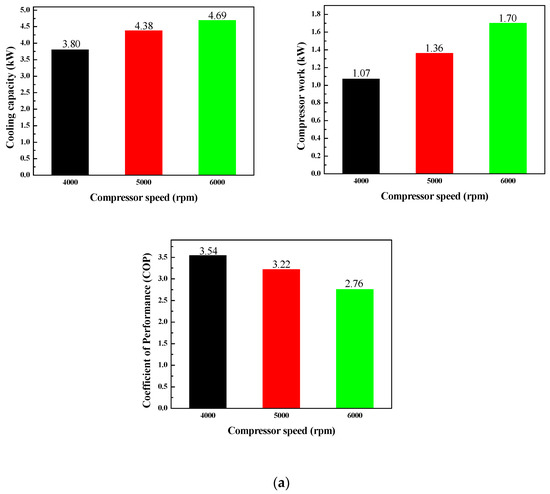
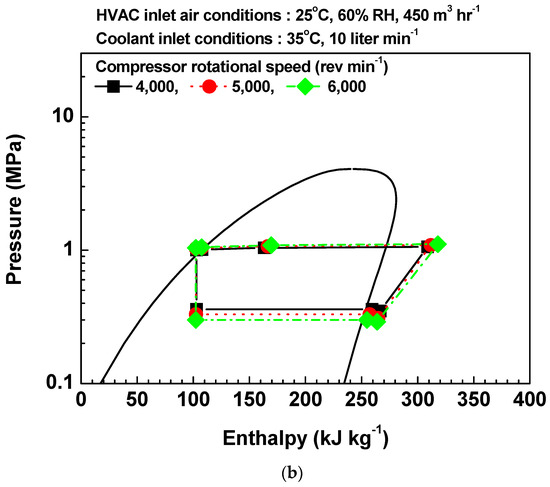
Figure 2.
Effect of compressor speed on (a) cooling capacity, compressor work and coefficient of performance (COP) and (b) P-h diagram of heat pump system with chiller during the cooling mode.
4.1.2. Cooling Capacity, Compressor Work and COP at Various Coolant Inlet Temperatures
The variation of cooling capacity, compressor work and coefficient of performance of heat pump system with a high-pressure side chiller for various coolant inlet temperatures during the cooling mode is presented in Figure 3a. The behaviors of cooling capacity, compressor work and coefficient of performance for various coolant inlet temperatures were experimentally recorded at the HVAC inlet air conditions of temperature of 25 °C, relative humidity of 60% and flow rate of 450 m3/h, air velocity of 3 m/s, coolant volume flow rate of 10 L/min and compressor speed of 5000 rpm. The coolant inlet temperature had very little effect on the cooling capacity. As shown in Figure 3a, with the increase in the coolant inlet temperature from 35 °C to 45 °C, the cooling capacity remained constant at 4.15 kW, whereas, with an increase in the coolant inlet temperature from 45 °C to 55 °C, the cooling capacity decreased from 4.15 kW to 4.06 kW, a reduction of 2.2%. With the increase in the coolant inlet temperature, the compressor work increased because of the increase in the high-pressure side of the compressor. The compressor work increased from 1.36 kW to 1.58 kW with an enhancement of 16.2% for the increase in the coolant inlet temperature from 35 °C to 45 °C. However, with the increase in the coolant inlet temperature from 45 °C to 55 °C, the compressor work increased from 1.58 kW to 1.67 kW, an enhancement of 5.70%. With an increase in the coolant inlet temperature, the percentage enhancement in the compressor decreased as shown in Figure 3a. The coefficient of performance varied with coolant inlet temperature due to variations in cooling capacity and compressor work with coolant inlet temperature. As shown in Figure 3a, the coefficient of performance decreased with the increase in the coolant inlet temperature because the cooling capacity was not affected much, and compressor work increased with coolant inlet temperature. Because of the characteristic variation of cooling capacity and compressor work presented in Figure 3a, the coefficient of performance decreased from 3.06 to 2.64 with a reduction of 13.7% for the increase in the coolant inlet temperature from 35 °C to 45 °C, while it decreased from 2.64 to 2.43, a reduction of 7.95%, for the increase in the coolant inlet temperature from 45 °C to 55 °C. The refrigeration cycle of the heat pump system with a high-pressure side chiller for various coolant inlet temperatures on the P-h diagram is shown in Figure 3b. High-side pressure increased with coolant inlet temperature in order to have certain temperature difference. The proportion of the heat transfer rate in the developed chiller with the increase in coolant temperature varied from one quarter to three-quarters of the total condensing heat capacity due to heat transfer potential, such as temperature difference among fluids.
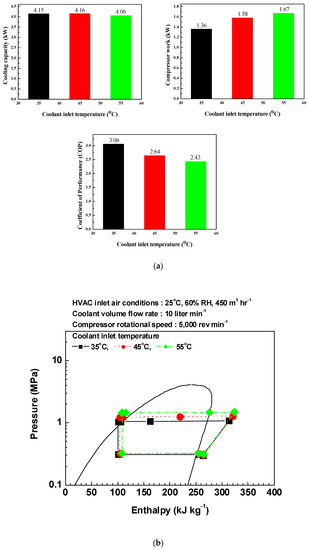
Figure 3.
Effect of coolant inlet temperature on (a) cooling capacity, compressor work and coefficient of performance (COP) and (b) P-h diagram of heat pump system with chiller during the cooling mode.
4.1.3. Cooling Capacity, Compressor Work and COP at Various Coolant Volume Flow Rates
The behaviors of cooling capacity, compressor work and coefficient of performance of heat pump system with a high-pressure side chiller for various coolant volume flow rates during the cooling mode is presented in Figure 4a. The variations of cooling capacity, compressor work and coefficient of performance with coolant volume flow rate were experimentally recorded for HVAC inlet air conditions of a temperature of 25 °C, relative humidity of 60%, flow rate of 450 m3/h, air velocity of 3 m/s, coolant inlet conditions of 35 °C and compressor speed of 5000 rpm. The coolant volume flow rate had no significant effect on the cooling capacity as shown in Figure 4a. With increase in the coolant volume flow rate from 10 L/min to 15 L/min, the cooling capacity reduced by 1.47% from 4.09 W to 4.03 W, whereas the cooling capacity remained constant at 4.03 W when the coolant volume flow rate increased from 15 L/min to 20 L/min. The compressor work decreased with the increase in the coolant volume flow rate due to the fall in the high-pressure side of the compressor. However, the decrease in the compressor work with coolant volume flow rate was not significant as shown in Figure 4a. The compressor work decreased from 1.33 kW to 1.3 kW with a reduction of 2.26% for the increase in coolant volume flow rate from 10 L/min to 15 L/min. With the increase in the coolant volume flow rate from 15 L/min to 20 L/min, the compressor work decreased by 1.54% from 1.3 kW to 1.28 kW. Due to variations in the cooling capacity and compressor work with coolant volume flow rate, the coefficient of performance also showed variation with coolant volume flow rate. As shown in Figure 4a, the effect of coolant volume flow rate on coefficient of performance was less because of less effect of coolant volume flow rate on cooling capacity and compressor work. Due to characteristic behaviors of cooling capacity and compressor work with coolant volume flow rate, as presented in Figure 4a, the coefficient of performance increased from 3.08 to 3.1 with an enhancement of 0.65% for the increase in the coolant volume flow rate from 10 L/min to 15 L/min, whereas, when coolant volume flow rate increased from 15 L/min to 20 L/min, the coefficient of performance increased by 1.29% from 3.1 to 3.14. Figure 4b presents the P-h diagram for the refrigeration cycle of the heat pump system with a high-pressure side chiller with various coolant volume flow rates. The working of this refrigeration cycle on the P-h diagram for various coolant volume flow rates was similar to that explained for the refrigeration cycle on the P-h diagram for various compressor speeds.
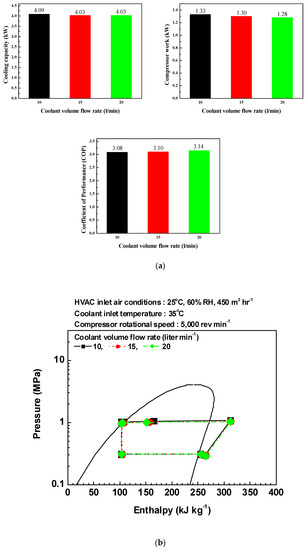
Figure 4.
Effect of coolant volume flow rate on (a) cooling capacity, compressor work and coefficient of performance (COP) and (b) P-h diagram of heat pump system with chiller during the cooling mode.
4.1.4. Pressure Characteristics
The pressure ratio between low and high pressure of refrigeration system affected compressor power consumption. The behaviors of pressure ratio of tested system with high-pressure side chiller for various operating conditions during the cooling mode is presented in Figure 5. The variations of pressure ratio with coolant operating conditions and compressor speed were experimentally recorded for HVAC inlet air conditions of temperature of 25 °C, relative humidity of 60%, flow rate of 450 m3/h, and air velocity of 3 m/s. At coolant inlet conditions of 35 °C and 10 L/min, the compressor speed varied from 3000 rpm to 5000 rpm and pressure ratio was analyzed. With the increase in the compressor speed from 3000 rpm to 5000 rpm, the low pressure decreased; however, the high pressure remained constant in the range of 1100 kPa because the coolant and ambient conditions remained constant. As an effect of this the pressure ratio which is defined as the ratio of high pressure to low pressure, increased with the increase in the compressor speed. Pressure ratio increased by 26.8% from 3.05 to 3.87 with the increase in the compressor speed from 3000 rpm to 5000 rpm, as shown in Figure 5a. This was the reason behind the increase in the compressor power consumption as depicted Figure 2a. In the case when the coolant temperature increased from 35 °C to 55 °C, the low pressure remained constant, whereas the high pressure increased up to 1500 kPa. Therefore, the pressure ratio increased with the increase in the coolant temperature. The pressure ratio increased by 35.0% from 3.6 to 4.87 with the increase in the coolant temperature from 35 °C to 55 °C, as shown in Figure 5b. The effect of coolant temperature on the pressure ratio caused an increase in the compressor power consumption with an increase in the coolant temperature as shown in Figure 3a. However, the pressure ratio affected little with the variation of coolant volume flow rate from 10 L/min to 20 L/min because of the same operating conditions of coolant temperature and compressor speed.
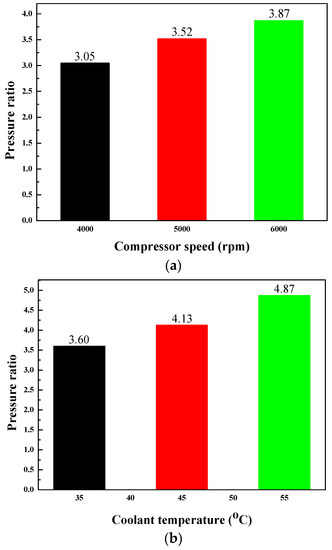
Figure 5.
Pressure ratio characteristics with (a) compressor speed and (b) coolant temperature in cooling mode.
4.2. Performance of Heat Pump System with Higher Pressure Side Chiller in Heating Mode
This section elaborates the performance characteristics of the heat pump system with a high-pressure side chiller, namely, heat dissipation, chiller heat transfer rate, compressor power consumption, system efficiency, heater core performance and pressure characteristics for the steady state conditions of various compressor speeds, coolant temperatures and air velocities in heating mode. In addition, a brief discussion about the transient behavior of heat pump system with a high-pressure side chiller under heating mode is presented in this section.
4.2.1. Heat Dissipation at Various Air Velocities
The heat dissipation performance of the outdoor heat exchanger (condenser) of the heat pump system with a high-pressure side chiller for various air velocities is presented in Figure 6. The performance of the heat exchanger with air velocity was experimentally evaluated at the inlet temperature of 80 °C, inlet pressure of 1600 kPa, inlet SH of 25 and outlet SC of 8. With the increase in the air velocity, the mass flow rate of air increased, hence the air carried more heat from the outdoor heat exchanger, which resulted in the increase in the heat dissipation of the outdoor heat exchanger [11]. The heat dissipation of the outdoor heat exchanger increased linearly with the increase in the air velocity, as shown in Figure 6. The heat dissipation of the outdoor heat exchanger increased by 19% from 9.3 kW to 11.1 kW with the increase in the air velocity from 3 m/s to 4 m/s, whereas the heat dissipation increased by 13.7% from 11.1 W to 12.6 kW when the air velocity increased from 4 m/s to 5 m/s.
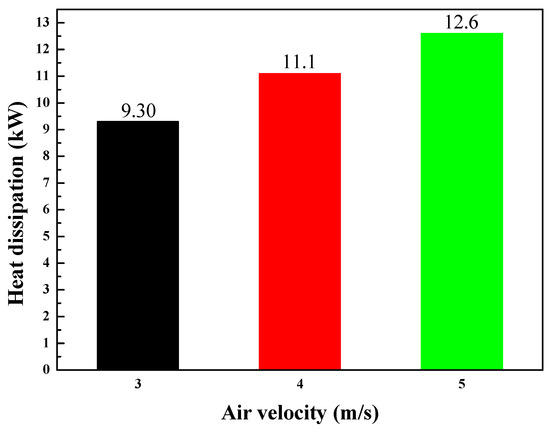
Figure 6.
Heat dissipation performance of the outdoor heat exchanger (condenser) of heat pump system with chiller for various air velocities.
4.2.2. Chiller Heat Transfer Rate at Various Compressor Speeds and Coolant Temperatures
The effect of compressor speed and coolant temperature on the heat transfer rate of chiller is presented in Figure 7. Chiller heat transfer rate for various compressor speeds and coolant temperatures was experimentally recorded for ambient and air temperatures of −6.7 °C, air volume flow rate of 300 m3/h, coolant flow rate of 10 L/min, and maximum temperature and maximum pressure of 120 °C and 2500 kPa. The chiller heat transfer rate increased with the increase in the compressor speed from 2000 rpm to 6000 rpm for the coolant temperatures of −6.7 °C, 10 °C, 20 °C, 30 °C, 40 °C and 50 °C. However, the chiller heat transfer rate increased for the increase in the compressor speed from 2000 rpm to 4000 rpm and reduced with the increase in the compressor speed from 4000 rpm to 6000 rpm for the coolant temperature of 0 °C. The compressor speed range became narrow with the increase in the coolant temperature to present the variation of chiller heat transfer rate. The variation of the chiller heat transfer rate is presented over the compressor speed range of 2000 rpm to 6000 rpm for coolant temperatures of−6.7 °C and 0 °C, that of 2000 rpm to 5000 rpm for the coolant temperatures of 10 °C, 20 °C and 30 °C and that of 2000 rpm to 4000 rpm for the coolant temperatures of 40 °C and 50 °C. With the increase in the compressor speed, the percentage increase in the chiller heat transfer rate decreased for coolant temperatures of −6.7 °C, 10 °C, 20 °C, 30 °C, 40 °C and 50 °C. The chiller heat transfer rate increased by 11.4%, 55.6%, 40.7%, 70.6%, 54.0% and 55.0% for the coolant temperatures of −6.7 °C, 10 °C, 20 °C, 30 °C, 40 °C and 50 °C, respectively with the increase in the compressor speed from 2000 rpm to 3000 rpm. The chiller heat transfer rate increased by 11.7%, 20.6%, 16.2%, 17.8%, 21.9% and 22.6% for the coolant temperatures of −6.7 °C, 10 °C, 20 °C, 30 °C, 40 °C and 50 °C, respectively, with the increase in the compressor speed from 3000 rpm to 4000 rpm. The chiller heat transfer rate increased by 11.6%, 1.56%, 7.29% and 11.0% for the coolant temperatures of −6.7 °C, 10 °C, 20 °C and 30 °C, respectively, with the increase in the compressor speed from 4000 rpm to 5000 rpm. Finally, the chiller heat transfer rate increased by 1.83% for the coolant temperatures of −6.7 °C with an increase in the compressor speed from 4000 rpm to 5000 rpm. In the case of the coolant temperature of 0 °C, when the compressor speed increased from 2000 rpm to 3000 rpm and 3000 rpm to 4000 rpm correspondingly, the chiller heat transfer rate increased by 21.6% and 11.4%, whereas the chiller heat transfer rate decreased by 2.90% and 3.20% with the increase in the compressor speed from 4000 rpm to 5000 rpm and 5000 rpm to 6000 rpm, respectively. The maximum chiller heat transfer rates of 4.91 kW, 4.73 kW, 3.83 kW, 3.84 kW, 3.37 kW and 3.05 kW were experimentally evaluated for the coolant temperatures of −6.7 °C, 10 °C, 20 °C, 30 °C, 40 °C and 50 °C, respectively at the highest compressor speeds of respective ranges, whereas the maximum chiller heat transfer rate of 3.50 W was experimentally evaluated at the middle of compressor speed range for a coolant temperature of 0 °C.
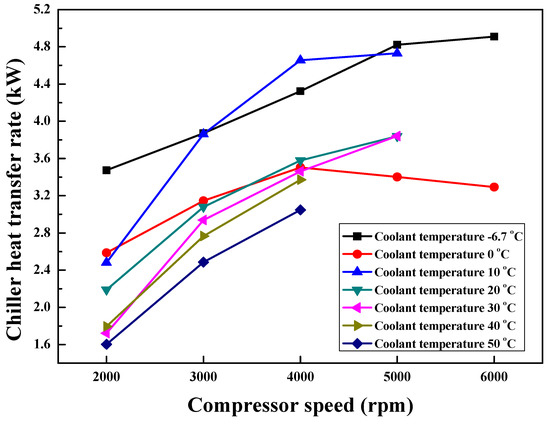
Figure 7.
Effect of compressor speed and coolant temperature on heat transfer rate of chiller.
4.2.3. Compressor Power Consumption at Various Compressor Speeds and Coolant Temperatures
The behavior of compressor power consumption for coolant temperatures of −6.7 °C, 0 °C, 10 °C, 20 °C, 30 °C, 40 °C and 50 °C and compressor speeds of 2000 rpm, 3000 rpm, 4000 rpm, 5000 rpm and 6000 rpm is presented in Figure 8. The behavior of compressor power consumption for various compressor speeds and coolant temperatures were experimentally evaluated for ambient and air temperatures of −6.7 °C, air volume flow rate of 300 m3/h, coolant flow rate of 10 L/min, maximum temperature of 120 °C and maximum pressure of 2500 kPa. For each coolant temperature, compressor power consumption increased with the increase in the compressor speed. In addition, the percentage increase in the compressor power consumption decreased with the increase in the compressor speed for each coolant temperature except 40 °C. The variation range of compressor power consumption with compressor speed decreased as the coolant temperature increased from −6.7 °C to 50 °C. The variation of compressor power consumption is presented over the compressor speed range of 2000 rpm to 6000 rpm for coolant temperatures of −6.7 °C and 0 °C. For coolant temperatures of 10 °C, 20 °C and 30 °C, the variation of compressor power consumption is presented over the compressor speed range of 2000 rpm to 5000 rpm. The variation of compressor power consumption is presented over the compressor speed range of 2000 rpm to 4000 rpm for coolant temperatures of 40 °C and 50 °C. The compressor power consumption increased by 76.3%, 64.2%, 76.5%, 51.8%, 44.0%, 35.7% and 35.7% for coolant temperatures of −6.7 °C, 0 °C, 10 °C, 20 °C, 30 °C, 40 °C and 50 °C, respectively, when the compressor speed increased from 2000 rpm to 3000 rpm. The compressor power consumption increased by 33.2%, 29.7%, 35.5%, 36.5%, 26.7%, 43.3% and 22.8% for coolant temperatures of −6.7 °C, 0 °C, 10 °C, 20 °C, 30 °C, 40 °C and 50 °C, respectively, when the compressor speed increased from 3000 rpm to 4000 rpm. The compressor power consumption increased by 21.6%, 17.4%, 22.8%, 19.7% and 18.1% for coolant temperatures of −6.7 °C, 0 °C, 10 °C, 20 °C and 30 °C, respectively, when the compressor speed increased from 4000 rpm to 5000 rpm. The compressor power consumption increased by 11.1% and 5.30% for coolant temperatures of −6.7 °C and 0 °C, respectively when the compressor speed increased from 5000 rpm to 6000 rpm. The minimum compressor power consumption of 0.48 kW, 0.44 kW, 0.60 kW, 0.70 kW, 0.86 kW, 0.95 kW and 1.05 kW were experimentally evaluated at the coolant temperatures of −6.7 °C, 0 °C, 10 °C, 20 °C, 30 °C, 40 °C and 50 °C, respectively, for a compressor speed of 2000 rpm. The maximum compressor power consumption of 1.51 kW and 1.16 kW were evaluated at the coolant temperatures of −6.7 °C and 0 °C, respectively, for compressor speed of 6000 rpm. For coolant temperatures of 10 °C, 20 °C and 30 °C, the maximum compressor power consumptions were evaluated as 1.77 kW, 1.75 kW and 1.85 kW, respectively, at the compressor speed of 5000 rpm. The maximum compressor power consumptions of 1.84 kW and 1.75 kW were evaluated at the coolant temperatures of 40 °C and 50 °C, respectively, for compressor speed of 4000 rpm.
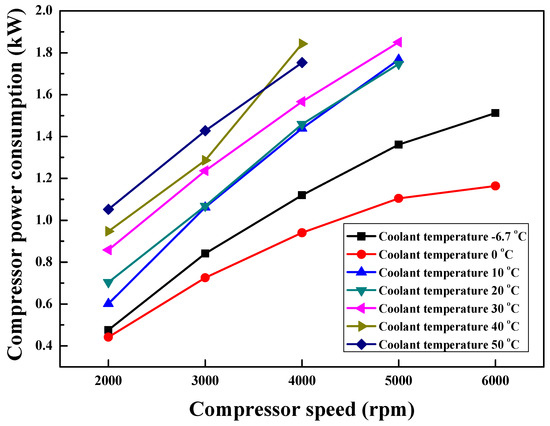
Figure 8.
Behavior of compressor power consumption for coolant temperatures of −6.7 °C, 0 °C, 10 °C, 20 °C, 30 °C, 40 °C and 50 °C and compressor speeds of 2000 rpm, 3000 rpm, 4000 rpm, 5000 rpm and 6000 rpm.
4.2.4. System Efficiency at Various Compressor Speeds and Coolant Temperatures
The variation of system efficiency for compressor speed range of 2000 rpm to 6000 rpm and coolant temperature range of −6.7 °C to 50 °C is shown in Figure 9. The variation of system efficiency with compressor speed and coolant temperature was experimentally evaluated at ambient and air temperatures of −6.7 °C, maximum temperature of 120 °C, maximum pressure of 2500 kPa, air volume flow rate of 300 m3/h and coolant flow rate of 10 L/min. The compressor speed range became narrow for the variation of system efficiency as the coolant temperature increased. The variation of system efficiency is presented over the compressor speed range of 2000 rpm to 6000 rpm for the coolant temperatures of −6.7 °C and 0 °C, that of 2000 rpm to 5000 rpm for coolant temperatures of 10 °C, 20 °C and 30 °C and that of 2000 rpm to 4000 rpm for coolant temperatures of 40 °C and 50 °C. For coolant temperatures of −6.7 °C, 0 °C, 10 °C and 20 °C, the system efficiency decreased with the increase in the compressor speed, whereas, for the coolant temperatures of 30 °C, 40 °C and 50 °C, the system efficiency increased, reached maximum value at compressor speed of 3000 rpm and decreased with further increase in the compressor speed. The system efficiency decreased by 35.5%, 25.5%, 10.8% and 7.51% for the coolant temperatures of −6.7 °C, 0 °C, 10 °C and 20 °C, respectively, and increased by 16.0%, 14.9% and 15.3% for the coolant temperatures of 30 °C, 40 °C and 50 °C, respectively, with the increase in the compressor speed from 2000 rpm to 3000 rpm. The system efficiency decreased by 16.2%, 15.6%, 11.2%, 15.4%, 6.34%, 15.5% and 1.49% with the increase in compressor speed from 3000 rpm to 4000 rpm for the coolant temperatures of −6.7 °C, 0 °C, 10 °C, 20 °C, 30 °C, 40 °C and 50 °C, respectively. The system efficiency decreased by 8.63%, 17.4%, 17.6%, 11.3% and 6.62% with the increase in compressor speed from 4000 rpm to 5000 rpm for the coolant temperatures of −6.7 °C, 0 °C, 10 °C, 20 °C and 30 °C, respectively. The system efficiency decreased by 7.72% and 8.82% with the increase in the compressor speed from 5000 rpm to 6000 rpm for the coolant temperatures of −6.7 °C and 0 °C, respectively. The system efficiency decreased as the coolant temperature increased from −6.7 °C to 50 °C for the same compressor speed. The coolant temperature of −6.7 °C showed the maximum system efficiency for the same compressor speed. The maximum system efficiencies of 7.21%, 5.81%, 4.08% and 3.08% were experimentally evaluated at the compressor speed of 2000 rpm for the coolant temperatures of −6.7 °C, 0 °C, 10 °C and 20 °C, respectively, whereas the maximum system efficiencies of 2.37%, 2.17% and 1.76% were experimentally evaluated at the compressor speed of 3000 rpm for the coolant temperatures of 30 °C, 40 °C and 50 °C, respectively.
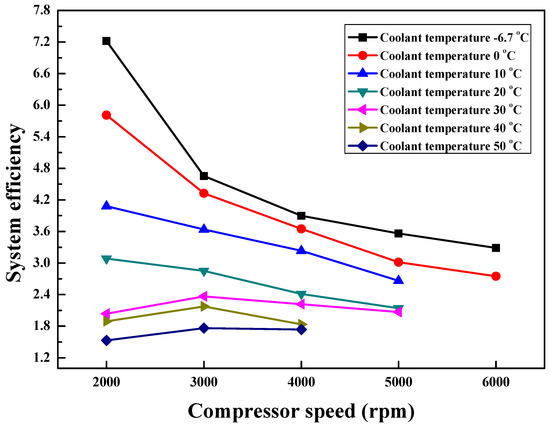
Figure 9.
Variation of system efficiency for compressor speed range of 2000 rpm to 6000 rpm and coolant temperature range of −6.7 °C to 50 °C.
4.2.5. Heater Core Performance at Various Compressor Speeds and Coolant Temperatures
The variation of heater core performance for various compressor speeds and coolant temperatures is shown in Figure 10. The variation is presented at the ambient and air temperatures of −6.7 °C, air volume flow rate of 300 m3/h, coolant flow rate of 10 L/min, maximum temperature of 120 °C and maximum pressure of 2500 kPa. As the coolant temperature increased from −6.7 °C to 50 °C, the compressor speed range of 2000 rpm to 6000 rpm decreased for the variation of heater core performance. The heater core performance was evaluated at the maximum compressor speed of 6000 rpm for coolant temperatures of −6.7 °C and 0 °C, that of 5000 rpm for coolant temperatures of 10 °C, 20 °C and 30 °C and that of 4000 rpm for coolant temperatures of 40 °C and 50 °C. With the increase in the compressor speed, the heater core performance increased for the coolant temperatures of −6.7 °C, 10 °C, 20 °C, 30 °C, 40 °C and 50 °C, whereas, for the coolant temperature of 0 °C the heater core performance showed parabolic variation with compressor speed. With the increase in the compressor speed from 2000 rpm to 3000 rpm, the heater core performance increased by 230%, 15.4%, 12.0%, 10.6%, 6.03%, 2.38% and 2.43% for the coolant temperatures of −6.7 °C, 0 °C, 10 °C, 20 °C, 30 °C, 40 °C and 50 °C, respectively. With the increase in the compressor speed from 3000 rpm to 4000 rpm, the heater core performance enhanced by 35.4%, 7.34%, 5.62%, 4.38%, 1.60%, 2.98% and 0.98% for the coolant temperatures of −6.7 °C, 0 °C, 10 °C, 20 °C, 30 °C, 40 °C and 50 °C, respectively. The heater performance enhanced by 28.0%, 1.95%, 2.36%, 1.52% and 2.43% for the coolant temperatures of −6.7 °C, 0 °C, 10 °C, 20 °C and 30 °C, respectively, when compressor speed increased from 4000 rpm to 5000 rpm. As the compressor speed increased from 5000 rpm to 6000 rpm, the heater core performance increased by 5.25% for coolant temperature of −6.7 °C and decreased by 5.80% for the coolant temperature of 0 °C. For the same compressor speed, the heater core performance enhanced with the increase in the coolant temperature. The heater core performance showed maximum behavior at the coolant temperature of 50 °C for same compressor speed. The maximum heater core performance of 0.36 kW was evaluated at compressor speed of 6000 rpm for the coolant temperature of −6.7 °C and that of 0.77 W at compressor speed of 5000 rpm for the coolant temperature of 0 °C. For the coolant temperatures of 10 °C, 20 °C and 30 °C, the corresponding maximum heater core performances of 1.85 kW, 2.75 kW and 3.58 kW were evaluated at the compressor speed of 5000 rpm. The maximum heater core performances of 4.35 kW and 4.98 kW were evaluated for coolant temperatures of 40 °C and 50 °C, respectively, at the compressor speed of 4000 rpm.
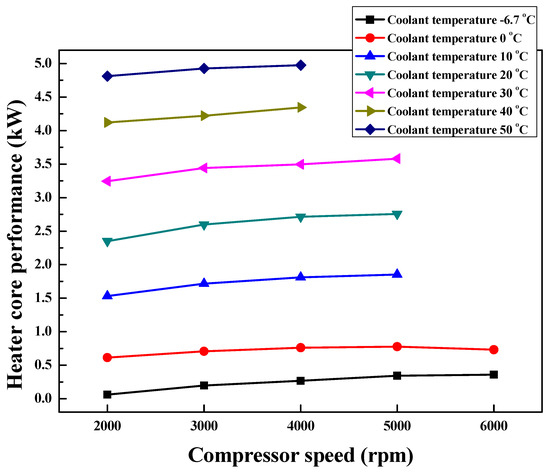
Figure 10.
Variation of heater core performance for various compressor speeds and coolant temperatures.
4.2.6. Performance of Heat Pump System with a High-Pressure Side Chiller in Transient State
The transient performance of heat pump system with a high-pressure side chiller during the heating mode was experimentally evaluated for the ambient and air temperature of −6.7 °C, air volume flow rate of 300 m3/h, coolant temperature and flow rate of −6.7 °C and 10 L/min, and compressor speed range of 3000 rpm to 6000 rpm. The variation in coolant temperature with time for compressor speeds of 3000 rpm, 4000 rpm, 5000 rpm and 6000 rpm is presented in Figure 11. Starting with the coolant temperature of −6.7 °C, for all compressor speeds, coolant temperature increased with time and converged, as shown in Figure 11. The increase in coolant temperature followed a smooth curve for compressor speeds of 3000 rpm, 4000 rpm and 5000 rpm, but, for the compressor speed of 6000 rpm, the increasing coolant temperature curve fluctuated due to experimental or environmental error. However, the curve converged accurately at the same time with other smooth curves. The convergence temperature was higher for a compressor speed of 6000 rpm followed by convergence temperatures corresponding to compressor speeds of 5000 rpm, 4000 rpm and 3000 rpm. However, the convergence temperature was obtained almost at the same time for all compressor speeds. The highest coolant convergence temperature of 22 °C was experimentally evaluated at the compressor speed of 6000 rpm followed by 20 °C, 16 °C and 13 °C at the compressor speeds of 5000 rpm, 4000 rpm and 3000 rpm, respectively. Even when starting with the lower coolant temperature of −6.7 °C, it took a longer time of 1 h 30 min to attain the convergence coolant temperature for all compressor speeds. This meant the time invested in cabin heating was longer for all compressor speeds. With reference to the ambient temperature of −6.7 °C, the temperature differences of 28.7 °C, 26.7 °C, 22.7 °C and 19.7 °C were evaluated at convergence time for compressor speeds of 6000 rpm, 5000 rpm, 4000 rpm and 3000 rpm, respectively.
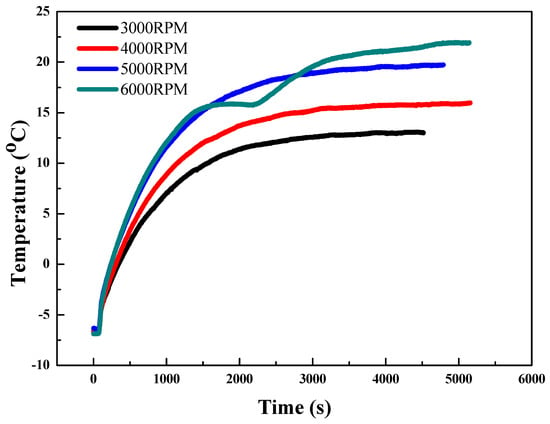
Figure 11.
Variation in coolant temperature with time for compressor speeds of 3000 rpm, 4000 rpm, 5000 rpm and 6000 rpm.
4.2.7. Pressure Characteristics
Pressure ratio in heating mode was analyzed like cooling mode in the tested system, as shown in Figure 12. The variations of pressure ratio with coolant operating conditions and compressor speed were experimentally recorded for HVAC inlet air conditions of temperature of −6.7 °C, air flow rate of 300 m3/h, and coolant flow rate of 10 L/min. In all cases of coolant temperature variation, as the compressor speed increased, pressure ratio had the same trend with cooling mode. However, pressure ratio in heating mode was higher than cooling mode by two to three times. In heating mode, because the tested system was exposed to temperatures under −6.7 °C, low pressure got down to below 100 kPa, similar to vacuum pressure, and high pressure led to applied coolant temperature increases up to 1500 kPa at the coolant temperature of 50 °C. As a result of that, pressure ratio had a wide range from 2.67 to 12.4, which led to the increase of compressor power consumption depicted in Figure 8.
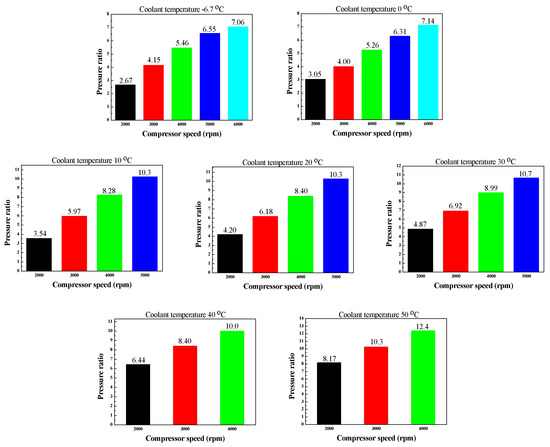
Figure 12.
Pressure ratio characteristics with compressor speed and coolant temperature in heating mode.
5. Conclusions
The cooling and heating performance characteristics of the heat pump system with a high-pressure side chiller are experimentally investigated under real road driving conditions for light-duty commercial electric vehicles. The critical findings from the experimental investigations into the heat pump system with a high-pressure side chiller in cooling and heating modes are summarized as below.
- (a)
- In the cooling mode of heat pump system with a high-pressure side chiller, the system efficiency decreases by 16.4% on an average and the cooling capacity and compressor work enhances by 8.0% and 27.0%, respectively, on average with variation in compressor speed.
- (b)
- In the heating mode, the coolant gets heated by the discharged refrigerant of the electric compressor in the high-pressure side chiller and higher temperature coolant transfers heat to the inlet air of heater core so that the cabin heats up. In the high-pressure side chiller, the heat transfer rate is higher at the lower coolant temperature due to the higher temperature difference between the coolant and the refrigerant and because the coolant could absorb more heat from refrigerant at lower temperatures. However, with respect to the heater core to heat up the cabin because the coolant temperature is relatively low despite heat gain from the refrigerant, heat transfer rate in heater core is quantitatively low. On the contrary, when the coolant temperature is higher than ambient conditions, −6.7 °C, system efficiency of the tested heat pump is decreased due to the increase in compressor power consumption with higher pressure ratio.
- (c)
- In the transient mode, the coolant temperature converges to 22 °C, 20 °C, 16 °C and 13 °C after 1 h 30 min for the compressor speeds of 6000 rpm, 5000 rpm, 4000 rpm and 3000 rpm, respectively. The attained temperature differences are 28.7 °C, 26.7 °C, 22.7 °C and 19.7 °C for 6000 rpm, 5000 rpm, 4000 rpm and 3000 rpm, respectively, at the convergent stage.
Author Contributions
Conceptualization, M.-Y.L.; K.S.G.; H.-B.J. and H.-S.L.; methodology, M.-Y.L.; K.S.G.; H.-B.J. and H.-S.L.; formal analysis, M.-Y.L.; K.S.G.; H.-B.J. and H.-S.L.; investigation, M.-Y.L.; H.-B.J. and H.-S.L.; resources, M.-Y.L.; K.S.G.; H.-B.J. and H.-S.L.; data curation, M.-Y.L. and H.-S.L.; writing—original draft preparation, M.-Y.L.; K.S.G. and H.-S.L.; writing—review and editing, M.-Y.L.; K.S.G. and H.-S.L.; visualization, M.-Y.L. and H.-S.L.; supervision, M.-Y.L. and H.-S.L.; project administration, H.-S.L.; funding acquisition, H.-S.L. All authors have read and agreed to the published version of the manuscript.
Funding
This work was funded by the Ministry of Trade, Industry & Energy(MOTIE), Korea Evaluation Institute of Industrial Technology (KEIT) through the Industrial Technology Innovation Program (20003988, Development of 4 kW heating and cooling modularization technology using waste heat recovery and alternative refrigerant on electric vehicle’s exclusive platform).
Acknowledgments
This work was supported by the Ministry of Trade, Industry & Energy(MOTIE), Korea Institute for Advancement of Technology (KIAT) through the Automobile Parts Cluster Construction Program for the Environment-Friendly Vehicles (P0000760, Development of Integrated Smart Air-Conditioning System for Electric Commercial Vehicles), Korea Evaluation Institute of Industrial Technology(KEIT) through the Industrial Technology Innovation Program (20003988, Development of 4 kW heating and cooling modularization technology using waste heat recovery and alternative refrigerant on electric vehicle’s exclusive platform) and the National Research Foundation of Korea (NRF) grant funded by the Korea government(MSIT) (No. 2020R1A2C1011555).
Conflicts of Interest
The authors declare no conflict of interest.
References
- Lee, M.-Y.; Seo, J.-H.; Lee, H.-S.; Garud, K.S. Power generation, efficiency and thermal stress of thermoelectric module with leg geometry, material, segmentation and two-stage arrangement. Symmetry 2020, 12, 786. [Google Scholar] [CrossRef]
- Kang, B.H.; Lee, H.J. A review of recent research on automotive HVAC systems for EVs. Int. J. Air-Cond. Refrig. 2017, 25, 1730003. [Google Scholar] [CrossRef]
- Qi, Z. Advances on air conditioning and heat pump system in electric vehicles–A review. Renew. Sustain. Energy Rev. 2014, 38, 754–764. [Google Scholar] [CrossRef]
- Torregrosa, B.; Payá, J.; Corberán, J.M. Modelling of mobile airconditioning systems for electric vehicles. In Proceedings of the 4th European Workshop—Mobile Air Conditioning and Vehicle Thermal Systems, Torino, Italy, 1–2 December 2011; pp. 1–2. [Google Scholar]
- Zhang, Z.; Li, W.; Shi, J.; Chen, J. A study on electric vehicle heat pump systems in cold climates. Energies 2016, 9, 881. [Google Scholar] [CrossRef]
- Qin, F.; Zhang, G.; Xue, Q.; Zou, H.; Tian, C. Experimental investigation and theoretical analysis of heat pump systems with two different injection portholes compressors for electric vehicles. Appl. Energy 2017, 185, 2085–2093. [Google Scholar] [CrossRef]
- Qin, F.; Xue, Q.; Zhang, G.; Zou, H.; Tian, C. Experimental investigation on heat pump for electric vehicles with different refrigerant injection compressors. Energy Procedia 2015, 75, 1490–1495. [Google Scholar] [CrossRef][Green Version]
- Qin, F.; Xue, Q.; Velez GM, A.; Zhang, G.; Zou, H.; Tian, C. Experimental investigation on heating performance of heat pump for electric vehicles at −20 °C ambient temperature. Energy Convers. Manag. 2015, 102, 39–49. [Google Scholar] [CrossRef]
- Qin, F.; Shao, S.; Tian, C.; Yang, H. Experimental investigation on heating performance of heat pump for electric vehicles in low ambient temperature. Energy Procedia 2014, 61, 726–729. [Google Scholar] [CrossRef][Green Version]
- Zhou, G.; Li, H.; Liu, E.; Li, B.; Yan, Y.; Chen, T.; Chen, X. Experimental study on combined defrosting performance of heat pump air conditioning system for pure electric vehicle in low temperature. Appl. Therm. Eng. 2017, 116, 677–684. [Google Scholar] [CrossRef]
- Ahn, J.H.; Kang, H.; Lee, H.S.; Jung, H.W.; Baek, C.; Kim, Y. Heating performance characteristics of a dual source heat pump using air and waste heat in electric vehicles. Appl. Energy 2014, 119, 1–9. [Google Scholar] [CrossRef]
- Jung, J.; Jeon, Y.; Lee, H.; Kim, Y. Numerical study of the effects of injection-port design on the heating performance of an R134a heat pump with vapor injection used in electric vehicles. Appl. Therm. Eng. 2017, 127, 800–811. [Google Scholar] [CrossRef]
- Zhang, L.; Hashimoto, K.; Hasegawa, H.; Saikawa, M. Performance analysis of a heat pump system with integrated desiccant for electric vehicles. Int. J. Refrig. 2018, 86, 154–162. [Google Scholar] [CrossRef]
- Choi, Y.U.; Kim, M.S.; Kim, G.T.; Kim, M.; Kim, M.S. Performance analysis of vapor injection heat pump system for electric vehicle in cold startup condition. Int. J. Refrig. 2017, 80, 24–36. [Google Scholar] [CrossRef]
- Lee, D.Y.; Cho, C.W.; Won, J.P.; Park, Y.C.; Lee, M.Y. Performance characteristics of mobile heat pump for a large passenger electric vehicle. Appl. Therm. Eng. 2013, 50, 660–669. [Google Scholar] [CrossRef]
- Kwon, C.; Kim, M.S.; Choi, Y.; Kim, M.S. Performance evaluation of a vapor injection heat pump system for electric vehicles. Int. J. Refrig. 2017, 74, 138–150. [Google Scholar] [CrossRef]
- Liu, C.; Zhang, Y.; Gao, T.; Shi, J.; Chen, J.; Wang, T.; Pan, L. Performance evaluation of propane heat pump system for electric vehicle in cold climate. Int. J. Refrig. 2018, 95, 51–60. [Google Scholar] [CrossRef]
- Li, W.; Liu, R.; Liu, Y.; Wang, D.; Shi, J.; Chen, J. Performance evaluation of R1234yf heat pump system for an electric vehicle in cold climate. Int. J. Refrig. 2020, 115, 117–125. [Google Scholar] [CrossRef]
- Ahn, J.H.; Lee, J.S.; Baek, C.; Kim, Y. Performance improvement of a dehumidifying heat pump using an additional waste heat source in electric vehicles with low occupancy. Energy 2016, 115, 67–75. [Google Scholar] [CrossRef]
- Bellocchi, S.; Guizzi, G.L.; Manno, M.; Salvatori, M.; Zaccagnini, A. Reversible heat pump HVAC system with regenerative heat exchanger for electric vehicles: Analysis of its impact on driving range. Appl. Therm. Eng. 2018, 129, 290–305. [Google Scholar] [CrossRef]
- Lee, H.S.; Lee, M.Y. Steady state and start-up performance characteristics of air source heat pump for cabin heating in an electric passenger vehicle. Int. J. Refrig. 2016, 69, 232–242. [Google Scholar] [CrossRef]
- Li, S.; Wang, S.; Ma, Z.; Jiang, S.; Zhang, T. Using an air cycle heat pump system with a turbocharger to supply heating for full electric vehicles. Int. J. Refrig. 2017, 77, 11–19. [Google Scholar] [CrossRef]
- Cho, C.W.; Lee, H.S.; Won, J.P.; Lee, M.Y. Measurement and evaluation of heating performance of heat pump systems using wasted heat from electric devices for an electric bus. Energies 2012, 5, 658–669. [Google Scholar] [CrossRef]
- Lee, M.Y.; Lee, H.S.; Won, H.P. Characteristic evaluation on the cooling performance of an electrical air conditioning system using R744 for a fuel cell electric vehicle. Energies 2012, 5, 1371–1383. [Google Scholar] [CrossRef]
- Lee, H.S.; Won, J.P.; Cho, C.W.; Kim, Y.C.; Lee, M.Y. Heating performance characteristics of stack coolant source heat pump using R744 for fuel cell electric vehicles. J. Mech. Sci. Technol. 2012, 26, 2065–2071. [Google Scholar] [CrossRef]
- Shi, Y.; Guo, X.; Zhang, X. Study on economized vapor injection heat pump system using refrigerant R32. Int. J. Air-Cond. Refrig. 2016, 24, 1650006. [Google Scholar] [CrossRef]
- Raj, A.K.; Kunal, G.; Srinivas, M.; Jayaraj, S. Performance analysis of a double-pass solar air heater system with asymmetric channel flow passages. J. Therm. Anal. Calorim. 2019, 136, 21–38. [Google Scholar] [CrossRef]
- Arun, K.R.; Kunal, G.; Srinivas, M.; Kumar, C.S.; Mohanraj, M.; Jayaraj, S. Drying of untreated Musa nendra and Momordica charantia in a forced convection solar cabinet dryer with thermal storage. Energy 2020, 192, 116697. [Google Scholar] [CrossRef]
- Garud, K.S.; Seo, J.H.; Cho, C.P.; Lee, M.Y. Artificial Neural Network and Adaptive Neuro-Fuzzy Interface System Modelling to Predict Thermal Performances of Thermoelectric Generator for Waste Heat Recovery. Symmetry 2020, 12, 259. [Google Scholar] [CrossRef]
- Garud, K.S.; Seo, J.H.; Patil, M.S.; Bang, Y.M.; Pyo, Y.D.; Cho, C.P.; Lee, M.Y. Thermal–electrical–structural performances of hot heat exchanger with different internal fins of thermoelectric generator for low power generation application. J. Therm. Anal. Calorim. 2020, 1–33. [Google Scholar] [CrossRef]
- Hamad, A.J.; Khalifa, A.H.N.; Khalaf, D.Z. The Effect of Compressor Speed Variation and Vapor Injection on the Performance of Modified Refrigeration System. Int. Rev. Mech. Eng. IREME 2018, 12, 285–292. [Google Scholar] [CrossRef]
© 2020 by the authors. Licensee MDPI, Basel, Switzerland. This article is an open access article distributed under the terms and conditions of the Creative Commons Attribution (CC BY) license (http://creativecommons.org/licenses/by/4.0/).