Detecting Optimal Leak Locations Using Homotopy Analysis Method for Isothermal Hydrogen-Natural Gas Mixture in an Inclined Pipeline

Abstract
1. Introduction
2. Mathematical Formulation
2.1. Governing Equation
- R: is the specific gas constant.
- T: is temperature.
- : is the specific heat at constant volume.
- : is the specific heat at constant pressure.
- R: is the specific gas constant.
- P: is pressure.
- : is the flow process index.
2.2. Hydrogen-Natural Gas Mixture Equation
3. Homotopy Analysis Method
3.1. Solving the Steady State Equations by High-Order Deformation HAM
3.2. Solving Isothermal Flow of Hydrogen-Natural Gas Mixture by HAM
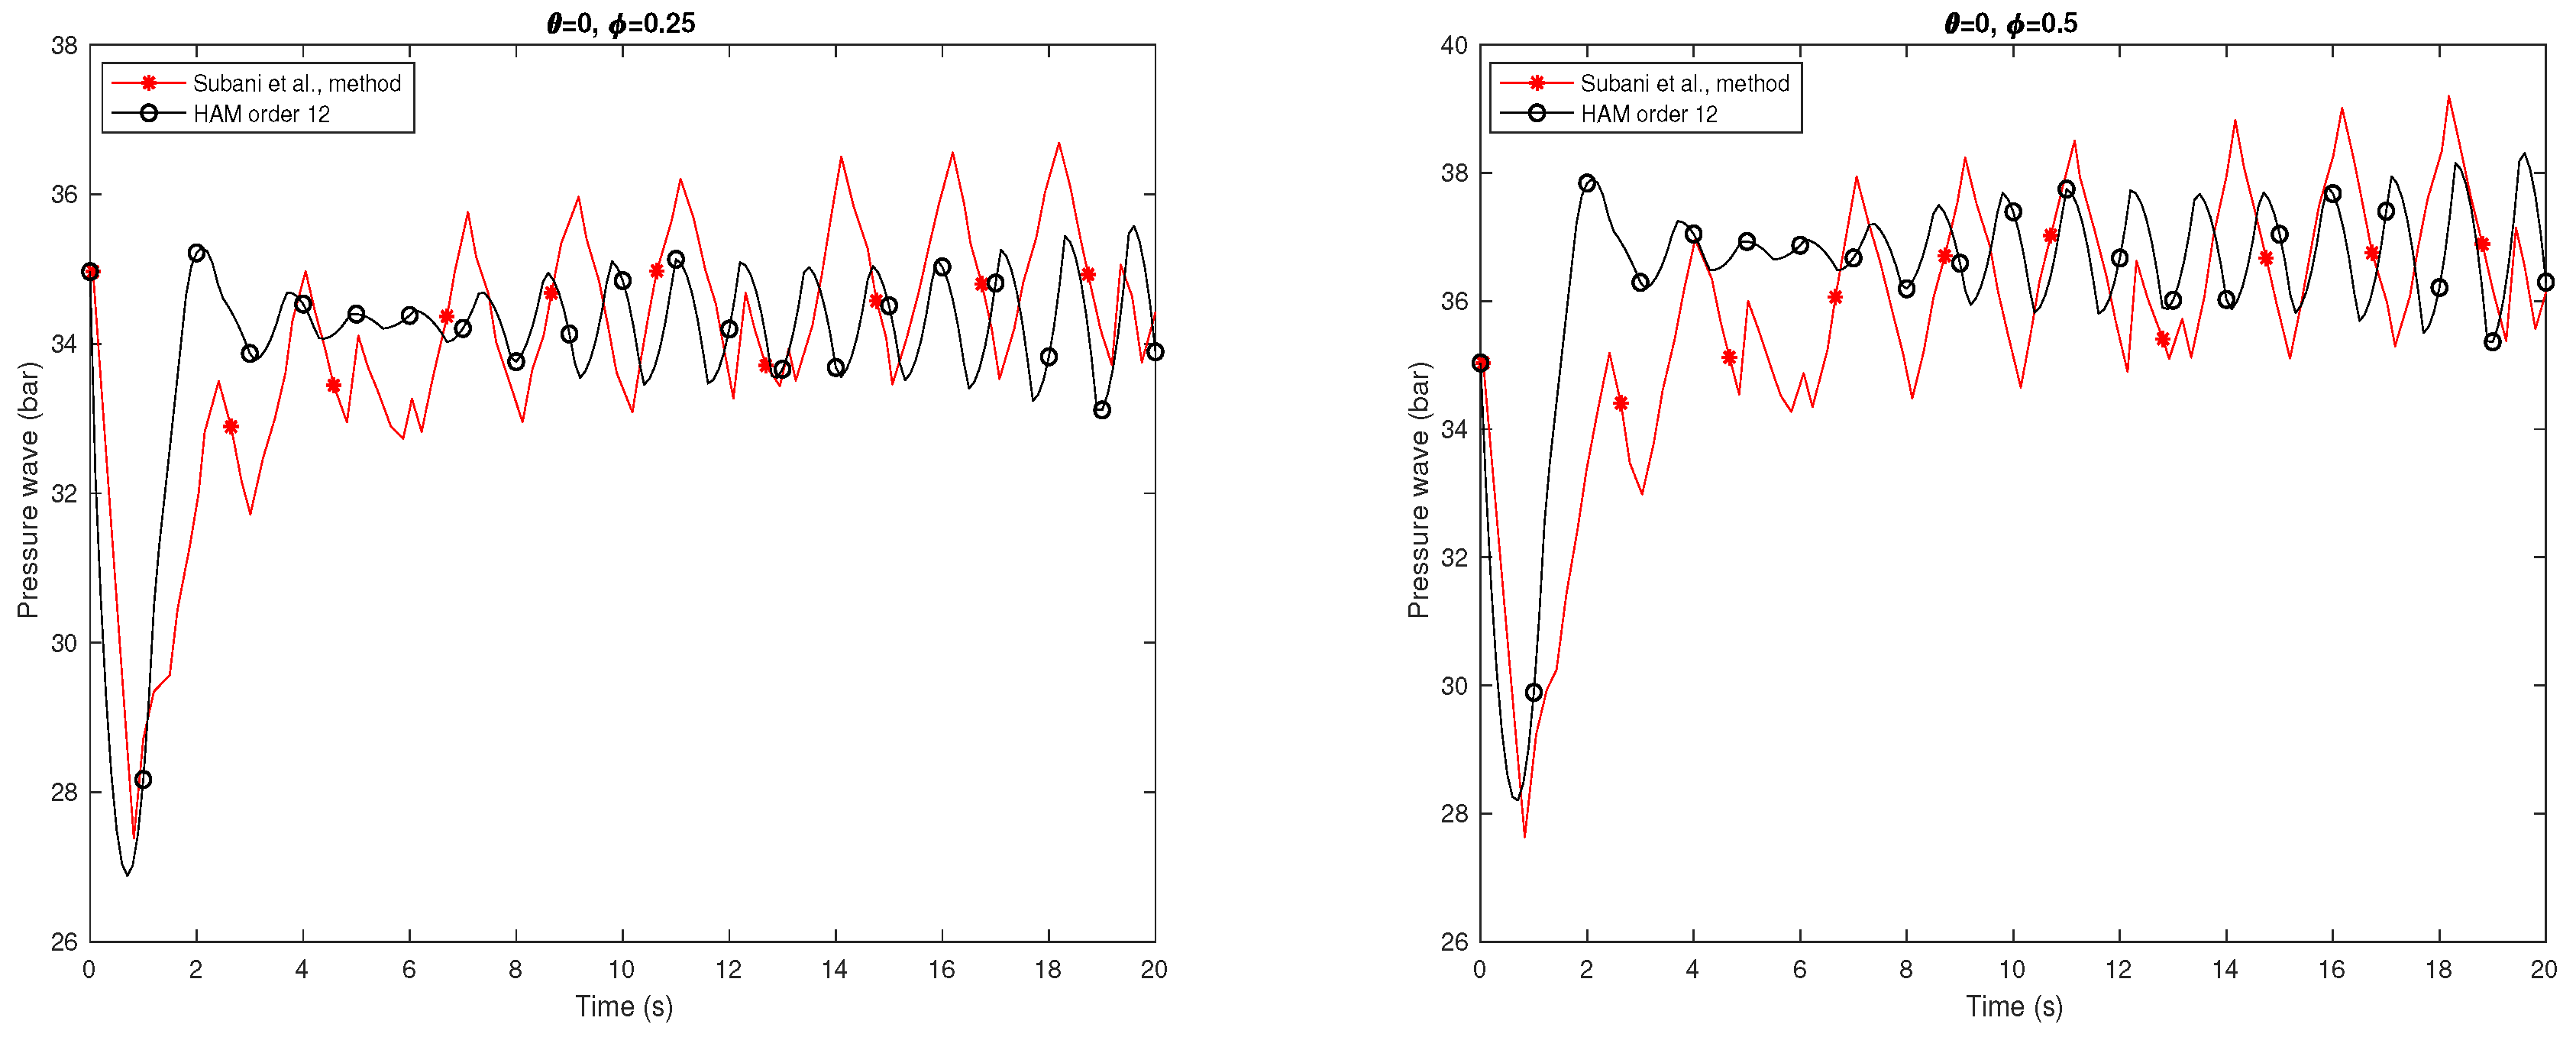
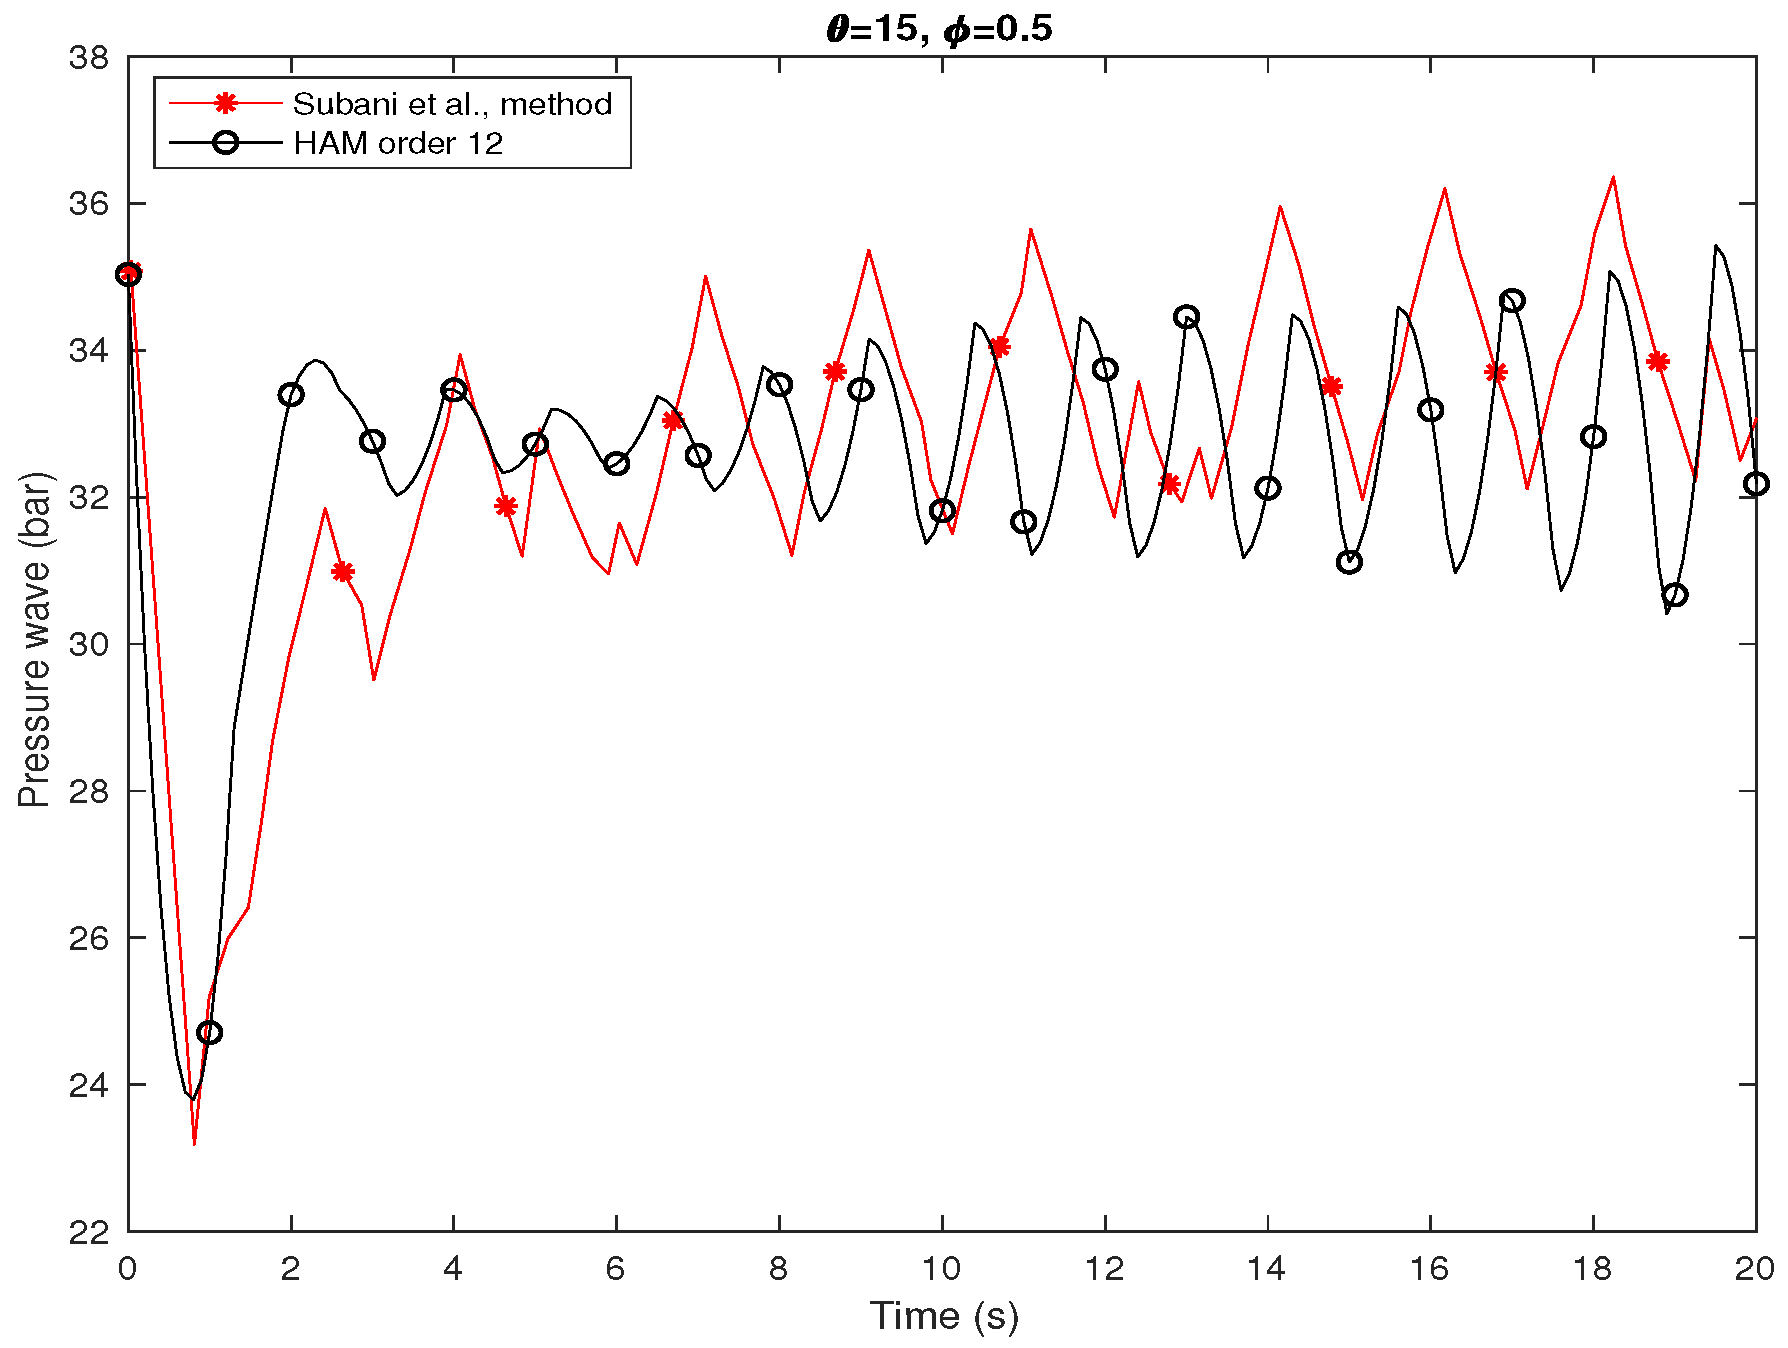
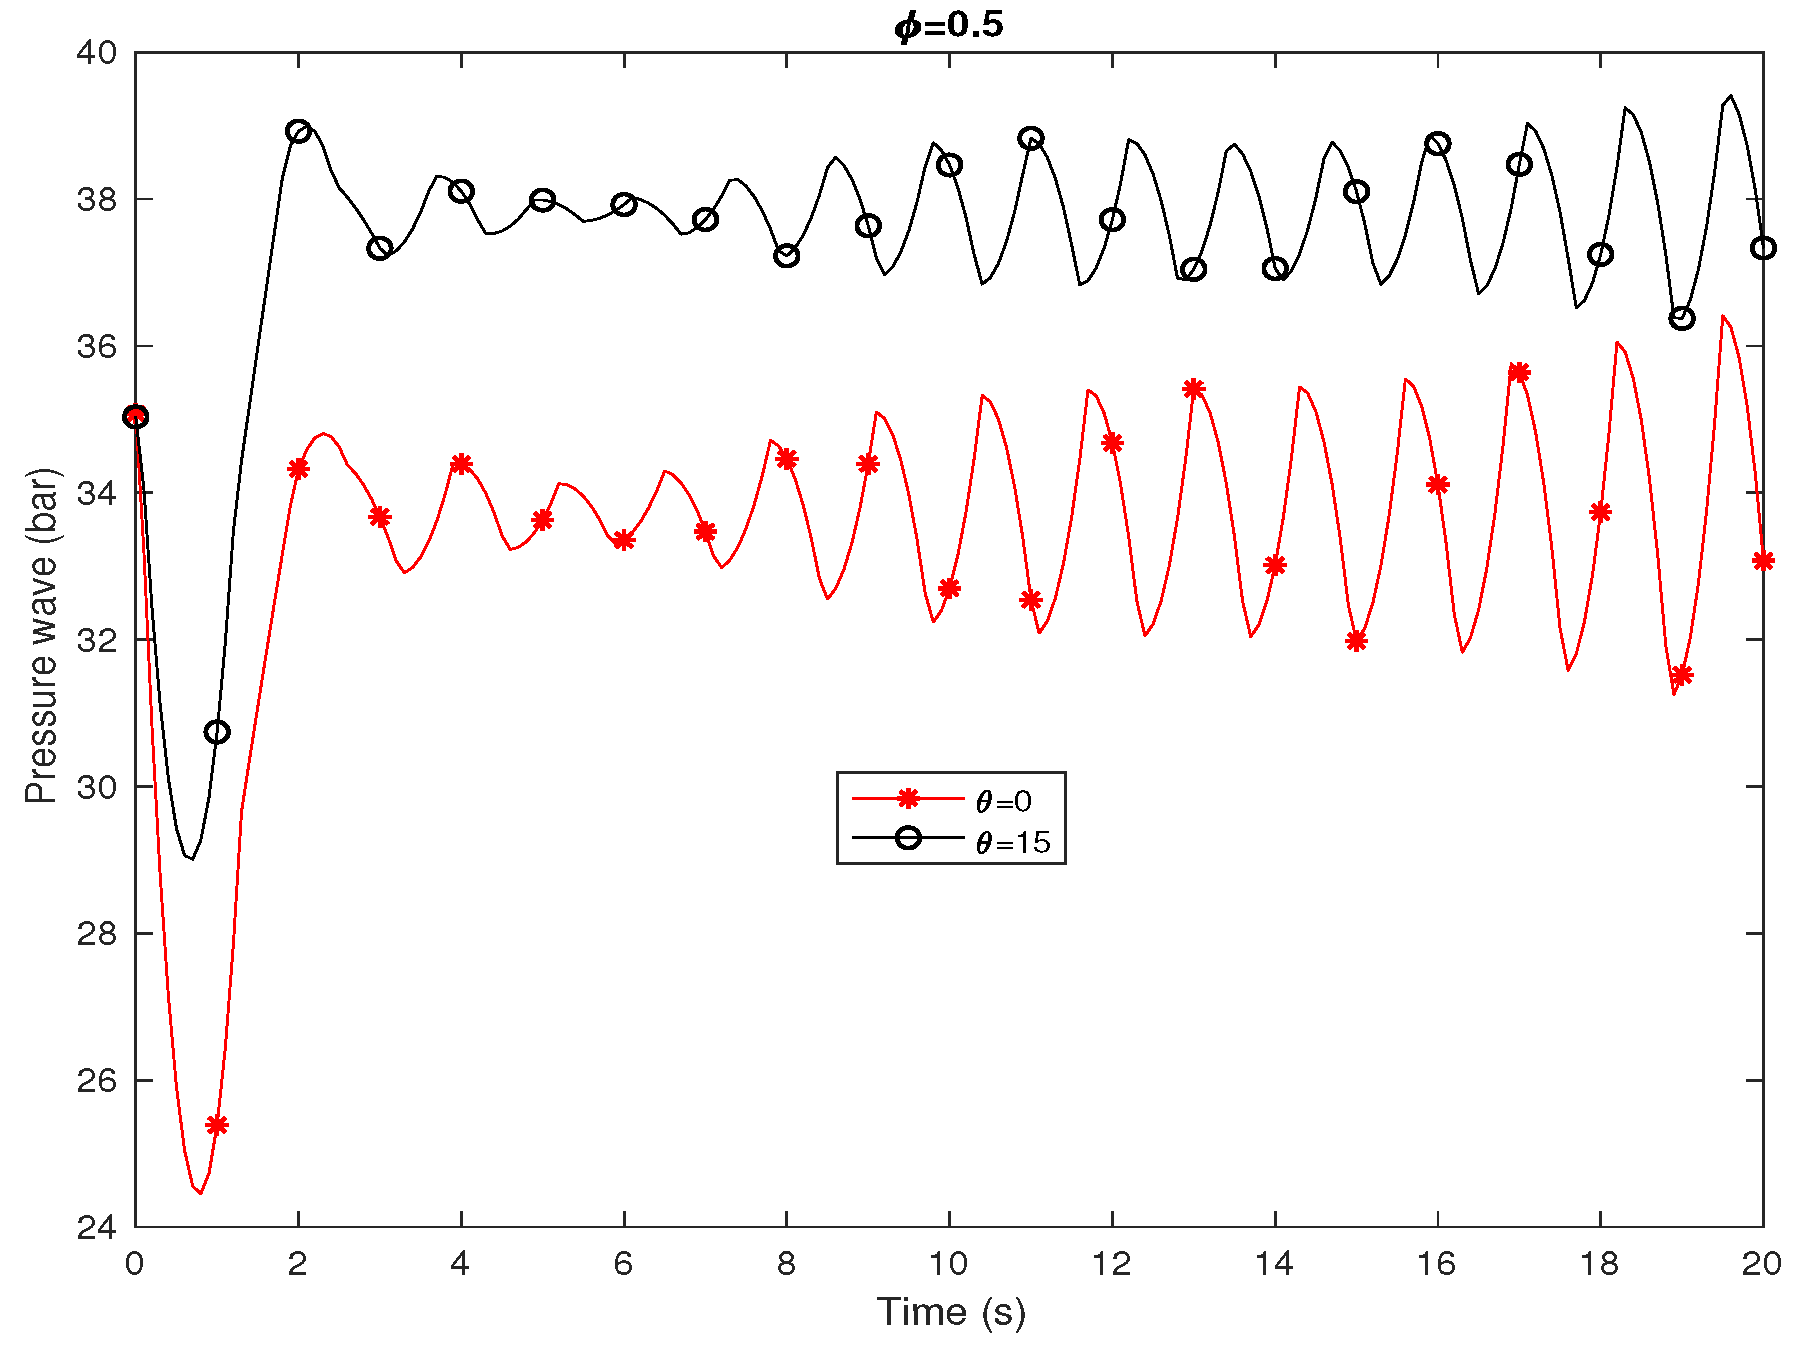
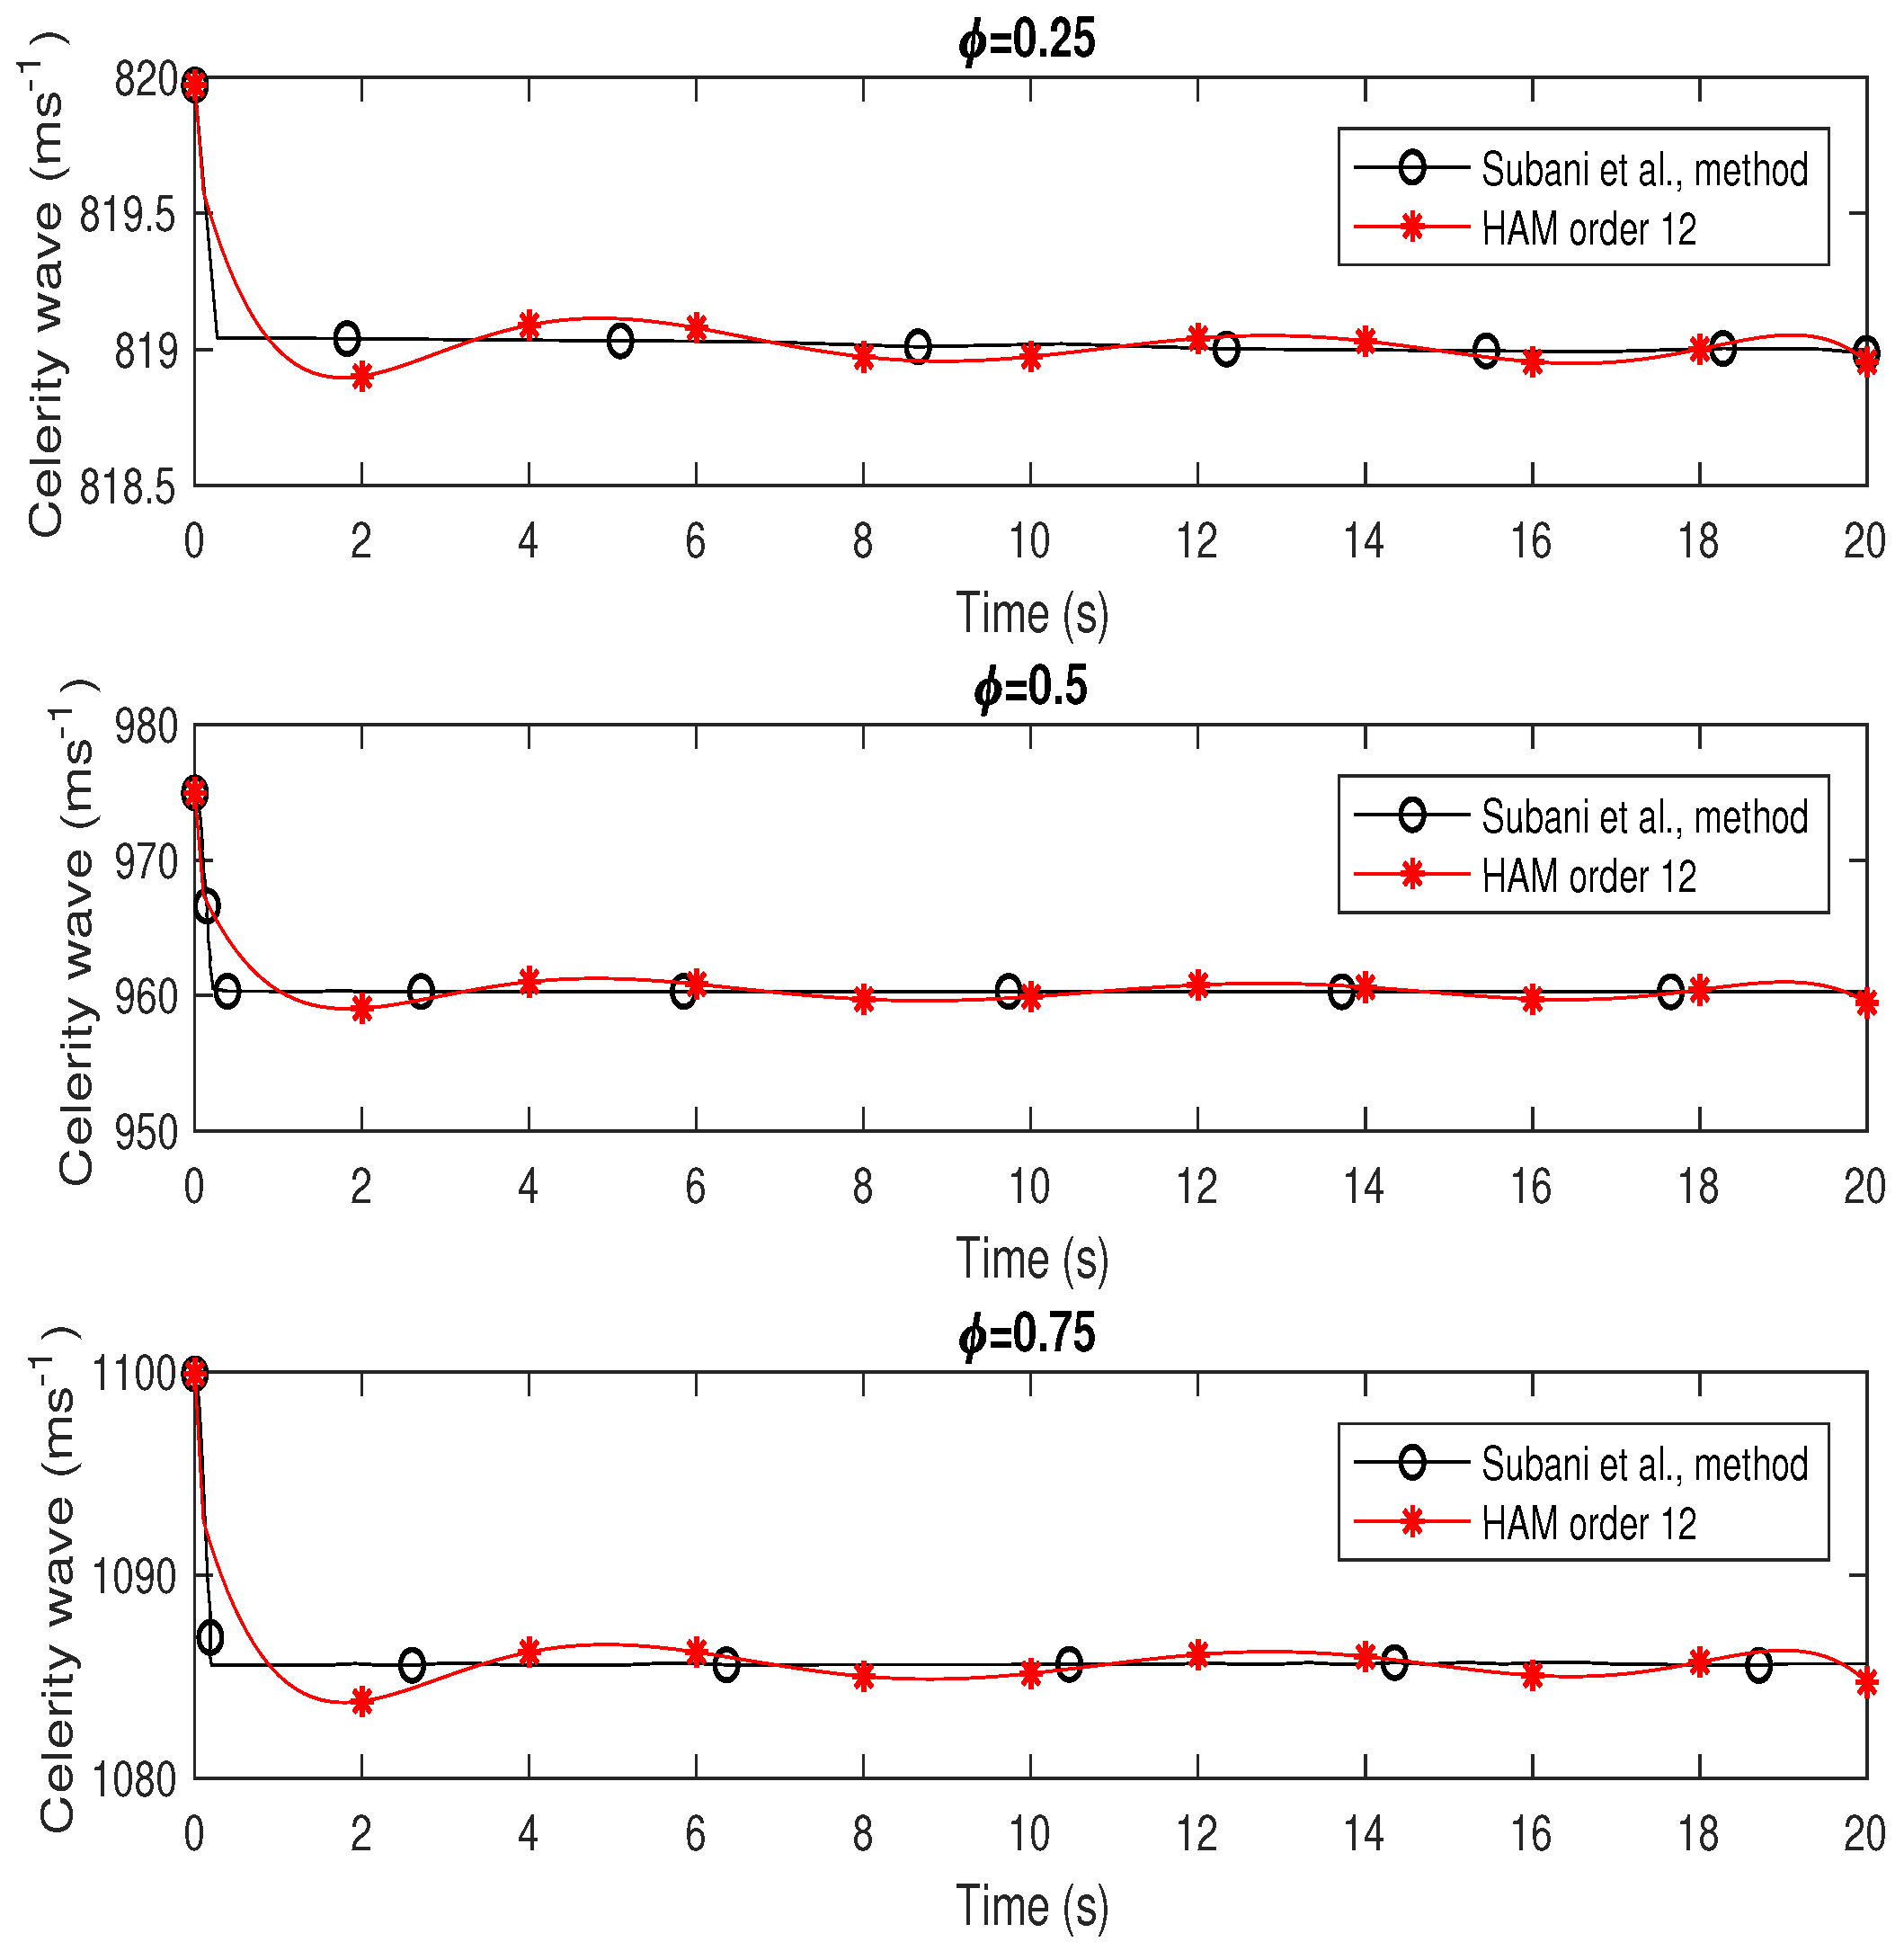
3.3. Results and Discussion
3.4. Leak Detection Using Homotopy Analysis Method
3.5. Results and Discussion
4. Conclusions
Author Contributions
Funding
Acknowledgments
Conflicts of Interest
References
- Elaoud, S.; Hadj-Taieb, E. Transient flow in pipelines of high-pressure hydrogen-natural gas mixtures. Int. J. Hydrog. Energy 2008, 33, 4824–4832. [Google Scholar] [CrossRef]
- Chaczykowski, M. Transient flow in natural gas pipeline the effect of pipeline thermal model. Appl. Math. Model. 2010, 34, 1051–1067. [Google Scholar] [CrossRef]
- Karney, B.W.; Ruus, E. Charts for water hammer in pipelines resulting from valve closure from full opening only. Can. Civ. Eng. 1985, 12, 241–264. [Google Scholar] [CrossRef]
- Kim, H.; Kim, S.; Kim, Y.; Kim, J. Optimization of Operation Parameters for Direct Spring Loaded Pressure Relief Valve in a Pipeline System. J. Press. Vessel Technol. 2018, 140, 051603. [Google Scholar] [CrossRef]
- Jalving, J.; Zavala, V.M. An Optimization-Based State Estimation Framework for Large-Scale Natural Gas Networks. Ind. Eng. Chem. Res. 2018, 57, 5966–5979. [Google Scholar] [CrossRef]
- Seddighi Chahrborj, S.; Amin, N. Controlling the pressure of hydrogen-natural gas mixture in an inclined pipeline. PLoS ONE 2020, 15, e0228955. [Google Scholar]
- Subani, N.; Amin, N.; Agaie, B.G. Leak detection of non-isothermal transient flow of hydrogennatural gas mixture. J. Loss Prev. Process. Ind. 2017, 48, 244–253. [Google Scholar] [CrossRef]
- Subani, N.; Amin, N. Analysis of water hammer with different closing valve laws on transient flow of hydrogen-natural gas mixture. Abstr. Appl. Anal. 2015, 2015, 1–12. [Google Scholar] [CrossRef]
- Subani, N.; Amin, N.; Agaie, B.G. Hydrogen-natural gas mixture leak detection using reduced order modelling. Appl. Comput. Math. 2015, 4, 135–144. [Google Scholar] [CrossRef]
- Uilhoorn, F.E. Dynamic behaviour of non-isothermal compressible natural gases mixed with hydrogen in pipelines. Int. J. Hydrog. Energy 2009, 34, 6722–6729. [Google Scholar] [CrossRef]
- Veziroglu, T.N.; Barbir, F. Hydrogen: The wonder fuel. Int. J. Hydrog. Energy 1992, 17, 391–404. [Google Scholar] [CrossRef]
- Ebrahimzadeh, E.; Shahrak, M.N.; Bazooyar, B. Simulation of transient gas flow using the orthogonal collocation method. Chem. Eng. Res. Des. 2012, 90, 1701–1710. [Google Scholar] [CrossRef]
- Elaoud, S.; Hadj-Taieb, E. Leak detection of hydrogen-natural gas mixtures in pipes using the pressure-time transient analysis. In Proceedings of the Conference and Exposition International of Ecologic Vehicles and Renewable Energy (EVRE), Monte Carlo, Monaco, 2019. [Google Scholar]
- Elaoud, S.; Hadj-Taeb, L.; Hadj-Taeb, E. Leak detection of hydrogennatural gas mixtures in pipes using the characteristics method of specified time intervals. J. Loss Prev. Process. Ind. 2010, 23, 637–645. [Google Scholar] [CrossRef]
- Turner, W.J.; Mudford, N.R. Leak detection, timing, location and sizing in gas pipelines. Math. Comput. Model. 1988, 10, 609–627. [Google Scholar] [CrossRef]
- Wilkening, H.; Baraldi, D.C.F.D. CFD modelling of accidental hydrogen release from pipelines. Int. J. Hydrog. Energy 2007, 32, 2206–2215. [Google Scholar] [CrossRef]
- Puust, R.; Kapelan, Z.; Savic, D.A.; Koppel, T. A review of methods for leakage management in pipe networks. Urban Water J. 2010, 7, 25–45. [Google Scholar] [CrossRef]
- Diao, X.; Shen, G.; Jiang, J.; Chen, Q.; Wang, Z.; Ni, L.; Mebarki, A.; Dou, Z. Leak detection and location in liquid pipelines by analyzing the first transient pressure wave with unsteady friction. J. Loss Prev. Process. Ind. 2019, 60, 303–310. [Google Scholar] [CrossRef]
- Li, S.; Zhang, J.; Yan, D.; Wang, P.; Huang, Q.; Zhao, X.; Cheng, Y.; Zhou, Q.; Xiang, N.; Dong, T. Leak detection and location in gas pipelines by extraction of cross spectrum of single non-dispersive guided wave modes. J. Loss Prev. Process. Ind. 2016, 44, 255–262. [Google Scholar] [CrossRef]
- Silva, R.A.; Buiatti, C.M.; Cruz, S.L.; Pereira, J.A. Pressure wave behaviour and leak detection in pipelines. Comput. Chem. Eng. 1996, 20, S491–S496. [Google Scholar] [CrossRef]
- Ge, C.; Wang, G.; Ye, H. Analysis of the smallest detectable leakage flow rate of negative pressure wave-based leak detection systems for liquid pipelines. Comput. Chem. 2008, 32, 1669–1680. [Google Scholar] [CrossRef]
- Brunone, B.; Ferrante, M. Detecting leaks in pressurised pipes by means of transients. J. Hydraul. Res. 2001, 39, 539–547. [Google Scholar] [CrossRef]
- Martini, A.; Rivola, A.; Troncossi, M. Autocorrelation analysis of vibro-acoustic signals measured in a test field for water leak detection. Appl. Sci. 2018, 8, 2450. [Google Scholar] [CrossRef]
- Brennan, M.J.; Gao, Y.; Ayala, P.C.; Almeida, F.C.L.; Joseph, P.F.; Paschoalini, A.T. Amplitude distortion of measured leak noise signals caused by instrumentation: Effects on leak detection in water pipes using the cross-correlation method. J. Sound Vib. 2019, 461, 114905. [Google Scholar] [CrossRef]
- Martini, A.; Troncossi, M.; Rivola, A. Leak detection in water-filled small-diameter polyethylene pipes by means of acoustic emission measurements. Appl. Sci. 2017, 7, 2. [Google Scholar] [CrossRef]
- Liu, C.; Li, Y.; Fang, L.; Xu, M. New leak-localization approaches for gas pipelines using acoustic waves. Measurement 2019, 134, 54–65. [Google Scholar] [CrossRef]
- Li, J.; Zheng, Q.; Qian, Z.; Yang, X. A novel location algorithm for pipeline leakage based on the attenuation of negative pressure wave. Process Saf. Environ. 2019, 123, 309–316. [Google Scholar] [CrossRef]
- Liao, S.J. The Proposed Homotopy Analysis Technique for the Solution of Nonlinear Problems. Ph.D. Thesis, Shanghai Jiao Tong University, Shanghai, China, 1992. [Google Scholar]
- Rana, P.; Shukla, N.; Gupta, Y.; Pop, I. Homotopy analysis method for predicting multiple solutions in the channel flow with stability analysis. Commun. Nonlinear Sci. Numer. Simul. 2019, 66, 183–193. [Google Scholar] [CrossRef]
- Yu, C.; Wang, H.; Fang, D.; Ma, J.; Cai, X.; Yu, X. Semi-analytical solution to one-dimensional advective-dispersive-reactive transport equation using homotopy analysis method. J. Hydrol. 2018, 565, 422–428. [Google Scholar] [CrossRef]
- Seddighi Chahrborj, S.; Sadat Kiai, S.M.; Abu Bakar, M.R.; Ziaeian, I.; Gheisari, Y. Homotopy analysis method to study a quadrupole mass filter. J. Mass Spectrom. 2012, 47, 484–489. [Google Scholar] [CrossRef]
- Seddighi Chahrborj, S.; Moameni, A. Spectral-homotopy analysis of MHD non-orthogonal stagnation point flow of a nanofluid. J. Appl. Math. Comput. Mech. 2018, 17. [Google Scholar] [CrossRef]
- Liao, S. Beyond Perturbation: Introduction to the Homotopy Analysis Method; CRC Press: Boca Raton, FL, USA, 2003. [Google Scholar]
- Mehmood, A.; Munawar, S.; Ali, A. Comments to: Homotopy analysis method for solving the MHD flow over a non-linear stretching sheet (Commun. Nonlinear Sci. Numer. Simul. 14 (2009) 26532663). Commun. Nonlinear Sci. Numer. 2010, 15, 4233–4240. [Google Scholar] [CrossRef]
- Mandal, P.C. Gas leak detection in pipelines & repairing system of titas gas. J. Appl. Eng. 2014, 2, 23–34. [Google Scholar]
- Seddighi Chahrborj, S.; Kiai, S.M.S.; Arifina, N.M.; Gheisari, Y. Applications of Stochastic Process in the Quadrupole Ion traps. Mass Spectrom. Lett. 2015, 6, 91–98. [Google Scholar] [CrossRef]
- Seddighi Chahrborj, S.; Chaharborj, S.S.; Mahmoudi, Y. Study of fractional order integro-differential equations by using Chebyshev Neural Network. J. Math. Stat. 2017, 13, 1–13. [Google Scholar] [CrossRef]
Publisher’s Note: MDPI stays neutral with regard to jurisdictional claims in published maps and institutional affiliations. |


| Symbol | Fluid Properties | Values (J/kgK) | |
|---|---|---|---|
| Hydrogen | Natural Gas | ||
| Specific heat at constant pressure | 14,600 | 1497.5 | |
| Specific heat at constant volume | 10,440 | 1056.8 | |
| R | Gas constant | 4160 | 440.7 |
| Symbols | Values | Symbols | Values |
|---|---|---|---|
| Pipe length | L = 600 m | Mass ratio | |
| Time | t = 20 | Angle | |
| Pipe diameter | D = m | Mass flow | = 55 kg/s |
| Friction coefficient | Absolute pressure | = 35 bar | |
| Temperature | C = 288 K |
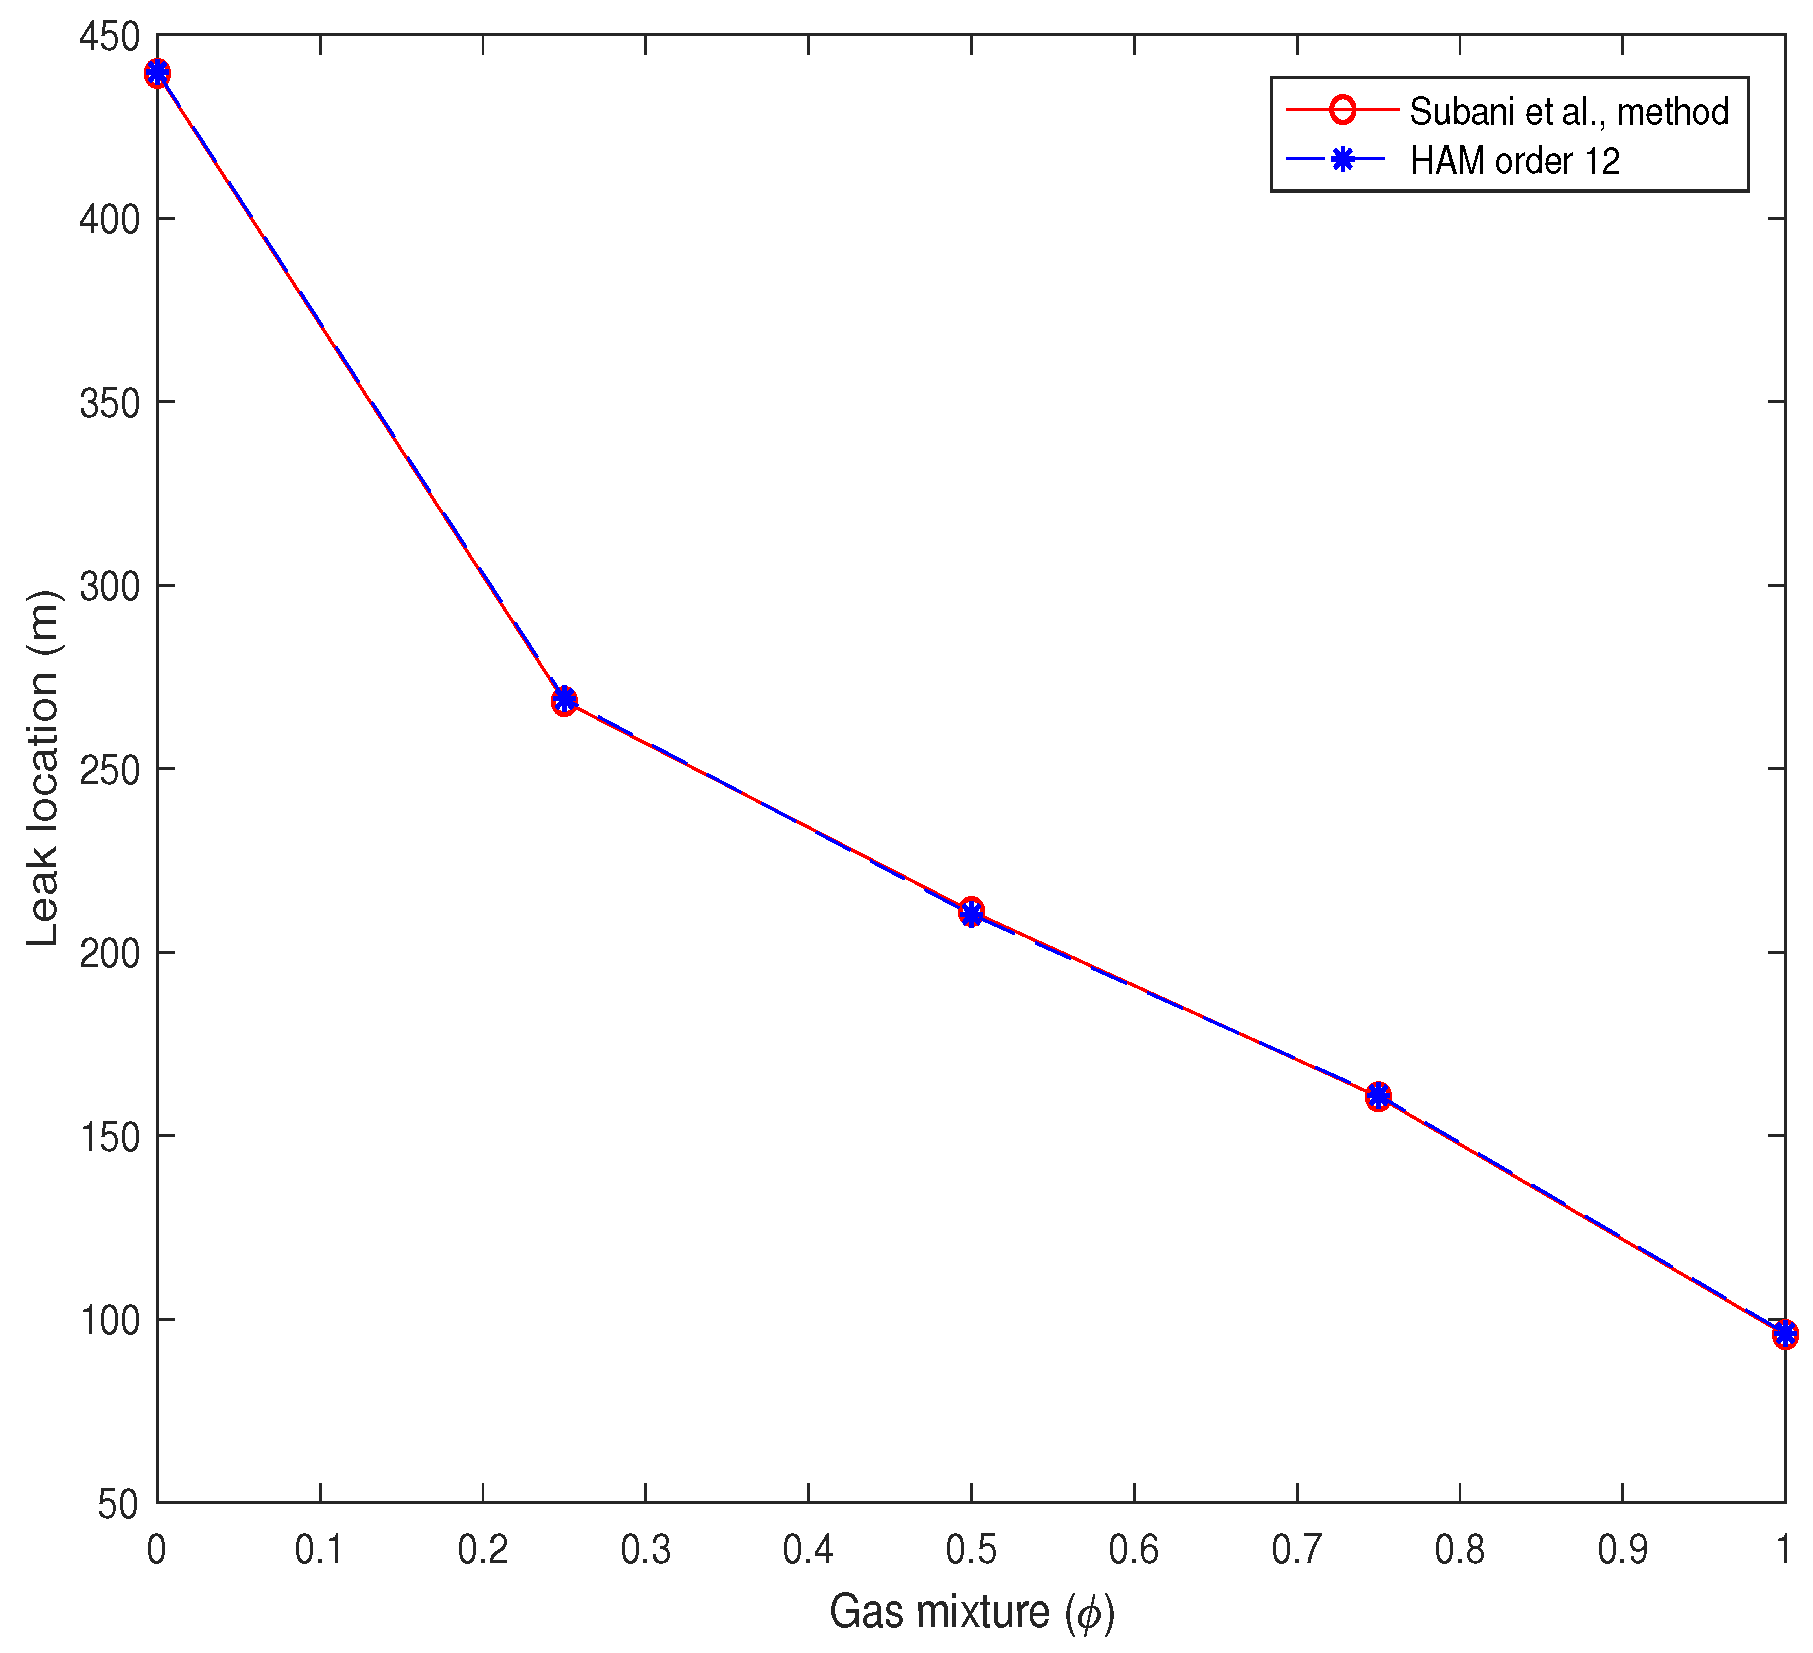
| Gas Mixture | Pipeline’s Angle | Leak Location (m) | |
|---|---|---|---|
| Subani et al., Method | HAM | ||
| 0 | 439.4 | 439.8 | |
| 439.4 | 439.8 | ||
| 0.25 | 268.3 | 269.04 | |
| 268.3 | 269.04 | ||
| 0.5 | 211.1 | 210.3 | |
| 211.1 | 210.3 | ||
| 0.75 | 160.6 | 161.01 | |
| 160.6 | 161.01 | ||
| 1 | 95.8 | 96.2 | |
| 95.8 | 96.2 | ||
© 2020 by the authors. Licensee MDPI, Basel, Switzerland. This article is an open access article distributed under the terms and conditions of the Creative Commons Attribution (CC BY) license (http://creativecommons.org/licenses/by/4.0/).
Share and Cite
S. Chaharborj, S.; Ismail, Z.; Amin, N. Detecting Optimal Leak Locations Using Homotopy Analysis Method for Isothermal Hydrogen-Natural Gas Mixture in an Inclined Pipeline. Symmetry 2020, 12, 1769. https://doi.org/10.3390/sym12111769
S. Chaharborj S, Ismail Z, Amin N. Detecting Optimal Leak Locations Using Homotopy Analysis Method for Isothermal Hydrogen-Natural Gas Mixture in an Inclined Pipeline. Symmetry. 2020; 12(11):1769. https://doi.org/10.3390/sym12111769
Chicago/Turabian StyleS. Chaharborj, Sarkhosh, Zuhaila Ismail, and Norsarahaida Amin. 2020. "Detecting Optimal Leak Locations Using Homotopy Analysis Method for Isothermal Hydrogen-Natural Gas Mixture in an Inclined Pipeline" Symmetry 12, no. 11: 1769. https://doi.org/10.3390/sym12111769
APA StyleS. Chaharborj, S., Ismail, Z., & Amin, N. (2020). Detecting Optimal Leak Locations Using Homotopy Analysis Method for Isothermal Hydrogen-Natural Gas Mixture in an Inclined Pipeline. Symmetry, 12(11), 1769. https://doi.org/10.3390/sym12111769