Abstract
This paper proposes a diagnosis method, combining signal analysis and classification models, to the rotor defect problems of motors. Two manufacture technologies, nonmagnetic high-temperature resistant ceramic adhesive and electrical discharge machining (EDM), are applied to make testing samples, including blowhole and perforation defects of rotor bars in this study. The typical multiresolution analysis (MRA) model is used to analyze acquired source current signals of motors. The features are extracted from the signals of each column of MRA-matrix, including maximum, mean, standard deviation, root-mean-square, and summation. The typical back-propagation neural network (BPNN) model is used to diagnose the rotor bar defects of motors, and then the various signal-to-noise ratio (SNR) of white Gaussian noise (WGN), 30, 25, and 20 dB, are added to the signals to verify the robustness of the proposed method. The results show the availability of the proposed method to diagnose the rotor bar defects of motors.
1. Introduction
Three-phase squirrel-cage induction motors (SCIM) are used widely for industrial applications. Additionally, they are the important equipment for the whole production line. Quality control (QC) must be built in the process of the motor manufacture. Faults in an induction motor are contributed by bearing, stator, rotor, and others, with percentages of 41%, 37%, 10%, and 12%, respectively [1]. In [2] the best characteristics of the infinite impulse response (IIR) filter are exploited to observe the broken rotor bar (BRB) frequencies with good legibility in current and voltage the spectrum of the grid and inverter-fed motor, respectively. Rotor bars are one of the critical components in motors, and defective rotor bars always seriously decay the operation performance, thus the detection of defective rotor bars has primarily been considered. Blowholes of rotor bars are always detected in the die casting process of aluminum alloy when parameters of die casting machines are improper, as shown Figure 1. When a motor has been assembled and quality tested completely, the motor manufacture cuts the rotor destructively to observe the inside of the cross section of defective rotor bars.
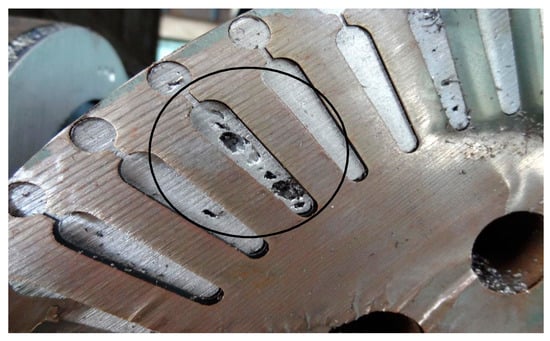
Figure 1.
Blowhole defect.
Each kind of fault always leaves certain specific frequency components in the current or voltage spectrum. It can be used as a potential indicator of fault nature and its severity [3]. There are some methods for detecting defective rotor bars. In [4,5,6,7,8], the literature use a sensing coil, such as Hall transducer or Rogowski coil, to measure the variations of magnetic flux in induction motors. A few studies are based on the operating performances of broken rotor bars, such as voltage [9,10], current [11,12,13], vibration [14,15], noise [16,17], temperature [18], and electromagnetic torque [19]. The aforementioned methods are proposed for the rotor bars malfunction where the induced voltages and currents in the rotor bars are incorrect [20,21]. The voltages and currents cannot be induced to the situation of the broken rotors defect. It is difficult to diagnose the blowholes defect because the inductive voltages and currents of the motors can be easily detected to the situation of the broken rotors defect, but not to the situation of the blowholes rotor bars defect. A good time to diagnose the defective rotor bars is in the QC process, but motor manufacturers usually use a destruct approach or an infrared thermometer [22] to diagnose those. Those detecting methods are in addition to use of voltage, current, and magnetic field, others are not applied in the QC process or need a more expensive detecting sensor, and although the magnetic field sensor is cheap [4], but the sensing coil needs to adjust the position to coordinate with a motor, thus increasing the measurement inconvenience. Nowadays, the common methods of analyzing signals include the fast Fourier transform (FFT) applied as stable and linear, expressed in frequency and energy. The multiresolution analysis (MRA) is applied as nonstable and linear expressed in frequency, energy, and time. The Hilbert-Huang transform (HHT) is applied as nonstable and nonlinear. In the past, FFT [23,24] was used as the main method for the signal analysis of motors. FFT is commonly applied in industry, the spectrum analyzer transforms original signals from the time domain to the frequency domain, in order to obtain the real-time spectrum, but the drawback is inability to get the occurrence time of the signal spectrum. In recent years, signal analysis methods that can resist environmental noise interference have been developed, such as MRA [25,26,27] and HHT.
This paper proposes two manufacture technologies, nonmagnetic high-temperature resistant ceramic adhesive and electrical discharge machining (EDM), that are applied to make testing samples to simulate the rotor defects problem, and then acquire the signals of defective rotor bars. Secondly, this study plans an experiment for measuring source current signals of motors and a servo motor as load, the acquired signals, respectively, use typical FFT, MRA, and HHT models to analyze. The features are respectively extracted from the signals of FFT, MRA, and HHT matrix. The normalized features, respectively, use back-propagation neural network (BPNN) and probability neural network (PNN) as classification algorithm models to recognize whether rotor bars are healthy or not and the accuracy of the proposed method is verified by cross validation. Finally, the various signal-to-noise ratio (SNR) of white Gaussian noise (WGN), 30, 25, and 20 dB, are, respectively, added to the original signals to verify the robustness of the proposed method. Finally, the results show the availability of the proposed method to diagnose the rotor bars defects of motors.
2. Common Signals Analysis Methods
The mother wavelet of MRA is added to the original signals to scale and translate for observing the local feature, but the signals analysis distortion can be caused by the different basis (wavelet family). HHT is a time–frequency analysis tool for analyzing the nonstationary and nonlinear data, it is unique and different from typical FFT and MRA, that can availably reduce the adverse effect of noise interference on signal analysis [28,29,30,31]. MRA uses the scaling function (low-pass filter) and the mother wavelet function (high-pass filter) of the same analytical layer to decompose the original signal into different frequencies in a hierarchical manner, that is, to analyze or reconstruct the signal in different analytical layers. This decomposes the original signal into a monotonous signal for analyzing the information contained in the original signal. HHT is used to analyze nonstable and nonlinear signals. The filtering process of empirical mode decomposition (EMD) is mainly used to eliminate the signal carrier and make the waveform more symmetrical. The signal to be analyzed is decomposed to obtain the intrinsic mode function (IMF) and trends of the signal. This section will introduce the above three signal analysis methods in order.
2.1. FFT
FFT is a fast algorithm of discrete Fourier transform (DFT) that can obtain the real-time signals spectrum. A given periodic function can be represented as Fourier series that combines cosine and sine functions [32], is defined as (1).
where are the Fourier series which obtained from Euler’s formula, defined as (2)–(4), respectively.
Fourier transform (FT) applies the Fourier series to a nonperiodicity function, is called the continuous-time FT of , defined as (5), and is called the discrete-time FT, defined as (6),
where
- is time index of discrete-time signal, k = 0, 1, …, k − 1,
- is frequency index of DFT, n = 0, 1, …, n − 1,
- is separation of sampling time,
- is frequency separation,
- is number of sampling.
As operational factor of DFT has the periodicity, therefore, FFT uses Cooley–Tukey type algorithms to make a simple computation. If a number of sampling is and the complexity of computation is , but the complexity of time is that computes by DFT, the former computation complexity is of the latter. If there is a large number of samples, then more and more computation time is saved [33]. Figure 2 shows the butterfly diagram of 4-element Cooley–Tukey type algorithms that output , defined as (7).
where
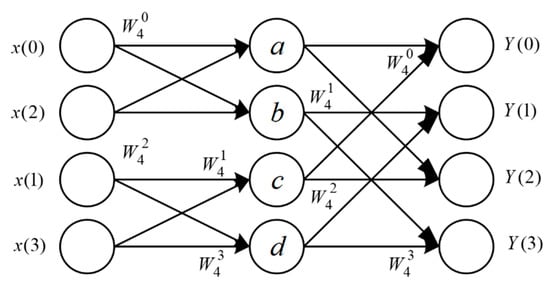
Figure 2.
FFT-butterfly diagram.
- operational factor ,
- output = element + element ,
- output = element + element ,
- output = element + element ,
- output = element + element ,
- element ,
- element ,
- element ,
- element .
Many motors defective diagnoses are analyzed by FFT, that is, motor current signature analysis (MCSA) [24], the advantage can only measure a lead wire of the balanced three-phase system. When rotors produce asymmetry, and then cause additional side band harmonic components at the fundamental frequency, this harmonic frequency is defined as (8).
where
- is stator supply frequency,
- ∈ {1, 2, 3, …},
- is slip.
2.2. MRA
Wavelet transform (WT) is a multiresolution analysis tool which extends from FT, also called as the mathematical microscope, including the continuous wavelet transform (CWT) and the discrete wavelet transform (DWT) [34]. CWT of any function is defined as (9).
where
- is mother wavelet function,
- is scaling parameter,
- is translation parameter,
- is normalization factor, to ensure energy of and are constant.
DWT can change the scaling-translation parameter of CWT to reduce the complexity computation of DWT, and then uses the scaling function and the mother wavelet as a low-pass filter and a high-pass filter, respectively, to decompose signals in different frequency, that is MRA proposed by Mallat [35,36]. MRA can layer-by-layer decompose signals to observe the implicit message. Formula (10) is MRA of time-domain signal function , is the first layer scaling parameter after WT, and then uses it as the input signal of the next layer to proceed to the second layer WT, and so on.
where
- is the layer scaling parameter,
- is the layer mother wavelet parameter,
- is sequence data of signal,
- is MRA layer, .
In Formula (10), and are defined as (11) and (12), respectively, is the coefficient of low-pass filtering, and is the coefficient of high-pass filtering; and are composed of linear basis function . Figure 3 shows MRA frame of signals, represents sampling rate of bandwidth halved.
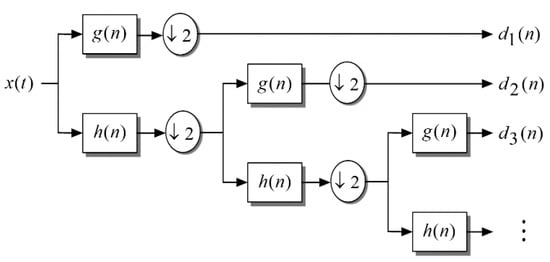
Figure 3.
MRA architecture.
2.3. HHT
HHT was proposed by Dr. Norden E. Huang, it is based on the mathematical theory of mathematician Hilbert in the 19th century that was designed to analyze the nonstationary and nonlinear signals. HHT consists of empirical mode decomposition (EMD) and Hilbert spectral analysis (HSA) [37], EMD uses the sifting process to obtain the intrinsic mode function (IMF) and the trend of signal, the sifting process can eliminate a carrier wave and make a more symmetrical waveform, the IMF must be adequate for the following conditions:
- (1)
- The number of local extreme points and zero-crossing points of signal shall be equal or one difference at most.
- (2)
- Average value of the high and low envelope curves must be close to zero.
The sifting process steps of IMF are as below:
- Step 1
- Find out the local maximum and the local minimum input signal .
- Step 2
- Connect the maximum and minimum envelope curve, respectively, and obtain the mean envelope curve .
- Step 3
- Subtract from original signal , obtain a new signal .
- Step 4
- Whether is IMF or not? If it is true, then save it into , otherwise, repeat the previous steps 1 to 4.
- Step 5
- Obtain the trend function .
- Step 6
- If trend function is monotone function or constant, then the decomposition is complete, otherwise come back to the beginning step to re-sifting.
The EMD process shown in Figure 4. The original signal decomposes as IMF components, and then each IMF component uses Formula (13) to do Hilbert transform (HT). is IMF and is the mainly value of the singular integral. The converted data use Formula (14) to represent Hilbert spectral. and are the layer intrinsic mode against time–amplitude–frequency functions. Hilbert spectral integrates against time.
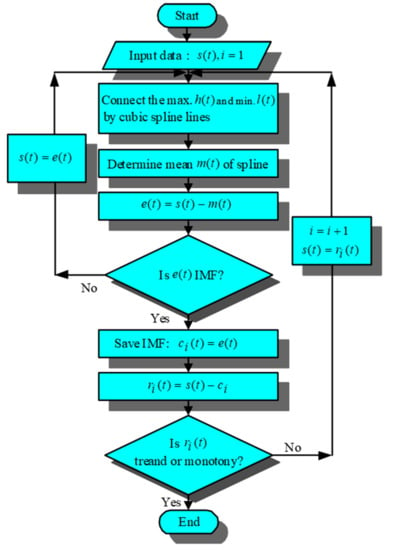
Figure 4.
EMD flowchart.
3. Neural Network Classifier
Neural network (NN) has been successfully applied in different domains, such as recognizing the faulty electrical machinery [38], monitoring the power quality [39], and classifying the fault signal [40]. This paper proposes a recognition approach for the defect diagnosis of motors, signal analysis methods decompose original signals, automatic recognition of defective rotor bars use acquired signal features by the classifier. The classifier uses the different classification algorithms, such as a multilayer perceptron [41,42], BPNN or PNN, to deal with different kinds of problems. BPNN needs setting the number of neurons and the learning rate of network, this supervised neural network has a high accuracy more than an unsupervised neural network. However, there are also limitations in BPNN. This network requires a lot of input and target for training the network. PNN does not need trained, but needs to find out a smoothing parameter. There are some advantages of using PNN for classification. For example, the run time of PNN is faster than BPNN, and it is robust to noise. Furthermore, the training manner of PNN is simple and instantaneous.
3.1. BPNN
BPNN is a multilayer feedforward neural network [41,42], also known as a multilayer perceptron which has a fast self-learning speed and high accuracy features for application to classification and predication. The network architecture shown in Figure 5, including input layer, hidden layer, and output layer. are the input of network, are the predicted output values of network, neurons interconnect with each other by a weight, but they do not connect with the same layer neurons. The hidden layer can be a single layer or a multilayer architecture which depends on the complexity degree of functions, in most of the cases, as long as the number of neurons are enough, a single hidden layer can conduct any function.
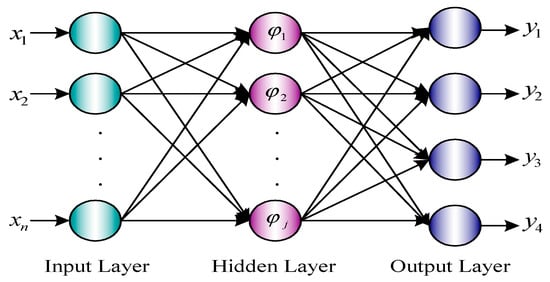
Figure 5.
BPNN architecture diagram.
Signals are feedforward propagation (feedforward phase) in BPNN, the predication of output error are back propagation (back propagation phase). Input vectors sequentially propagate to the output layer via the input layer, the hidden layer of network in the feedforward phase. The weight value of the network is corrected by the error of output and the set target value in the back propagation phase, the purpose is forcing the output value close the expected target value.
The basic principle of BPNN uses the gradient descent method [43] which continuously corrects the weight and the bias to promote the output result close to the expected value. NN application process is as follows: firstly, the signal data are obtained from the experiment, and then divided into training and testing data, training data are used to train the network to set up network model, testing data are used to test the accuracy of the network. When the recognizable result is not ideal, in addition to training the network again, the training data can be increased, it would be beneficial to reach the expected value of network output. Besides, if we want to build a successful network model that shall confirm whether the input and output of network exist in relationship, the algorithm steps are as below:
- Step 1
- Set the number of neurons of input layer, hidden layer, and output layer.
- Step 2
- Set the initial value of network, randomly produce the weight and the bias , and then set the trainable learning rate which usually use 0.1–0.9, determine which type of activation function, as represented is sigmoid function and is piecewise linear function [43].
- Step 3
- Set the input vector as , the output of hidden layer and the output layer in the feedforward phase, defined as (15) and (16), respectively.
- Step 4
- Calculate the error function which is the number of training times, is the target value, is the output value.
- Step 5
- Calculate the gradient of weight and bias, defined as (17) to (20), respectively.
- Step 6
- Correct the weight and bias, defined as (21) to (24), respectively.
- Step 7
- Repeat steps 1 to 6 to reach the number of training times or compliance with the convergent criteria.
3.2. PNN
PNN was proposed by Dr. D. F. Specht, it replaces the commonly used sigmoid activation function by exponential function, and then uses Bayes optimal decision rule to calculate the nonlinear decision boundary. After that, PNN uses linear learning algorithm to improve the Bayesian classifier’s weakness that it is not easy to create a probability density function in each class [44].
PPN belongs to a forward, supervised, and learnable network architecture which has both fast training and learning speed, it uses the training data as the weight of neurons with each other, and then needs only to adjust the smoothing parameter of probability density function (PDF), to reduce the error of the network output and the target vector value with each other that let the output vector close to the target vector value. PDF defined as (25), shows that if the input vector of classification is different from the training vector data of category , and the smoothing parameter does not adjust appropriately, then prompts PDF close to zero, which caused a poor recognition, therefore, to adjust the smoothing parameter is the key for reaching the optimal NN.
The basic architecture of PNN shown in Figure 6. The first layer is the input layer for classifying the eigen vector and then sends them to the second layer. The second layer is the feature layer or the pattern units, it undertakes the input vector of the above layer, and then proceeds to the nonlinear calculation by the exponential activation function. The third layer is the summation layer which is the sum of the different types of feature units to send to next layer. The fourth layer is the output layer or the competitive layer where the healthy rotor bar competes with three kinds of defective rotor bars each, and then obtains the recognizable result, that is called G.
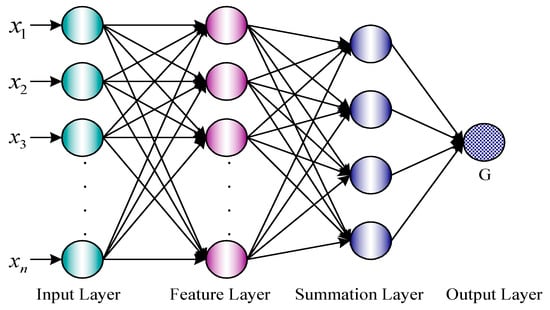
Figure 6.
PNN architecture.
The four-layer neural network architecture can handle classification problems of any input type and can modify the decision boundary range through new input signal data in real-time. Therefore, the speed of the parallel operation is relatively better than that of the BPNN that requires continuous weight adjustment. Additionally, it is more suitable for the conversion of the neuron system into hardware architecture for application [45].
where
- is PDF of category at point,
- is the number of modes,
- is dimension of measure space,
- is smoothing parameter,
- is amount of category training vector,
- is input classificatory vector,
- is training vector data of category ,
- is transposed vector.
4. Experimental Setup for Defective Rotor Bars
This section discusses how to manufacture rotor bar defects, blowhole defects, perforation defects—EDM, experiment setup, and measurement data.
4.1. Manufacture of Rotor Bar Defects
This study mainly addresses defects of rotor bars as the average of rotor fault rate of induction motors in industrial applications was approximately 10% [1,45,46,47]. The defective rotor bars are divided into two parts:
- Manufacture of blowhole defect.
- Manufacture of perforation defect—EDM.
Figure 7 depicts the blowhole defect of rotor bars. When the silicon steel of the rotor is laminated completely and then the ceramic adhesive is fixed into the rotor slot so that it becomes the blowhole defect. Moreover, Figure 8 shows the rotor die-cast aluminum alloys by the die-casting machine which becomes an aluminum-rotor, and then the rotor cuts by a cutting machine. The result shows that the availability of the proposed manufacture technology to simulate the blowhole defect of rotor bars as shown in Figure 9. Therefore, besides making one healthy 2HP SCIM, two rotors in which one has a blowhole defect (in one rotor bar), and the other one has four blowhole defects (in four rotor bars) are made also. Moreover, a computer numerical control (CNC) is used to make an EDM process to simulate a perforation defect of the rotor bar (in one rotor bar). Thus, this experiment has four testing samples: one healthy SCIM, one rotor with a blowhole defect, one rotor with four blowhole defects, and one rotor with a perforation defect.
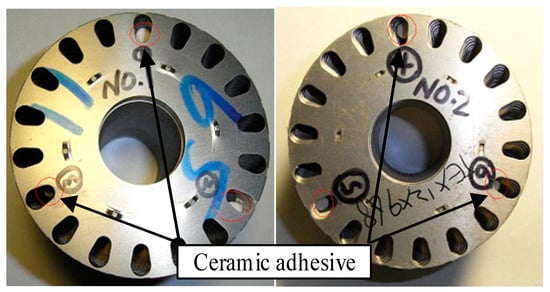
Figure 7.
Ceramic adhesives are fixed in rotor slots.
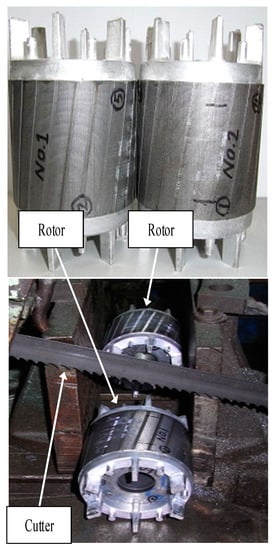
Figure 8.
Rotor cutting.
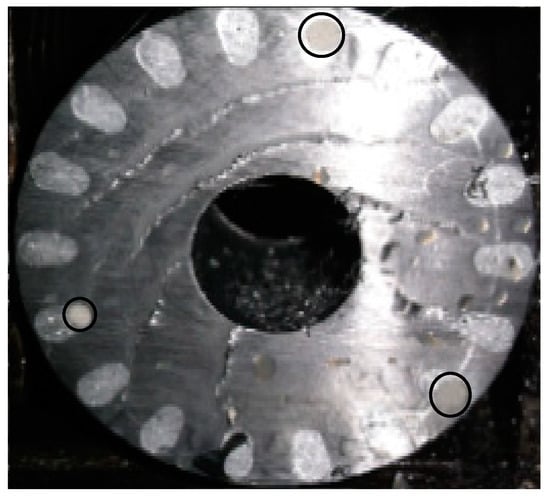
Figure 9.
Simulated blowhole defects.
4.2. Manufacture of Blowhole Defect
A measuring cup measures 1535 °C resistant ceramic powder and clean water as shown in Figure 10a,b, using agitation mixing by the ratios of 100:15 to become ceramic adhesive (Figure 10c), and then measures 20 mm in length of plastic pipe as a mold (Figure 10d), ceramic adhesive injected into the plastic pipe to be cut to take out ceramic adhesive after it hardens, that is a simulated blowhole (Figure 10e). The simulated blowhole was put into the rotor slot (Figure 10f), the diameter of the rotor is 95 mm, one blowhole in a slot (Figure 10g) and four blowholes in four slots (Figure 10i), the dimension of the rotor slot shown in Figure 10h,j. Finally, rotor die-cast aluminum alloys by the die casting machine become the aluminum-rotor finished product with 72 mm core length (Figure 11).
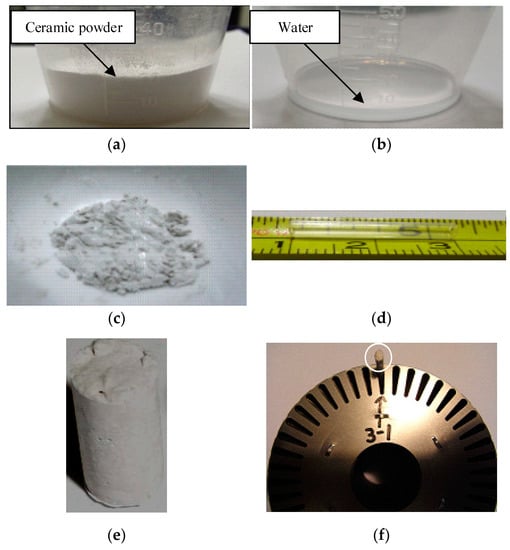
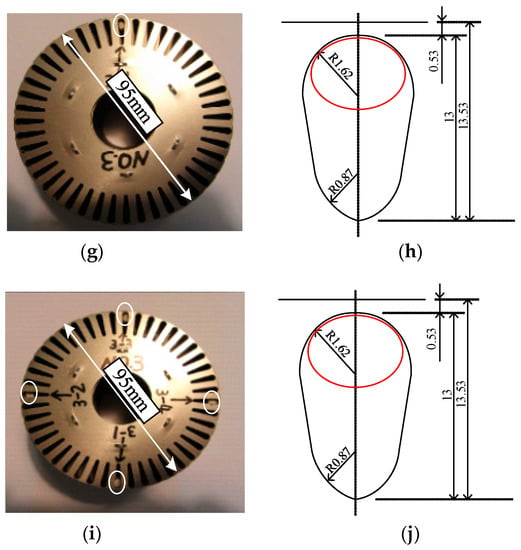
Figure 10.
(a) Measure ceramic powder, (b) measure clean water, (c) ceramic adhesive, (d) measure 20 mm in length of plastic pipe, (e) a simulated blowhole, (f) one blowhole puts into a rotor slot, (g) one rotor slot with one blowhole, (h) dimension of one rotor slot (mm), (i) four rotor slot with four blowholes, (j) dimension of one rotor slot (mm).
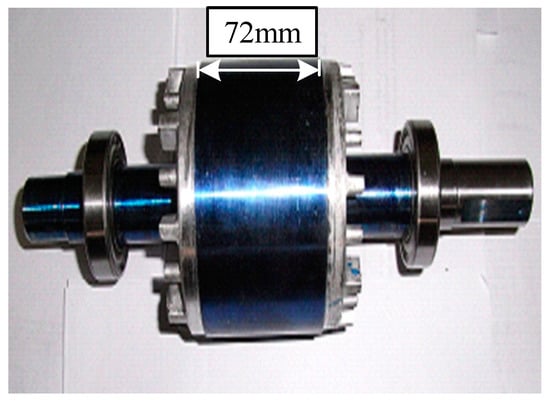
Figure 11.
Aluminum rotor.
4.3. Manufacture of Perforation Defect—EDM
A rotor bar of one healthy rotor proceeds EDM by CNC to simulate a perforation defect, the CNC control panel is shown in Figure 12a. Firstly, the CNC set 9 mm in vertical depth (Figure 12b), the EDM platform is shown in Figure 12c, EDM processing shown in Figure 12d, discharge electrode shown in Figure 12e, the finished product of EDM has one perforation defect that is 2 mm in diameter and 9 mm in vertical depth as shown in Figure 13.
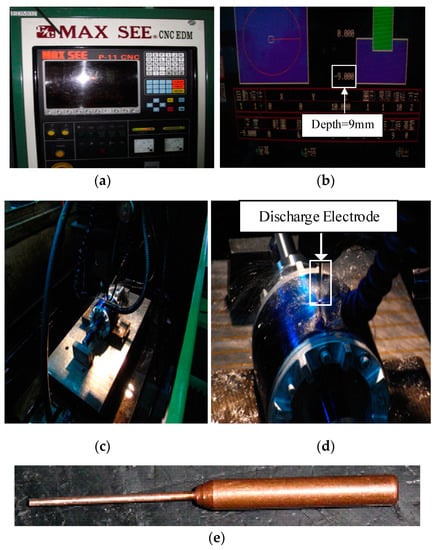
Figure 12.
(a) CNC control panel, (b) vertical depth, (c) EDM platform, (d) EDM processing, (e) discharge electrode.
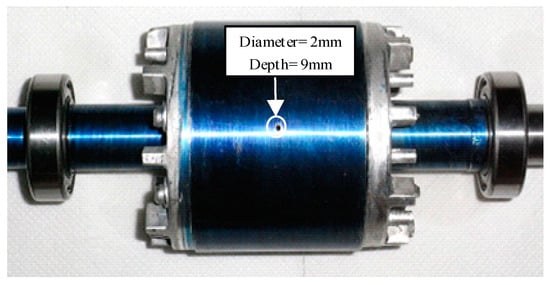
Figure 13.
The finished product of EDM.
4.4. Experiment Setup and Measurement Data
This paper proposes two defective rotor bars which are blowhole and perforation. Additionally, the signal analysis proceeds with FFT, MRA, and HHT, respectively, for understanding the abnormal conditions and the serious degree of the defective rotor bars. Experiment setup dynamometer platform combines one servo motor (3 phase AC 69 Hz, 11 kW, 2000 rpm, Volts: 190–330, Amps: 41.2–23.8) with the torque sensor as load of IM (3 phase SCIM 4 Pole 1.49 kW, 60 Hz, Volts: 220, Amps: 5.58, 1715 rpm). Any one lead wire of three phase IM connects to (NI)PIX-1033 data acquisition, and adjusts the motor speed and torque by the control panel of the dynamometer platform, and then a current probe measures the single-phase motor current that the current signal records by the data acquisition, and sampling frequency is 1000 Hz/s. The experimental system architecture is shown in Figure 14 and equipment of the experiment are shown in Figure 15.
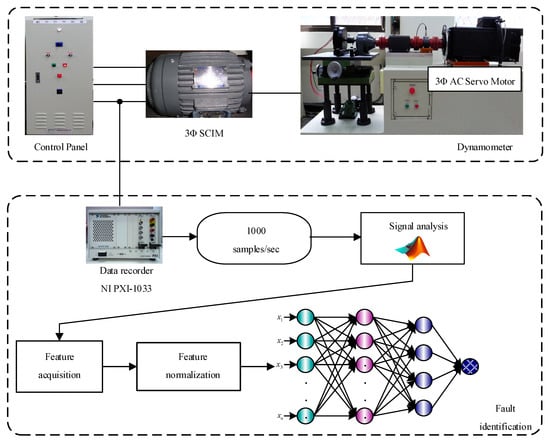
Figure 14.
Experimental system architecture.
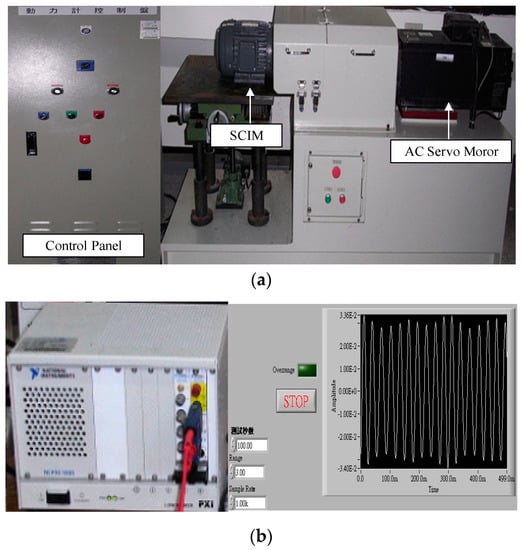
Figure 15.
Experimental equipment, (a) dynamometer platform and control panel, (b) data acquisition and data storage.
5. Features Extraction and Defects Recognition
This study uses (NI) PXI-1033 current acquisition of National Instruments to set the sampling rate per second equal to 1000 Hz, and takes the current signals of four IM samples which run, respectively, for 100 s. The measured current signals are divided into 100 records by Matlab, in example four samples amount to 400 records, and then the signal analysis proceeds with FFT, MRA, and HHT, respectively, BPNN and PNN classification algorithm as the defective recognition classifier, but after transform analysis the data is too much to compute directly by classifier which caused the high computation time. Therefore, the six features are extracted from the signals in advance, including the maximum values, the minimum values, the root mean square values, the average values, the standard deviation values, and the summation values of the raw matrix. The features are normalized between 0 and 1, 80 of the 100 recorders are the training data, and the remaining 20 recorders are the testing data to input in classifier, finally, the accuracy of the proposed method is verified by 10 times cross validation. In addition, the various SNR of WGN, 30, 25, and 20 dB, are, respectively, added to the signals to verify the robustness of the proposed method.
5.1. FFT-Based Recognition
Firstly, the healthy rotor and three samples of defective rotors (with one blowhole rotor bar, four blowhole rotor bars, and one perforation defective rotor bar) take 100 recorders each sample, four samples amount to 400 records, and then the signal analysis proceeds with FFT to obtain the frequency–amplitude spectrum. Secondly, the features are extracted from the signals, including maximum, minimum, mean, standard deviation, root-mean-square, and summation values of the FFT matrix, and the features are normalized between 0 and 1. The features energy diagram of 100% loading rate and no noise is shown in Figure 16a, where the vertical axis is the number of features and the horizontal axis is the sample number. The enlarge diagram of features 4 and 5 are shown in Figure 16b,c, which can recognize clearly whether the rotor bars are healthy or defective (blowhole or perforation), but it is hard to distinguish between one blowhole and four blowholes. In addition, Figure 17a is shown the features energy diagram of 100% loading rate and 30 dB noise is added to the signals, where the vertical axis is the number of features and the horizontal axis is the sample number. The enlarge diagram of features 4 and 5 are shown in Figure 17b,c, which also can recognize clearly whether the rotor bars are healthy or defective (blowhole or perforation), but it is still hard to distinguish between one blowhole and four blowholes.
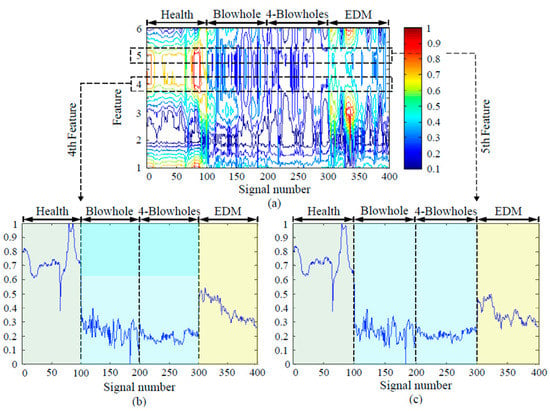
Figure 16.
FFT features energy diagram (100% loading rate, no noise): (a) feature energy diagram, (b) the enlarged diagram of the 4th feature, (c) the enlarged diagram of the 5th feature.
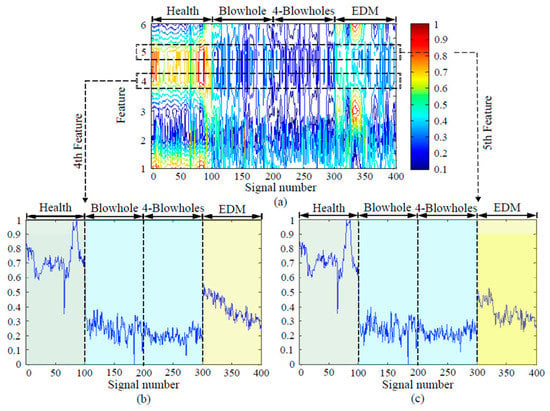
Figure 17.
FFT features energy diagram (100% loading rate, 30 dB noise): (a) feature energy diagram, (b) the enlarged diagram of the 4th feature, (c) the enlarged diagram of the 5th feature.
5.2. MRA-Based Recognition
The Haar wavelet decomposes the fault signals (stator currents) into one to five levels of high-frequency components, moreover, five signals features are extracted from the high-frequency signals, including maximum (Max), mean (Mean), standard deviation (Std), root-mean-square (Rms), and summation (Sum) values of the raw matrix, five layer high-frequency signals amount to 25 features, and the features extraction process is shown in Figure 18. The original signals are decomposed into the low-pass filtered () and the high-pass filtered () coefficients, and extracts five features, including Sum (F1), Std (F2), Rms (F3), Mean (F4), and Max (F5), and the low-pass filtered () signals to do the second layer decomposition to obtain the second layer low-pass filtered () and high-pass filtered () coefficients. Additionally, five features are extracted, including Sum (F6), Std (F7), Rms (F8), Mean (F9), and Max (F10), and so on, after the fifth layer is decomposed to obtain F21 to F25 features. Finally the 25 features are input into the neural network classifier for training and cross validation.
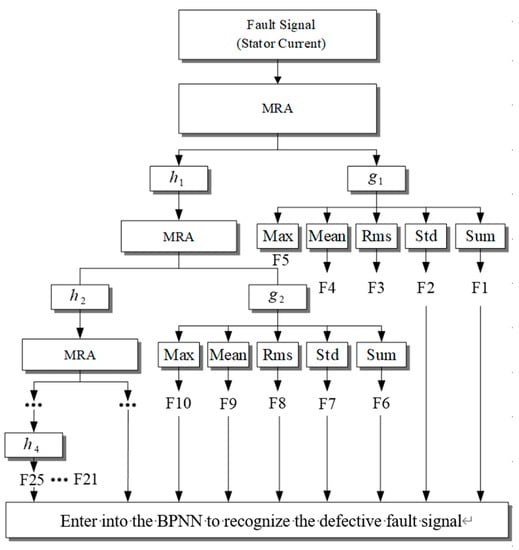
Figure 18.
The features extraction process of MRA.
The features energy diagram of 100% loading rate and no noise is shown in Figure 19a, where the vertical axis is the number of features and the horizontal axis is the sample number. The enlarged diagrams of features 8 and 9 are shown in Figure 19b,c, which can recognize clearly whether the rotor bars are healthy or defective (blowhole or perforation), but it is hard to distinguish between one blowhole and four blowholes. In addition, Figure 20a shows the features energy diagram of 100% loading rate and 30 dB noise is added to the signals, where the vertical axis is the number of features and the horizontal axis is the sample number. The enlarged diagrams of features 8 and 9 are shown in Figure 20b,c, which also can recognize clearly whether the rotor bars are healthy or defective (blowhole or perforation), but it is still hard to distinguish between one blowhole and four blowholes.
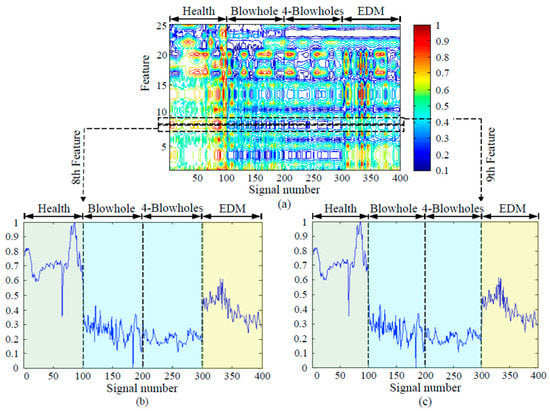
Figure 19.
MRA features energy diagram (100% loading rate, no noise): (a) feature energy diagram, (b) the enlarged diagram of the 8th feature, (c) the enlarged diagram of the 9th feature.
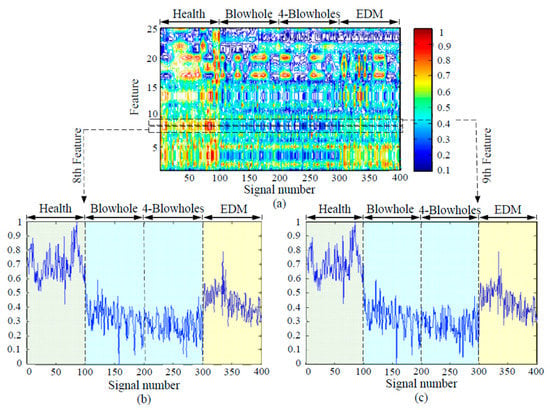
Figure 20.
MRA features energy diagram (100% loading rate, 30 dB noise): (a) feature energy diagram, (b) the enlarged diagram of the 8th feature, (c) the enlarged diagram of the 9th feature.
5.3. HHT-Based Recognition
EMD method decomposes the original signal (stator current) into five layers of IMF, a HHT analysis of each extracted IMF to obtain the Hilbert matrix with time–energy (Time scale) and time–frequency (frequency scale), respectively, to find the maximum characteristic curve, average characteristic curve, root-mean-square characteristic curve, standard deviation characteristic curve, energy sum characteristic curve. Additionally, five signals features are extracted, including Max (T-max, F-max), Mean (T-mean, F-mean), Std (T-std, F-std), Rms (T-rms, F-rms), and Sum (T-e, F-e) values of the raw matrix which amount to 50 features, 10 characteristic curves multiplied by five features (F1, F2, …, F50). The features extraction process of HHT is shown in Figure 21.
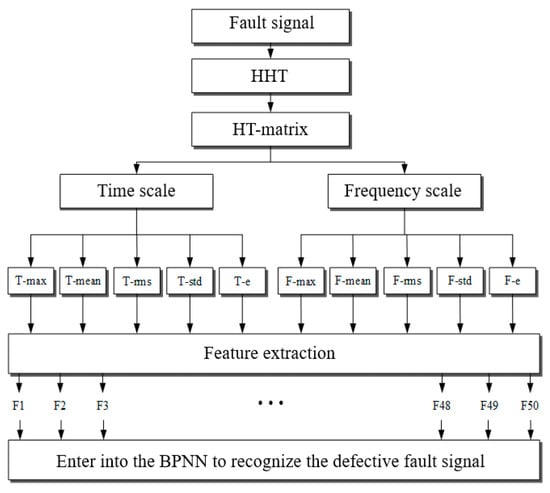
Figure 21.
The features extraction process of HHT.
The features energy diagram of 100% loading rate and no noise is shown in Figure 22a, where the vertical axis is the number of features and the horizontal axis is the sample number. The enlarged diagrams of features 32 and 33 are shown in Figure 22b,c, which can recognize clearly whether the rotor bars are healthy or defective (blowhole or perforation), but it is hard to distinguish between one blowhole and four blowholes. In addition, Figure 23a shows the features energy diagram of 100% loading rate and 30 dB noise is added to the signals, where the vertical axis is the number of features and the horizontal axis is the sample number. The enlarged diagrams of features 32 and 33 are shown in Figure 23b,c, which also can recognize clearly whether the rotor bars are healthy or defective (blowhole or perforation), but it is still hard to distinguish between one blowhole and four blowholes.
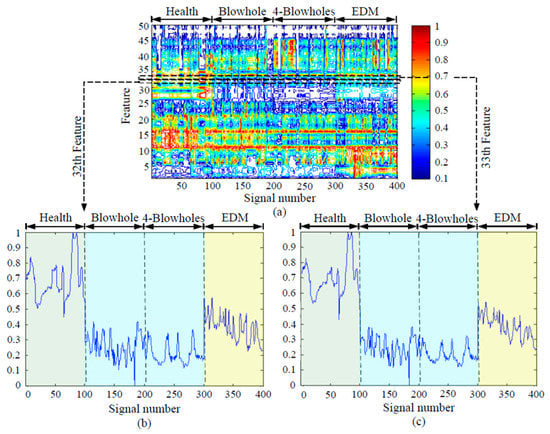
Figure 22.
HHT features energy diagram (100% loading rate, no noise): (a) feature energy diagram, (b) the enlarged diagram of the 32nd feature, (c) the enlarged diagram of the 33rd feature.
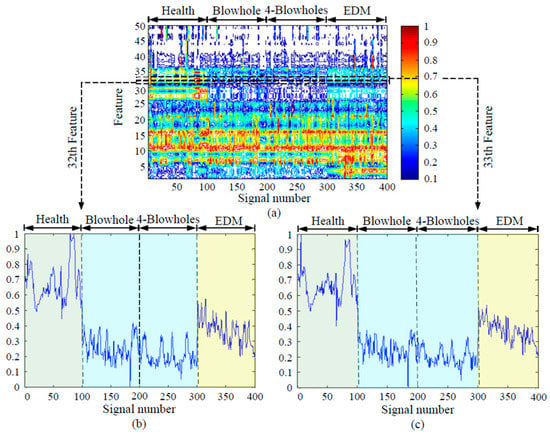
Figure 23.
HHT features energy diagram (100% loading rate, no noise): (a) feature energy diagram, (b) the enlarged diagram of the 32nd feature, (c) the enlarged diagram of the 33rd feature.
The various SNR of WGN, 30, 25, and 20 dB are added to the signals, three kinds of signal analysis methods are used to analyze the signal, and obtain features, including six FFT-based features, 25 MRA-based features, and 50 HHT-based features, and then PNN and BPNN, respectively, used as classifiers for classification and recognition, the recognition rate of PNN classification is shown in Table 1. The recognition rate of FFT is lower than MRA and HHT which have more feature numbers. The recognition rate of HHT is 94.8% under ∞dB noise and 84.5% under 25 dB noise, but it decreases to 68.4% under 20 dB noise which shown lack of anti-noise capability. The recognition rate of MRA is similar to HHT under low noise, but 74.6% is higher than HHT under 20 dB noise.

Table 1.
The recognition rate of PNN (%).
The trend of recognition rate toward PNN and noise interference is shown in Figure 24. From ∞ dB to 25 dB noise, the trend of anti-noise recognition rate is still appearing as a linear trend on FFT. It is similar on HHT and MRA, both of two method show a linear trend from ∞ dB to 25 dB, but HHT has quite an obvious descent that it is not sufficient on the anti-noise ability from 25 to 20 dB. However, MRA always shows a stationary linear trend. Figure 25 represents the recognition rate toward PNN and the load conditions, FFT has a lower recognition rate than HHT and MRA under each load condition, although the recognition rate of HHT is similar to MRA under light, medium, and heavy load conditions, but MRA has a higher recognition rate under no load condition. Q.C. (Quality Control) is routine test in the manufacturing process of motors.
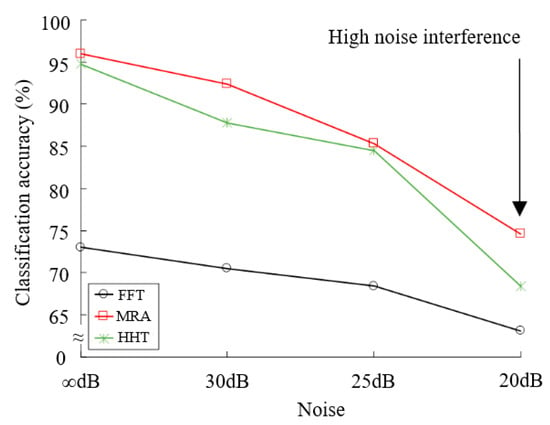
Figure 24.
The trend of recognition rate for PNN and noise interference.
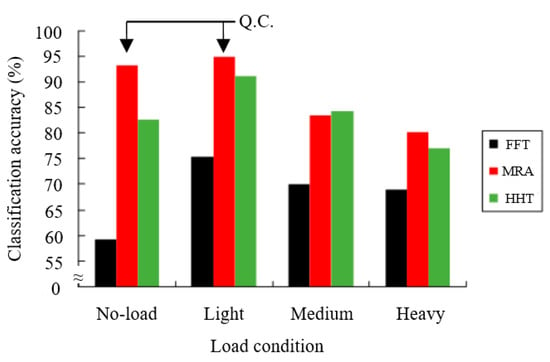
Figure 25.
The recognition rate of PNN and load conditions.
Table 2 shows the recognition rate of using BPNN classification, it is quite obvious that FFT is lower than MRA and HHT at various degrees of noise, and the recognition rate of MRA approximates to HHT at 25 dB noise, but it is 85.3% at 20 dB noise.

Table 2.
The recognition rate of BPNN (%).
Figure 26 represents the trend of the recognition rate toward BPNN and the noise interference, which the anti-noise tendency of MRA and HHT still show a linear trend from ∞ dB to 25 dB, but HHT has quite an obvious descent that it is not sufficient on the anti-noise ability from 25 to 20 dB. However, MRA always shows a stationary linear trend. Figure 27 represents the recognition rate toward BPNN and the load conditions, HHT has a higher recognition rate under medium load and heavy load conditions, but MRA has a higher recognition rate under light load and no load conditions, it has the advantage of the no load condition especially.
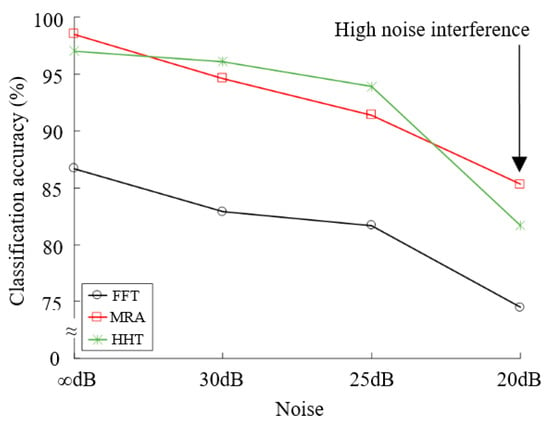
Figure 26.
The trend of recognition rate for BPNN and noise interference.
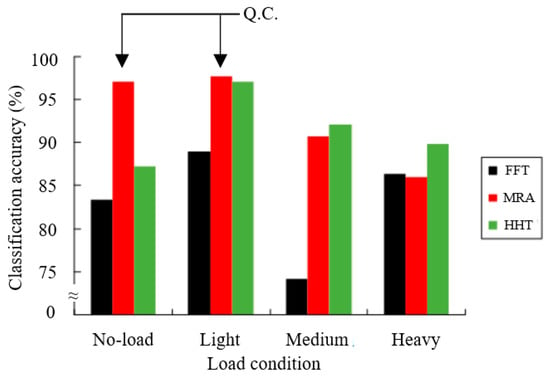
Figure 27.
The recognition rate of BPNN and load conditions.
5.4. Discussion
This study proposed a diagnosis method, combining the MRA signal analysis and the BPNN classification model, to recognize rotor defective problem of motors. The experimental evidence demonstrated that this proposed method has three advantages below:
- As mentioned above, a good time to diagnose defective rotor bars is in the QC process for motor manufacture, and this study proposes the method has the high recognition rate of 97.0% under no-load and 97.6% under light-load conditions, respectively, it more advantage compared with another two kinds of signal analysis methods, especially under no-load condition. Under no-load condition, MRA recognition rate of 97.0% is higher than the HHT of 87.2%.
- Suitable for high noise workshops: the recognition rate still has 85.3% under 20 dB high noise interference environment, for example it has a good anti-noise ability.
- Only a few features can make the defective recognition; MRA recognizes only half of the features of HHT that can effectively reduce the recognition time.
6. Conclusions
This paper proposed a diagnosis method, combining signal analysis and NN classification algorithms under different loading rate conditions, to rotor defective problems of IM motors. FFT, MRA, and HHT were, respectively, used to analyze the motor current signals where six signals features were extracted from the signals, including maximum, minimum, mean, standard deviation, root-mean-square, and summation values of the raw matrix. The typical PNN and BPNN models were used to recognize the rotor bar defects of motors, and this paper studied the advantages and disadvantages, combining three kinds of signal analysis methods with two kinds of NN, to apply in the rotor bars defects of motors.
Furthermore, this paper considered the anti-noise ability for the environment where the various SNR of WGN, 30, 25, and 20 dB, were added to the signals to verify the robustness of the proposed method.
The results of experiment and Matlab simulation show that the recognition rate of BPNN is higher than PNN, and MRA is has a more linear stationary recognition rate than HHT for anti-noise interference. As mentioned above, this paper recommends that MRA combined with BPNN is the comparatively good method for diagnosing the rotor bar defects of motors.
Author Contributions
Conceptualization, C.-Y.L., K.-Y.H., L.-Y.J. and G.-L.Z.; Methodology, C.-Y.L., K.-Y.H., L.-Y.J. and G.-L.Z.; Software C.-Y.L., K.-Y.H., L.-Y.J. and G.-L.Z.; Validation, C.-Y.L., K.-Y.H., L.-Y.J. and G.-L.Z.; Formal Analysis, C.-Y.L., K.-Y.H., L.-Y.J. and G.-L.Z.; Investigation, C.-Y.L., K.-Y.H., L.-Y.J. and G.-L.Z.; Resources, C.-Y.L., K.-Y.H., L.-Y.J. and G.-L.Z.; Data Curation, C.-Y.L., K.-Y.H., L.-Y.J. and G.-L.Z.; Writing-Original Draft Preparation, C.-Y.L., K.-Y.H., L.-Y.J. and G.-L.Z.; Writing-Review & Editing, C.-Y.L., K.-Y.H., L.-Y.J. and G.-L.Z.; Visualization, C.-Y.L., K.-Y.H., L.-Y.J. and G.-L.Z.; Supervision, C.-Y.L.; Project Administration, C.-Y.L.; Funding Acquisition, C.-Y.L. All authors have read and agreed to the published version of the manuscript.
Funding
This research received no external funding.
Conflicts of Interest
The authors declare no conflict of interest.
References
- Asad, B.; Vaimann, T.; Belahcen, A.; Kallaste, A. Broken rotor bar fault diagnostic of inverter fed induction motor using FFT, Hilbert and Park’s Vector Approach. In Proceedings of the XIII International Conference on Electrical Machines (ICEM), Alexandroupoli, Greece, 3–6 September 2018; pp. 1–7. [Google Scholar]
- Asad, B.; Vaimann, T.; Belahcen, A.; Kallaste, A.; Rassõlkin, A.; Iqbal, M.N. Broken rotor bar fault detection of the grid and inverter-fed induction motor by effective attenuation of the fundamental component. IET Electr. Power Appl. 2018, 13, 2005–2014. [Google Scholar] [CrossRef]
- Hassan, O.E.; Amer, M.; Abdelsalam, A.K.; Williams, B.W. Induction motor broken rotor bar fault detection techniques based on fault signature analysis—A review. IET Electr. Power Appl. 2018, 12, 895–907. [Google Scholar] [CrossRef]
- Ceban, A.; Pusca, R.; Romary, R. Study of rotor faults in induction motors using external magnetic field analysis. IEEE Trans. Ind. Electron. 2012, 59, 2082–2093. [Google Scholar] [CrossRef]
- Romary, R.; Corton, R.; Thailly, D.; Brudny, J.F. Induction machine fault diagnosis using an external radial flux sensor. EPJ. Appl. Phys. 2005, 32, 125–132. [Google Scholar] [CrossRef]
- Pusca, R.; Romary, R.; Ceban, A.; Brudny, J.F. An online universal diagnosis procedure using two external flux sensors applied to the ac electrical rotating machines. Sensors 2010, 10, 10448–10466. [Google Scholar] [CrossRef]
- Yazidi, A.; Henao, H.; Capolino, G.A.; Artioli, M.; Filippetti, F.; Casadei, D. Flux signature analysis: An alternative method for the fault diagnosis of induction machines. In Proceedings of the IEEE Power Tech, St. Petersburg, Russia, 27–30 June 2005; pp. 1–6. [Google Scholar]
- Dias, G.; Chabu, E. Spectral analysis using a hall effect sensor for diagnosing broken bars in large induction machines. IEEE Trans. Instrum. Meas. 2014, 63, 2890–2902. [Google Scholar] [CrossRef]
- Oumaamar, M.; Khezzar, A.; Boucherma, M.; Razik, H.; Andri, R.N.; Baghli, L. Neutral voltage analysis for broken rotor bars detection in induction motors using Hilbert Transform phase. In Proceedings of the 2007 IEEE Industry Applications Annual Meeting, New Orlean, LA, USA, 23–27 September 2007; pp. 1940–1947. [Google Scholar]
- Khezzar, A.; Oumaamar, M.; Hadjami, M.; Boucherma, M.; Razik, H. Induction motor diagnosis using line neutral voltage signatures. IEEE Trans. Ind. Electron. 2009, 56, 4581–4591. [Google Scholar] [CrossRef]
- Soualhi, A.; Clerc, G.; Razik, H. Detection and diagnosis of faults in induction motor using an improved artificial Ant Clustering technique. IEEE Trans. Ind. Electron. 2013, 60, 4053–4062. [Google Scholar] [CrossRef]
- Antonino-Daviu, J.; Riera-Guasp, M.; Pons-Llinares, J.; Park, J.; Bin Lee, S.; Yoo, J.; Kral, C. Detection of broken outer-cage bars for double-cage induction motors under the startup transient. IEEE Trans. Ind. Appl. 2012, 48, 1539–1548. [Google Scholar] [CrossRef]
- Ordaz-Moreno, A.; Romero-Troncoso, R.; Alberto Vite-Frias, J.; Rooney Rivera-Gillen, J.; Garcia-Perez, A. Automatic online diagnosis algorithm for broken-bar detection on induction motors based on discrete wavelet transform for FPGA Implementation. IEEE Trans. Ind. Electron. 2008, 55, 2193–2202. [Google Scholar] [CrossRef]
- Climente-Alarcon, V.; Antonino-Daviu, J.; Vedreño-Santos, F.; Puche-Panadero, R. Vibration transient detection of broken rotor bars by PSH Sidebands. IEEE Trans. Ind. Appl. 2013, 49, 2576–2582. [Google Scholar] [CrossRef]
- Sadoughi, A.; Ebrahimi, M.; Moalem, M.; Sadri, S. Intelligent diagnosis of broken bars in induction motors based on new features in vibration spectrum. In Proceedings of the 2007 IEEE International Symposium on Diagnostics for Electric Machines, Power Electronics and Drives, Cracow, Poland, 6–8 September 2007; pp. 106–111. [Google Scholar]
- Akcay, H.; Germen, E. Identification of acoustic spectra for fault detection in induction motors. In Proceedings of the Africon IEEE, Pointe Aux Piments, Mauritius, 9–12 September 2013; pp. 1–5. [Google Scholar]
- Li, W.D.; Mechefske, C.K. Detection of induction motor faults: A comparison of stator current vibration and acoustic methods. J. Vib. Control 2006, 12, 165–188. [Google Scholar] [CrossRef]
- Filho, E.R.; Riehl, R.R.; Avolio, E. Automatic three-phase squirrel cage induction motor test assembly for motor thermal behavior studies. In Proceedings of the IEEE Industrial Electronics, Santiago, Chile, 25–27 May 1994; pp. 204–209. [Google Scholar]
- Gyftakis, K.N.; Spyropoulos, D.V.; Kappatou, J.C.; Mitronikas, E.D. A novel approach for broken bar fault diagnosis in induction motors through torque monitoring. IEEE Trans. Energy Convers. 2013, 28, 267–277. [Google Scholar] [CrossRef]
- Antonino-Daviu, J.; Riera-Guasp, M.; Pons-Llinares, J.; Roger-Folch, J.; Perez, R.; Charlton-Perez, C. Toward condition monitoring of damper windings in synchronous motors via EMD analysis. IEEE Trans. Energy Convers. 2012, 27, 432–439. [Google Scholar] [CrossRef]
- Jung, J.H.; Lee, J.J.; Kwon, B.H. Online diagnosis of induction motors using MCSA. IEEE Trans. Ind. Electron. 2006, 53, 1842–1852. [Google Scholar] [CrossRef]
- Bishop, T. Squirrel cage rotor testing. In EASA Convention; Electrical Apparatus Service Association, Inc.: St. Louis, MO, USA, 2003; pp. 1–26. [Google Scholar]
- Ferrah, A.; Bradley, K.J.; Asher, G.M. An FFT-based novel approach to noninvasive speed measurement in induction motor drives. IEEE Trans. Instrum. Meas. 1992, 41, 797–802. [Google Scholar] [CrossRef]
- Kral, C.; Habetler, T.G.; Harley, R.G.; Pirker, F.; Pascoli, G.; Oberguggenberger, H.; Fenz, C.J.M. A comparison of rotor fault detection techniques with respect to the assessment of fault severity. In Proceedings of the 4th IEEE International Symposium on Diagnostics for Electric Machines, Power Electronics and Drives (SDEMPED 2003), Atlanta, GA, USA, 24–26 August 2003; pp. 265–270. [Google Scholar]
- Sadeghian, A.; Ye, Z.; Wu, B. Online detection of broken rotor bars in induction motors by Wavelet Packet Decomposition and Artificial Neural Networks. IEEE Trans. Instrum. Meas. 2009, 58, 2253–2263. [Google Scholar] [CrossRef]
- Khan, M.A.S.K.; Radwan, T.S.; Azizur Rahman, M. Real-time implementation of wavelet packet transform-based diagnosis and protection of three-phase induction motors. IEEE Trans. Energy Convers. 2007, 22, 647–655. [Google Scholar] [CrossRef]
- Antonino-Daviu, J.A.; Riera-Guasp, M.; Folch, J.R.; Palomares, M.P.M. Validation of a new method for the diagnosis of rotor bar failures via wavelet transform in industrial induction machines. IEEE Trans. Ind. Appl. 2006, 42, 990–996. [Google Scholar] [CrossRef]
- Yi-bing, L.; Qi, W.; Zhi-yong, M.; Ke-guo, Y. An improved Hilbert-Huang Transform and its application in faults signal analysis. In Proceedings of the IEEE International Conference on Mechatronics and Automation, Luoyang, China, 25–28 June 2006; pp. 2426–2431. [Google Scholar]
- Espinosa, A.G.; Rosero, J.A.; Cusid´o, J.; Romeral, L.; Ortega, J.A. Fault Detection by Means of Hilbert–Huang Transform of the Stator Current in a PMSM With Demagnetization. IEEE Trans. Energy Convers. 2010, 25, 312–318. [Google Scholar] [CrossRef]
- Tse, N.C.F.; Chan, J.Y.C.; Lau, W.H.; Lai, L.L. Hybrid wavelet and hilbert transform with frequency-shifting decomposition for power quality analysis. IEEE Trans. Instrum. Meas. 2012, 61, 3225–3233. [Google Scholar] [CrossRef]
- Xu, B.; Sun, L.; Xu, L.; Xu, G. Improvement of the Hilbert Method via ESPRIT for Detecting Rotor Fault in Induction Motors at Low Slip. IEEE Trans. Energy Convers. 2013, 28, 225–233. [Google Scholar] [CrossRef]
- Kreyszig, E. Advanced Engineering Mathematics, 8th ed.; John Wiley & Sons: New York, NY, USA, 1999. [Google Scholar]
- Cooley, J.W.; Tukey, J.W. An algorithm for the machine calculation of complex Fourier series. Math. Comput. 1965, 19, 297–301. [Google Scholar] [CrossRef]
- Grossman, A.; Morlet, J. Decompositions of hardy functions into square integrable wavelet of constant shape. Soc. Ind. Appl. Math. J. Math. Anal. 1984, 15, 723–736. [Google Scholar] [CrossRef]
- Mallat, S. A theory for multiresolution signal decomposition: The wavelet representation. IEEE Trans. Pattern Anal. Mach. Intell. 1989, 11, 674–693. [Google Scholar] [CrossRef]
- Hamid, E.; Kawasaki, Z. Instrument for the quality analysis of power systems based on the wavelet packet transform. IEEE Power Eng. Rev. 2002, 22, 52–54. [Google Scholar] [CrossRef]
- Huang, N.; Shen, S. Hilbert-Huang Transform and Its Applications; B & JO Enterprise: Singapore, 2005. [Google Scholar]
- Ayhan, B.; Chow, M.-Y.; Song, M.H. Multiple discriminant analysis and neural-network-based monolith and partition fault-detection schemes for broken rotor bar in induction motors. IEEE Trans. Ind. Electron. 2006, 53, 1298–1308. [Google Scholar] [CrossRef]
- Mishra, S.; Bhende, C.N.; Panigrahi, B.K. Detection and classification of power quality disturbances using s-transform and probabilistic neural network. IEEE Trans. Power Deliv. 2008, 23, 280–287. [Google Scholar] [CrossRef]
- Ghate, V.N.; Dudul, S.V. Cascade neural-network-based fault classifier for three-phase induction motor. IEEE Trans. Ind. Electron. 2011, 58, 1555–1563. [Google Scholar] [CrossRef]
- Tamura, S.; Tateishi, M. Capabilities of a four-layered feedforward neural network: Four layers versus three. IEEE Trans. Neural Netw. 1997, 8, 251–255. [Google Scholar] [CrossRef]
- Huang, G.B.; Chen, L.; Siew, C.K. Universal approximation using incremental constructive feedforward networks with random hidden nodes. IEEE Trans. Neural Netw. 2006, 17, 879–892. [Google Scholar] [CrossRef] [PubMed]
- Charalambous, C. Conjugate gradient algorithm for efficient training of artificial neural networks. IEEE Proc. G 1992, 139, 301–310. [Google Scholar] [CrossRef]
- Specht, D.F. Probabilistic neural networks. Neural Netw. 1990, 3, 109–118. [Google Scholar] [CrossRef]
- Mohammed, O.A.; Abed, N.Y.; Ganu, S. Modeling and characterization of induction motor internal faults using finite-element and discrete wavelet transforms. IEEE Trans. Magn. 2006, 42, 3434–3436. [Google Scholar] [CrossRef]
- Ayhan, B.; Trussell, H.J.; Chow, M.Y.; Song, M.H. On the use of a lower sampling rate for broken rotor bar detection with DTFT and AR-Based Spectrum Methods. IEEE Trans. Ind. Electron. 2008, 55, 1421–1434. [Google Scholar] [CrossRef]
- Sizov, G.Y.; Ahmed, A.S.; Yeh, C.C.; Demerdash, N.A.O. Analysis and diagnostics of adjacent and nonadjacent broken-rotor-bar faults in squirrel-cage induction machines. IEEE Trans. Ind. Electron. 2009, 56, 4627–4641. [Google Scholar] [CrossRef]
Publisher’s Note: MDPI stays neutral with regard to jurisdictional claims in published maps and institutional affiliations. |
© 2020 by the authors. Licensee MDPI, Basel, Switzerland. This article is an open access article distributed under the terms and conditions of the Creative Commons Attribution (CC BY) license (http://creativecommons.org/licenses/by/4.0/).