Article

Vibrational Circular Dichroism Detects Symmetry Breaking due to Conformational Mobility in C2-Symmetry Chiral Molecules and Provides Further Insight into Inter-Chromophoric Interactions

1
Dipartimento di Medicina Molecolare e Traslazionale, Università di Brescia, Viale Europa 11, 25123 Brescia, Italy
2
Istituto Nazionale di Ottica (INO), C.N.R., Research Unit of Brescia, via Branze 45, 25123 Brescia, Italy
3
Regional Health Inspectorate, 7 Prince Al. Battenberg I Str., 5800 Pleven, Bulgaria
4
Chemistry Department, University of Nevada, Reno, NV 89557, USA
*
Author to whom correspondence should be addressed.
Symmetry 2020, 12(11), 1752; https://doi.org/10.3390/sym12111752
Submission received: 24 September 2020 / Revised: 19 October 2020 / Accepted: 20 October 2020 / Published: 22 October 2020
(This article belongs to the Special Issue Chiral Molecules: Properties, Synthesis and Analysis)

Abstract

:
Bicyclo[3.3.1]nonane-2,6-dione (1) and bicyclo[3.3.1]nona-3,7-diene-2,6-dione (2) have been examined by vibrational circular dichroism (VCD), which, as for most C2-symmetric systems, exhibits strong VCD signals. In the case of 2, VCD signals are stronger and sharper with several bisignate doublets; for 1, signals are less intense and broader. The VCD and IR spectra are excellently predicted by DFT calculations: only one conformer is present for 2, while for 1, three main conformers, related through concerted skeleton torsional motions are present (two of them being interchanged by C2-rotation). The VCD spectrum shows specific features for the different conformers, such that correct population factors are crucial for reproducing experimental data. Also, the TD-DFT prediction of ECD (electronic circular dichroism) spectra is good. By comparing the spectroscopic signature of the two molecules (both VCD and ECD) and by careful analysis of the theoretical results, the role of the C=C double bond in compound (2) is evidenced. The double bond contributes toward enhancing the CD response both electronically and vibrationally.

Graphical Abstract

1. Introduction

Bicyclo[3.3.1]nonane-2,6-dione (1) and bicyclo[3.3.1]nona-3,7-diene-2,6-dione (2) in Scheme 1 was synthesized earlier and studied [1,2,3,4,5,6] to learn whether and to what extent electron delocalization through homo-conjugation and transannular interactions, defined by Hoffman et al. [7], manifest in the characteristics of a “coupled” chromophore [8,9,10]. Evidence was provided by 13C-NMR chemical shift δ(C=O), photoelectron spectroscopic data [1], as well as electronic circular dichroism (ECD) data [2]. The interchromophoric interaction present in unsaturated ketones shows clear spectroscopic signatures and is amply studied in the literature [2]. The characteristic of compound 2 is the presence of two olefinic moieties in the α, β and β, γ position with respect to one carbonyl, and in the reverse orientation with respect to the other carbonyl. In this work, we examined whether vibrational circular dichroism (VCD) [11,12] can provide further independent information on (1) the interaction of symmetrically disposed ketone carbonyl moieties within the same molecule and (2) the influence of C=C double bonds on spectroscopic response. The presence of the two moieties promises exquisite spectroscopic sensitivity to symmetry breaking in the case of 1, which is possible due to conformational mobility. In contrast, 2 is structurally rigid and a good example for elucidating the influence of the C=C double bonds by comparison with its saturated counterpart. Our study relies on the fact that most vibrational bands in the mid-IR are determined by normal modes [11,12], which are largely delocalized over the entire molecule. Such investigations allow us to learn more about the interaction of the two components by exploiting information obtained in different spectroscopic regions. A particular advantage provided by 1 and 2 is expected from their C2-symmetry, which, in many cases, has been shown to be responsible for quite intense VCD spectra (see for example References [13,14,15,16,17,18,19,20,21]). Two important aspects of this study are: (1) the characterization of conformers of the saturated diketone 1 for which the conformational mobility plays an important role in explaining the VCD data; and (2) analysis of the influence of the diene moiety in 2 which collectively provides a basis for understanding the intense VCD and ECD.

2. Materials and Methods

The syntheses and characterization of compounds 1 and 2 are described in References [1,2,3,4,5,6].
VCD measurements were run on a Jasco FVS6000 instrument, utilizing an MCT detector for the region 850–2000 cm−1 and an InSb detector for 2700–3200 cm−1; spectra were taken for concentration values in the range 0.02–0.05 M in CCl4 solvent, and 5000 scans were collected and averaged. The IR and VCD spectra for the solvent obtained in the same conditions were subtracted from the corresponding spectra of the samples. The cell employed for the first two regions was a BaF2-0.2 mm cell, while an infrasil® 1 mm quartz cell was employed for the CH-stretching region. We made sure to keep the concentration lower than usual in order to make it possible to interpret VCD spectra on the basis of DFT calculations for a single isolated molecule. We further took IR spectra at very low concentrations and noticed no significant change.
ECD measurements were performed using a Jasco 815 SE apparatus in CH3CN solutions with concentration values in the range 0.4–0.8 mM in 2 mm quartz cuvette, with 5 accumulations and solvent spectra subtracted out.
Calculations were performed with the Gaussian16 package [22], using the DFT methodology in the harmonic approximation for reproducing the IR and VCD spectra [11,12]. Preliminary conformational analysis was conducted initially by MM calculations and then reiterated with DFT. The spectra calculations were run at the B3LYP/TZVP level of theory, considering the molecule in vacuo. Calculated frequencies were opportunely scaled to compare with experimental data. Simulated spectra were obtained by assigning Lorentzian band-shapes with 8 cm−1 bandwidth. TD-DFT calculations were conducted at CAM-B3LYP/aug-cc-pVDZ level of theory, with Gaussian bandshapes assigned to the 0.2 eV band-width. Previously, calculations of the ECD spectra of the title compounds were presented by Stephens et al. [23].

3. Results and Discussion

3.1. IR and VCD Spectra of 1

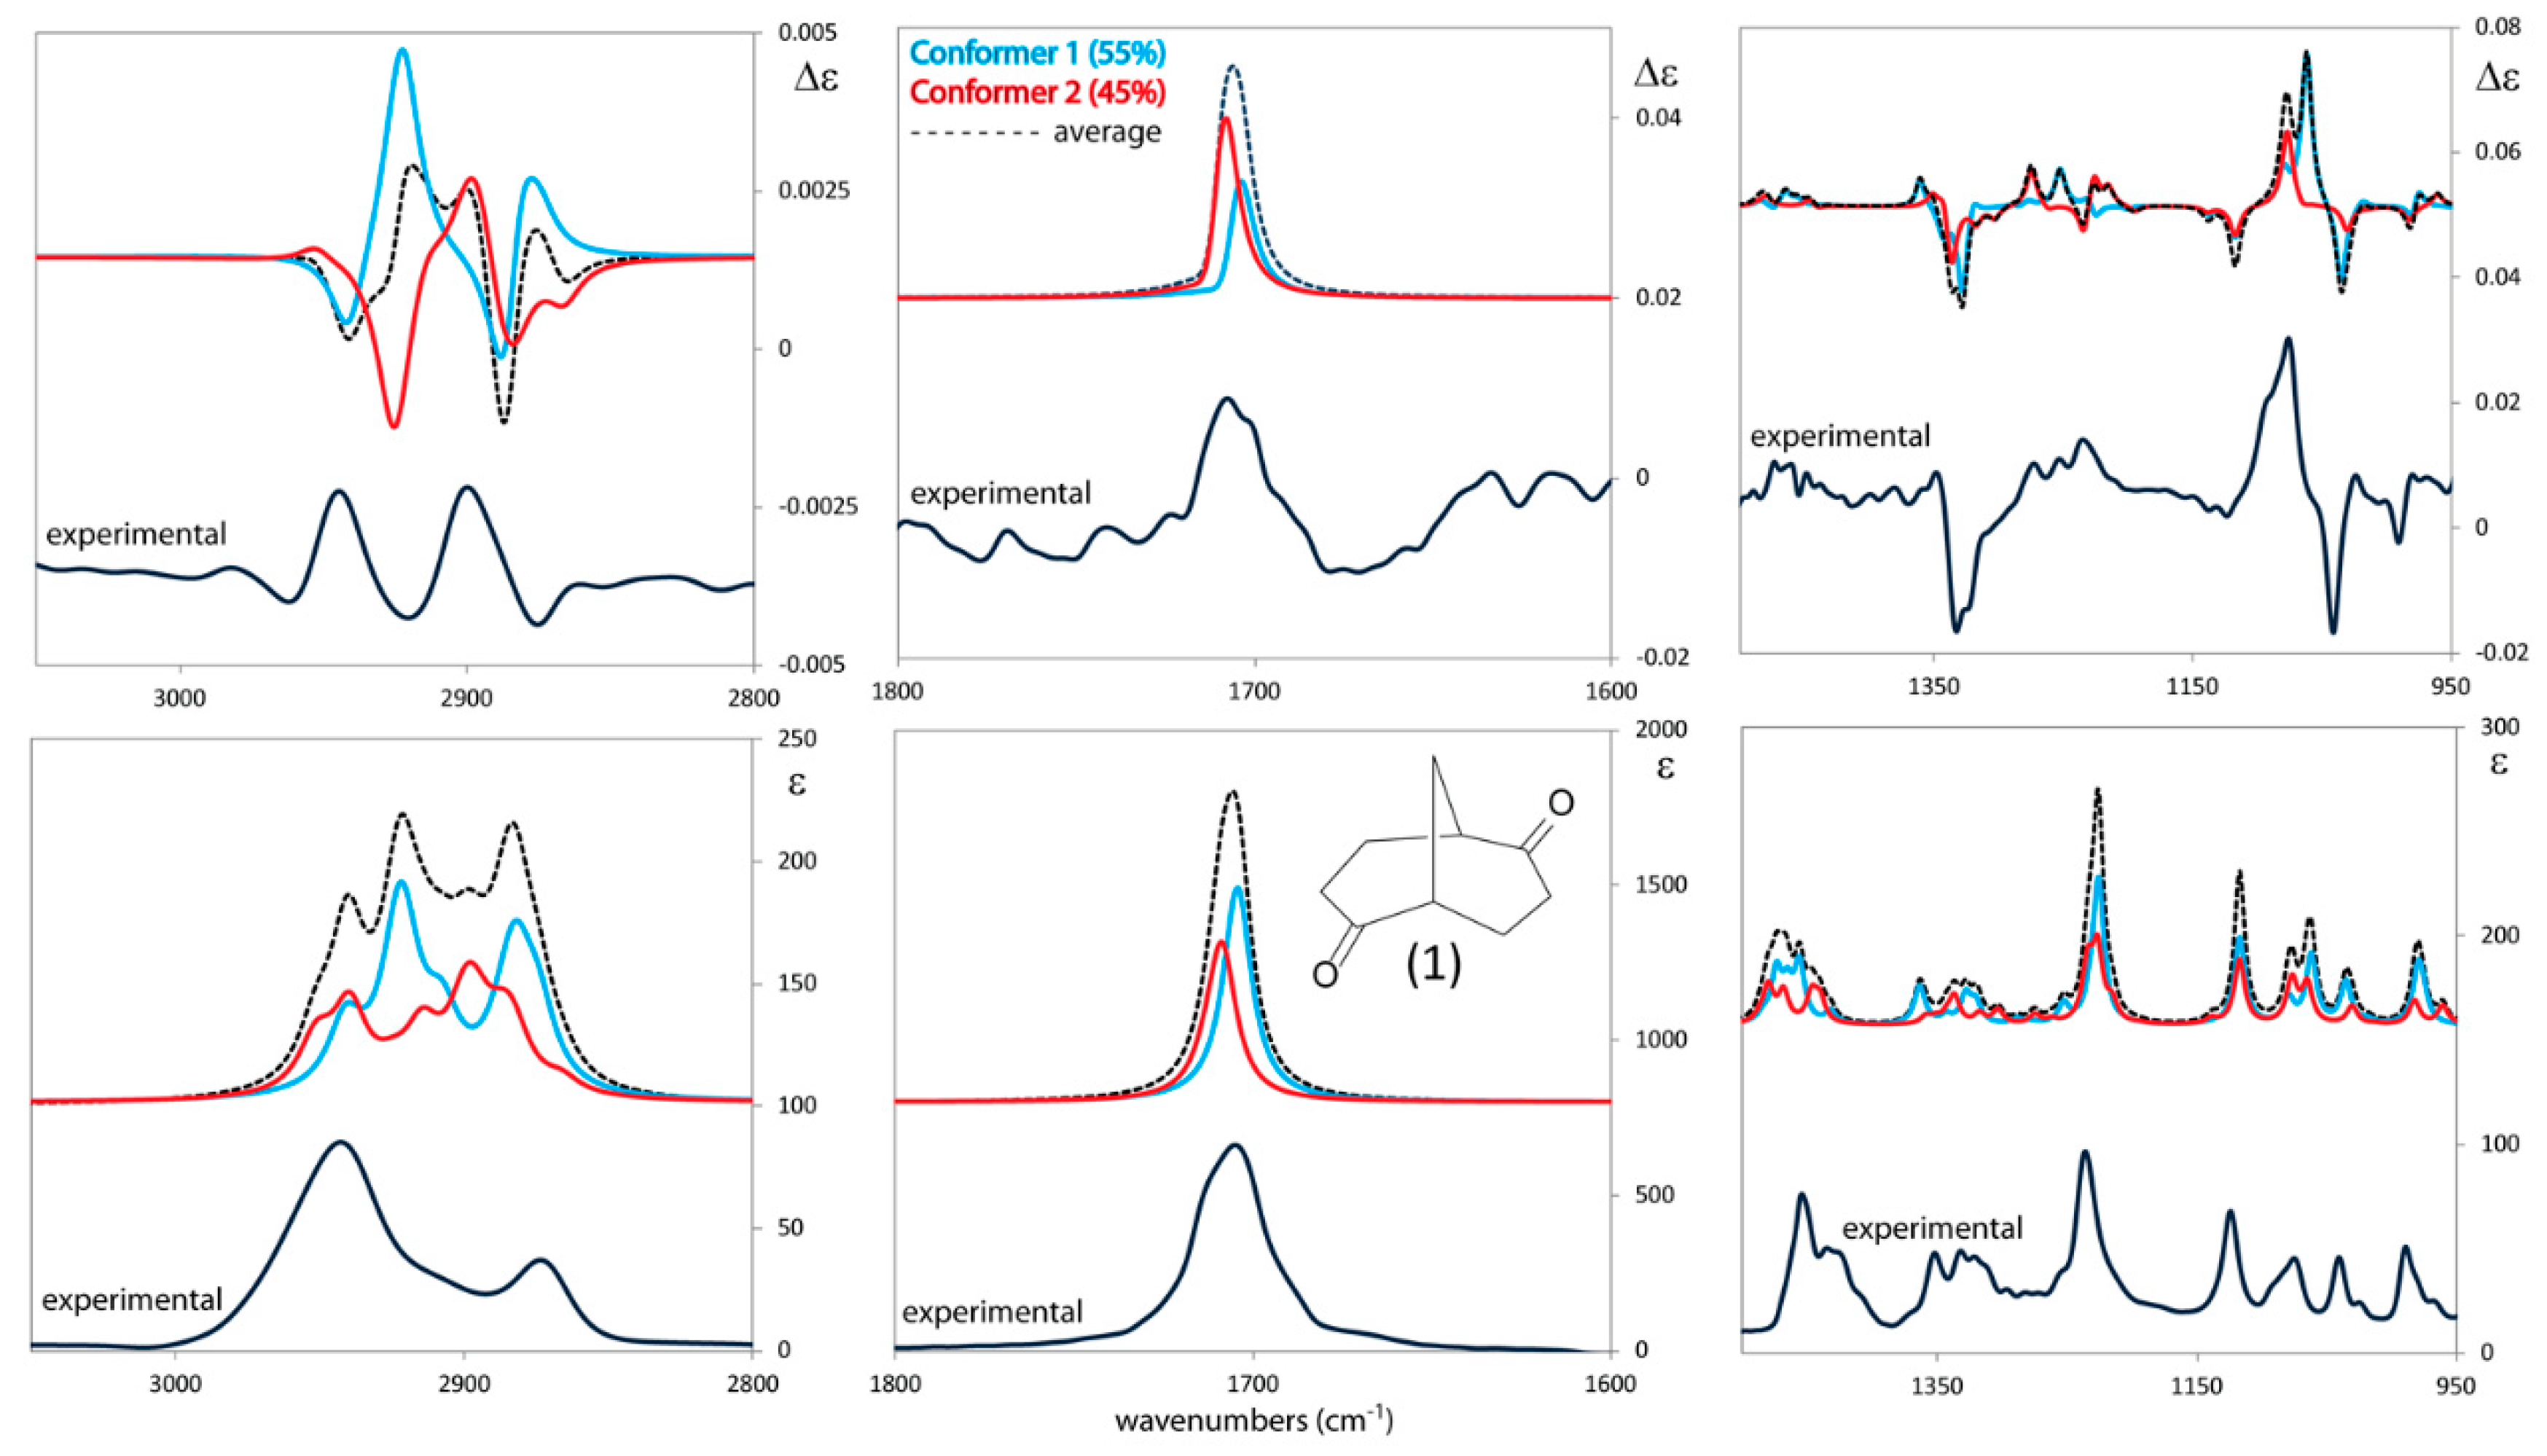
In Figure 1, we provide a comparison of experimental and calculated IR and VCD spectra for bicyclo[3.3.1]nonane-2,6-dione (1). The molecule may adopt different conformations, a chair-chair (cc) conformation and two chair-boat (cb) [2,23] conformations. The latter are transformed into each other by C2-symmetry rotations, as will be discussed below. The spectra corresponding to the two structures presented in Figure 1 are weighted with the corresponding population factors. Considering their average, the comparison is quite good in the mid-IR and in the C=O stretching regions and is acceptable in the CH-stretching region (left part of Figure 1). Different wavenumber scaling factors have been applied in the different spectroscopic regions due to the notorious influence of anharmonicity [24], which has been neglected in the present work and is particularly difficult to deal with in the presence of large amplitude motions (vide infra). Differences between calculated and experimental spectra in the CH stretching region are expected due to the Fermi Resonance phenomenon, which is known to anharmonically couple HCH-bending and symmetric CH-stretching modes in methylene groups [25,26]. The carbonyl-stretching region (center of Figure 1) does not exhibit an evident exciton-type behavior, and this is accounted for by the calculations of the spectra for both conformers and for the Boltzmann average thereof. The absence of an excitonic couplet is due to the fact that the C=O bonds are almost parallel to the vector O=C---C=O connecting the two moieties (in the notation of Reference [14] eq. 1–3: α1 = α2 = α ≈ 166° for the first conformer and α1 ≈ 173° and α2 ≈ 135°, the α-angles being defined as α = O=C---C for the second). For this reason, the coupled dipole contribution to the rotational strength is negligible in both conformers [14]. Of the two antisymmetric and symmetric modes (in order of increasing energy), only the first one bears infrared intensity (i.e., it exhibits a non-vanishing electric dipole transition moment). For the same reason, the corresponding VCD signal also prevails over the symmetric mode; thus, symmetry and C=O alignment explain the presence of just one normal mode contributing in this region. Ketone C=O stretching modes are often considered as isolated, i.e., “local” modes involving just the two carbonyl atoms; in this case, minor contaminations come from the two H atoms lying in the same plane of the H-C*-CO-CH moiety (Figure S1). The second non-symmetric conformer presents some IR contribution from the symmetric stretching but still to a negligible extent with respect to the antisymmetric mode. The broad and asymmetric shape of the IR and VCD band is well accounted for by the DFT calculations and is due to the presence of the three main conformers, two of which are equivalent by symmetry. The relative weight of the conformer populations predicted by DFT calculations and based on ∆G appears ideal for the prediction. Similar comments can be made for the mid-IR region (right part of Figure 1): in particular, the features at ca. 1085–1073 and 1330–1320 cm−1 appearing as split bands are due to the absolute minimum conformer and to the other two equivalent conformers (see Figure 2, left side). The normal modes underlying each one of the two features are illustrated in Figure S2 and one may see that they are mostly due to delocalized motions comprised of C-H bendings and CH2-wagging modes for the 1325 cm−1 split band, C-H bendings and CH2-twisting modes for the three positive weak bands at ca. 1250 cm−1, and C-H bendings and CH2-wagging-twisting and CC stretching for 1075 cm−1 split band.

3.2. Symmetry Breaking from Chair-Chair→ to Chair-Boat in Compound 1

As pointed out above, the conformational aspect is essential for understanding the VCD spectra. A theoretical analysis had been already reported in References [2,4,5,6,23]; the last study had been conducted by comparing different levels of calculations in order to account for the observed ECD spectrum (see below). In particular, two main conformers, cc and cb, have been indicated. To illustrate the conformational pattern and symmetry breaking effect, we built two-dimensional energy maps about the absolute (cc) and relative (cb) conformational minima as a function of dihedral angles τ1 = 1 − 2 − 3 − 4 and τ2 = 1 − 2′ − 3′ − 4′ (Figure 2) at the B3LYP/TZVP level. The global minimum (cc) was found at τ1 = +44° and τ2 = +44°, while two equivalent local minima (cb and bc) were found at τ1 = +52° and τ2 = +5° and at τ1 = +5° and τ2 = +52°. One further local minimum (bb) has too high an energy to significantly contribute to the spectra. The two saddle points (∆E ~ 1.9 kcal/mol) defining the transition states between the most populated conformer and the next two populated ones are found at τ1 = +50° and τ2 = +15° and at τ1 = +15° and τ2 = +50°. Conformer interconversion follows the curve defined by a reactive coordinate (a non-linear function of τ1 and τ2, indicated f(τ12) in Figure 2, right) which we have graphically constructed along the minimum energy path reported as a dashed line on the two-dimensional energy map of Figure 2 (center). This allowed us to draw the one-dimensional energy-profile from the 2D-energy map (Figure 2, right). Population values of the two minima (referenced to the corresponding Gibbs free energies) are crucial for the best reproduction of the relative heights of the 1075 and 1325 cm−1 doublets. Note that had we calculated population factors based on the electronic energy values of Figure 2, the prediction of the spectra would not have been so satisfactory. This fact was encountered previously in other molecules containing large amplitude motions [27].

3.3. IR and VCD Spectra of 2

The large amplitude motion commented on above is not present in bicyclo[3.3.1]nona-3,7-diene-2,6-dione (2) because the 8-membered ring bearing the two C=O groups is rendered rigid by the presence of the C=C bonds. Analogously to 1, the dihedral angles found in 2 have the following values: τ1 = +35.7° and τ2 = +35.7°, which are not too far from the global minimum of 1. The IR and VCD spectra of 2 (Figure 3) have a different aspect from those corresponding to 1, with generally larger dissymmetry factor values g = ∆ε/ε = 4R/D (R and D are the rotational and dipole strengths respectively) for all observed bands relative to 1, indicative of a “conformational robustness” [28]. First, we notice that the CH-stretching region (Figure 3, left) contains fewer congested features than for 1, especially for VCD. DFT calculations allow excellent prediction of the experimental data. The molecule possesses four olefinic CH bonds and four aliphatic bonds. As expected, only the second CHs are quite IR active, giving simple and fairly narrow bands assigned to vibrations delocalized on the H-C-CH2-C-H moiety. The negative feature at ca. 2870 cm−1 is the symmetric stretching; the positive one at ca. 2960 cm−1 is due to nearly degenerate contributions of opposite sign, from antisymmetric modes involving the four bonds. Both the C=O stretching feature at ca. 1680 cm−1 (Figure 3, center) and the weaker C=C stretching at ca. 1620 cm−1 are also well predicted by DFT calculations. From Figure S1, as observed previously for molecule 1, just the antisymmetric combination is observed, and the normal mode pattern is very similar, involving only slightly the two adjacent CH bonds lying in the same plane. Thus, for the same reasons discussed above, the typical bisignate aspect of coupled C=O vibrations is absent and only the antisymmetric, lower energy mode shows an intense electric dipole allowed feature. For compound 2, however, the carbonyl stretching rotational strength is quite large [18], despite the similar geometry and the strong similarity in the normal mode pattern in the two molecules: in 2, the presence of nearby double bonds increases the rotational strength of the antisymmetric stretching. In Table 1, we report the observed IR and VCD intensities for the carbonyl stretching region; from the recorded spectra the g factor is about 2 × 10⁻⁵ for compound 1, while it reaches 10−4 for compound 2. Finally, let us consider in the right part of Figure 3 the mid-IR region: we recognize that the doublet of negative VCD bands at ca. 1350 cm−1 bears some analogy with the 1325 cm−1 strong feature in 1 (in 2 though it is even stronger). From Figure S3A, we indeed see that the normal modes here bear some analogy to those of Figure S2 for compound 1. Other than this feature, the rest of the VCD and IR spectra of 1 and 2 are quite different, and from Figure S3B,C one may check that strong involvement of the bending and stretching coordinates of the diene moieties is taking place. Once again, as for the previous two spectroscopic regions, the g factor is much larger in 2 than in 1.

3.4. UV and ECD Spectra of 1 and 2

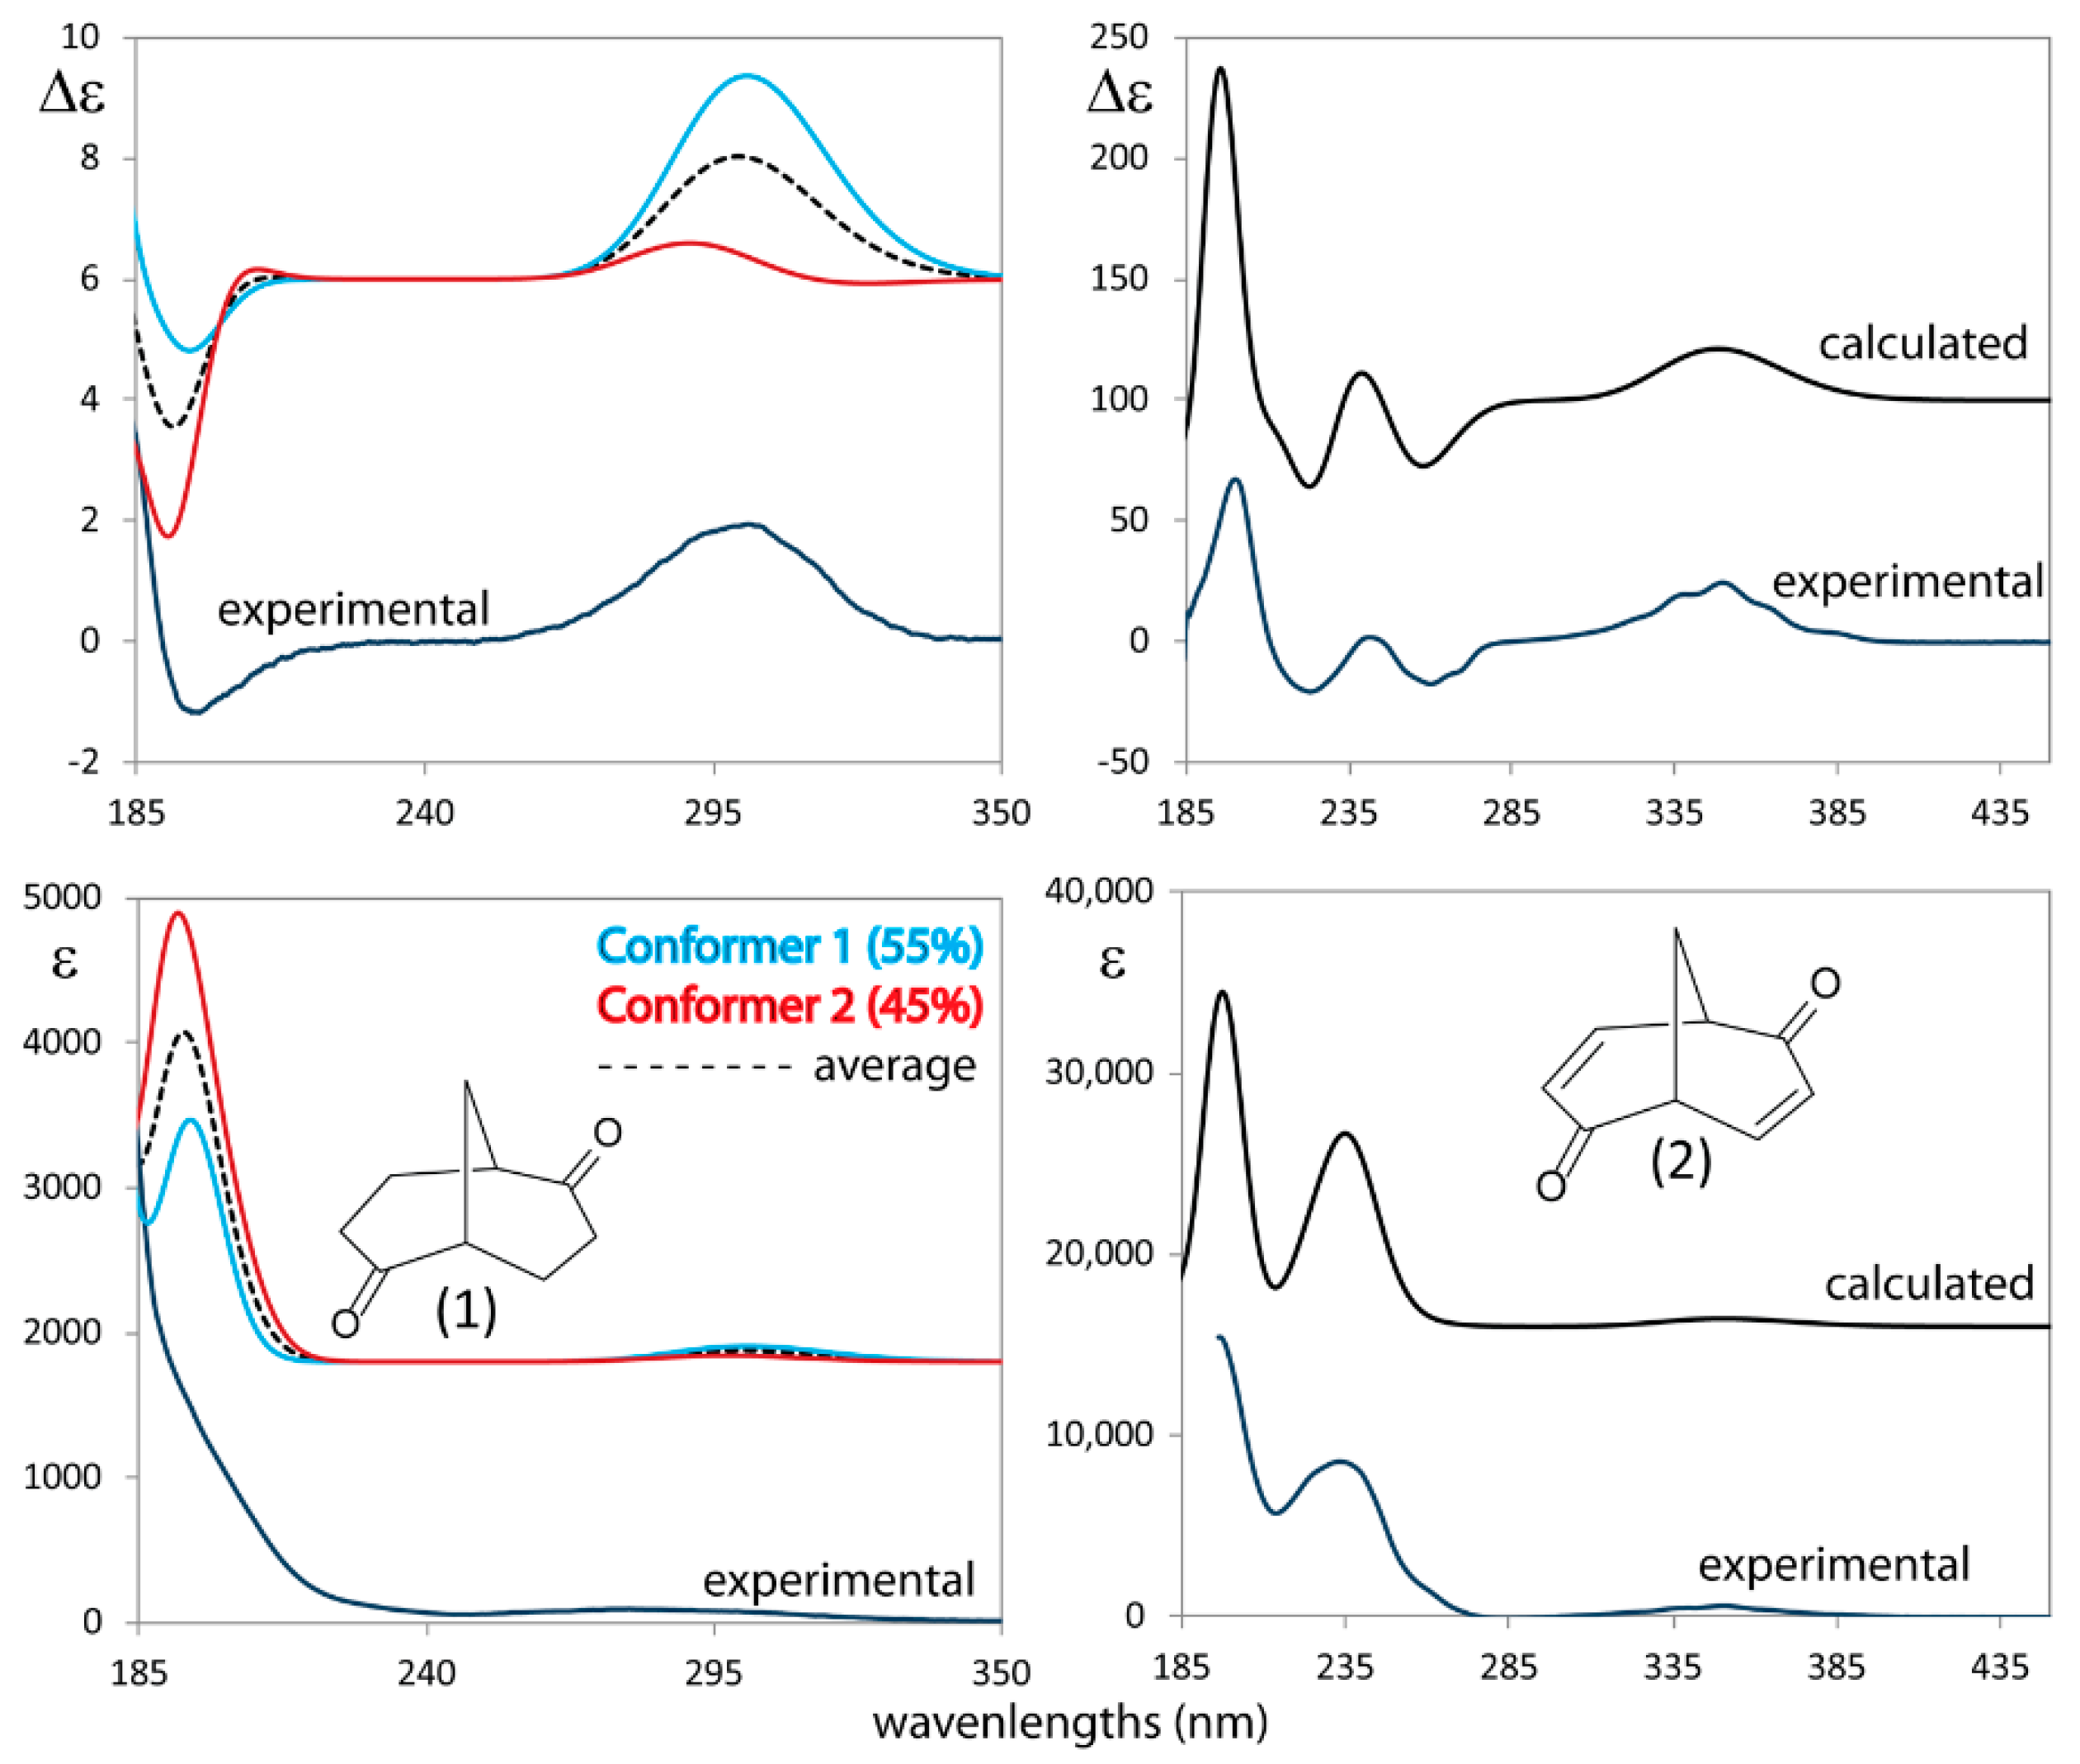
To describe the interplay of carbonyl and diene moieties in modulating chiroptical response, we re-examine here the UV and ECD spectra of 1 and 2, previously reported in References [1,2,3,4,5,6] (Figure 4). Both are diketones, and their differences and characteristics are indeed largely determined by the absence or presence of the C=C moieties. Both the UV and ECD are more intense for 2 than for 1, enhancements due typically to conjugation (Table 2) and understood via the strong involvement of the π→π* transition of the C=C chromophore in the n→π* and the π→π* transitions of the C=O moiety (features at 300–350 and 200 nm respectively). Of course, the π→π* transition for the enone is observed at 260–230 nm (in Figure S4 see the natural transition orbitals). Intensification by one order of magnitude in the ECD spectra from 1 to 2 corresponds to a similar intensification of the experimental specific optical rotation from 1 ([α]D = +217) to 2 ([α]D = +2397) (vide infra for recent literature in optical rotation studies). These behaviors were described at the outset of the employment of QM methods to interpret chiroptical data of coupled C=O and C=C chromophores, for which the formal definition of chromophores was first proposed on the basis of ab-initio methods and prototypical calculations for achiral acrolein and for bicyclo[2.2.2]oct-5-ene-2-one [2,8,9,10]. The appearance of clear vibronic features, which we observed at room temperature for the band at ca. 340 nm in compound 2, is on the other hand attributable to the rigidification of the 8-membered ring.

3.5. Interaction of the Ketone Carbonyls in Diketone 1

Computed UV and ECD of 1 are summarized in Table 3A,B and compared to monoketone C (where one C=O group is substituted by a CH2 group). As noted above, the two cc and cb conformers (Table 3A,B) of 1 orient the C=O groups differently with respect to each other, resulting in differing levels of either electric dipole-electric dipole interaction or transannular orbital interaction, as reflected by a different pattern of the CD contributions for the n→π* transitions near 290 nm. In fact, in conformer cc, the more intense component of the n→π* transition lies at lower energy. The opposite is obtained for cb, and both conformers exhibit net positive n→π* transitions with approximately twice the magnitude calculated in monoketone (Table 3C).
An explanation for the coupling of the two n→π* transitions, such as those seen in compound 1, conformers cc and cb, may be found by the coupling of the two moieties, as discussed for the structurally rigid diketone, bicyclo[2.2.1]heptan-2,7-dione, and for (+)-(1R)-bicyclo[2.2.2]oct-5-ene-2-one by Hansen and Moscowitz [8,9,10]. Further analysis via NMR has been supported by Gaussian 92 HF/3-21G calculations of Paddon-Row [29] favoring the electrostatic dipole-dipole coupling interpretation. More recently, the now classical homoconjugated norbornenone was reinvestigated by the DFT calculations in References [30,31,32]. Taking into account the computed results, it appears that the presence of a second C=O leads to splitting of the n→π* and π→π * C=O transitions, splitting also observed by photoelectron spectroscopy for gamma-diketones and by the C-13 chemical shifts of diketones vs. the corresponding mono-ketones [1]. However, from our results, it appears that the presence of two carbonyls instead of one does not have a clear-cut effect on CD, differing from what was observed considering photoelectron and NMR data [1], as can be seen (also considering compound 2) from the comparison of monoketones (Table 3C and Table 4B,C and Table S2) with diketones (Table 3A,B and Table 4A).

3.6. The Role of the C=C Double Bonds in the ECD and VCD (Carbonyl Stretching Region)

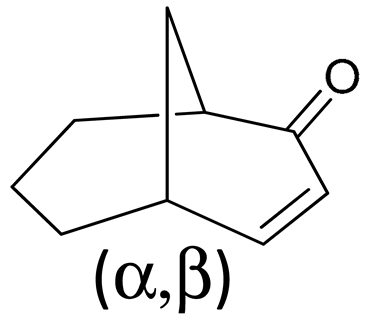
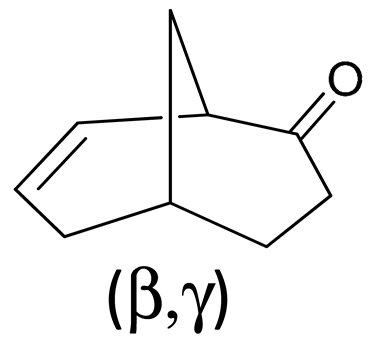
The above considerations led us to check whether both the electronic CD [2] and VCD, particularly in the carbonyl stretching region, can provide some information about conjugative effects due to C=C and C=O bond interactions. Concerning ECD, calculations of the spectroscopic response of 2 (Table 4A) and monoketone analogs (Table 4B,C) confirm the red-shift of the n→π* UV transition of 2 relative to 1, and of 2 relative to its monoketone analogs. They also account well for the fact that the electric dipole forbidden n→π* transitions acquire expected [33] dipole strength via direct conjugation with the adjacent C=C, with intensity increasing by more than one order of magnitude with respect to 1 (compare Table 3A,B and Table 4A). The rotational strength also increases, albeit to a lesser extent. Of the two computed n→π* transitions, the active one is the antisymmetric one, which is the lowest in energy for 1, while it is the second-lowest in energy for 2. A comparison with monoketone calculations permits one to analyze the intramolecular electronic interactions. In particular, it is interesting to note the effect of the C=C double bond location by comparing computed calculations for α,β-enone (B) and homoconjugated β,γ-enone (C) in Table 4. The effect in the first case is on the energy of the first transition; the increase in dipole strength is present but is weak. In contrast, in homoconjugated C (Table 4), the transition energy is not influenced, but both the dipole and rotational strengths (particularly the first) increase. Of course, the higher energy π→π* C=O electronic transitions are also quite sensitive to the presence of C=C groups, giving characteristic features at 200–240 nm classified as electron-transfer or K bands [34,35], herein manifesting in compound 2 with the two negative ECD features at about 260 and 233 nm.
Returning to the analysis of carbonyl stretching VCD data, calculations appear to predict the observations well, with some increase in absorption in compound 2 with respect to 1 and a very high increase in the corresponding VCD signal. As previously noted, the major contributions to the carbonyl stretching normal mode intensities come from the C and O carbonyls atoms; this permits analysis of the origin of VCD increase in the presence of the diene moiety by looking at their APT and AAT values, due to the local mode nature of these vibrations, analogously to what was done in Reference [36]. The (xz, yz, zz) components along the bond stretching direction z are the important ones. In Tables S1 and S2, the APT (∂μx,y,z/∂z) and AAT (∂mx,y,z/∂z, μ and m being the electric and magnetic dipole moments, respectively) of the carbonyl atoms are reported (the iz components of which are bold-face, and we repeat them here in Table 5 for 1 in the cc conformation and for 2), considering in all cases that the z-axis is directed along the C=O bond and the y-axis points toward the nearby asymmetric carbon C*. It can be observed that the APT do not change much from compound 1 to compound 2 (Tables S1A,B and S2 and Table 5), while variations in AAT components are more important, particularly the AAT zz component of both the carbon and oxygen atoms. This confirms the interpretation that the purely magnetic part is important, and these compounds are particularly useful to show the effect because the almost parallel orientation of the two carbonyls does not permit large coupled dipole contributions. The analysis is particularly simple for the two C2-symmetric molecules, namely 1-cc conformer and 2, exhibiting similar structures and a similar normal mode pattern for the carbonyls. Analogously to what was observed in the ECD case, comparison of model molecules with just one C=O (Table S1) and with one carbonyl and one C=C group in the α,β position (Table S2B) or β,γ position (Table S2C) suggests that the C=C moiety in the β,γ position makes a large contribution to the AAT and enhances the rotational strength of the carbonyl stretching mode. With the C=C moiety in the α,β position, however, a non-negligible rotational strength is calculated due to contributions from in-plane bending of the nearby olefinic hydrogens. Similar enhancement of VCD spectra, besides being observed, analyzed and explained in ref. [36], have been recently obtained in the case of α-amino acids due to N-acetyl and N-acryloyl substitutions in Reference [37].

4. Conclusions

From the compounds of this work and the sensitivity of the VCD technique, we were able to pinpoint signatures from different conformers: in the case of compound 1, a C2-symmetry cc-conformer and two non-symmetric cb-conformers which are equivalent under C2-rotation. The underlying conformational pattern had already been suggested through semiempirical and DFT calculations, available also for evaluating the corresponding ECD spectra. The latter, however, do not show high sensitivity in this case: only VCD confirms in a detailed fashion the theoretical findings. With the aid of calculations performed to obtain ECD and VCD spectra, the role of the C=C double bond on ketone C=O optical activity has been elucidated. Electronic absorption and ECD for the electrical dipole forbidden n→π* C=O transition provide evidence for enhancement from the C=C moiety: the β,γ position is oriented more effectively than the α,β position concerning the intensity, while the opposite happens considering frequency. Considering magnetic dipole forbidden C=O stretching, in cases for which the coupled dipole mechanism can be disregarded, VCD receives contributions from the C=C moiety in both the α,β position and β,γ. A similar situation had been observed and analyzed also in other diketones [36]. So, once again, the synthesis and availability of appropriate compounds have been demonstrated to be quite valuable for elucidating the electronic effect through chiroptical spectroscopies. We think that this adds a small independent contribution to research on the homoconjugation phenomenon, which is still receiving attention via both new experiments and theories [38,39].

Supplementary Materials

The following are available online at https://www.mdpi.com/2073-8994/12/11/1752/s1, Figures S1–S3: normal mode description of selected vibrational transitions of compounds 1 and 2. Figures S4 and S5: molecular orbital description of selected electronic transitions of compounds 1 and 2. Tables S1 and S2: APT and AAT of atoms C and O of C=O.

Author Contributions

G.M., S.A. and G.L. carried out the spectroscopic measurements and the ab-initio calculations. S.E.B. and D.A.L. provided the compounds. All authors participated equally in the design of the work and in the interpretation of the results. All authors have read and agreed to the published version of the manuscript.

Funding

Funding was provided by the Italian Ministry of Education, University and Research (MIUR) through the PRIN program (PRIN 2017, project “Physico-chemical Heuristic Approaches: Nanoscale Theory of Molecular Spectroscopy” (PHANTOMS), prot. 2017A4XRCA). We also thank Sebastian Cusumano for help with acquiring the VCD spectra.

Acknowledgments

The research was carried out with the support of Big&Open Data Innovation Laboratory (BODaI-Lab), University of Brescia, granted by Fondazione Cariplo and Regione Lombardia and of the Computing Center CINECA (Bologna), Italy

Conflicts of Interest

The authors declare no conflict of interest.

References

  1. Doerner, T.; Gleiter, R.; Robbins, T.A.; Chayangkoon, P.; Lightner, D.A. Homoconjugation and Transannular Orbital Interactions Detected by Photoelectron and 13C-NMR Spectroscopy. Bicyclo[3.3.1]nonane-2,6-dione and bicyclo[3.3.1]nona-3,7-diene-2,6-dione. J. Am. Chem. Soc. 1992, 114, 3235–3241. [Google Scholar] [CrossRef]
  2. Lightner, D.A.; Gurst, J.E. Stereochemstry from Circular Dichroism Spectroscopy; Wiley-VCH: New York, NY, USA, 2000. [Google Scholar]
  3. Gerlach, H. Racematspaltung und Bestimmung der absoluten Konfiguration von 2,6-disubstituierten Bicyclo [3.3.1]nonanen. Helv. Chim. Acta 1978, 61, 2773–2776. [Google Scholar] [CrossRef]
  4. Berg, U.; Butkus, E. Enantiomer separation and circular dichroism spectra of bicyclo[3.3.1]nonanediones. J. Chem. Res. 1993, 3, 116–117. [Google Scholar]
  5. Berg, U.; Butkus, E. An analysis of the circular dichroism spectra of bicyclo[3.3.1]nonanediones. J. Chem. Res. 1994, 9, 356–357. [Google Scholar]
  6. Buktus, E.; Stoncius, S.; Zilinskas, A. Determination of the Absolute Configuration of Bicyclo[3.3.1]nonane-2,7-dione by Circular Dichroism Spectroscopy and Chemical Correlation. Chirality 2001, 13, 694–698. [Google Scholar]
  7. Hoffman, R.; Inamura, A.; Hehre, W.J. Benzynes, dehydroconjugated molecules, and the interaction of orbitals separated by a number of intervening sigma bonds. J. Am. Chem. Soc. 1968, 99, 1499–1509. [Google Scholar] [CrossRef]
  8. Hansen, A.E. On the Optical Activity of Compounds Containing Coupled Chromophores. Ph.D. Thesis, H.C. Ørsted Institute, Copenhagen, Denmark, 1964. [Google Scholar]
  9. Moscowitz, A.; Hansen, A.E.; Forster, L.S.; Rosenheck, K. Prototypic Systems for Optically Active Helical Polypeptides. Biopolym. Symp. 1964, 1, 75–89. [Google Scholar]
  10. Moscowitz, A. Some Comments on the Relevance of Charge Transfer for the 300 nm Transition in β, γ Unsaturated Ketones. Proc. R. Soc. Lond. 1967, 297, 40–42. [Google Scholar]
  11. Nafie, L.A. Vibrational Optical Activity. Principles and Applications; John Wiley & Sons: New York, NY, USA, 2011. [Google Scholar]
  12. Stephens, P.J.; Devlin, F.J.; Cheeseman, J.R. VCD Spectroscopy for Organic Chemists; CRC Press: New York, NY, USA, 2012. [Google Scholar]
  13. Taniguchi, T.; Monde, K. Exciton Chirality Method in Vibrational Circular Dichroism. J. Am. Chem. Soc. 2012, 134, 3695–3698. [Google Scholar] [CrossRef] [Green Version]
  14. Abbate, S.; Mazzeo, G.; Meneghini, S.; Longhi, G.; Boiadjiev, S.E.; Lightner, D.A. Bicamphor: A prototypic molecular system to investigate vibrational excitons. J. Phys. Chem. A 2015, 119, 4261–4267. [Google Scholar] [CrossRef]
  15. Covington, C.L.; Nicu, V.P.; Polavarapu, P.L. Determination of the Absolute Configurations Using Exciton Chirality Method for Vibrational Circular Dichroism: Right Answers for the Wrong Reasons? J. Phys. Chem. A 2015, 119, 10589–10602. [Google Scholar] [CrossRef] [PubMed]
  16. Nicu, V.P. Revisiting an old concept: The coupled oscillator model for VCD. Part 2: Implications of the generalised coupled oscillator mechanism for the VCD robustness concept. Phys. Chem. Chem. Phys. 2016, 18, 21213–21225. [Google Scholar] [CrossRef] [PubMed]
  17. Abbate, S.; Bruhn, T.; Pescitelli, G.; Longhi, G. Vibrational Optical Activity of BODIPY Dimers: The Role of Magnetic−Electric Coupling in Vibrational Excitons. J. Phys. Chem A 2017, 121, 394–400. [Google Scholar] [CrossRef]
  18. Mazzeo, G.; Santoro, E.; Abbate, S.; Fabris, F.; Zonta, C.; Longhi, G. Testing the Vibrational Exciton and the Local Mode Models on the Instructive Cases of Dicarvone, Dipinocarvone, and Dimenthol Vibrational Circular Dichroism Spectra. Chirality 2020, 32, 907–921. [Google Scholar] [CrossRef]
  19. Abbate, S.; Lebon, F.; Longhi, G.; Boiadjiev, S.E.; Lightner, D.A. Vibrational and Electronic Circular Dichroism of Dimethyl Mesobilirubins-XIIIalpha. J. Phys. Chem. B 2012, 116, 5628–5636. [Google Scholar] [CrossRef]
  20. Passarello, M.; Abbate, S.; Longhi, G.; Lepri, S.; Ruzziconi, R.; Nicu, V.P. Importance of C*−H Based Modes and Large Amplitude Motion: Effects in Vibrational Circular Dichroism Spectra: The Case of the Chiral Adduct of Dimethyl Fumarate and Anthracene. J. Phys. Chem A 2014, 118, 4339–4350. [Google Scholar] [CrossRef]
  21. Mazzeo, G.; Abbate, S.; Longhi, G.; Castiglioni, E.; Boiadjiev, S.E.; Lightner, D.A. pH Dependent Chiroptical Properties of (1R,2R)- and (1S,2S)-trans-Cyclohexane Diesters and Diamides from VCD, ECD, and CPL Spectroscopy. J. Phys. Chem. B 2016, 120, 2380–2387. [Google Scholar] [CrossRef]
  22. Frisch, M.J.; Trucks, G.W.; Schlegel, H.B.; Scuseria, G.E.; Robb, M.A.; Cheeseman, J.R.; Scalmani, G.; Barone, V.; Petersson, G.A.; Nakatsuji, H.; et al. Gaussian 16, Revision C.01; Gaussian, Inc.: Wallingford, CT, USA, 2016. [Google Scholar]
  23. Stephens, P.J.; McCann, D.M.; Butkus, E.; Stoncius, S.; Cheeseman, J.R.; Frisch, M.J. Determination of Absolute Configuration Using Concerted ab Initio DFT Calculations of Electronic Circular Dichroism and Optical Rotation: Bicyclo[3.3.1]nonane Diones. J. Org. Chem. 2004, 69, 1948–1958. [Google Scholar] [CrossRef]
  24. Paoloni, L.; Mazzeo, G.; Longhi, G.; Abbate, S.; Fusé, M.; Bloino, J.; Barone, V. Toward Fully Unsupervised Anharmonic Computations Complementing Experiment for Robust and Reliable Assignment and Interpretation of IR and VCD Spectra from Mid-IR to NIR: The Case of 2,3-Butanediol and trans-1,2-Cyclohexanediol. J. Phys. Chem. A 2020, 124, 1011–1024. [Google Scholar] [CrossRef]
  25. Abbate, S.; Wunder, S.L.; Zerbi, G. Conformational dependence of Fermi Resonance in n-Alkanes Raman Spectra of 1,1,1,4,4,4,-Hexadeuteriobutane. J. Phys. Chem. 1984, 88, 593–600. [Google Scholar] [CrossRef]
  26. Abbate, S.; Castiglioni, E.; Gangemi, F.; Gangemi, R.; Longhi, G.; Ruzziconi, R.; Spizzichino, S. Harmonic and Anharmonic Features of IR and NIR Absorption and VCD Spectra of Chiral 4-X-[2.2]Paracyclophanes. J. Phys. Chem. A 2007, 111, 7031–7040. [Google Scholar] [CrossRef] [PubMed] [Green Version]
  27. Longhi, G.; Abbate, S.; Scafato, P.; Rosini, C. A Vibrational Circular Dichroism Approach to the Determination of the Absolute Configuration of Flexible and Transparent Molecules: Fluorenone Ketals of 1,n-Diols. Phys. Chem. Chem. Phys. 2010, 12, 4703–4712. [Google Scholar] [CrossRef] [PubMed] [Green Version]
  28. Longhi, G.; Tommasini, M.; Abbate, S.; Polavarapu, P.L. The Connection Between Robustness Angles and Dissymmetry Factors in Vibrational Circular Dichroism Spectra. Chem. Phys. Lett. 2015, 623, 320–325. [Google Scholar] [CrossRef]
  29. Paddon-Row, M.N. On the Origin of Transannular Interactions in Diketones and Methylene-Ketones, as Detected by 13C N.M.R. Spectroscopy: An Ab Initio MO Study. Tetrahedron 1994, 50, 10813–10828. [Google Scholar] [CrossRef]
  30. Moore, B., II; Srebro, M.; Autschbach, J. Analysis of Optical Activity in Terms of Bonds and Lone-Pairs: The Exceptionally Large Optical Rotation of Norbornenone. J. Chem. Theory Comput. 2012, 8, 4336–4346. [Google Scholar] [CrossRef]
  31. Caricato, M.; Vaccaro, P.H.; Crawford, T.D.; Wiberg, K.W.; Lahiri, P. Insights on the Origin of the Unusually Large Specific Rotation of (1S,4S)-Norbornenone. J. Phys. Chem. A 2014, 118, 4863–4871. [Google Scholar] [CrossRef]
  32. Wiberg, K. Chirality Induced by the Interaction of C=C and C=X Bonds (X=CH2, NH, NH2+, O, and S) Separated by a Methylene Group. J. Phys. Chem. A 2016, 120, 7771–7777. [Google Scholar] [CrossRef]
  33. Gawroński, J.K. Chapter 3, Conformations, Chiroptical and Related Spectral Properties of Enones. In The Chemistry of Enones. Part I; Patai, S., Rapport, Z., Eds.; Wiley & Sons: Hoboken, NJ, USA, 1989; pp. 55–103. [Google Scholar] [CrossRef]
  34. Jaffe, H.H.; Orchin, M. Theory and Applications of Ultraviolet Spectroscopy; Wiley: New York, NY, USA, 1962. [Google Scholar]
  35. Scott, A.I. Interpretation of the Ultraviolet Spectra of Natural Products; The Macmillan Company: New York, NY, USA, 1964. [Google Scholar]
  36. Longhi, G.; Castiglioni, E.; Abbate, S.; Lebon, F.; Lightner, D.A. Experimental and Calculated CPL spectra and related spectroscopic data of camphor and other simple chiral bicyclic ketones. Chirality 2013, 25, 589–599. [Google Scholar] [CrossRef]
  37. Polavarapu, P.L.; Santoro, E.; Covington, C.L.; Raghavan, V. Enhancement of the chiroptical response of α-amino acids via N-substitution for molecular structure determination using vibrational circular dichroism. Chirality 2020, 32, 564–578. [Google Scholar] [CrossRef]
  38. Gleiter, R.; Lange, H.; Borzyk, O. Photoelectron Spectra, Ab Initio SCF MO, and Natural Bond Orbital Studies on Stellenes. Long Range π/σ Interactions. J. Am. Chem. Soc. 1996, 118, 4889–4895. [Google Scholar] [CrossRef]
  39. Paoloni, L.; Fusè, M.; Baiardi, A.; Barone, V. Interplay of Stereoelectronic and Vibrational Modulation Effects in Tuning the UPS Spectra of Unsaturated Hydrocarbon Cage Compounds. J. Chem. Theory Comput. 2020, 16, 5218–5226. [Google Scholar] [CrossRef] [PubMed]
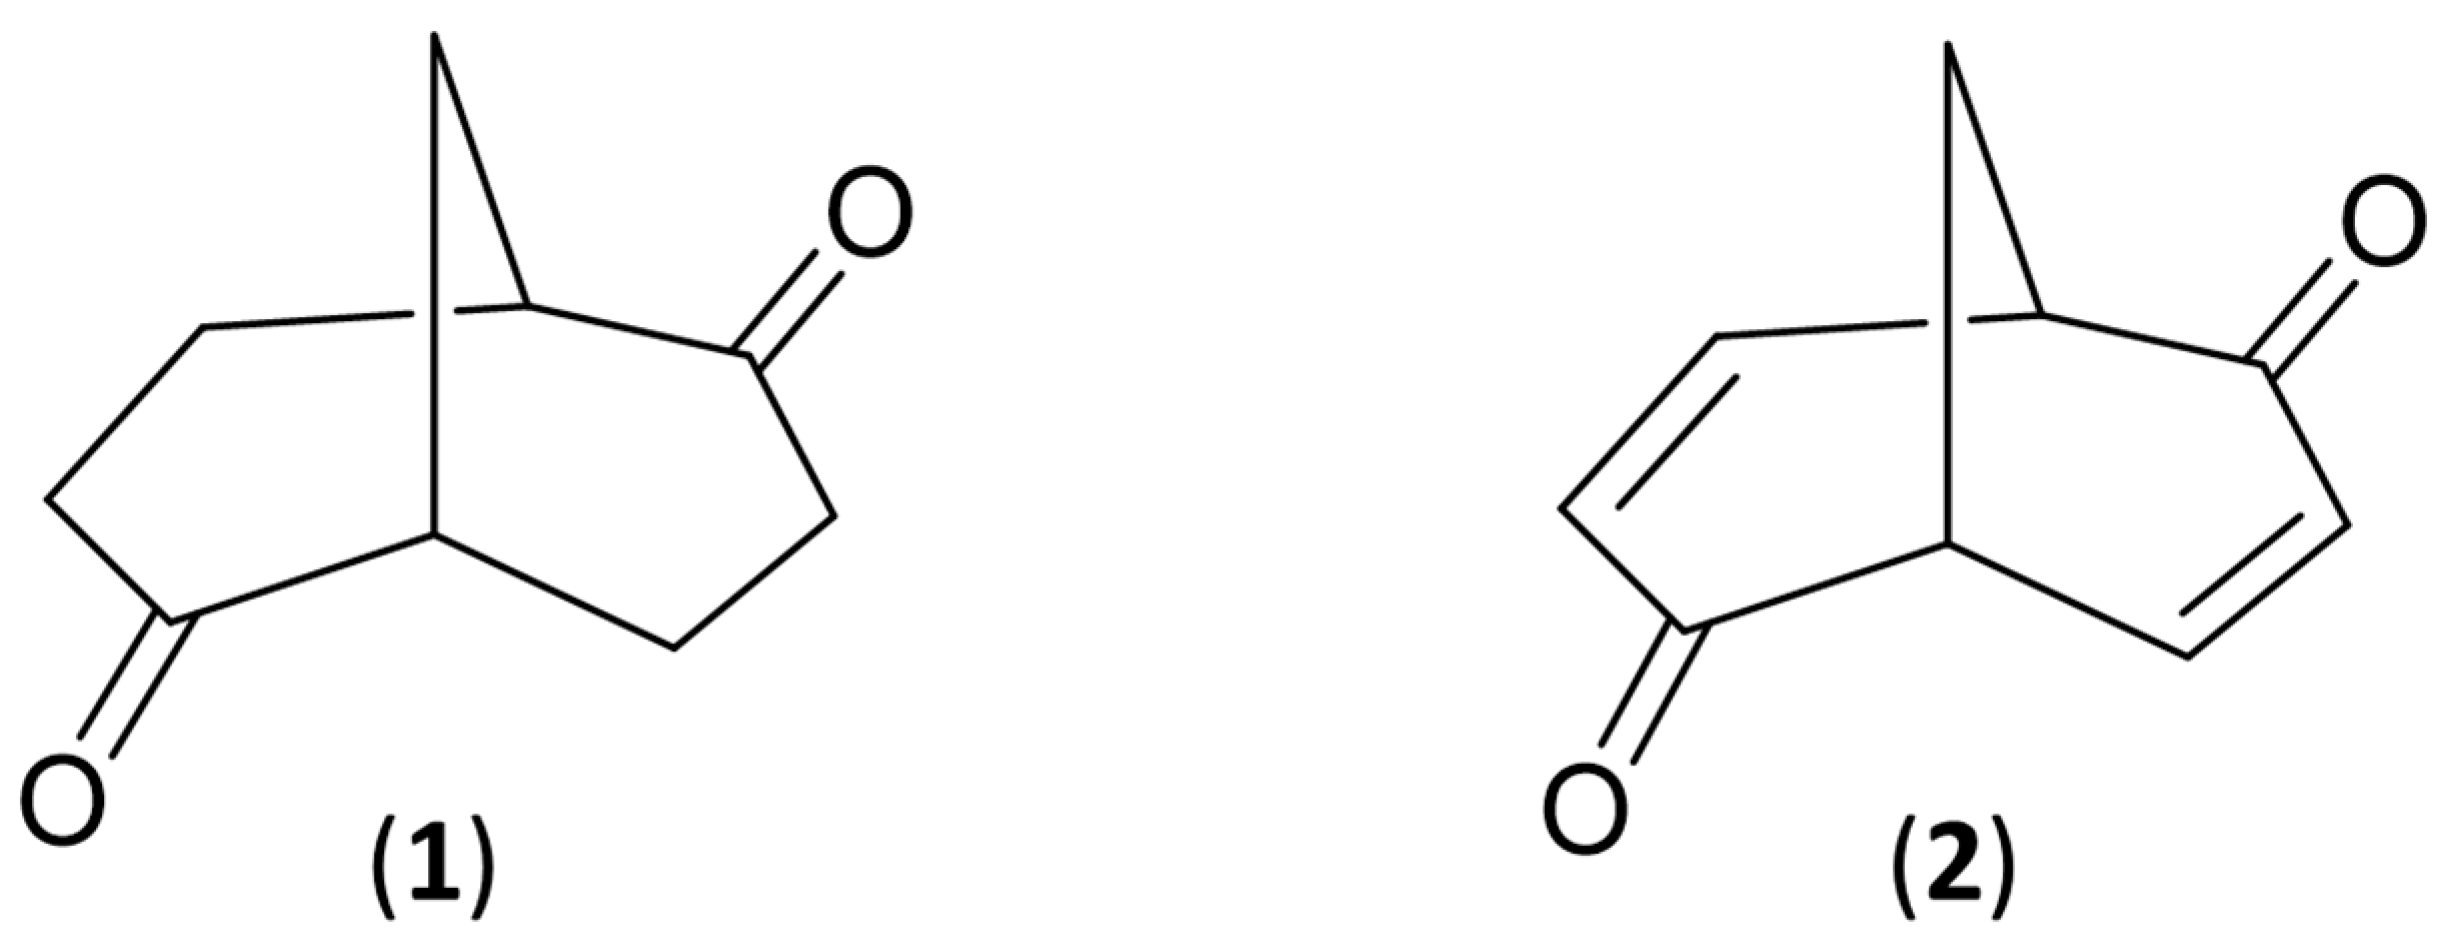
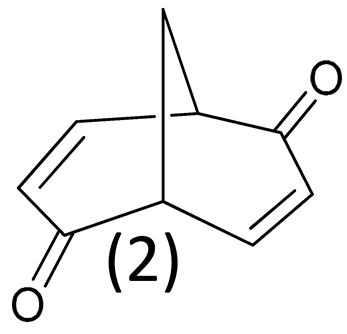
Scheme 1. The chemical structure and numbering of bicyclo[3.3.1]nonane-2,6-dione (1) and of bicyclo[ 3.3.1]nona-3,7-diene-2,6-dione (2).
Symmetry 12 01752 sch001
Figure 1. Comparison of experimental IR and VCD spectra of bicyclo[3.3.1]nonane-2,6-dione (1) in the CH-stretching region (left), in the C=O-stretching region (center), and in the mid-IR region (right) with calculated spectra for the two main conformers and for their Boltzmann average (based on ∆G, see text), with due account for the equivalence of the two minor components. Wavenumber scaling factors were 0.95 for the CH-stretching region, 0.96 for the C=O-stretching region, and 0.98 for the mid-IR.
Symmetry 12 01752 g001
Figure 2. Bicyclo[3.3.1]nonane-2,6-dione (1). (Left) stick-representation of the two main conformers, as obtained from Gaussian16 [22]. Center: two-dimensional energy maps about the absolute and relative conformational minima as a function of dihedral angles τ1 = 1 – 2 – 3 − 4 and τ2 = 1 − 2′ − 3′ −4′ derived using the routine of Gaussian16. (Right) the one-dimensional energy-profile obtained from the 2D-energy map along a minimum (steepest-descent) path connecting the absolute minimum and the two equivalent minima closest in energy.
Symmetry 12 01752 g002
Figure 3. Comparison of experimental and calculated IR and VCD spectra of bicyclo[3.3.1] nona-3,7-diene-2,6-dione (2) in the CH-stretching region (left), in the C=O-stretching region (center), and in the mid-IR region (right). Scaling factors were: 0.955 for the CH-stretching region, 0.96 for the C=O-stretching region, and 0.98 for the mid-IR.
Symmetry 12 01752 g003
Figure 4. Comparison of the experimental and calculated UV and ECD spectra of bicyclo[3.3.1]nonane-2,6-dione (1) (left) and of bicyclo[3.3.1]nona-3,7-diene-2,6-dione (2) (right). In the case of 1, only the average Boltzmann calculated spectrum is reported. Gaussian bandshapes are assigned to the transitions (bandwidth = 0.2 eV). The calculated bands were shifted by 10 nm for 1 and 15 nm for 2 for the best comparison with experimental spectra.
Symmetry 12 01752 g004
Table 1. Experimental frequencies, IR, and VCD intensities, the latter given as integrated band areas for compounds 1 and 2 in the carbonyl stretching region. The g-values evaluated from the latter two data are given in the last column.
cpdWavenumber (cm−1)IR Band Area (103 cm2/mol)CD Band Area (103 cm2/mol)g (×105)
11704141500.402.83
21679186301.809.66
Table 2. The experimental molar extinction coefficients at the band wavelength maxima (in parenthesis) in UV absorption and ECD spectra of compounds 1 and 2. The notation E.T. (electron transfer transition) was taken from reference 35
Compound 1
εmax (nm)∆εmax (nm)Transition
50.1 (287.0)+1.9 (301.6)n-π*
1329.3 (196.9)−1.2 (196.9)π-π*
Compound 2
εmax (nm)∆εmax (nm)Transition
741.8 (350.3)+24.5 (350.3)n-π*
1544.3 (259.5)−17.5 (259.5)π-π* (E.T.)
8543.9 (233.1)−20.8 (222.8)π-π* (E.T.)
15,423.3 (196.6)+67.5 (199.7)π-π*
Table 3. Compound 1 in cc (part A) and cb (part B) conformation, and monoketone model. Calculated properties for the lowest energy transitions at the B3LYP/TZVP//cam-B3LYP/aug-cc-PVDZ level of calculations are given. The transition number, wavelength (nm), energy (eV), electric (μ) and magnetic (m) dipole transition moments (a.u. = atomic units), angle between electric and magnetic dipole transition moment E-M (deg), rotational (R), and dipole strengths (D) (10−40 esu2cm2 and 10−36 esu2cm2 respectively) are also given. Part C: monoketone analog of 1.
A1-ccnmeV|μ||m|E-MRD
12934.230.0581.6366310.08249
22924.250.0080.144180−0.314
31936.410.2450.502180−29.813868
41936.430.2260.389021.323281
51866.650.2360.345783.863609
B1-cbnmeV|μ||m|E-MRD
12934.240.0161.240113−1.8416
22894.290.0421.094507.04123
31996.240.1810.352106−4.112112
41936.410.3060.656854.206049
51866.670.2960.62094−2.885695
C1-mono-conf1nmeV|μ||m|E-MRD
12924.250.0411.164664.57124
21966.310.2050.53790−0.092714
31836.780.3480.225115−7.737815
Table 4. Compound 2 and the mono enone models. Calculated properties are shown for the lowest energy transitions at the B3LYP/TZVP//cam-B3LYP/aug-cc-PVDZ level of calculations. The transition number, wavelength (nm), energy (eV), electric (μ) and magnetic dipole transition moments (m) (a.u.), the angle between electric and magnetic dipole transition moment, E-M (deg), rotational (R), and dipole strengths (D) are given (10−40 esu2cm2 and 10−36 esu2cm2 respectively).
A2nmeV|μ||m|E-MRD
Symmetry 12 01752 i00113483.560.1060.533180−12.88741
23363.690.3081.2282082.356143
32425.120.1631.623180−62.391699
42245.551.1740.3285155.588,731
52155.770.0230.07180−0.0846
62105.890.7350.703139−90.6334,914
71926.460.0840.698180−11.52449
Bα,βnmeV|μ||m|E-MRD
Symmetry 12 01752 i00213323.730.0670.845606.58282
22155.771.2381.69491−8.0599,039
31936.430.0840.578309.9451
41916.50.1370.379115−5.491216
Cβ,γnmeV|μ||m|E-MRD
Symmetry 12 01752 i00312944.220.1911.2392848.592377
22066.020.1260.431880.441008
31956.360.7960.96990−0.8740,956
41906.520.4210.7897−9.8411,480
Table 5. Compound 1 in cc conformation and compound 2: APT and AAT relevant components (xz, yz, zz) (a.u.) of C and O atoms are reported in the reference Cartesian system of each carbonyl group, with the z-axis pointing towards the O atom, and the y-axis pointing towards the nearby asymmetric carbon C*.
Compound 1 (cc Conformer)
AtomAPT(xz)APT(yz)APT(zz)AAT(xz)AAT(yz)AAT(zz)
C−0.105−0.0061.313−0.1540.1180.041
O0.0400.021−1.2240.173−0.150−0.061
Compound 2
AtomAPT(xz)APT(yz)APT(zz)AAT(xz)AAT(yz)AAT(zz)
C−0.195−0.0531.542−0.3090.2600.318
O0.1280.056−1.3580.305−0.311−0.225
Publisher’s Note: MDPI stays neutral with regard to jurisdictional claims in published maps and institutional affiliations.