Article

Numerical Analysis of Fluid Forces for Flow Past a Square Rod with Detached Dual Control Rods at Various Gap Spacing

by
Raheela Manzoor
1,
Abdul Ghaffar
2,
Dumitru Baleanu
3,4,5 and
Kottakkaran Sooppy Nisar
6,*
1
Mathematics Department, SBK Women’s University, Quetta 87300, Pakistan
2
Department of Mathematics, BUITEMS, Quetta 87300, Pakistan
3
Department of Mathematics, Cankaya University, Anakara 06790, Turkey
4
Department of Medical Research, China Medical University Hospital, China Medical University, Taichung 40447, Taiwan
5
Institute of Space Sciences, 077125 Magurele-Bucharest, Romania
6
Department of Mathematics, College of Arts and Sciences, Prince Sattam bin Abdulaziz University, Wadi Aldawaser 11991, Saudi Arabia
*
Author to whom correspondence should be addressed.
Symmetry 2020, 12(1), 159; https://doi.org/10.3390/sym12010159
Submission received: 6 December 2019 / Revised: 28 December 2019 / Accepted: 6 January 2020 / Published: 13 January 2020
(This article belongs to the Special Issue Fluid Mechanics Physical Problems and Symmetry)

Abstract

:
A two-dimensional numerical study was conducted for flow past a square rod in the presence of two control rods. One is placed vertically in the upstream direction and the second one is placed horizontally in the downstream direction of the square rod. The influence of gap spacing was studied by taking g1 = 1–5 and g2 = 0.5–5 (where g1 is the gap between the upstream control rod and the main rod, and g2 is the space between the main rod and the downstream control rod) at Re = 160. The simulation results were obtained in the form of vorticity contour, drag and lift coefficients, Strouhal number, and force statistics. Under the effect of gap spacing, three different flow modes were found and named according to their behavior. It was found that the mean drag coefficient showed decreasing behavior by increasing the value of g2 continually at a fixed value of g1. The largest value of C d m e a n was found at (g1, g2) = (1, 1) and the greatest percentage reduction in C d m e a n was obtained at (g1, g2) = (1, 3), which is 139.72%. The effect of thrust was also noticed for all selected values of g1 and g2. Furthermore, it was noticed that the Strouhal number and the root mean square values of the drag and lift coefficients smaller values than the single rod values, except for the Clrms value of (g1, g2) = (1, 3) and (1, 4).

1. Introduction

A passive control method is a numerical technique adopted to control flow and thus save energy by modifying the shape and size of an object or by attaching/detaching some additional tools such as control rods or cylinders with the main object [1,2,3]. This method is simple and cheap compared to an active control method, in which energy is externally supplied to control the flow. When flow interacts with an object, a damaging of the structure occurs with a loss of energy. Therefore, it is essential to control flow and save energy. A limited number of stationary object studies have been conducted with the passive control method in order to reduce the fluid forces and to suppress vortex shedding (see [4,5,6,7,8] and so on). In the passive control method, the control rods/cylinders can be placed horizontally or vertically either upstream or downstream of the main rod. Many experimental and numerical studies based on these types of arrangements are available in the literature. A numerical study of fluid past a square rod detached from a thin rod placed downstream was conducted by Alam et al. [9] at   R e = 56,000 . Tsutsui and Igrashi [10] used the passive control method using a control rod placed upstream of the main rod by considering R e = 104 . They observed a 63% drag reduction along with two different types of flow modes. Turki [11] numerically simulated the flow structure mechanism past a square rod attached with a controlling rod by taking R e = 110     200 using a control volume finite element method. The author noted two different phenomena for Strouhal number (St) values: firstly, for R e   <   150 , the value of St reduces and approaches a local minima at control rod length h = 0.6 and then increases afterward; for R e 150 , the values of St increase by increasing the length of the rod. A numerical investigation of drag and lift coefficients on a square rod detached from a control rod through a finite volume code was performed by Malikzadeh and Sohankar [12] with a Reynolds number ranging from 50 to 200. The highest reduction in fluid forces was found at g = 3 and   R e = 160 . Furthermore, they obtained three types of flow modes. In the first two modes, the vortex shedding was suppressed completely. Islam et al. [13] numerically studied the influence of gap spacing for flow past a main rod detached from a horizontal control rod. They obtained optimum spacing values at g = 2 2.5 . A study of fluid force reduction using two controlling rods was conducted by Vamsee et al. [14]. One rod was placed upstream and the second one was placed downstream of the main rod. They found a 27% reduction in drag force using the upstream controlling rod and a 35% drag reduction by fixing the upstream controlling rod and varying the gap between the main rod and the downstream controlling rod. A numerical examination of flow past a square rod detached from an upstream controlling rod at the low value of R e was performed by Islam et al. [15]. They focused on the effect of gap spacing with a g =   1 7 and an Re = 80–200, and the size of the controlling rod (h) ranged from 0.1 d to 1 d. They obtained a maximum reduction in C d m e a n of 142 at ( h ,   g ) = ( 20 ,   1 ) for   R e = 160 . De Araujo et al. [16] numerically investigated the flow behavior over a square rod detached from a controlling rod considering R e = 1250 , and the length of the controlling rod varied up to twice the size of the square rod. The flow simulation over a single circular rod in the presence of a controlling rod was performed by Vu et al. [17] to study the effect of the length of the controlling rod and the R e on the flow structure mechanism. It was reported that flow was suppressed completely when the length of the controlling rod was greater than its critical value, which is proportional to Reynolds   number . Furthermore, they observed two different types of flow mode. Another numerical study based on flow past a square rod with an upstream detached circular bar and a downstream horizontal splitter rod was carried out by Yuan et al. [18]. They considered an R e = 100 where the diameter (d) of the circular bar was in the range d = 1 5 , gap spacing g = 0–7, and the splitter rod length l = 1 5 . The maximum reduction found in C d m e a n was 68.7% at ( D ,   g ,   l ) = ( 2.5 ,   0 ,   3 ) . Gupta [19] also numerically studied vortex shedding suppression around a square rod at Re = 100 and observed a 10–15% drag reduction using a small control rod downstream of the main rod. A comparative study for weakly compressible (WCSPH) and incompressible smoothed particle hydro dynamics (ISPH) method was conducted by Shadloo et al. [20] for a numerical solution of fluid flows over an airfoil and a square obstacle. They used improved WCSPH and ISPH techniques to solve flow problems generated by the flow past these two bluff bodies. The comparison of WCSPH and ISPH methods indicated that a weakly compressible method produces numerical results as accurate and reliable as those of the incompressible smoothed particle method. Numerical simulations for flow over an airfoil and a square obstacle using the ISPH method with an improved solid boundary treatment approach such as the multiple boundary tangents (MBT) method were performed by Shadloo et al. [21], and they found that the MBT boundary treatment technique is very effective for tackling the boundaries of complex shapes. Furthermore, the usage of the repulsive component of the Lennard-Jones potential (LJP) in the advection equation for repairing particle fractures occurring in the SPH method has also been proposed and examined, and the ISPH method was found to be is effective at naturally capturing the complex physics of bluff-body flows. The numerical Lattice Boltzmann method was used to solve the complex fluid flow problems. Such flows are single-phase or multi-phase. This method is effective and can easily handle the problem. Many studies are available in literature that are based on complex flow problems and have been solved by the lattice Boltzmann method. The laminar-forced convection heat transfer of water–Cu nano-fluids in a micro channel was studied by D’Orazio et al. [22] using the double population thermal lattice Boltzmann method (TLBM). Simulations were performed for nanoparticle volume fractions equal to 0.00, 0.02, and 0.04% and slip coefficients equal to 0.001, 0.01, and 0.1. The selected values of the Reynolds number were 1, 10, and 50. It was found that a micro channel performs better heat transfers at higher Reynolds number values. Meanwhile, for all selected values of Re, the average Nusselt number increases slightly as the solid volume fraction increases and the slip coefficient increases. The nano-scale lattice Boltzmann method was developed to predict the fluid flow and heat transfer of air through the inclined lid-driven 2-D cavity, considering a large heat source by Goodarzi et al. [23]. Pure natural convection at Grashof numbers from 400 to 4,000,000 and mixed convection at Richardson numbers from 0.1 to 10 at various cavity inclination angles were considered, and it was observed that the present LBM model is appropriately able to simulate the supposed domain. Moreover, the effects of inclination angle are more important at higher Richardson number values.
The above-mentioned literature shows limited knowledge about vortex shedding suppression and force reduction through the passive control method using controlling rods at different positions. Therefore, the present study sought to determine the influence of dual detached controlling rods with different gap spacing at a fixed Reynolds number value, i.e., R e = 160 .
The structure of this paper is based on the following sections. The lattice Boltzmann method (LBM) is discussed shortly in the next section. The formulation of the problem and boundary conditions are discussed in Section 3. The effects of the computation domain, the code validation, and the grid independence study are described in Section 4. The obtained results are explained in Section 5, focusing on the effect of gap spacing in the flow structure mechanism. Finally, important conclusions are presented in Section 6.

2. The Lattice Boltzmann Method

In this study, the lattice Boltzmann approach was applied particularly for a 2-D viscous and incompressible flow (Chen and Doolen [24]). The flow field for an unsteady and incompressible flow was determined by continuity and momentum equations that are given below:
. ρ u = 0 .
  ρ ( u t + ( u . ) u ) = p + ρ 2 u
where u ,   p , and ρ represent the velocity of flow, density, and pressure at certain intervals of time. By applying the Chapman–Enskog expansion (Muhammad [25]) and Taylor’s series in Equations (1) and (2), at a small Mach number ( M a   = U c s < < 1 ) , a discrete form of the lattice Boltzmann equation can be acquired (Rossi [26]):
h i ( x + e i Δ t ,   t + Δ t ) =   h i ( x ,   t ) h i   h i e q τ
where h i is a distribution function that describes the position and velocity of a particle at a certain period of time,   τ =   3 ν + 1 2 is the stability parameter used to control the flow, Δ t is the time increment, c s = 0.5780 is the speed of sound in a non-dimensionalized form, and h i e q is the equilibrium distribution function related to the density distribution function, which is defined in Equation (4) (d’Humières et al. [27]):
h i eq =   ξ i ρ [ 1   +   3 ( e i . u ) / c 2   +   4.5 ( e i . u ) 2 / c 4 1.5 u 2 / c 2 ]
where ξ i is the weighting coefficient in the coupled form of the set of velocities.
ξ 0 = 4 9 ,
ξ 1 = ξ 2 =   ξ 3 = ξ 4 = 1 9   ,
ξ 5 = ξ 6 =   ξ 7 = ξ 8 = 1 36   .
The velocity vectors in the component form for the D2Q9 model are shown in Figure 1 (Qian et al. [28]).
e i = [ e i x , e i y ]
e i x = ( 0 , 1 , 0 , 1 , 1 ,   1 , 1 , 1 ) ,
e i y = ( 0 , 0 , 1 , 0 , 1 , 1 , 1 , 1 , 1 ) .
The kinematic viscosity, pressure, and density can be obtained through the following equations:
ν = 1 / 3 ( τ 0.5 ) ,
p =   ρ c s 2 ,
ρ =   i = 0 8 h i ,  
ρ u =   1 / ρ i = 0 8 h i .
Basically, the lattice Boltzmann method is based on two main steps: (i) streaming and (ii) collisions (Succi [29]). The collisions take place between particles at each time step, and their velocities change their directions, but the net mass and momentum are conserved. The initial boundary conditions are applied after the streaming step, and the entire process is solved iteratively until the convergence is ensured by the following relation:
[ l ,   m [ u l ,   m ( k + 1 )   u l ,   m ( k ) ] 2 l ,   m [ u l ,   m ( k + 1 ) ] 2 ] 1 / 2 1 × 10 6 .
In the above equation, k represents the number of iterations. The LBM has several merits as compared to other techniques, such as the finite volume or finite element methods. For example, the streaming and collisions are local in nature, which provides an opportunity for parallel computing (Mohammad [25]). It is explicit in nature and conditionally stable. The non-linear term in the Navier–Stokes equation (Wolf-Gladrow [30] can easily be handled through this method. There is no need to solve Laplace’s equation at each time step for the calculation of pressure, as it can be obtained by solving the equation of state, and it is second-order accurate in both space and time (Wolf-Gladrow [30] and Sukop [31]). In this study, a two-dimensional nine-velocity (D2Q9, where D is the space dimensions, and Q is the number of particles) model, used in a standard Boltzmann equation, was adopted [25,30,32].

3. Problem Statements and Boundary Conditions

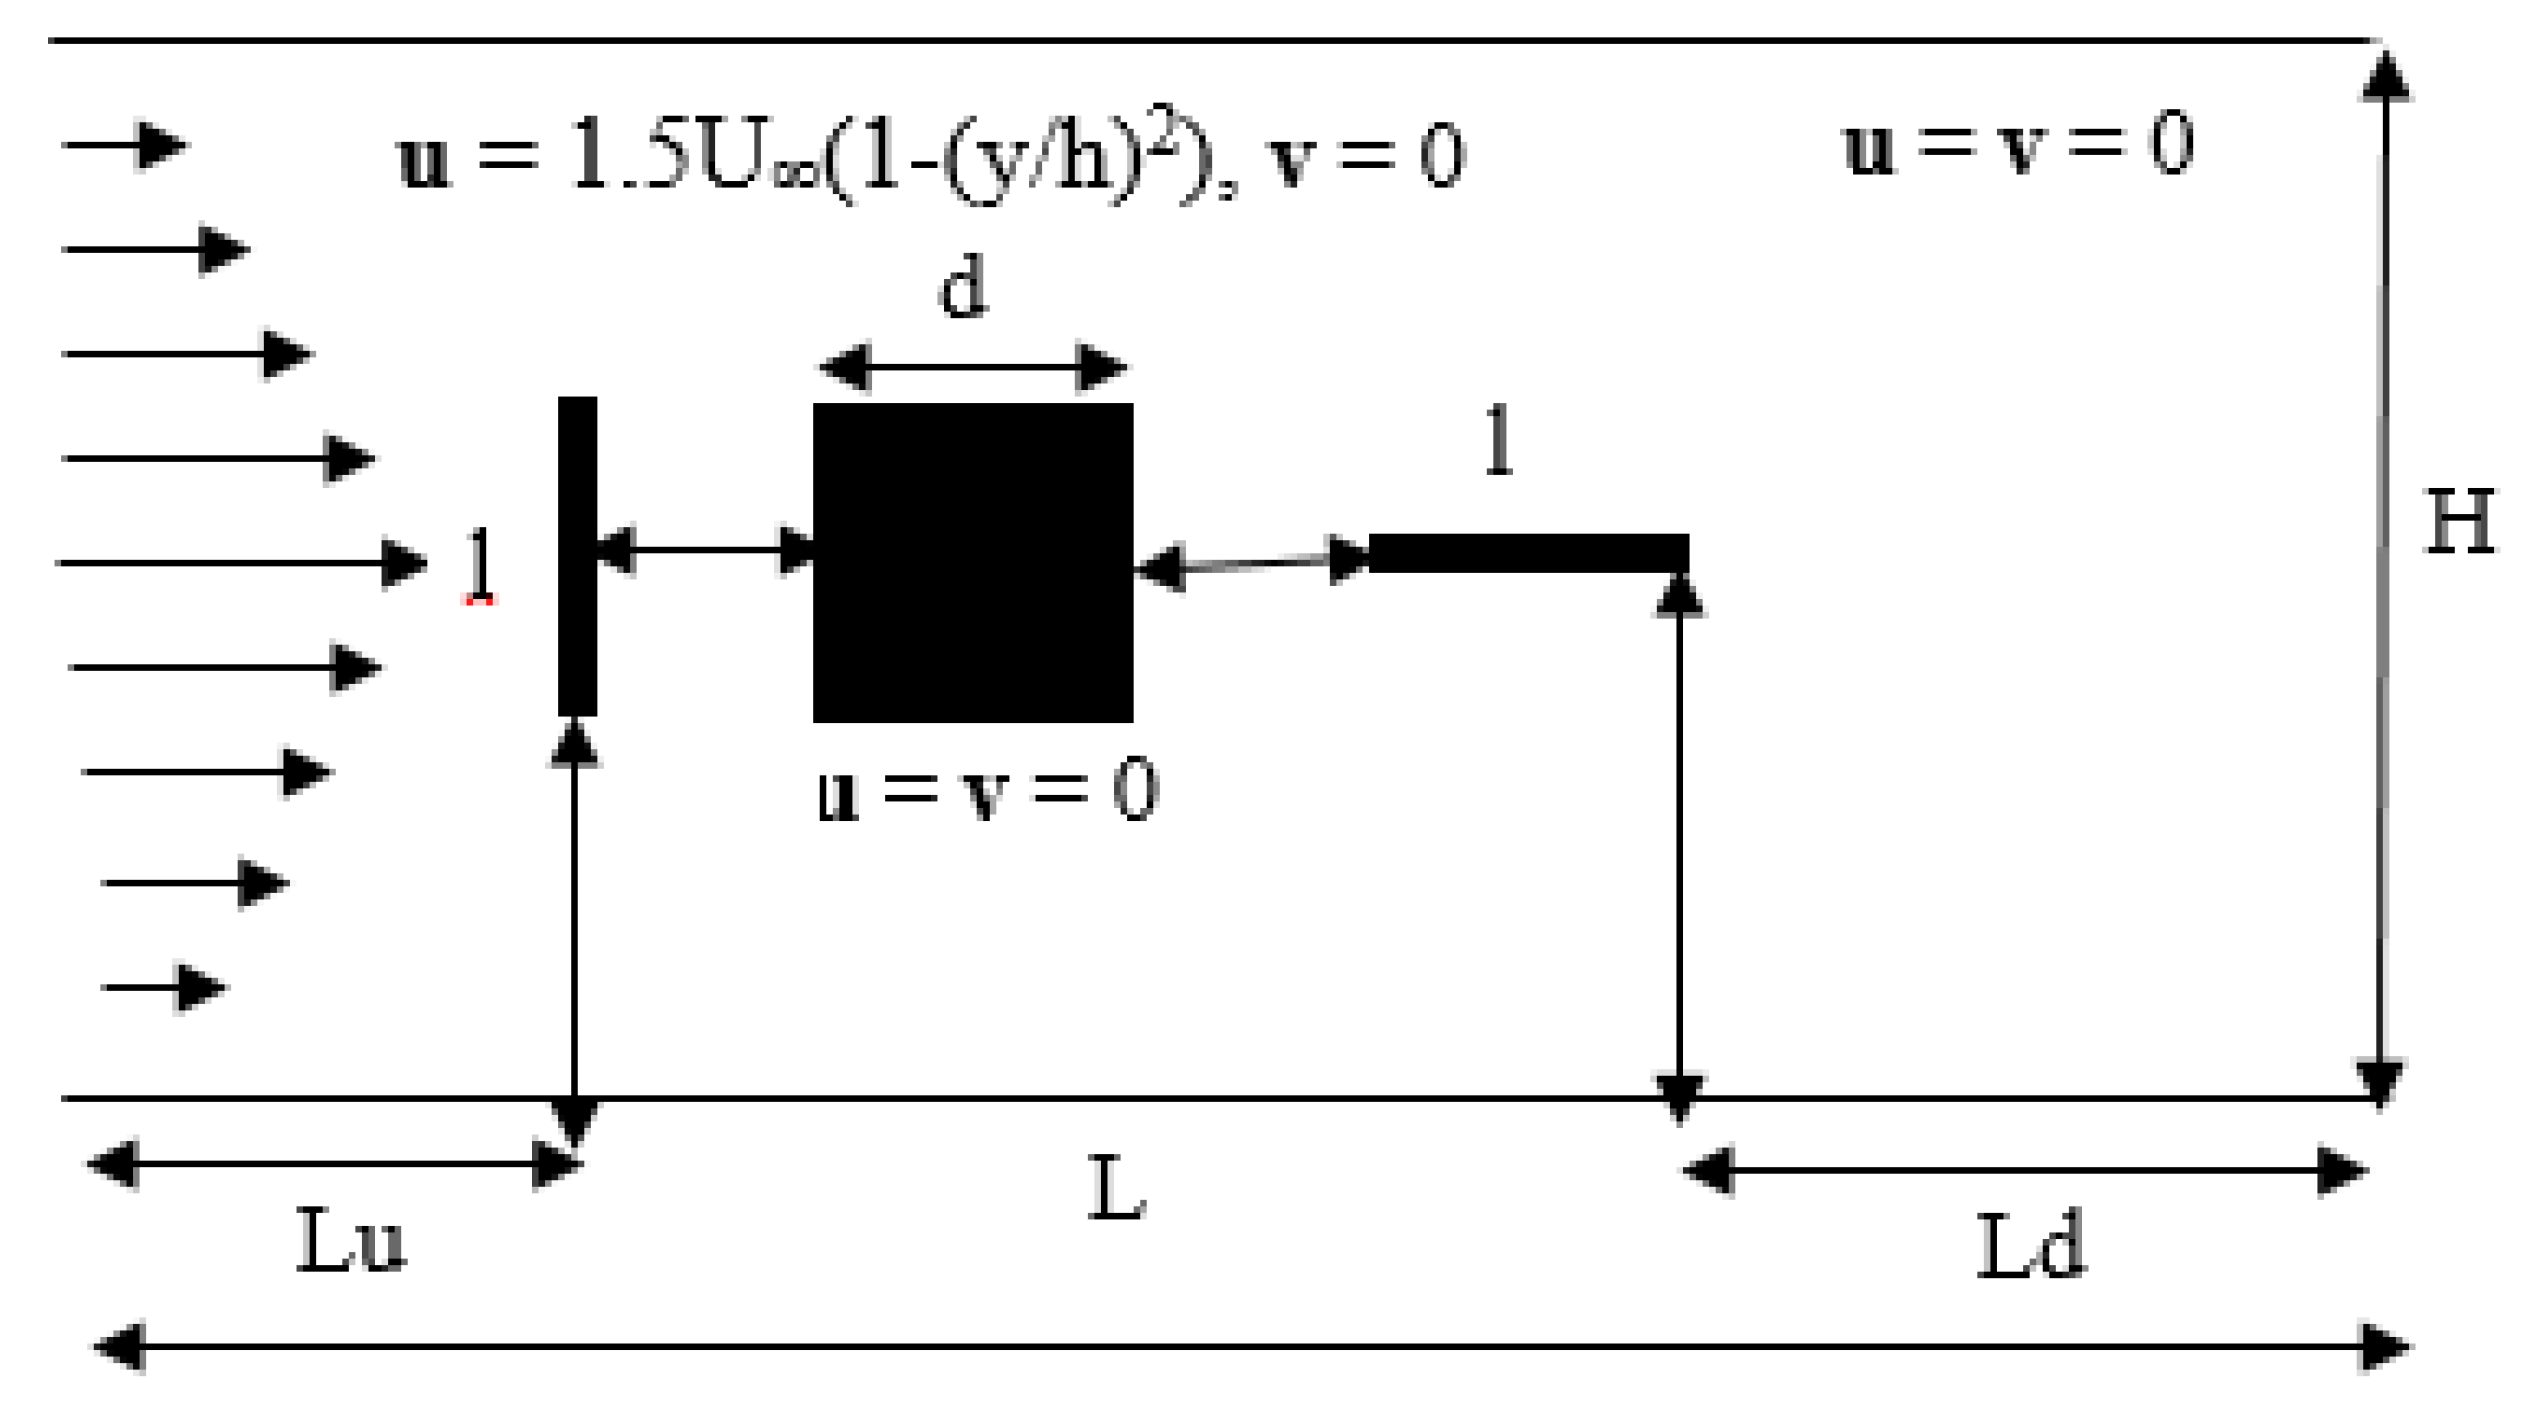
The computational domain was based on a square rod of size ‘d’ detached from two controlling rods between a (2-D) plane channel having an upstream distance L u = 8.0   d , a downstream length L d = 33.0   d , and a height H = 8.0   d (see Figure 2). The upstream controlling rod is placed in a vertical form and the downstream rod is placed in a horizontal form with respect to the main rod. L is the length of the channel, whereas l is the length and h the height of the controlling rod. The parabolic velocity profile ( u = 1.5   U ( 1 ( y / H ) 2 ) ;   v = 0 ) with speed U ( = 0.0438595 ) (where y is the vertical distance from the centreline, and U is entrance velocity of the flow, and u and v are the components of velocity vectors) was used for the inlet position of the channel. We used the bounce back boundary conditions on the main and controlling rods as well as on the upper and lower walls of the channel (Guo et al. [32]). Furthermore, we applied convective boundary conditions at the exit of the computational domain (Sukop and Throne [31]). The momentum exchange method was applied for the calculation of fluid forces. The important parameters regarding this flow problem are as follows:
Reynolds   number :   R e = u d ν ,
Strouhal   number   S t = f s d u   ,
Drag   coefficient :   C d = 2 F d ρ u 2 d ,
Lift   coefficient :   C l = 2 F l ρ u 2 d ,
where   f s   , F d   ,   F l , and ρ represent the vortex shedding frequency, the drag and lift forces, and the fluid density, respectively.

4. Computational Domain, Grid Independence and Code Validation Study

To study the effect of the grid points, we selected three different values of L u   , L d , and H for g 1 = 1 and g 2 = 2 at a fixed value of R e = 160 and calculated the values of C d m e a n ,   C l r m s , and S t (see Table 1). The C d m e a n consists of negative values for all selected cases and all values are approximately the same, except for the result obtained from L u = 8.0   d , L d = 33.0   d , and H = 9.0   d . The obtained results in terms of C d m e a n , C l r m s , and S t for Cases II, IV, and V are similar. If L u = 8.0   d , L d = 35.0   d , and   H = 8.0   d from three cases with a similar result, it takes more time due to the maximum grid points. Therefore, we simulate our results by using   L u = 8.0   d , L d = 33.0   d , and   H = 8.0   d .
The choice of grid is more important for any numerical simulation to achieve accurate results. All computational results depend on it. In this regard, we took three different grid points ( 10.0 d ,   20.0 d ,   30.0 d ,   and   40.0 d ) comprised of the following: ( X m a x ,   Y m a x ) =   ( 421.0 ,   81.0 ) ,   ( 841.0 ,   161.0 ) ,   ( 1261.0 ,   241.0 ) , and ( 1681.0 ,   321.0 ) . We calculated the values of force statistics at these selected grid points, shown in Table 2. All values of the force statistics are higher at d = 10.0 and minimum at d = 20.0   . We did not select   d = 10.0   for the present simulation. At d = 30.0 and 40.0, the grid points along the x- and y-axes are greater compared to d = 10.0 and 20.0, but this would be computationally costly because it requires a great amount of time to complete the simulation. Therefore, we selected d = 20.0 grid points for the present problem.
To validate the present numerical method, different force coefficients such as Cdmean, St, Cdrms, and Clrms for a single square rod at Reynolds number Re = 100 were calculated. The present results are compared with previous published experimental and computational results in Table 3. The comparison shows good agreement with previous published results.
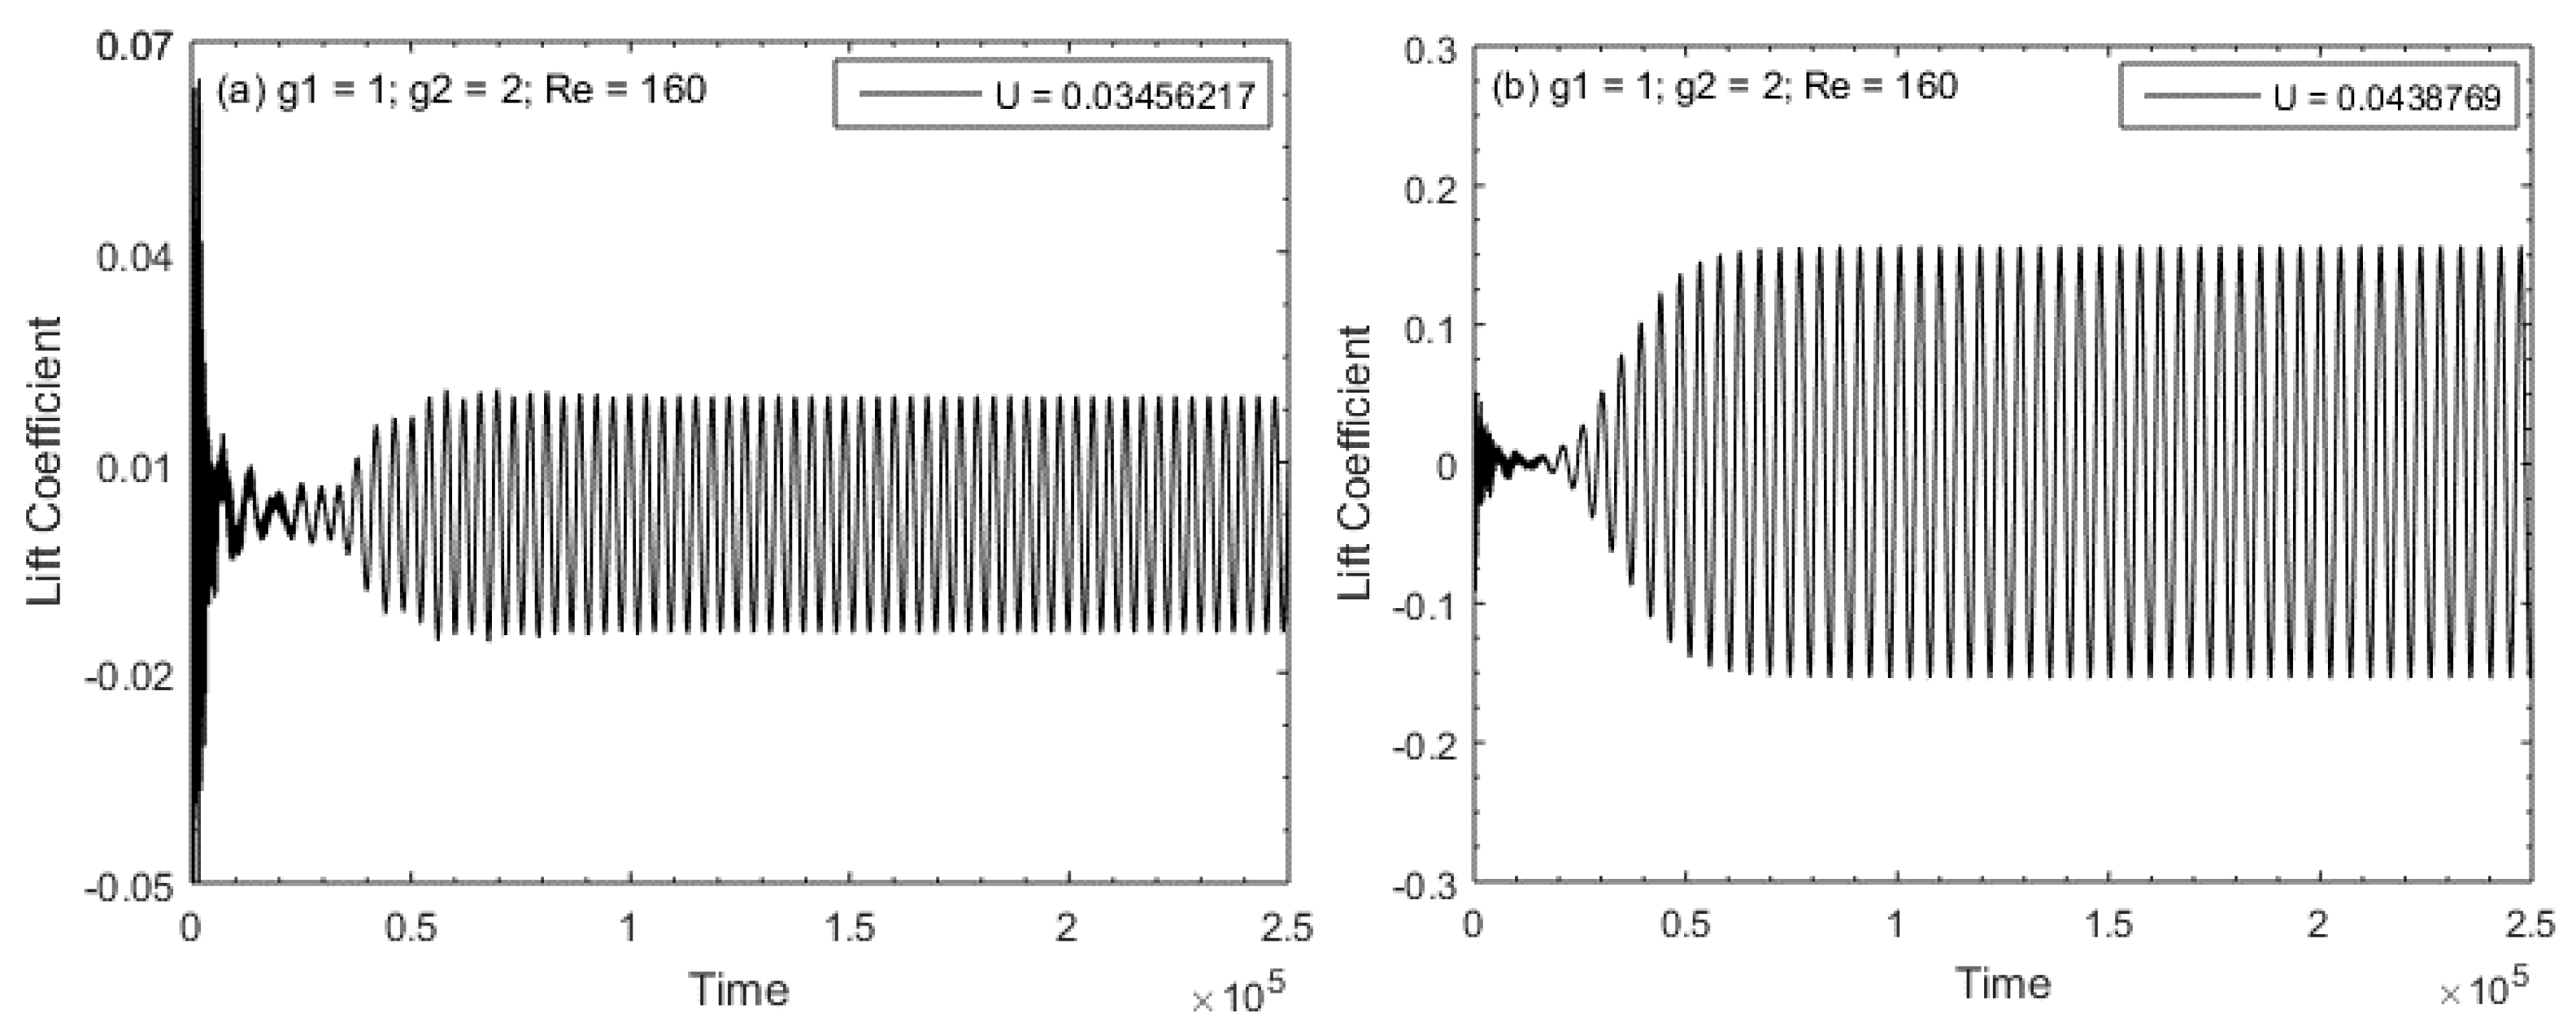
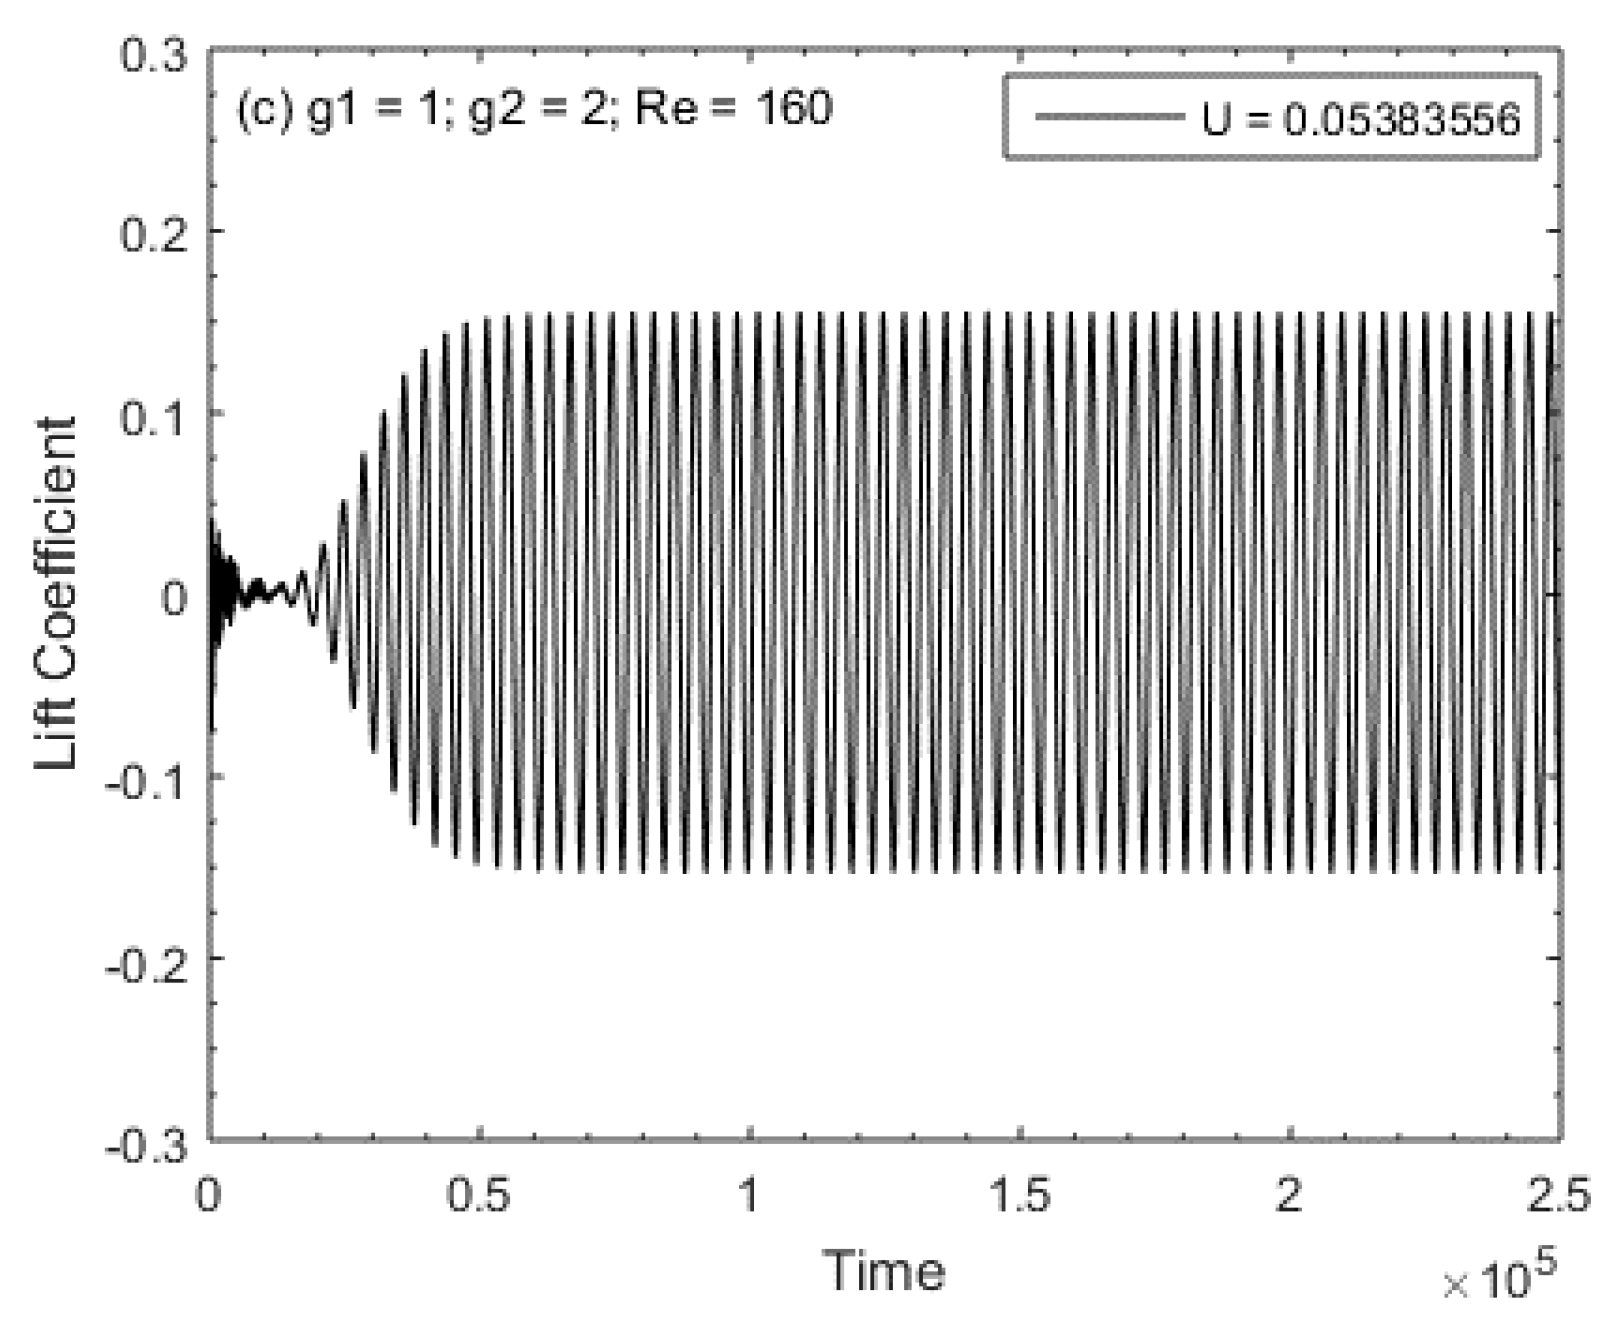
The uniform inflow velocity has a great impact on flow behavior and affects the iteration time. Comparison between different uniform inflow velocities is shown in Figure 3a–c. The value of velocity U = 0.05383556 and 0.0438596 yields a faster convergence compared to U = 0.03456217   . The computational time for U = 0.05383556 and 0.0438596 is the same. Therefore, we used U = 0.0438596 thereafter.

5. Results and Discussion

In this section, we will study the effect of g and Re on flow behavior and its characteristics in presence of two controlling rods. The gap between upstream vertical rod to square rod and square rod to downstream horizontal controlling rod is taken from g 1 = 1 5 and g 2 = 0.5 5 at fixed   R e = 160   . The results are acquired in terms of vorticity, Cdrms, Clrms, St and force coefficients. In plot of vorticity contour, the positive and negative vortices are shown through solid and dotted lines, respectively.

5.1. Vorticity Contours Visualization, Time-History Analysis of Drag and Lift Coefficients, and Energy Spectra Analysis of the Lift Coefficient

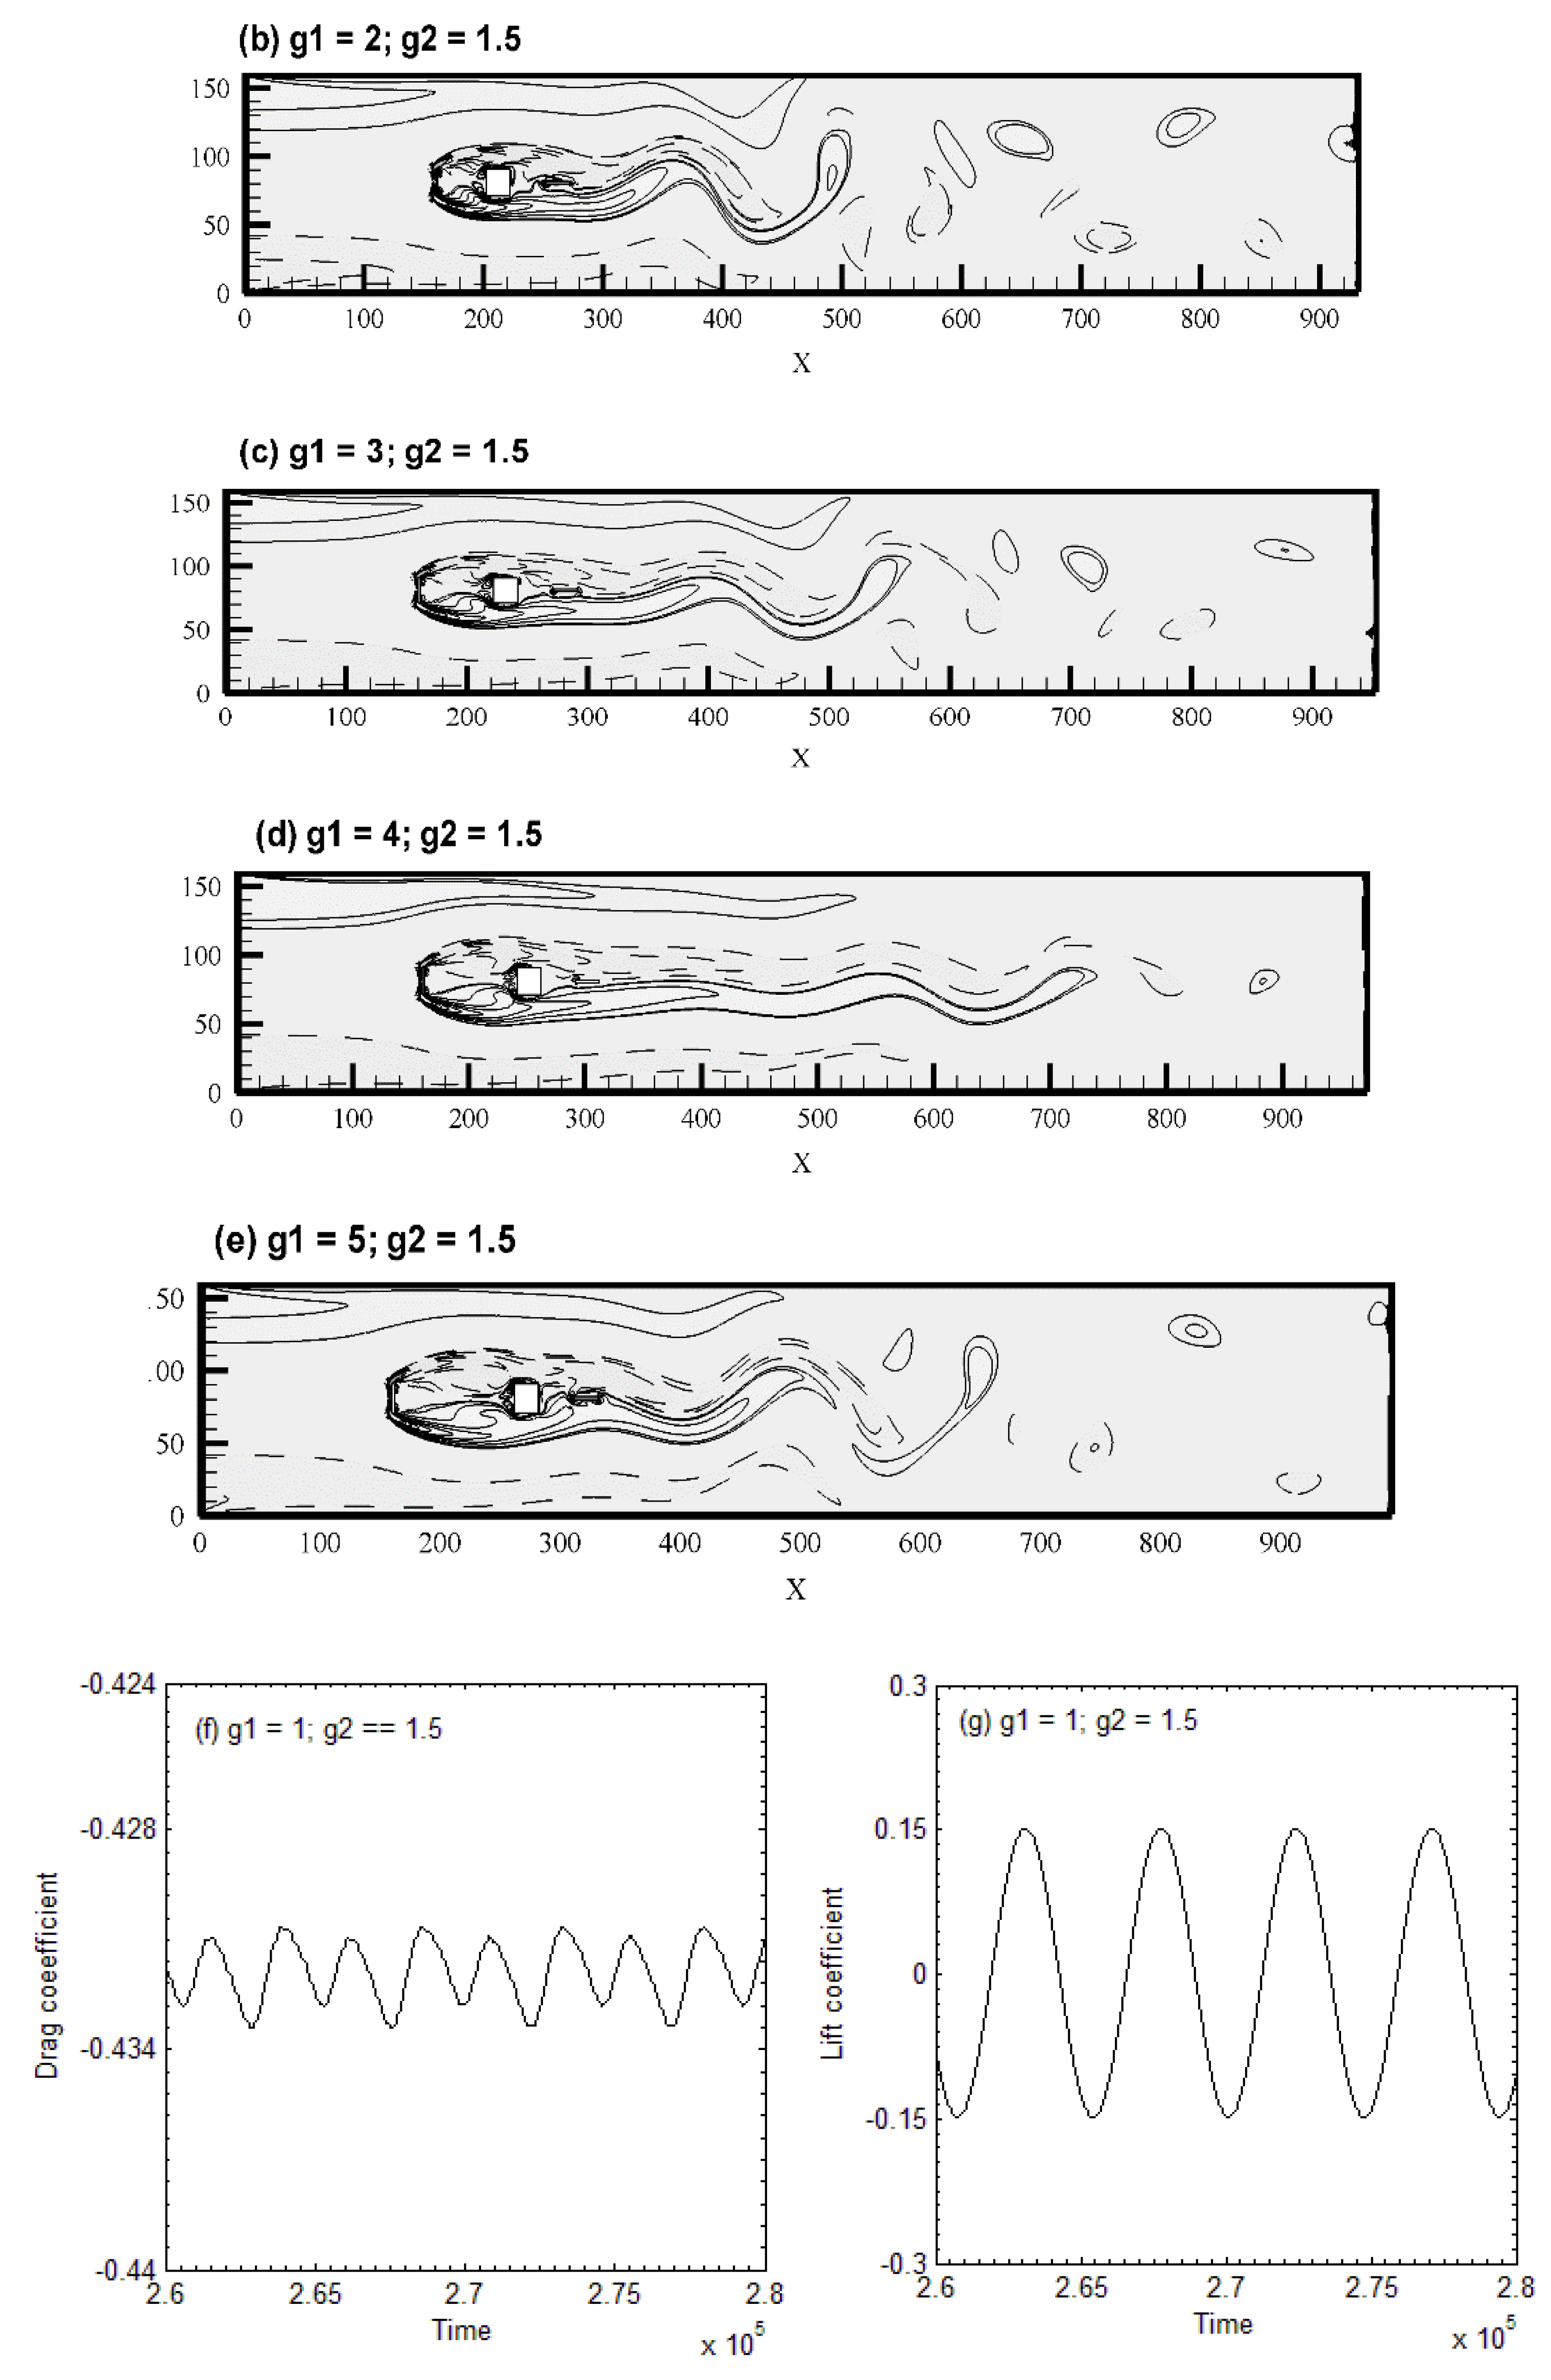
In the present simulation, three different types of flow modes were obtained under the effects of g 1 = 1 5 and g 2 = 0.5 5 , and these flow modes were named according to the behavior of the shed vortices near the main rod and the controlling rod and far downstream of the channel. The first flow mode was found at g 1 = 1 for g 2 = 0.5 2 ,   g 1 = 2 for g 2 = 0 5 ,   g 1 = 3 for g 2 = 0 5 , and g 1 = 4 , 5 for g 2 = 1.5 5 (see Figure 4a–c). In this flow mode, the shear layer emerging from the upper and lower corners of the upstream vertical controlling rod reattach directly to the main rod and the downstream controlling rod without any flow passing within the gap at g 2 = 0 2 for all chosen g 1 values. When g 2 > 2 , symmetric behavior is observed between the main rod and the downstream controlling rod due to its sufficient gap spacing. No vortex shedding was noticed within the gap in this flow mode. Flow approaches the end of the downstream controlling rod, and due to its rotational motion, vortices then start to appear at the downstream location throughout the channel. This type of flow mode is named the shear layer reattachment (SLR). The strength of the vortices changes due to the increasing value of g 1 and g 2 . The weak vortex shedding is observed for g 1 3 and g 2 2 , respectively shown in Figure 4c.
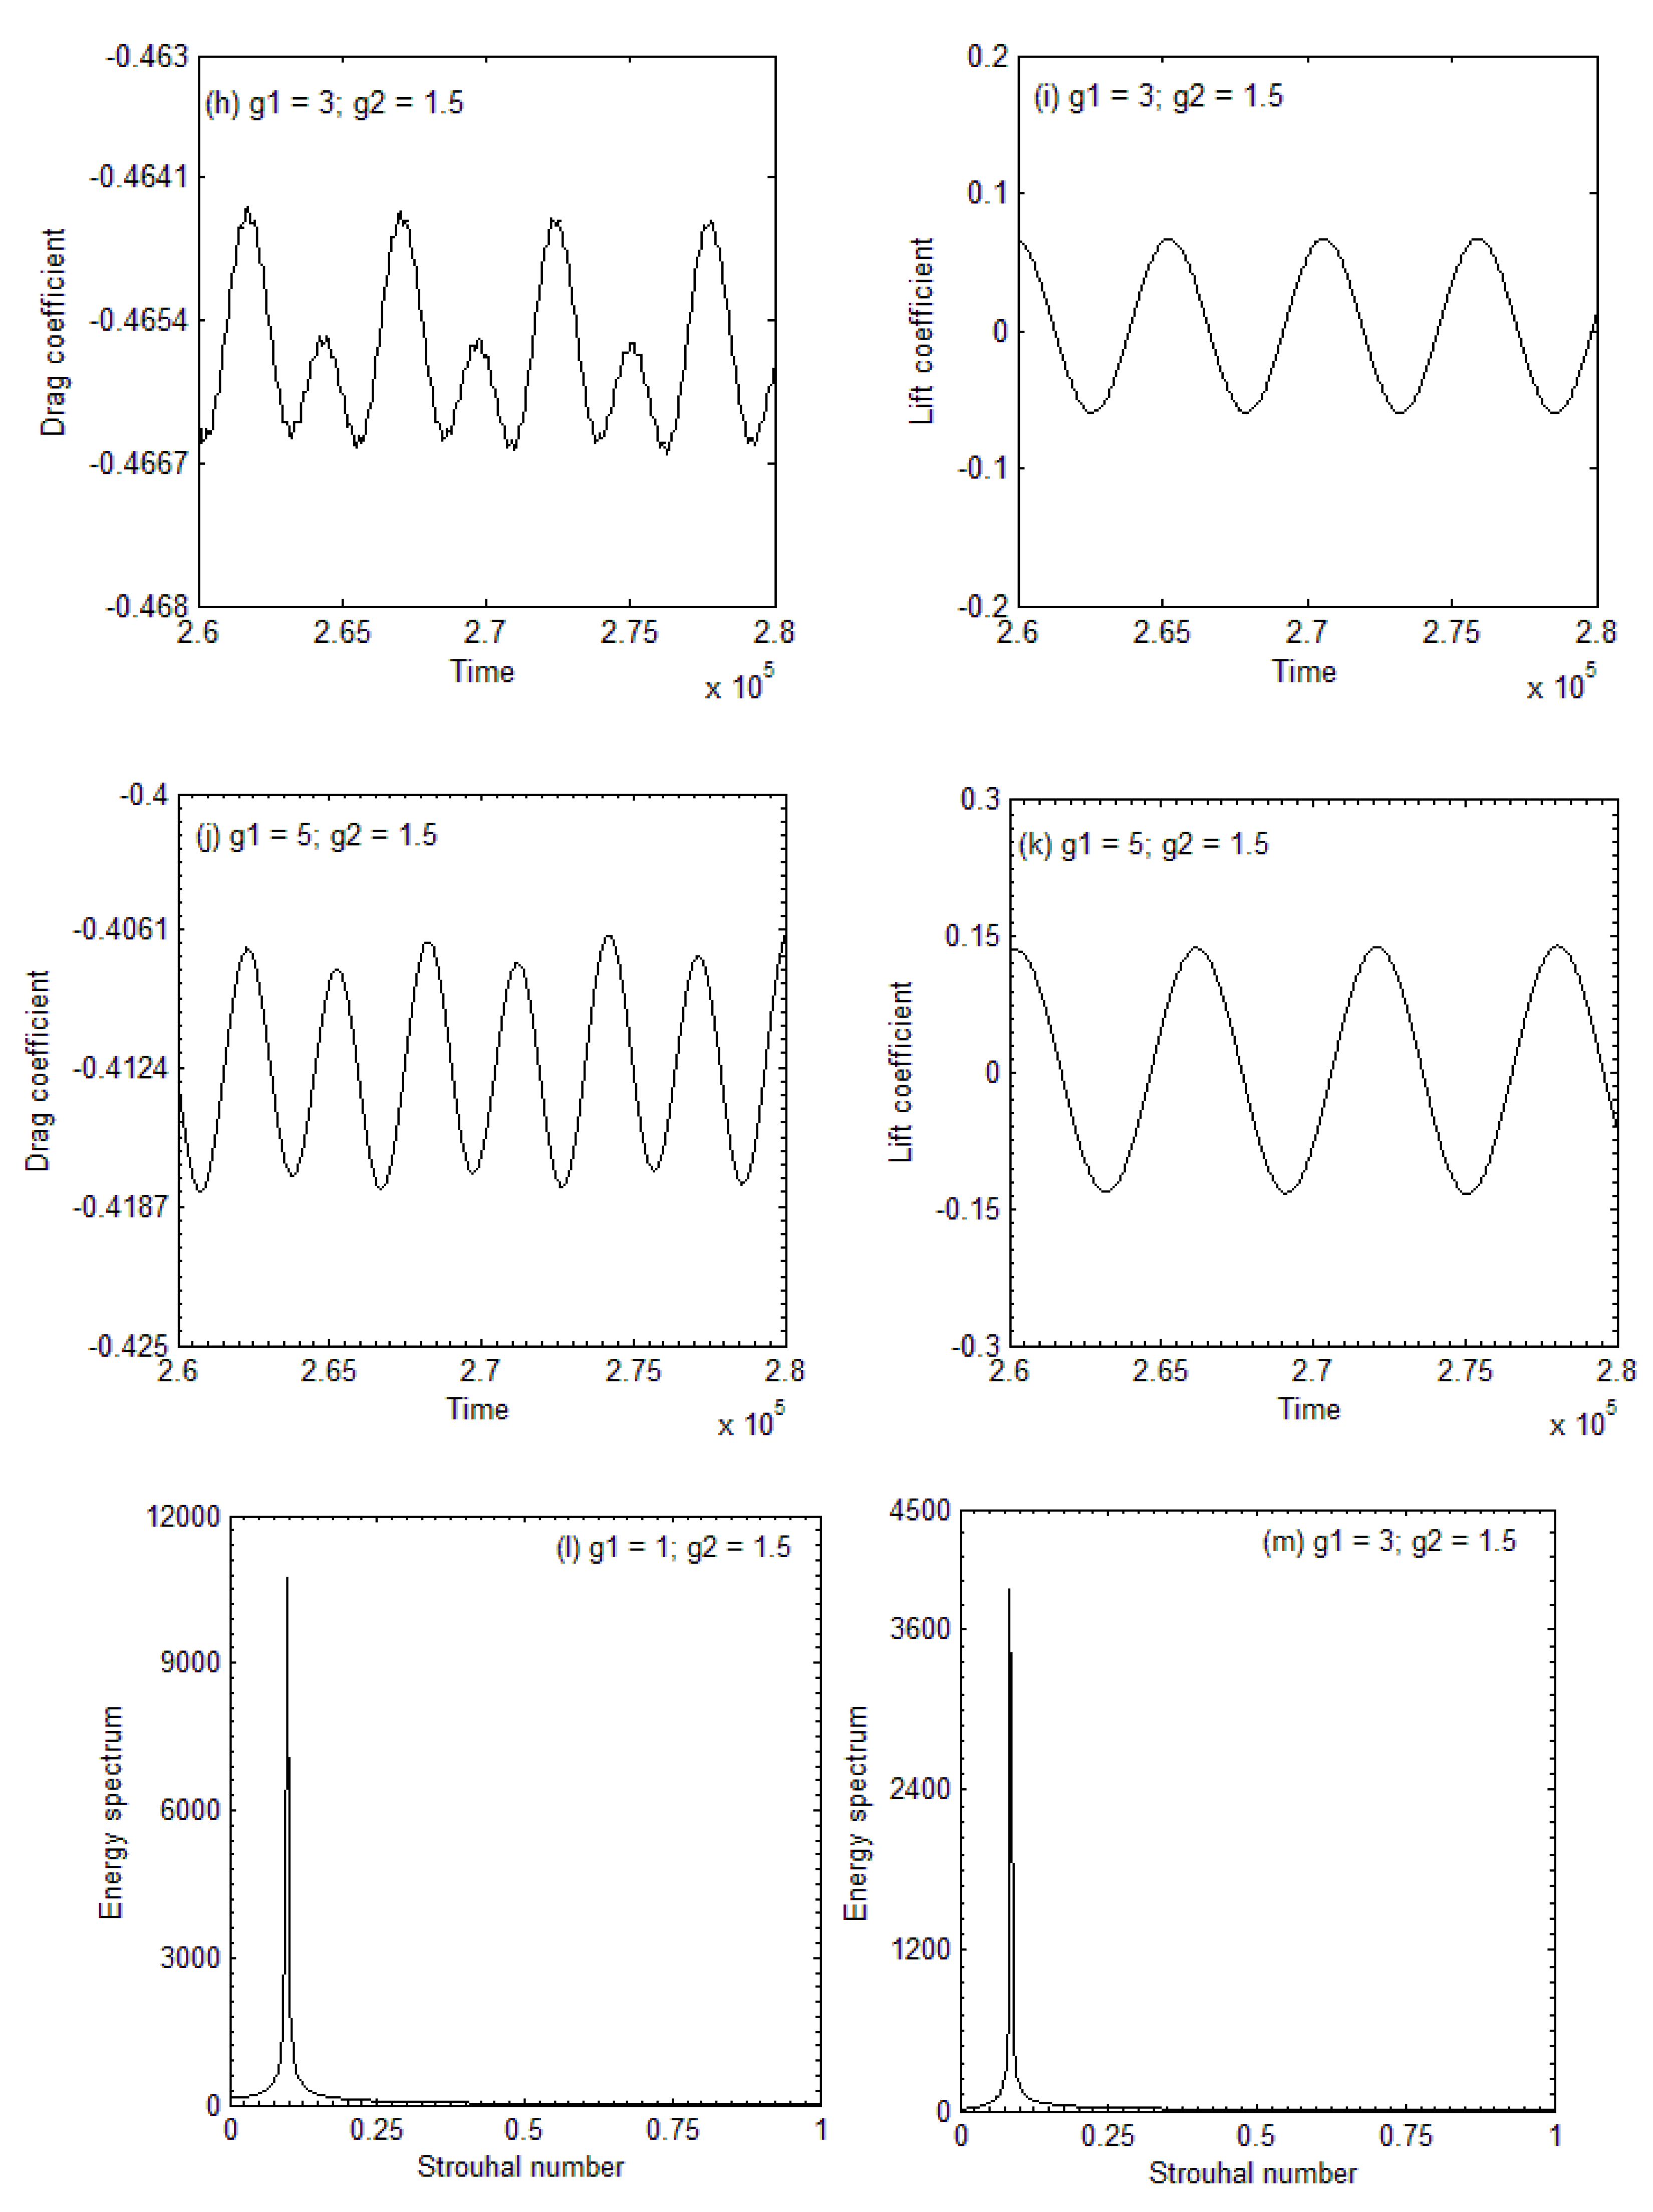
The C d and C l for the SLR flow mode are shown in Figure 4f–k. C d represents the modulated behavior due to an alternate vortex shedding throughout the channel, while C l shows periodicity due to an alternate trend of positive and negative shed vortices. The frequency of Cd increases with increasing values of g 1 for a fixed value of g 2 . The lift coefficient represents increasing and decreasing behavior with increments in value of g 1 .
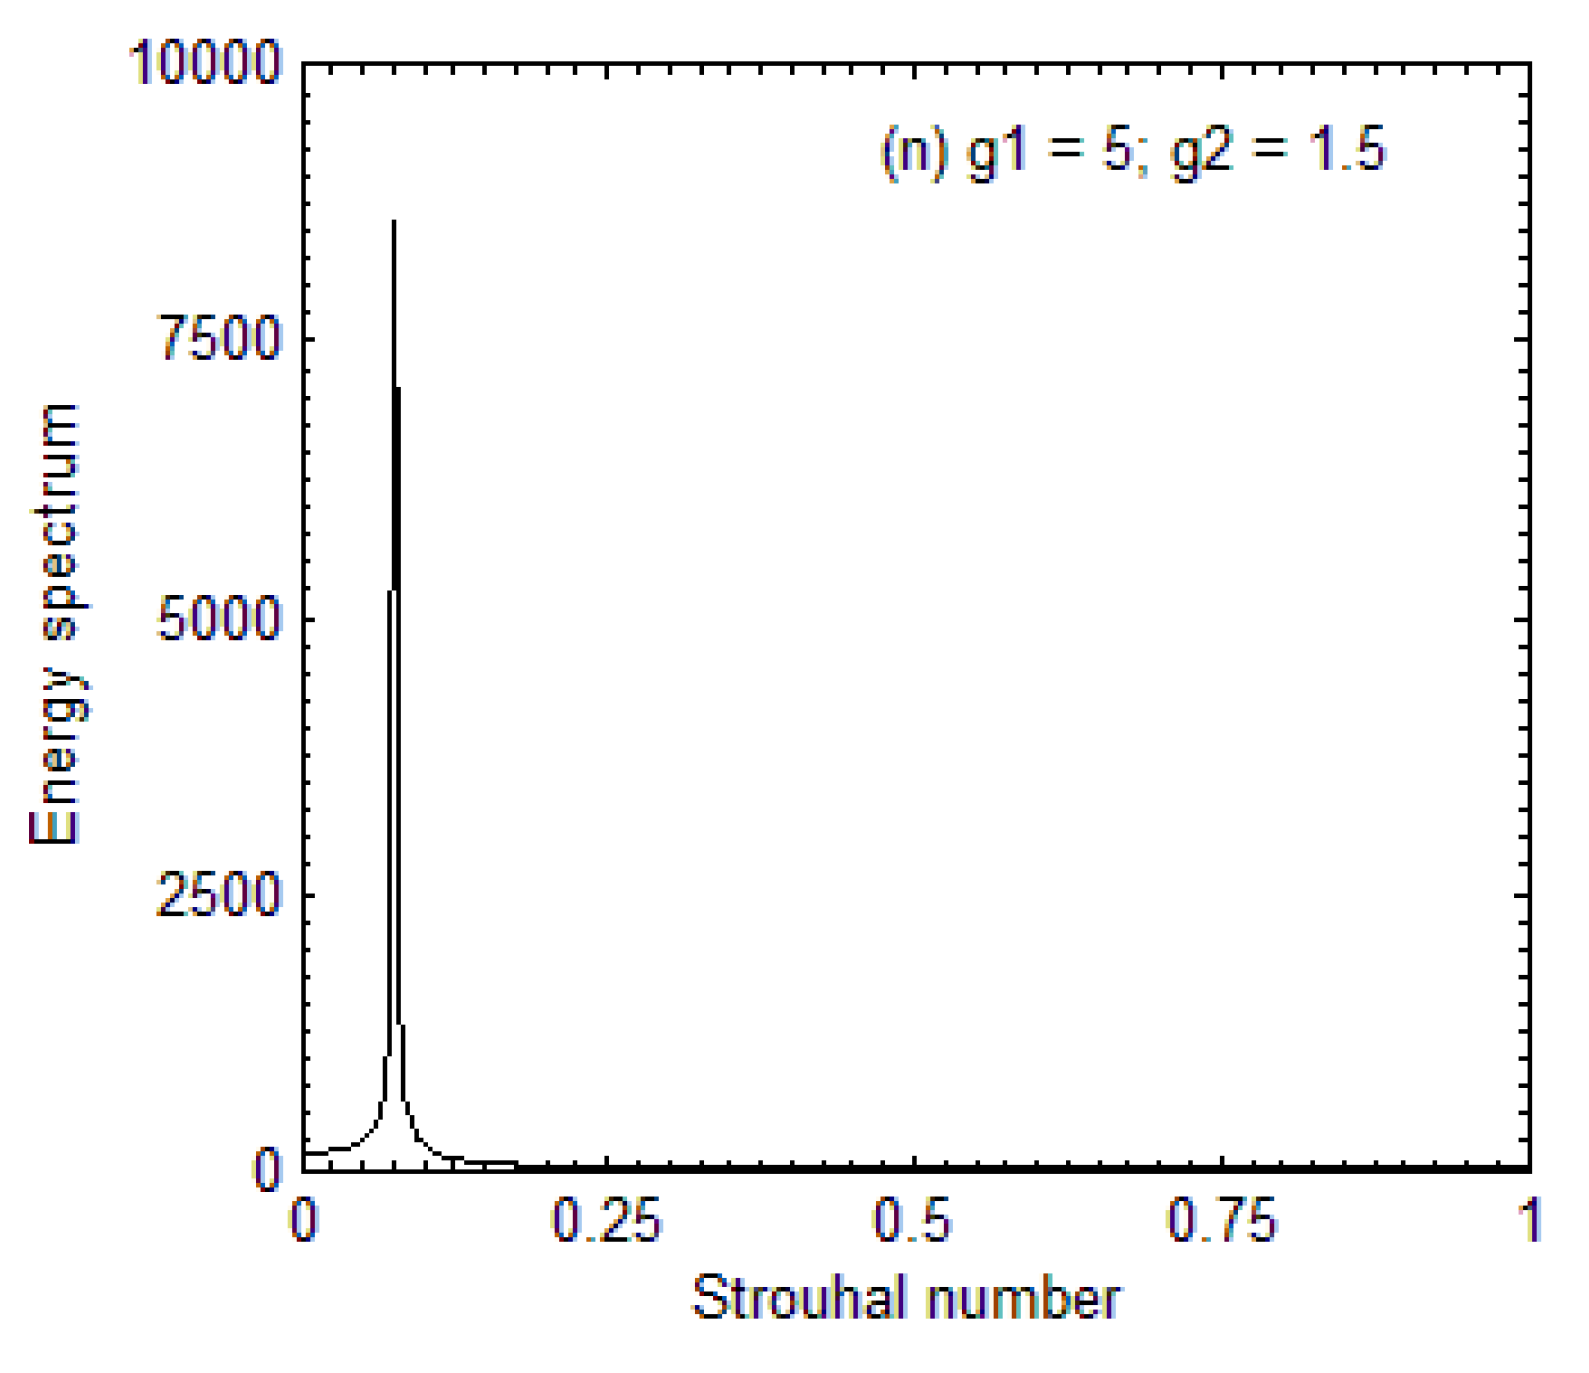
The energy spectra analysis of C l for SLR flow mode is shown in Figure 4l–n. There is a single, sharp peak for all cases discussed in this flow mode. The magnitude of the energy spectrum decreases with increasing values of g 2 for fixed values of g 1 . This is because, by increasing the value of gap spacing, weak vortex shedding occurs (see Figure 4c,d). Therefore, the magnitude of the energy spectrum reduces due to the increment in the upstream gap spacing. On the contrary, at a fixed value of g 1 , by varying the values of g 2 , the length of the energy spectrum increases. The reason for this is that the downstream horizontal controlling rod plays a vital role in generating vortices, as compared to the upstream one.
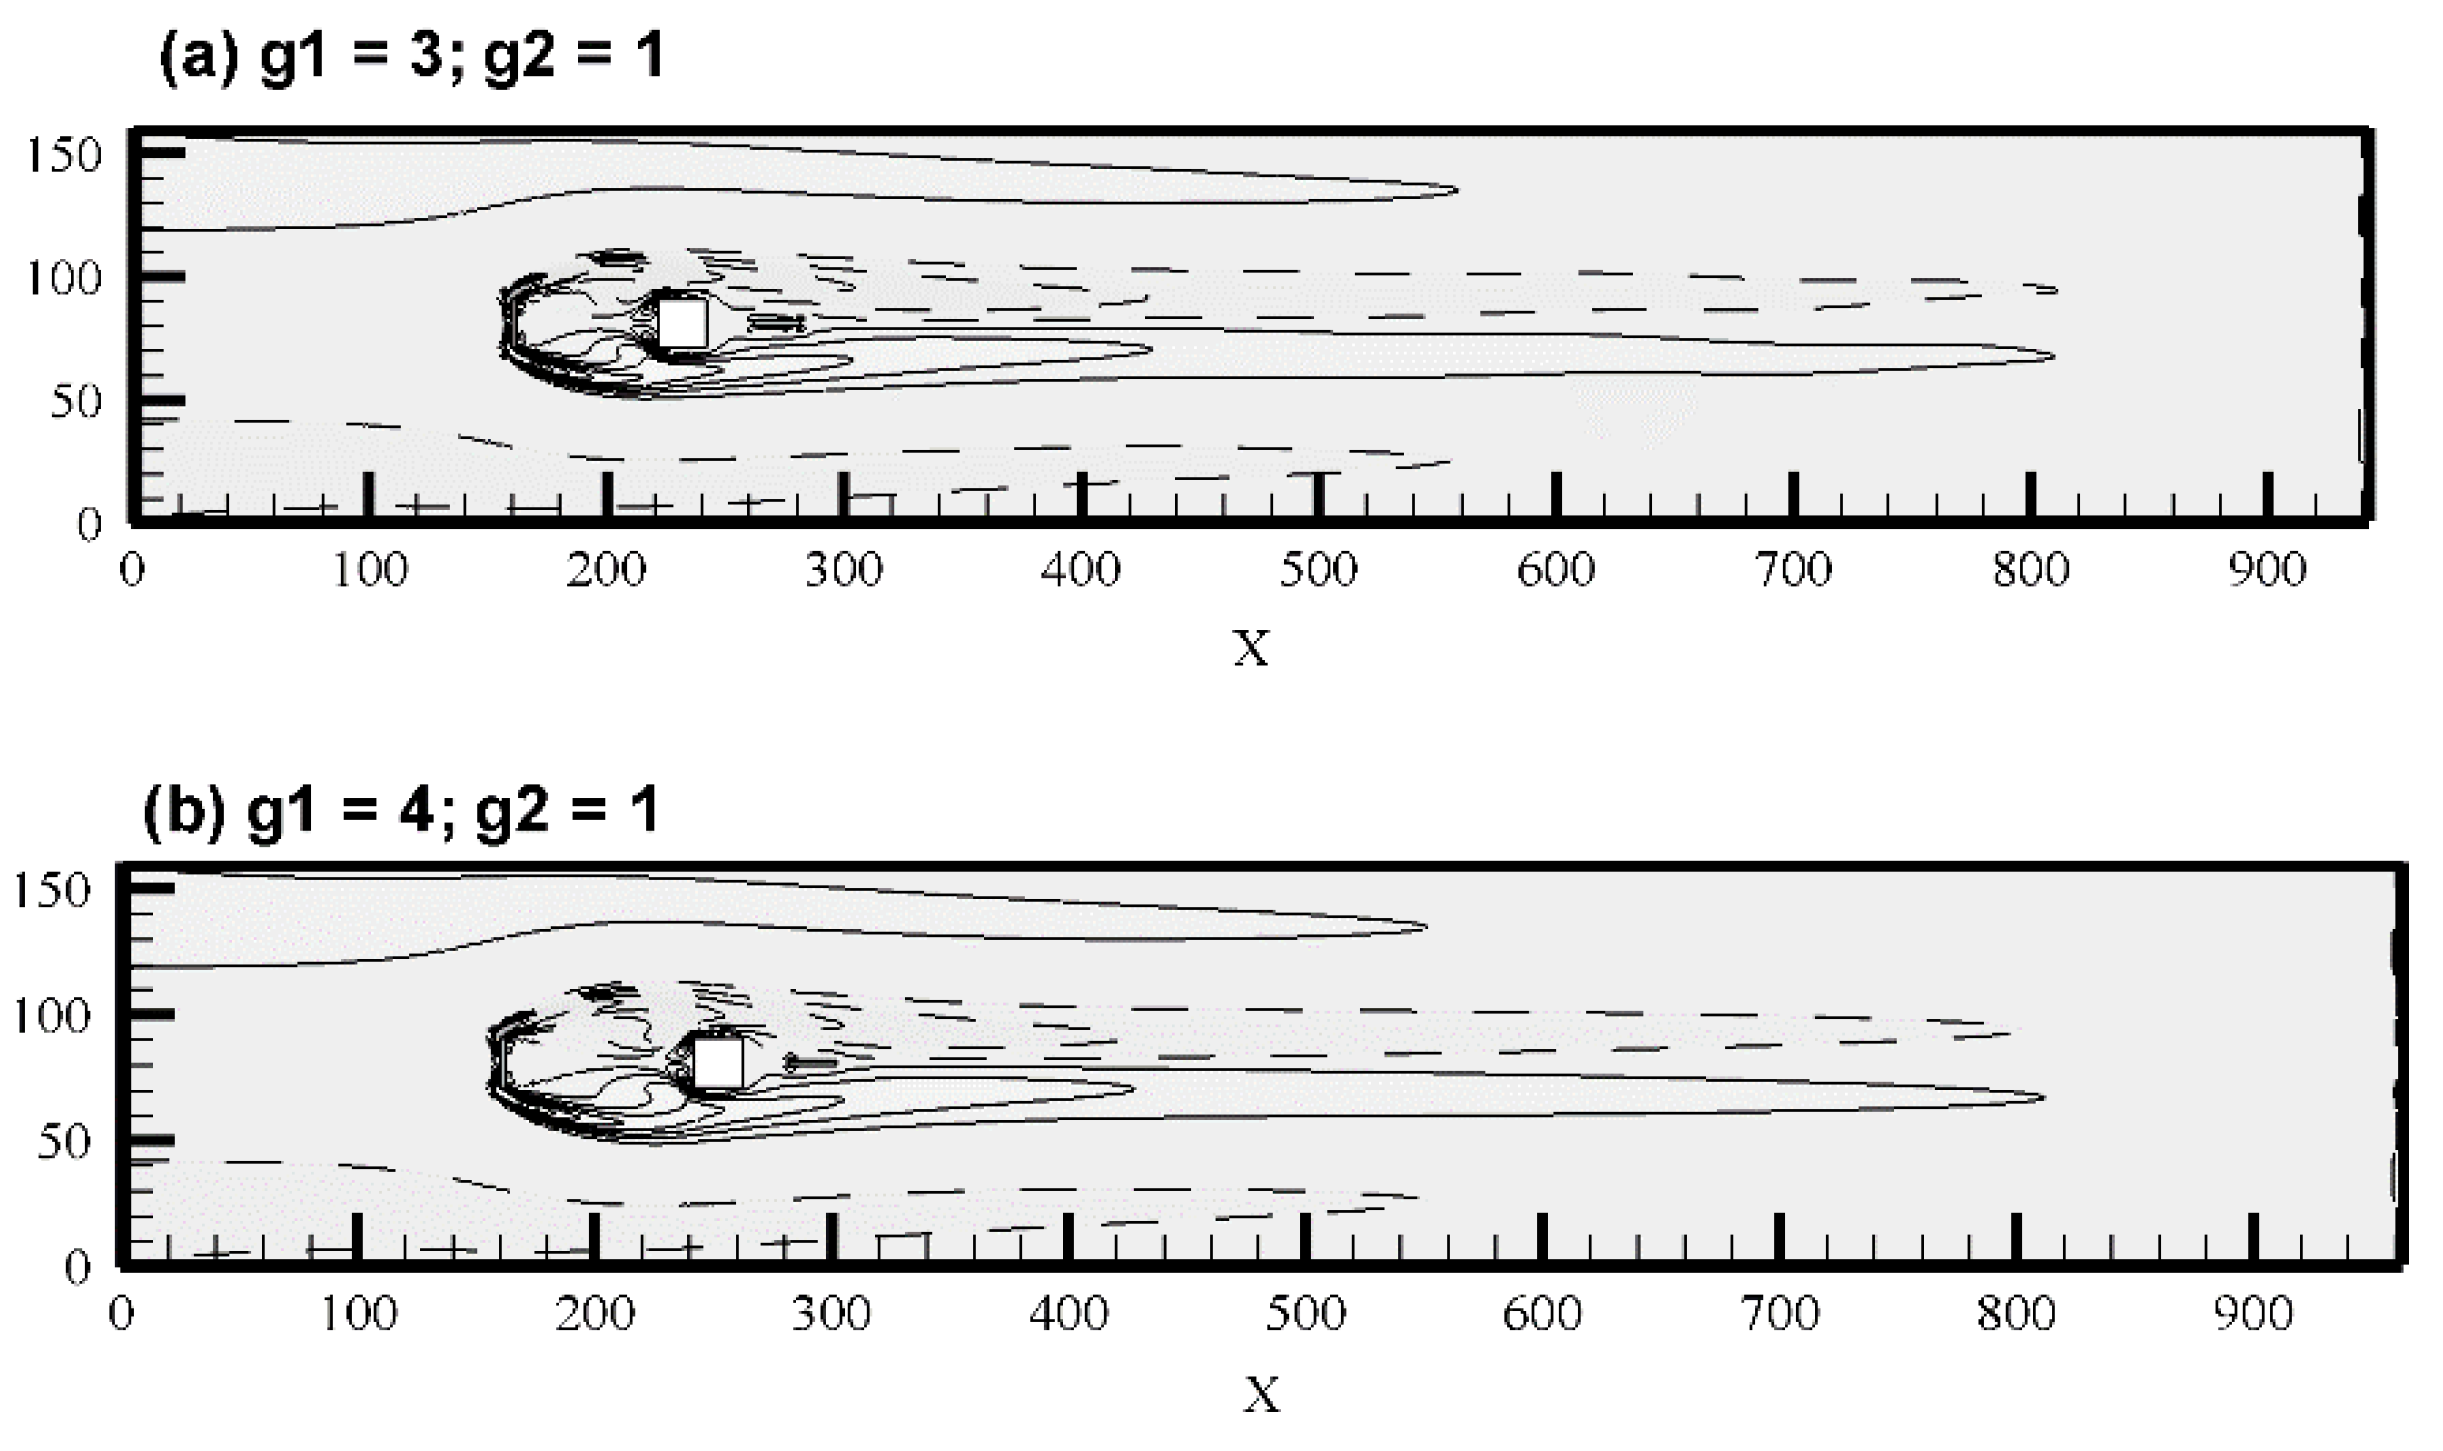
The second existing flow characteristic is called the steady flow, which was examined at larger values of g 1 ( g 1 = 3 5 ) and smaller values of g 2 , i.e g 2 = 1 (see Figure 5a–c). In this flow mode, no shed vortices were observed within either gap, nor at the downstream location of the channel. The flow remains steady throughout the channel, since in steady flow mode, the magnitude of Cd and Cl contains constant values. Therefore, we cannot compute the Strouhal number values.
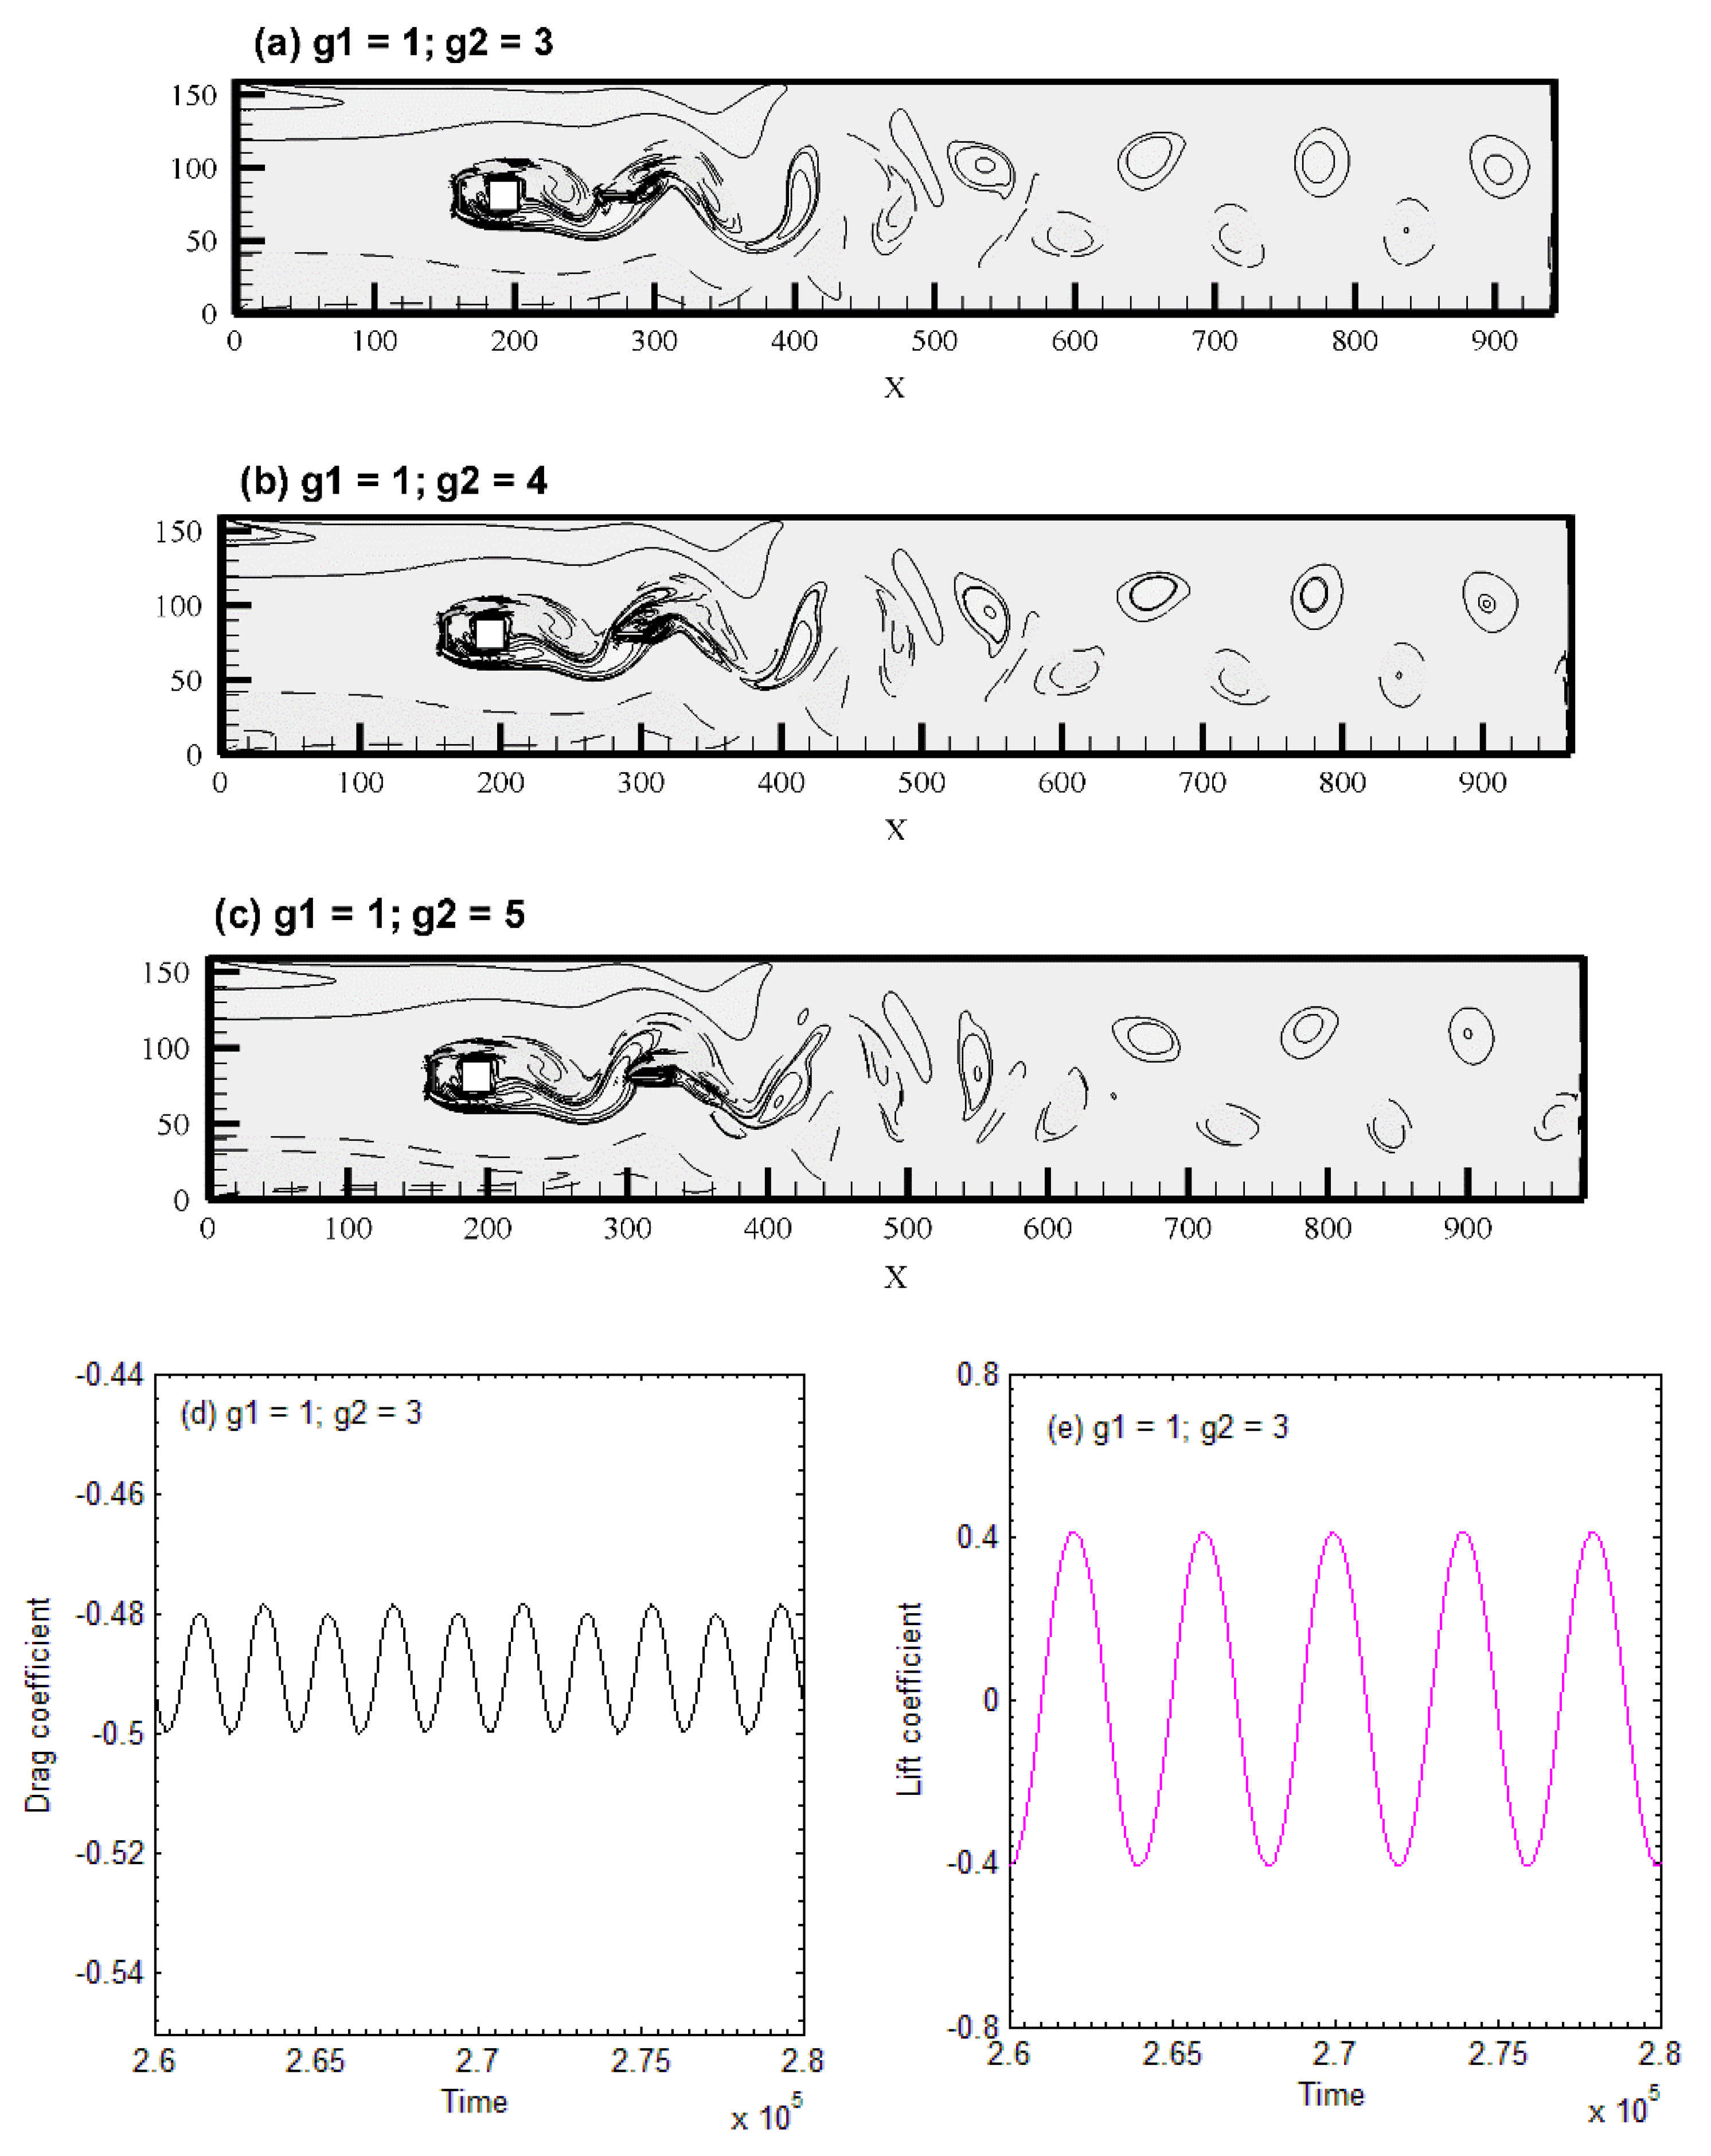
The third and last existing flow mode is only obtained at g 1 = 1 for g 2 = 3 5 (see Figure 6a,c). In this flow mode, due to sufficient spacing between the main rod and the downstream controlling rod, the flow rolls up in between the gaps. These shed vortices move towards the downstream location and mix up with vortices that are formed behind the horizontal downstream controlling rod. The size and strength of shed vortices are affected by changing the value to g 2 from 3–5 at a fixed value of g 1 = 1. There was no flow between the gap of the upstream controlling rod to the main rod due to insufficient space for vortex shedding generation. The vortices only generate in the second gap. Because of this, we named this flow characteristic as semi-developed vortex shedding (SDVS).
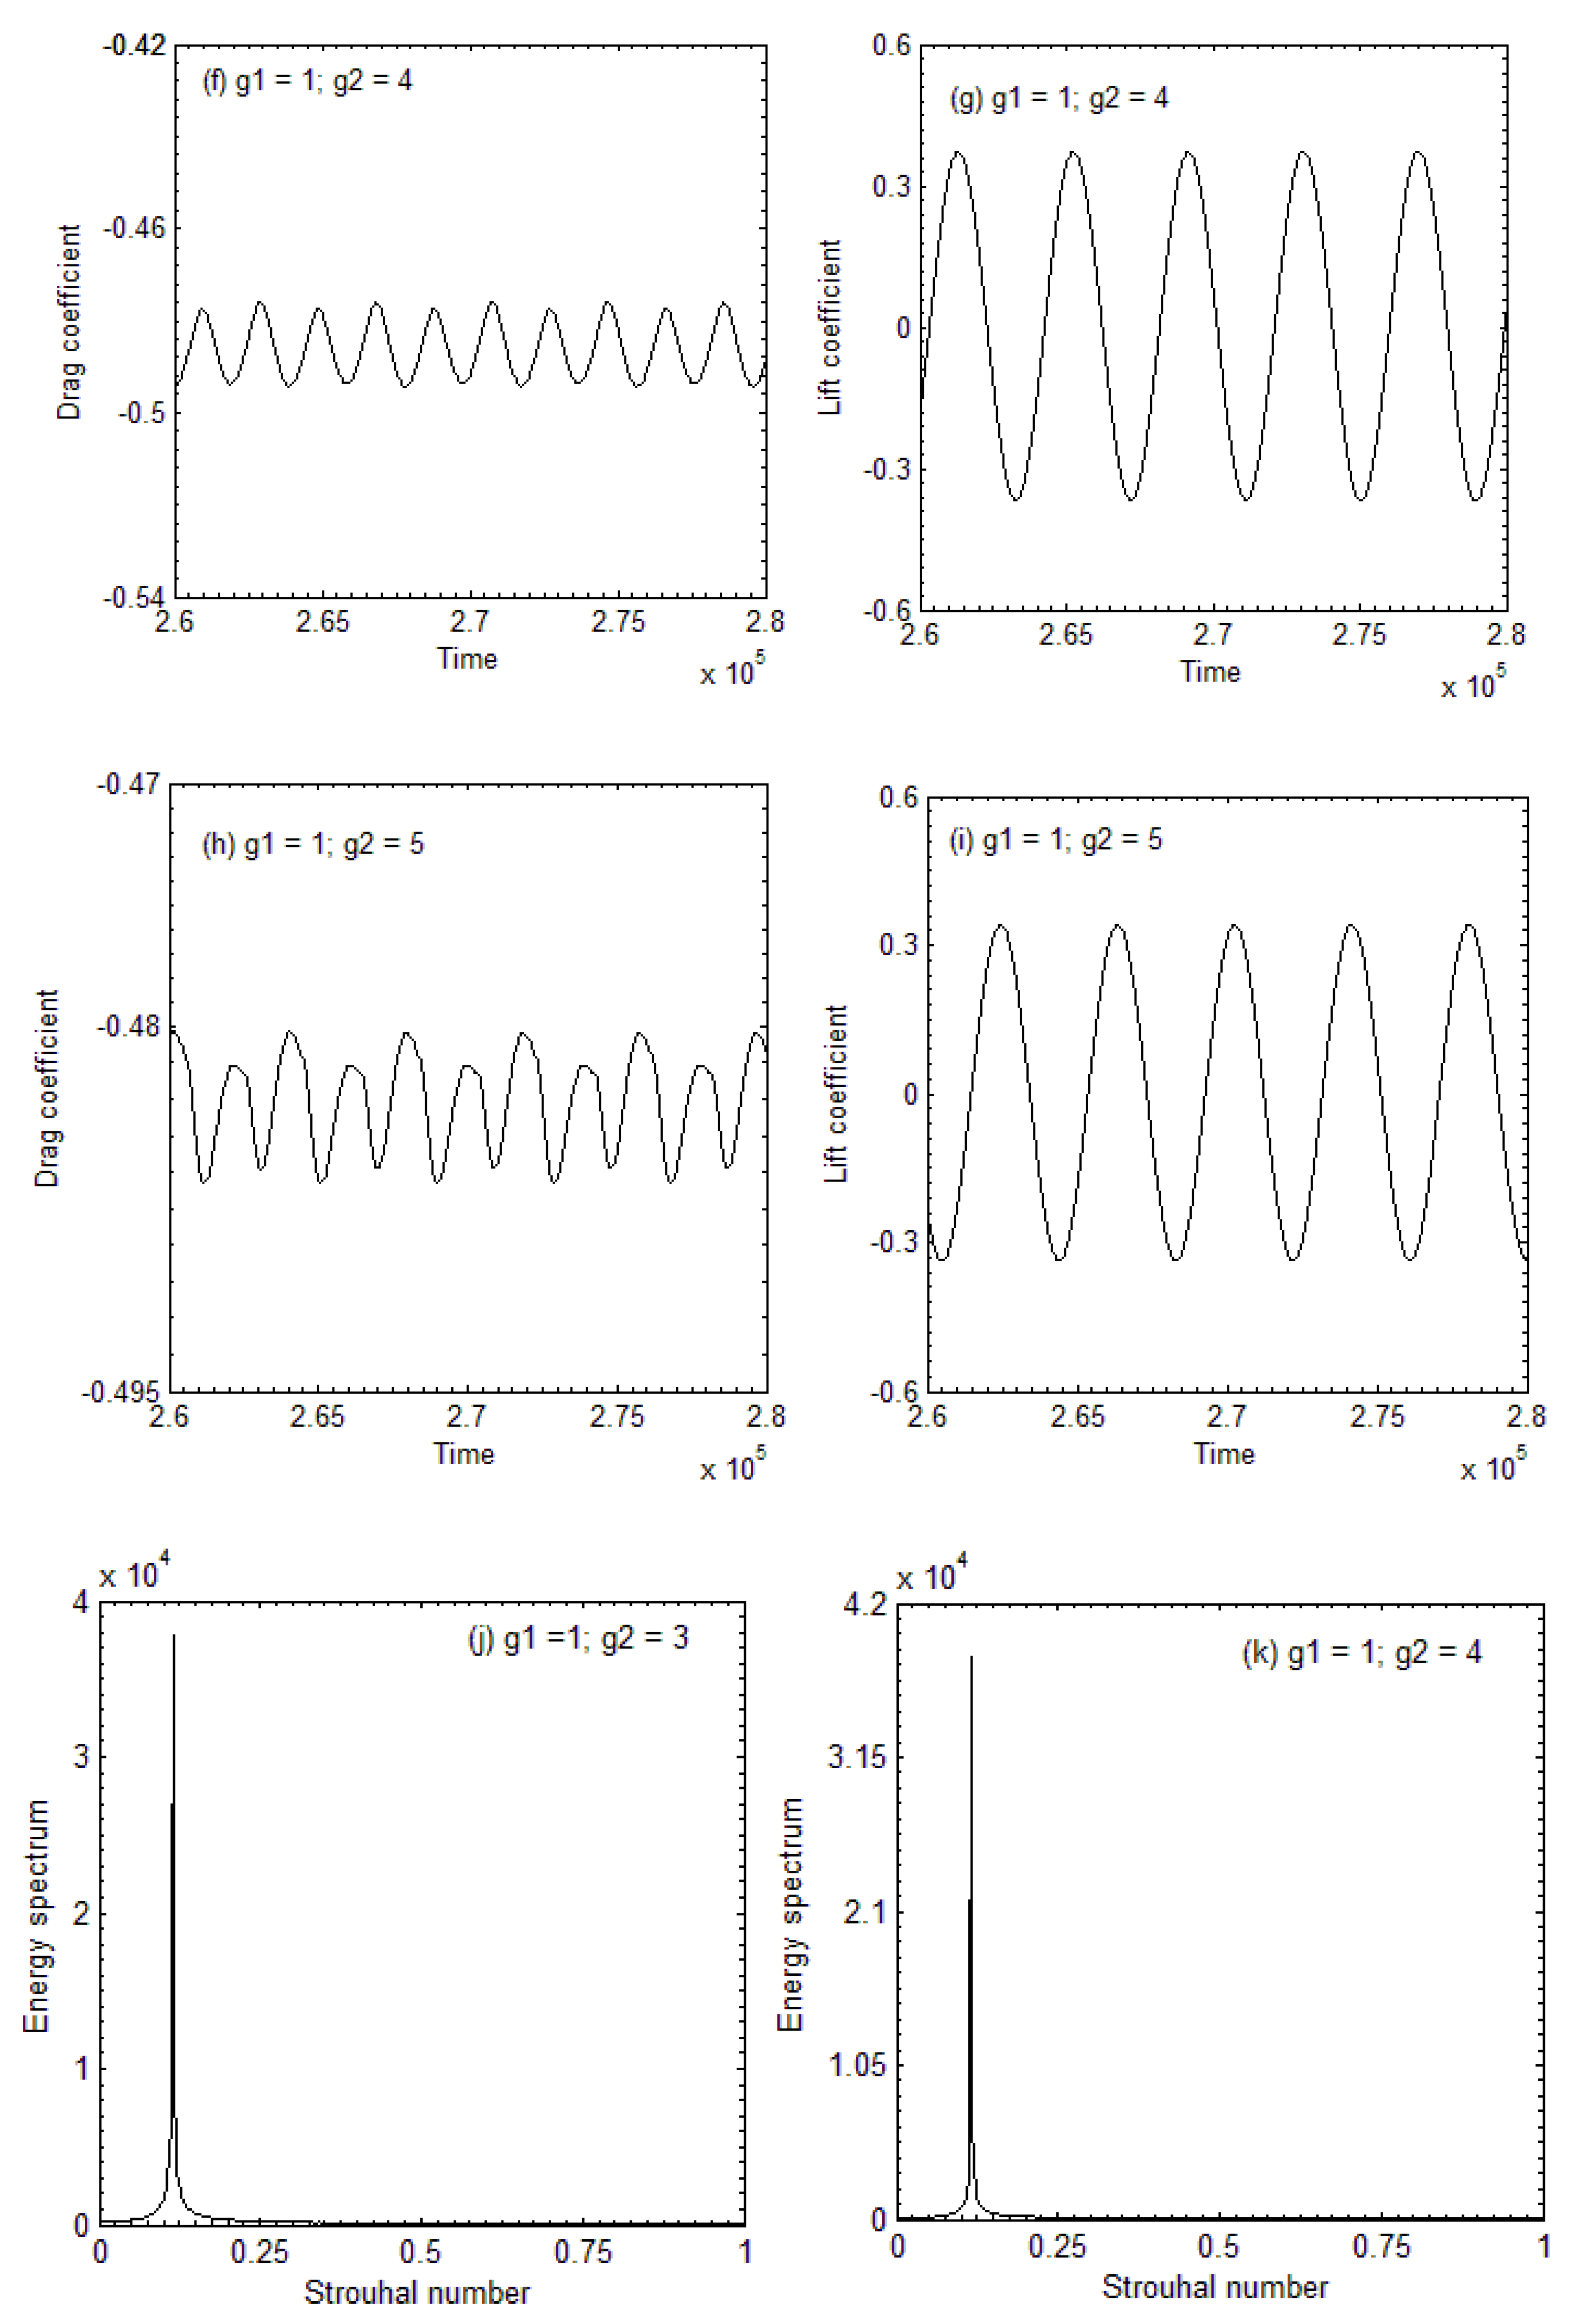
The drag (Cd) and lift (Cl) coefficients for the SDVS flow mode are shown in Figure 6d–i. The magnitude of C d contains negative values with periodic behavior, and its magnitude decreases as the values of g 2 increase, while the lift coefficient has periodic behavior for all chosen cases. The magnitude of the lift coefficient for g 1 = 1 and g 2 = 3 is greater than that for g 1 = 1 at g 2 = 4 and 5. This is because the shed vortices for the case of g 1 = 1 and g 2 = 3 are stronger and greater in size as compared to g 1 = 1 at g 2 = 4 , 5 .
The energy spectrum analysis for the SDVS flow mode contains a sharp, single, broad-banded peak because of an alternate, regular vortex shedding at the downstream location of the channel (see Figure 6j-l). The magnitude of energy spectrum decreases by increasing the value of g 2 at a fixed value of g 1 .
The complete description of all existing flow modes at different values of g 1 and g 2 is discussed in Table 4.

5.2. Physical Parameters

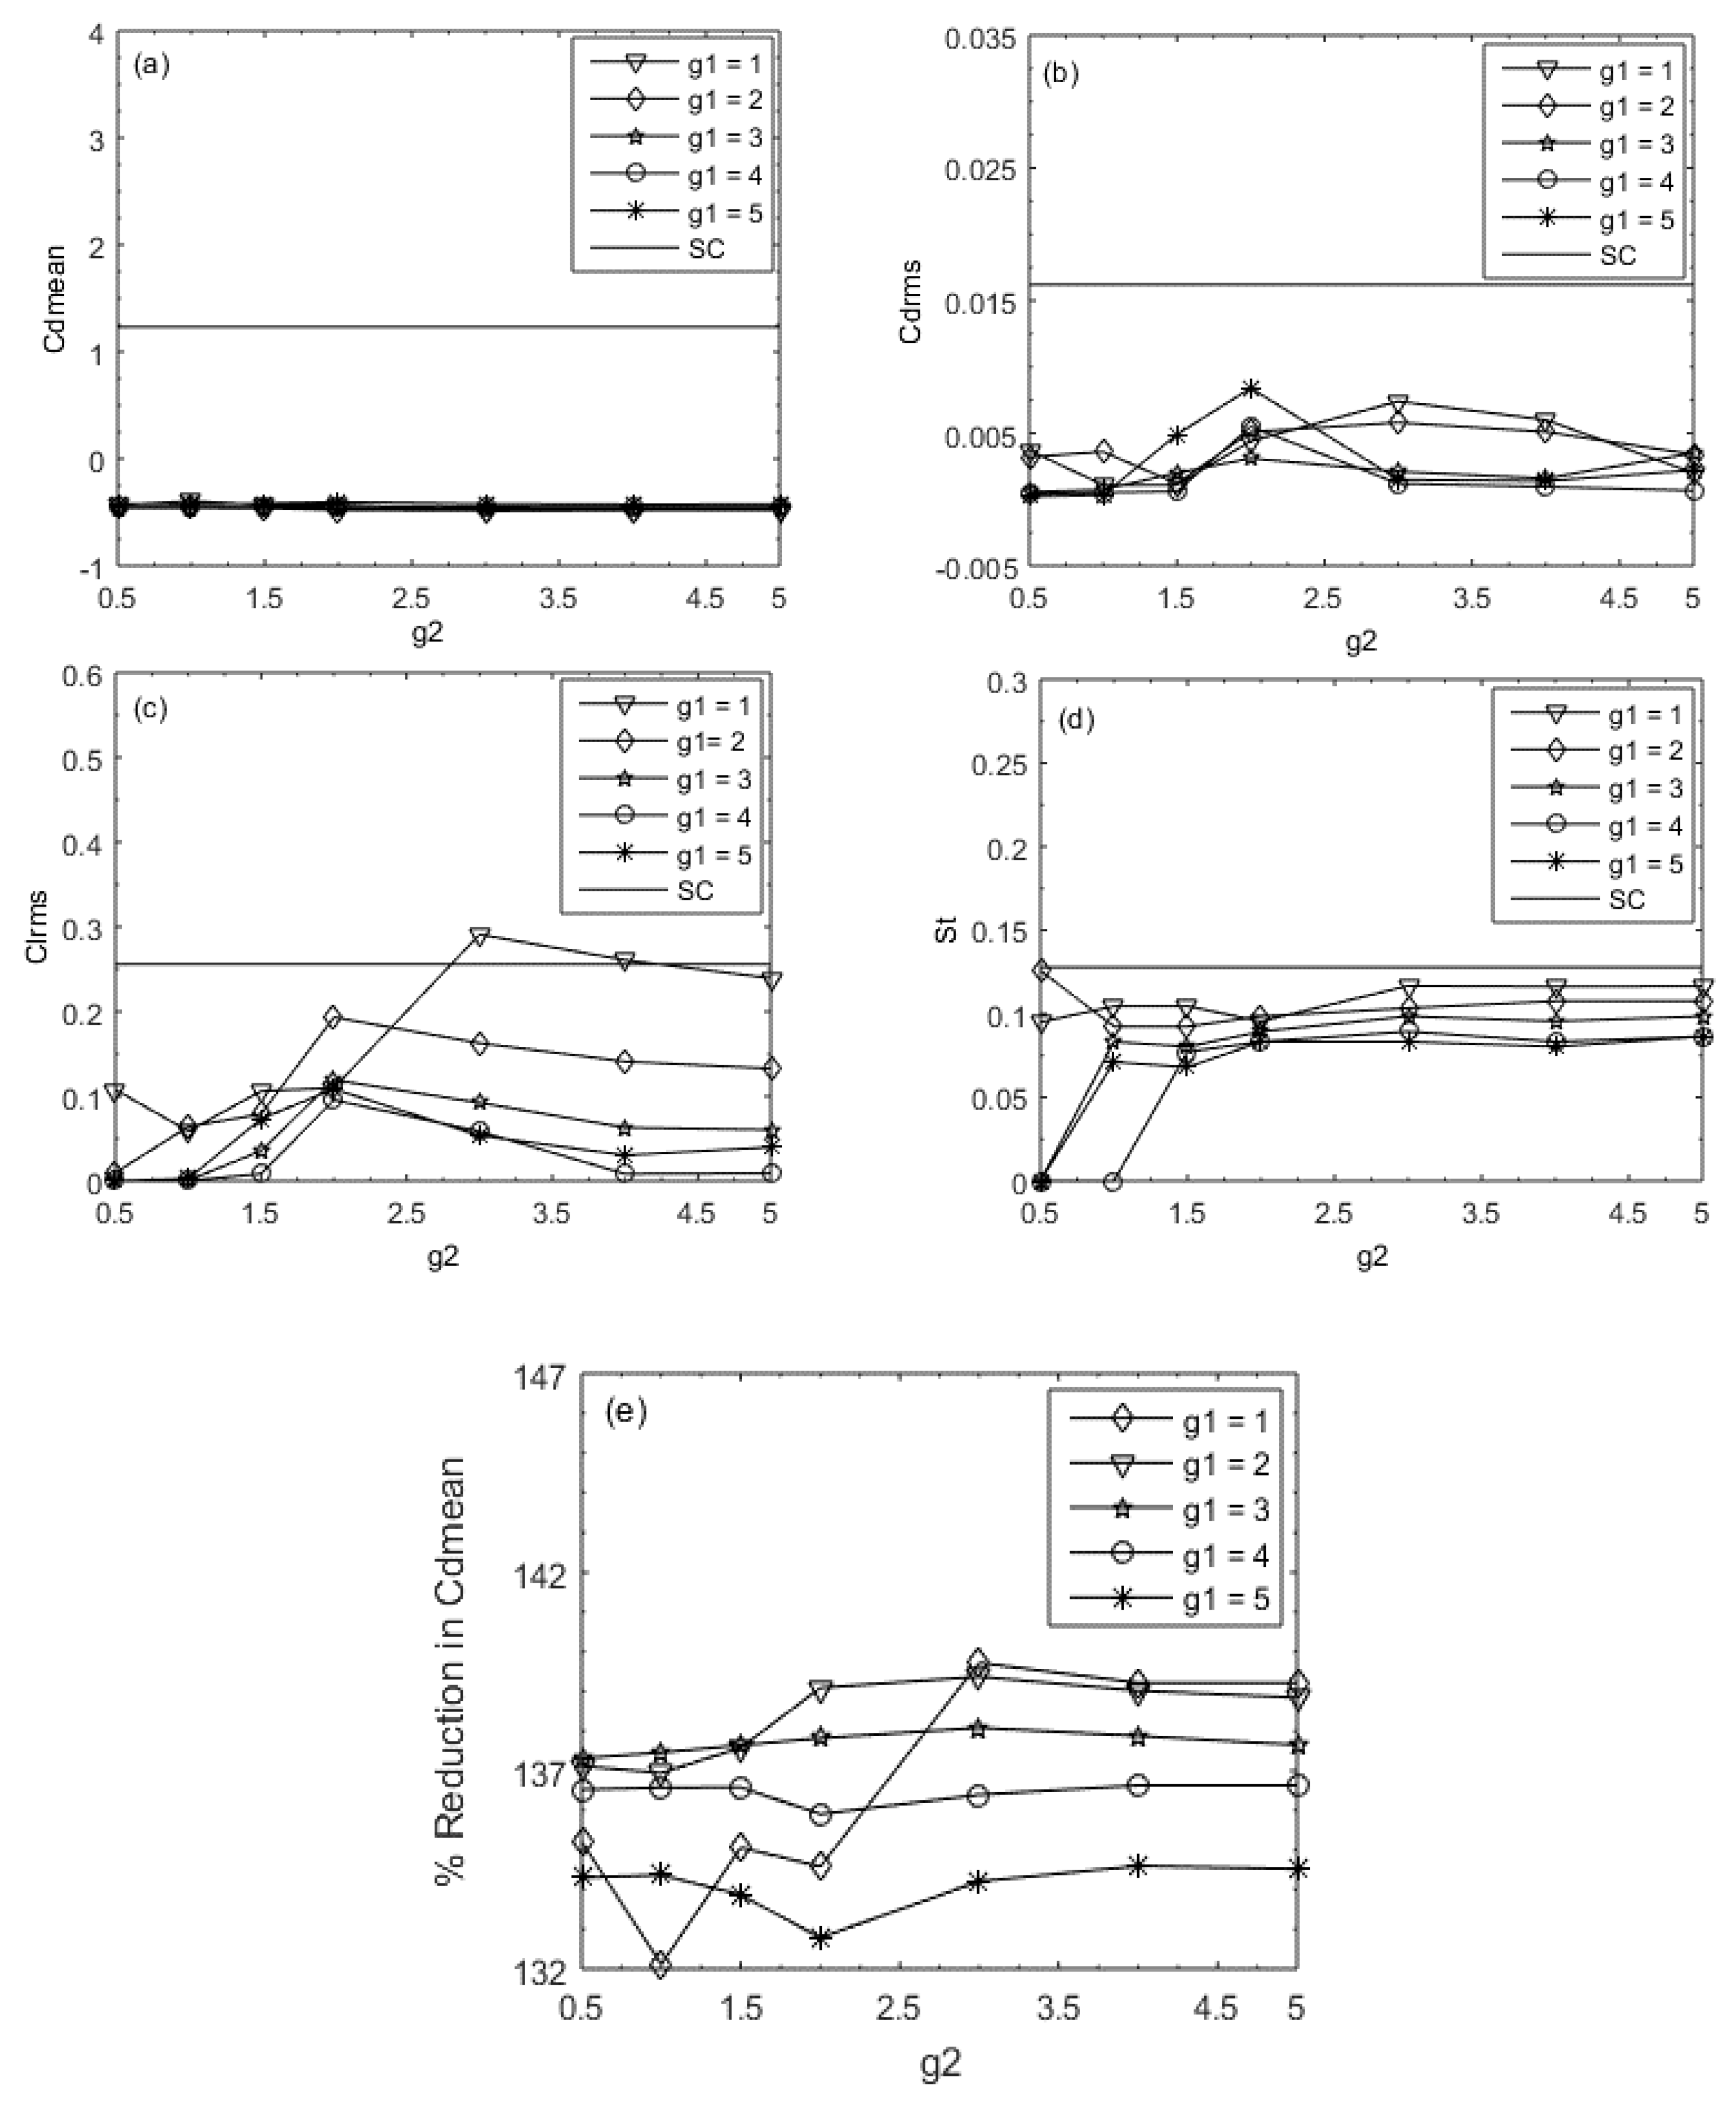
The effects of the spacing ratio ( g 1 = 1 5   and   g 2 = 0 5 ) of the upstream and downstream control rods to the main rod at a fixed Reynolds number R e = 160 in terms of force statistics such as C d m e a n , Cdrms, Clrms, and St are shown in Figure 7a–d. The value of C d m e a n against g 2 at fixed values of g 1 is drawn in Figure 7a, and for comparison, single rod data are also included. C d m e a n contains smaller values than the single rod (SC) values, and these values decrease when increasing the values of g 2 for all selected values of g 1 . The largest value of C d m e a n was found at ( g 1 , g 2 ) = ( 1 , 1 ) , i.e., −0.3956, where the flow mode is SLR. The reason for the largest Cdmean value at ( g 1 , g 2 ) = ( 1 , 1 ) is that, at a small values of gap spacing, both control rods are closed to the main rod and strongly affect the flow when it is past over the main rod. Therefore, the C d m e a n value increases at that gap spacing, while the smallest C d m e a n value was obtained at ( g 1 , g 2 ) = ( 1 , 3 ) i.e., −0.4893, where the existing flow mode is SDVS. In this flow mode, vortices are partially generated in a single gap.
The C d r m s and C l r m s values against g 2 are shown in Figure 7b,c. Both C d r m s and C l r m s have minimum values that are lower than the single rod values at all chosen g 1 values, except for some values of C l r m s obtained at ( g 1 , g 2 ) = ( 1 , 3 ) and ( 1 , 4 ) , where C l r m s values are greater than the single rod values. By increasing the value of g 2 , C d r m s and C l r m s showed fluctuating behavior, which was sometimes increasing and sometimes decreasing. The maximum and minimum values of C d r m s occurred at ( g 1 , g 2 ) = ( 5 , 2 ) and ( 5 , 0 ) . The flow mode for the maximum and minimum values of C d r m s are SLR and SF modes, respectively. The maximum value of C l r m s was examined at ( g 1 , g 2 ) = ( 1 , 3 ) , and it was 0.2910. At these values of g 1 and g 2 , a strong vortex shedding is observed within the second gap as well as downstream of the channel. As a result, the lift coefficient increases and approaches its maximum value (see Figure 7c). The St graph against g 2 is plotted in Figure 7d for a fixed value of g 1 . It has smaller values than the St value of the single rod, except when ( g 1 , g 2 ) = ( 2 , 0.5 ) , whose St value is approximately equal to the single rod St value. A sudden jump in Strouhal number is also visualized at g 1 = 1 for g 2 = 0.5 1 . After that, small changes in terms of increasing and decreasing behavior of St were observed until g 2 = 5. The greatest value of St was obtained at ( g 1 , g 2 ) = ( 2 , 0.5 ) , and this value is 0.1258. The detail in the percentage reduction of C d m e a n is shown in Figure 7e and Table 5. There are mixed trends that are increasing or decreasing until g 2 = 2 , after which the percentage reduction in C d m e a n increases as the values of g 2 increase. The maximum reduction in the Cdmean was obtained at ( g 1 , g 2 ) = ( 1 , 3 ) , and this value is 139.72%, and the minimum reduction was acquired at ( g 1 , g 2 ) = ( 1 , 1 ) , and this value is 132.1%.

6. Conclusions

Numerical investigations were performed through the LBM method to study the main impact of g for flow past a square rod detached from two controlling rods, placed in the up- and downstream directions. R e = 160 was fixed, and gap spacing ( g 1 , g 2 ) between the upstream control rod and the main rod and between the main rod and the downstream control rod was varied, i.e. where g 1 = 1 5 and g 2 = 0.5 5 . First, we checked the validity of the present code by comparing the obtained results with available data in the literature. After validation, we performed simulations for the present problem and obtained the following:
(i)
Three different types of flow modes were found and were named (a) shear layer reattachment (SLR), (b) steady flow mode (SF), and (c) semi-developed vortex shedding (SDVS).
(ii)
The C d m e a n values were negative for all selected combinations of g 1 and g 2 due to the effect of trust.
(iii)
The values of C d m e a n decreased by increasing the gap spacing. The maximum value of C d m e a n was obtained at ( g 1 , g 2 ) = ( 1 , 1 ) i . e . , 0.3956 .
(iv)
The values of C d r m s and C l r m s increased by increasing the value of g 2 at fixed values of g 1 . The maximum values of C d r m s and C l r m s were obtained at 0.0084 and 0.2910, respectively.
(v)
The greatest reduction in C d m e a n was obtained at ( g 1 ,   g 2 ) =   ( 1 ,   3 ) , and this value was 139.72%.
(vi)
The minimum reduction was acquired at ( g 1 ,   g 2 ) = ( 1 ,   1 ) , and this value was 132.1%.

Author Contributions

Conceptualization: K.S.N.; formal analysis: A.G. and D.B.; methodology: K.S.N.; software: A.G.; validation: D.B.; writing—original draft: R.M.; writing—review & editing: A.G., K.S.N. and D.B. All authors have read and agreed to the published version of the manuscript.

Funding

This research received no external funding.

Conflicts of Interest

The authors have declared that no competing interests exist.

Nomenclature

CdDrag
ClLift
C d m e a n Mean drag force
C d r m s Root-mean-square value of drag force
C l r m s Root-mean-square value of lift force
C s Speed of sound
h Height of the control rods
d Size of the main rod
l Length of the control rods
e i Velocities direction
F d Horizontal component of force
F 1 Transverse component of force
fsVortex shedding
h i Density distribution function
h i ( e q ) Equilibrium distribution function
L u Upstream position
L d Downstream position
Q Number of particles
R e Reynolds number
S t Strouhal number
U Uniform inflow velocity
SFSteady flow
SLRShear layer reattachment
SDVSSemi developed vortex shedding
SRSingle rod
Greek Symbols
ν   Kinematic viscosity
ρ   Fluid density
ξ Weighting coefficients

References

  1. Darekar, R.M.; Sherwin, S.J. Flow past a bluff body with a wavy stagnation face. J. Fluid Struct. 2001, 15, 587–596. [Google Scholar] [CrossRef]
  2. Hwang, J.; Yang, K. Drag reduction on a circular cylinder using dual detached control rods. J. Wind Eng. Ind. Aerodyn. 2007, 95, 551–564. [Google Scholar] [CrossRef]
  3. Lee, S.; Lee, S.; Park, C. Reducing the drag on a circular cylinder by upstream Installation of a small control rod. Fluid Dyn. Res. 2004, 34, 233–250. [Google Scholar] [CrossRef]
  4. Roshko, A. On the Drag and Shedding Frequency of 2D Bluff Bodies; Tech Rept TN 3169; NACA: Washington, DC, USA, 1954. [Google Scholar]
  5. Apelt, C.; West, G. The Effects of Wake Control rods on Bluff-Body Flow in the Range 104 < Re < 5 × 10⁴. J. Fluid Mech. 1975, 71, 145–160. [Google Scholar]
  6. Anderson, E.; Szewczyk, A. Effects of a Control rod on the Near Wake of a Circular Cylinder in 2D and 3D Flow Configurations. In Experimental on Fluids; Springer London: London, UK, 1997. [Google Scholar]
  7. Mittal, S.; Raghuvanshi, A. Control of vortex shedding behind circular cylinder for flows at low Reynolds numbers. Int. J. Numer. Methods Fluids 2001, 35, 421–447. [Google Scholar] [CrossRef]
  8. Kuo, C.H.; Chen, C.C. Passive control of wake flow by two small control cylinders at Reynolds number 80. J. Fluids Struct. 2009, 25, 1021–1028. [Google Scholar] [CrossRef]
  9. Alam, M.M.; Moriya, M.; Takai, K.; Sakamoto, H. Suppression of fluid forces acting on two square prisms in a tandem arrangement by passive control of flow. J. Fluids Struct. 2002, 16, 1073–1092. [Google Scholar] [CrossRef]
  10. Tsutsui, T.; Igrashi, T. Drag Reduction of a Circular Cylinder in an Air-Stream. J. Wind Eng. Ind. Aerodyn. 2002, 4, 527–541. [Google Scholar] [CrossRef]
  11. Turki, S. Numerical simulation of passive control on vortex shedding behind square rod using control rod. Eng. Appl. Comput. Fluid Mech. 2008, 2, 514–524. [Google Scholar]
  12. Malekzadeh, S.; Sohankar, A. Reduction of fluid forces and heat transfer on a square rod in a laminar flow regime using a control rod. Int. J. Heat Fluid Flow 2012, 34, 15–27. [Google Scholar] [CrossRef]
  13. Islam, S.U.; Rahman, H.; Abbasi, W.S.; Noreen, U.; Khan, A. Suppression of fluid force on flow past a square rod with a detached flat plate at low Reynolds number for various spacing ratios. J. Mech. Sci. Technol. 2014, 28, 4969–4978. [Google Scholar] [CrossRef]
  14. Vamsee, G.R.; De Tena, M.L.; Tiwari, S. Effect of arrangement of inline control rod on flow past square rod. Prog. Comput. Fluid. Dyn. 2014, 14, 277–293. [Google Scholar] [CrossRef]
  15. Islam, S.U.; Manzoor, R.; Tareen, A. Numerical investigation of flow around square rod with an upstream control rod at low Reynolds numbers in tandem. J. Braz. Soc. Mech. Sci. Eng. 2017, 39, 1201–1223. [Google Scholar] [CrossRef]
  16. De Araujo, L.A.; Schettini, E.B.C.; Silvestrini, J.H. Direct numerical simulation of turbulent flow past a cylinder with control rod. In Proceedings of the 10th ABCM Spring School on Transition and Turbulence, São José dos Campos, Brazil, 19–23 September 2016. [Google Scholar]
  17. Vu, H.C.; Ahn, J.; Hwang, J.H. Numerical investigation of flow around circular cylinder with control rod. KSCE J. Civ. Eng. 2016, 20, 2559–2568. [Google Scholar] [CrossRef]
  18. Yuan, M.; Rashidi, M.M.; Yang, Z.G. Numerical Simulation of Flow past a Square rod with a Circular Bar Upstream and a Control rod downstream. J. Hydrodyn. 2018. [Google Scholar] [CrossRef]
  19. Gupta, A. Suppression of Vortex Shedding in Flow around Square Cylinder Using Control Cylinder; Department of Mechanical Engineering Indian Institute of Technology: Kanpur, India, 2013. [Google Scholar]
  20. Shadloo, M.S.; Zainali, A.; Yildziz, M.; Suleman, A. A robust weakly compressible SPH method and its comparison with an incompressible SPH. Int. J. Numer. Methods Eng. 2012, 89, 939–956. [Google Scholar] [CrossRef]
  21. Shadloo, M.S.; Zainli, A.; Sadek, S.H.; Yildziz, M. Improved Incompressible Smoothed Particle Hydrodynamics method for simulating flow around bluff bodies. Comput. Methods Appl. Mech. Eng. 2011, 200, 1008–1020. [Google Scholar] [CrossRef]
  22. D’Orazio, A.; Nikkah, Z.; Karimipour, A. Simulation of copper–water nano fluid in a micro channel in slip flow regime using the lattice Boltzmann method with heat flux boundary condition. J. Phys. Conf. Ser. 2015, 655, 012029. [Google Scholar] [CrossRef]
  23. Goodarzi, M.; D’Orazio, A.; Keshavarzi, A.; Mousavi, S.; Karimipour, A. Develop the nano scale method of lattice Boltzmann to predict the fluid flow and heat transfer of air in the inclined lid driven cavity with a large heat source inside, Two case studies: Pure natural convection & mixed convection. Phys. A Stat. Mech. Its Appl. 2018, 509, 210–233. [Google Scholar] [CrossRef]
  24. Chen, S.; Doolen, G.D. Lattice Boltzmann method for fluid flows. Ann. Rev. Fluid Mech. 1998, 30, 329–364. [Google Scholar] [CrossRef] [Green Version]
  25. Mohammad, A.A. Lattice Boltzmann Method: Fundamentals and Engineering Applications with Computer Codes; Springer London: London, UK, 2011. [Google Scholar]
  26. Rossi, N.; Ubertini, S.; Bella, G.; Succi, S. Unstructured lattice Boltzmann method in three dimensions. Int. J. Numer. Methods Fluids 2005, 49, 619–633. [Google Scholar] [CrossRef]
  27. Cornubert, R.; D’Humières, D.; Levermore, D. A Knudsen number theory for lattice gases. Physica D 1991, 47, 241–259. [Google Scholar] [CrossRef]
  28. Qian, Y.; D’Humieres, D.; Lallemand, P. Lattice BGK models for Navier-Stokes Equation. Europhys. Lett. 1992, 17, 479–484. [Google Scholar] [CrossRef]
  29. Succi, S. Lattice Boltzmann Method for Fluid Dynamics and Beyond; Oxford Univ. Press: Oxford, UK, 2001. [Google Scholar]
  30. Wolf-Gladrow, D.A. Lattice-Gas Cellular Automata and Lattice Boltzmann Models an Introduction; Springer: Berlin/Heidelberg, Germany, 2005. [Google Scholar]
  31. Sukop, M.C.; Thorne, D.T. Lattice Boltzmann Modeling: An Introduction for Geoscientists and Engineers; Springer: Berlin/Heidelberg, Germany, 2006. [Google Scholar]
  32. Guo, Z.; Liu, H.; Luo, L.S.; Xu, K. A comparative study of the LBE and GKS method for 2D near incompressible laminar flows. J. Comput. Phys. 2008, 22, 4955–4976. [Google Scholar] [CrossRef]
  33. Saha, A.K.; Biswas, G.; Muralidhar, K. Three-dimensional study of flow past a square cylinder at low Reynolds numbers. Int. J. Heat Fluid Flow. 2003, ED-24, 54–66. [Google Scholar] [CrossRef]
  34. Sohankar, A.; Davidson, L.; Norberg, C. Numerical simulation of unsteady flow around a square two-dimensional cylinder. In Proceedings of the Twelfth Australian Fluid Mechanics Conference, Sydney, Australia, 10–15 December 1995; pp. 517–520. [Google Scholar]
  35. Okajima, A. Strouhal numbers of rectangular cylinders. J. Fluid Mech Digit. Arch. 2006, 123, 379–398. [Google Scholar] [CrossRef] [Green Version]
  36. Norberg, C. Flow around rectangular cylinders: Pressure forces and wake frequencies. J. Wind Eng. Ind. Aerodyn. 1993, 49, 187–196. [Google Scholar] [CrossRef]
  37. Abograis, A.S.; Alshayji, A.E. Reduction of fluid forces on a square cylinder in a laminar flow using passive control methods. In Proceedings of the COMSOL Conference, Boston, MA, USA, 9–11 October 2013. [Google Scholar]
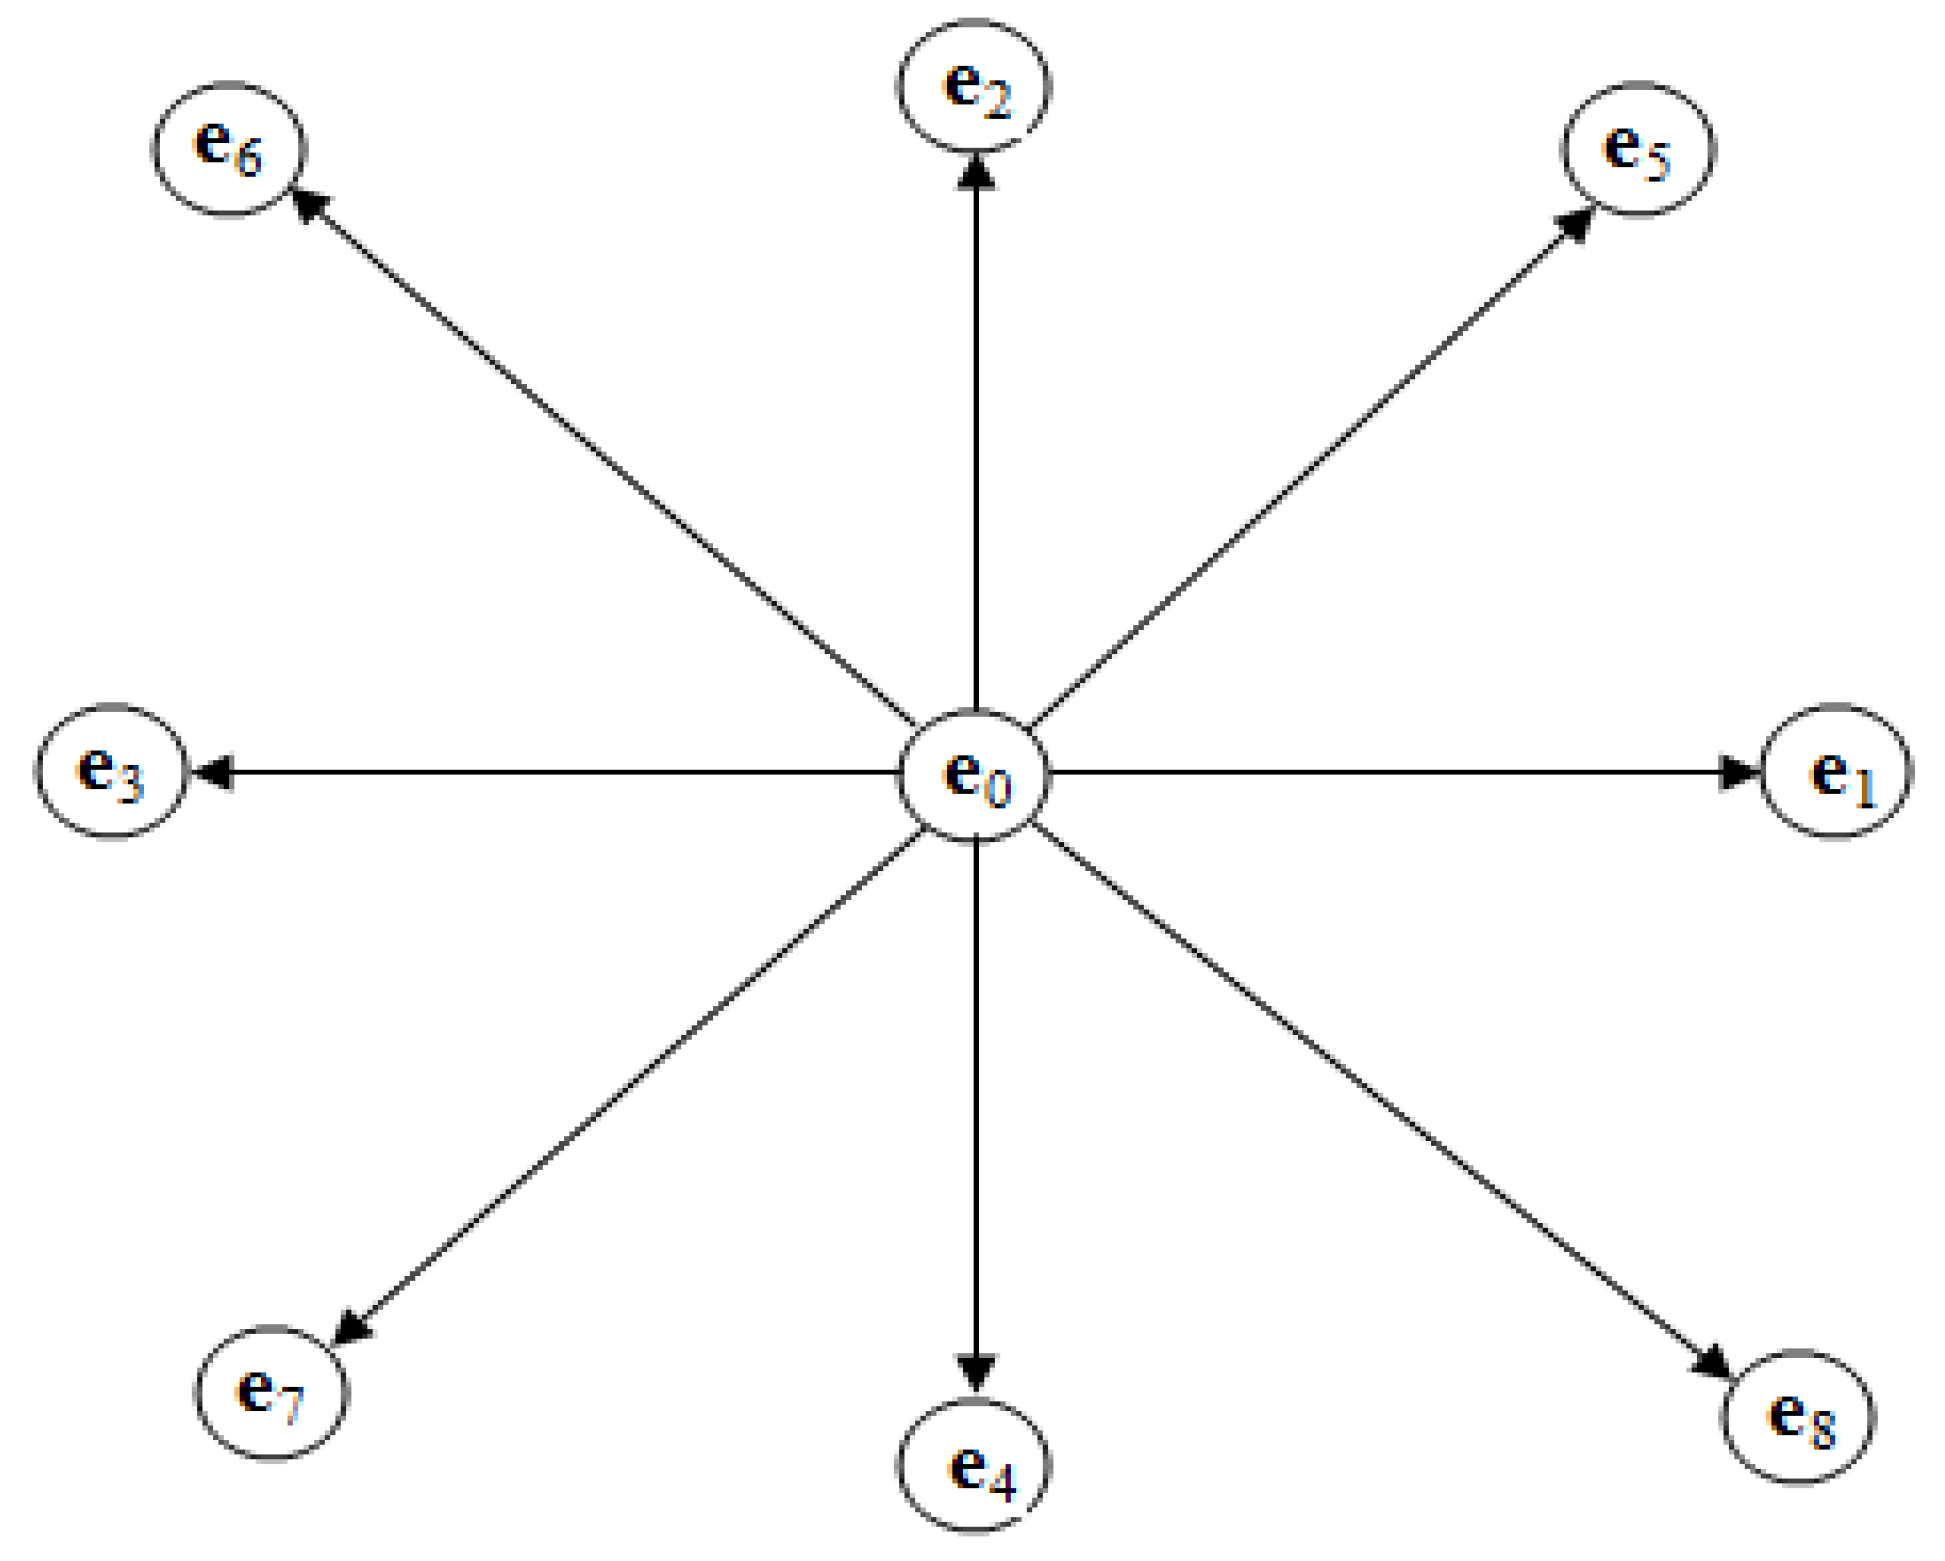
Figure 1. The D2Q9 lattice structure.
Symmetry 12 00159 g001
Figure 2. Schematic diagram for flow over a square rod with detached upstream/downstream control rods at fixed Re = 160.
Symmetry 12 00159 g002
Figure 3. Comparison of different uniform inflow velocities at (a) U = 0.03456217, (b) 0.0438596, and (c) 0.05383556.
Symmetry 12 00159 g003aSymmetry 12 00159 g003b
Figure 4. (ae) Vorticity contour visualization of the shear layer reattachment (SLR) flow mode. (fk) Time trace analysis of drag and lift coefficients for the SLR flow mode. (ln) Energy spectrum analyses of lift coefficients for the SLR flow mode.
Symmetry 12 00159 g004aSymmetry 12 00159 g004bSymmetry 12 00159 g004cSymmetry 12 00159 g004d
Figure 5. (ac) Vorticity contour visualization of the steady flow mode.
Symmetry 12 00159 g005aSymmetry 12 00159 g005b
Figure 6. (ac) Vorticity contour visualization of the SDVS flow mode. (di) Time trace analysis of drag and lift coefficients for the SDVS flow mode. (jl) Energy spectrum analyses of lift coefficients for the SDVS flow mode.
Symmetry 12 00159 g006aSymmetry 12 00159 g006bSymmetry 12 00159 g006c
Figure 7. (ae) The effect of the spacing ratio (g1 = 1–5, g2 = 0–5) of the upstream and downstream control rods to the main rod at a fixed Re = 160 in terms of statistics force and percentage reduction in Cdmean.
Symmetry 12 00159 g007
Table 1. Physical parameters for different computational domains at g1 = 1, g2 = 2, and Re = 160.
CasesCdmeanClrmsSt
(I)Lu = 7.0 d; Ld = 33.0 d; H = 8.0 d−0.4250.10990.102
(II)Lu = 8.0 d; Ld = 33.0 d; H = 8.0 d−0.4260.10950.096
(III)Lu = 9.0 d; Ld = 33.0 d; H = 11.0 d−0.4270.10910.096
(IV)Lu = 8.0 d; Ld = 30.0 d; H = 8.0 d−0.4260.10970.099
(V)Lu = 8.0 d; Ld = 35.0 d; H = 8.0 d−0.4260.10960.102
(VI)Lu = 8.0 d; Ld = 33.0 d; H = 7.0 d−0.4220.06090.099
(VII)Lu = 8.0 d; Ld = 33.0 d; H = 9.0 d−0.4920.36230.108
Table 2. Grid independence study for flow over a square rod.
CasesCdmeanCdrmsClrmsSt
d = 10.01.59320.02850.36880.3197
d = 20.01.52720.02290.31520.1712
d = 30.01.54580.04280.30330.2106
d = 40.01.55280.59210.31040.2193
Table 3. Comparison of Cdmean, St, Cdrms, and Clrms for flow past a single square cylinder at Re = 200.
Re = 200CdmeanSt
Saha et al. [33]1.6700.163
Sohankar et al. [34]1.4240.165
Okajima [35]1.4800.138
Norberg [36]1.4500.152
Abograis and Alshayji [37]1.4880.153
Present1.5190.155
Re = 200CdrmsClrms
Sohankar et al. [34]0.0120.012
Abograis and Alshayji [37]0.0270.027
Present0.0380.038
Table 4. Existing flow modes at g1 = 1–5 and g2 = 0–5 at Re = 160.
Flow Modes(g1, g2)
Shear Layer Reattachment(1, 0.5), (1, 1), (1, 1.5), (1, 2), (2, 0), (2, 0.5), (2, 1), (2, 1.5), (2, 2), (2, 3), (2, 4), (2, 5), (3, 0), (3, 1.5), (3, 2), (3, 3), (3, 4), (3, 5), (4, 1.5), (4, 2), (4, 3), (4, 4), (4, 5), (5, 1.5), (5, 2), (5, 3), (5, 4), (5, 5)
Steady(3, 0.5), (3, 1), (4, 0), (4, 0.5), (4, 1), (5, 0), (5, 0.5), (5, 1)
Semi-Developed Vortex Shedding(1, 3), (1, 4), (1, 5)
Table 5. Percentage reduction in Cdmean at g1 = 1–5 and g2 = 0–5 for Re = 160.
% Reduction Cdmeang2 = 0.5g2 = 1g2 = 1.5g2 = 2g2 = 3g2 = 4g2 = 5
g1 = 1135.21132.11135.06134.58139.72139.22139.22
g1 = 2137.11136.94137.58139.09139.37139.03138.85
g1 = 3137.31137.45137.64137.82138.08137.88137.65
g1 = 4136.52136.57136.58135.91136.39136.62136.63
g1 = 5134.30134.36133.87132.79134.21134.60134.53