1. Introduction
Since its appearance, the Internet has become increasingly influential by facilitating the connection of people all over the world. In particular, the introduction of the World Wide Web (www) has allowed people to easily discover information about any topic by simply searching and clicking. Symmetry’s expertise in connecting engineers to the technology allows consumers to save time and money by getting their design products of complex interactions among various stimuli and perceptions. The Internet revolution has led to the advancement of online business all over the world [
1]. Users rely on websites to serve their practical demands, such as finding entertainment, enjoying social media, making or chatting with friends, watching movies, doing business, receiving news updates, reading articles, checking on product stock in stores, and so on.
Nevertheless, nothing in this world is free, including the Internet. Users generally pay monthly fees for Internet access through their smartphones or computers. Many highly popular websites are free to users but include many advertisements. By profiting from advertisers who purchase ad space on these websites, website creators are able to maintain the quality of their websites while keeping them up to date. The development of computer technology has accelerated economic development while creating new opportunities and sectors of activity amidst an increasingly competitive environment and easily accessible information could greatly affect the online consumption decision [
2,
3].
Im2market [
4] explained that advertisers focus on providing information that generates or encourages customers’ enjoyment. Advertising media can be a tool that promotes a company’s product to customers and target groups, and its success is dependent on the chosen media type.
The Digital Advertising Association in Thailand (DAAT) [
5] has shown that Facebook (
www.facebook.com) has continued to be a predominant platform preferred by companies for advertising and communicating their brand to customers. Advertising on Facebook was valued at 4084 million baht (Thai monetary unit) or one third of digital media advertising revenue in 2017. YouTube (
www.youtube.com) was in second place in advertising revenue, which amounted to 2105 million baht, and the third highest was attributed to the display of advertising banners or website banners, with a value of 1340 million baht.
YouTube is a website for watching videos that users can easily upload and share with people around the world. The website is a collection of countless video types of different topics and various content. Globally, more than 1000 million people per day watch videos on YouTube, with hundreds of millions of hours watched per day [
6].
Marketers insert advertising into regular media in an attempt to deploy attention-grabbing facts about their goods or services. Consequently, customers are increasingly shunning such advertising. Customers can avoid advertisements on television using a range of actions, such as changing channels or muting the TV when advertising appears. Internet users tend to avoid advertisements in online media as well; for example, users can close banners and pop-up ads that appear on websites by clicking the window cross-box.
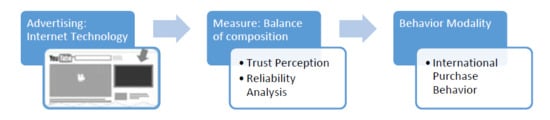
In this study, we concentrate on the behavioral trends of Thai individuals to investigate the effects of YouTube advertising, with a particular focus on the “uses and gratifications” approach and the demographic characteristics of Thai people. We used these methods to determine whether the behavioral trend of Thai Internet users is toward avoiding or confronting YouTube advertisements.
2. Literature Review
2.1. YouTube Website
Sanook [
7] suggested that YouTube could serve as an effective video-sharing website on which users upload videos, view existing videos, and share videos. These videos are available free of charge to anybody on the YouTube website, although much of the content includes advertising. The types of video content include short film clips, TV shows, music videos, video blogs, and so on. Videos on YouTube are mostly short clips with a duration that ranges from about one minute to more than one hour, and they are recorded by the people in the general public or content creators. The videos are sorted by the website under categories such as recent videos, most viewed videos, most liked videos, and so on. YouTube is available on various platforms: such as a website on PCs or as an application on smartphones, smart TVs, and tablets. In this study, we focus on the PC platform because YouTube started as a website that is accessible through browsers, such as Google Chrome, Internet Explorer, Opera, Safari, and so on.
2.2. Types of Advertising on the Desktop Version of YouTube
Nuttaputch [
8] explained that the desktop version of YouTube has six types of advertisements.
(1) Mastheads (
Scheme 1) are oversized banners that appear at the top of YouTube’s homepage. The standard banner size is 970 × 250 pixels or 970 × 500 pixels as an expandable size. It has multiple formats (schemes or video advertising) and is a fixed banner that is viewed multiple times every day.
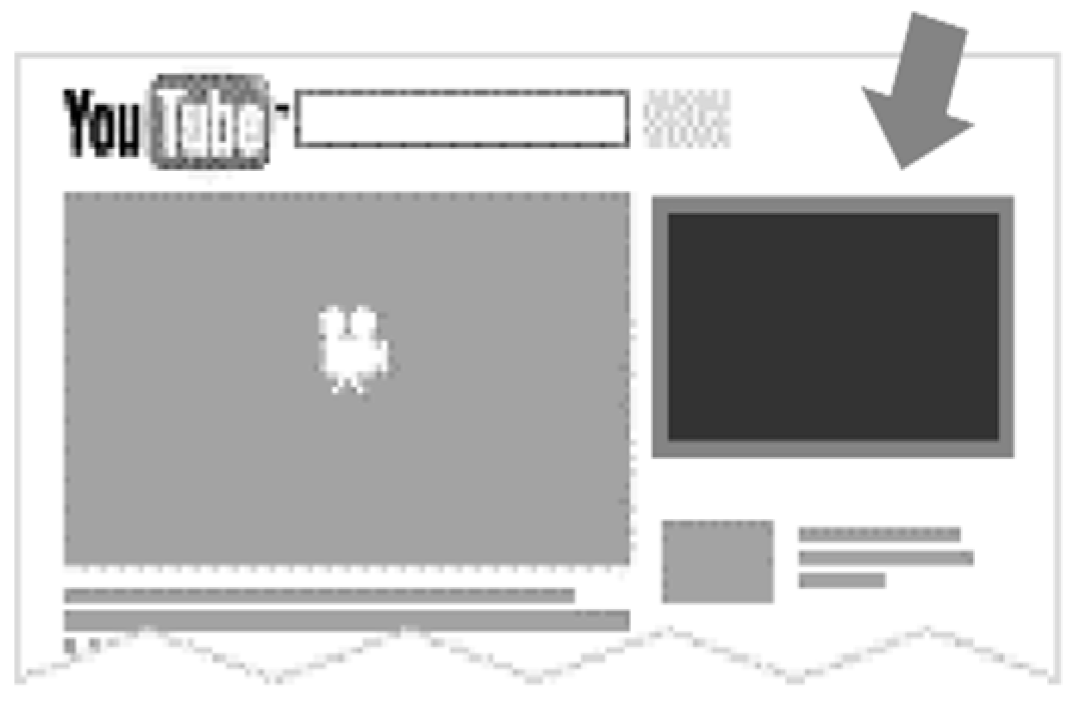
(2) Display ads (
Scheme 2) are banner ads that are displayed as slides or animated gifs. They are typically 300 × 250 pixels and appear on the right side of the playing video.
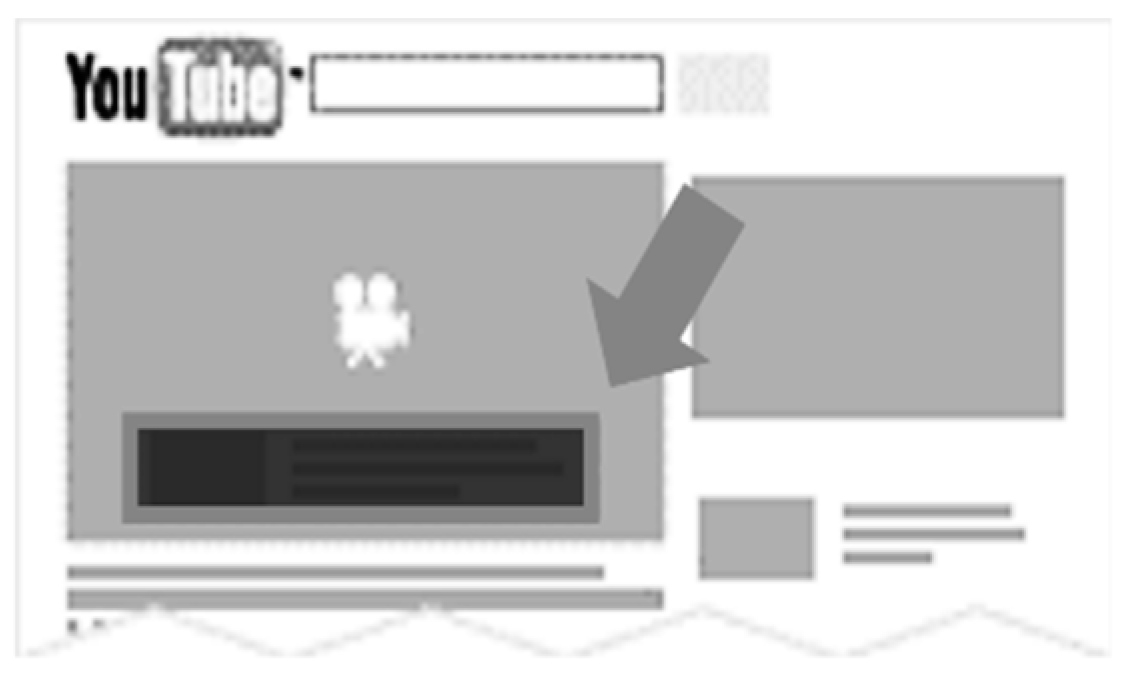
(3) Overlay-in-video ads (
Scheme 3) are banner ads beneath the video content to discourage the audience from hiding it.
The next two types of ads are forms of TrueView advertising. TrueView is advertising for which YouTube can only charge the advertiser who placed the ad once users view the ad. TrueView advertisements can automatically find their target audiences through the system.
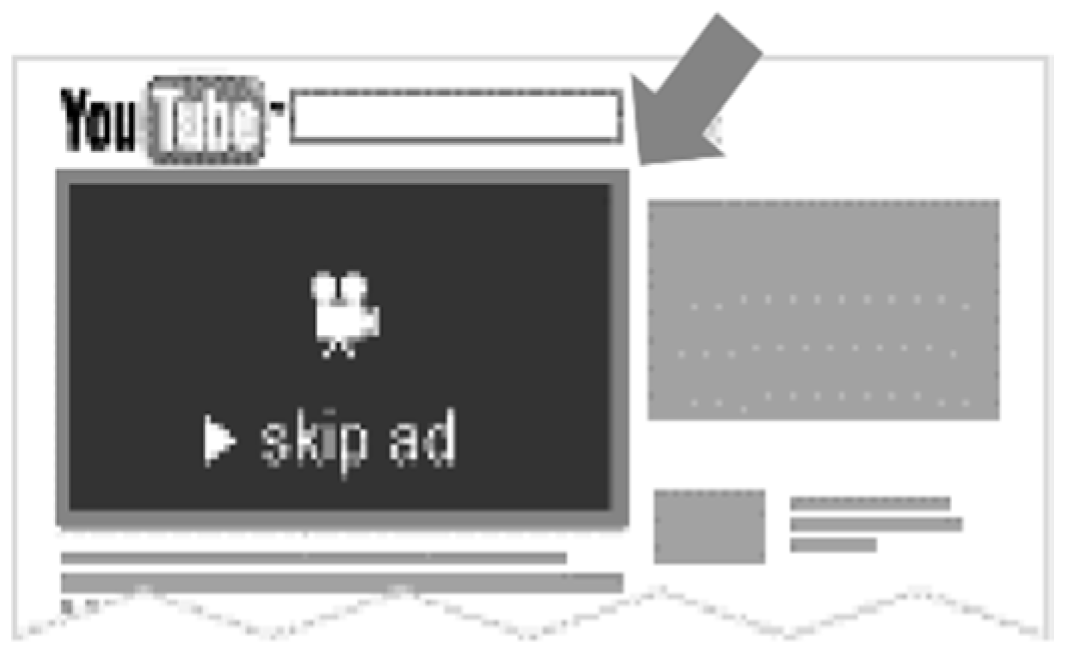
(4) TrueView in-stream ads (
Scheme 4) are video ads that play before the main video that the user intends to watch. The cost of advertising to the ad owner depends on whether the video is watched until the end without the user skipping it. However, users who want to skip it can only do so five seconds after the advertisement appears.
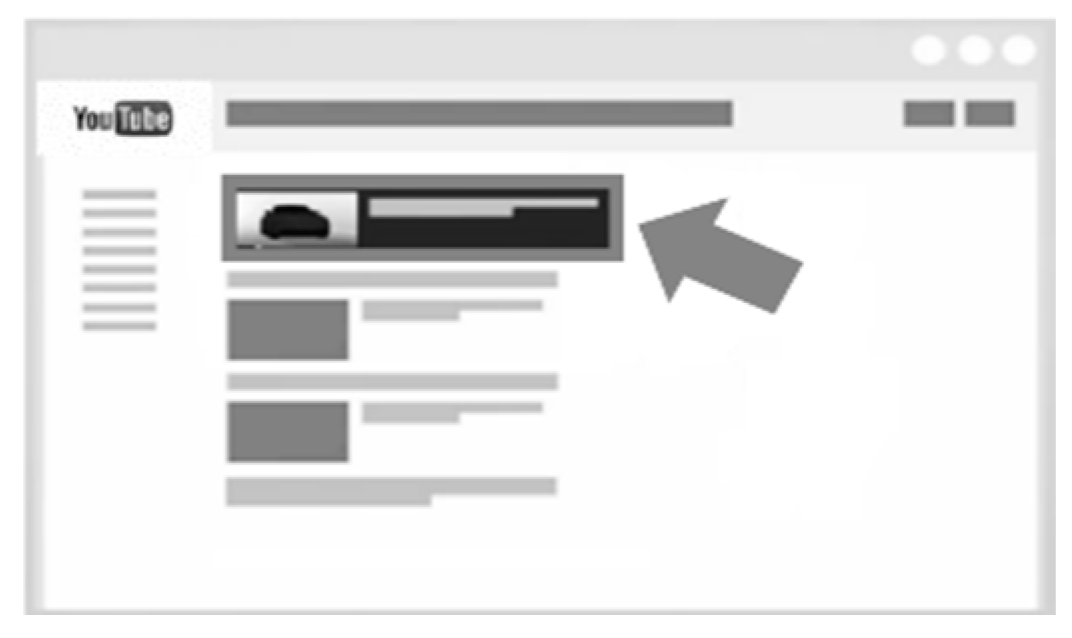
(5) TrueView in-search ads (
Scheme 5) are recommended video clips at the top of YouTube’s search results. The ad owner is charged once a link is clicked to view the ad.
(6) Non-skippable in-stream ads (
Scheme 6) are also called reserve videos. They are mostly video clips similar to TrueView in-stream ads, but this type of ad forces the user to view the video until the end before they can access the main video. The video ad is no longer than 20 s. The ad owner is only charged per 1000 views.
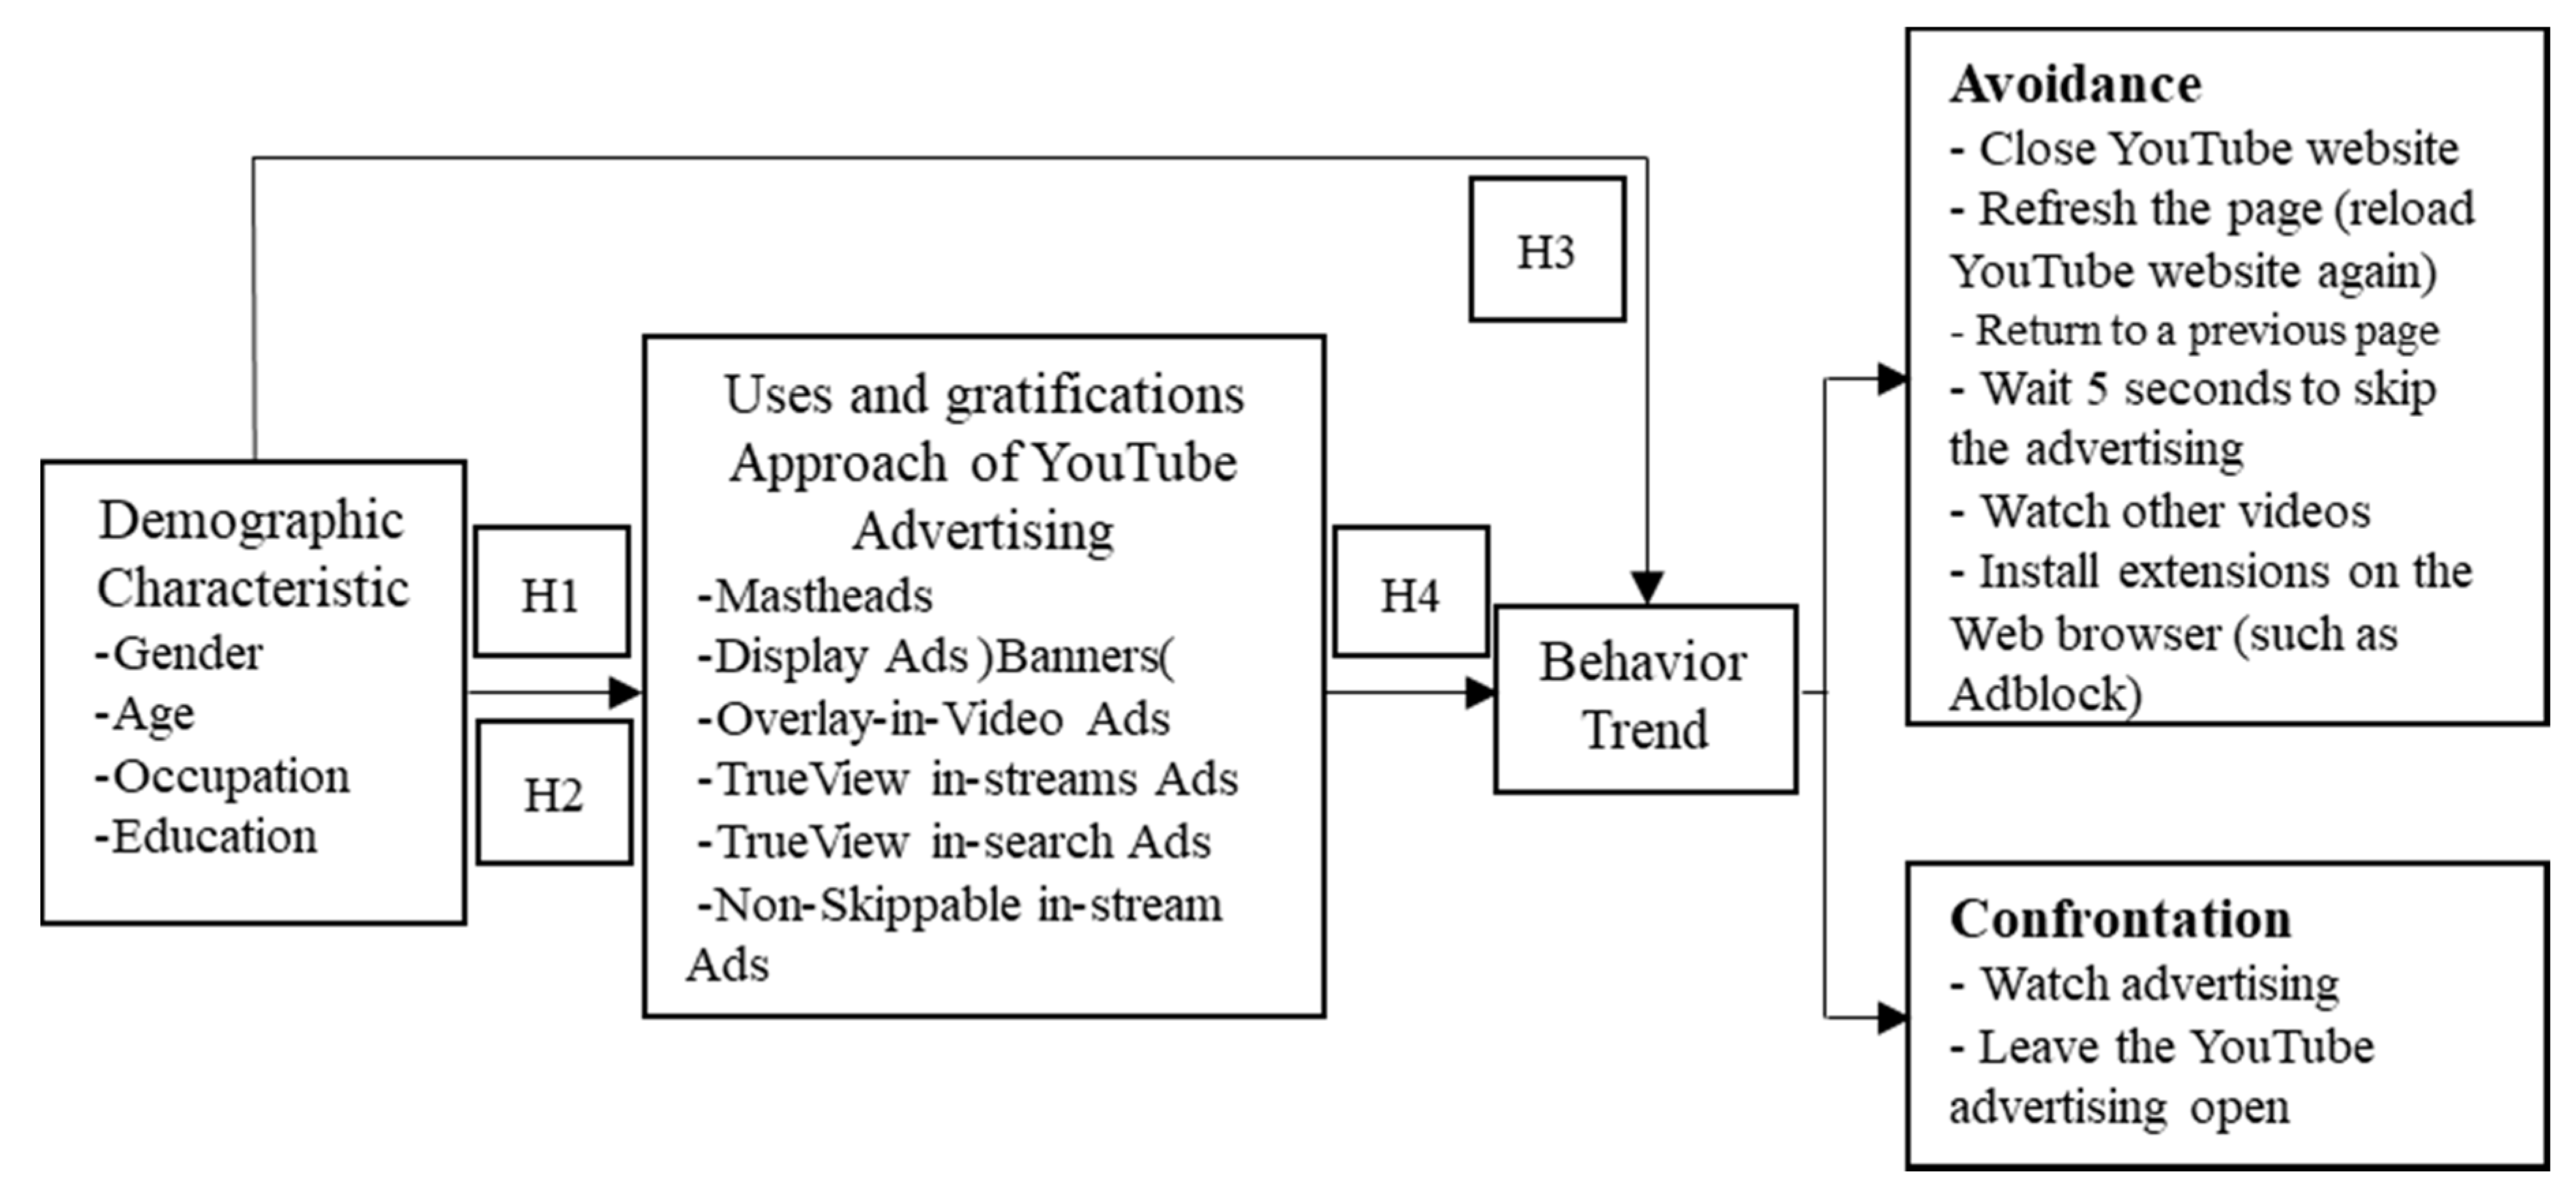
2.3. Demographic Characteristics
Bryant, and Oliver, [
9] indicated that because of the influential role the mass media play in society, understanding the psychosocial mechanisms through which symbolic communication influences human thought, affect, and action is of considerable import. To disseminate information (such as news, advertising, and so on), advertisers apply market segmentation to define their target market using demographic characteristics such as gender, age, occupation, social and economic status, education, and so on.
2.4. Uses and Gratifications Approach
When mass society theory was first proposed, it claimed that humanity is the victim of influential media. Later, the credibility of this theory decreased as a result of social studies and observations that illustrated that advertising media do not have a direct effect on everybody or affect everyone in the same way.
Pira Jirasopon [
10] recommended the “uses and gratifications theory” as a potential social and psychological theory that views human communication activities as being driven by wants and motivations. By this theory, the receiver looks for specific media and content to satisfy their wants and motivations to obtain self-satisfaction.
Dainton and Zelley [
11] asserted that communication constitutes giving and receiving meaning and includes the concept of interaction followed by sharing with others. The media are considered to play a role in the production and dissemination of content that corresponds to the wants of the receiver.
Hence, the uses and gratification approach is based on the view that receivers are enthusiastically active rather than passive in their search for media that is in line with their wants and needs.
2.5. Exit-Voice
As described by Albert O. Hirschman [
12], Exit-Voice Theory pertains to the response of customers to the product or service of a company when they feel dissatisfied with that product or service. For instance, dissatisfaction can arise if a product’s quality deteriorates but still sells at its original price or if the quality of the item does not match what is advertised. Consumers react to this situation in two major ways:
- (1)
The “exit option” is an expression of consumer dissatisfaction with a product or service in the form of behaviors such as no longer purchasing that product or service, changing brands, and so on.
- (2)
Consumers who exercise the “voice option” continue to purchase such products or services and employ other expressions of dissatisfaction that are either direct or indirect. An example is issuing a complaint to the company by writing an e-mail, criticizing the company on social media, and so on.
In cases of the voice option, consumers are likely to spend time or money to express their dissatisfaction to others, such as the time spent writing e-mails to complain to the company. Therefore, the exit option is often a simpler and more convenient expression of dissatisfaction than the voice option.
The theoretical exit-voice concepts are applied to this research to study the behavioral trends of Thai people in response to YouTube advertising. Their possible responses are divided into two types of expression:
- (1)
Avoidance behavior is the use of measures to avoid viewing the ad on the YouTube website. There are many ways in which advertising can be avoided: closing the YouTube website, refreshing the page (reloading the YouTube website), returning to a previous page, waiting for five seconds to skip the advertisement, watching other videos, installing Web browser extensions (such as AdBlock), and so on.
- (2)
Confrontation behavior is viewing the ad on YouTube rather than avoiding it, and the video is allowed to play to completion. Such confrontation actions include watching the advertisement, leaving the YouTube ad open, and so on.
4. Research Methodology and Behavioral Modality Establishment
This research used a quantitative approach through the collection of data from Thai subjects using a questionnaire and sample population are presented on
Table 1.
4.1. Sample Selection
There are roughly 960,906 individuals living in Chiang Mai, Thailand [
13]. Therefore, we determined the sample size for a precision level defined by a 95% confidence level and a degree of accuracy of 0.05. Thus [
14],
where
X2 is the Chi-Square value for df (degrees of freedom) = 1 for the desired confidence level of 95%, i.e.,
X2 = 3.84; N is the population size; P is the population proportion (defined as 0.50); and d is the degree of accuracy (expressed as a proportion), these are shown on
Table 1.
According to the above formula and the desired confidence level and accuracy, the sample Thai population size for this study was 384 Thai subjects. For easier analysis, we added 16 more subjects. Therefore, there were 400 subjects in the sample.
4.2. Random Sampling
We used probability sampling by multi-stage sampling. The steps were:
Step 1: From Thai sample (400 subjects, these data are presented as
Table 2), we conducted non-probability sampling by using quota sampling with respect to the age of Thai subjects.
Step 2: We used non-probability sampling, accident sampling, snowball sampling, and convenience sampling to distribute the questionnaire until the number of completed questionnaires was that of the calculated sample size.
4.3. The Study Instrument
The questionnaire was written in two languages, English and Thai, and consisted of three parts.
Part 1: Information about the demographic characteristics of the study subjects. The requested information included gender, age, education, and occupation. There were four questions in this part.
Part 2: Information about Thai subjects’ application of the uses and gratification approach to YouTube advertising. This part of the questionnaire consisted of closed-ended questions so that subjects could choose a certain answer from six scaled-response questions, which asked about satisfaction with six types of YouTube advertising: mastheads, display ads (banners), overlay-in-video ads, TrueView in-stream ads, TrueView in-search ads, and non-skippable in-stream ads.
Table 3 shows the five possible responses on the importance scale.
Part 3: Behavioral trend of Thai subjects in response to YouTube advertising. This part of the questionnaire had one closed-ended question, with more than one possible answer (i.e., checklist question), as well as one open-ended question, the answer to which respondents could write whatever they chose. Importance scale are presented here as
Table 3.
4.4. Data Analysis and Statistics for Analyzing Data
Data analysis for analyzing data and classification of satisfaction are presented here as
Table 4 and
Table 5. We used the standardized satisfaction of subjects by following the formula below [
15]:
4.5. Perception-Based Behavior toward Purchasing: Reliability Analysis
This study analyzed the purchaser’s perception-based behavior and the reliability of purchasing perception for relevant purchases in the future. Reliability is defined as the probability that an element (that is, a component, subsystem, or full system) will accomplish its assigned task within a specified time, which is designated by the interval t = [0, tM] [
16]. Reliability is closely related to the following four factors: (1) probability value; (2) predetermined function; (3) predetermined life; and (4) prescribed environment. The probability function of reliability allocation is defined in the next subsection.
4.6. Exponential Distribution
Hazard rate:
where
f(x) is the probability density function of exponential distribution,
where
λ is the failure rate.
The mean time between failures (MTTF) is calculated by the following calculations.
Let
X be a random variable that indicates the expiration time. Then, the probability of the product failing at a specific time
x is
where
F(
x) is the failure distribution function.
If the product still functions as intended at time
x, then
4.7. Weibull Distribution Probability Density Function
The probability density function of a Weibull is
The cumulative distribution function is:
The average time to failure is:
The failure rate function is:
where the conditions are as follows: when
β < 1, the failure rate decreases with time (early stage); when
β = 1, the failure rate is constant (opportunity period); when
β > 1, the failure rate increases with time (loss period).
Reliability defines the reliability of a product or system. This study had two key computations: the internal series calculation and the Internet of Things (IOT) system. The
RA is the A-system reliability,
RB is the B-system reliability,
RC is the C-system reliability, and
RD is the D-system reliability.
In the internal parallel calculation, the internal components of the system are connected in series, and the Internet of Things (IoT) system is also connected in series. The parallel equation is as follows:
The above scenario and calculations were applied in this experiment by using 400 subjects from Thailand, as shown in
Table 6.
From the Thai sample population (400 subjects), we conducted non-probability sampling by using quota sampling with respect to the age of Thai subjects.
The purpose of this study was to determine the reliability of using perception-based behavior to predict an individual’s final decision on their willingness to purchase the product. The results are shown in
Table 7. The reliability of the predicted purchasing behavior (i.e., whether the individual will purchase) was low when it was based on a single use of YouTube. With multiple uses of YouTube, the predicted purchasing behavior was highly reliable. Overall, the reliability of determining purchasing behavior on the basis of YouTube use was greater than 90%.
6. Hypothesis Testing
6.1. Hypothesis 1: Thai Subjects Have Low Satisfaction with YouTube Advertising
Table 9 reports the satisfaction of the subjects with the six types of YouTube advertising. The results reveal that Thai subjects had a moderate satisfaction with mastheads, display ads (banners), and TrueView in-search ads. Overlay-in-video ads and TrueView in-stream ads were scored as low satisfaction, and Thai subjects had very low satisfaction with non-skippable in-stream ads.
We next used the ranges of average points to classify satisfaction, as specified in
Table 5. The results reveal that Thai subjects have low satisfaction with YouTube advertising, with a mean score of 2.54.
6.2. Hypothesis 2: Male Subjects Have Lower Satisfaction with YouTube Advertising than Female Subjects
Table 10 compares the mean scores given by male and female subjects. These results demonstrate that the difference in satisfaction with YouTube advertising between genders was not significant at the 0.05 level, which means that males and females had the same opinion toward YouTube advertising.
The mean satisfaction score given by male subjects was 2.48, which was lower than that given by female subjects, whose mean was 2.60. In other words, male samples have lower satisfaction with YouTube advertising than female samples.
6.3. Hypothesis 3: The Behavioral Trend of Thai Subjects in Response to YouTube Advertising Is that of Avoidance Rather Than Confrontation
The results show that most Thai subjects engaged in Avoidance behavior toward YouTube advertising. This option was selected 564 times, which was 76.2% of the total. The most common avoidance behavior was waiting for five seconds and then skipping the ad. This behavior was selected 328 times, which is 44.3% of the total.
Confrontation behavior was reported 176 times (23.8% of the total). The most common confrontation behavior was leaving the YouTube advertisement open, which was selected 124 times, which was 16.8% of the total.
This implies that the behavioral trend of Thai subjects was more avoidance than confrontation in response to YouTube advertising. These data are presented here as
Table 11.
6.4. Hypothesis 4: YouTube Advertising Has a Significant Effect on Behavioral Trends
Table 12 provides the regression results with avoidance as the dependent variable. The result indicates that variation in masthead ads and display ads (banner) explained 4.2% of the variation in the avoidance behavior of Thai subjects at a significance level of 0.01 for these two independent variables. Thus, the independent variables that led to the most variation in avoidance behavior were display ads (banner) and mastheads.
This result shows that Thai subjects tended to avoid mastheads and display ads (banners) the most among all types of YouTube advertising. The results for the remaining independent variables imply that Thai subjects were consistent in their accepted level of advertising.
Table 13 reports the regression results with confrontation as the dependent variable. The result indicates that variation in mastheads, TrueView in-search ads, and non-skippable ads explained 5.9% of the variation in the confrontation behavior of Thai subjects at the 0.05 significance level for mastheads and at the 0.01 level for the two other independent variables. Thus, the independent variables that led to the most variation were TrueView in-search ads, non-skippable in-stream ads, and mastheads, from highest to lowest significance.
The result implies that Thai subjects tended to confront mastheads, TrueView in-search ads, and non-skippable in-stream ads. This means that they accepted watching these types of YouTube ads.
Note that mastheads were a special case: Thai subjects tended to both confront and avoid them. However, comparing significance levels revealed that Thai subjects tended to avoid more than confront mastheads since the former behavior was associated with a significance level of 0.01. These data are presented here as
Table 14.
7. Conclusions
The results indicate that Thai subjects using the desktop version of YouTube had low satisfaction with YouTube advertising, and the YouTube advertising type that subjects felt the most displeasure encountering was non-skippable in-stream ads. This was likely because it is the only kind of YouTube advertising on the desktop version of the website that users cannot avoid unless they install specific Web browser adds-on (i.e., extensions, such as AdBlock). Further, male subjects had lower satisfaction with YouTube advertising than female subjects. Demographic characteristic theories [
6] argue that individuals with different demographic characteristics (such as gender, age, occupation, education, and so on) behave differently.
Avoidance or confrontation? In fact, the presented results indicated that subjects were more likely to avoid YouTube advertising than confront it. The most common way to avoid ads was waiting for five seconds and then skipping the ad, which is applicable to TrueView in-stream ads (video ads that play before the main video that the user intends to watch). Research on why people avoid advertising on the Internet has been conducted, and it was suggested in Reference [
17] that the more that advertising interrupts the Internet user’s activity, the more they avoid the advertising website. Some comments in subjects’ responses to the questionnaire included, “I do not like YouTube advertising that waste[s] my time”, “we can install an extension to block advertising”, “advertising should be suitable with video”, “YouTube advertising should not have non-skip[p]able in-stream ads because I cannot skip”, and so on.
Riedl and Kenning’s study found that perceived trustworthiness of Internet offers is affected by neurobiology [
18]. Organizational trust can be divided into intra- and inter-organizational trust. Inter-organizational trust refers to the extent to which organizational members have a collectively held trust orientation towards the partner firm [
19]. We have to emphasis on this point in the future study.
What should YouTube do? Understanding how IT impacts consumer behavior can serve as a critical foundation for businesses to identify and develop effective and sustainable marketing communication strategies [
20]. To enhance user satisfaction, YouTube ought to improve its advertising format by providing a choice to users, such as monthly or yearly subscriptions to the website for an ad-free experience, or reducing non-skippable advertising on the website. Future work may need to consider other countries and apply a similar method for comparison with Thailand, as well as study avoidance behavior for other social media platforms, such as Instagram, Line, and Facebook.


