A Hybrid Plithogenic Decision-Making Approach with Quality Function Deployment for Selecting Supply Chain Sustainability Metrics


Abstract
1. Introduction
2. Literature Review
2.1. Supply Chain Sustainability
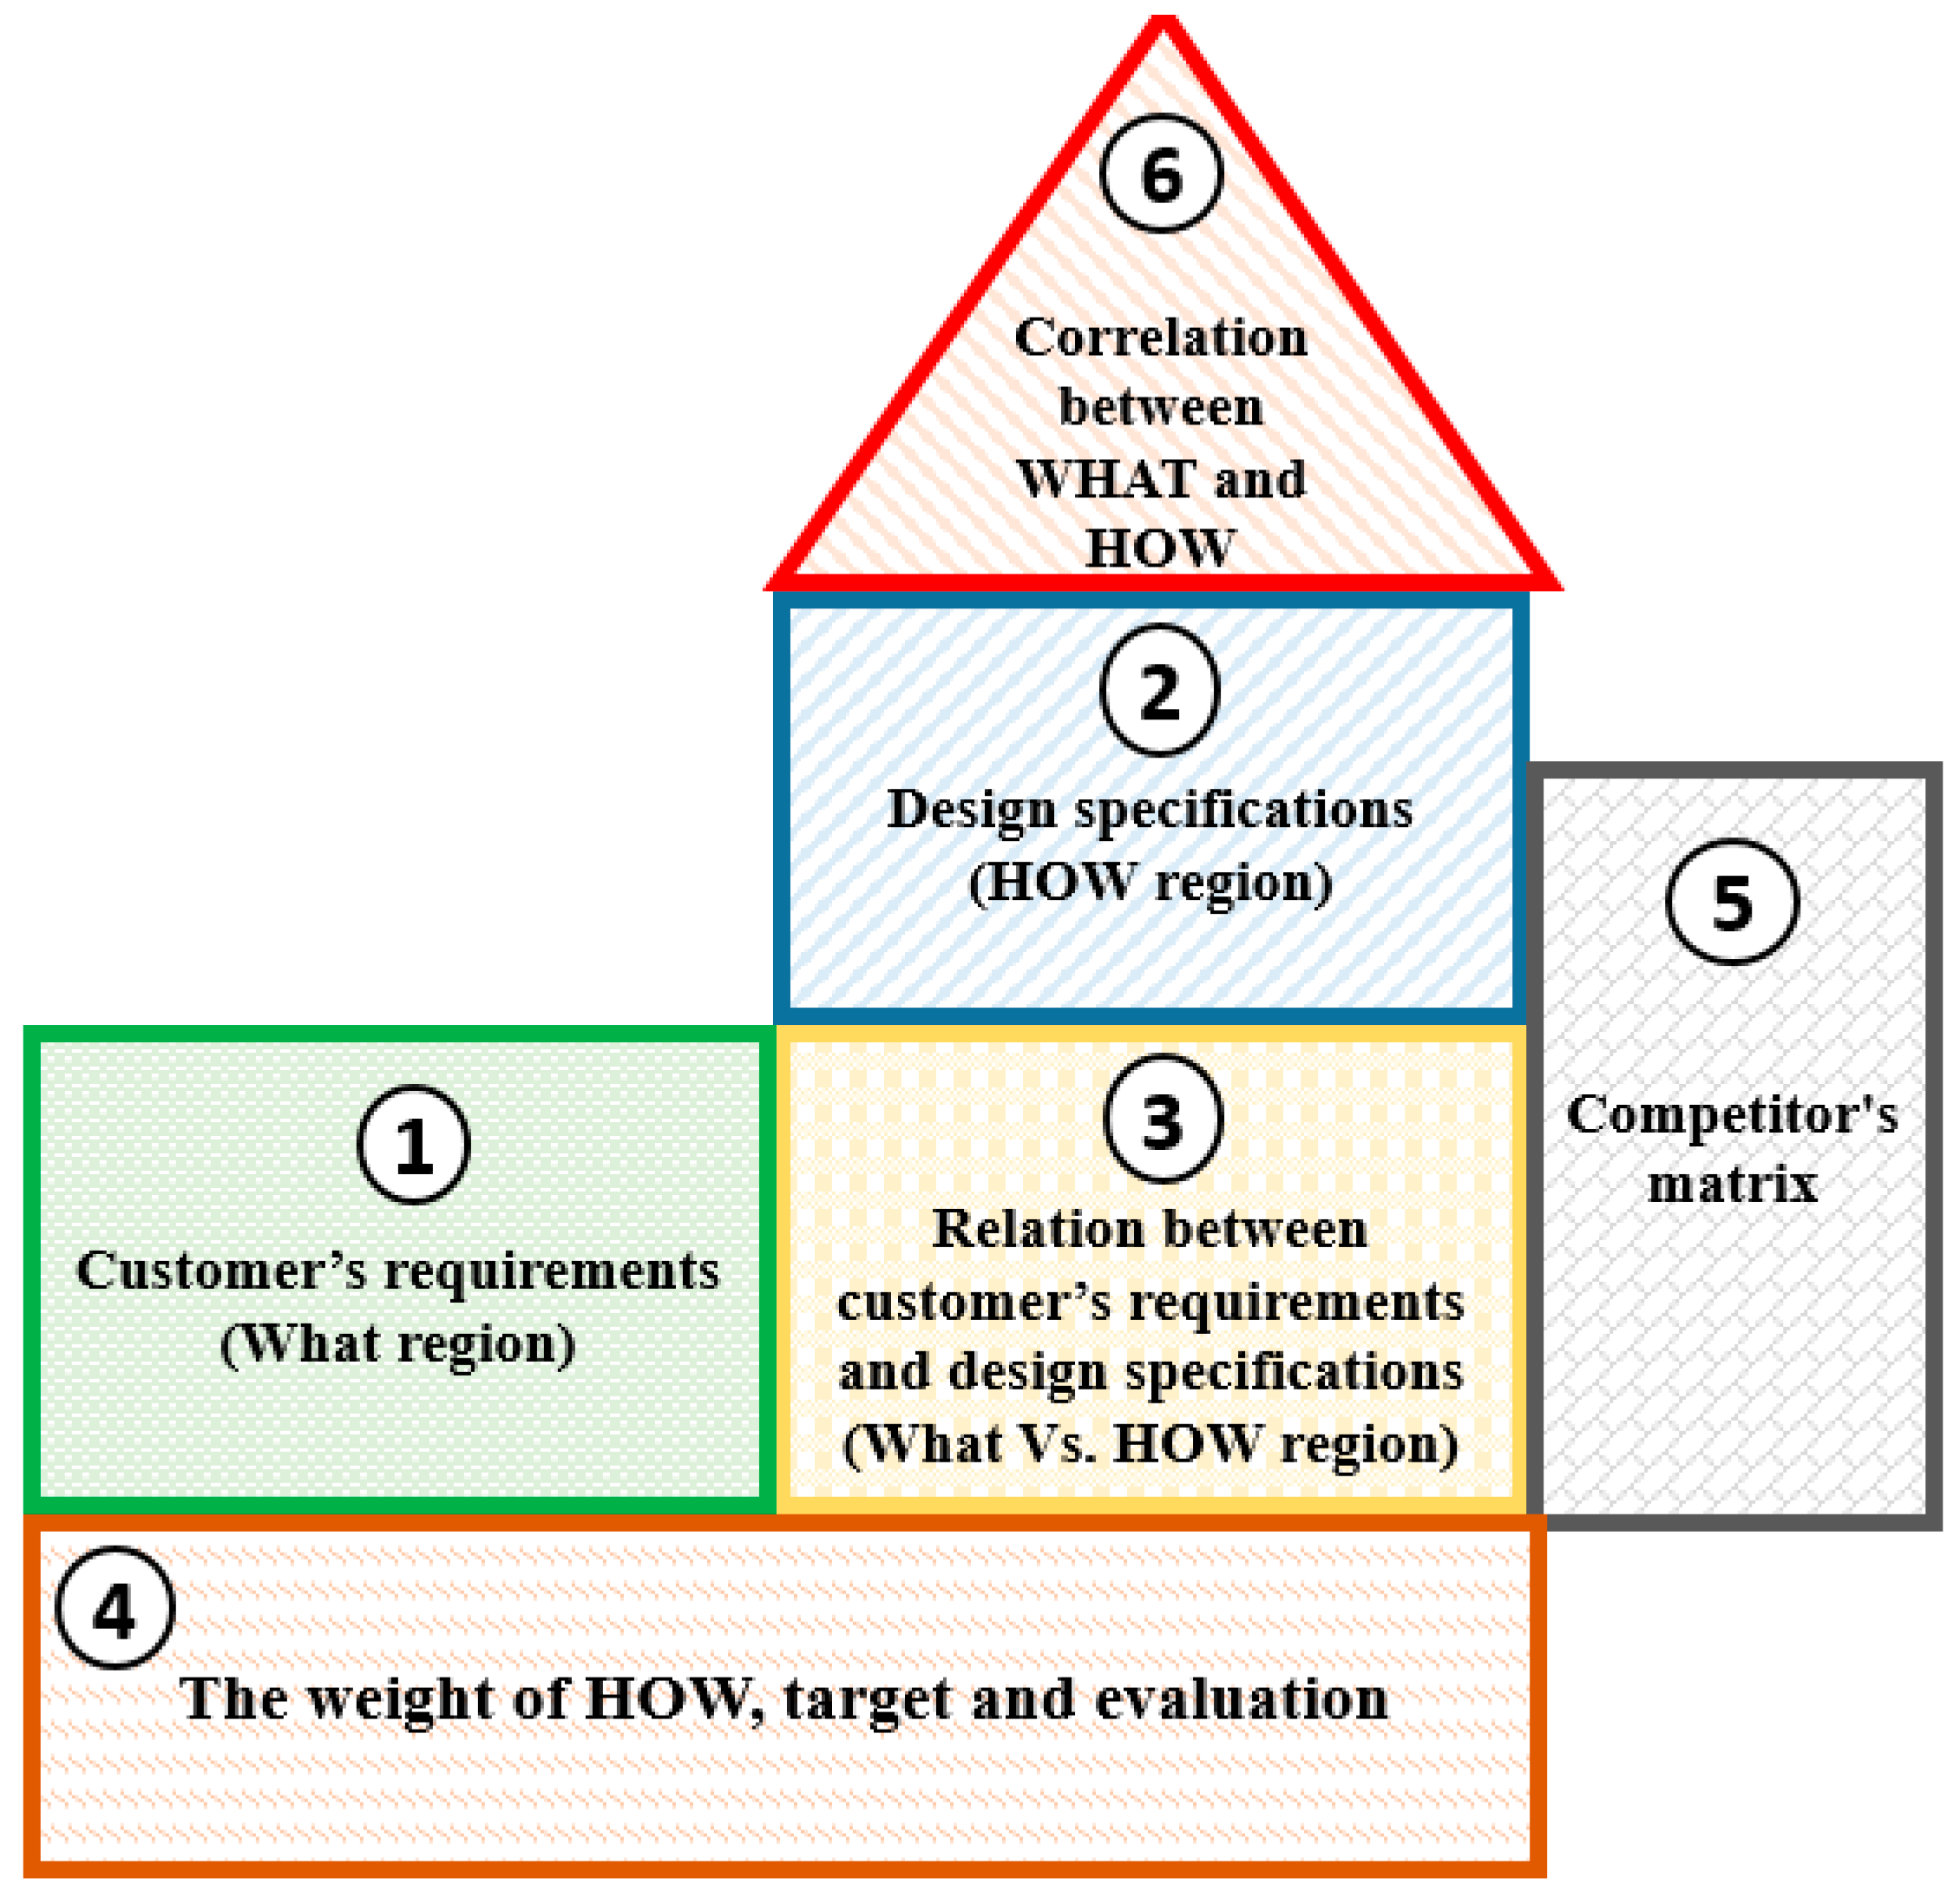
2.2. Quality Function Deployment (QFD)
- Area (1): The customers’ requirements (what region) that consists of two indicators: The customers’ requirements and the importance of each of them .
- Area (2): The quality characteristics or design specifications (how region), composed of two parts: The design specifications and the way of development.
- Area (3): The relationship between customer requirements and design specifications (what versus how region) by score .
- Area (4): This area is a combination of the value of the design specification, the acceptance level of it, and the score
- Area (5): The comparison of the product and competitors, and how much it satisfies customer needs.
- Area (6): The comparison between each design specification, and how much their improvement may affect each other.
2.3. Plithogenic Set Characteristics
2.4. Neutrosophic Set
3. Proposed Model
- ❖
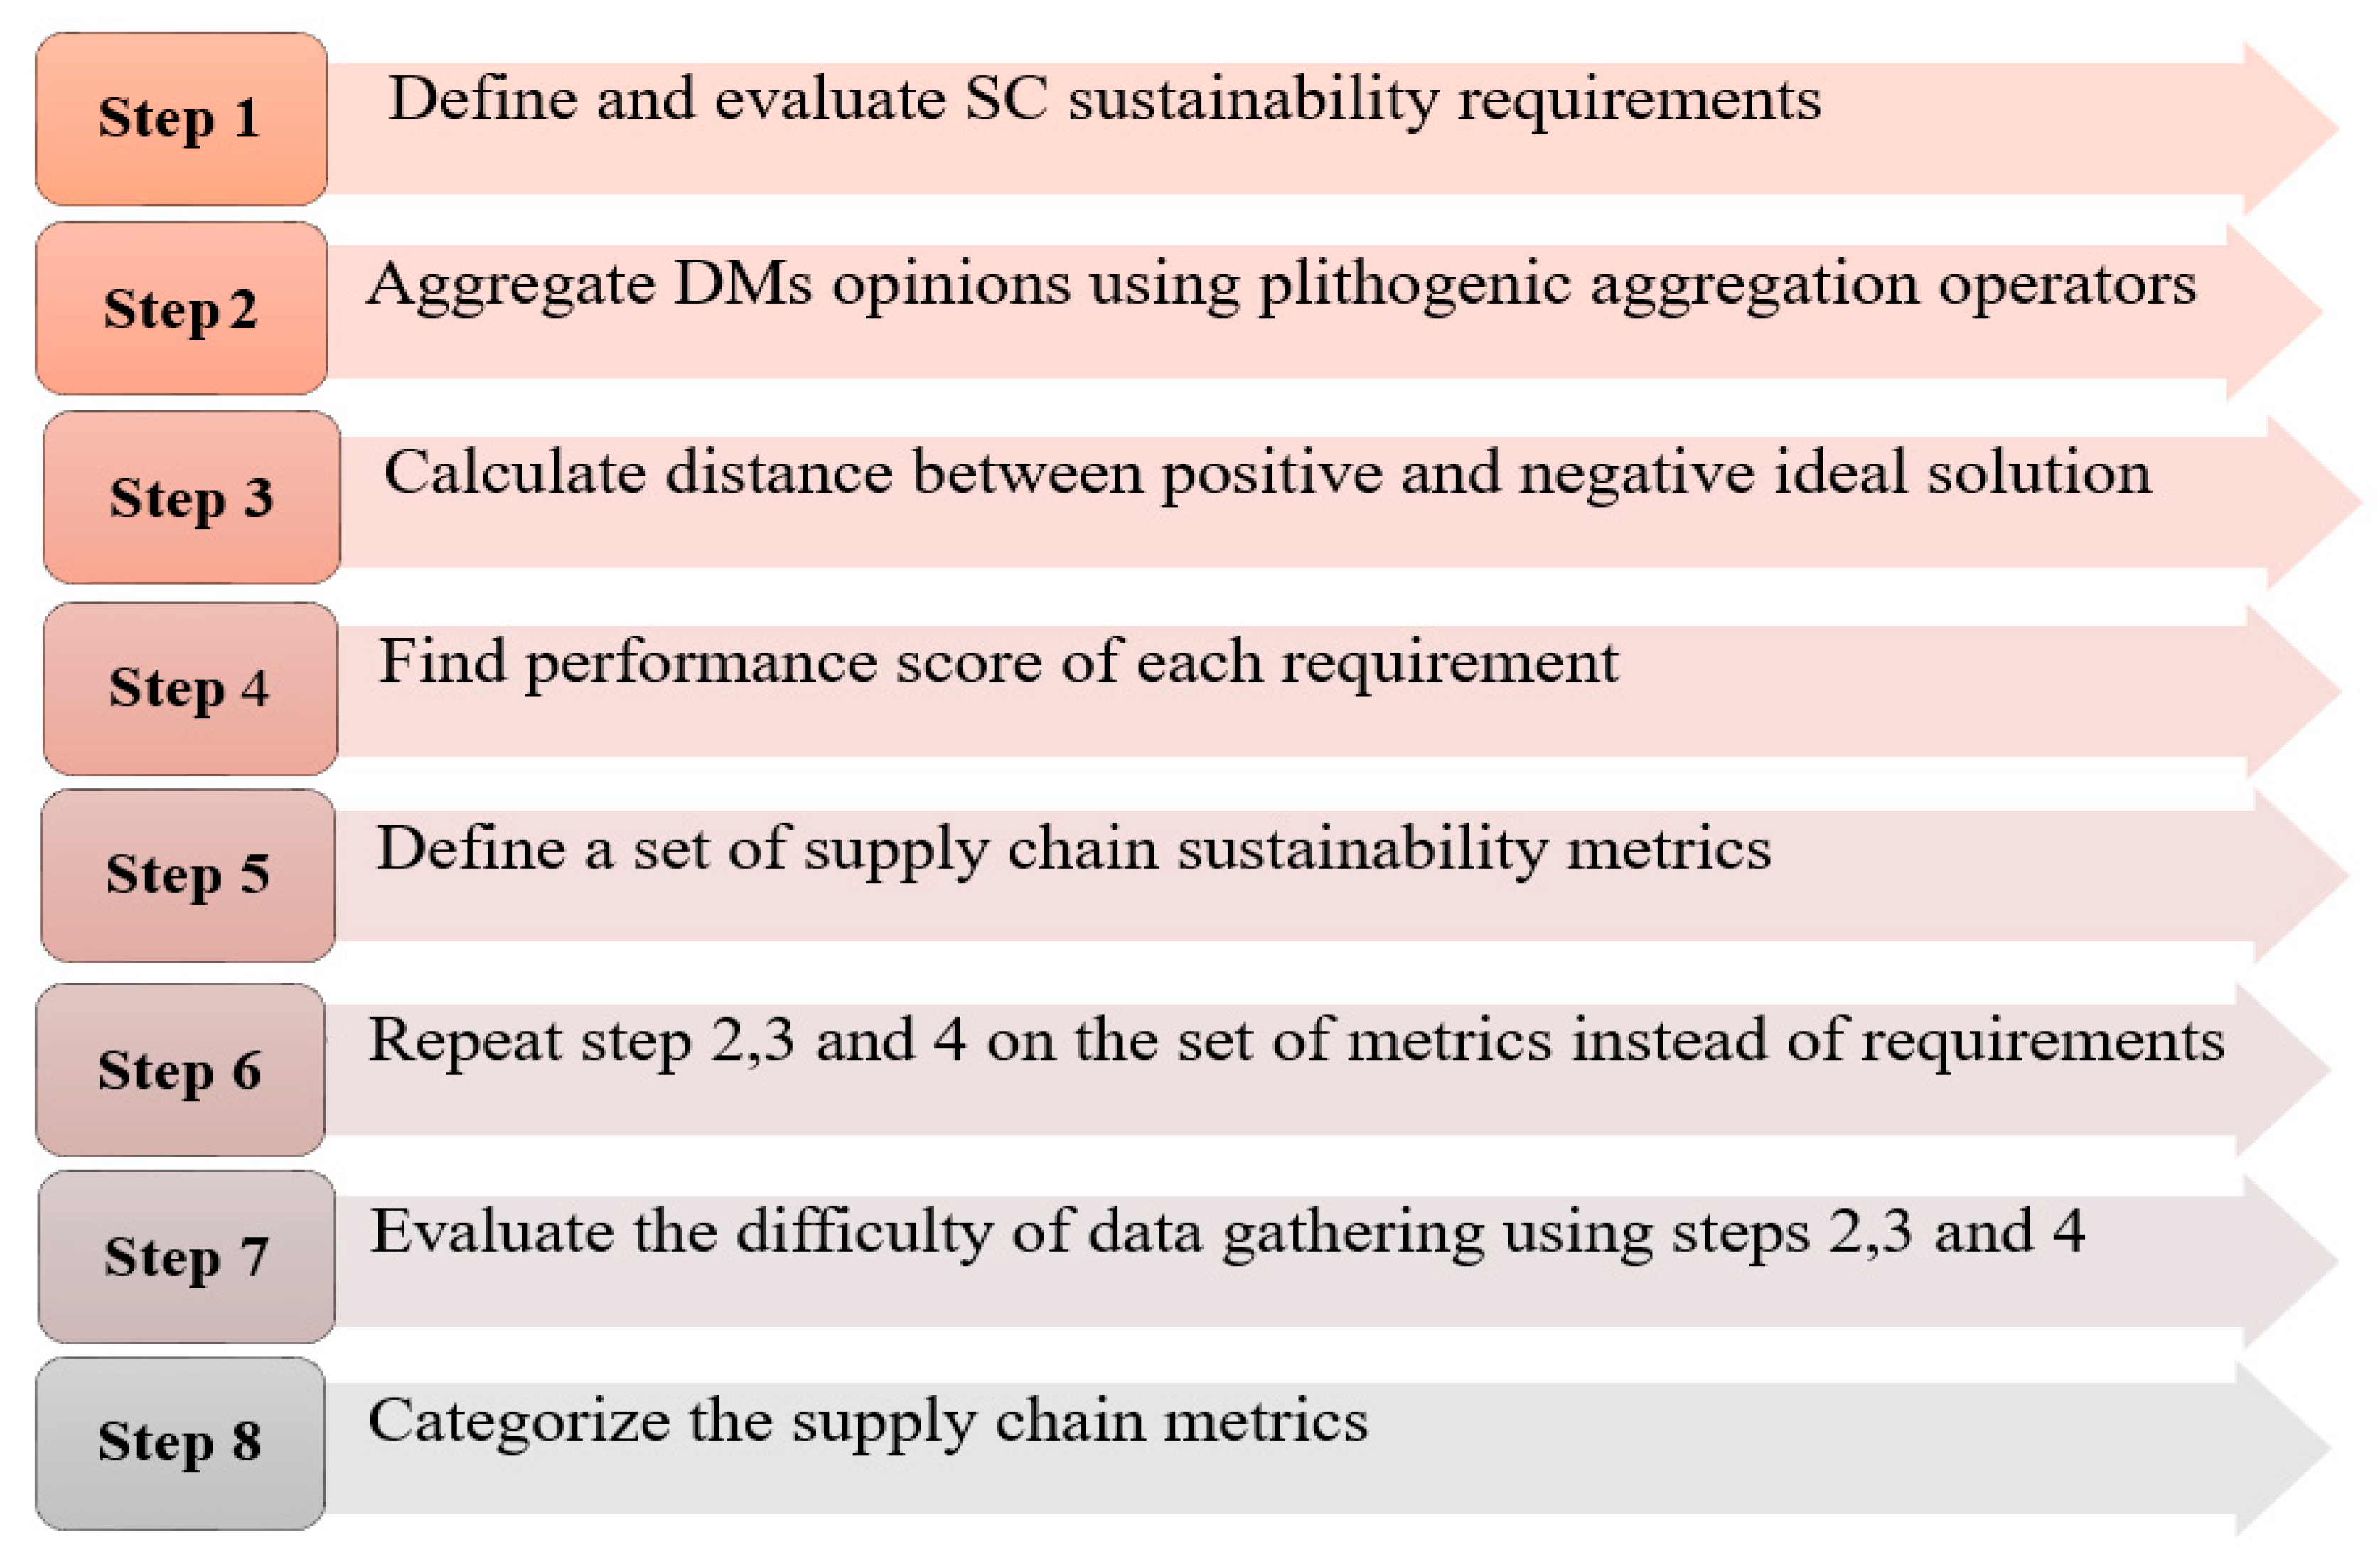
- Step 1: First of all, decision makers (DM) identify a series of requirements to appraise the supply chain sustainability. The most popular requirements of supply chain sustainability evaluation are summarized in Table 2 or the DM can identify other requirements based on their strategy. These requirements must reflect economic, social and environmental features which is called triple bottom line (TPL).
- -
- The decision makers measure the importance of each requirement based on the supply chain strategy using linguistic terms.
- -
- The linguistic scale is defined to describe the assessment of each requirement by the DM. In this model, the scale is suggested as a triangular neutrosophic scale, as shown in Table 3.
- ❖
- Step 2: Using plithogenic aggregation operations, the decision maker’s opinions are aggregated based on the contradiction degree of each requirement. This step increases the accuracy of results.
- -
- Define contradiction degree c of each requirement with respect to the dominant.
- -
- Plithogenic neutrosophic set intersection is defined as following:where and are fuzzy t-norm and t-conorm respectively.
- -
- The neutrosophic number is transformed into a crisp number using the following equation:
- ❖
- Step 3: In order to find the best requirement considering the set of criteria, the distance of each requirement is found from the best and worst solutions.
- -
- The best (positive) ideal solution S+ and worst (negative) ideal solution S− require definition.
- -
- For example, in price requirements, the lowest value is desired (best ideal solution); on the other side, the maximum value is the worst ideal solution. In the opposite of that, in profit requirements, the maximum value is positive and the lowest value is negative.
- -
- The formula of Euclidean distance is used to find the distance of each requirement to the ideal positive and ideal negative solutions, as shown in Equations (8) and (9) [50].
- -
- The superior alternative has the smallest distance from the positive ideal solution S+ and the worst alternative has a larger distance from the negative ideal solution S−.
- ❖
- Step 4: The performance score of each requirement is found in order to weight each of them based on Equation (10).- The performance score is normalized to find the weight of each requirement that satisfies two constraints which are 0 ≤ ≤ 1 and .
- ❖
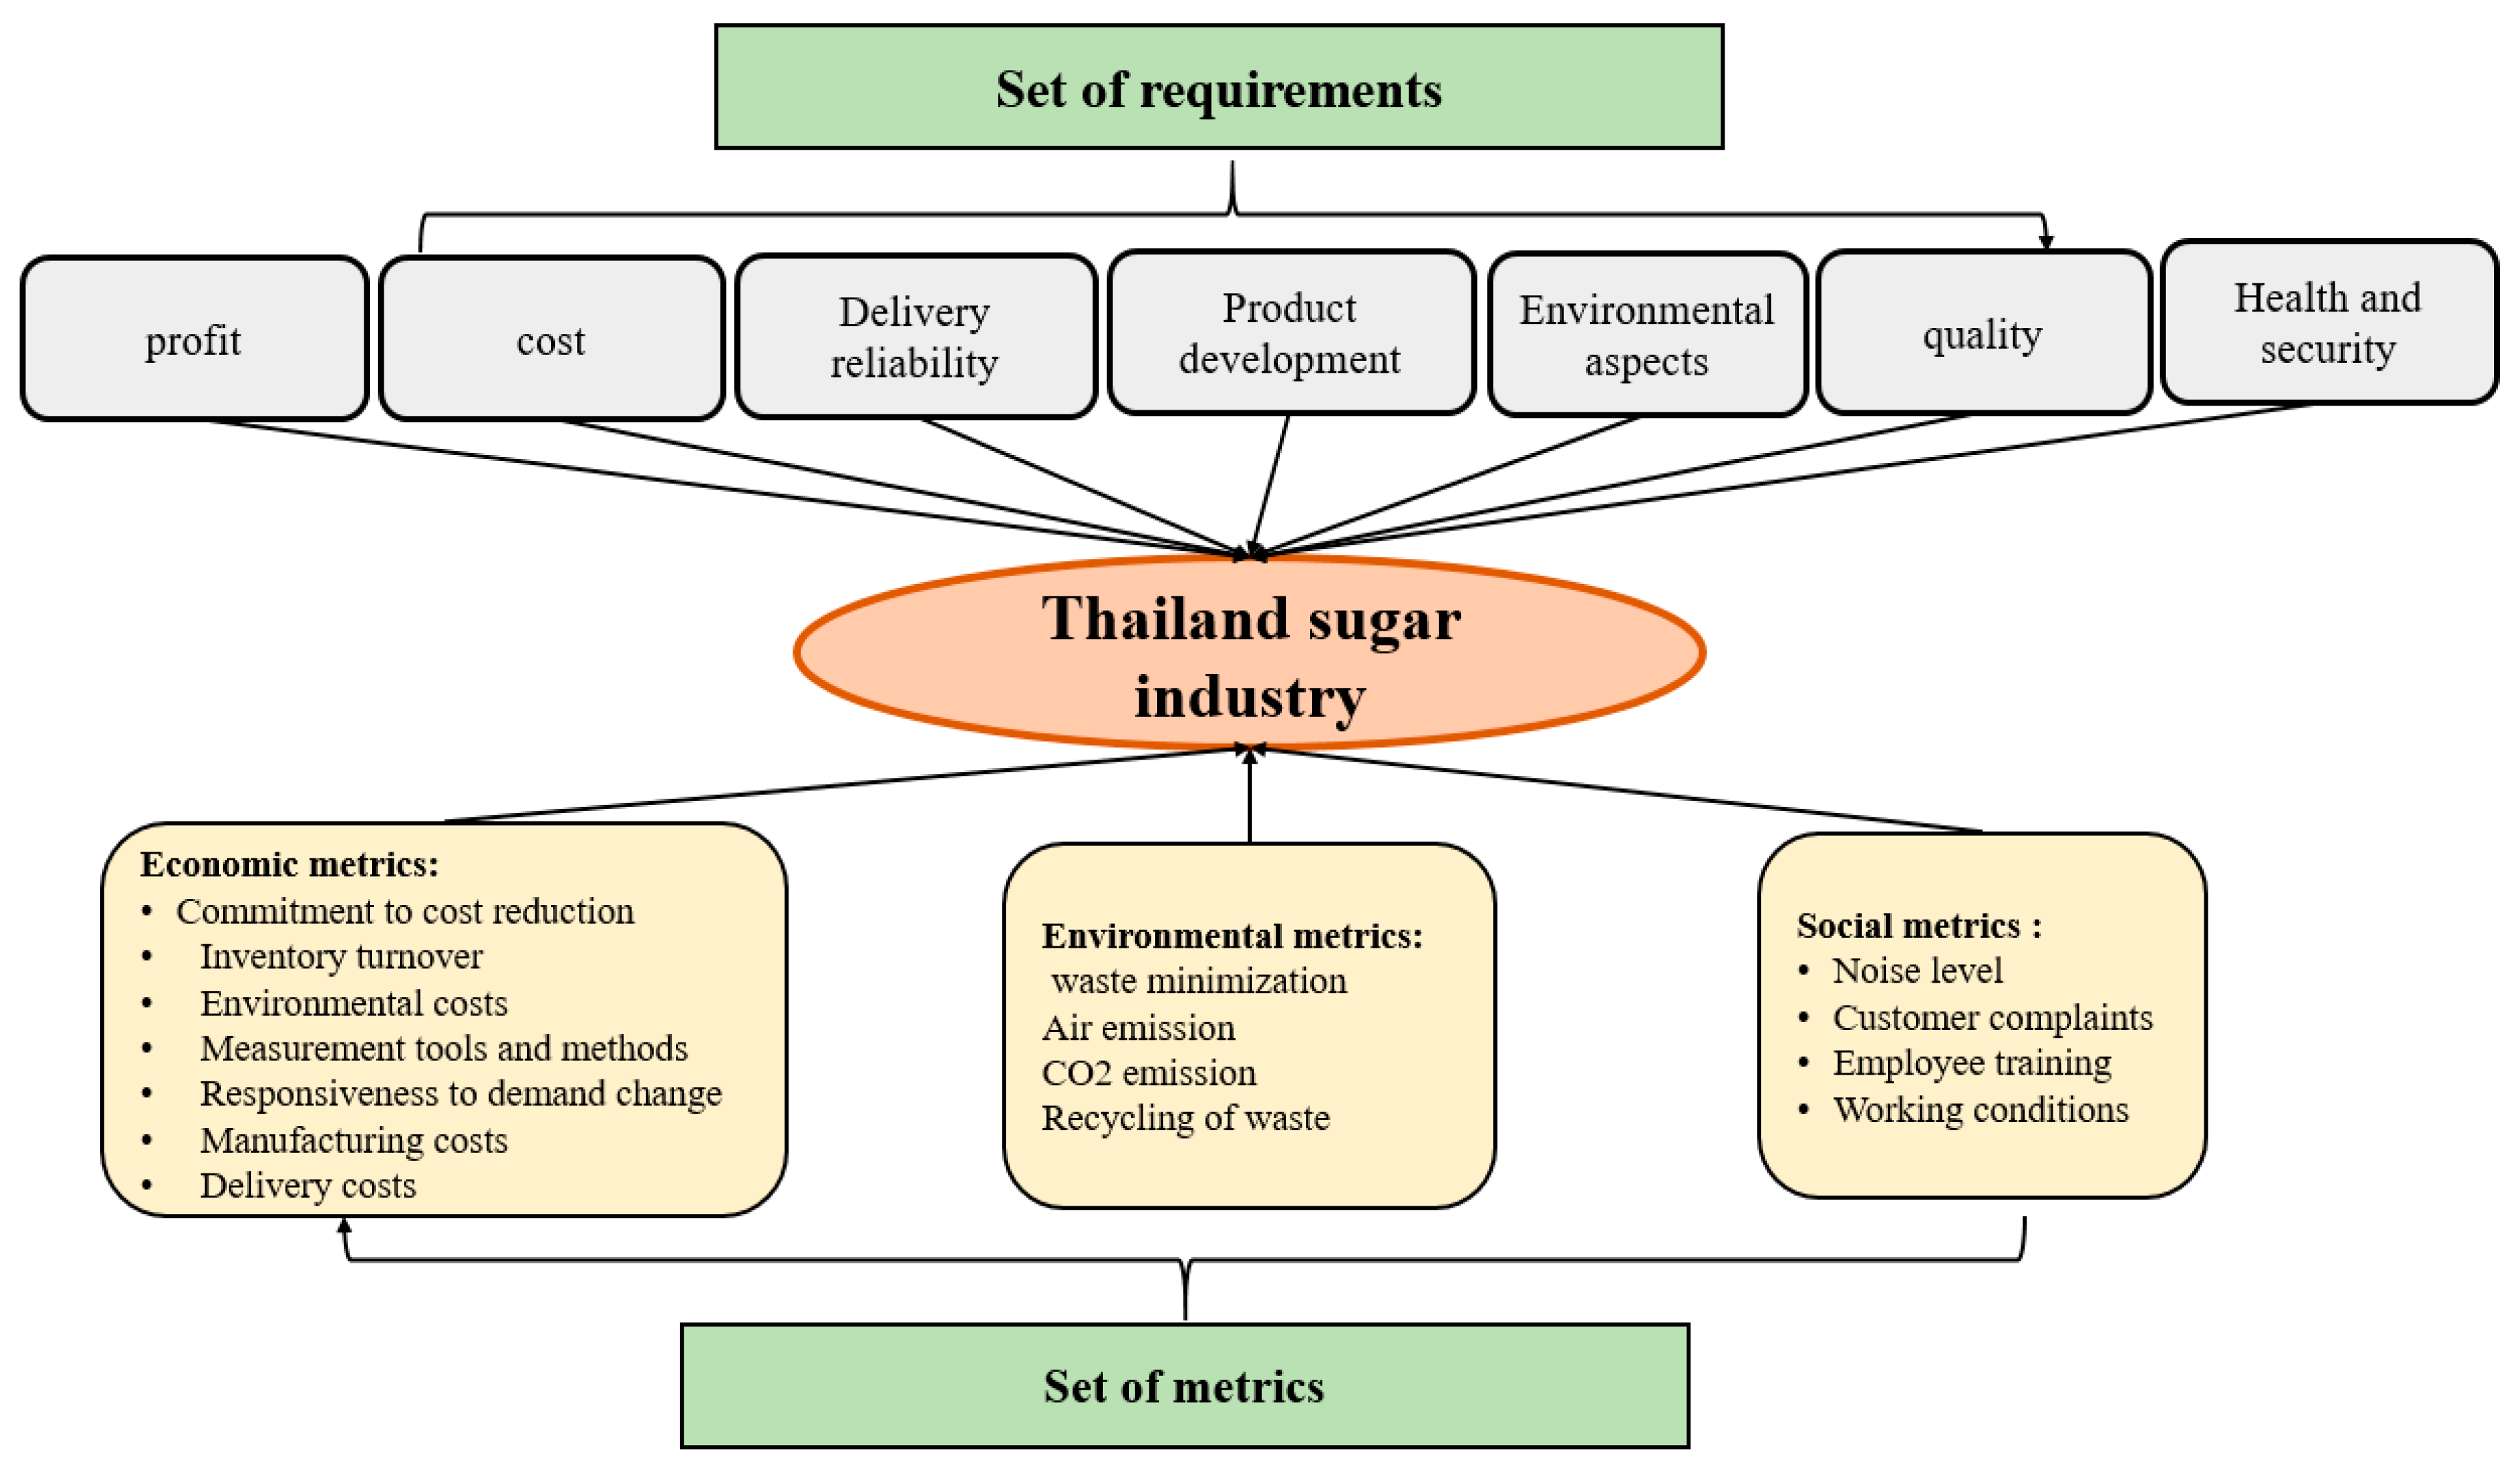
- Step 5: The decision makers define a combination of metrics by considering the requirements selected previously in step 1 and the TPL.Some of the economic metrics are cost reduction, transaction costs, environmental costs, service level, or sales. The environmental metrics are environmental policies, recycling of waste, air pollution emission, solid waste, water consumption, and so on. Finally, the social diminution consists of working conditions, employee satisfaction, government relationships, employee training, and reputation, among others.- The DMs define the relation between each metric and explain each requirement using linguistic terms as in Table 3.
- ❖
- Step 6: Steps 2–4 are repeated on the evaluation metrics. As in Step 2, the plithogenic aggregation operation is used to combine all decision makers’ judgments about defined metrics. Then, Equations (8) and (9) are used to establish the distance of every metric from the best and worst solutions. The importance of each metric is determined using the performance score as in Equation (10).
- ❖
- Step 7: As proposed in Osiro, Lauro et al. 2018 [11], the limitations of other studies that do not consider the hardness of data gathering of each metric need to be addressed. In this step, the difficulty in regards to three dimensions are evaluated in relation to information accessibility, human resources and time needed for assessment, and other required resources [51].
- -
- The difficulty of assessment metrics data collecting based on three dimensions explained by linguistic variables are evaluated.
- -
- The assessment based on the contradiction degree to obtain accuracy of results are aggregated, and thenits crisp value is found.
- -
- Their performance score of data collecting difficulty based on the distance of best and worst solutions are found.
- ❖
- Step 8: In this final step, the goal is to categorize the set of supply chain sustainability metrics.
- -
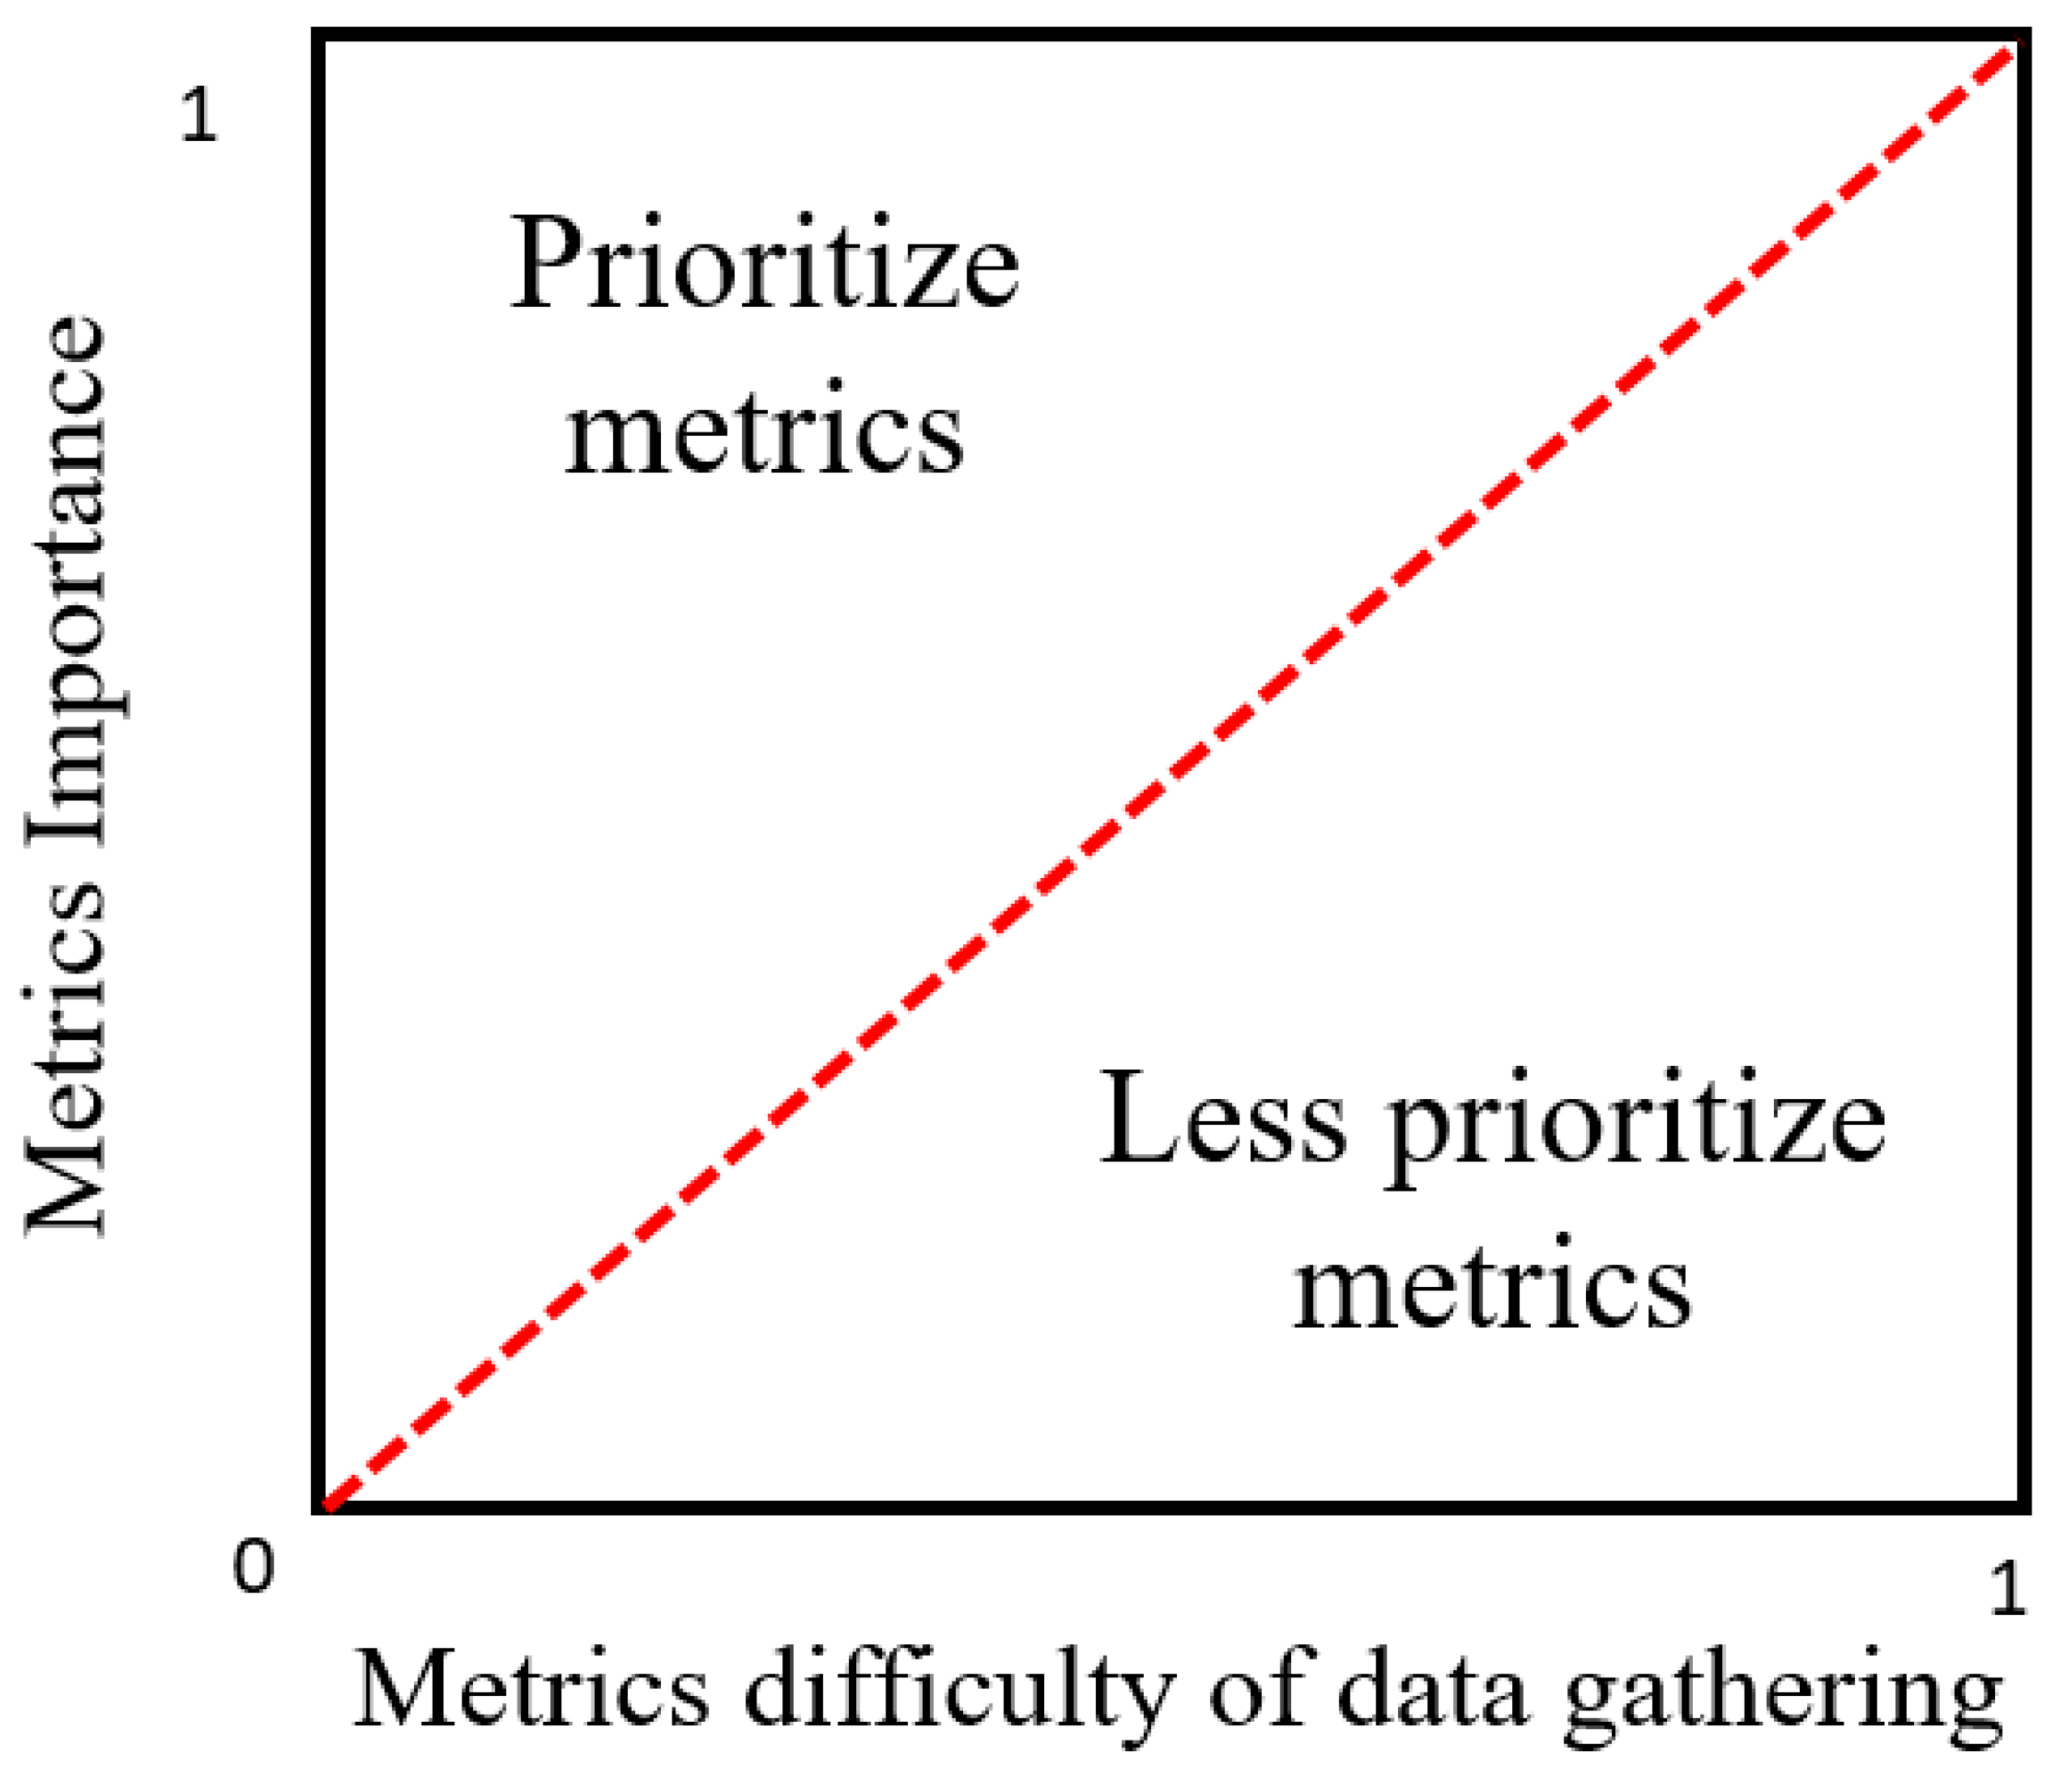
- The performance degree found in Step 4 (the importance of each metric) and Step 7 (the difficulty of data gathering) using Equation (11) are normalized as proposed in (Osiro, Lauro et al. 2018) [11].where is the normalized value, is the difference between the value and the mean, and is the standard deviation.
- -
- This is the result if supply chain sustainability evaluation metrics are categorized according to Figure 3 based on the importance of each metric and its difficulty of data gathering.
4. Real World Case Study
- ➢
- ➢
- As explained in Step 2, the plithogenic aggregation operation is used to combine all decision makers judgments about the requirements based on the contradiction degree of each one as in Table 5.
- ➢
- Using Equation (6), the aggregation results are shown in Table 6 and then their crisp value is found using Equation (7).
- ➢
- In Steps 3 and 4, the distance of positive and negative ideal solutions are found using the Euclidean distance as in Equations (8) and (9). Then, the performance degree is measured as mentioned in Equation (10) to find the weight vector of the seven requirements as shown in Table 7.
- ➢
- ➢
- ➢
- As in Steps 3 and 4, using the Euclidean distance as in Equations (8) and (9), the distance of positive and negative ideal solutions are found. Then, as mentioned in Equation (10), the performance degree is measured to find the weight vector of the metrics. Their results are shown in Table 12.
- ➢
- As proposed in Osiro, Lauro et al. 2018 [11], the limitations of neglecting the difficulty of data gathering of every metric is addressed. In this step, the decision makers evaluate the difficulty in regards to three dimensions: Information accessibility, human resources and time needed for assessments, and other required resources, as shown in Table 13.
- ➢
- Then, the decision makers evaluations were aggregated using a plithogenic aggregation equation as shown in Table 14:
- ➢
- Equations (8) and (9) were used to find the distance of every metric from the positive ideal solution and negative ideal solution. Then, Equation (10) was used to calculate the performance degree, as shown in the fourth column in Table 15.
- ➢
- Finally, the performance score was normalized using Equation (11) that relates to metrics importance and difficulty of data gathering. The normalization results are shown in Table 16.
- ➢
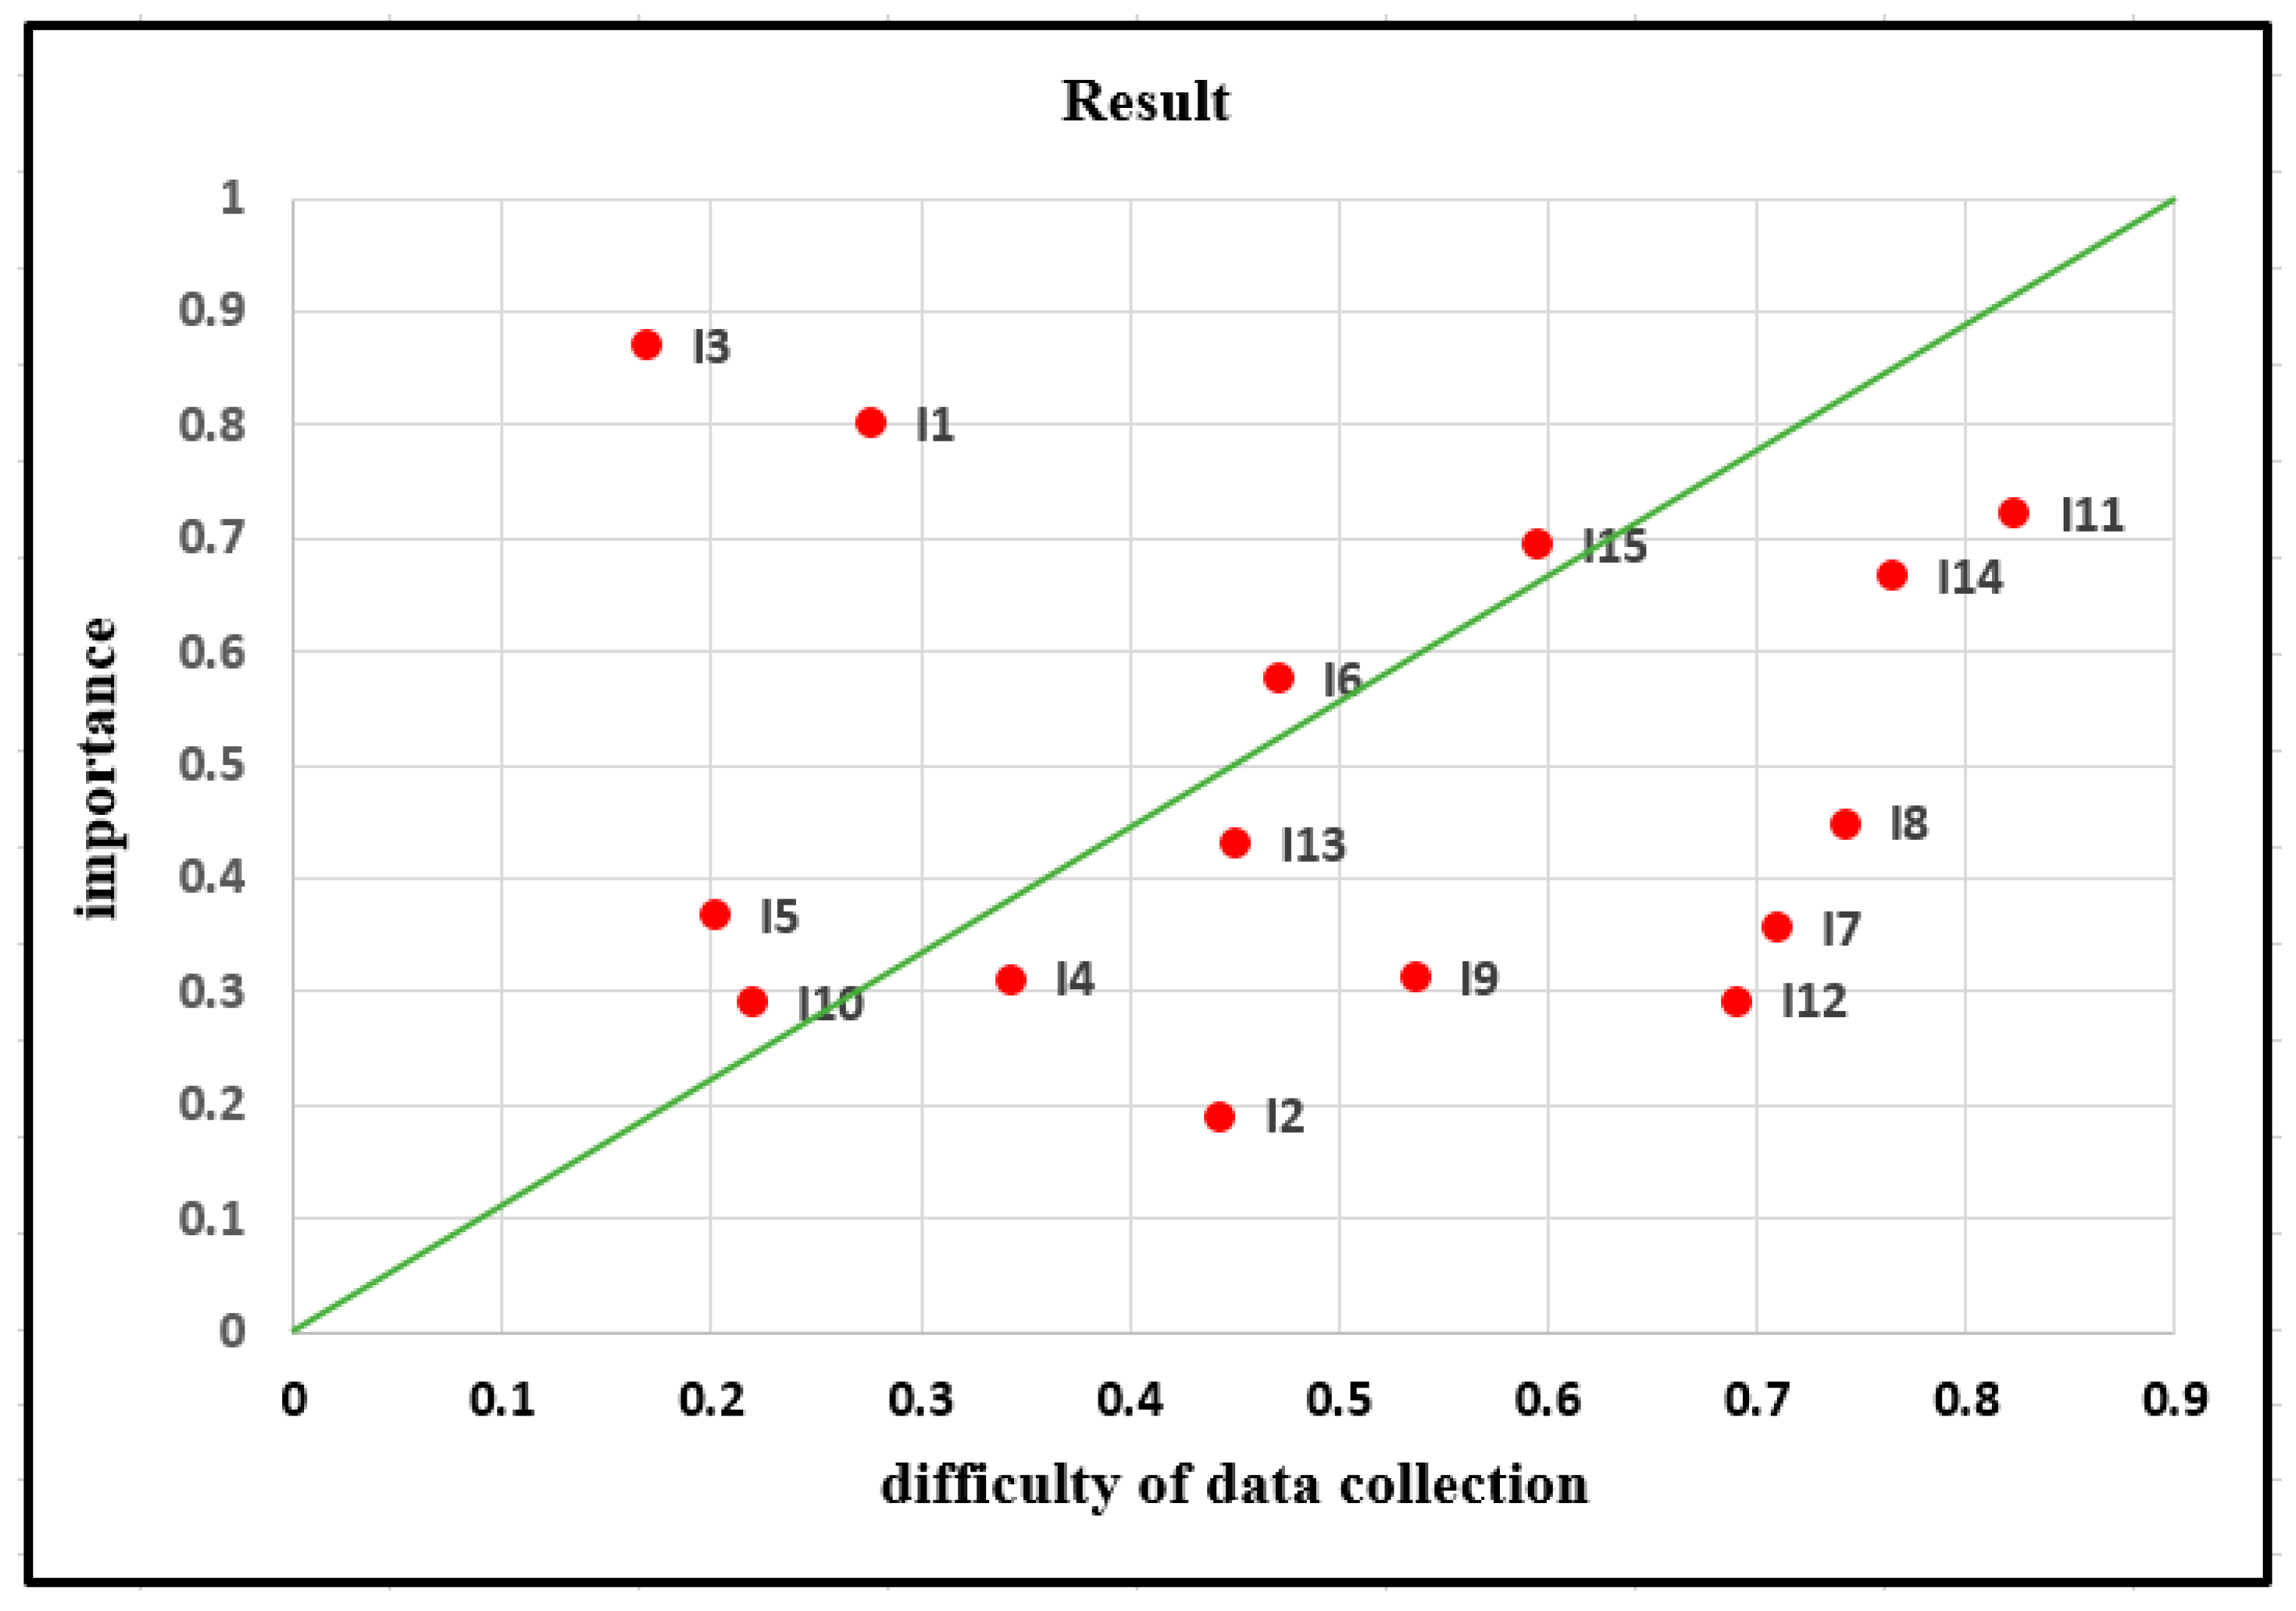
- Figure 5 shows the Thailand sugar industry supply chain sustainability metrics distribution categorized in two regions which are the prioritized metrics and less prioritized metrics based on the four decision maker’s evaluation.
5. Results and Discussion
6. Conclusions and Future Works
- The main contribution of this proposed model lies in providing accurate results of the decision makers assessments based on the contradiction degree while applying the aggregation.
- The plithogenic aggregation operation allows the DMs to consider several experts opinions in order to maximize the efficiency of the decision making.
- Also, it measures the supply chain sustainability based on two major aspects, the significance of the metrics and its level of difficulty of data gathering, which is really a critical point that affects the evaluations.
- Using a triangular neutrosophic linguistic scale to evaluate the requirement, metrics and information availability improved the level of consideration to uncertainty, because it confirms the best representation by using the three membership degrees positive, negative and boundary areas of decision making.
- The proposed methodology is efficient and has a high accuracy degree in decision making problems, Therefore, it is a great tool that may help firms in their estimation of customer needs in addition to evaluating the supply chain sustainability requirements.
Author Contributions
Funding
Acknowledgments
Conflicts of Interest
References
- Ageron, B.; Gunasekaran, A.; Spalanzani, A. Sustainable supply management: An empirical study. Int. J. Prod. Econ. 2012, 140, 168–182. [Google Scholar] [CrossRef]
- Hassini, E.; Surti, C.; Searcy, C. A literature review and a case study of sustainable supply chains with a focus on metrics. Int. J. Prod. Econ. 2012, 140, 69–82. [Google Scholar] [CrossRef]
- Fera, M.; Fruggiero, F.; Lambiase, A.; Macchiaroli, R.; Miranda, S. The role of uncertainty in supply chains under dynamic modeling. Int. J. Ind. Eng. Comput. 2017, 8, 119–140. [Google Scholar] [CrossRef]
- Taticchi, P.; Tonelli, F.; Pasqualino, R. Performance measurement of sustainable supply chains: A literature review and a research agenda. Int. J. Product. Perform. Manag. 2013, 62, 782–804. [Google Scholar] [CrossRef]
- Chithambaranathan, P.; Subramanian, N.; Gunasekaran, A.; Palaniappan, P.K. Service supply chain environmental performance evaluation using grey based hybrid MCDM approach. Int. J. Prod. Econ. 2015, 166, 163–176. [Google Scholar] [CrossRef]
- Hervani, A.A.; Helms, M.M.; Sarkis, J. Performance measurement for green supply chain management. Benchmarking Int. J. 2004, 14, 330–353. [Google Scholar] [CrossRef]
- Xu, M.; Cui, Y.; Hu, M.; Xu, X.; Zhang, Z.; Liang, S.; Qu, S. Supply chain sustainability risk and assessment. J. Clean. Prod. 2018, 225, 857–867. [Google Scholar] [CrossRef]
- Martins, C.L.; Pato, M.V. Supply chain sustainability: A tertiary literature review. J. Clean. Prod. 2019. [Google Scholar] [CrossRef]
- Vafaeenezhad, T.; Tavakkoli-Moghaddam, R.; Cheikhrouhou, N. Multi-objective mathematical modeling for sustainable supply chain management in the paper industry. Comput. Ind. Eng. 2019. [Google Scholar] [CrossRef]
- Tseng, M.L.; Wu, K.J.; Hu, J.; Wang, C.H. Decision-making model for sustainable supply chain finance under uncertainties. Int. J. Prod. Econ. 2018, 205, 30–36. [Google Scholar] [CrossRef]
- Osiro, L.; Lima-Junior, F.R.; Carpinetti, L.C. A group decision model based on quality function deployment and hesitant fuzzy for selecting supply chain sustainability metrics. J. Clean. Prod. 2018, 183, 964–978. [Google Scholar] [CrossRef]
- Rajeev, A.; Pati, R.K.; Padhi, S.S. Sustainable supply chain management in the chemical industry: Evolution, opportunities, and challenges. Resour. Conserv. Recycl. 2019, 149, 275–291. [Google Scholar]
- Akkawuttiwanich, P.; Yenradee, P. Fuzzy QFD approach for managing SCOR performance indicators. Comput. Ind. Eng. 2018, 122, 189–201. [Google Scholar] [CrossRef]
- Li, S.; Tang, D.; Wang, Q. Rating engineering characteristics in open design using a probabilistic language method based on fuzzy QFD. Comput. Ind. Eng. 2019. [Google Scholar] [CrossRef]
- Eleftheriadis, S.; Duffour, P.; Mumovic, D. Participatory decision-support model in the context of building structural design embedding BIM with QFD. Adv. Eng. Inform. 2018, 38, 695–711. [Google Scholar] [CrossRef]
- Lee, C.K.; Ru, C.T.; Yeung, C.L.; Choy, K.L.; Ip, W.H. Analyze the healthcare service requirement using fuzzy QFD. Comput. Ind. 2015, 74, 1–15. [Google Scholar] [CrossRef]
- Eldermann, M.; Siirde, A.; Gusca, J. QFD framework for selection of industry development scenarios. Energy Procedia 2017, 128, 230–233. [Google Scholar] [CrossRef]
- Zaim, S.; Sevkli, M.; Camgöz-Akdağ, H.; Demirel, O.F.; Yayla, A.Y.; Delen, D. Use of ANP weighted crisp and fuzzy QFD for product development. Expert Syst. Appl. 2014, 41, 4464–4474. [Google Scholar] [CrossRef]
- Abdel-Basset, M.; Manogaran, G.; Mohamed, M.; Chilamkurti, N. Three-way decisions based on neutrosophic sets and AHP-QFD framework for supplier selection problem. Future Gener. Comput. Syst. 2018, 89, 19–30. [Google Scholar] [CrossRef]
- Smarandache, F. Plithogeny, Plithogenic Set, Logic, Probability, and Statistics; Infinite Study, 2017; p. 141. [Google Scholar]
- Ahi, P.; Searcy, C. Assessing sustainability in the supply chain: A triple bottom line approach. Appl. Math. Model. 2015, 39, 2882–2896. [Google Scholar] [CrossRef]
- Closs, D.J.; Speier, C.; Meacham, N. Sustainability to support end-to-end value chains: The role of supply chain management. J. Acad. Mark. Sci. 2011, 39, 101–116. [Google Scholar] [CrossRef]
- Haake, H.; Seuring, S. Sustainable procurement of minor items–exploring limits to sustainability. Sustain. Dev. 2009, 17, 284–294. [Google Scholar] [CrossRef]
- Linton, J.D.; Klassen, R.; Jayaraman, V. Sustainable supply chains: An introduction. J. Oper. Manag. 2007, 25, 1075–1082. [Google Scholar] [CrossRef]
- Jadhav, A.; Orr, S.; Malik, M. The role of supply chain orientation in achieving supply chain sustainability. Int. J. Prod. Econ. 2008. [Google Scholar] [CrossRef]
- Yazdani, M.; Kahraman, C.; Zarate, P.; Onar, S.C. A fuzzy multi attribute decision framework with integration of QFD and grey relational analysis. Expert Syst. Appl. 2019, 115, 474–485. [Google Scholar] [CrossRef]
- Qorri, A.; Mujkić, Z.; Kraslawski, A. A conceptual framework for measuring sustainability performance of supply chains. J. Clean. Prod. 2018, 189, 570–584. [Google Scholar] [CrossRef]
- Searcy, C.; Dixon, S.M.; Neumann, W.P. The use of work environment performance indicators in corporate social responsibility reporting. J. Clean. Prod. 2016, 112, 2907–2921. [Google Scholar] [CrossRef]
- Chen, R.H.; Lin, Y.; Tseng, M.L. Multicriteria analysis of sustainable development indicators in the construction minerals industry in China. Resour. Policy 2015, 46, 123–133. [Google Scholar] [CrossRef]
- Haghighi, S.M.; Torabi, S.A.; Ghasemi, R. An integrated approach for performance evaluation in sustainable supply chain networks (with a case study). J. Clean. Prod. 2016, 137, 579–597. [Google Scholar] [CrossRef]
- Akao, Y.; Mazur, G.H. The leading edge in QFD: Past, present and future. Int. J. Qual. Reliab. Manag. 2003, 20, 20–35. [Google Scholar] [CrossRef]
- Moubachir, Y.; Bouami, D. A new approach for the transition between QFD phases. Procedia CIRP 2015, 26, 82–86. [Google Scholar] [CrossRef][Green Version]
- Lam, J.S. Designing a sustainable maritime supply chain: A hybrid QFD-ANP approach. Transp. Res. Part E: Logist. Transp. Rev. 2015, 78, 70–81. [Google Scholar] [CrossRef]
- Yazdani, M.; Chatterjee, P.; Zavadskas, E.K.; Zolfani, S.H. Integrated QFD-MCDM framework for green supplier selection. J. Clean. Prod. 2017, 142, 3728–3740. [Google Scholar] [CrossRef]
- Dursun, M.; Arslan, Ö. An Integrated Decision Framework for Material Selection Procedure: A Case Study in a Detergent Manufacturer. Symmetry 2018, 10, 657. [Google Scholar] [CrossRef]
- Meksavang, P.; Shi, H.; Lin, S.M.; Liu, H.C. An Extended Picture Fuzzy VIKOR Approach for Sustainable Supplier Management and Its Application in the Beef Industry. Symmetry 2019, 11, 468. [Google Scholar] [CrossRef]
- Smarandache, F. Plithogenic Set, an Extension of Crisp, Fuzzy, Intuitionistic Fuzzy, and Neutrosophic Sets–Revisited. Neutrosophic Sets Syst. 2018, 21, 153–166. [Google Scholar]
- Smarandache, F. Physical Plithogenic Set. APS Meeting Abstracts. 2018.
- Smarandache, F. Extension of Soft Set to Hypersoft Set, and then to Plithogenic Hypersoft Set. Neutrosophic Sets Syst. 2018, 24, 168–170. [Google Scholar]
- Liu, P.; Wang, Y. Multiple attribute decision-making method based on single-valued neutrosophic normalized weighted Bonferroni mean. Neural Comput. Appl. 2014, 25, 2001–2010. [Google Scholar] [CrossRef]
- Abdel-Baset, M.; Hezam, I.M.; Smarandache, F. Neutrosophic goal programming. Neutrosophic Sets Syst. 2016, 11. [Google Scholar]
- Rivieccio, U. Neutrosophic logics: Prospects and problems. Fuzzy Sets Syst. 2008, 159, 1860–1868. [Google Scholar] [CrossRef]
- Govindan, K.; Khodaverdi, R.; Jafarian, A. A fuzzy multi criteria approach for measuring sustainability performance of a supplier based on triple bottom line approach. J. Clean. Prod. 2003, 47, 345–354. [Google Scholar] [CrossRef]
- Osiro, L.; Lima-Junior, F.R.; Carpinetti, L.C. A fuzzy logic approach to supplier evaluation for development. Int. J. Prod. Econ. 2014, 153, 95–112. [Google Scholar] [CrossRef]
- Kannan, D.; Khodaverdi, R.; Olfat, L.; Jafarian, A.; Diabat, A. Integrated fuzzy multi criteria decision making method and multi-objective programming approach for supplier selection and order allocation in a green supply chain. J. Clean. Prod. 2013, 47, 355–367. [Google Scholar] [CrossRef]
- Huang, S.H.; Keskar, H. Comprehensive and configurable metrics for supplier selection. Int. J. Prod. Econ. 2007, 105, 510–523. [Google Scholar] [CrossRef]
- Katsikeas, C.S.; Paparoidamis, N.G.; Katsikea, E. Supply source selection criteria: The impact of supplier performance on distributor performance. Ind. Mark. Manag. 2004, 33, 755–764. [Google Scholar] [CrossRef]
- Mani, V.; Agrawal, R.; Sharma, V. Supplier selection using social sustainability: AHP based approach in India. Int. Strateg. Manag. Rev. 2014, 2, 98–112. [Google Scholar] [CrossRef]
- Chang, B.; Chang, C.W.; Wu, C.H. Fuzzy DEMATEL method for developing supplier selection criteria. Expert Syst. Appl. 2011, 38, 1850–1858. [Google Scholar] [CrossRef]
- Liao, H.; Xu, Z.; Zeng, X.J. Distance and similarity measures for hesitant fuzzy linguistic term sets and their application in multi-criteria decision making. Inf. Sci. 2014, 271, 125–142. [Google Scholar] [CrossRef]
- Lima-Junior, F.R.; Carpinetti, L.C. A multicriteria approach based on fuzzy QFD for choosing criteria for supplier selection. Comput. Ind. Eng. 2016, 101, 269–285. [Google Scholar] [CrossRef]
- Ignatius, J.; Rahman, A.; Yazdani, M.; Šaparauskas, J.; Haron, S.H. An integrated fuzzy ANP–QFD approach for green building assessment. J. Civ. Eng. Manag. 2016, 22, 551–563. [Google Scholar] [CrossRef]
- Jamalnia, A.; Mahdiraji, H.A.; Sadeghi, M.R.; Hajiagha, S.H.; Feili, A. An integrated fuzzy QFD and fuzzy goal programming approach for global facility location-allocation problem. Int. J. Inf. Technol. Decis. Mak. 2014, 13, 263–290. [Google Scholar] [CrossRef]
- Khodakarami, M.; Shabani, A.; Saen, R.F.; Azadi, M. Developing distinctive two-stage data envelopment analysis models: An application in evaluating the sustainability of supply chain management. Measurement 2015, 70, 62–74. [Google Scholar] [CrossRef]
- Izadikhah, M.; Saen, R.F. Evaluating sustainability of supply chains by two-stage range directional measure in the presence of negative data. Transp. Res. Part D Transp. Environ. 2016, 49, 110–126. [Google Scholar] [CrossRef]
- Ahmadi, H.B.; Kusi-Sarpong, S.; Rezaei, J. Assessing the social sustainability of supply chains using Best Worst Method. Resour. Conserv. Recycl. 2017, 126, 99–106. [Google Scholar] [CrossRef]
- Matić, B.; Jovanović, S.; Das, D.K.; Zavadskas, E.K.; Stević, Ž.; Sremac, S.; Marinković, M. A New Hybrid MCDM Model: Sustainable Supplier Selection in a Construction Company. Symmetry 2019, 11, 353. [Google Scholar] [CrossRef]
- Abdel-Basset, M.; Mohamed, M.; Smarandache, F. A hybrid neutrosophic group ANP-TOPSIS framework for supplier selection problems. Symmetry 2018, 10, 226. [Google Scholar] [CrossRef]


| Authors | Scope | Methodology | Metrics |
|---|---|---|---|
| Akshay Jadhav, Stuart Orr, Mohsin Malik (2018) [25] | Supply chain orientation (SCO) | Literature review analysis (SEM analysis) | Co2 emission management, community engagement, supplier codes of conduct, waste elimination, energy usage efficiency, water usage efficiency, and recycled materials practices, among others. |
| Elkafi Hassini, ChiragSurti, CorySearcy (2012) [4] | Developing supply chain sustainability metrics | Literature review | Percent of suppliers, Percent of contracts, Percent of purchase orders, Level of stake-holder trust by category |
| Yazdani, Morteza, Cengiz Kahraman, Pascale Zarate, and Sezi Cevik Onar (2019) [26] | Ranking of supply chain sustainability indicators | Multi-attribute decision making (QFD and GRA) | Quality, managing environmental systems, supply chain elasticity, business social liability, transportation service situation, and financial constancy. |
| Qorri, Ardian, Zlatan Mujkić, and Andrzej Kraslawski (2018) [27] | Measuring supply chain sustainability performance | Literature review | Number of contributors, products, geographical encompassing, strategic goals, methods, tools, among others |
| Searcy, Cory, Shane M. Dixon, and W. Patrick Neumann (2016) [28] | Analysis of performance indicators in supply chain sustainability | Literature review and report analysis | Employees number, profits, supplier estimation, trainingcost, among others |
| Chen, Rong-Hui, Yuanhsu Lin, and Ming-Lang Tseng [29] | Sustainable development indicators in the structure minerals industry in China | Combines fuzzy set theory, the Delphi method, discrete multi-criteria method | Solid waste, Eco-efficiency, Health and safety, Energy use, Investments, Land use and rehabilitation, among others |
| Haghighi, S. Motevali, S. A. Torabi, and R. Ghasemi [30] | Evaluation of Sustainable Supply Chain Networks | Data envelopment analysis technique | Time delivery, Supplier rejection rate, Amount of Pollution, Customers’ satisfaction, Service quality, among others |
| Requirement | Author | |
|---|---|---|
| 1 | Cost/profit | Govindan, Kannan, Roohollah Khodaverdi, and Ahmad Jafarian [43] |
| 2 | Product quality | Osiro, Lauro, Francisco R. Lima-Junior, and Luiz Cesar R. Carpinetti [44] |
| 3 | Environmental influences | Huang, Samuel H., and Harshal Keskar [45] |
| 4 | Stability and constancy | Kannan, Devika, et al. [46] |
| 5 | Information Technology | Katsikeas, Constantine S., Nicholas G. Paparoidamis, and Eva Katsikea [47] |
| 6 | Social aspects | Mani, V., Rajat Agrawal, and Vinay Sharma [48] |
| 7 | Delivery accuracy | Chang, Betty, Chih-Wei Chang, and Chih-Hung Wu [49] |
| Linguistic Variable | Triangular Neutrosophic Scale |
|---|---|
| Nothing (N) | ((0.10, 0.30,0.35), 0.1,0.2,0.15) |
| Very Low (VL) | ((0.15,0.25,0.10), 0.6,0.2,0.3) |
| Low (L) | ((0.40,0.35,0.50), 0.6,0.1,0.2) |
| Medium (M) | (0.65,0.60,0.70),0.8,0.1,0.1) |
| High (H) | ((0.70,0.65,0.80),0.9,0.2,0.1) |
| Very high (VH) | ((0.90,0.85,0.90),0.7,0.2,0.2) |
| Absolute (A) | ((0.95,0.90,0.95),0.9,0.10,0.10) |
| Requirement | DM1 | DM2 | DM3 | DM4 |
|---|---|---|---|---|
| R1 | VH | H | H | M |
| R2 | H | VH | M | H |
| R3 | M | H | H | VH |
| R4 | H | M | M | H |
| R5 | H | VH | H | M |
| R6 | H | VH | VH | M |
| R7 | H | M | H | M |
| Requirement | R1 | R2 | R3 | R4 | R5 | R6 | R7 |
|---|---|---|---|---|---|---|---|
| Contradiction degree | 0 | 1/7 | 2/7 | 3/7 | 4/7 | 5/7 | 6/7 |
| Requirement | DM1⋀p DM2 ⋀p DM3 ⋀p DM4 | Crisp Value |
|---|---|---|
| R1 | ((0.29,0.69,1),0.45,0.18,0.36) | 0.4727 |
| R2 | ((0.42,0.69,0.97),0.57,0.18,0.32) | 0.1664 |
| R3 | ((0.56,0.69,0.91),0.68,0.18,0.24) | 0.6130 |
| R4 | ((0.61,0.63,0.8),0.6,0.15,0.12) | 0.5942 |
| R5 | ((0.79,0.69,0.75),0.86,0.18,0.1) | 0.7192 |
| R6 | ((0.92,0.74,0.68),0.9,0.18,0.06) | 0.7781 |
| R7 | ((0.93,0.63,0.43),0.98,0.15,0.01) | 0.7015 |
| Requirement | Positive Distance | Negative Distance | Performance Score | Weight | Ranking |
|---|---|---|---|---|---|
| R1 | 0.2323 | 0.40872 | 0.6376 | 0.1551 | 4 |
| R2 | 0.4674 | 0.538 | 0.5351 | 0.1302 | 5 |
| R3 | 0.0914 | 0.0208 | 0.1854 | 0.0451 | 7 |
| R4 | 0.1048 | 0.0398 | 0.2752 | 0.0669 | 6 |
| R5 | 0.0146 | 0.0852 | 0.8537 | 0.2077 | 2 |
| R6 | 0.0736 | 0.1442 | 0.6621 | 0.1611 | 3 |
| R7 | 0.0027 | 0.0677 | 0.9616 | 0.2339 | 1 |
| total | - | - | 4.1107 | 1 |
| Dimension | Metrics |
|---|---|
| Economic | Commitment to cost reduction (I1) |
| Inventory turnover (I2) | |
| Environmental costs (I3) | |
| Measurement tools and methods (I4) | |
| Responsiveness to demand change (I5) | |
| Manufacturing cost (I6) | |
| Delivery cost (I7) | |
| Environmental | Waste minimization(I8) |
| Air emission (I9) | |
| CO2 emission (I10) | |
| Recycling of waste (I11) | |
| Social | Noise level (I12) |
| Customer complaints (I13) | |
| Employee training (I14) | |
| Working conditions (I15) |
| Metrics | R1 | R2 | R3 | R4 | R5 | R6 | R7 |
|---|---|---|---|---|---|---|---|
| I1 | VH | A | M | M | L | M | L |
| I2 | L | M | H | L | L | M | L |
| I3 | H | VH | L | M | VH | L | H |
| I4 | M | M | H | VH | H | VH | H |
| I5 | H | H | VH | L | VL | M | VL |
| I6 | M | VH | L | VH | VL | VH | VL |
| I7 | VH | VH | VH | M | VL | H | L |
| I8 | L | VH | L | L | VH | L | VH |
| I9 | VL | VL | L | M | VH | L | VH |
| I10 | VL | VL | L | H | VH | M | VH |
| I11 | M | L | L | VL | VH | L | VH |
| I12 | L | L | L | VL | M | L | H |
| I13 | H | L | M | L | M | L | H |
| I14 | H | VH | L | VH | VL | H | H |
| I15 | H | H | M | M | L | H | H |
| R1 ⋀pR2⋀pR3⋀p R4 | R5⋀p R6⋀p R7 | R1 … R7 | CRISP | |
|---|---|---|---|---|
| I1 | ((0.36,0.74,1),0.4,0.13,0.42) | ((0.1,0.43,0.9),0.29,0.1,0.4) | ((0.036,0.59,1),0.12,0.25,0.65) | 0.248 |
| I2 | ((0.12,0.49,0.96),0.34,0.13,0.5) | ((0.15,0.4,0.9),0.3,0.1,0.45) | ((0.03,0.5,0.99),0.13,0.1,0.69) | 0.2479 |
| I3 | ((0.52,0.48,0.87),0.43,0.15,0.39) | ((0.6,0.63,0.9),0.5,0.2,0.34) | ((0.4,0.6,0.97),0.28,0.17,0.54) | 0.3866 |
| I4 | ((0.46,0.7,0.94),0.6,0.15,0.32) | ((0.6,0.7,0.94),0.7,0.2,0.25) | ((0.4,0.7,0.97),0.5,0.18,0.41) | 0.4968 |
| I5 | ((0.43,0.63,0.92),0.6,0.18,0.3) | ((0.1,0.3,0.45),0.5,0.18,0.4) | ((0.43,0.5,0.8),0.43,0.18,0.46) | 0.3871 |
| I6 | ((0.55,0.7,0.87),0.56,0.15,0.3) | ((0.2,0.4,0.62),0.5,0.2,0.37) | ((0.3,0.6,0.8),0.45,0.18,0.41) | 0.3953 |
| I7 | ((0.78,0.5,0.87),0.88,0.18,0.24) | ((0.3,0.4,0.7),0.7,0.14,0.24) | ((0.5,0.45,0.8),0.76,0.16,0.28) | 0.5191 |
| I8 | ((0.5,0.48,0.64),0.6,0.13,0.2) | ((0.75,0.7,0.8),0.7,0.18,0.2) | ((0.61,0.6,0.73),0.61,0.16,0.2) | 0.5484 |
| I9 | ((0.37,0.73,0.32),0.68,0.15,0.21) | ((0.8,0.7,0.8),0.7,0.18,0.18) | ((0.6,0.73,0.53),0.7,0.17,0.18) | 0.5464 |
| I10 | ((0.45,0.38,0.28),0.77,0.18,0.16) | ((0.9,0.8,0.8),0.8,0.18,0.13) | ((0.72,0.6,0.48),0.8,0.18,0.12) | 0.5607 |
| I11 | ((0.57,0.4,0.28),0.79,0.2,0.11) | ((0.9,0.7,0.85),0.8,0.18,0.1) | ((0.8,0.6,0.46),0.84,0.19,0.07) | 0.587 |
| I12 | ((0.57,0.33,0.29),0.8,0.13,0.09) | ((0.8,0.6,0.5),0.9,0.15,0.05) | ((0.78,0.5,0.28),0.9,0.14,0.04) | 0.5168 |
| I13 | ((0.82,0.49,0.3),0.93,0.13,0.57) | ((0.8,0.6,0.5),0.93,0.15,0.2) | ((0.9,0.53,0.24),0.97,0.14,0.2) | 0.5448 |
| I14 | ((0.17,0.7,0.46),0.95,0.13,0.02) | ((0.8,0.6,0.2),0.97,0.2,0.03) | ((0.8,0.6,0.17),0.99,0.2,0.007) | 0.5521 |
| I15 | ((0.97,0.63,0.4),0.99,0.15,0.003) | ((0.9,0.6,0.4),0.98,0.2,0.01) | ((0.99,0.61,0.14),1,0.17,0.001) | 0.6153 |
| Metrics | I1 | I2 | I3 | I4 | I5 | I6 | I7 | I8 | I9 | I10 | I11 | I12 | I13 | I14 | I15 |
|---|---|---|---|---|---|---|---|---|---|---|---|---|---|---|---|
| Contradiction degree | 0 |
| Metrics | Positive Distance | Negative Distance | Performance Score |
|---|---|---|---|
| I1 | 0.1114 | 0.5139 | 0.8218 |
| I2 | 0.4509 | 0.1115 | 0.1983 |
| I3 | 0.0272 | 0.3753 | 0.9324 |
| I4 | 0.2651 | 0.137 | 0.3407 |
| I5 | 0.3748 | 0.2467 | 0.3969 |
| I6 | 0.264 | 0.3666 | 0.5814 |
| I7 | 0.3878 | 0.2428 | 0.385 |
| I8 | 0.2135 | 0.189 | 0.4696 |
| I9 | 0.4151 | 0.2155 | 0.3417 |
| I10 | 0.4294 | 0.2012 | 0.3191 |
| I11 | 0.1749 | 0.4557 | 0.7226 |
| I12 | 0.3855 | 0.182 | 0.3207 |
| I13 | 0.1854 | 0.154 | 0.4537 |
| I14 | 0.2098 | 0.4208 | 0.6673 |
| I15 | 0.0835 | 0.2559 | 0.754 |
| Metrics | Information Availability | Human Resource and Time | Additional Resource Required |
|---|---|---|---|
| I1 | H | L | VH |
| I2 | M | H | H |
| I3 | H | L | L |
| I4 | M | H | H |
| I5 | L | M | L |
| I6 | H | H | L |
| I7 | H | L | VH |
| I8 | M | L | VH |
| I9 | H | M | L |
| I10 | H | M | L |
| I11 | M | L | VH |
| I12 | H | VH | L |
| I13 | VH | L | L |
| I14 | H | VH | VH |
| I15 | H | H | H |
| Metrics | A ⋀p B ⋀p C | Crisp Value |
|---|---|---|
| I1 | ((0.25,0.68,1),0.38,0.18,0.42) | 0.4294 |
| I2 | ((0.37,0.64,0.96),0.69,0.18,0.25) | 0.5565 |
| I3 | ((0.2,0.4,0.85),0.42,0.13,0.35) | 0.3516 |
| I4 | ((0.47,0.64,0.92),0.75,0.18,0.2) | 0.6014 |
| I5 | ((0.29,0.42,0.73),0.49,0.1,0.28) | 0.3798 |
| I6 | ((0.43,0.5,0.76),0.66,0.15,0.2) | 0.488 |
| I7 | ((0.65,0.68,0.83),0.66,0.18,0.22) | 0.6102 |
| I8 | ((0.7,0.67,0.77),0.68,0.15,0.19) | 0.626 |
| I9 | ((0.56,0.49,0.6),0.74,0.13,0.14) | 0.5094 |
| I10 | ((0.6,0.49,0.55),0.78,0.13,0.12) | 0.506 |
| I11 | ((0.82,0.67,0.63),0.8,0.15,0.11) | 0.6731 |
| I12 | ((0.77,0.55,0.53),0.84,0.15,0.09) | 0.6013 |
| I13 | ((0.78,0.48,0.38),0.83,0.13,0.07) | 0.5392 |
| I14 | ((0.97,0.8,0.72),0.85,0.2,0.04) | 0.8124 |
| I15 | ((0.94,0.65,0.55),0.99,0.2,0.01 | 0.7437 |
| Metrics | Ideal Positive | Ideal Negative | Performance Degree |
|---|---|---|---|
| I1 | 0.7619 | 0.3594 | 0.1739 |
| I2 | 0.6988 | 0.6338 | 0.352 |
| I3 | 0.6988 | 0.3594 | 0.02197 |
| I4 | 0.6988 | 0.6338 | 0.2496 |
| I5 | 0.6338 | 0.3594 | 0.0743 |
| I6 | 0.6988 | 0.3594 | 0.3789 |
| I7 | 0.7619 | 0.3594 | 0.6231 |
| I8 | 0.7619 | 0.3594 | 0.6624 |
| I9 | 0.6988 | 0.3594 | 0.442 |
| I10 | 0.6988 | 0.3594 | 0.1003 |
| I11 | 0.7619 | 0.3594 | 0.7794 |
| I12 | 0.7619 | 0.3594 | 0.601 |
| I13 | 0.7619 | 0.3594 | 0.4467 |
| I14 | 0.7619 | 0.6988 | 0.6923 |
| I15 | 0.6988 | 0.6988 | 0.5 |
| Metrics | Importance | Difficulty of Data Collection |
|---|---|---|
| I1 | 0.8031 | 0.2762 |
| I2 | 0.1913 | 0.4434 |
| I3 | 0.8711 | 0.1692 |
| I4 | 0.3119 | 0.3429 |
| I5 | 0.3694 | 0.2018 |
| I6 | 0.5763 | 0.4710 |
| I7 | 0.3569 | 0.7095 |
| I8 | 0.4495 | 0.7418 |
| I9 | 0.3129 | 0.5361 |
| I10 | 0.2911 | 0.2197 |
| I11 | 0.7216 | 0.8233 |
| I12 | 0.2926 | 0.6903 |
| I13 | 0.4316 | 0.4509 |
| I14 | 0.6682 | 0.7648 |
| I15 | 0.6958 | 0.595 |
© 2019 by the authors. Licensee MDPI, Basel, Switzerland. This article is an open access article distributed under the terms and conditions of the Creative Commons Attribution (CC BY) license (http://creativecommons.org/licenses/by/4.0/).
Share and Cite
Abdel-Basset, M.; Mohamed, R.; Zaied, A.E.-N.H.; Smarandache, F. A Hybrid Plithogenic Decision-Making Approach with Quality Function Deployment for Selecting Supply Chain Sustainability Metrics. Symmetry 2019, 11, 903. https://doi.org/10.3390/sym11070903
Abdel-Basset M, Mohamed R, Zaied AE-NH, Smarandache F. A Hybrid Plithogenic Decision-Making Approach with Quality Function Deployment for Selecting Supply Chain Sustainability Metrics. Symmetry. 2019; 11(7):903. https://doi.org/10.3390/sym11070903
Chicago/Turabian StyleAbdel-Basset, Mohamed, Rehab Mohamed, Abd El-Nasser H. Zaied, and Florentin Smarandache. 2019. "A Hybrid Plithogenic Decision-Making Approach with Quality Function Deployment for Selecting Supply Chain Sustainability Metrics" Symmetry 11, no. 7: 903. https://doi.org/10.3390/sym11070903
APA StyleAbdel-Basset, M., Mohamed, R., Zaied, A. E.-N. H., & Smarandache, F. (2019). A Hybrid Plithogenic Decision-Making Approach with Quality Function Deployment for Selecting Supply Chain Sustainability Metrics. Symmetry, 11(7), 903. https://doi.org/10.3390/sym11070903