Potential Impacts of Soil Tillage System on Isoflavone Concentration of Soybean as Functional Food Ingredients
by
 , , ,
, , ,
Liliana Mureșan
1, 
Doina Clapa
2,*,
Orsolya Borsai
2,3,
Teodor Rusu
4 ,
,
Thomas T. Y. Wang
1 and
Jae B. Park
1 1
Diet, Genomics and Immunology Laboratory, Beltsville Human Nutrition Research Center, Agricultural Research Service, U.S. Department of Agriculture, Beltsville, MD 20705, USA
2
Institute of Advanced Horticulture Research of Transylvania, University of Agricultural Sciences and Veterinary Medicine Cluj-Napoca, Manastur St. 3-5, 400372 Cluj-Napoca, Romania
3
AgroTransilvania Cluster, Dezmir, Crișeni FN, 407039 Dezmir, Romania
4
University of Agricultural Sciences and Veterinary Medicine, Mănăştur St.3-5, 400372 Cluj-Napoca, Romania
*
Author to whom correspondence should be addressed.
Land 2020, 9(10), 386; https://doi.org/10.3390/land9100386
Submission received: 3 September 2020
/
Revised: 8 October 2020
/
Accepted: 9 October 2020
/
Published: 12 October 2020
(This article belongs to the Special Issue Soil Tillage Systems and Conservative Agriculture)
Abstract
:Soybean is an important natural source of isoflavones, but their concentration is likely to be influenced by external factors, such as climatic conditions and soil tillage systems. However, there is minimal information about the effects of such external factors on the isoflavone concentration in soybeans grown in Europe. Therefore, in this study, field experiments were established in Romania to investigate the potential impacts of three different soil tillage systems—conventional, minimum tillage and no-tillage—on crop yields and the isoflavone concentration of soybeans for three experimental years, 2014–2016. Our experimental results indicated that the soil tillage systems had little impact on the soybean yields each year. However, the 2016 yield was found to be higher than the 2014 and 2015 yields under all three soil systems. For every experimental year, the higher yield was recorded by the conventional system, followed by the minimum tillage system and no-tillage system under first weed control (weed control two (wct2): S-metolaclor 960 g/L, imazamox 40 g/L and propaquizafop 100 g/L). Likewise, the soil tillage system did not have a significant influence on the total isoflavone concentrations. Nevertheless, we noticed some variations in the individual isoflavone concentration (daidzin, genistin, glycitin, daidzein, genistein) in each year. Altogether, the minimum tillage and no-tillage systems may be employed as a suitable soil tillage system in soybean farming without an impact on the total isoflavone.
1. Introduction
Soybean and soy products are consumed worldwide due to their high nutrient contents and bioactive components [1]. In particular, soybean is an essential source of isoflavones [1,2]. Isoflavones belong to a group of flavonoids: mostly in the glycosidic conjugated forms (e.g., daidzin, genistin and glycitin) but also in the aglycones (e.g., daidzein and genistein) [3,4,5]. Numerous studies suggest that the isoflavones in soybeans and soy products may have positive health effects, such as anti-oxidant, anti-inflammatory, anti-diabetic, anti-microbial, anti-arthritic, anti-obesity, anti-hyperlipidemic, cardioprotective and anti-cancer effects [6,7,8,9]. Due to these purported effects, soybean products were widely marketed and sold as a health food product [1,10]. In fact, the concentration of isoflavones in soybeans has been reported to be modulated by many factors, such as genotype climatic conditions (e.g., temperature and precipitation) [4,11,12,13,14,15,16,17,18]. However, there is little information about the impacts of soil tillage systems on the isoflavone concentration in soybeans grown in Europe.
Romania is one of the major soybean producers in Europe, cultivating soy on 178,000 hectares with a production of 260,000 tons of soybeans [19,20]. In fact, there are five very suitable regions for soybean cultivation in Romania: (1) the Southern Romanian Meadow and Dobrogea, (2) the Banat and Crișanei Meadow, (3) the Northern Romanian Meadow, (4) Eastern and Northern Moldova and (5) Western/Southwestern Transilvania and the Northwestern Meadow. In these regions, a conventional soil tillage system has been widely practiced for years. The conventional soil tillage system is specifically better used in areas rich in humus, clayey or argillaceous soils. However, the continual practice of this soil tillage system often leads to some negative outcomes, such as the stratification, structural degradation and fertility reduction of soil, because it often requires plowing deeper and stirring more soil than in the conservative soil systems (e.g., minimum tillage and no-tillage) [20]. In fact, soil structural erosion and reduced fertility are very challenging issues in not only Romania but also other European countries due to limited farmlands [20]. For this reason, in Romania, the conservative soil tillage systems were recently introduced for soybean production because these soil systems often maintain a high production potential of the soil through maintaining optimal nutrient and structural/biological conditions in the soil [21,22]. Currently, conservative soil management (e.g., minimum tillage and no-tillage) is practiced on approximately 10% of the arable land in Romania and is expected to be expanded in the future. However, there is limited information about the effects of soil tillage systems on the yield and isoflavone concentration of soybeans grown in Romania. Therefore, in this study, field experiments were established in Romania for three experimental years (2014–2016) in order to investigate the effects of different soil tillage systems (conventional, minimum tillage and no-tillage) on the isoflavone concentration and the crop yield of soybeans.
2. Materials and Methods
2.1. Materials
Soybean samples were obtained from the Agricultural Research and Development Station (SCDA), Turda-Cluj, Romania, which harvested between 2014 and 2016. The soybean used in this study is a high-grade Felix variety (Glycine max (L); subspecies (manshurica)) which was created at SCDA Turda as a result of Maple Presto x Merit (Glycine max (L) Merr.) with several characteristics, such as compact bush, erect growth habit with an average height of 94 cm, the average mass per 1000 soybeans of 178 g and an average vegetation period of 122 days [23,24].
2.2. Field Experimental Design and Crop Management at the Agricultural Research and Development Station Turda-Cluj, Romania
The field experiments were based on the subdivided parcel method with soil cultivation systems occupying large plots and with herbicide treatments applied to the small, overlapping parcels. The experimental parcel size was 48 m2. The field experiments were bifactorial, including the soil tillage systems: conventional (sms1), minimum tillage (sms2) and no-tillage (sms3), with no weed control (wct1) and two weed control methods (wct2 and wct3), as shown in Table A1. The soil type was faeoziom with a content of 3.16% humus (organic carbon content 1.83), 51.8–55.5% clay (clay texture), total nitrogen content 0.226%, available phosphorus 73 ppm; potassium 295 ppm, apparent density 1.28 g/cm3, wilting coefficient 18%, field water capacity 32%; and pH (H2O) 6.75 at a depth of 0–30 cm.
Tillage system: The conventional system (sms1) was done by plow at 30 cm depth, and preparation of the germinating bed before sowing was done by a rotary harrow that grinds the soil at the 10 cm depth. The minimum tillage soil system (sms2) was performed with the chisel plow and with the rotary harrow used for crushing soil at 10 cm in depth. The no-tillage system (sms3) was carried out using the direct sowing machine
Sowing: Soybean sowing was done on 20 April, at 18 cm between the rows for the weed control system [25]. The soybeans were planted 5 cm deep with a seed density of 65 soybeans germinated per m2. The precursor plant in the rotation for soybean culture was corn.
Weed control: No weed control (wct1), 1st weed control (wct2: S-metolaclor 960 g/L, imazamox 40 g/L and propaquizafop 100 g/L, with 1.5 l/ha; 0.8 L/ha and 1.5 L/ha, post I) and 2nd weed control (wct3: dimetenamid 720 g/L, bentazon 480 g/L and fluazifop-P-butil 150 g/L, with 1.2 L/ha; 2.5 L/ha and 1.5 L/ha). The pre-emergent herbicides were applied ppi (pre plant incorporated) at 3–4 cm depth before sowing, and the post-emergent ones in the phenophase of 3–5 leaves of the soybean crop and the weeds in the rosette phase.
Harvesting: Soybean harvesting was done on September 28, using the experimental plot combining Wintersteiger with a working width of 1.4 m. Soybeans obtained from each variant of all four repetitions were weighed individually, calculated at 12% STAS and reported per hectare.
Climatic conditions: The climatic conditions (temperature and precipitation) were recorded at the Agricultural Research and Development Station (SCDA), Turda-Cluj, Romania, during the growing periods from 2014–2016 (longitude 23°46’59” E, latitude 46°34’0” N, Köppen climate type: Dfb: warm summer, humid continental climate)
2.3. Yields and Isoflavone Contents of Soybean Grown during 2014–2016
During the three experimental years (2014, 2015 and 2016), climatic conditions (Figure A1) were monitored, and three different soil tillage systems (conventional, minimum tillage and no-tillage systems) (Table A1) were employed to determine their impacts on the yields and isoflavone concentration of soybeans harvested during these years.
2.4. Isoflavone Extraction and High-Performance Liquid Chromatography (HPLC) Analysis
Isoflavone Extraction: The isoflavone analysis was performed as described previously [4]. All soybean seeds were carefully hand-selected to eliminate any defected/damaged beans, then finely ground and stored at −80 °C until extraction. 250 mg of grounded soy samples were extracted with 25 mL of 45% (v/v) methanol and shaken at room temperature for 48 h (Thermo-Scientific VWR, Batavia, IL, USA). After centrifugation for 20 min at 4000 rpm, the supernatant was transferred into 1 mL vials ready for the HPLC analysis.
HPLC Analysis: The quantitative analysis of isoflavones from all soy samples was performed by high-performance liquid chromatography on a Waters model 2695 equipped with Waters 2998 photodiode array detector [4,26]. The isoflavone separation was conducted through a reverse-phase column (150 mm × 2.1 mm i.d., 4 µm, Nova-Pak C18; Waters, Milford, MA, USA). The eluting solvent included a linear gradient of acetonitrile (solvent A) and acetonitrile/methanol 3:1 (v/v) (solvent B) for 60 min with the flow rate of 0.8 mL/min. A representative chromatogram of the five isoflavones analyzed shows the peaks corresponding to each of the isoflavones. Daidzin, glycitin, genistin, daidzein and genistein peaks were identified by their retention times and confirmed with their standards. Quantification of the isoflavones was done by the external standard method with genuine standards purchased from Sigma-Aldrich (St. Louis, MO, USA). The calibration solutions were prepared by serial dilution of the individual stock solution of different concentrations (2–10 µM). The relationship between the peak and the known concentrations of the standards was used to quantify each isoflavone. The standard curve for each isoflavone and the correlation coefficients were obtained using the linear regression model in SPSS Statistics. The correlation coefficient of each calibration curve for the standards was greater than 0.99.
2.5. Statistical Analyses
Two-way ANOVA was performed to validate statistically significant differences among the soil tillage treatments (mean) in the same year and between the means of different years and the same soil tillage systems. When the null hypothesis was rejected, Tukey’s honestly significant difference test using a p < 0.05 significance level was applied to determine the statistically significant differences between the means. Precisely, the field experiments were based on the subdivided parcel method with the 3 tillage systems occupying the large plots and weed treatments applied to the small, overlapping parcels. There were 3 large plots for every tillage system that were replicated three times every season (3 × 3 × 3). Within every large plot we had overlapping smaller plots with the 3 different weed control treatments (3 × 3 × 3 = 27 experimental plots). From each of the 27 experimental plots, we collected 4 samples (27 × 4 = 108 samples). We repeated the experiment in 3 different years, 2014–2016, and we collected the same 108 samples each year (108 × 3 = 324 samples). Values shown are means ± S.E. (n = 3 for field experiments and n = 4 for HPLC analyses). In addition, the environmental factors (monthly temperature and precipitation during the growing season (5 months) from March to July) and isoflavone concentration were correlated by principal component analysis (PCA) using SPSS Statistics 19.
3. Results
3.1. Experimental Year 2014
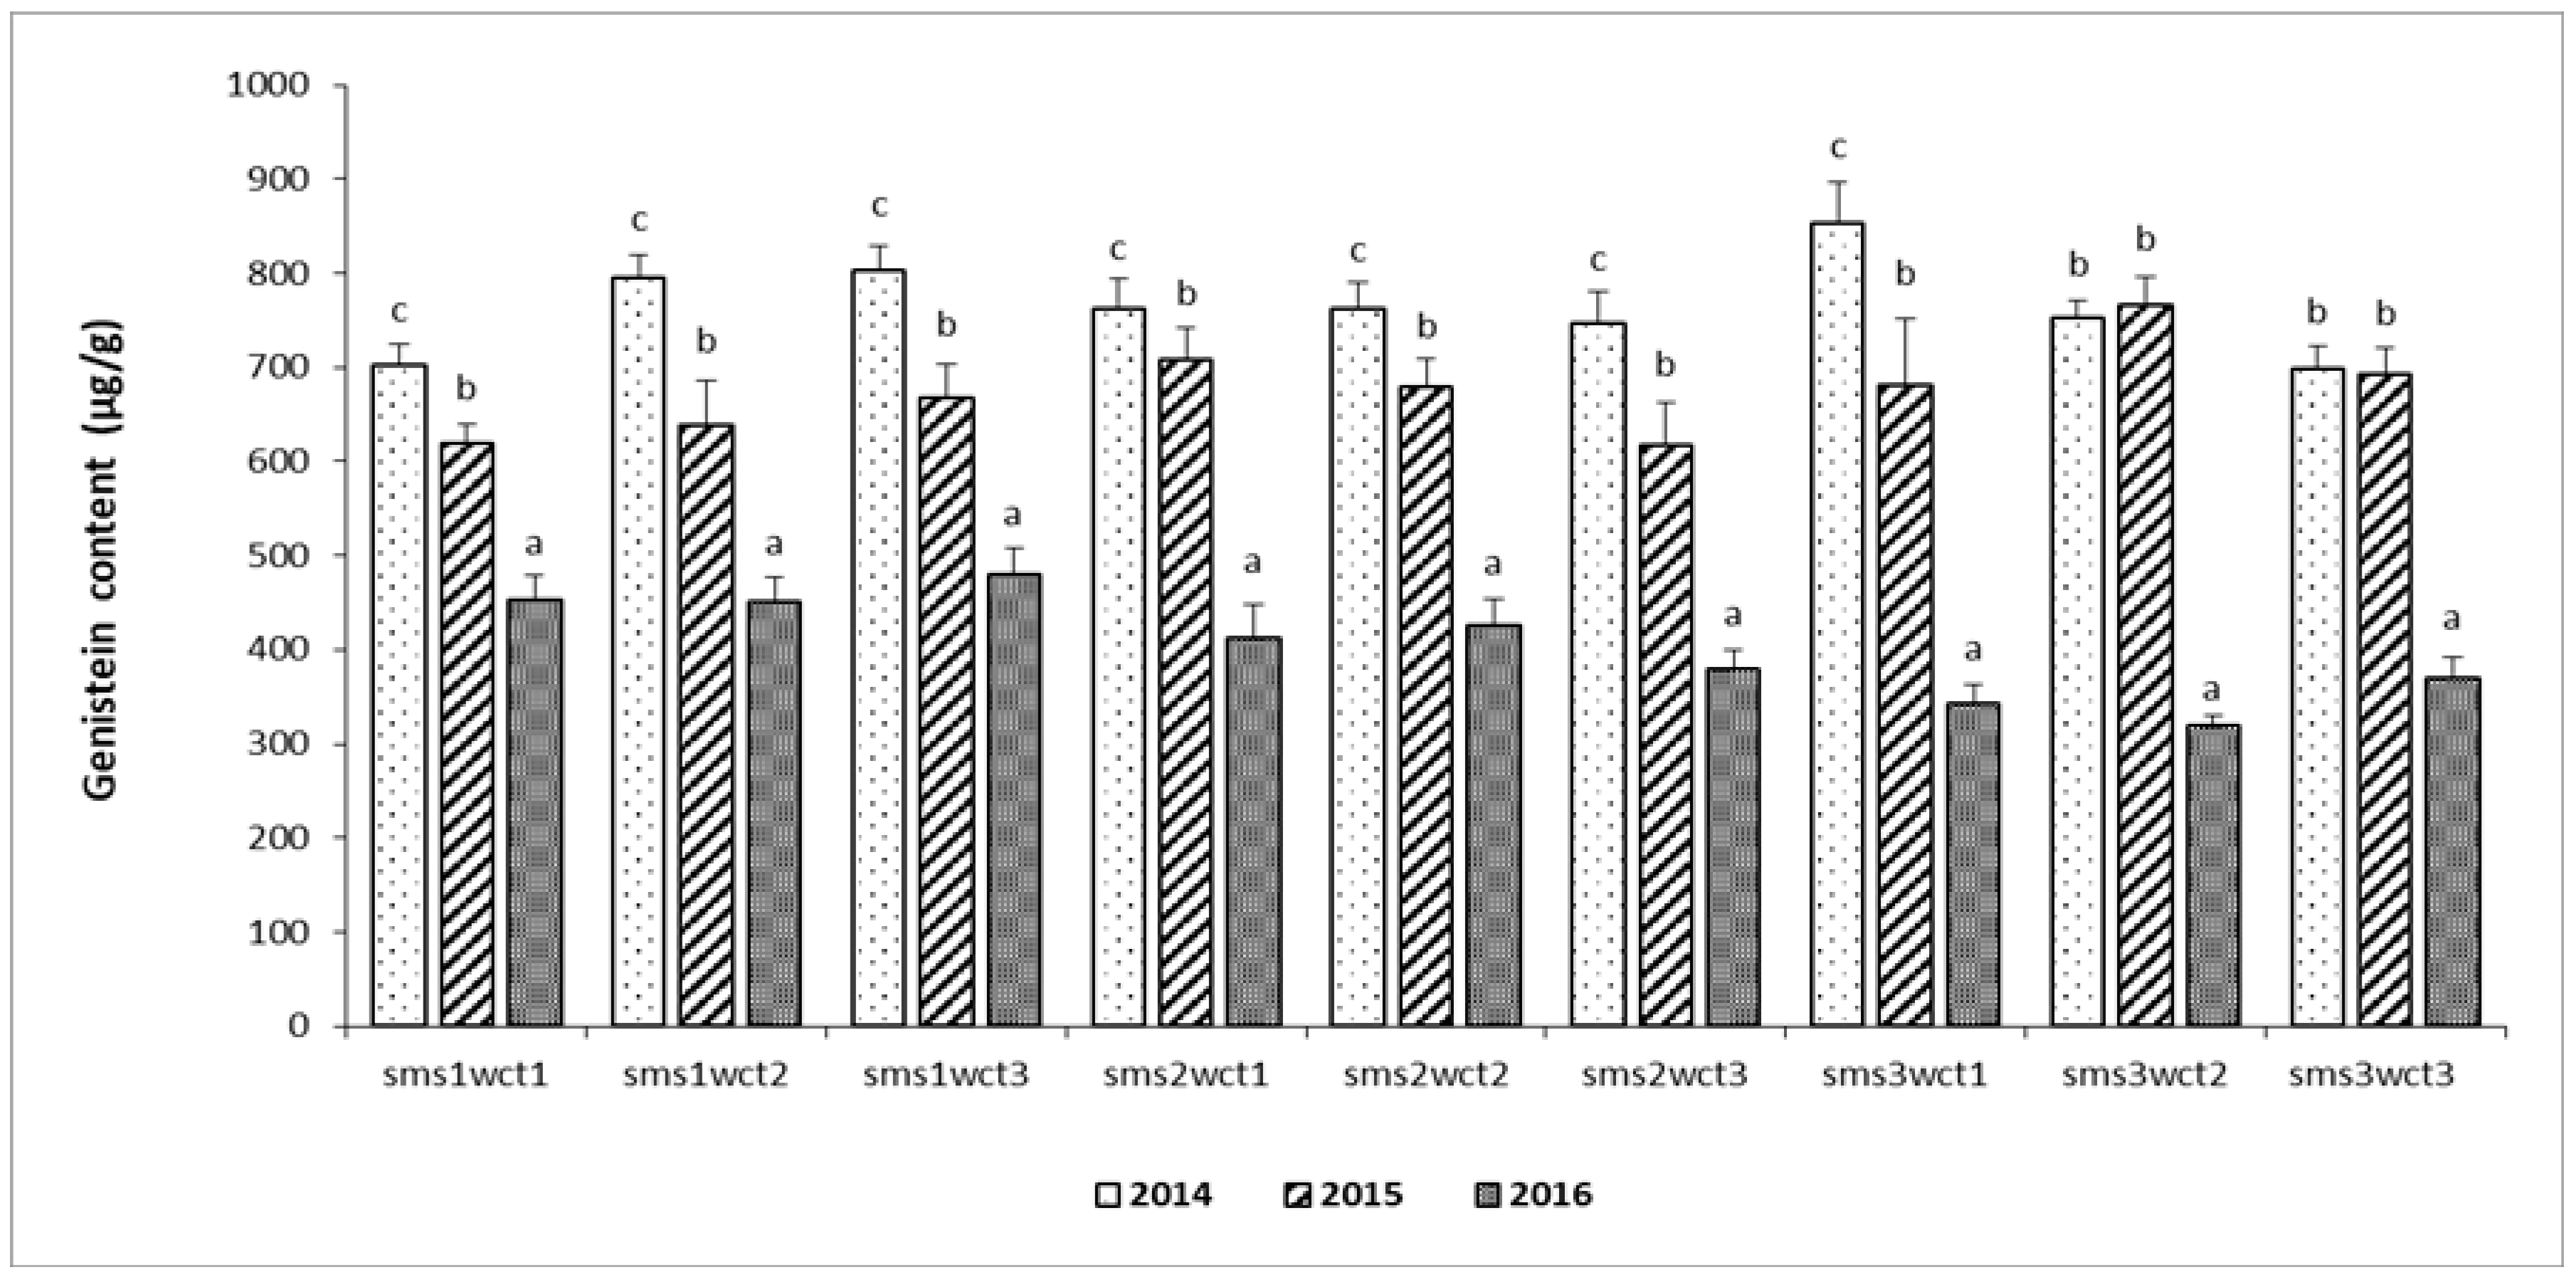
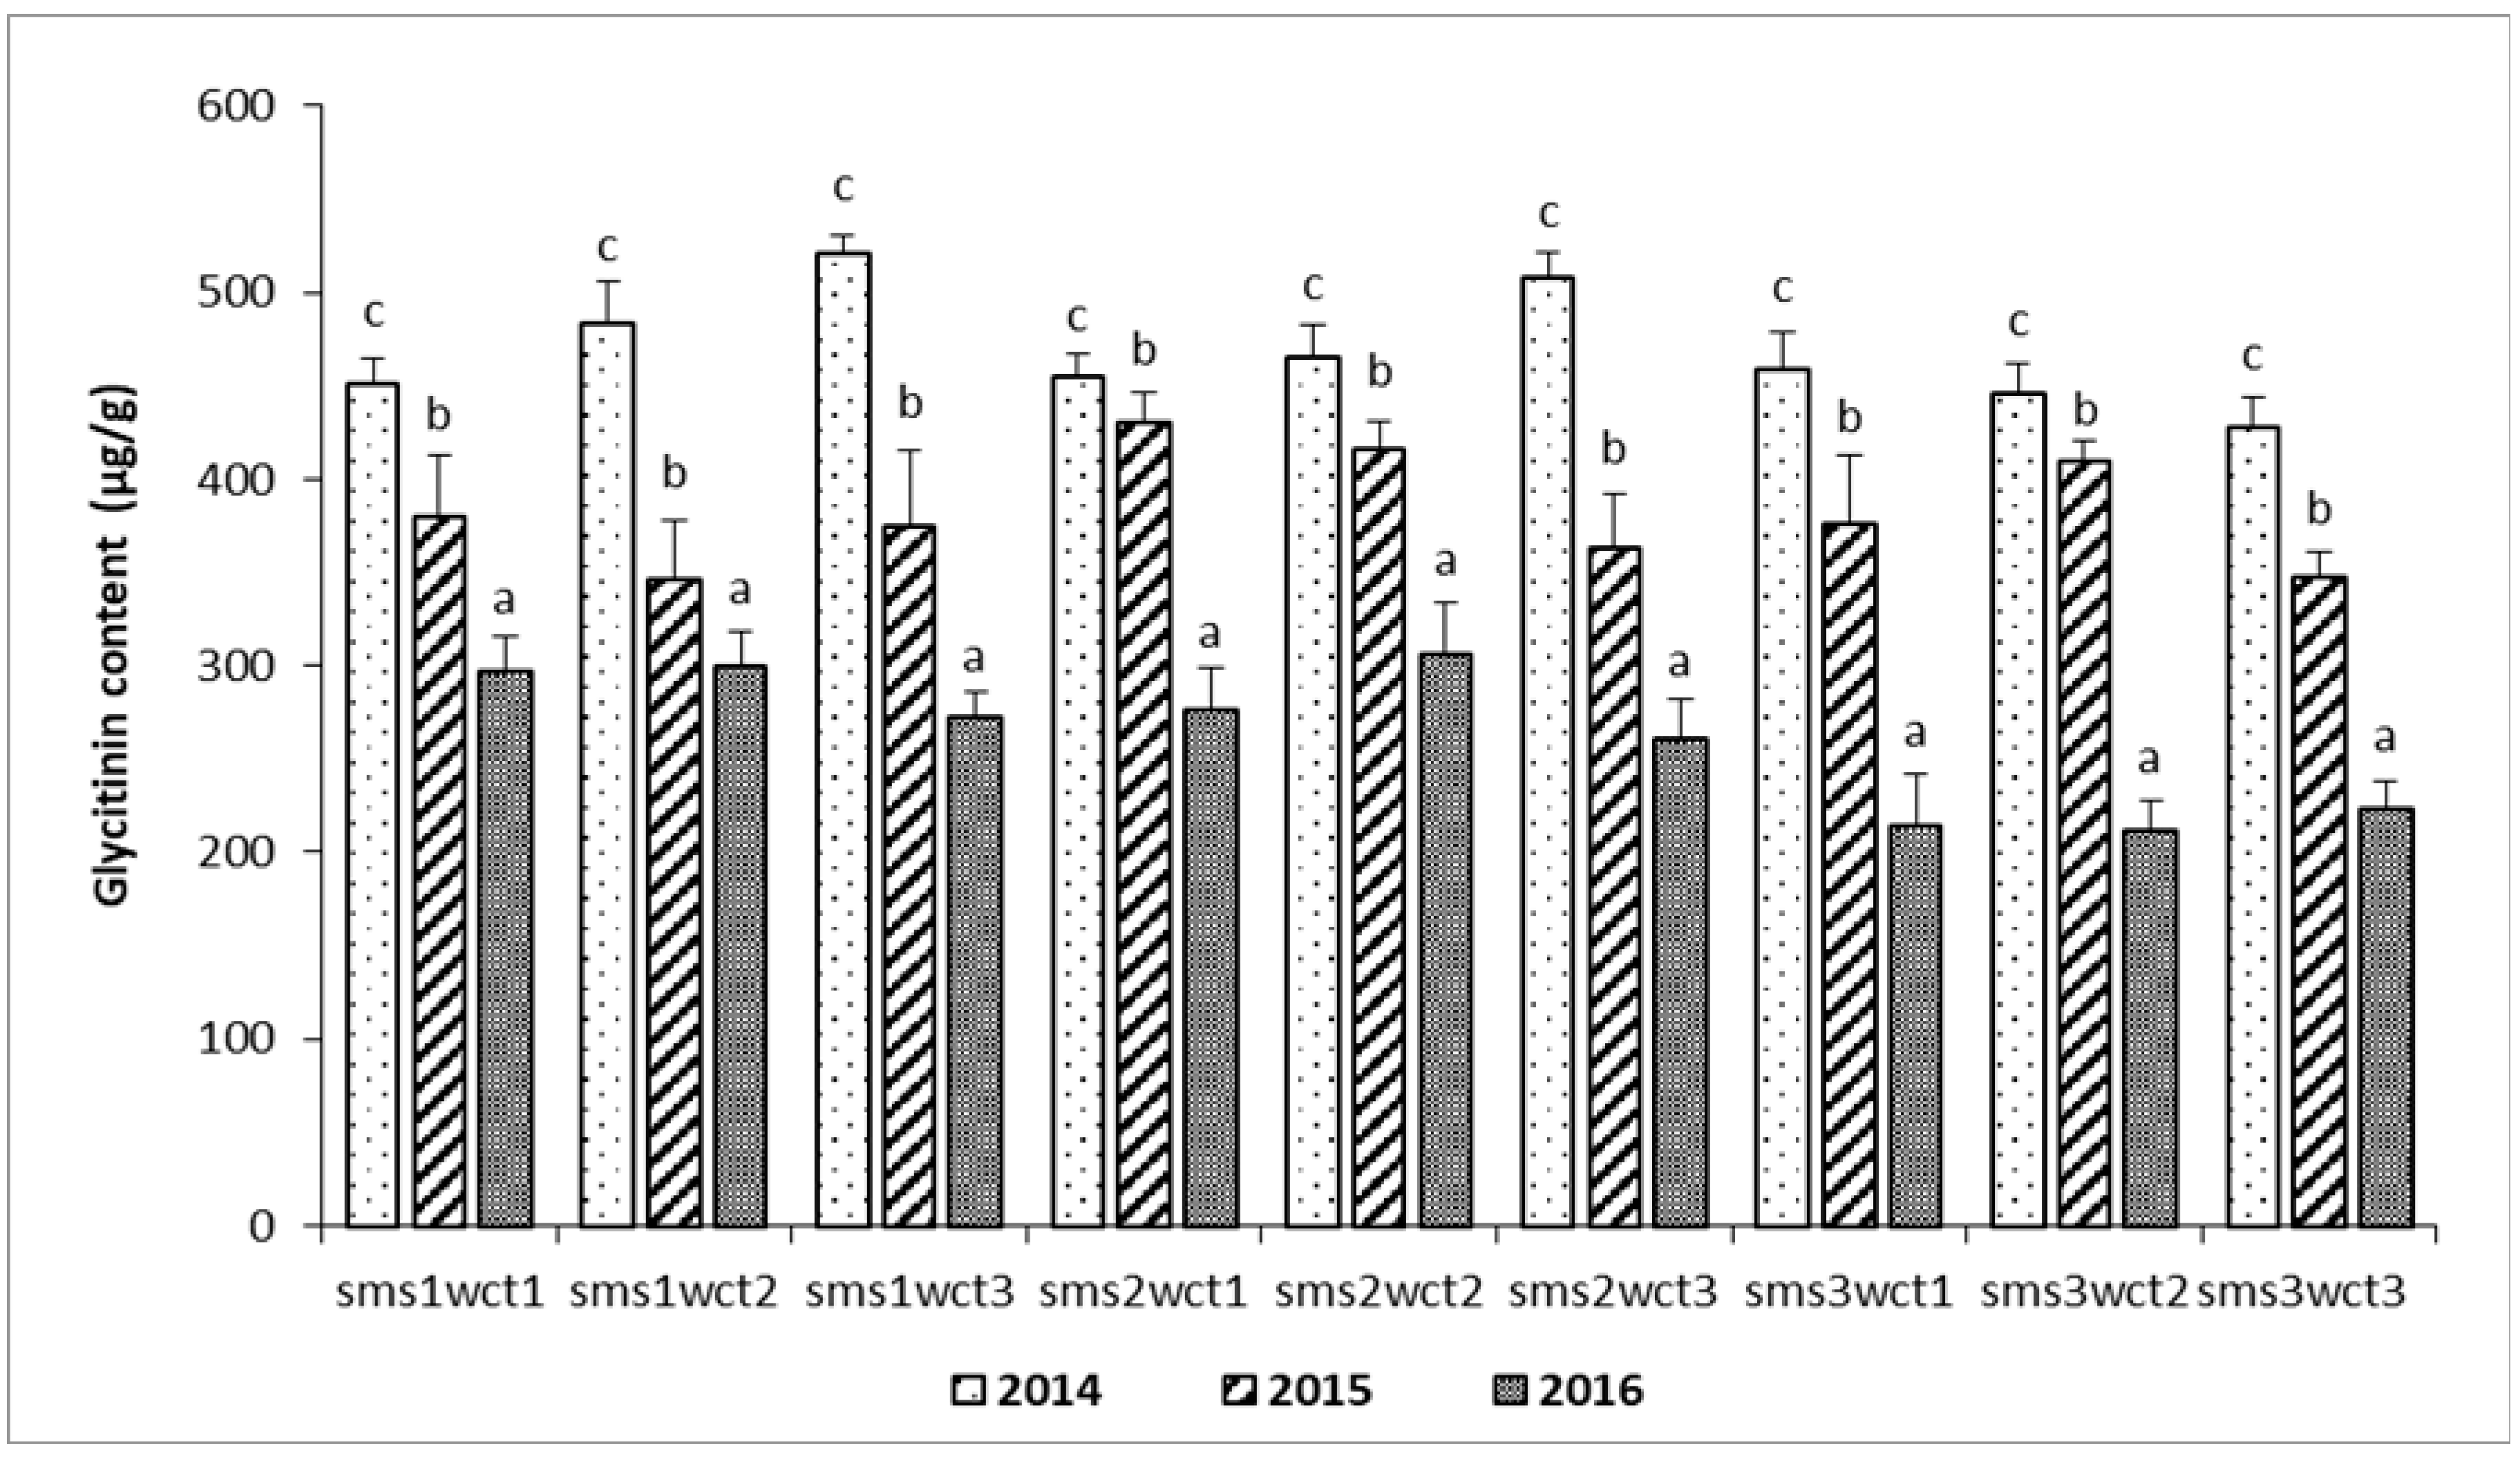
As shown in Table A2, several factors affected the quantity of soybeans grown in Romania in 2014. One important factor influencing soybean yield was the soil tillage system along with the degree of weed infestation of the soybean crop. In the conventional soil tillage system without weed control, the annual dicotyledonous weeds (2–9 weeds/m2) predominate, and the monocotyledon weeds represent 0.25–2.25 weeds/m2. Similarly, there is also a weed infestation of the minimum tillage and no-tillage systems with no weed control; dicotyledonous weeds with 2–31 weeds/m2, and the annual monocotyledons between 0.25–5.5 weeds/m2. Without the application of weed control treatments (wct1), the production was 385–429 kg/ha, compared with 1921–2167 kg/ha, when the two different types of weed control systems where applied. The higher production of 2167 kg/ha in the conventional system was followed by 2015 kg/ha in the minimum tillage system and 1950 kg/ha in the no-tillage system with the 1st weed control. The weed controls increased the crop yields significantly, compared to no weed control in the year 2014 (p < 0.05) (Table A2). In addition, the soybeans harvested in 2014 showed significant differences in the concentration of individual isoflavone (daidzin, daidzein, genistin, genistein and glycitin) depending on soil tillage systems. The daidzin concentration was the lowest (2077 ± 180 µg/g) in the conventional soil tillage system with the 2nd weed control (wct3), but its concentration increased (2599 ± 75 µg/g) in the direct seeding system with no herbicide (p < 0.05) (Figure A2). In regard to daidzein, the higher concentration (605 ± 47 µg/g) was found when no tillage with no weed control (wct1) was applied, and the lower concentration (505 ± 31 µg/g) in the conventional soil tillage system with no weed control (wct1) (p < 0.05) (Figure A3). There was also a significant difference in the concentration of genistin; the highest concentration of 2961 ± 397 µg/g in the conventional system with the 1st weed control (wct2) and the lowest at 2597 ± 352 µg/g in the no-tillage system with the 2nd weed control (wct3) (p < 0.05) (Figure A4). Unlike genistin, the higher genistein concentration (852 ± 44 µg/g) was with a no-tillage system with no weed control (wct1), but the lower genistein concentration (698 ± 24 µg/g) was from the no-tillage system with the 2nd weed control (wct2) (Figure A5). The glycitin concentration was also affected by the soil tillage systems and the weed controls (from 427 ± 16 µg/g to 521 ± 9 µg/g) (Figure A6). However, the three different soil tillage systems had little effect on the total isoflavone concentrations (6892 ± 561 µg/g (conventional), 6833 ± 600 µg/g (minimum tillage) and 7107 ± 526 µg/g (no-tillage)) in the field year 2014. Although the total isoflavone concentration under the no-tillage system was higher than the conventional soil system (Table A3), the difference was found to be not significant statistically.
3.2. Experimental Year 2015
Like the previous year, the yields of soybeans were greatly influenced by soil tillage systems with and without weed control in 2015 (p < 0.05) (Table A2). The lower crop yields of 488–496 kg/ha were obtained with no weed control (wct1), compared to 1974–2243 kg/ha with both weed controls (wct2 and wct3). Like 2014, the highest yield of 2243 kg/ha in the conventional system was followed by 2076kg/ha in the minimum tillage system and 1991kg/ha in the no-tillage system with the 1st weed control. The average isoflavone concentration in 2015 was higher than in 2014 (Table A3). Soil tillage systems also influenced differently the individual isoflavones in 2015. The higher daidzin concentration (3659 ± 107 µg/g) was obtained with a conventional system with no weed control and the lowest (3102 ± 135 µg/g) from the minimum tillage system without weed control (Figure A2). Daidzein was higher (623 ± 18 µg/g) with a no-tillage system without weed control and lower (501 ± 17 µg/g) with no-tillage with the 2nd weed control (wct3) (p < 0.05) (Figure A3). In addition, there were significant differences in genistin concentration; the higher (3623 ± 246 µg/g) under the no tillage system with the 2nd weed control and the lowest (2522 ± 232 µg/g) under the conventional system with 1st weed control (p < 0.05) (Figure A4). Regarding genistein, the concentrations were between 620 and 766 µg/g, which was lower than in 2014 (p < 0.05) (Figure A5). In addition, there was a significant difference in glycitin concentration (346 ± 31 µg/g to 430 ± 16 µg/g) depending on soil tillage and weed control systems (Figure A6). However, as in 2014, the three different soil tillage systems had no adverse effects on the total isoflavones (7674 ± 405 µg/g (conventional), 7729. ± 437 µg/g (minimum tillage) and 8563. ± 449 µg/g (no-tillage)) for the field year 2015 (Table A3), despite some variations in the individual isoflavone concentration (daidzin, genistin, glycitin, daidzein, genistein) (Figure A2, Figure A3, Figure A4, Figure A5 and Figure A6). In fact, the average isoflavone concentration of soybeans harvested under the direct soil system was significantly higher than those in the conventional and minimum tillage systems. Notably, the isoflavone concentration of soybeans harvested under the no-tillage soil system with the second weed control was significantly higher than those of the conventional and minimum tillage systems under the same weed control (p < 0.05).
3.3. Experimental Year 2016
As in 2014 and 2015, the soil tillage systems with and without weed control had a significant influence on soy production in 2016 (p < 0.05) (Table A2). The highest production (3012.00 kg/ha) was recorded with the conventional system, followed by the minimum tillage system (2980kg/ha) and no-tillage system (2874kg/ha) under 1st weed control (Table A2). In addition, like the previous two years, daidzin and genistin were influenced by soil tillage and weed control systems (Figure A2 and Figure A4). Daidzin was significantly higher (3626 ± 72 µg/g) with the minimum tillage system without weed control (wct1) and lowest (3103 ± 74 µg/g) in the conventional soil system with 2nd weed control (p < 0.05) (Figure A2). The concentration of genistin was higher (3858 ± 141µg/g) in the conventional soil system with 1st weed control (wct2) and lowest (3286 ± 106 µg/g) in the minimum tillage system with 2nd weed control (wct3) (p < 0.05) (Figure A4). Likewise, genistein concentration was higher under the conventional soil tillage system (479 ± 28 µg/g) than in both the minimum tillage (380 ± 20 µg/g) and no-tillage systems (318 ± 11 µg/g) (Figure A5). The concentration of daidzein and glycitin were also affected by soil tillage and weed control systems (Figure A3 and Figure A6). Daidzein’s concentration was higher (596 ± 22 µg/g) under minim tillage, and lower in no-tillage (532 ± 23 µg/g). Glycitin concentration was highest (305 ± 28 µg/g) in minimum tillage and lowest in no-tillage (211 ± 15 µg/g). Like the two previous years, there was no significant difference in total isoflavone between the soil tillage systems (Table A3). Furthermore, like the two previous years (2014 and 2015), there was no impact from each weed control method on the total isoflavone under the different soil tillage systems in the field year 2016 (Table A3).
3.4. Comparison of Soybean Yields and Isoflavone Concentrations for 2014–2016
When the average soybean yields were compared during 2014–2016 field years, the highest was the 2016 field year with 2109 kg/ha, followed by 2015 (1544 kg/ha) and 2014 (1473 kg/ha (Table A2). In fact, the data are in line with previous reports [16,17,18,27], suggesting that the field year factors (e.g., temperature and precipitation) may contribute significantly to soybean yields. In particular, the fluctuation of precipitation in the months of June and July may be critical in soybean yield, although other environmental factors cannot be disregarded (Figure A7). As with the yield, significant differences in individual isoflavone concentrations were found during the three field years. The daidzin concentration was significantly lower in 2014 compared with the other two years (p < 0.05) (Figure A2). However, the concentration of daidzein was not much affected by the years: 552 ± 4 µg/g to 572 ± 10 µg/g (Figure A3). Unlike daidzein, a significant disparity in genistin’s concentration was also found during 2014–2016; the highest concentration in 2016 (3293 ± 9 µg/g), followed by 2015 (2930 ± 261 µg/g) and 2015 (2834 ± 22 µg/g) (Figure A4). In contrast to genistin, we noticed the highest total genistein concentration in 2014 (763 ± 35 µg/g), followed by 674 ± 20 µg/g in 2015 and 403 ± 8 µg/g in 2016 (Figure A5). Similar patterns were found for glycitin; the highest concentration in 2014 (467 ± 12 µg/g), followed by 382 ± 10 µg/g in 2015 and 262 ± 2 µg/g in 2016 (Figure A6). Because climatic conditions were reported to influence the concentration of individual isoflavone in soybeans [16,27], temperatures and precipitation were recorded during the field years (2014–2016) at Turda Weather Station in Romania in order to determine their potential effects on isoflavone concentration in the soybeans (Figure A1). The average temperature during the soybean growing season in Turda, Romania was 12 °C in April and 21 °C in July, respectively. However, the average annual precipitation was much higher in 2016 (816.8 mm) than in 2015 (641.2 mm) and 2014 (520.6 mm), suggesting that temperatures and precipitation in the growing season may have important impacts on isoflavone concentrations (Figure A7). This is actually consistent with other previous reports that soil moisture is likely to increase the concentration of daidzin and genistin [28]. Furthermore, our data suggest that daidzin may be significantly affected by the temperature during the month of June (with an average of 19.2 °C), even though there was little correlation between temperature and daidzein concentration (Figure A2, Figure A3, Figure A4 and Figure A7). In regard to total isoflavone, the average of total isoflavones in the field year 2016 was highest with 8129 ± 307 µg/g under all three soil systems, followed by 2015 (7989 ± 430 µg/g) and 2014 (6944 ± 562 µg/g) (Table A3). Nonetheless, the data imply that the higher total isoflavone concentrations in 2016 may be attributed partially to higher precipitation during the growing season, suggesting that environmental factors may have more influence on isoflavones concentration than soil tillage systems. Because there is no statistical difference in the average isoflavone concentration for the three years, we investigated the variance of isoflavone’s concentration under each soil system. Under the conventional soil system, the average isoflavone concentration of soybeans harvested in 2016 was significantly higher than those in 2014 under all weed controls (p < 0.05). In addition, the concentration of isoflavones of soybeans harvested in 2015 was significantly higher than that in 2014 under no weed control (1st weed control) (p < 0.05). Under the minimum tillage system, the average isoflavone concentration of soybeans harvested in 2016 was significantly higher than that in 2014 under all weed controls (p < 0.05). Under the no-tillage system, the average isoflavone concentration of soybeans harvested in 2015 was significantly higher than that in 2014 under all weed controls (p < 0.05). In addition, the isoflavone concentration of soybeans harvested in 2015 was significantly higher than that in 2014 under all weed controls (wct1, wct2 and wct3) (p < 0.05). In addition, the concentration of isoflavones of soybeans harvested in 2016 was significantly higher than that in 2014 under the 3rd weed control (wct3) (P < 0.05). In fact, the data suggest that these differences may be attributed to the climatic conditions of each year, not the soil tillage systems used in this study because there was no significant difference each year. These data point out an important fact that two conservative soil tillage systems (minimum tillage and no-tillage systems) had no negative effects on total isoflavone concentration, compared to the conventional soil system in each field year for 2014–2016 (Table A3). Furthermore, our data suggest that the soybean yields will be improved significantly with the weed controls (wct2 and wct3) under all three different soil tillage systems without a significant change in the total concentration of isoflavone (Table A2 and Table A3).
4. Discussion
Like previous reports [12,15,16,28,29], our experimental results indicate that the field year factors (e.g., temperature and precipitation) may contribute significantly to soybean yields (Figure A7). In particular, the fluctuation of precipitation in June and July may be crucial for soybean yield, although other environmental factors cannot be disregarded. Significant interactions were found between soybean production, temperature, and precipitations in June, in every year of cultivation (r = 0.95), an aspect which might be explained by the fact that in this month, the high quantity of precipitations and high temperatures considerably stimulate plant development and soybean production. It is worth mentioning that this phenomenon was observed in all soil tillage systems which were applied. Our results indicate that the three different soil tillage systems had no significant effect on the total concentration of isoflavone under the three different soil systems, although the individual isoflavone concentration (daidzin, genistin, glycitin, daidzein, genistein) showed some variations under these soil systems (Figure A2, Figure A3, Figure A4, Figure A5 and Figure A6). This study also showed that soybeans (Felix variety) cultivated in Romania contain genistin and daidzin as the predominant isoflavone, followed by their aglycones (genistein and daidzein), as previously reported [29,30]. In addition, glycitin was the isoflavone with the lowest concentration in the Felix variety, as per other reports [29,30,31]. However, we noticed significant variations in all five isoflavone concentrations during the three experimental years, highlighting that the climatic conditions may play a critical role during the growing period in the variation of isoflavone concentrations in the Felix variety. In fact, these data are in line with several previous reports showing that environmental conditions have predominant effects on isoflavone concentration in soybeans [28,32,33,34,35]. Consistently, higher isoflavone concentrations were obtained from soybeans harvested in 2016, which recorded lower temperatures and highest precipitation during the seed development than the previous two years [32,33,34,35].
Moreover, we found that the concentrations of genistin and daidzin were significantly influenced by relatively high precipitation, specifically in May and June, while the concentration of glycitin was minimally affected by this factor. These results are consistent with a previous finding which reported that soil moisture could increase the concentration of daidzin and genistin, but not glycitin’s concentration. Interestingly, other research has suggested that environmental factors could have a significant effect on isoflavone concentration for different soybean cultivars [28]. For instance, when two French soybean cultivars (Imari and Queen) and three U.S. cultivars (Dwight, Jack and Londa) were tested under different environmental conditions, the results showed that environmental factors such as soil moisture and air temperature could have significant effect on isoflavone concentrations in different soybean cultivars [28]. Based on the principal component analysis (Figure A7), temperatures and precipitation in the growing season may have an important impact on isoflavone concentrations. However, our data indicate that the minimum tillage and no-tillage systems may not have negative effects on the concentration of total isoflavone in soybeans, compared to the conventional soil system (Table A3), although environmental factors may have an impact on the concentration of individual isoflavones. Our data suggest that minimum tillage and no-tillage systems may be employed in soybean farming to meet imperative cultivation needs. In fact, finding a proper soil tillage system without impact on total bioactive components is an important issue in Europe, due to serious soil erosion and reduced fertility in limited farmlands. This study implies that minimum tillage/no tillage-type soil management systems may be used as proper soil tillage systems in cultivating soybeans, without a significant loss of total isoflavone concentration.
5. Conclusions
Total isoflavone concentration is an essential matter for soybean farmers and consumers. However, their concentration is likely to be influenced by external factors, such as climatic conditions and soil tillage systems. In particular, finding a proper soil tillage system is a very urgent issue in Europe due to limited farmlands. This study shows that the minimum tillage and no-tillage systems may not have a negative impact on the total isoflavone concentration in soybeans, compared to the conventional soil tillage system. Altogether, this study suggests that the minimum tillage and no-tillage systems may be used as proper soil tillage systems in cultivating soybeans, without a negative impact on total isoflavone concentration.
Author Contributions
Conceptualization: L.M., D.C., O.B., T.R., T.T.Y.W. and J.B.P.; methodology: L.M., D.C. and J.B.P.; software: L.M. and D.C.; validation: L.M. and D.C.; formal analysis: L.M. and D.C.; investigation: L.M., D.C. and J.B.P.; resources: L.M., D.C. and J.B.P.; writing—original draft preparation: L.M., D.C. and J.B.P.; writing—review and editing: D.C., T.T.Y.W. and J.B.P.; supervision: D.C. and J.B.P.; funding acquisition: L.M., D.C., O.B., T.R., T.T.Y.W. and J.B.P. All authors have read and agreed to the published version of the manuscript.
Funding
This research was funded by MCI-UEFISCDI, project number 37 PFE-2018-2020, “Cresterea performantei institutionale prin mecanisme de consolidare si dezvoltare a directiilor de cercetare din cadrul USAMVCN”. In addition, this study was partially funded by USDA (project number 1235-51000-054-00D).
Acknowledgments
This work was supported by the collaboration protocol between the University of Agricultural Sciences and Veterinary Medicine Cluj-Napoca, Romania, and the Department of Agriculture—Research, Education and Economics of the United States: Non-financed CA, no. 41240/01.01.2016, “Investigation of phytochemical and macronutrient properties of soy cultivated in Romania, 2016–2020”. Support was also provided by the Romanian Ministry of Research and Innovation: PN-III-P1-1.2-PCCDI-2017-0056, 946/SMIS 14064, and POC-A1-A1.1.1-B-2015. Mureșana conducted all analytical and statistical analyses for this paper. The authors also wish to acknowledge Renee C. Peters, Quynhchi Pham and Haiqiu Huang from the Nutrition, Genetics and Immunology Laboratory at USDA, USA, for all the support of this research.
Conflicts of Interest
The authors declare no conflict of interest.
Appendix A

Table A1.
The layout of soil tillage systems with weed controls.
| No. | Conventional Soil Tillage with and without Weed Controls | No. | Minimum Tillage with and without Weed Controls | No. | No-tillage with Weed and without Controls |
|---|---|---|---|---|---|
| 1 | sms1wct1 | 4 | sms2wct1 | 7 | sms3wct1 |
| 2 | sms1wct2 | 5 | sms2wct2 | 8 | sms3wct2 |
| 3 | sms1wct3 | 6 | sms2wct3 | 9 | sms3wct3 |
sms1: conventional soil system with plow: plow + seedbed preparation with rotary harrow + seeding + fertilizer; sms2: the minimum tillage system: tillage + seedbed preparation with rotary harrow + seeding+ fertilizer; sms3: no tillage system: seeding + fertilizer; wct1: no herbicide; wct2: S-metolaclor 960 g/L; Imazamox 40 g/L + Propaquizafop 100 g/L –1.5 L/ha; 0.8 L/ha + 1.5 L/ha post I; wct3: Dimetenamid 720 g/L; Bentazon 480 g/L + Fluazifop-P-butil 150 g/L–1.2 L/ha; 2.5 L/ha + 1.5 L/ha.
Table A2.
The effect of soil tillage systems on soybean yield at the experimental site 2014–2016. Different lowercase letters indicate significant differences between the means of the same soil tillage systems in the same year of field, while capital letters indicate significant differences between the means of different years and same soil tillage systems according to Tukey’s HSD test (p ≤ 0.05).
| Year Crop Yield (kg/ha) | |||
|---|---|---|---|
| Soil Systems | 2014 | 2015 | 2016 |
| sms1wct1 | 429 ± 11 aA | 496 ± 15 aB | 521 ± 19 aC |
| sms1wct2 | 2167 ± 183 bA | 2243 ± 198 bA | 3012 ± 111 bB |
| sms1wct3 | 2048 ± 176 bA | 2152 ± 189 bA | 2952 ± 96 bB |
| Average | 1548 ± 123 | 1630 ± 134 | 2161.91 ± 75 |
| sms2wct1 | 397 ± 7 aA | 492 ± 16 aB | 510 ± 18 aB |
| sms2wct2 | 2015 ± 189 bA | 2076 ± 177 bA | 2980 ± 89 bB |
| sms2wct3 | 1943 ± 163 bA | 1974 ± 170 bA | 2834 ± 73 bB |
| Average | 1451 ± 120 | 1514 ± 121 | 2108 ± 60 |
| sms3wct1 | 385 ± 7 aA | 488 ± 14 aB | 492 ± 17 aB |
| sms3wct2 | 1950 ± 175 bA | 1991 ± 168 bA | 2874 ± 78 bB |
| sms3wct3 | 1921 ± 180 bA | 1986 ± 171 bA | 2812 ± 118 bB |
| Average | 1418 ± 121 | 1488 ± 118 | 2059 ± 71 |
| Total Average | 1473 ± 12 | 1544 ± 14 | 2109 ± 9 |
Table A3.
Total isoflavone concentration in soybeans for 2014–2016, three soil systems. Different lowercase letters indicate significant differences between the means of the soil tillage systems in the same year, while capital letters indicate significant differences between the means of different years but the same soil tillage systems according to Tukey’s HSD test (p ≤ 0.05).
| Year | 2014 | 2015 | 2016 |
|---|---|---|---|
| Total Isoflavones | Amounts (µg/g) | Amounts (µg/g) | Amounts (µg/g) |
| sms1wct1 | 6800 ± 510 aA | 7854 ± 405 bB | 8172 ± 319 bC |
| sms1wct2 | 7131 ± 528 bA | 7569 ± 449 aA | 8433 ± 260 cB |
| sms1wct3 | 6744 ± 644 aA | 7598 ± 361 aA | 8256 ± 238 bB |
| Average | 6892 ± 561 | 7674 ± 405 | 8287 ± 272 |
| sms2wct1 | 6843 ± 577 aA | 7857 ± 449 bB | 8575 ± 270 cC |
| sms2wct2 | 6960 ± 613 aA | 7677 ± 382 aB | 8097 ± 404 bB |
| sms2wct3 | 6696 ± 610 aA | 7653 ± 481 aB | 7701 ± 362 aB |
| Average | 6833 ± 600 | 7729 ± 437 | 8124 ± 345 |
| sms3wct1 | 7493 ± 601 cA | 8457 ± 490 cC | 8181 ± 297 bA |
| sms3wct2 | 7097 ± 492 bA | 8778 ± 428 dC | 7909 ± 313 aA |
| sms3wct3 | 6731 ± 484 aA | 8455 ± 430 cC | 7834 ± 297 aB |
| Average | 7107 ± 526 | 8563 ± 449 | 7901 ± 302 |
| Total average | 6944 ± 562 | 7989 ± 430 | 8129 ± 307 |
Figure A1.
Thermic and pluviometric chart. The average precipitation (represented by lines) and temperature (represented by bars) determined at the experimental site in Turda, Romania, during the growing period (2014–2016).
Figure A1.
Thermic and pluviometric chart. The average precipitation (represented by lines) and temperature (represented by bars) determined at the experimental site in Turda, Romania, during the growing period (2014–2016).
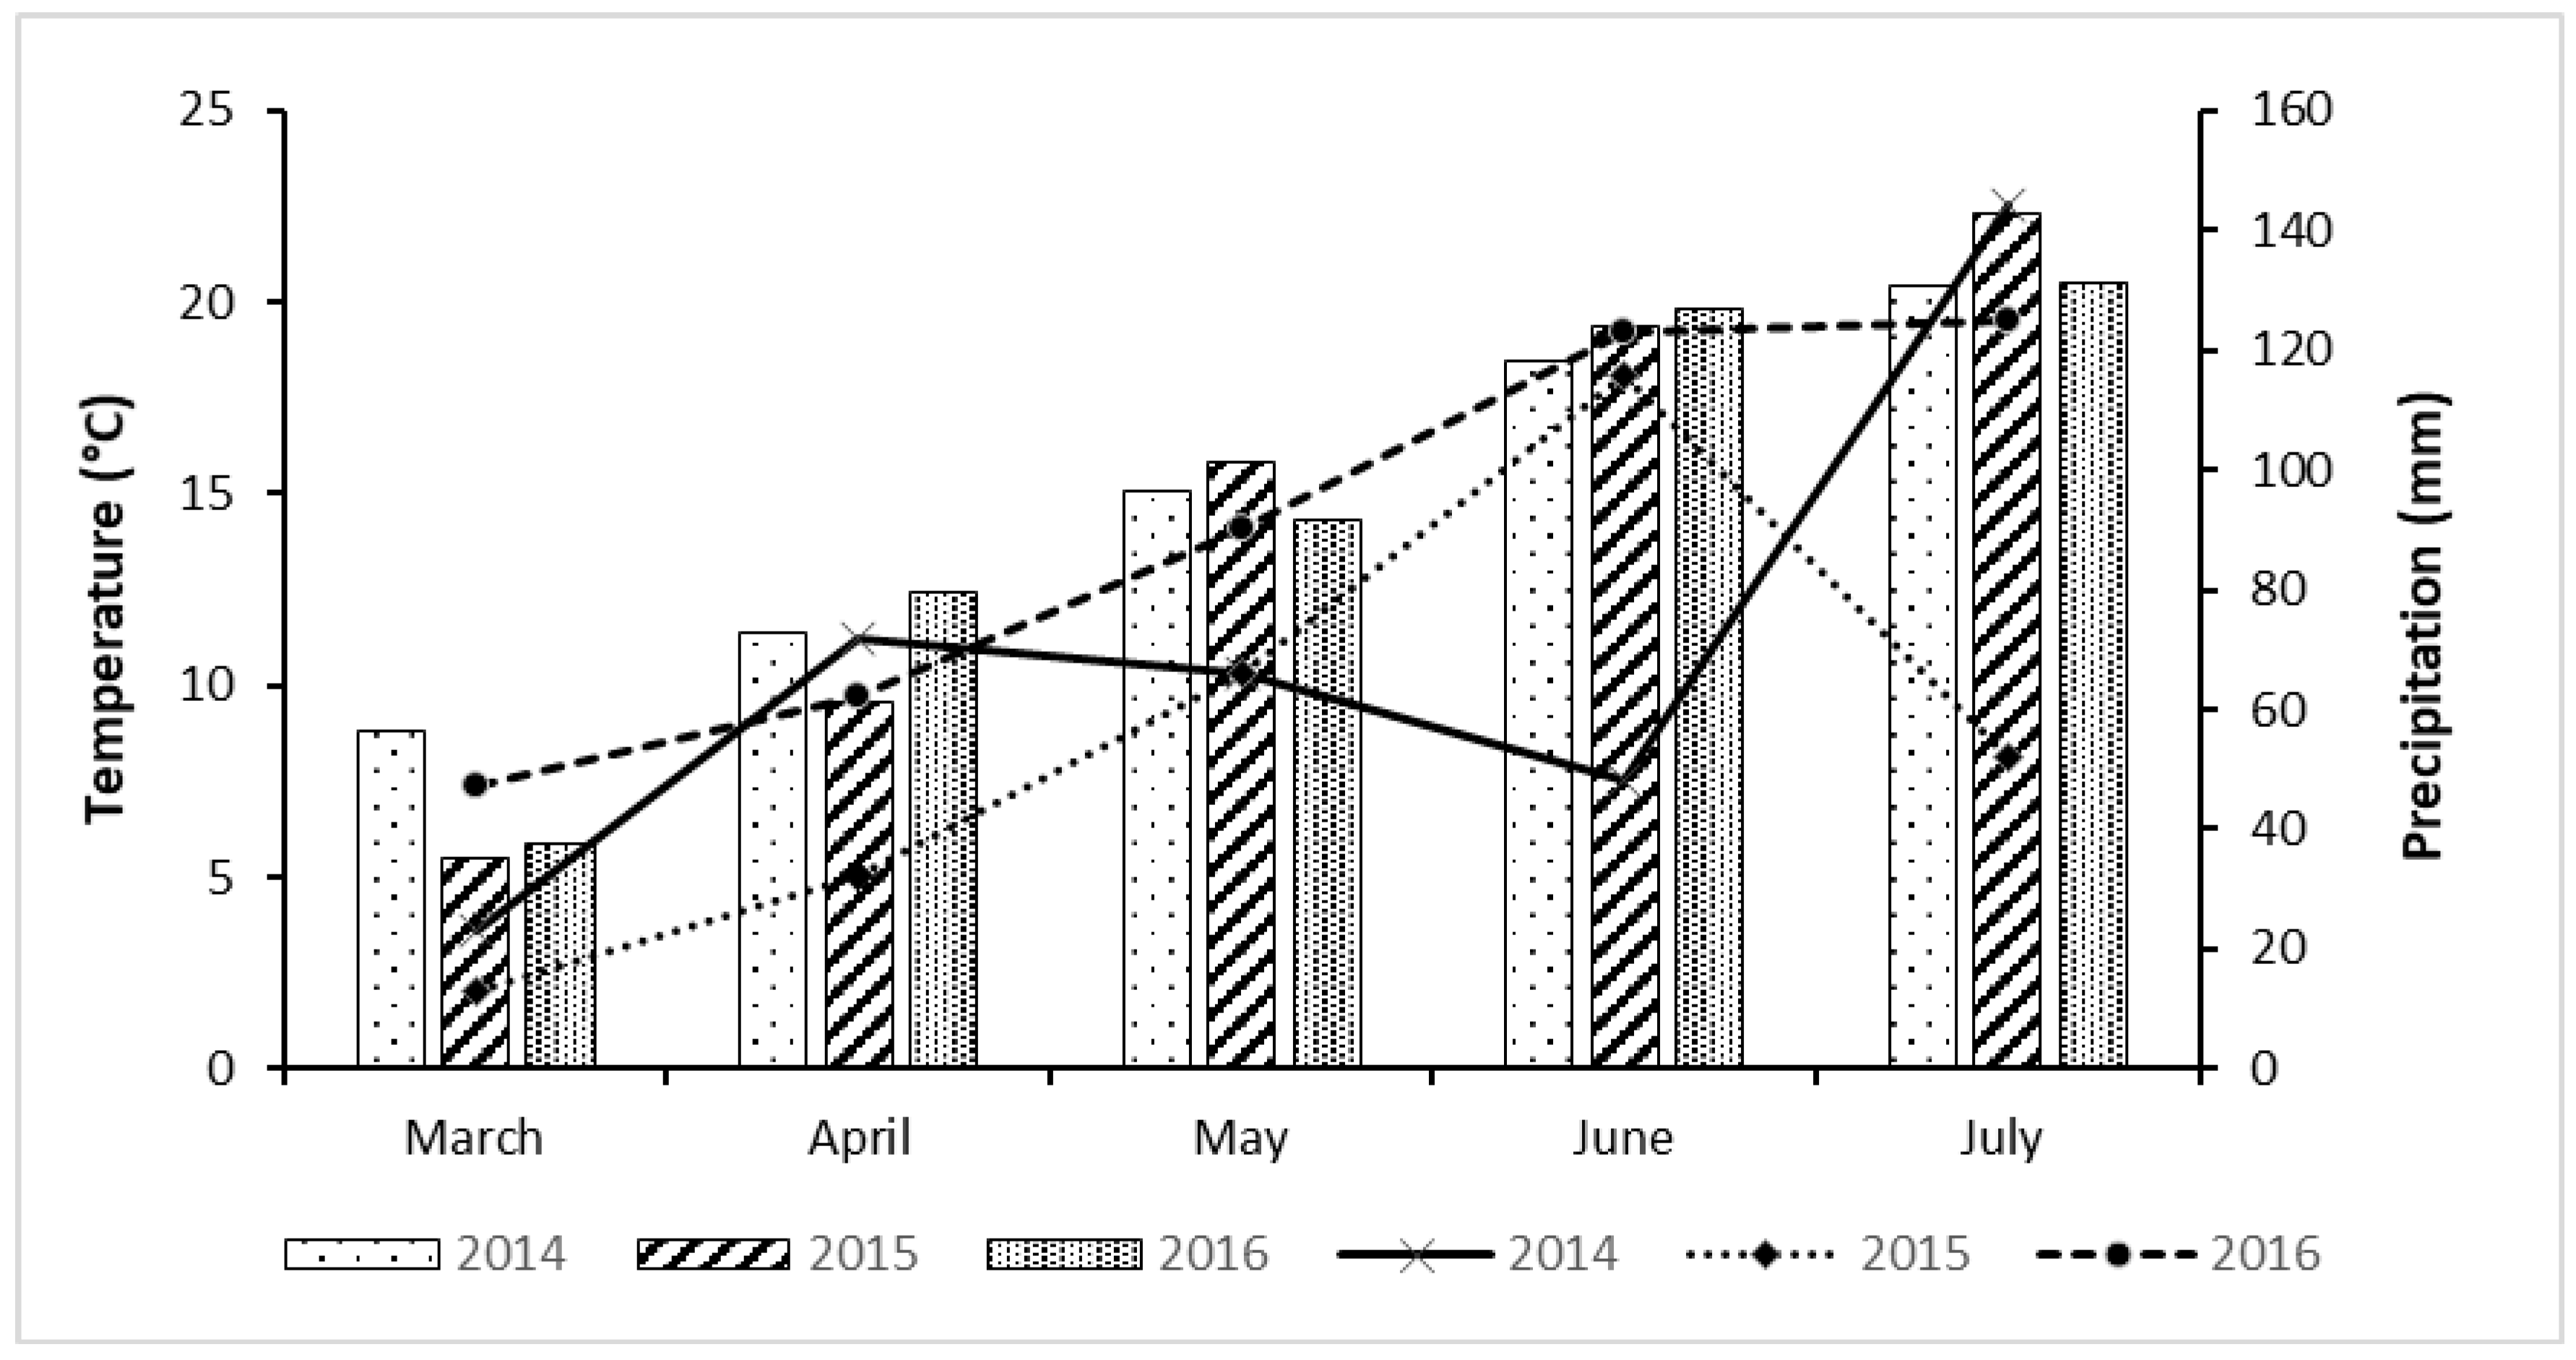
Figure A2.
Daidzin concentration in soybeans influenced by field year. Sms: soil tillage system and wct: weed control treatment. The values shown are means ± S.E. Different lowercase letters above the bars indicate significant differences in daidzin concentration between the years undergoing the same treatment, according to Tukey’s HSD test (p ≤ 0.05).
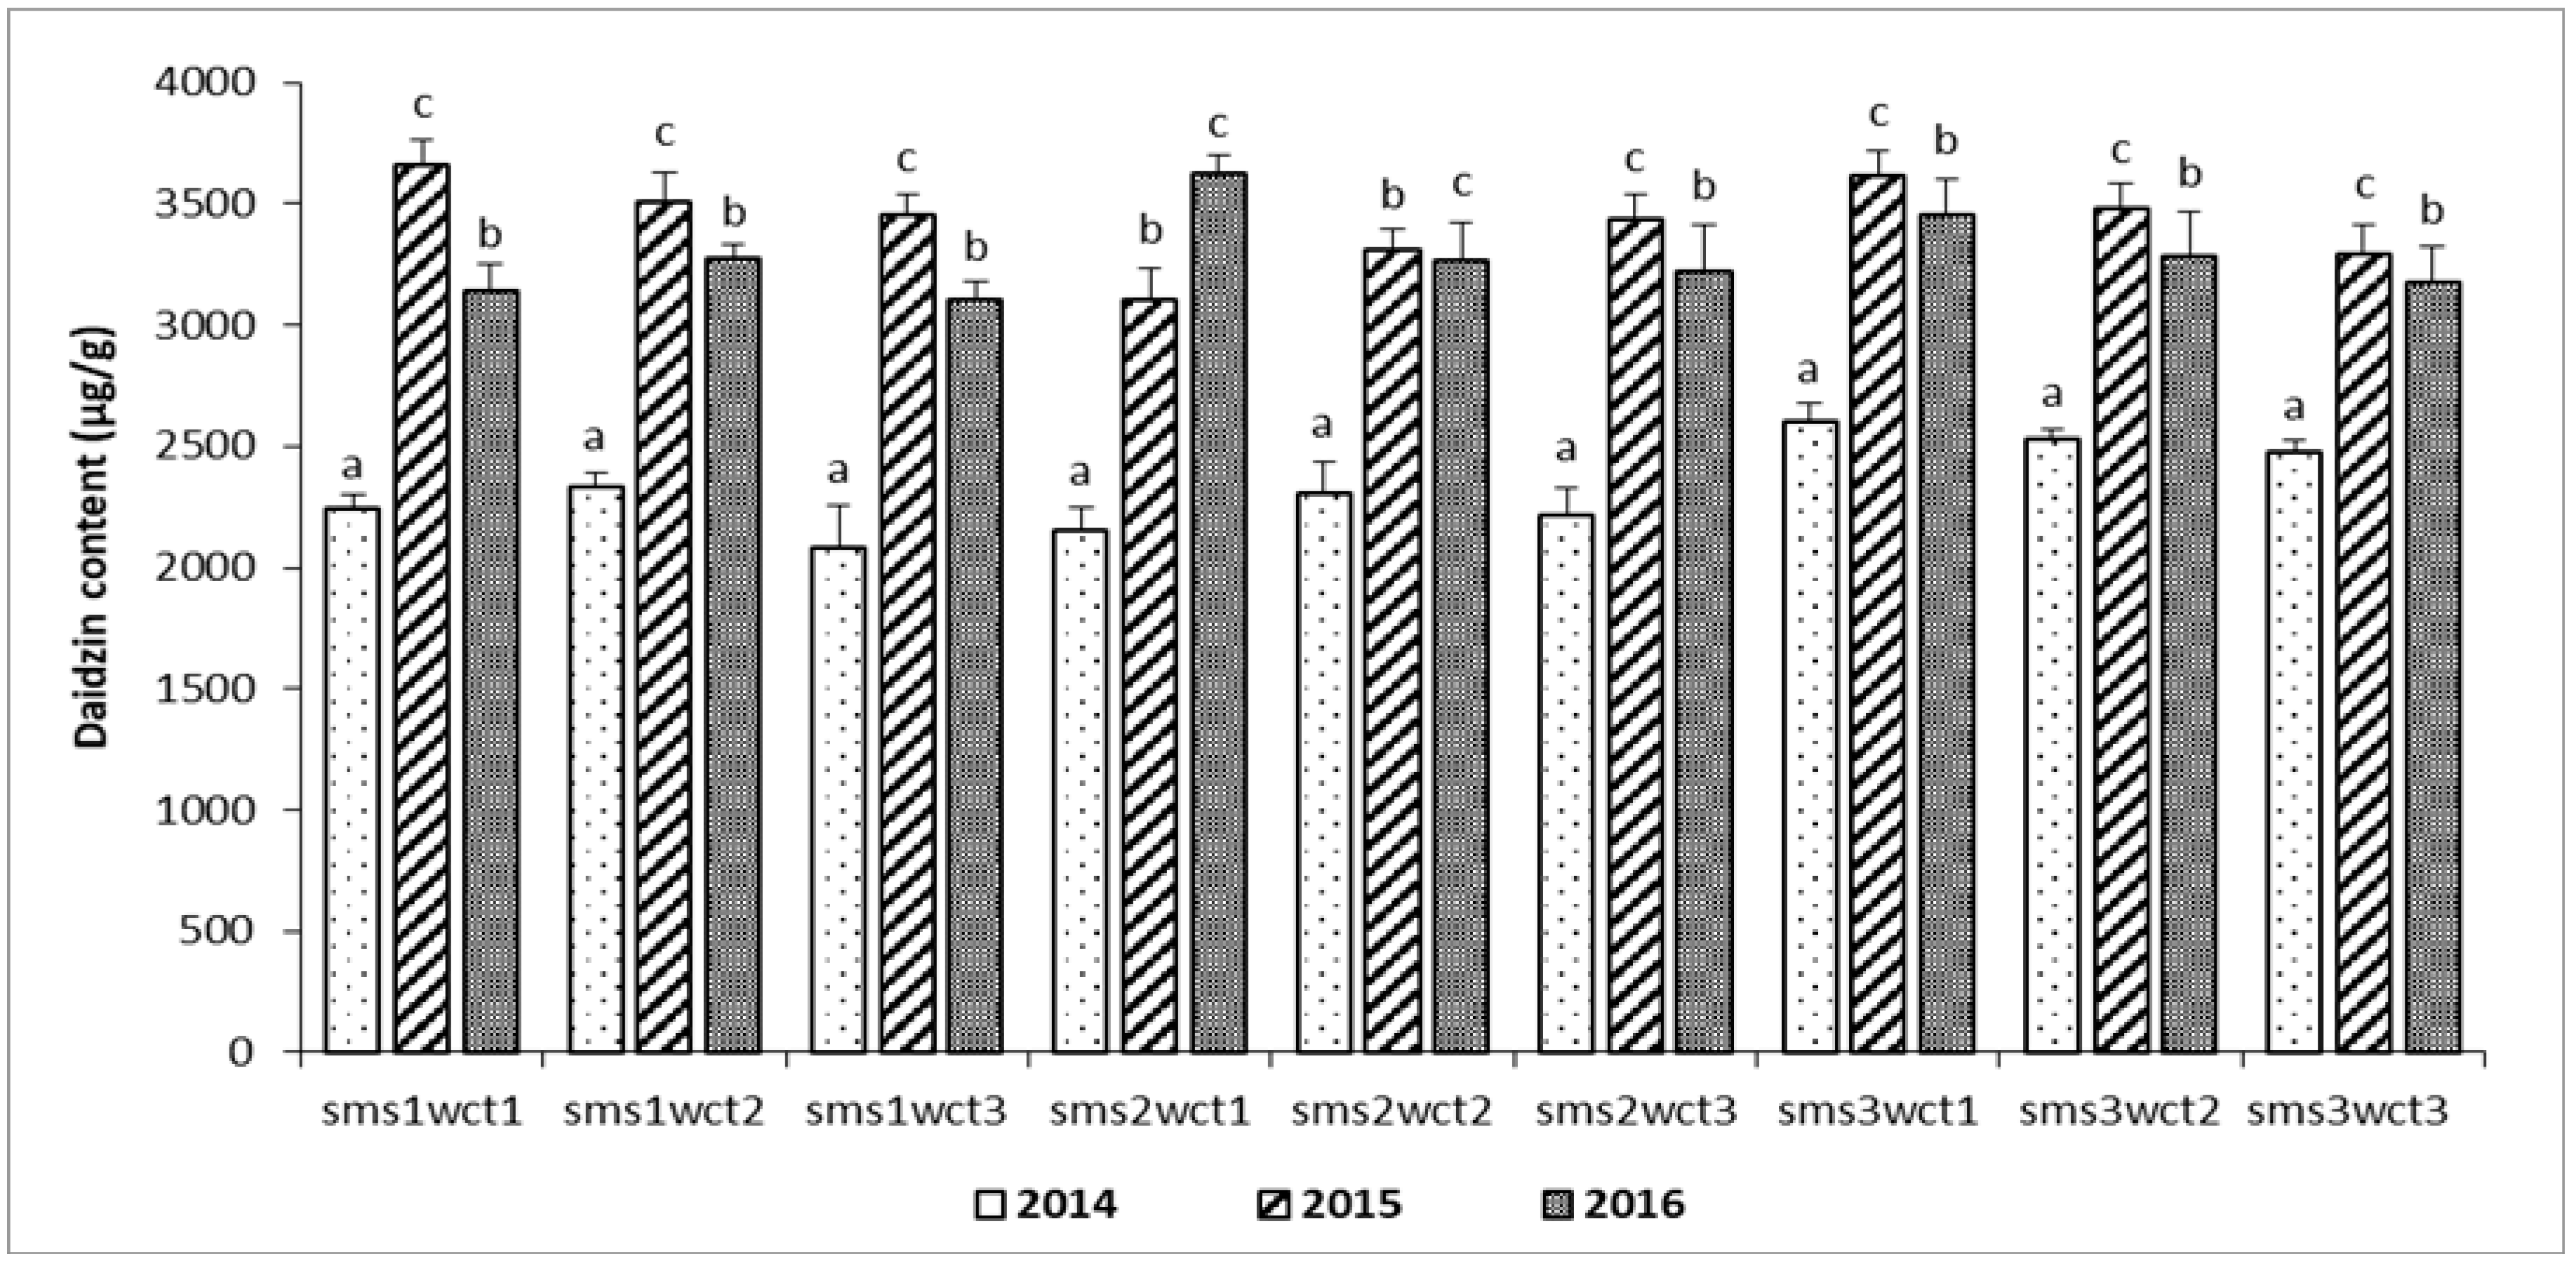
Figure A3.
Daidzein concentration in soybeans influenced by field year. Sms: soil tillage system and wct: weed control treatment. The values shown are means ± S.E. Different lowercase letters above the bars indicate significant differences in daidzein concentration between the years undergoing the same treatment, according to Tukey’s HSD test (p ≤ 0.05).
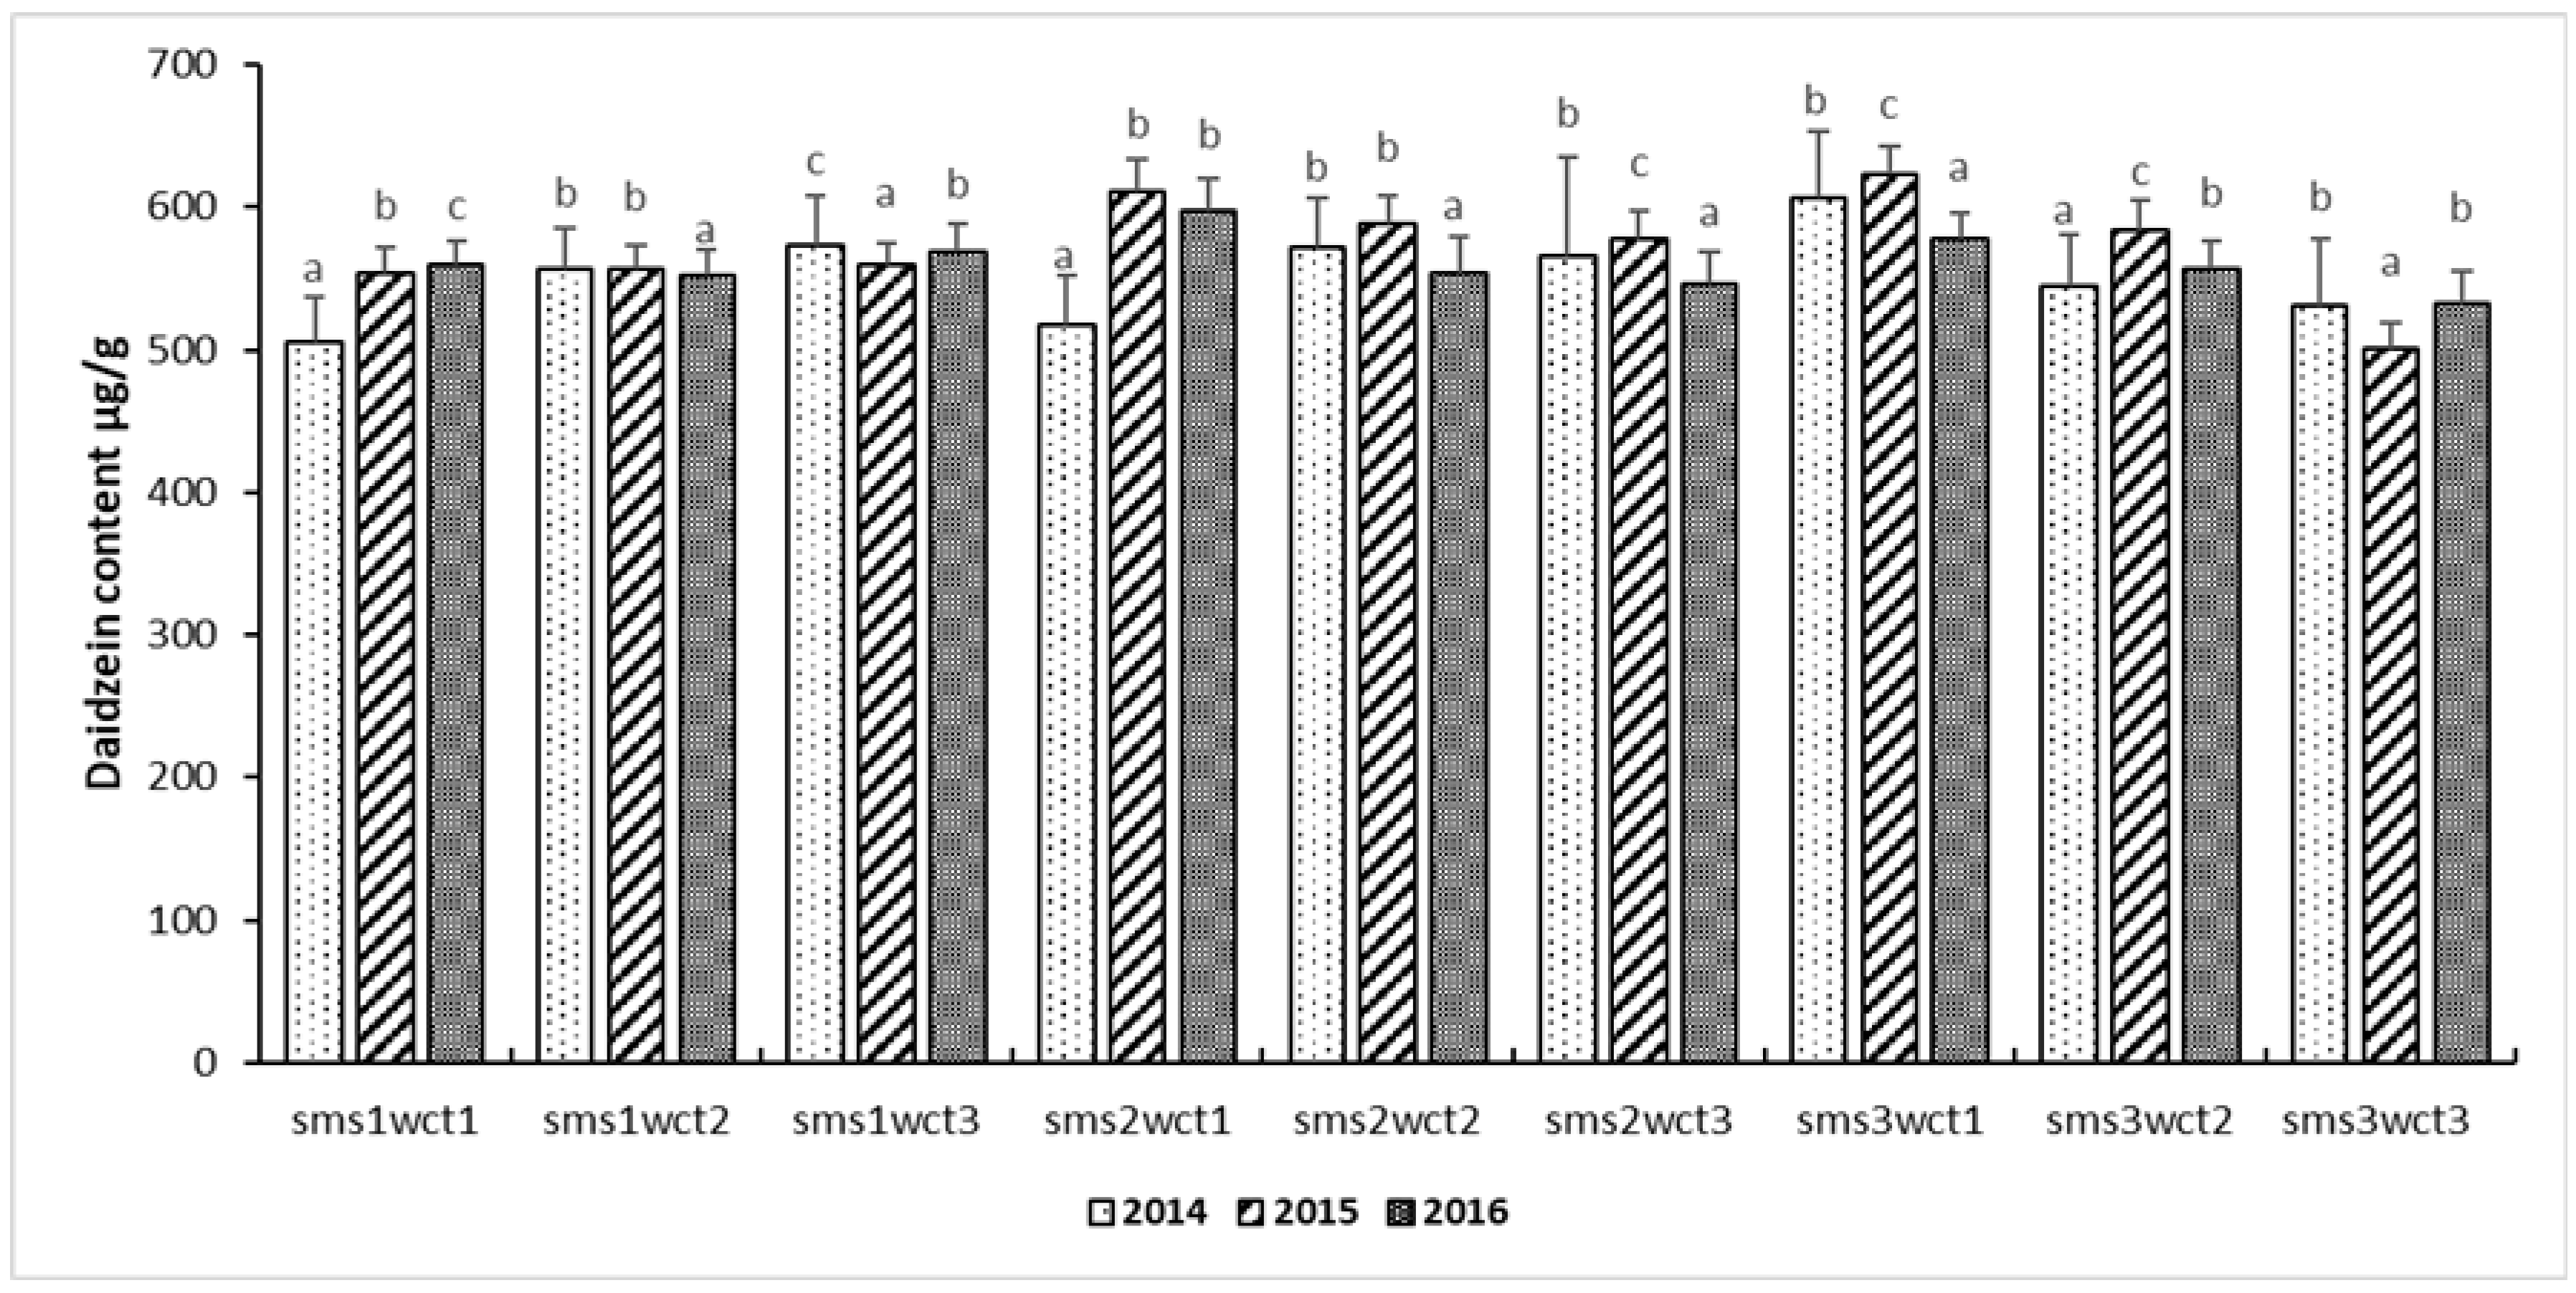
Figure A4.
Genistin concentration in soybeans influenced by field year. Sms: soil tillage system and wct: weed control treatment. The values shown are means ± S.E. Different lowercase letters above the bars indicate significant differences in genistin concentration between the years undergoing the same treatment, according to Tukey’s HSD test (p ≤ 0.05).

Figure A5.
Genistein concentration in soybeans influenced by field year. Sms: soil tillage system and wct: weed control treatment. The values shown are means ± S.E. Different lowercase letters above the bars indicate significant differences in genistein concentration between the years undergoing the same treatment, according to Tukey’s HSD test (p ≤ 0.05).

Figure A6.
Glycitin concentration in soybeans influenced by field year. Sms: soil tillage system and wct: weed control treatment. The values shown are means ± S.E. Different lowercase letters above the bars indicate significant differences in glycitin concentration between the years undergoing the same treatment, according to Tukey’s HSD test (p ≤ 0.05).

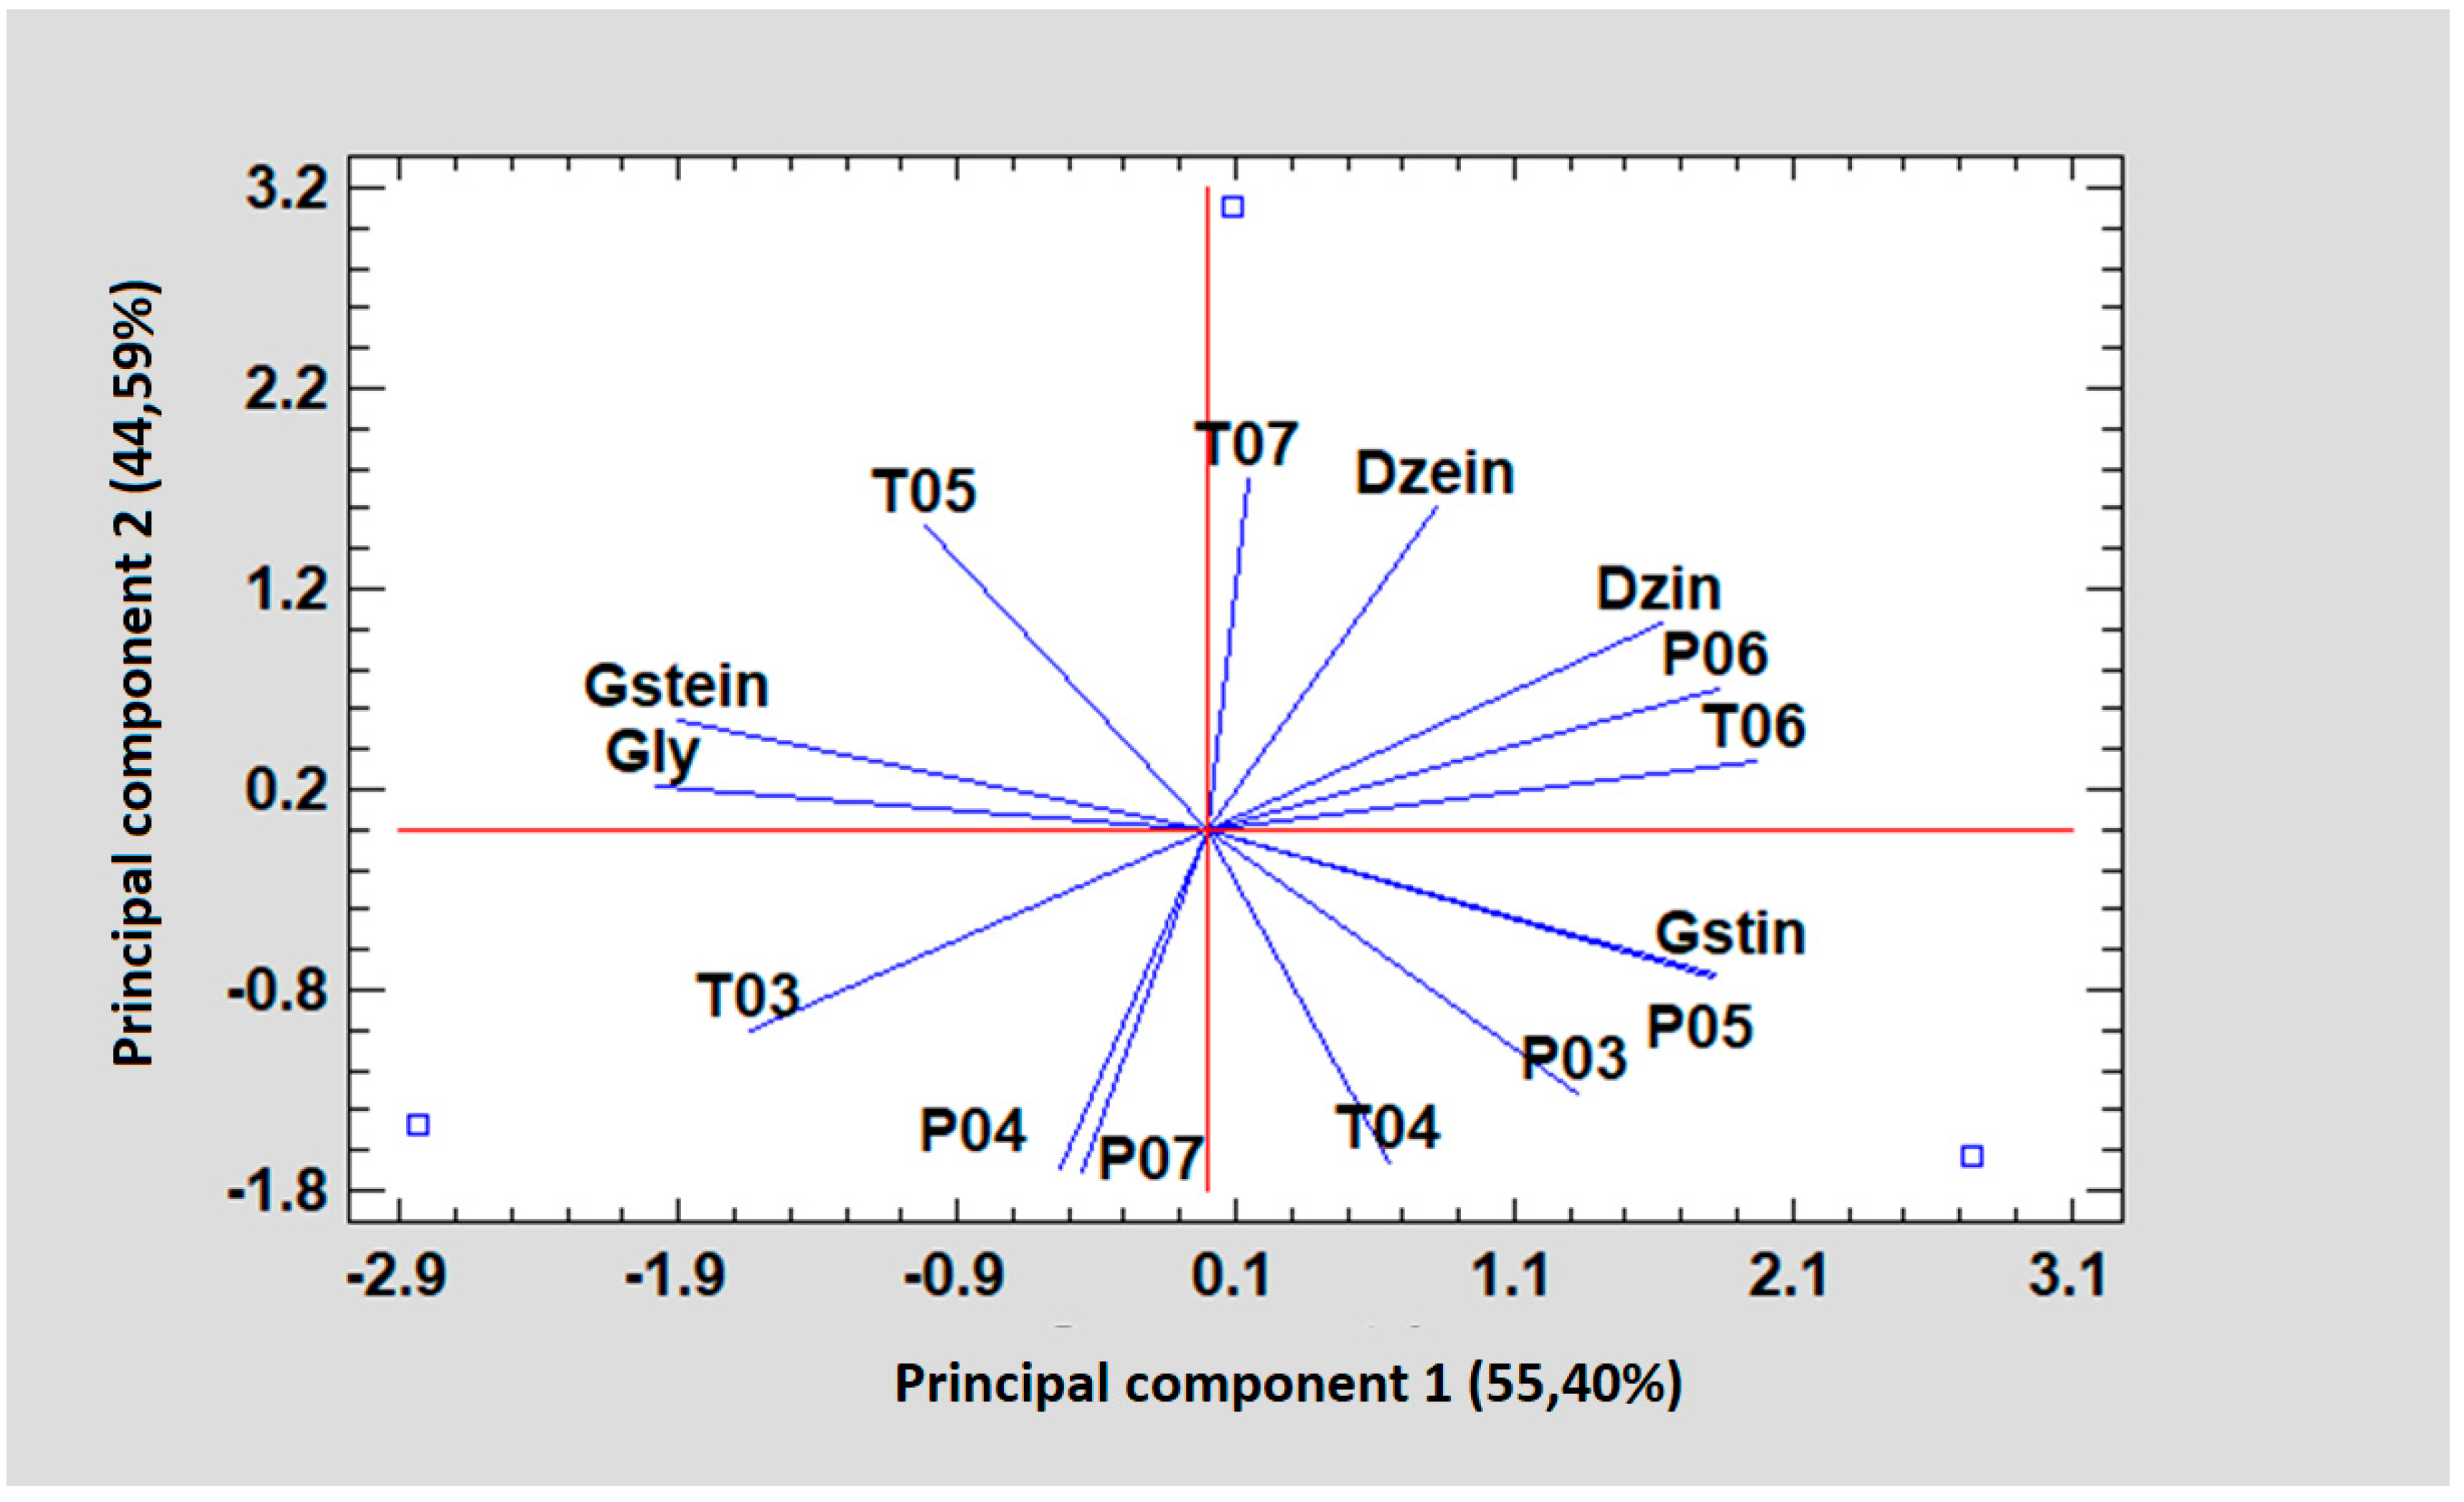
Figure A7.
Loading plot of Principal Component Analysis carried out with the analyzed factors: temperatures and precipitation during the growing season (T03, T04, T05, T06, T07 and P03, P04, P05, P06, P07) and isoflavones concentration: daidzein (Dzein), genistin (Gstin), daidzin (Dzin); glycitin (Gly) and genistein (Gstein) based on the first and second components accounting for 55.40% and 44.59% of the total variability observed.
References
- Hu, C.; Wong, W.T.; Wu, R.; Lai, W.F. Biochemistry and use of soybean isoflavones in functional food development. Crit. Rev. Food Sci. Nutr. 2020, 60, 2098–2112. [Google Scholar] [CrossRef]
- Pawar, V.S.; Patil, B.M.; Syed, Z.; Salve, R.V. Soybean: A novel food grain for human health. Int. J. Chem. Stud. 2018, 6, 1894–1898. [Google Scholar]
- Kudou, S.; Fleury, Y.; Welti, D.; Magnolato, D.; Uchida, T.; Kitamura, K.; Okubo, K. Malonyl isoflavone glycosides in soybeans seeds (Glycine max (L.) Merrill). Agric. Biol. Chem. 1991, 55, 2227–2233. [Google Scholar] [CrossRef] [Green Version]
- Wang, H.; Murphy, P.A. Isoflavone Content in Commercial Soybean Foods. J. Agric. Food Chem. 1994, 42, 1666–1673. [Google Scholar] [CrossRef]
- Lee, J.H.; Renita, M.; Fioritto, R.J.; Martin, S.K.; Schwartz, S.J.; Vodovotz, Y. Isoflavone Characterization and Antioxidant Activity of Ohio Soybeans. J. Agric. Food Chem. 2004, 52, 2647–2651. [Google Scholar] [CrossRef]
- Coward, L.; Barnes, N.C.; Setchell, K.D.R.; Barnes, S. Genistein and daidzein, and their β-glycoside conjugates: Anti-tumor isoflavones in soybean foods from American and Asian diets. J. Agric. Food Chem. 1993, 41, 1961–1967. [Google Scholar] [CrossRef]
- Messina, M.; Barnes, S. The role of soy products in reducing risk of cancer. J. Natl. Cancer Inst. 1991, 83, 541–546. [Google Scholar] [CrossRef] [Green Version]
- Banz, W.; Williams, M.; Lightfoot, D.; Winters, T. Effects of Soy Protein and Soy Phytoestrogens on Symptoms Associated with Cardiovascular Disease in Rats. J. Med. Food 1999, 2, 271–273. [Google Scholar] [CrossRef]
- Kanchana, P.M.; Lakshmi, S.; Raja, K.D. A Review of Glycine Max (L.) Merr. (Sybean). World J. Pharm. Pharm. Sci. 2015, 5, 356–371. [Google Scholar]
- Boerema, A.; Peeters, A.; Swolfs, S.; Vandevenne, F.; Jacobs, S.; Staes, J.; Meire, P. Soybean trade: Balancing environmental and socio-economic impacts of an intercontinental market. PLoS ONE 2016, 11, e0155222. [Google Scholar] [CrossRef] [PubMed]
- Tsukamoto, C.; Shimada, S.; Igita, K.; Kudou, S.; Kokubun, M.; Okubo, K.; Kitamura, K. Factors affecting isoflavone content in soybean seeds: Changes in isoflavones, saponins composition of fatty acids at different temperatures during the seeds development. J. Agric. Food Chem. 1995, 43, 1184–1192. [Google Scholar] [CrossRef]
- Meksem, K.; Njiti, V.N.; Banz, W.J.; Iqbal, M.J.; Kassem, M.M.; Hyten, D.L.; Yuang, J.; Winters, T.A.; Lightfoot, D.A. Genomic regions that underlie soybean seed isoflavone content. BioMed Res. Int. 2001, 1, 38–44. [Google Scholar] [CrossRef] [PubMed] [Green Version]
- Aussenac, T.; Lacombe, S.; Daydé, J. Quantification of isoflavones by capillary zone electrophoresis in soybean seeds: Effects of variety and environment. Am. J. Clin. Nutr. 1999, 68, 1480S–1485S. [Google Scholar] [CrossRef] [PubMed]
- Sakthivelu, G.M.K.; Akitha-Devi, P.; Giridhar, T.; Rajasekharan, G.A.; Ravishankar, T.N.; Kosturkova, G. Drought-induced alterations in growth, osmotic potential and in-vitro regeneration of soybean cultivars. Gen. Appl. Plant. Physiol. 2008, 34, 103–112. [Google Scholar]
- Carrão-Panizzi, M.C.; Berhow, M.; Mandarino, J.M.G.; Oliveira, M.C.N.D. Environmental and genetic variation of isoflavone content of soybean seeds grown in Brazil. Pesqui. Agropecu. Bras. 2009, 44, 1444–1451. [Google Scholar] [CrossRef] [Green Version]
- Caldwell, C.R.; Britz, S.J.; Mirecki, R.M. Effect of Temperature, Elevated Carbon Dioxide, and Drought during Seed Development on the Isoflavone Content of Dwarf Soybean [Glycine max (L.) Merrill] Grown in Controlled Environments. J. Agric. Food Chem. 2005, 53, 1125–1129. [Google Scholar] [CrossRef]
- Yin, X.; Vyn, T.J. Relationships of Isoflavone, Oil, and Protein in Seed with Yield of Soybean. Agronom. J. 1997, 97, 1314–1321. [Google Scholar] [CrossRef] [Green Version]
- Barion, G.; Hewidy, M.; Mosca, G.; Vamerali, T. Intraspecific variability for soybean cotyledon isoflavones in different cropping and soil conditions. Eur. J. Agr. 2010, 33, 63–73. [Google Scholar] [CrossRef]
- Dima, D.C. Soybean Crop in Romania, Bulgaria and the Republic of Moldova: Current Situation and Perspectives. Agric. Agric. Sci. Procedia 2015, 6, 3–8. [Google Scholar] [CrossRef]
- Moraru, P.I.; Rusu, T.; Guș, P.; Bogdan, I.; Pop, A.I. The role of minimum tillage in protecting environmental resources of the Transylvanian Plain, Romania. Rom. Agric. Res. 2015, 32, 127–135. [Google Scholar]
- Rusu, T. Energy efficiency and soil conservation in conventional, minimum tillage and no-tillage. Int. Soil Water Conserv. Res. 2014, 2, 42–49. [Google Scholar] [CrossRef] [Green Version]
- Rusu, T.; Bogdan, I.; Moraru, P.I.; Pop, A.I.; Duda, B.M.; Coste, C. Research results on conservative tillage systems in the last 50 years at USAMV Cluj-Napoca. ProEnvironment 2015, 8, 105–111. [Google Scholar]
- Mureşanu, E.; Mărginean, R.; Negru, S. Early soybean cultivar-Felix. Analele I.N.C.D.A. Fundulea. 2010, LXXVIII, 55–62. [Google Scholar]
- Muntean, L.S.; Cernea, S.; Morar, G.; Duda, M.M.; Virban, D.I.; Muntean, S.; Moldovean, C. Fitotehnie, III. Ed.; Risoprint: Cluj-Napoca, Romania, 2014. [Google Scholar]
- Cheţan, C.; Rusu, T.; Cheţan, F.; Şimon, A. Research Regarding the Influence of the Weed Control Treatments on Production and Qualitative Indicators of the Soybean Cultivated in Minimum Tillage System. Bull. Univ. Agric. Sci. Vet. Med. Cluj-Napoca Agric. 2016, 73, 170–175. [Google Scholar]
- Eldridge, A.C. High-performance liquid chromatography separation of soybean isoflavones and their glucosides. J. Chromatogr. 1982, 234, 494. [Google Scholar] [CrossRef]
- Britz, S.J.; Schomburg, C.J.; Kenworthy, W.J. Isoflavones in seeds of field-grown soybean: Variation among genetic lines and environmental effects. J. Am. Oil Chem. Soc. 2011, 88, 827–832. [Google Scholar] [CrossRef]
- Lozovaya, V.V.; Lygin, A.V.; Ulanov, A.V.; Nelson, R.L.; Dayde, J.; Widholm, J.M. Effect of Temperature and Soil Moisture Status during Seed Development on Soybean Seed Isoflavone Concentration and Composition. Crop. Sci. 2005, 45, 1934–1940. [Google Scholar] [CrossRef] [Green Version]
- Murphy, P.A.; Barua, K.; Hauck, C.C. Solvent extraction selection in the determination of isoflavones in soy foods. J. Chromatogr. B 2002, 777, 129–138. [Google Scholar] [CrossRef]
- Xu, B.; Chang, S.K.C. Characterization of phenolic substances and antioxidant properties of food soybeans grown in North Dakota-Minnesota region. J. Agric. Food Chem. 2008, 56, 5102–9113. [Google Scholar] [CrossRef]
- Teekachunhatean, S.; Hanprasertpong, N.; Teekachunhatean, T. Factors Affecting Isoflavone Content in Soybean Seeds Grown in Thailand. Int. J. Agron. 2013, 2013, 163573. [Google Scholar] [CrossRef] [Green Version]
- Lee, S.J.; Yan, W.; Ahn, J.K.; Chung, I.M. Effects of year, site, genotype and their interactions on various soybean isoflavones. Field Crops Res. 2003, 81, 2–3. [Google Scholar] [CrossRef]
- Chennupati, P.; Seguin, P.; Liu, W. Effects of high temperature stress at different development stages on soybean isoflavone and tocopherol concentrations. J. Agric. Food Chem. 2011, 59, 13081–13088. [Google Scholar] [CrossRef] [PubMed]
- Gutierrez-Gonzalez, J.J.; Wu, X.; Gillman, J.D.; Lee, J.D.; Zhong, R.; Yu, O.; Shannon, G.; Ellersieck, M.; Nguyen, H.T.; David, A. Intricate environment-modulated genetic networks control isoflavone accumulation in soybean seeds. BMC Plant. Biol. 2010, 10, 105. [Google Scholar] [CrossRef] [PubMed] [Green Version]
- Carrera, C.S.; Dardanelli, J.L.; Soldini, D.O. Genotypic and environmental variation in seed nutraceutical and industrial composition of non-transgenic soybean (Glycine max) genotypes. Crop. Pasture Sci. 2014, 65, 1311–1322. [Google Scholar] [CrossRef]
© 2020 by the authors. Licensee MDPI, Basel, Switzerland. This article is an open access article distributed under the terms and conditions of the Creative Commons Attribution (CC BY) license (http://creativecommons.org/licenses/by/4.0/).
Share and Cite
MDPI and ACS Style
Mureșan, L.; Clapa, D.; Borsai, O.; Rusu, T.; Wang, T.T.Y.; Park, J.B. Potential Impacts of Soil Tillage System on Isoflavone Concentration of Soybean as Functional Food Ingredients. Land 2020, 9, 386. https://doi.org/10.3390/land9100386
AMA Style
Mureșan L, Clapa D, Borsai O, Rusu T, Wang TTY, Park JB. Potential Impacts of Soil Tillage System on Isoflavone Concentration of Soybean as Functional Food Ingredients. Land. 2020; 9(10):386. https://doi.org/10.3390/land9100386
Chicago/Turabian StyleMureșan, Liliana, Doina Clapa, Orsolya Borsai, Teodor Rusu, Thomas T. Y. Wang, and Jae B. Park. 2020. "Potential Impacts of Soil Tillage System on Isoflavone Concentration of Soybean as Functional Food Ingredients" Land 9, no. 10: 386. https://doi.org/10.3390/land9100386
Note that from the first issue of 2016, this journal uses article numbers instead of page numbers. See further details here.