Article

Land–Climate Interactions in Lisbon: A Climatological Characterisation of the Urban Heat Island via Ground and Satellite Observations


1
Instituto Português do Mar e da Atmosfera, Rua C do Aeroporto, 1749-077 Lisboa, Portugal
2
Centre for Research and Technology of Agro-Environmental and Biological Sciences (CITAB), Inov4Agro, University of Trás-os-Montes and Alto Douro (UTAD), Quinta de Prados, 5000-801 Vila Real, Portugal
3
Instituto Dom Luiz (IDL), Faculdade de Ciências da Universidade de Lisboa (FCUL), Campo Grande Edifício C1, Piso 1, 1749-016 Lisboa, Portugal
*
Author to whom correspondence should be addressed.
Land 2026, 15(7), 1209; https://doi.org/10.3390/land15071209
Submission received: 15 June 2026 / Revised: 26 June 2026 / Accepted: 30 June 2026 / Published: 6 July 2026

Abstract

As climate change intensifies heat extremes, the Urban Heat Island (UHI) effect amplifies local thermal stress. Assessing the UHI using robust observational data, whether ground- and/or satellite-based, is essential for climate risk assessment and evidence-based urban adaptation. Therefore, this study aims to provide a comprehensive climatological assessment of air temperature patterns and UHI intensity across the Lisbon Metropolitan Area (LMA) over a 26-year period (2000–2025). The methodology employs a dense, high-quality integrated network of in-situ weather stations from the Portuguese Institute for Sea and Atmosphere (IPMA) and the National Water Resources Information System (SNIRH). To bridge critical gaps in traditional climate assessments, this research implements a dual-perspective approach that combines the high temporal resolution of MSG-SEVIRI and the spatial precision of MODIS Land Surface Temperature (LST). This framework accurately captures the lag effects between surface heating and atmospheric response. Validation results demonstrate that satellite-derived LST is a robust proxy for monitoring the nocturnal UHI, with differences generally below 1 °C compared with near-surface air temperature observations (T2m). However, daytime LST significantly overestimates atmospheric temperatures, with deviations of 2–8 °C due to solar radiation and urban geometry. The selection of rural reference stations constitutes a critical methodological factor, as a baseline shift can alter perceived UHI intensities by more than 3 °C. Despite these sensitivities, the results unequivocally confirm a persistent and spatially heterogeneous UHI effect in Lisbon, which intensifies during extreme heat events by up to an additional 4 °C. Analysis of the 2003 and 2018 heatwaves reveals surface LST anomalies exceeding 10 °C and urban–rural thermal differentials reaching up to 7 °C under conditions of suppressed maritime breezes. These nocturnal anomalies are particularly pronounced in densely built-up areas, limiting thermal dissipation and preventing physiological recovery. Integrating multi-sensor satellite data with in-situ validation provides a new benchmark for climate risk assessments, delivering the reliable, reproducible data required to strengthen long-term urban resilience under increasingly frequent extreme heat events.

1. Introduction

Both civil society and the scientific community are increasingly concerned about the risks posed by the increasing frequency of heatwaves and extreme thermal events. The intersection of global warming and rapid urbanisation has created a synergistic effect that amplifies local temperature extremes. When coupled with the Urban Heat Island (UHI) effect, these phenomena significantly degrade urban thermal comfort, with profound implications for public health [1,2,3,4]. The vulnerability of urban populations is no longer a peripheral concern but a central pillar of contemporary climate research, particularly as heat-stress thresholds are increasingly exceeded in densely populated regions.
The UHI phenomenon, characterised by higher average air temperature in urban centres than in their rural counterparts, adversely affects the quality of life in cities, particularly in Southern Europe [4,5,6]. Indeed, this phenomenon represents a complex meteorological disruption that alters local wind patterns, increases cooling energy consumption, and accelerates the formation of secondary pollutants, such as ground-level ozone.
The physical basis of the UHI lies in the fundamental alteration of energy, mass, and momentum balances caused by human-made surfaces and activities [7,8]. In undisturbed natural landscapes, a significant portion of incoming solar radiation is converted into latent heat flux through evapotranspiration. However, urbanisation fundamentally shifts this partitioning toward sensible heat flux. Urban climates emerge from the absorption of solar radiation, driven by low albedo, high building density, and a lack of pervious surfaces [9]. The three-dimensional geometry of the city, often referred to as the “urban canyon,” further complicates this balance by trapping longwave radiation and reducing the sky view factor (SVF), which prevents efficient nocturnal cooling. Sprawling urban expansion triggers territorial shifts that modify radiative and energy budgets [10,11,12], primarily by replacing natural land cover with heat-retaining materials such as asphalt and concrete. These materials have high thermal admittance, allowing them to store large amounts of energy during the day and release it slowly at night. This results in a concentric thermal pattern in which urban temperatures, particularly at night, exceed those in the surrounding peri-urban zones [10,12,13,14]. This nocturnal intensity is a hallmark of the atmospheric UHI, in which the city remains a “heat reservoir” long after sunset, preventing residents’ physiological recovery from daytime heat stress and influenced by land use, urban morphology, and atmospheric and geographic conditions [15]. Addressing these factors is crucial for improving urban thermal comfort and public health [16].
Lisbon’s climate is characterised as temperate, with dry, hot summers (Köppen classification: Csa) [17,18,19]. The city’s mesoclimatic behaviour is heavily dictated by its complex topography and its strategic proximity to both the Atlantic Ocean and the Tagus River estuary. This geographic positioning creates a unique hydrothermal interaction. During the day, the thermal contrast between the heated Iberian landmass and the cooler Atlantic drives powerful mesoscale circulations. Wind patterns exhibit significant seasonal variability [20,21]; the summer period (JJA) is dominated by north-to-northwesterly “sea breezes” known in Portugal as the “nortada” [22,23,24]. These winds are essential for ventilating the urban fabric and dispersing anthropogenic heat [25], often serving as a natural air-conditioning system for the city’s westernmost regions. However, the efficacy of this maritime cooling is unevenly distributed. The rugged topography of Lisbon, characterised by its seven hills and deep valleys, creates microclimates where wind speed is attenuated, and heat is trapped. In this context, the spatial distribution of land use and land cover (LULC) is a key determinant of UHI mitigation, as green spaces and water bodies provide critical cooling through evapotranspiration and thermal regulation [18,26,27]. The “Blue and Green Infrastructure” of the city, ranging from the Monsanto Forest Park to the riverfront, serves as a vital thermal buffer, yet the continuous densification of the urban core threatens these ecosystem services.
The intensity of the UHI (ΔTu-r) is typically defined by the maximum temperature gradient between the urban core (Tu) and its surrounding rural environment (Tr) [10,20,28,29]. While traditional studies rely solely on 2-m air temperature (T2m), which provides high temporal precision at specific points, they often lack the spatial granularity required to map the heterogeneous thermal landscape of a modern metropolis. A comprehensive understanding of Lisbon’s thermal climate requires a multi-source approach that integrates satellite observations with terrestrial networks.
By integrating a large set of official observational data, this study uses an innovative dataset with unprecedented temporal extent, resolution, and spatial coverage for this type of analysis in the Portuguese context. Using satellite-derived Land Surface Temperature (LST) from the Meteosat Second Generation (MSG) Spinning Enhanced Visible and Infrared Imager (MSG-SEVIRI) and the Moderate Resolution Imaging Spectroradiometer (MODIS), along with in-situ observations, this research bridges the gap between land surface temperatures and atmospheric heat. Nevertheless, it is critical to distinguish between the Surface UHI (SUHI), measured by satellites, and the Canopy Layer UHI (CUHI), measured by weather stations. While they are physically linked, their magnitudes and temporal peaks often diverge. LST responds almost instantaneously to solar forcing, whereas T2m exhibits a lag due to the time required for the surface to heat the adjacent air layer through convection and conduction [14,22,24,25]. This study innovatively addresses this dual perspective by investigating the complex lag effects between surface heating and T2m responses, with a particular focus on identifying how different land-use classes influence the transition from surface heating to the nocturnal atmospheric heat island. Integrating the MODIS and MSG-SEVIRI sensors enables a more complete approach, leveraging the spatial detail of MODIS and the diurnal continuity of MSG.
The primary goal of the present article is to evaluate and characterise the urban thermal environment and the UHI effect within the Lisbon Metropolitan area by examining the geographical distribution of land use/land cover and occupancy, and their relation to temperature variations across a 26-year climatological baseline (2000–2025). The suitability and reliability of satellite-derived LST (from both MSG and MODIS) are also evaluated as standalone proxies for urban climate monitoring and UHI estimation. Indeed, the scientific community still faces challenges in directly applying LST as a surrogate for T2m, primarily due to atmospheric interference, uncertainties in surface emissivity, and the inherent physical difference between surface temperature and T2m, amid known variability and heterogeneity.
The complexity of urban thermal environments, combined with the increasing frequency of extreme heat events and the growing availability of high-resolution observational datasets, highlights the need for an integrated assessment of the UHI phenomenon in Lisbon. Given the strong interactions among land use/land cover (LULC), urban morphology, atmospheric processes, and regional climatic controls, it is essential to investigate not only the spatial and temporal dynamics of urban heat but also the reliability of emerging satellite-based approaches to urban climate monitoring. Furthermore, understanding how these thermal patterns evolve during heatwaves is critical to supporting climate-resilient urban planning and public health adaptation strategies. In this context, the present study is structured around the following research questions:
  • How do urbanisation patterns, LULC, urban morphology, and Lisbon’s geographic and climatic characteristics jointly influence the spatial and temporal variability of the UHI effect and urban thermal comfort within the Lisbon Metropolitan Area?
  • To what extent can satellite-derived LST products from MODIS and MSG-SEVIRI reliably characterise and monitor the Urban Heat Island effect when compared with near-surface T2m, particularly regarding the temporal decoupling between surface and atmospheric heating across different seasons, land-use classes, and heatwave conditions?
  • Can satellite-derived LST products from MODIS and MSG-SEVIRI reliably serve as operational proxies for urban climate monitoring and UHI assessment in Lisbon?
  • How do heatwave events modify the intensity, persistence, and nocturnal behaviour of the Urban Heat Island effect within the Lisbon Metropolitan Area?
Furthermore, while traditional urban climate studies often examine baseline seasonal patterns using single remote sensing instruments or solitary rural baselines, this research addresses key remaining gaps through a multifaceted framework. By coupling a high-resolution, multi-sensor database (MSG-SEVIRI and MODIS) with an analysis of extreme synoptic forcing—focusing on the catastrophic 2003 and 2018 heatwaves—this study explores the feedback mechanisms between macro-climatic stress and micro-urban features. Concurrently, it provides a novel sensitivity analysis that deconstructs the vulnerability of standard, binary ‘urban–rural’ comparisons, evaluating how distinct background reference stations alter the perceived magnitude of the heat island in complex coastal environments.
Additionally, this study also seeks to identify the specific climatological behaviour of the UHI and the impact of significant heatwaves on its characteristics. By quantifying the thermal decoupling between T2m and LST across seasons and times of day, the research aims to establish a diagnostic framework for the operational limits of satellite monitoring. This is particularly relevant for the nocturnal period, where the decoupling effect is often most pronounced due to the formation of stable boundary layers. Ultimately, these findings aim to inform sustainable urban planning and the design of heat-mitigation strategies, providing evidence-based insights to support municipal policy that prioritises thermal comfort in the city’s development, benefiting both residents and visitors.

2. Materials and Methods

2.1. Study Area Characterisation

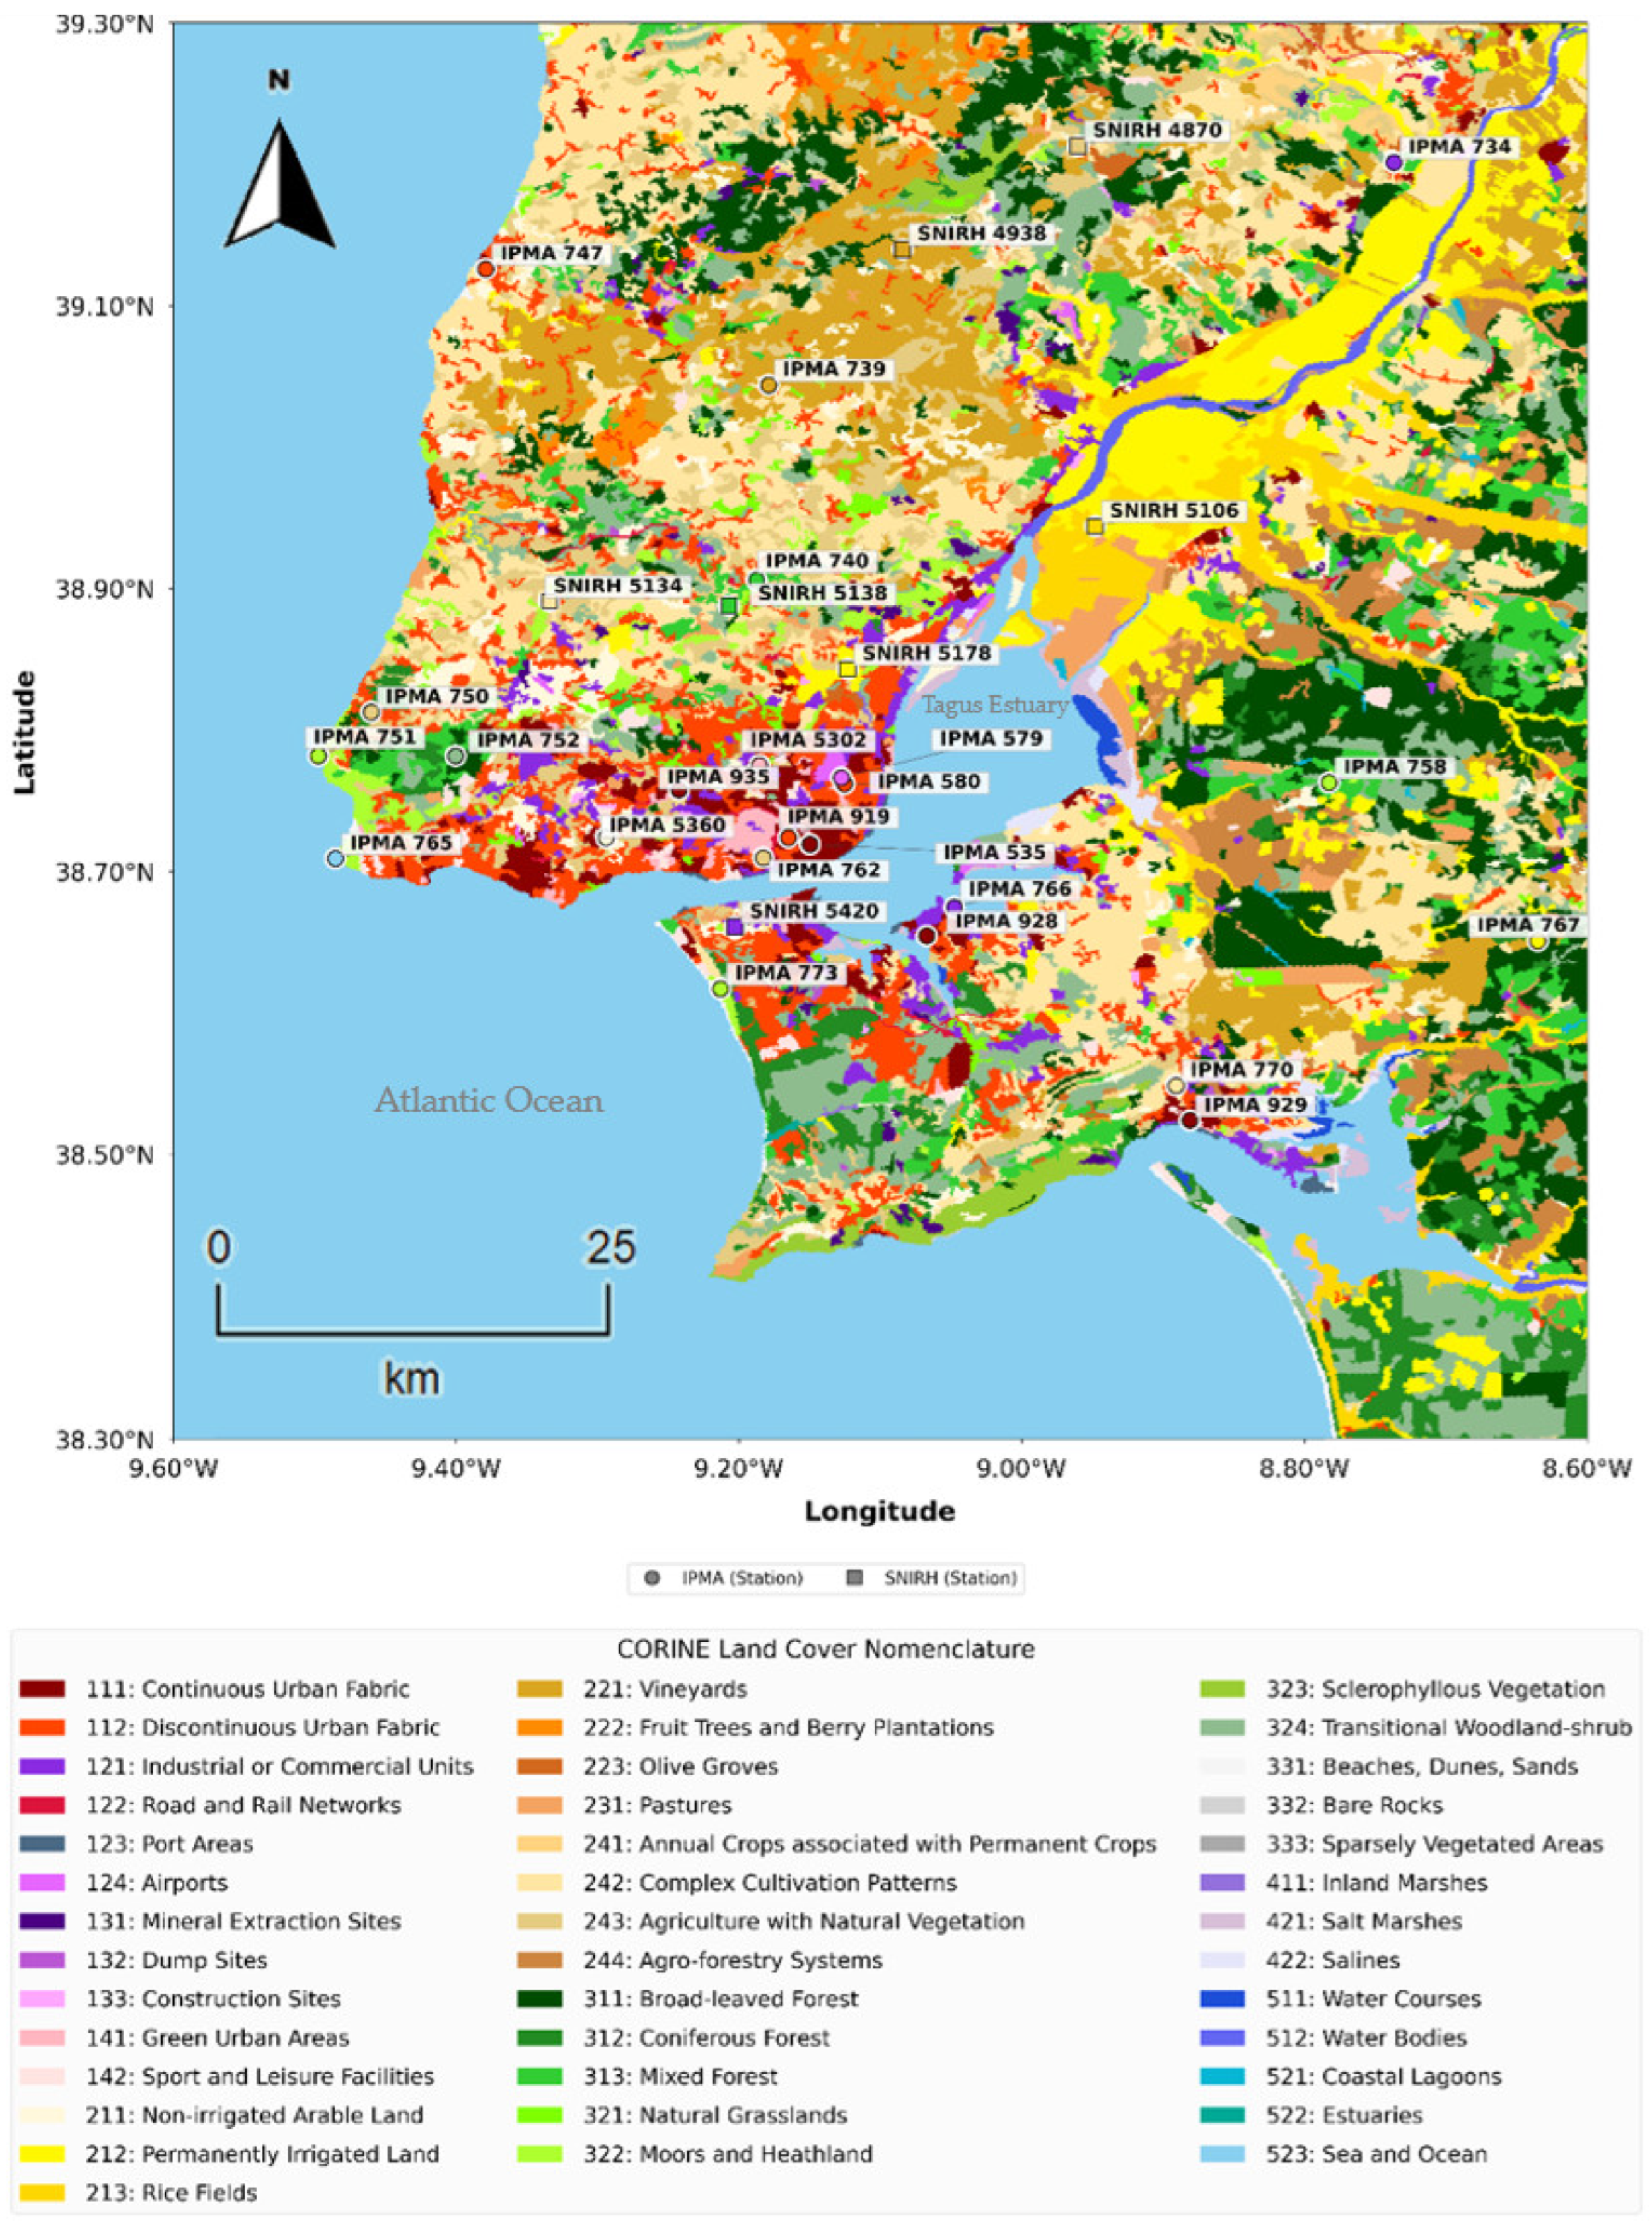
Here, a multi-platform framework for synchronising in-situ meteorological observations with orbital remote-sensing datasets is adopted. The geographic domain encompasses the Lisbon Metropolitan Area (LMA), defined by latitudes 38.3° N to 39.3° N and longitudes 8.6° W to 9.6° W. The LMA is defined by a highly heterogeneous landscape (Figure 1), as evidenced by the CORINE Land Cover (CLC) nomenclature. The urban fabric is primarily concentrated along the northern bank of the Tagus River estuary (Lisbon municipality) and in specific high-density clusters on the South Bay. The study area is defined by a 1° × 1° latitude–longitude domain. To ensure spatial consistency, this exact geographical extent is maintained across all maps presented throughout this paper, including those for T2m, SEVIRI LST, and MODIS LST. Consequently, the latitude and longitude coordinates displayed in Figure 1 are applicable to all subsequent figures. Furthermore, all map domains are strictly North-oriented.

2.2. Ground-Based Meteorological Stations Network

A unified database was constructed by integrating data from 30 official meteorological stations sourced from the Portuguese Institute for Sea and Atmosphere (IPMA) and the National Water Resources Information System (SNIRH). A 26-year climatological series (2000–2025) of T2m was used, including station identifiers, precise geographic coordinates, and network affiliations. The network enables robust characterisation of the region’s climatic and morphological diversity. Selection was predicated on the stations’ representativeness of various LULC classes. The Urban Core, composed, for example, of the IPMA 535 (Lisboa-Geofísico), IPMA 579 (Lisboa-Gago Coutinho), IPMA 919 (Lisboa-Amoreiras), and IPMA 935 (Amadora) stations, is strategically located within the Continuous and Discontinuous Urban Fabric (CLC 111, 112) to characterise the SUHI effect. We considered Continuous and Discontinuous Urban Fabric (CLC 111, 112) to characterise the SUHI effect. On the other hand, to monitor more continental regions dominated by agro-forestry systems and complex cultivation patterns (CLC 242, 311), we used inland stations comprising, among others, IPMA 734, 739, 758, 767, and SNIRH 4870, 4938, 5106. It should be noted that other meteorological stations located in transition areas were included on the maps due to their robust data and continuous availability throughout the study period. However, although these stations met all quality control criteria, they were excluded from direct urban–rural comparisons because their geographical distance or distinct environmental settings do not provide adequate climatic representativeness of the Lisbon urban core. Instead, these stations were integrated into the general climatological maps and heatwave spatial analyses to enhance the characterisation of regional temperature distribution and provide a more comprehensive demonstration of the metropolitan thermal footprint.

2.3. Satellite-Derived LST

To ensure robust thermal characterisation, this study relies on the convergence of ground-based observations (T2m) and LST products from two distinct orbital sensors (Table 1): MODIS and MSG-SEVIRI. MODIS is a key scientific instrument aboard the Terra and Aqua polar-orbiting satellites. It is a multispectral sensor designed to provide comprehensive monitoring of global dynamics across 36 spectral bands, capturing high-quality data on the Earth’s surface, oceans, and atmosphere to enhance our understanding of global climate change. MSG-SEVIRI is the primary imaging sensor aboard the Meteosat Second Generation (MSG) series of geostationary satellites. It is a multispectral radiometer designed to provide high-frequency imagery of the Earth’s surface and atmosphere across 12 spectral channels, spanning visible to thermal infrared wavelengths. This multi-source approach recognises the equal importance of each dataset by integrating its specific capabilities. On the one hand, LST from MODIS (Terra/Aqua) is fundamental for its 1 km spatial resolution, allowing the delineation of fine-scale thermal gradients and detailed signatures across Portugal’s heterogeneous landscape. On the other hand, with a spatial resolution of 3 km to 5 km, MSG-SEVIRI is essential for its high sampling rate (15 min), enabling the deconstruction of the full diurnal cycle and the quantification of regional thermal inertia.

2.4. Data Quality Control (QC)

The QC analysis was conducted to ensure data integrity and reliability, focusing on three core objectives: (i) identification and correction of errors, such as detecting outliers and handling missing values; (ii) consistency and coherence, to ensure comparability across platforms and time scales; and (iii) completeness, to verify the temporal and spatial continuity of the datasets before analysis. The data quality control included a multi-stage filtering process to ensure the dataset’s statistical robustness and geographical relevance, applied to the initial 30 stations. Stage 1 (Statistical Screening and Longevity) aimed to ensure the integrity of the long-term climate analysis and included the following criteria:
  • Stations were restricted to the study area bounded by coordinates 38.3° N to 39.3° N and 8.6° W to 9.6° W, encompassing the LMA and its immediate climatic influence zones.
  • A minimum of 10 years of continuous records within the 2000–2025 window was required to allow for meaningful climatological characterisation, defining the minimum continuous operating lifespan and temporal span of the station’s activity.
  • A threshold of 70% valid observations was enforced, representing the minimum quantitative data density required exclusively within this baseline 10-year minimum operational timeframe. Analysis of missing days and cumulative hourly gaps was performed to ensure that the reliability of long-term trend estimations was not compromised by seasonal biases or instrument downtime.
Following the filtering process, 10 validated stations were integrated into the final database. During Stage 2 (Classification and UHI Sampling), these stations were categorised by land cover and functional representativeness to support the comparative analysis. This curated group, designed to quantify UHI intensity (ΔTu-r), comprises 4 intra-urban stations in densely built-up areas (IPMA 535, IPMA 579, IPMA 919, IPMA 935) and 6 non-urban (rural/peri-urban) stations (IPMA 739, IPMA 762, IPMA 767, SNIRH 5138, SNIRH 5178, SNIRH 5420) that serve as the baseline reference for the undisturbed regional climate. This dual-group configuration allows for a robust assessment of the effective thermal gradient between the urban core and its surroundings. These specific stations were selected over previously excluded ones because they provide a far more accurate representation of the natural topographic and climatic conditions of Lisbon and its surrounding region. Furthermore, this final selection strictly complies with all prior data availability criteria and satisfies climatic representativeness. By capturing the region’s baseline environmental characteristics, these reference stations effectively illustrate what Lisbon’s climate would naturally be in the complete absence of anthropogenic influence.

2.5. Selection of the Master Rural References

The SNIRH 5178 and IPMA 767 stations were designated as the primary regional baselines for Urban Heat Island intensity (ΔTu-r) calculations. Their selection was justified by rigorous criteria to ensure environmental comparability, including orographic and altitudinal parity with the urban study area, a pristine, non-urban signature, and synoptic proximity to the target sites. Furthermore, the statistical robustness of each station’s historical record was evaluated to ensure the reliability of the comparative analysis.
Regarding these specific criteria, elevation parity was preferred to minimise microclimatic distortions caused by the atmospheric lapse rate, ensuring that topography did not introduce artificial thermal gradients. Concurrently, choosing non-urban reference areas dominated by natural vegetation provided a baseline free from anthropogenic heat contamination and surface modifications. This selection effectively captures the regional background climate, as natural land cover prioritises evapotranspiration over sensible heat storage, thereby representing the region’s environmental conditions as they would naturally manifest without urban influence. In terms of spatial distribution, SNIRH 5178 (São Julião do Tojal) is located approximately 5 km from Lisbon Airport and 13 km from the city centre, offering 18.42 years of operation with 76.8% data availability. Complementing this, IPMA 767 (Pegões) is located approximately 45 km from the urban core. It has 13.74 years of records, with a high data availability of 91.9%, contributing over 110,000 valid hourly observations to the study.
The selection of these two stations serves complementary analytical purposes. The closer non-urban reference station (SNIRH 5178) enables the examination of meteorological events with greater geographical proximity and reduced temporal mismatch, as well as the assessment of heterogeneities in wind direction and speed, and the intrusion of maritime or estuarine breezes. This facilitates a comparison that more closely approximates Lisbon’s conditions in the absence of anthropogenic influence. Conversely, the more distant station (IPMA 767) supports a broader, regional-scale analysis, offering greater stability for LST assessment. Owing to its more inland location and thus reduced exposure to maritime influences, it is expected to provide a more stable basis for analysing the differences between LST and in-situ T2m, which is particularly relevant for climatological-scale comparisons.

2.6. Data Processing, Site Classification, and UHI Metrics

To ensure seamless integration between terrestrial and orbital datasets, a rigorous protocol was implemented, starting with temporal synchronisation to Coordinated Universal Time (UTC). This standardisation is essential to eliminate discrepancies from local time adjustments in Mainland Portugal, where legal time shifts between UTC+0 in winter and UTC+1 during the summer daylight-saving period. Following this synchronisation, thermal variability was analysed in relation to land-cover dynamics. This process involved harmonising national COS (Land Cover Map, specifically COS2018 with a 1-hectare minimum mapping unit) and CORINE Land Cover (CLC) categories at a 100-m spatial resolution, using the European Environment Agency (EEA) nomenclature, such as the Continuous Urban Fabric. Consequently, stations were aggregated into macro-occupancy categories—Urban Core (high soil sealing), Peri-urban/Transition (fragmented surfaces), and Rural/Natural (high evapotranspirative potential). Additionally, the data were segmented into seasonal climatological partitions (DJF, MAM, JJA, and SON) to capture specific thermal cycles.
The methodological foundation for this classification is further detailed in Table S1 of the Supplementary Materials, which provides site metadata, operational longevity, and data completeness. This inventory justifies dividing sites into “Urban” and “Rural” categories, which is vital for robustly calculating Urban Heat Island intensity (ΔTu-r). This intensity was quantified as the thermal differential between the Urban Core stations and the Master Rural Reference. To fully characterise the nocturnal development and daytime peak of Lisbon’s thermal anomaly, this metric was evaluated across seasonal scales and key hourly intervals, specifically at 00:00 UTC, 12:00 UTC, and as an Integral Daily Mean. Climate data were processed, and the corresponding figures were generated, using the Spyder Integrated Development Environment (IDE, version 5.4.5 64-bit) Python environment.

3. Results and Discussion

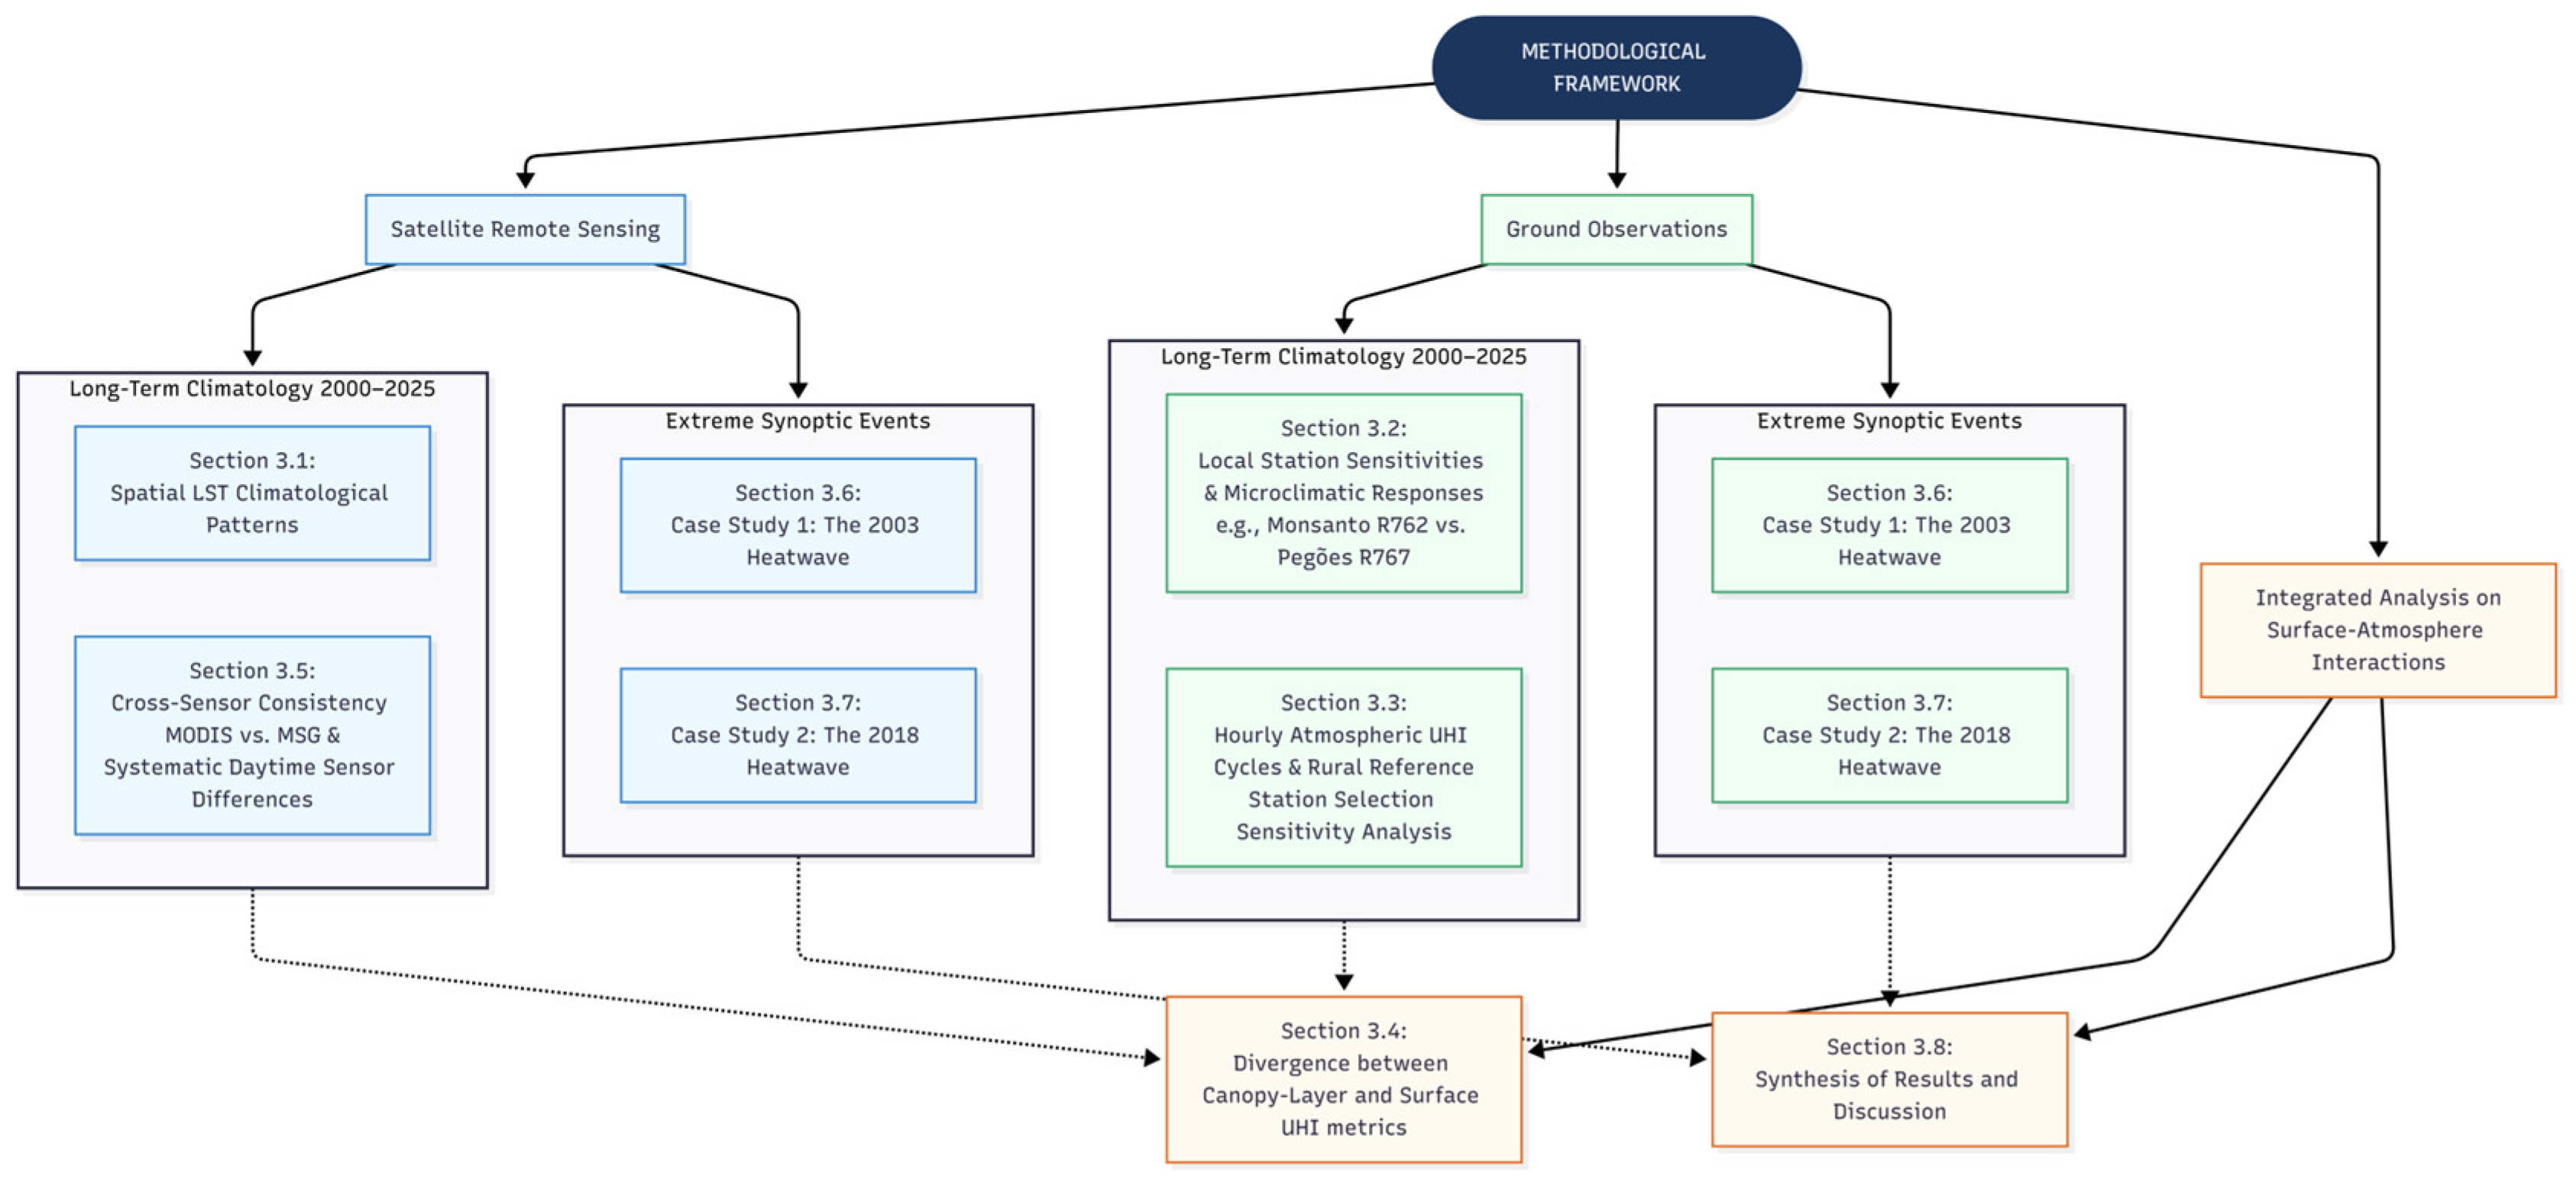
This section presents the spatio-temporal dynamics of LST and the SUHI effect across the LMA over the 26-year climatological period 2000–2025. The analysis is structured to first address the observational complementarity of the satellite sensors, followed by a characterisation of the regional climatological baseline. Special emphasis is placed on the decoupling between surface and atmospheric heat islands and the role of land-use heterogeneity and mesoscale geographic modulators, such as the Atlantic Ocean and the Tagus River estuary, in shaping LMA’s thermal resilience during periods of extreme heat. A summary of the subheadings below is provided in Figure 2.

3.1. LST Climatology

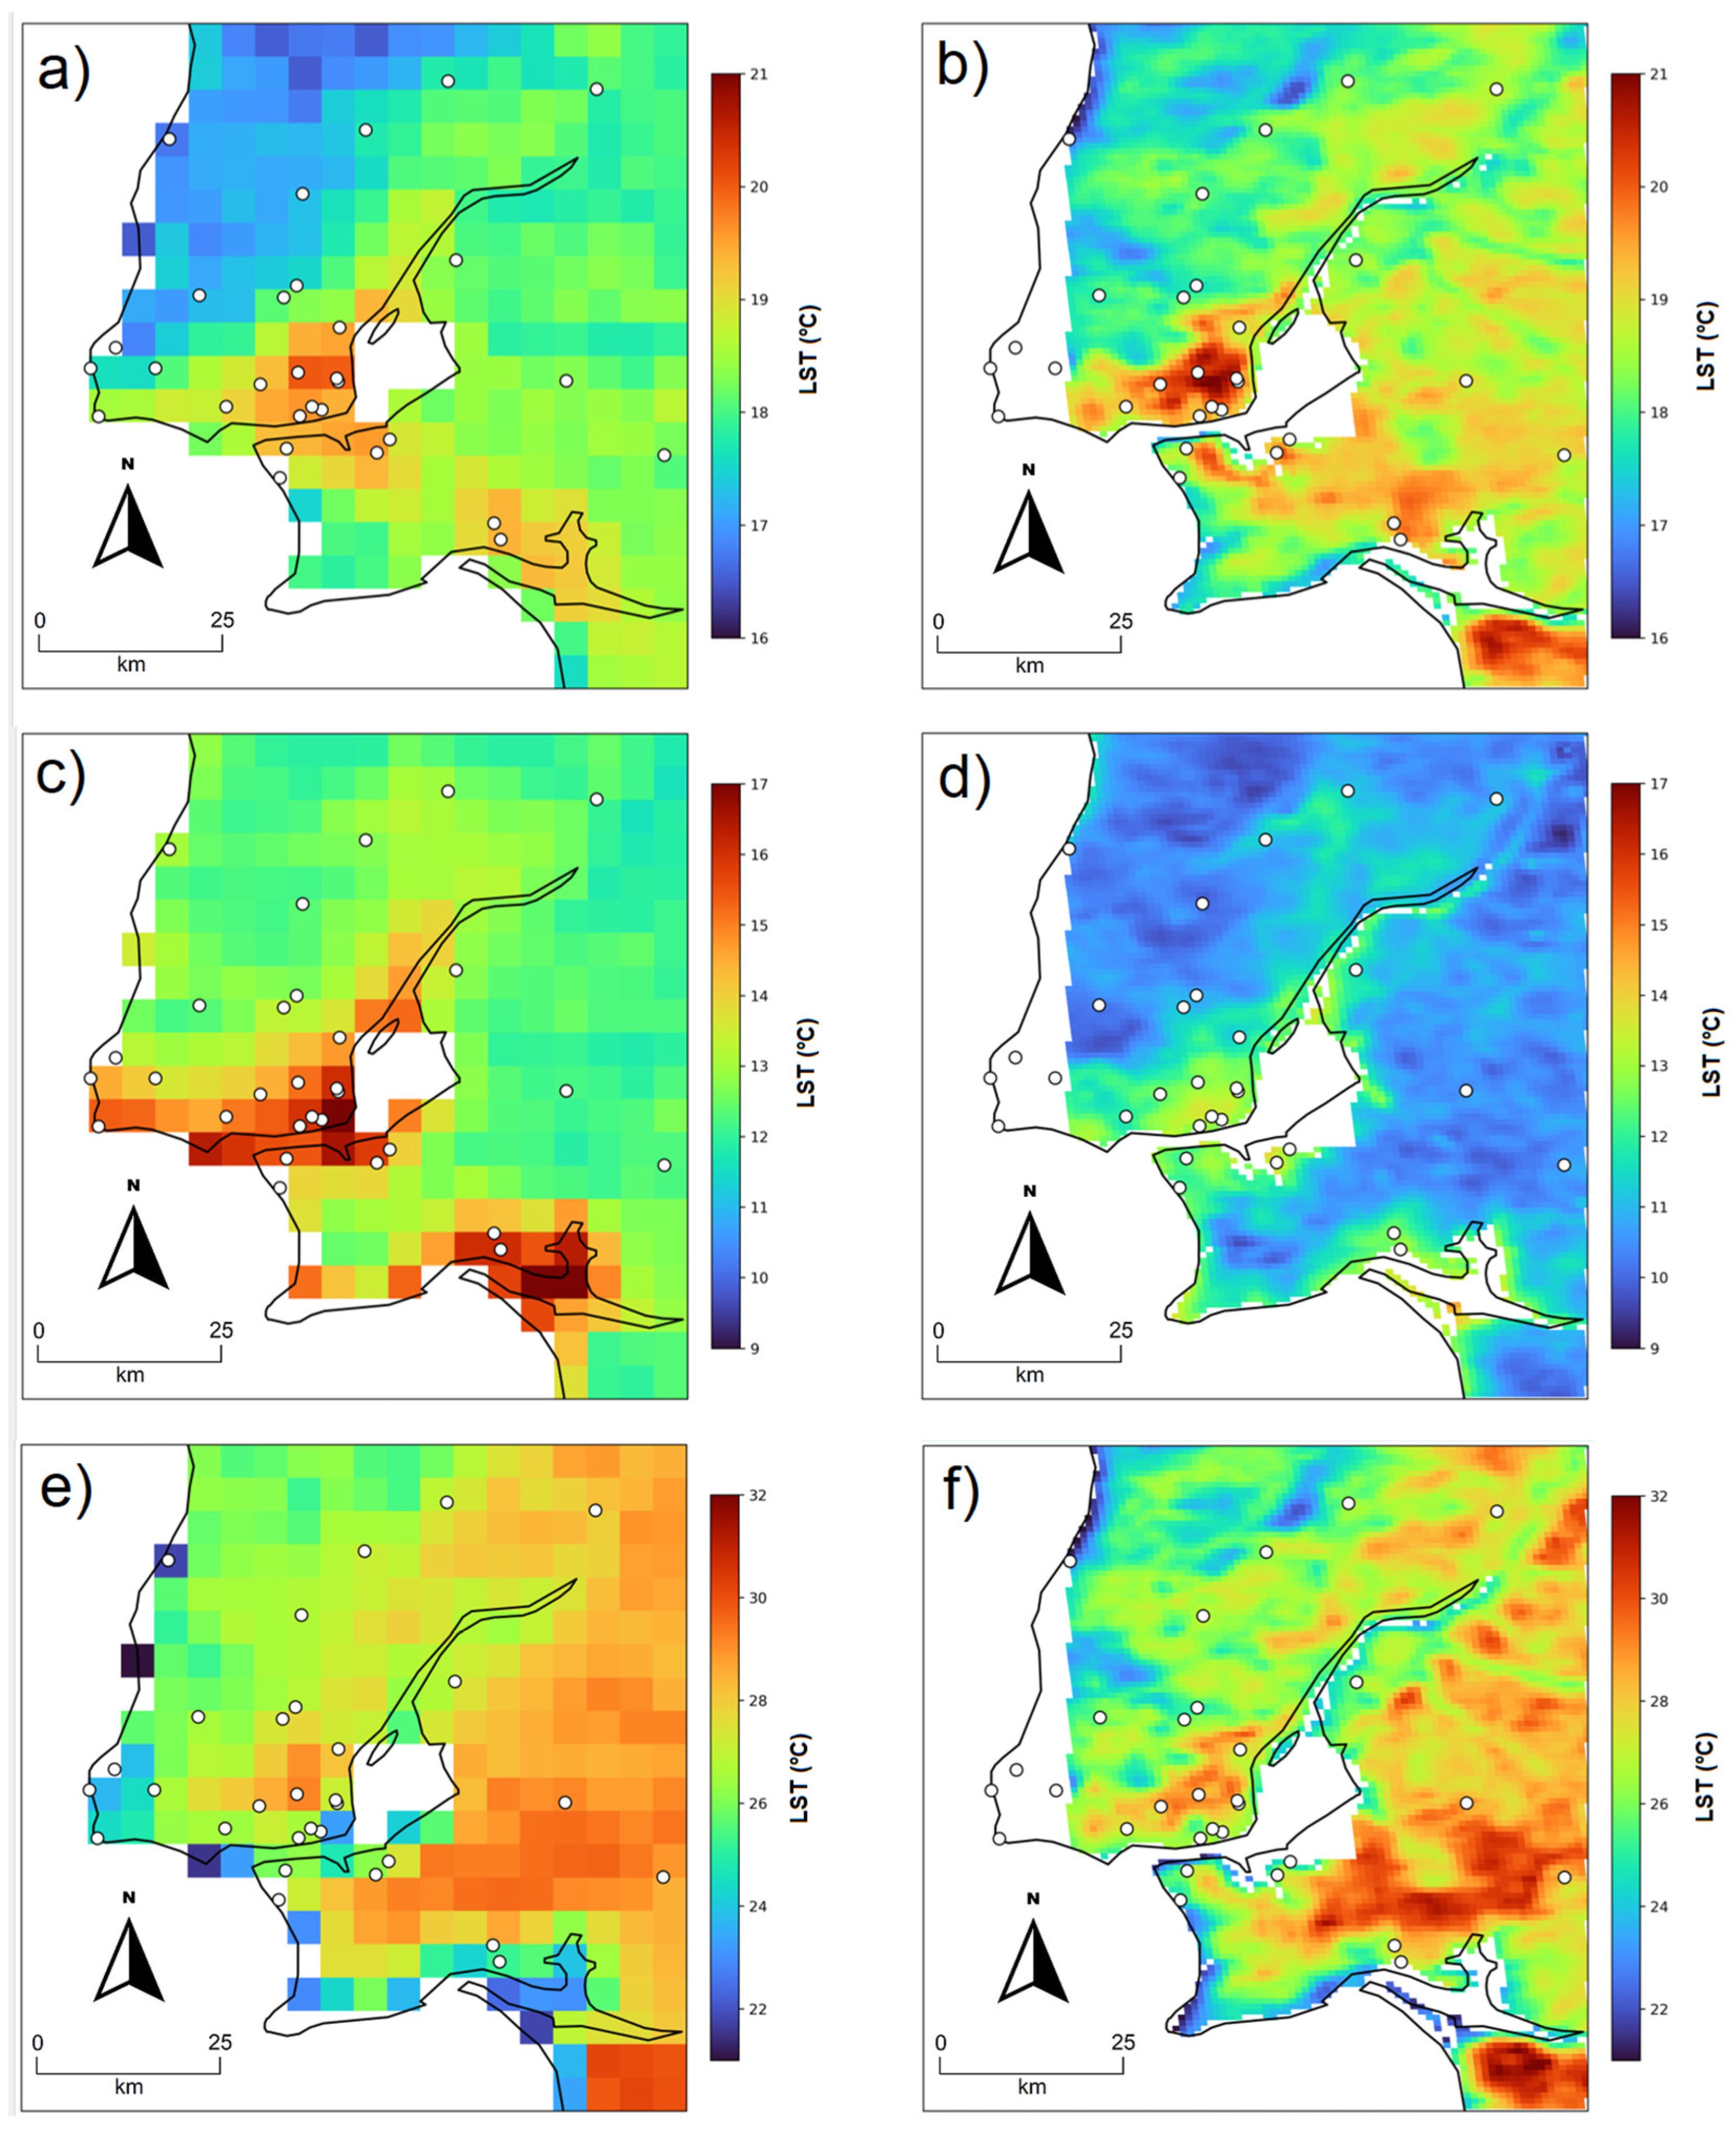
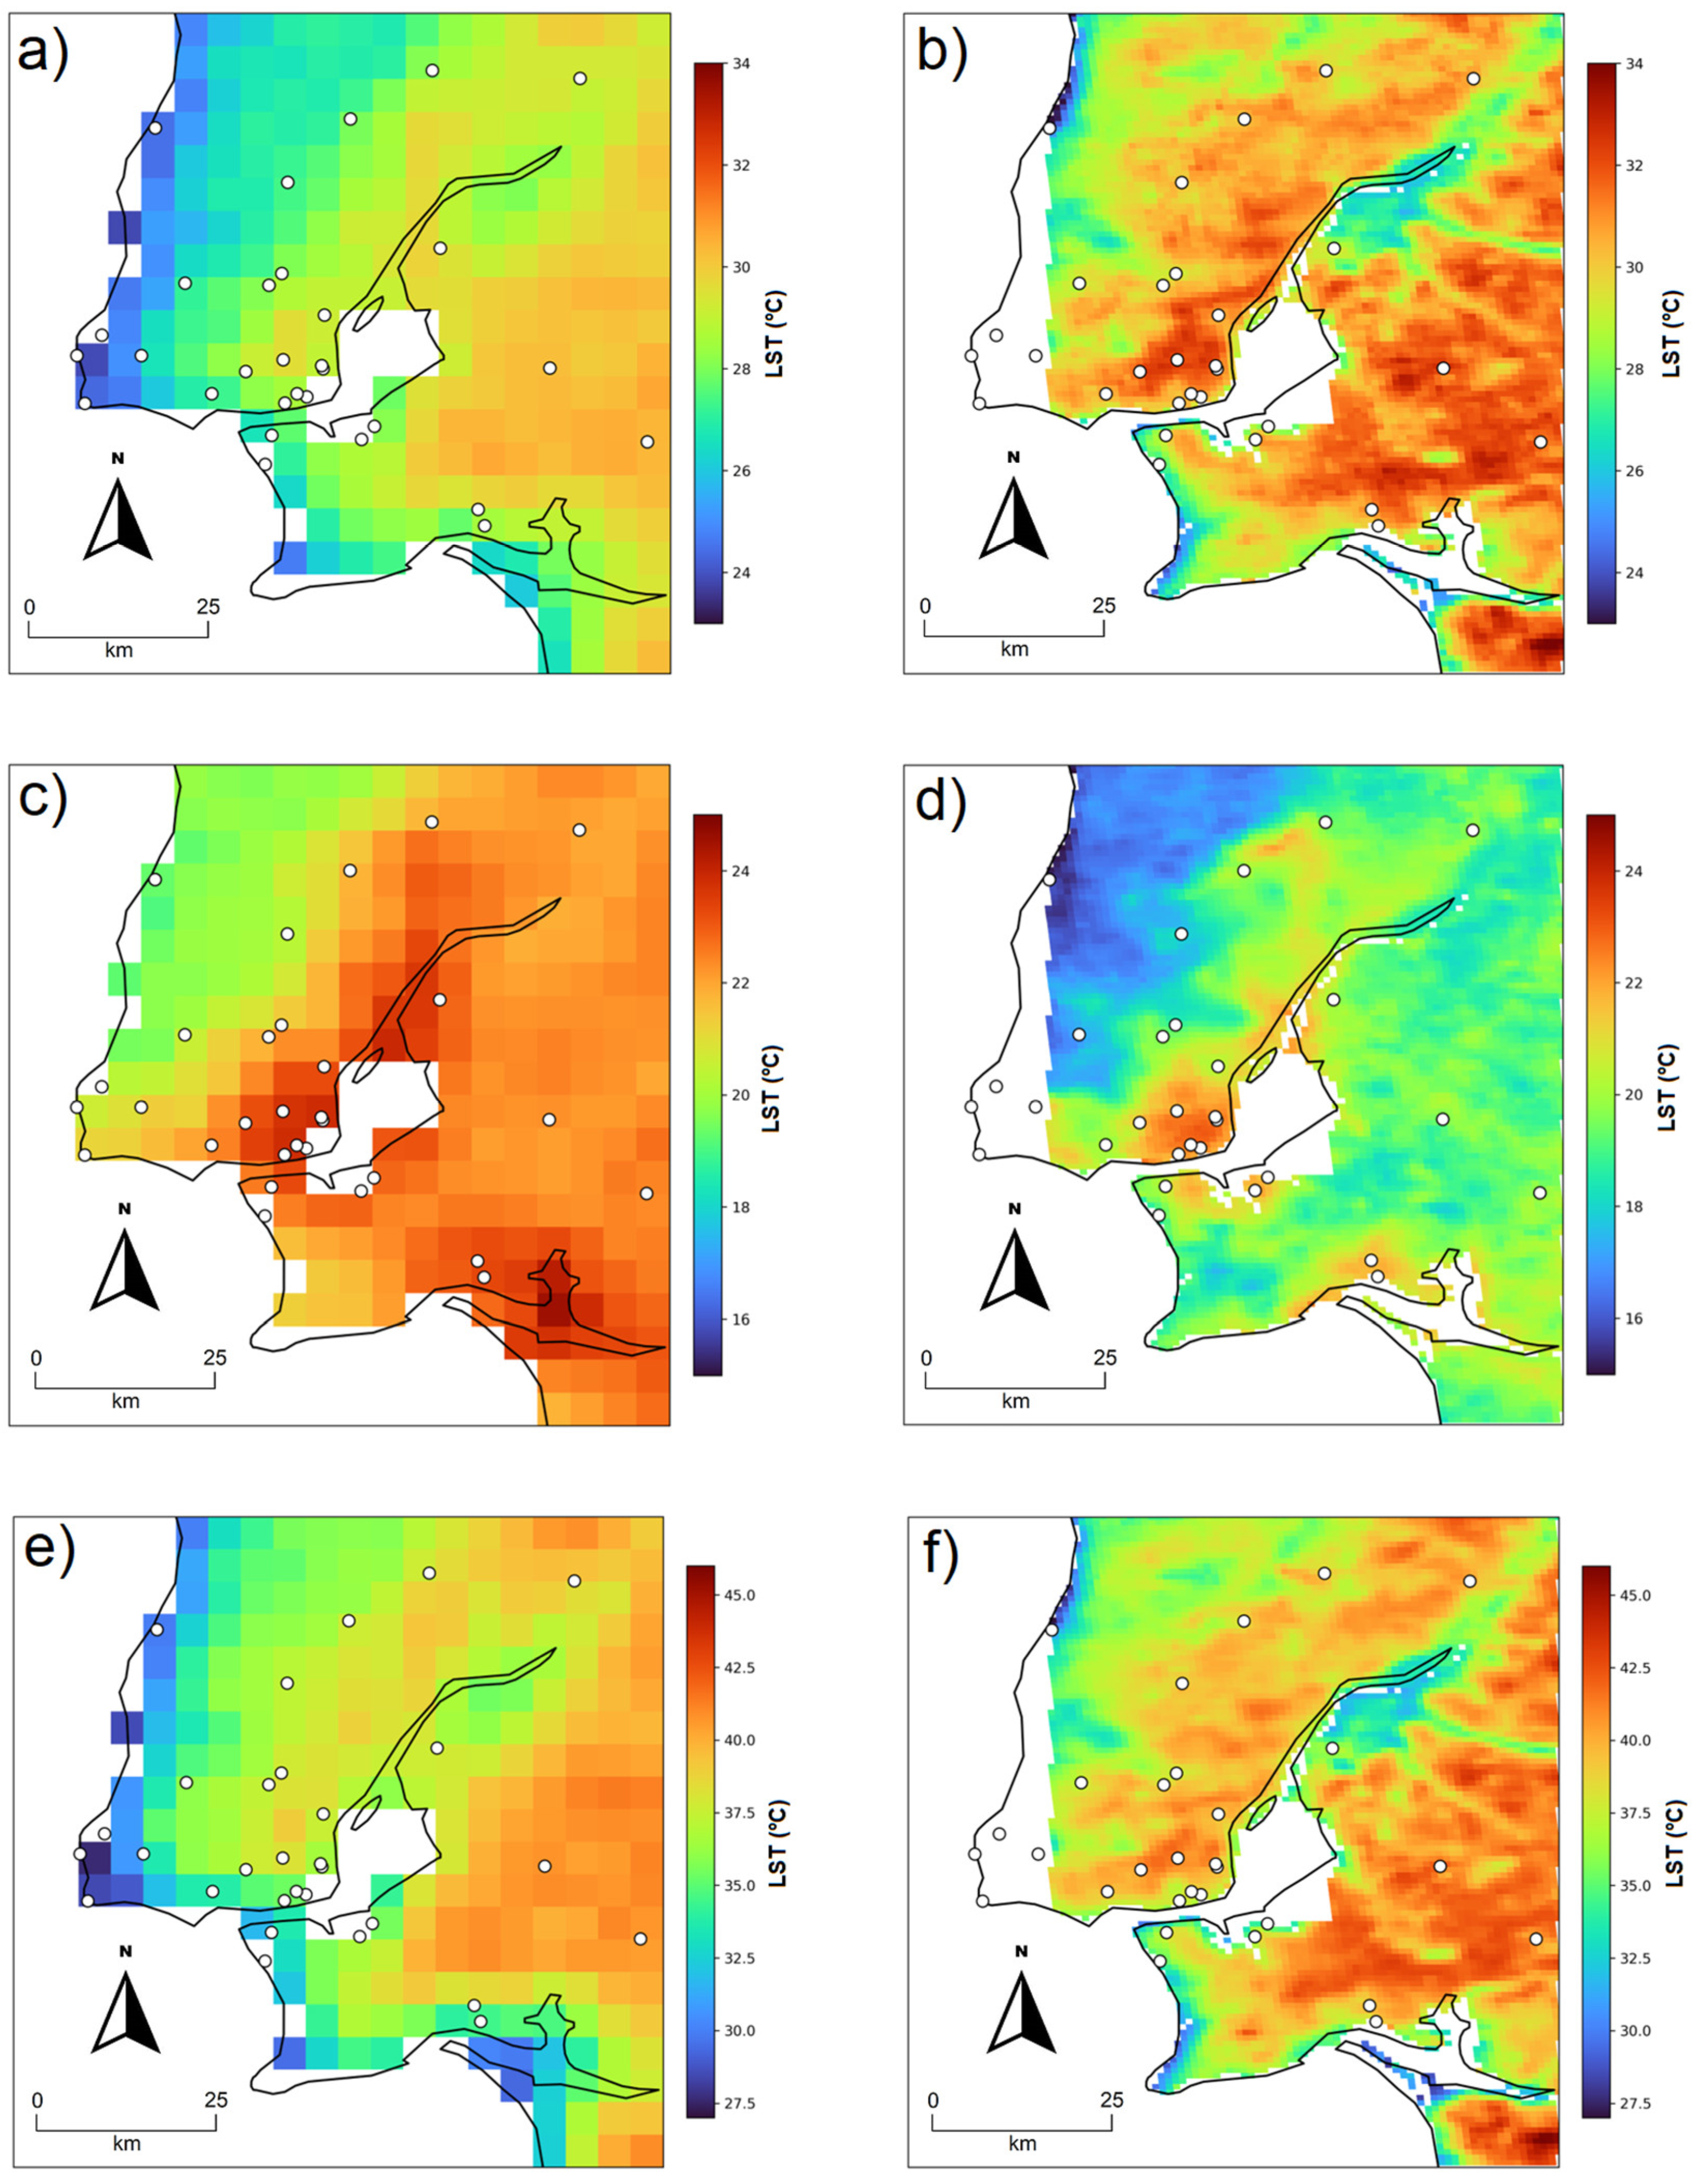
Figure 3 illustrates the multi-decadal climatological mean LST across the Lisbon Metropolitan Area (LMA), contrasting MSG-SEVIRI (left column: panels a, c, e) and MODIS (right column: panels b, d, f). The annual climatological mean serves as the foundational reference, revealing a persistent thermal signature governed by a complex feedback loop between artificial surfaces and proximity to the Atlantic and Tagus. Regarding the annual footprint, MSG-SEVIRI identifies a warm core extending north-eastward over the urban fabric (~20 °C, 16 °C, and 27 °C for the daily mean at 00:00 UTC and 12:00 UTC, respectively). MODIS adds morphological detail by detecting nocturnal cooling in Monsanto Forest Park and in high-albedo estuarine areas, which serve as sub-pixel features for the coarser MSG-SEVIRI grid.
During the nocturnal period at 00:00 UTC (Figure 3c,d), the thermal inertia of the urban environment becomes prominent. While rural and forested areas undergo rapid radiative cooling (12–13 °C), consolidated urban zones retain heat (approx. 15–17 °C). At 00:00 UTC, MSG-SEVIRI captures a nocturnal warm island over impervious areas, while MODIS reveals sharp thermal boundaries along the Tagus estuary. The estuary acts as a thermal stabiliser, remaining warmer than the rural soil but cooler than the urban core. During the 12:00 UTC peak, MSG-SEVIRI records higher LST in eastern sectors. In contrast, MODIS highlights localised heating in the South Bay, accurately mapping watercourses and the estuarine breeze that moderates shoreline temperatures.
The LST diurnal peak at 12:00 UTC (Figure 3e,f) indicates maximum thermal intensity, with inland temperatures exceeding 30 °C. A pronounced land–sea contrast is evident, with the Atlantic maritime influence and the prevailing north Tagus sea breeze system maintaining significantly cooler coastal margins. A pronounced decoupling exists between remote-sensing SUHI and CUHI (Figure 3, Figures S5 and S6). During the diurnal peak, LST significantly exceeds T2m in sealed zones because of the low albedo and high thermal admittance of urban materials [20,24,25]. Conversely, the maximum atmospheric UHI typically occurs at night; as the rural periphery cools rapidly after sunset, the urban fabric’s ‘thermal memory’ slowly releases stored sensible heat. This reservoir effect prevents heat dissipation, significantly amplifying thermal stress during summer heatwaves (JJA).
Lisbon’s thermal landscape is modulated by the Tagus estuary, which acts as a diurnal ‘cold pool’ (Figure 3f) but remains warmer than the land at night due to its high heat capacity (Figure 3d). Additionally, MODIS precisely captures a microclimatic inversion in the Ribatejo thalwegs, where surface water and riparian vegetation induce evaporative cooling, keeping valley bottoms cooler than exposed ridgelines during the day. Thermal contrasts align closely with CLC classifications. The Urban Core (around 18 °C annual mean) differs sharply from peri-urban sectors (<16 °C), with ‘Continuous Urban Fabric’ and ‘Airports’ showing high radiative absorption and minimal latent heat flux. Ground observations at Amoreiras (IPMA 919) and Amadora (IPMA 935) corroborate this (Figure 4), with extensive soil sealing exacerbating sensible heat release.

3.2. Diurnal LST Trajectories and Site-Specific Thermal Dynamics

Due to its fixed geostationary position, MSG-SEVIRI provides a unique advantage for continuous climate monitoring, enabling high-frequency sampling of LST. This captures the full thermal trajectory of the urban environment and enables precise evaluation of intensification and cooling rates across Lisbon’s diverse land-use classes. Across the analysed non-urban stations (Figure S5), peak LST values were consistently recorded at 13:00 UTC, shortly after the solar zenith, reflecting the thermal inertia of natural surfaces. However, specific sites reveal significant microclimatic particularities. For instance, Station R762, although situated within the urban polygon, functions as an Urban Freshness Island (UFI); its location within a large-scale green area results in T2m consistently lower than the corresponding LST, with nocturnal differentials approaching 2 °C due to dense vegetation and active evapotranspiration. In contrast, Station R767 exhibits the highest T2m amplitudes in the network, a behaviour attributed to its pronounced continentality. At this inland location, the cooling properties of maritime breezes are significantly attenuated, resulting in the smallest observed differential between T2m and LST during the diurnal peak.
As with the non-urban sites, peak LST for all analysed urban stations (Figure S6) occurs at 13:00 UTC, though distinct modulations are observed due to proximity to the estuary. Station U535, in particular, shows a high degree of convergence between T2m and LST with minimal differences throughout the diurnal cycle, a stability driven by sub-pixel interactions with the Tagus River. Uniquely, T2m at this site is lower at 15:00 UTC than at 13:00 UTC—a trend contrary to all other stations. This phenomenon is driven by immediate exposure to estuarine breezes, which provides a localised cooling effect absent at more inland urban locations.

3.3. Diurnal Evolution of Canopy-Layer UHI and Reference Sensitivity

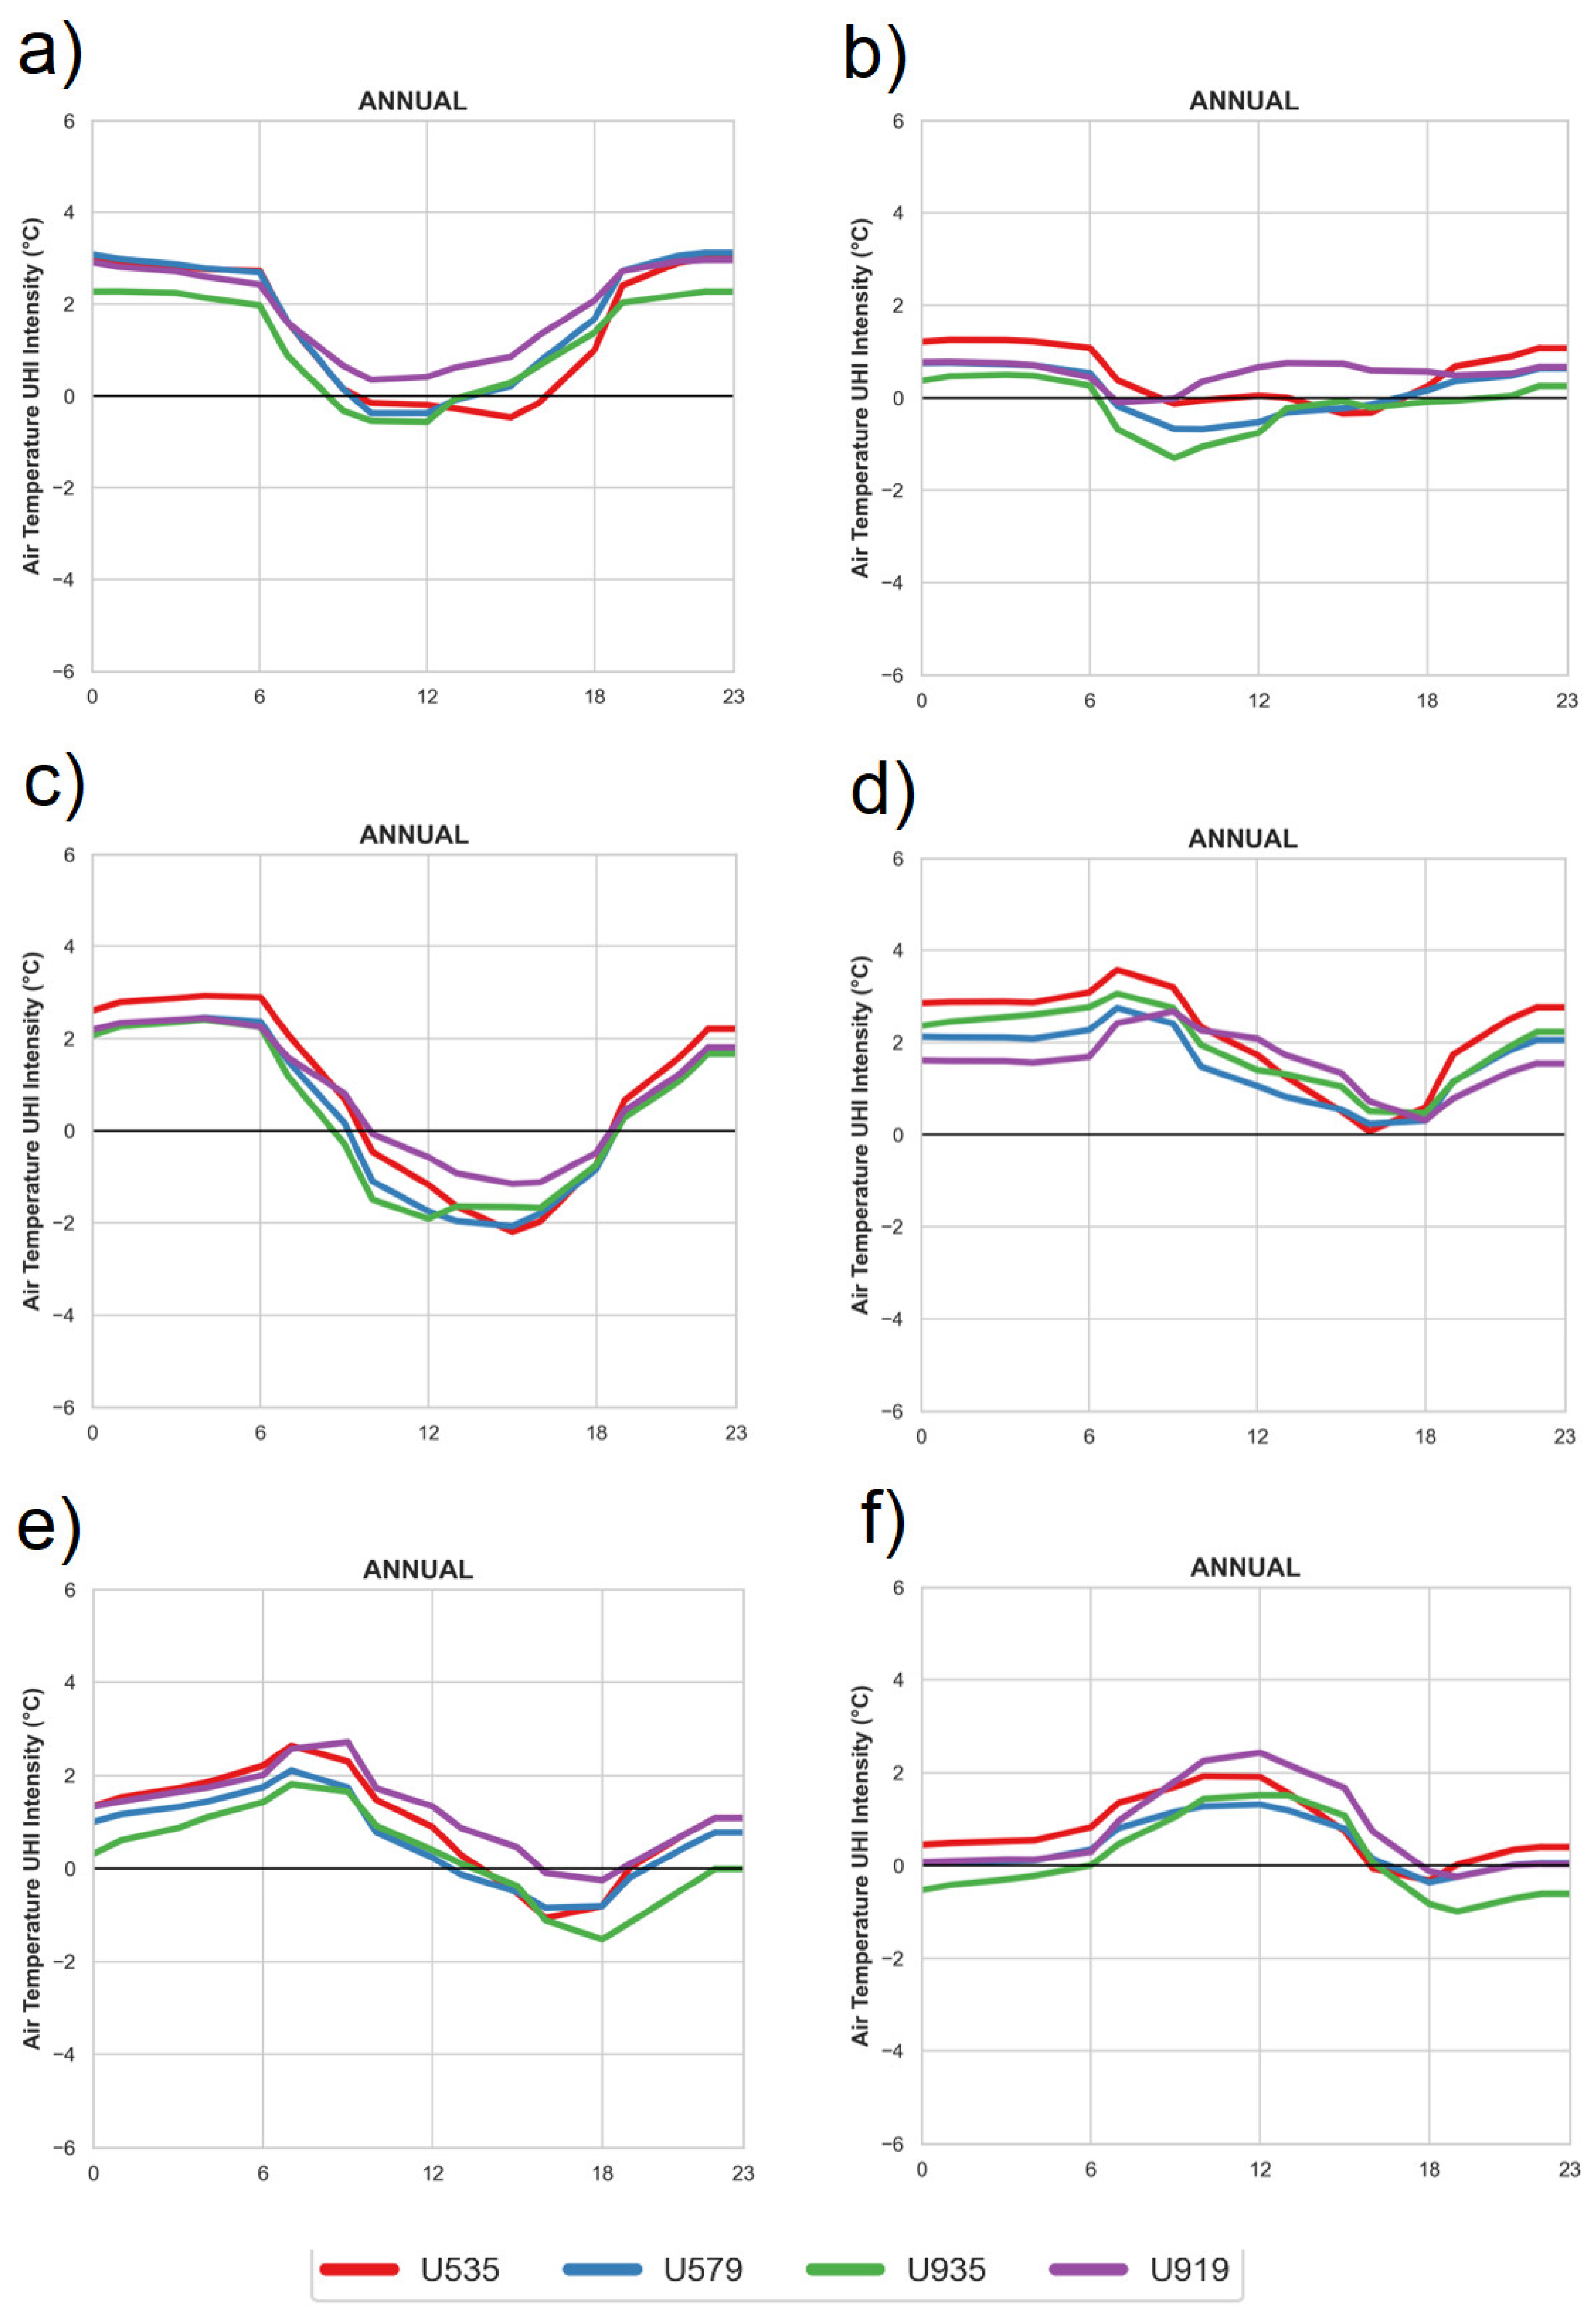
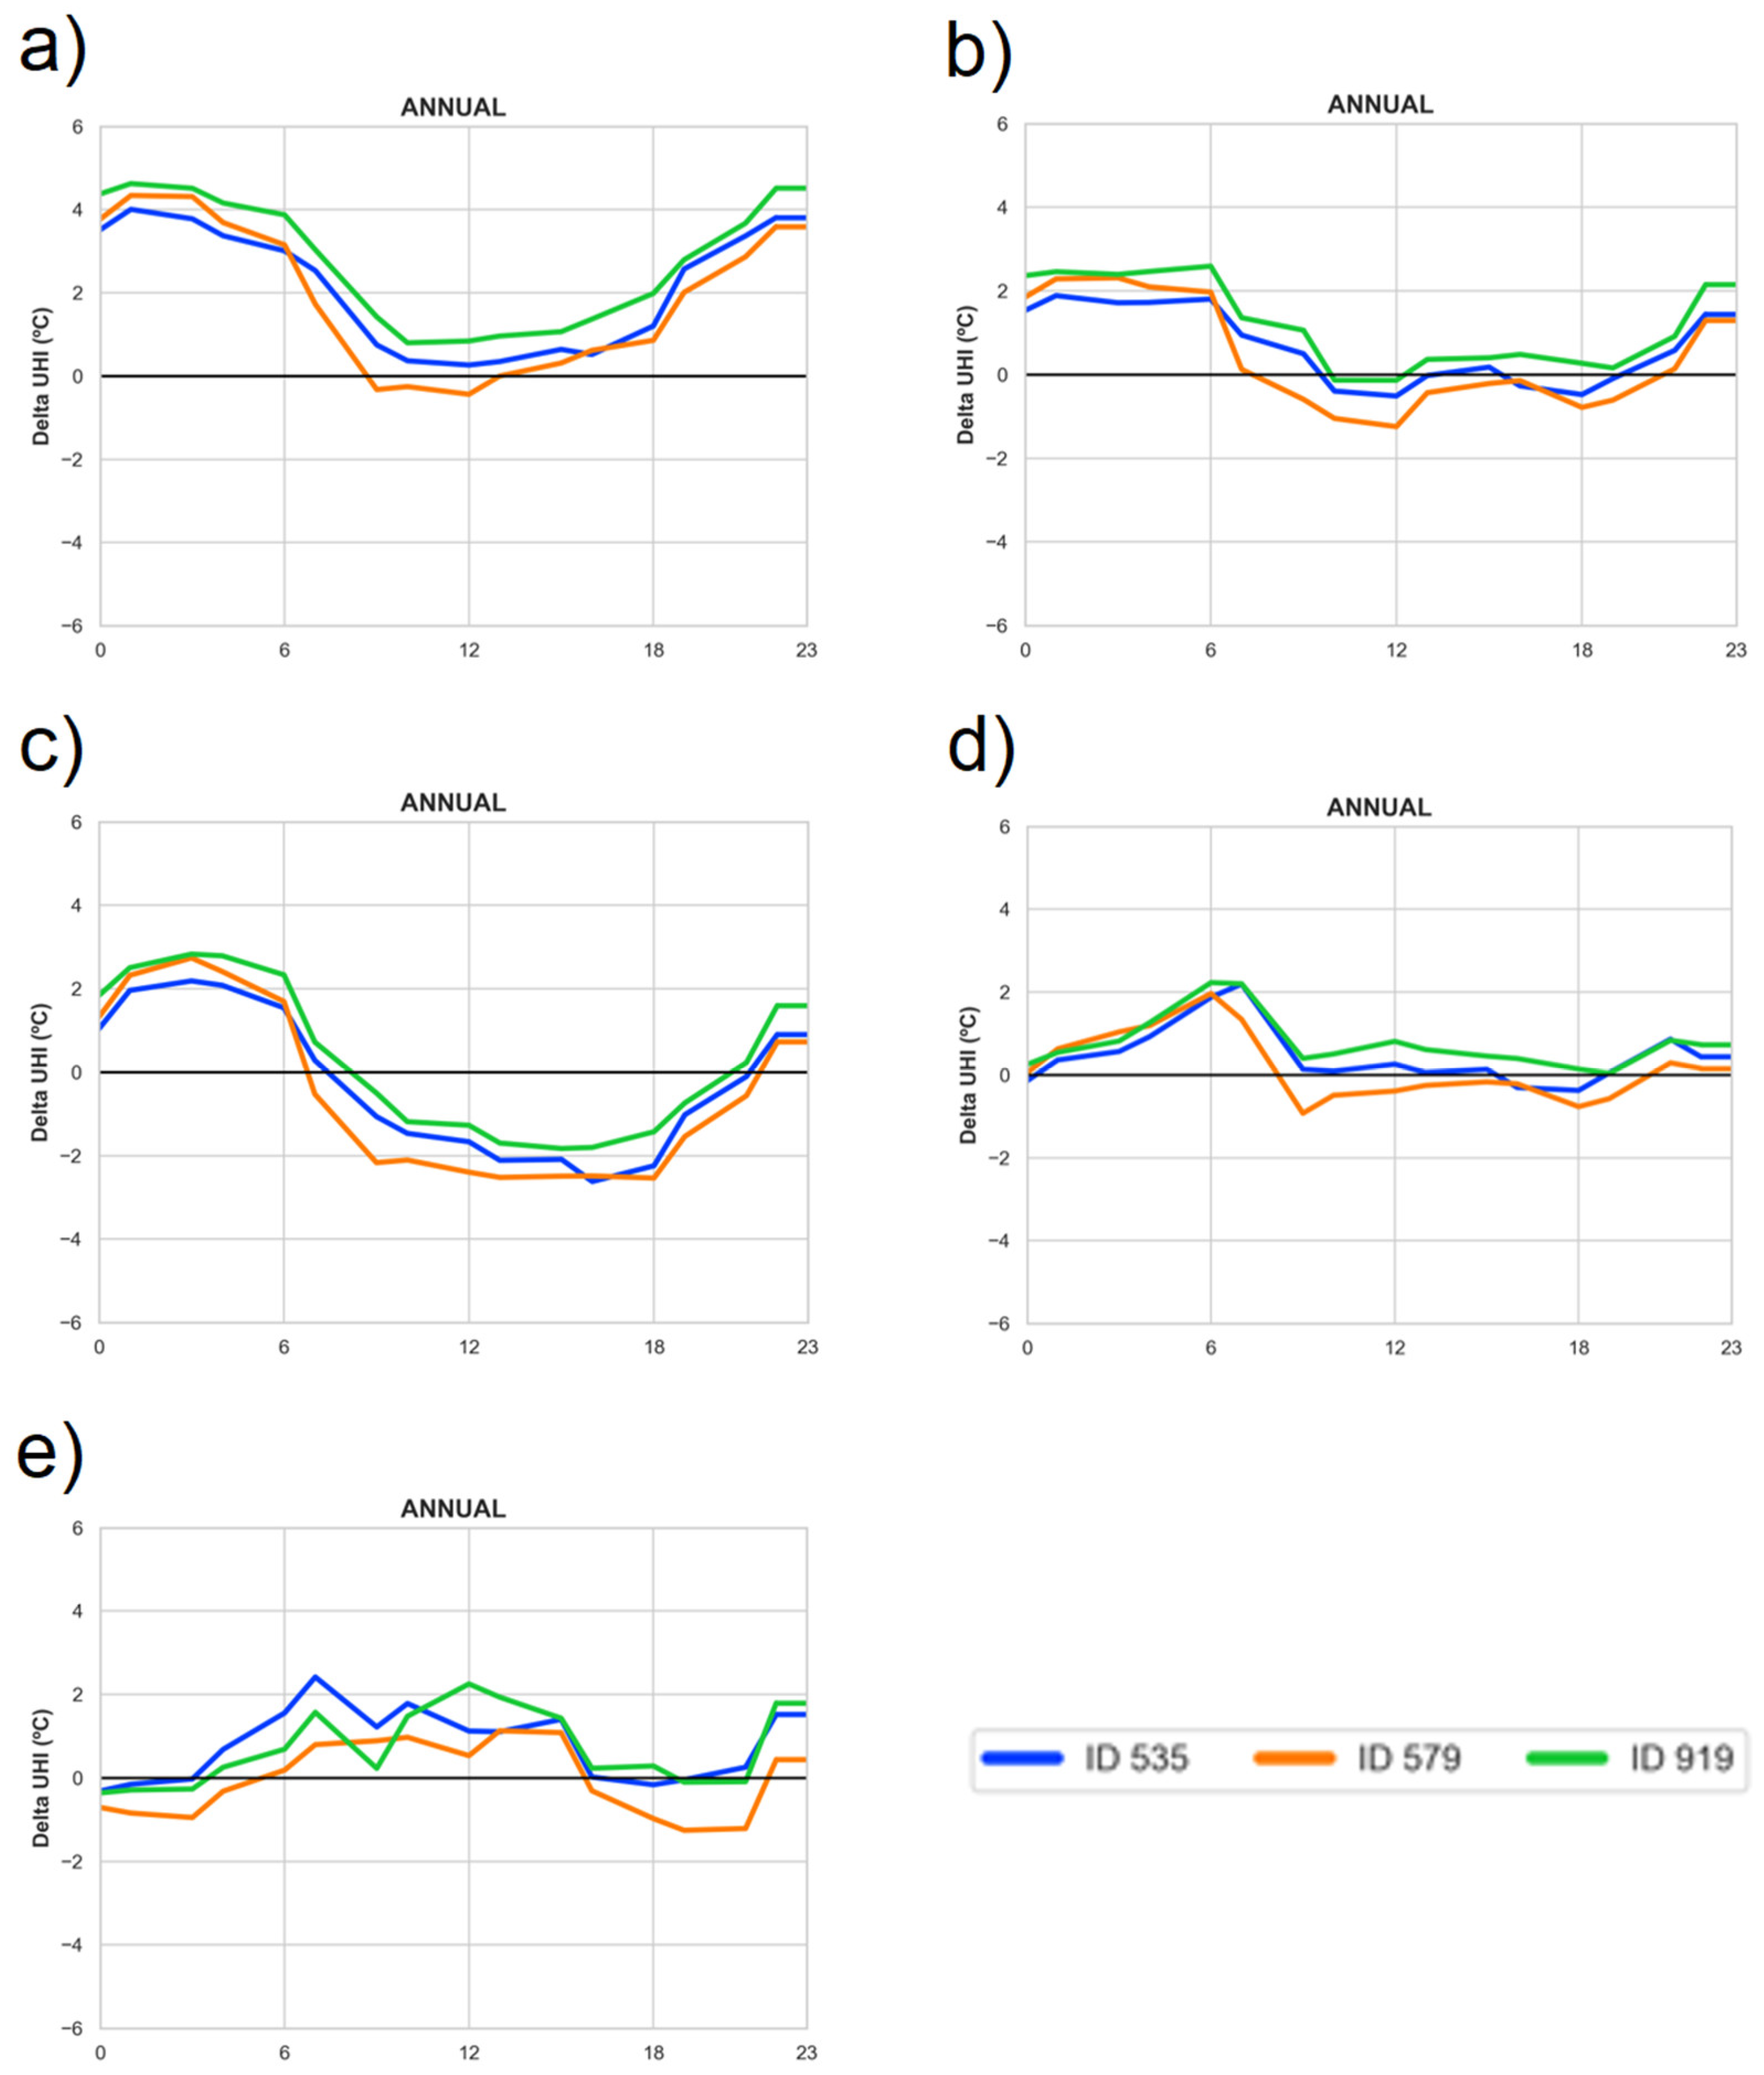
Figure 5 illustrates the annual hourly average of the T2m UHI intensity for six urban stations relative to non-urban references, revealing a well-defined diurnal oscillation. Across panels (a), (c), and (d), a robust nocturnal UHI is observed between 20:00 and 06:00 UTC, with intensities frequently exceeding 2 °C to 3 °C. This persistence reflects the built environment’s high thermal mass, which inhibits radiative cooling relative to rural surroundings. Following sunrise, UHI intensity decreases sharply. In comparison with reference stations (a), (b), and (c), a general negative intensity—or Urban Cool Island (UCI) effect—is observed during the midday period (12:00 to 15:00 UTC).
The urban heat island exhibits clear diurnal dynamics, with intensity typically weaker during the day than at night. This pattern is fundamentally caused by enhanced daytime convective mixing and weaker atmospheric stability, which promote the efficient upward transport of urban thermal energy. Additionally, this effect is associated with the higher thermal inertia of materials in denser areas and the reduced solar elevation, which promotes shading in compact urban zones. As the day progresses, this shading effect diminishes, and the thermal differences between dense and less dense areas tend to disappear by the afternoon. Finally, the variation between the four reference lines in each panel underscores that UHI magnitude is highly sensitive to both site-specific land-use characteristics and the choice of the rural reference station.
The results confirm that while the UHI in Lisbon is primarily a nocturnal atmospheric phenomenon, the surface-level signal (SUHI) intensifies distinctly during daylight hours. This decoupling necessitates a multi-sensor approach to understand the transition from radiative surface heating to canopy-layer air-temperature lags, particularly in coastal metropolitan environments, where mesoscale circulations further complicate the surface energy budget.

3.4. Consistency and Divergence Between Canopy-Layer and Surface UHI Metrics

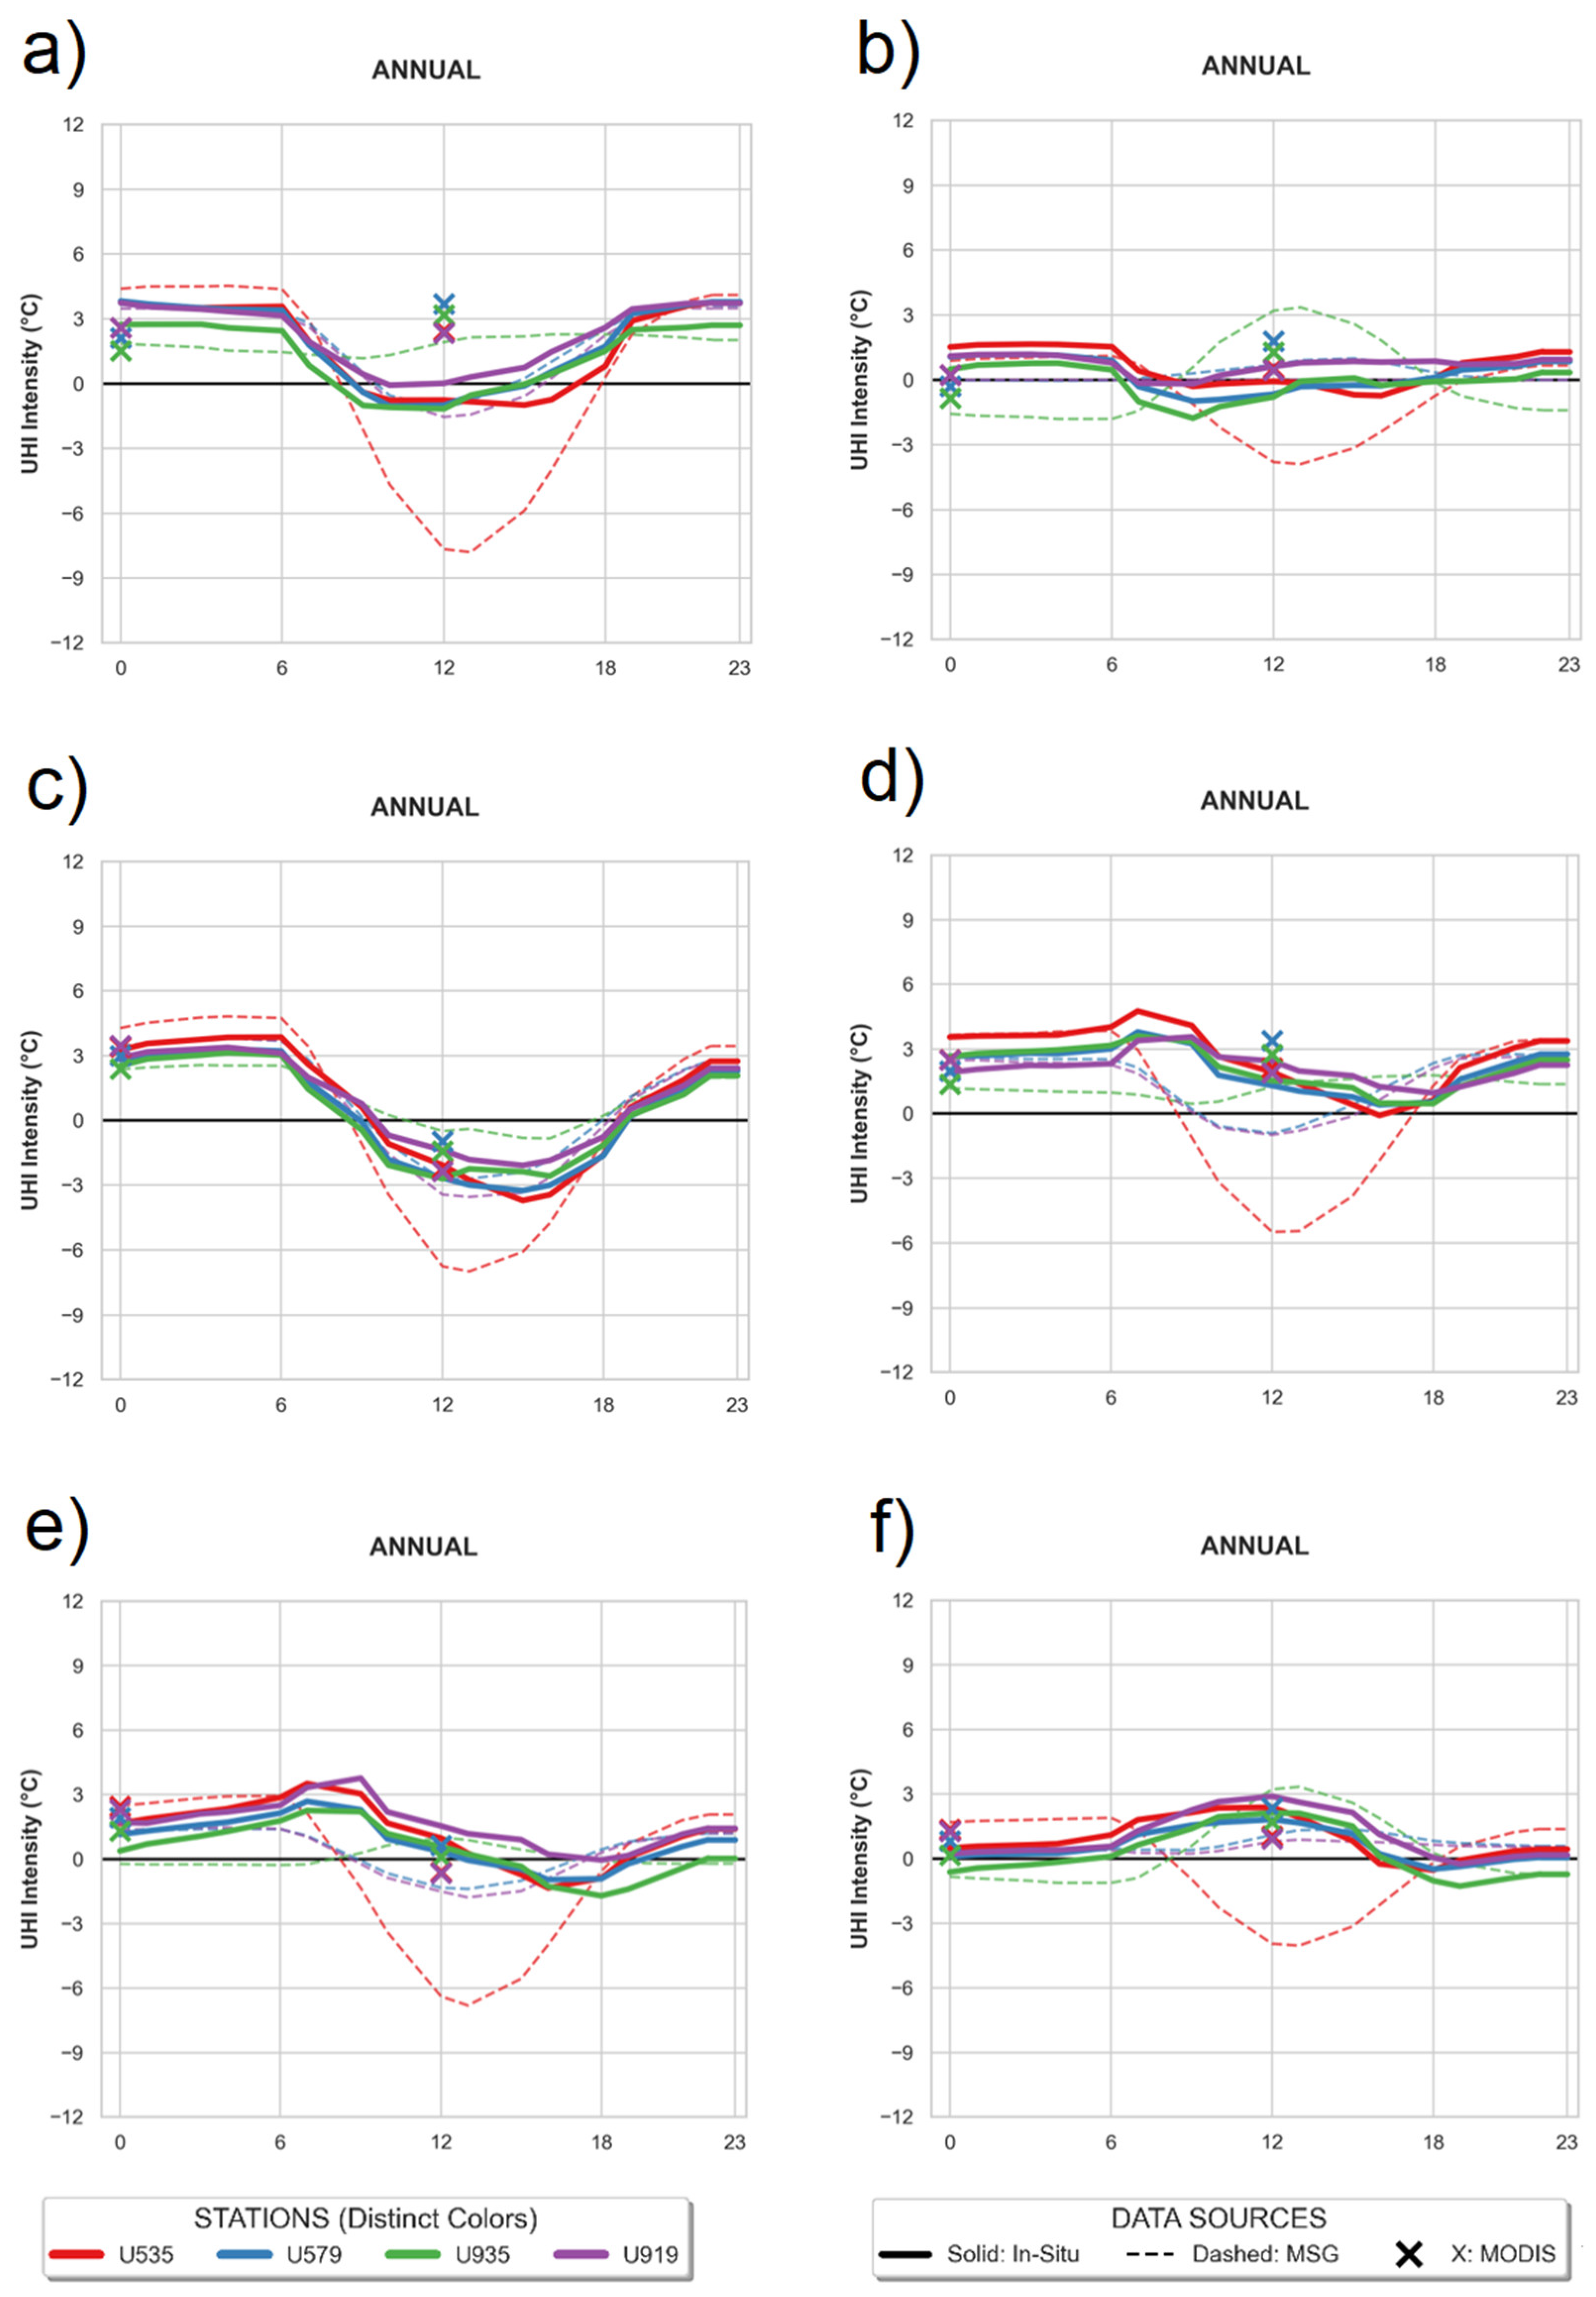
Figure 6 evaluates the consistency between ground-based observations (solid lines) and satellite-derived LST products (dashed lines for MSG-SEVIRI; cross markers for MODIS), revealing distinct physical and sensor-related trends. A significant decoupling is observed during daylight hours, as illustrated in Panels (a), (c), and (d). While in-situ data often show a moderated Urban Cool Island (UCI) or near-zero intensity at midday, MSG-SEVIRI results frequently exhibit a deeper negative peak, reaching intensities below −6 °C in certain rural-reference pairings. This discrepancy is particularly evident for station U535 (Lisboa-Geofísico), partly due to pixel interactions with the adjacent water body, and underscores the fundamental difference between “skin” temperature (LST) and canopy-layer air temperature (T2m). This occurs because rural soil surfaces heat up more intensely under direct radiation than the shaded urban canopy.
In contrast, strong agreement is observed between 20:00 and 06:00 UTC, with UHI intensities generally converging within the 2–4 °C range. This nocturnal convergence confirms that satellite-derived LST is a highly reliable proxy for the canopy-layer UHI at night, when solar-induced surface skin effects are absent. This inter-sensor consistency is further validated by MODIS snapshots, which align closely with the MSG-SEVIRI trend lines, supporting the use of polar-orbiting sensors to capture representative snapshots of Lisbon’s thermal cycle despite their limited temporal sampling. Finally, Panels (e) and (f) exhibit a damped diurnal cycle across all platforms, reflecting site-specific moderation. These locations are subject to stronger maritime or estuarine influences, which reduce the thermal contrast between urban and rural surface types and slow nocturnal cooling, regardless of measurement height or platform.
While conventional UHI studies utilise rural stations as a baseline, the approach illustrated in Figure S7 treats urban sites as the reference to allow for a granular assessment of how various rural environments behave relative to the city’s thermal characteristics and its sensitivities throughout the annual cycle. The results reveal a significant urban–rural thermal divergence; in all panels (a–d), non-urban stations exhibit negative values during nocturnal and morning hours, indicating they are substantially cooler than the urban reference. However, during the afternoon, several non-urban sites approach or exceed urban temperatures, particularly in comparison with the stations represented in panels (a) and (b). Station R767, in particular, displays the highest daily thermal amplitude, a behaviour attributed to its pronounced continentality and lack of exposure to modulating maritime breezes.
The nocturnal period, between 22:00 and 06:00 UTC, exhibits the highest negative magnitudes, with differences frequently reaching −2 °C to nearly −4 °C. This quantifies the superior cooling rates of rural land-use types, such as sclerophyllous vegetation and vineyards, compared with the high heat-retention capacity of the continuous urban fabric. Furthermore, the observed non-urban heterogeneity—evidenced by divergences between specific references such as annual crops (R5138) and fruit trees or berry plantations (R739)—demonstrates that vegetation type and soil moisture are critical factors in determining the magnitude of thermal contrast, even over short distances. Ultimately, this inverse analysis provides a physical explanation for why satellite sensors often record a “Daytime Urban Cool Island,” as rural land surface temperatures (LSTs) rise faster than the shaded urban canopy T2m during peak solar hours.
The integration presented in Figure 6 underscores that while satellites effectively capture the extreme radiative heterogeneity of the urban surface during the day, the in-situ network remains essential for characterising the moderated thermal environment at the pedestrian level. This dual-source approach provides the necessary validation for the subsequent analysis of extreme heatwave events.
The analysis of the four urban stations reveals distinct thermal signatures that underscore the high heterogeneity of Lisbon’s urban fabric (Figures S8–S13). Station U535 (High-Density Morphological Outlier): This site exhibits the most significant divergence between LST and ambient air temperature (T2m). While in-situ sensors record a robust nocturnal CUHI, MSG-SEVIRI estimates consistently show an extreme “Urban Cool Island” (UCI) effect during daylight hours, with negative deviations of up to −10 °C in summer (JJA). This suggests that U535 UHI is underestimated due to MSG-SEVIRI’s coarse spatial resolution (3 × 3 km), so pixels proximal to the estuary integrate thermal signatures from both the urban fabric and the water. Because water bodies have high thermal inertia and lower daytime temperatures, this integration leads to a drastic underestimation of urban heat. In addition, this weather station is situated within a high-density urban canyon, where radiative shading significantly reduces the surface “skin” temperature as perceived by geostationary sensors, despite the heat trapped within the canyon.
Station U579 (Baseline Sensitivity): U579 proves highly sensitive to the reference station selection. Its UHI signature is virtually neutralised with a baseline of R5420 but becomes prominent with a baseline of 739, indicating a transitional urban-fringe microclimate that is easily masked by localised warming at the reference site. Station U919 (Thermal Stability): In contrast to U535, station U919 exhibits the highest thermal stress, maintaining positive UHI intensities throughout the diurnal cycle across most baselines (notably 5138 and 5178). The convergence between MODIS and in-situ data suggests a more open Sky View Factor (SVF) or materials with high thermal admittance, allowing LST to more accurately reflect T2m. Station U935 (Nocturnal Thermal Storage): Serving as a primary indicator of nighttime heat release, this station consistently records peak UHI intensities between 00:00 and 06:00 UTC.
A fundamental divergence is observed between the Surface Urban Heat Island (SUHI), as captured by satellite LST, and the Canopy-layer Urban Heat Island (CUHI) measured in-situ. During the daytime decoupling phase, particularly between 10:00 and 14:00 UTC under peak solar radiation, MSG-SEVIRI results consistently underestimate UHI intensity, often reporting a negative Urban Cool Island (UCI). This phenomenon is likely attributable to LST sensors measuring the radiative “skin” temperature, which includes shaded building tops, whereas in-situ sensors record ambient air temperatures that are heated by sensible heat flux and longwave radiation within urban canyons. Furthermore, sensor performance and resolution play a critical role in these discrepancies: while the high temporal but low spatial resolution of MSG-SEVIRI tends to smooth thermal peaks and is susceptible to anisotropic effects in Lisbon’s rugged topography, MODIS demonstrates a higher correlation with in-situ midday T2m. By capturing urban “hotspots” with 1 km precision, MODIS data confirm that the negative intensities observed in MSG-SEVIRI are largely sensor-specific artefacts rather than accurate reflections of the canopy-level climate.

3.5. Remote Sensing Operational Reliability

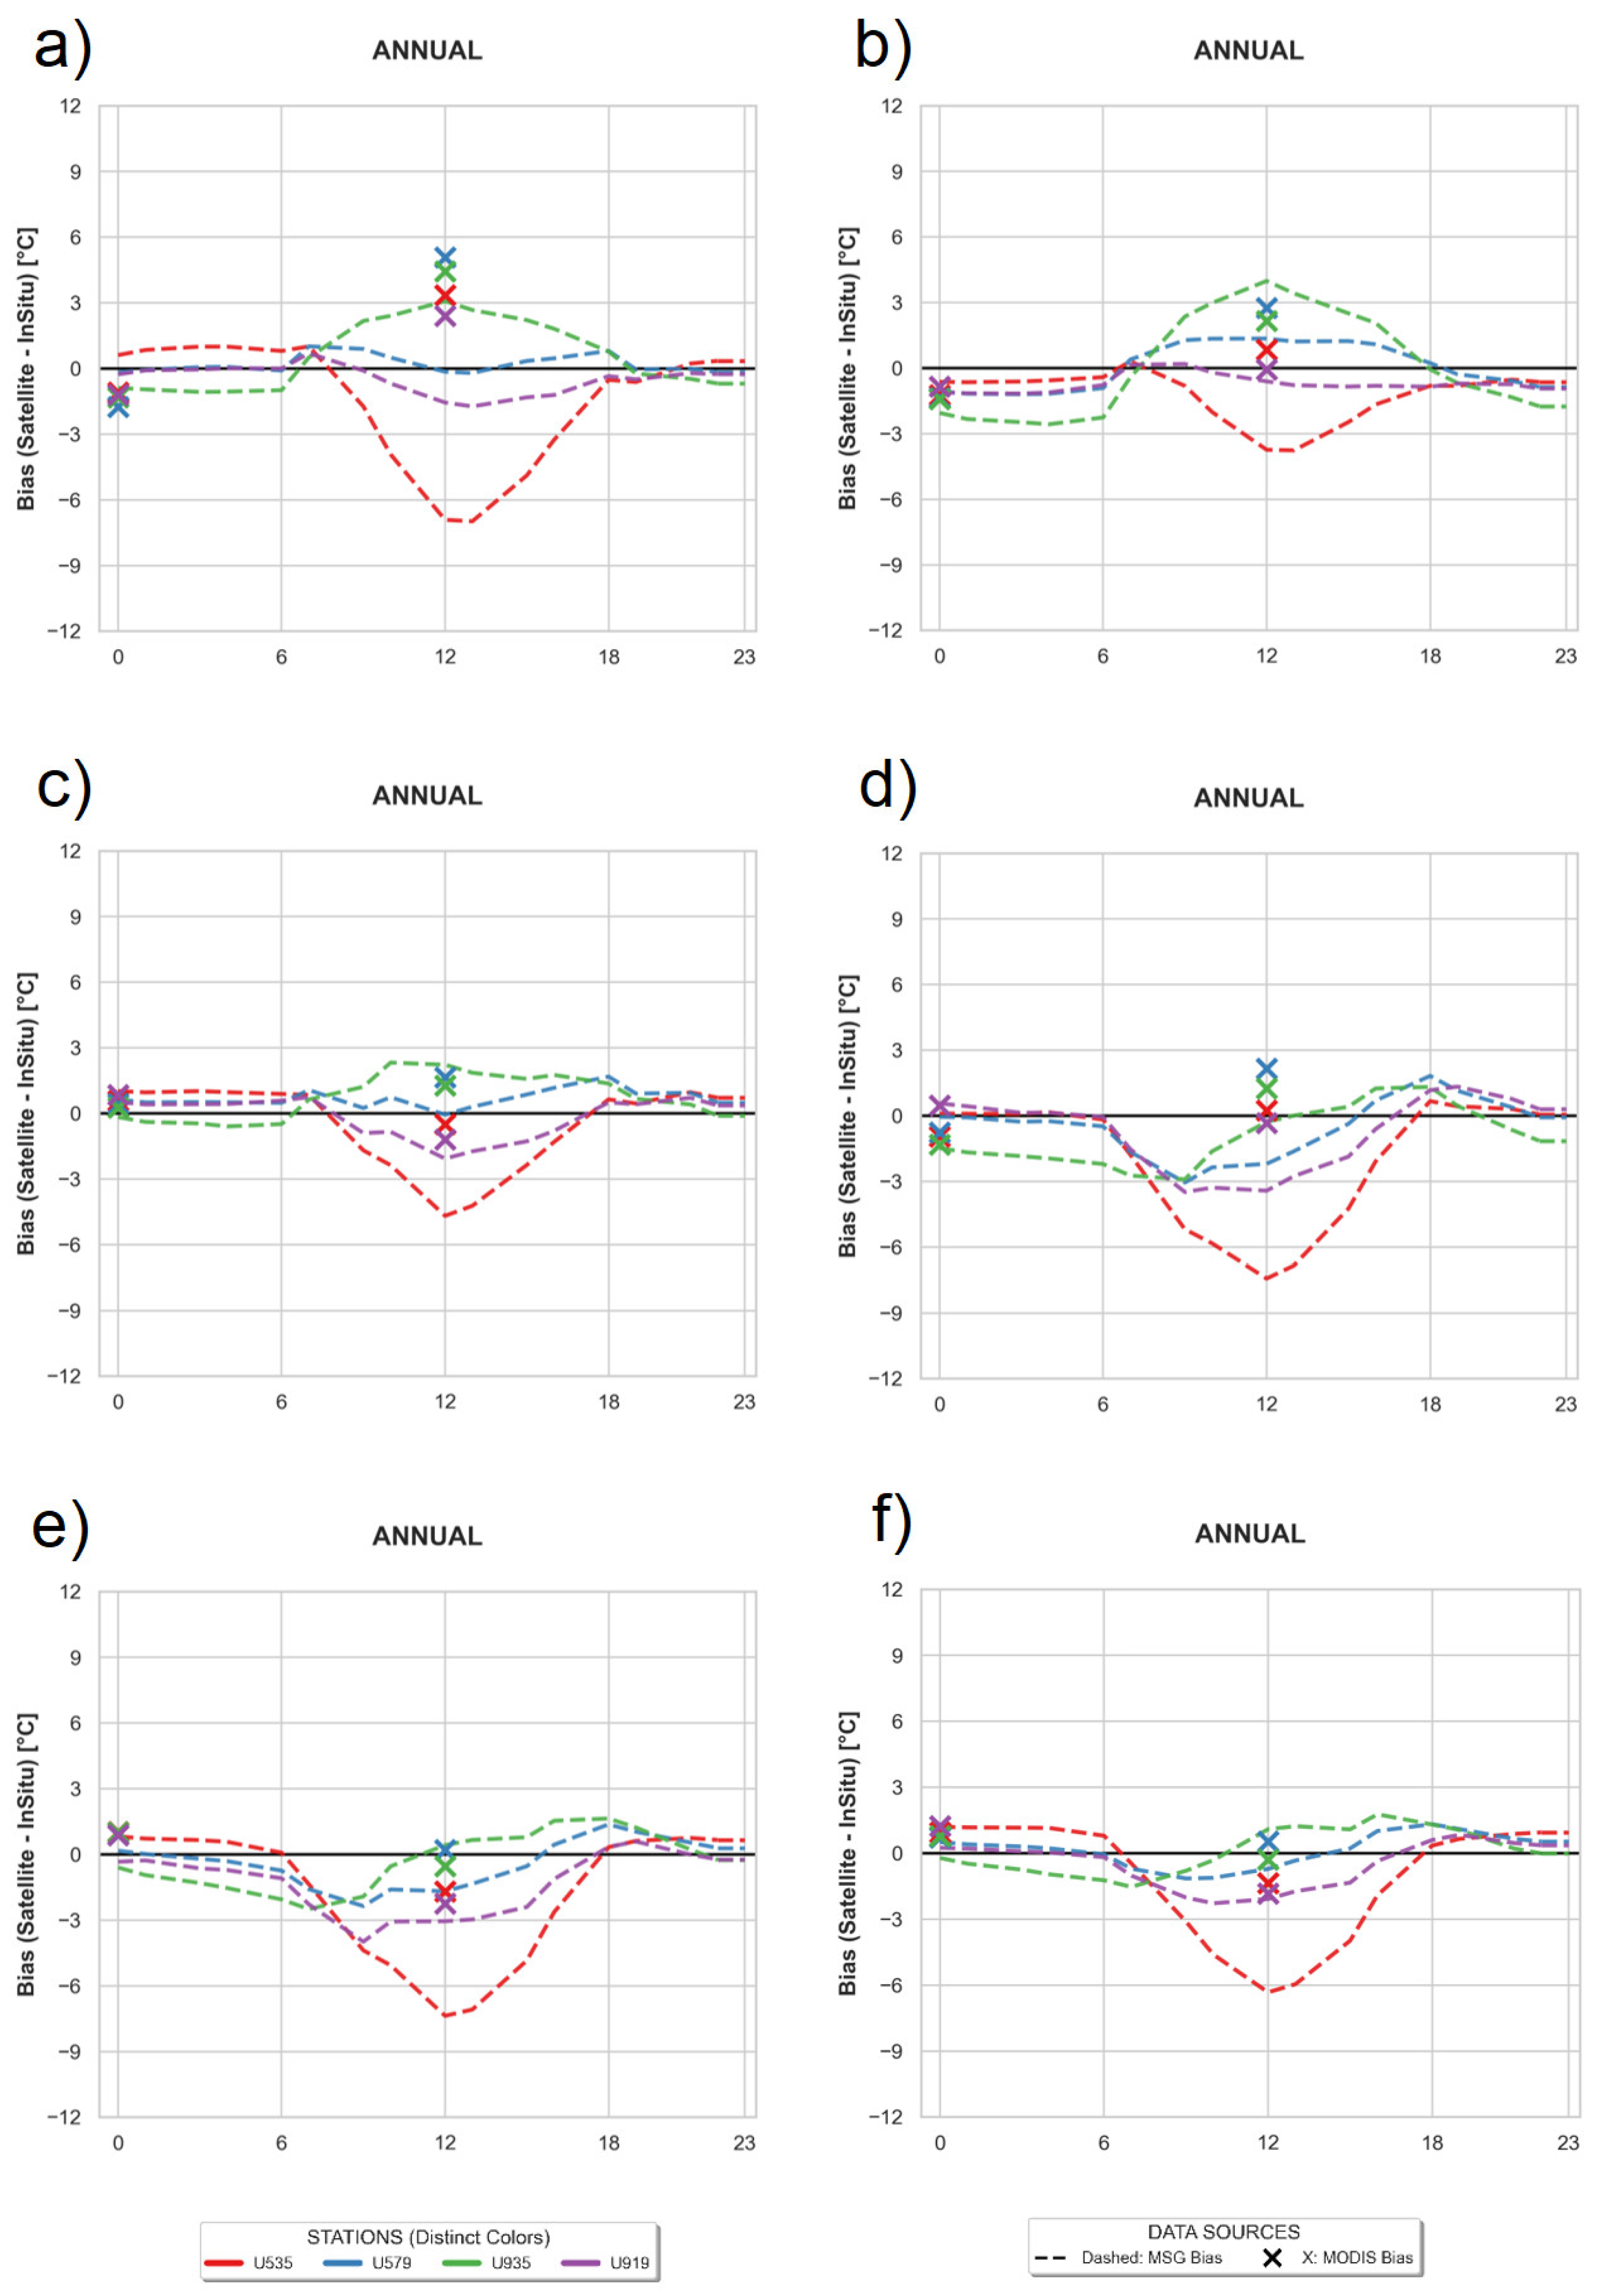
Figure 7 quantifies the systemic deviations between satellite-derived UHI estimates and in-situ observations, thereby defining the operational reliability of the remote sensing data. There is a considerable increase in difference magnitudes during the midday period (10:00 to 16:00 UTC) in panels (a, d, e, and f), where MSG-SEVIRI data exhibit pronounced negative differences, occasionally exceeding −6 °C to −9 °C. This indicates that during peak solar radiation, satellite LST significantly underestimates UHI intensity because rural surface skin temperatures heat rapidly, whereas urban T2m are moderated. This effect, combined with the coarse spatial resolution of MSG-SEVIRI (3 × 3 km), causes pixels near the estuary to integrate thermal signatures from both the urban fabric and water, notably influencing the UHI assessment at station U535 (Lisboa-Geofísico).
Conversely, the nocturnal period (20:00 to 06:00 UTC) is characterised by remarkably low and stable differences, generally within the 1 °C range. This reinforces the validity of using both MSG-SEVIRI and MODIS to monitor the nocturnal UHI in Lisbon, as the absence of solar-induced skin effects results in a stronger coupling between surface and T2m. Furthermore, MODIS differences align closely with MSG-SEVIRI temporal trends; although MODIS occasionally shows slightly more positive differences at 12:00 UTC, both sensors capture the same directional shifts in estimation error relative to the in-situ network, with discrepancies rooted in their distinct temporal and spatial resolutions. Ultimately, the variance in difference patterns suggests that the selection of the rural reference station is a primary driver of uncertainty, highlighting the impact of local Land Use/Land Cover (LULC) heterogeneity on the representativeness of baseline stations. In this context, Station R767 exhibits the smallest differences in UHI assessment due to its pronounced continentality and limited exposure to maritime breezes.
This comparative analysis confirms that Lisbon’s UHI is a relative phenomenon, highly dependent on the geographical representativeness of the rural reference, which can shift observed magnitudes by over 3 °C. Across all seasons and platforms, the nocturnal signature remains the most consistent indicator, with Lisbon serving as a persistent heat reservoir (1–5 °C). Conversely, the satellite-observed midday “Cool Island” is largely a radiative artefact of urban geometry rather than a reflection of canopy-level discomfort. This is explained by the greater thermal inertia of air, which heats more slowly via conduction, and the high thermal mass of dense urban areas [11,14,30,31,32]. Consequently, while LST typically peaks shortly after the solar zenith, the maximum is reached later in the day. This lag is further amplified by urban shading during periods of low solar elevation, which prolongs cooling in dense sectors until the afternoon. Ultimately, these results align with the scientific consensus that urbanisation increases the diurnal temperature range (DTR) for land surfaces while decreasing it for T2m [33].
A fundamental finding across all analysed scenarios is the pronounced seasonal and diurnal oscillation of the estimation differences between satellite and in-situ data (Figures S14–S19). The relationship between surface skin and canopy-layer temperatures exhibits a distinct temporal duality: during the nocturnal phase (22:00–06:00 UTC), both MSG-SEVIRI and MODIS exhibit high accuracy, with differences stabilising near 2 °C. This confirms that the SUHI serves as a robust proxy for atmospheric UHI only in the absence of solar-induced radiative effects. Conversely, daylight hours are characterised by a significant divergence, with MSG-SEVIRI often exhibiting “U-shaped” negative differences (underestimation) and MODIS exhibiting a positive difference (overestimation), particularly during the summer (JJA).
These differences are further modulated by estuarine interference and mixed-pixel artefacts. Due to its coarse 3 km resolution, MSG-SEVIRI pixels near the Tagus integrate the thermal signatures of both urban fabric and water. Because water bodies have high thermal inertia and lower daytime temperatures, this integration leads to a drastic underestimation of urban heat, with negative differences of up to −11 °C during summer at Station U535. In contrast, MODIS’s 1 km resolution partially decouples these signals, keeping the differences closer to zero and underscoring the need for higher-resolution sensors for coastal urban assessments. This highlights a resolution-accuracy trade-off: while MSG-SEVIRI provides indispensable temporal continuity, it is susceptible to pixel contamination and urban canyon shading; MODIS offers superior spatial fidelity but may capture extreme skin temperatures on sun-exposed surfaces that do not equilibrate with the ambient air.
Furthermore, the quantification of UHI is highly sensitive to the choice of non-urban reference and to seasonal non-stationarity. Using a “cool” rural baseline (e.g., 739) amplifies the perceived negative differences, whereas transitional baselines (e.g., 5420) may mask sensor underperformance. These differences are most volatile during periods of high solar forcing, such as summer and transition seasons (MAM/SON), while winter (DJF) exhibits the highest convergence across all platforms due to low radiative contrast.

3.6. Case Study 1: The 2003 Heatwave

The August 2003 heatwave stands as one of the most severe meteorological events in Portuguese history, driven by a persistent blocking high-pressure system that facilitated the continuous advection of hot, dry air from North Africa. In the Lisbon Metropolitan Area (LMA), T2m frequently exceeded 40 °C, while nocturnal minimums remained above 25 °C. This lack of relief exacerbated the UHI effect, as the built environment functioned as a continuous thermal radiator, preventing the dissipation of accumulated heat. The event highlighted the vulnerability of urban centres, where the synergy between high solar irradiance and low albedo led to extreme LST anomalies, increasing heat-related mortality and placing significant pressure on energy and water infrastructure.
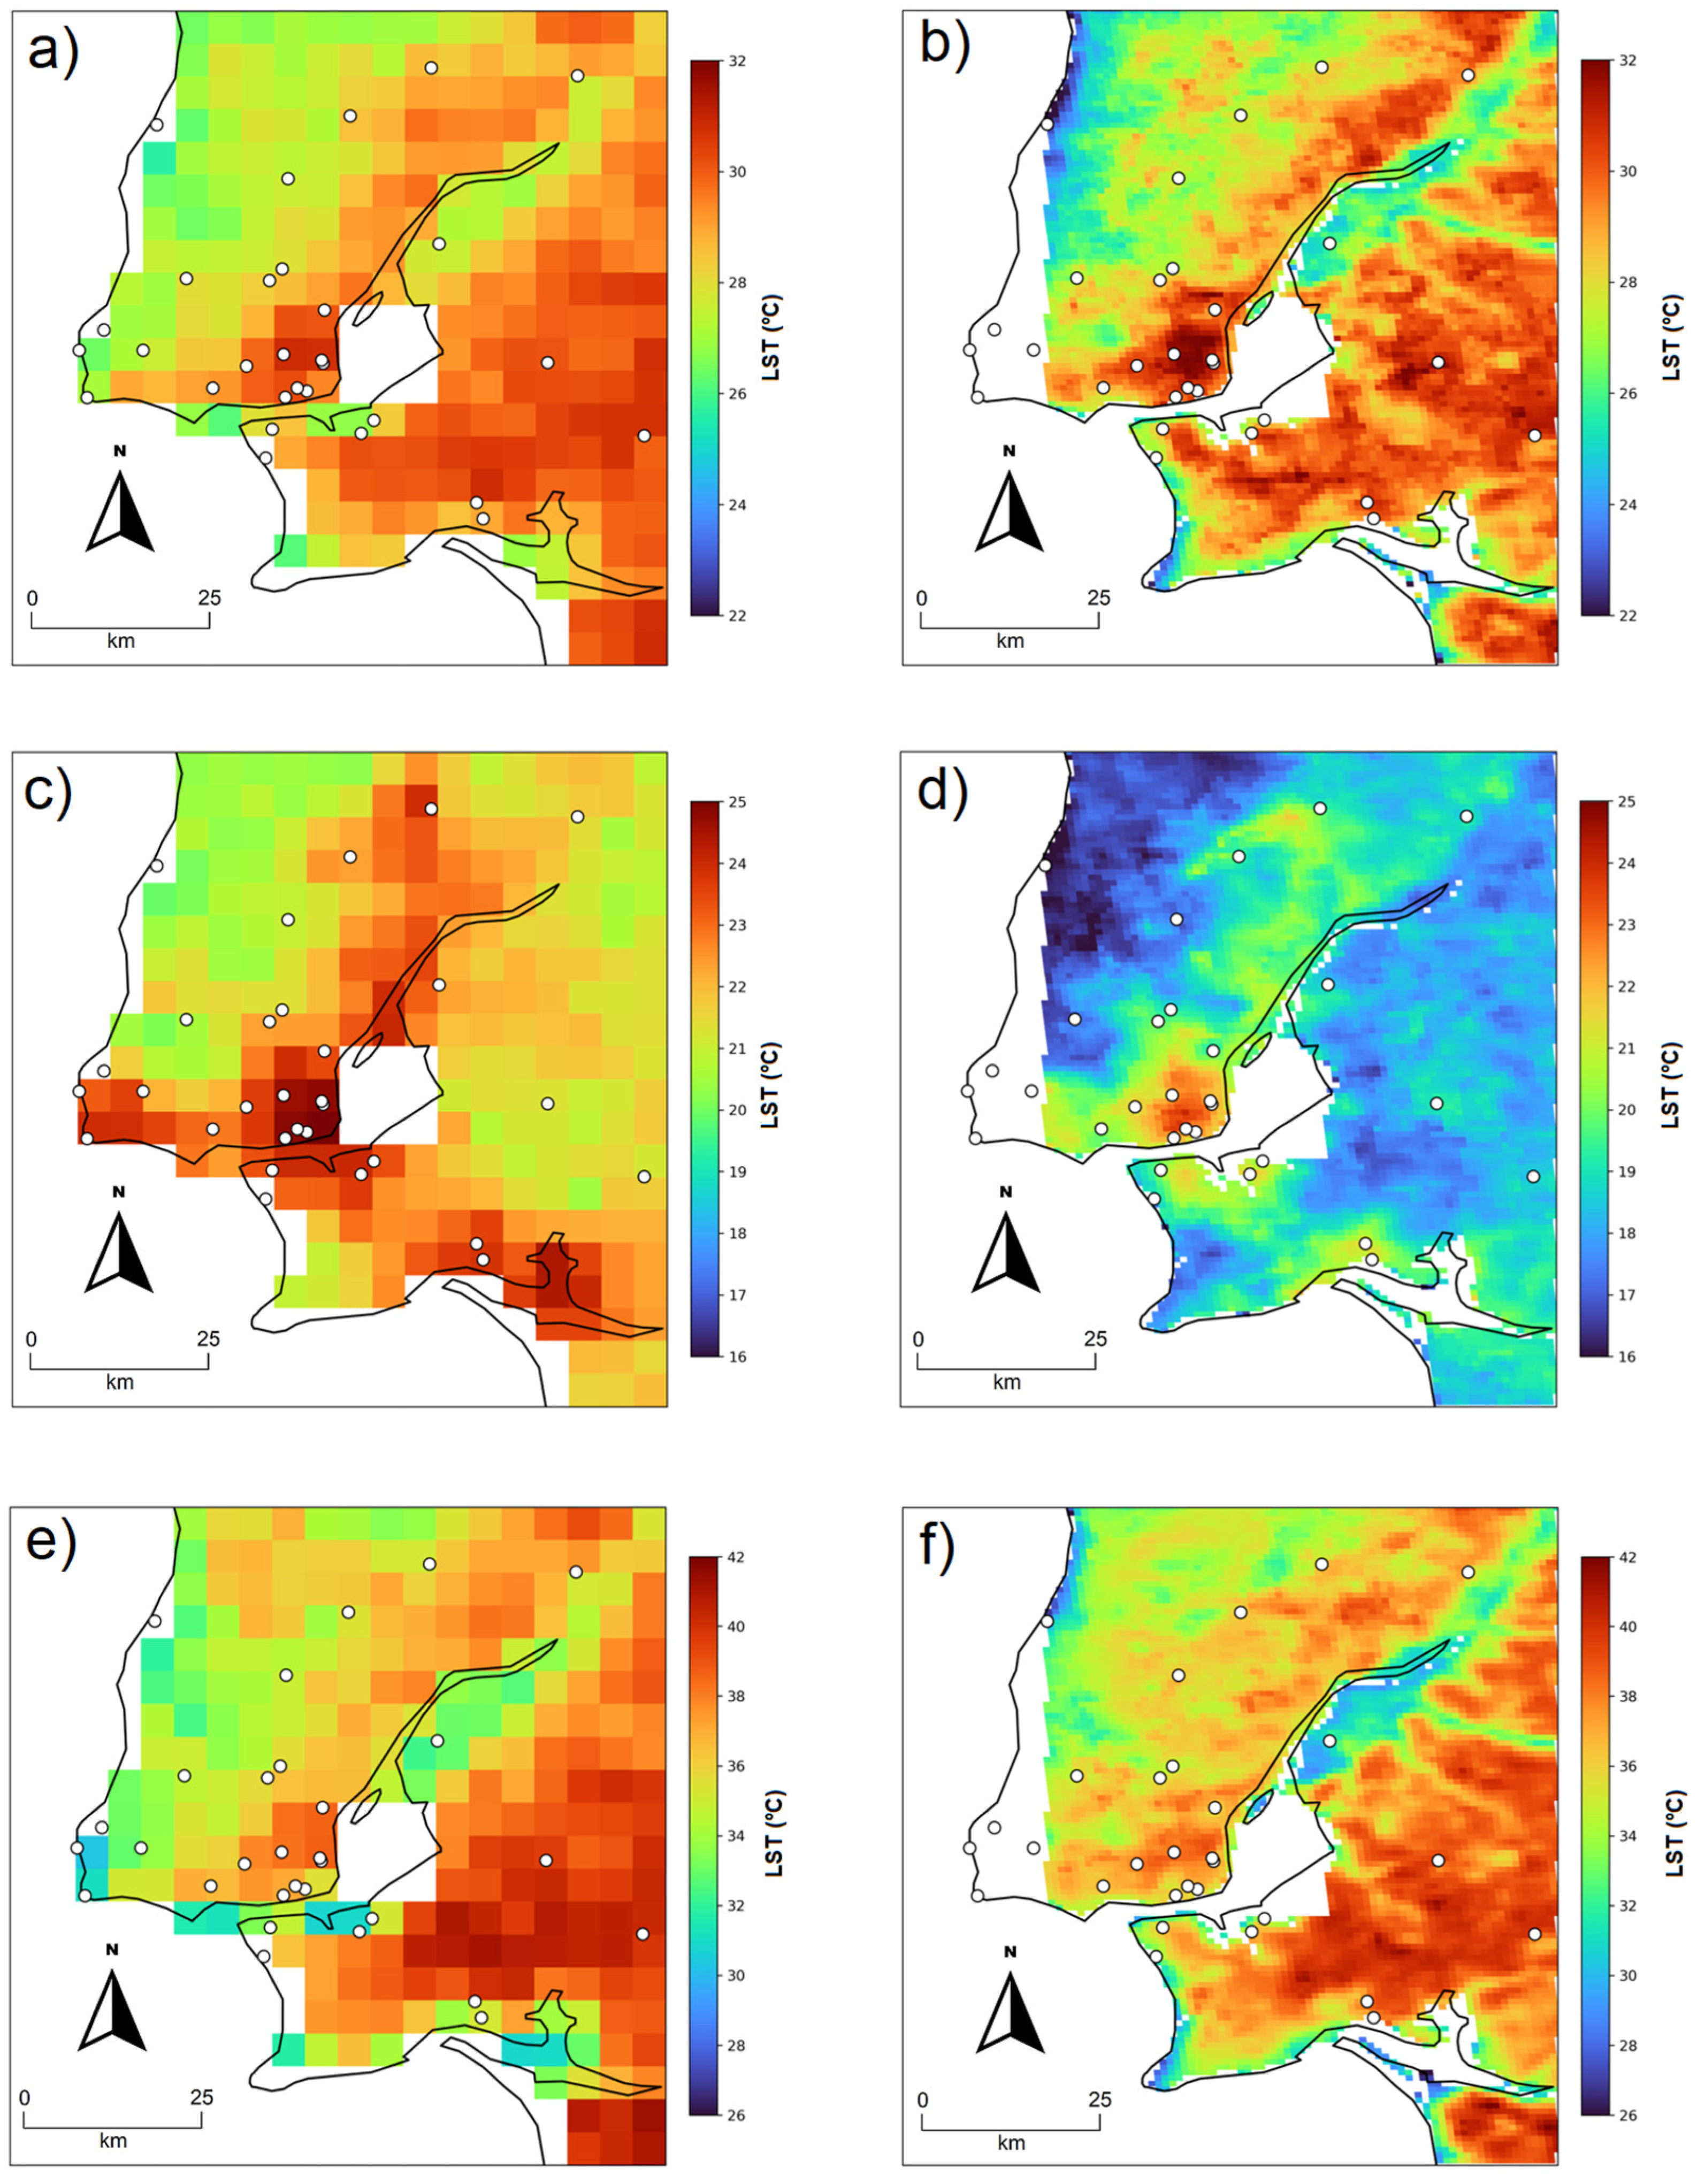
As illustrated in Figure 8, the multi-sensor framework was critical for monitoring this 16-day “thermal plateau” between 29 July 2003 and 14 August 2003, during which MSG-SEVIRI recorded LST peaks that consistently exceeded the climatological mean by more than 10 °C. Simultaneously, MODIS high-resolution snapshots revealed a generalised expansion of the SUHI signal, with even peri-urban buffer zones reaching temperatures identical to those of the urban core due to intense sensible heat flux. This “worst-case scenario” validated the complementarity of the sensors: while MSG-SEVIRI (Panels a, c, e) captured regional trends, MODIS (Panels b, d, f) offered superior detection of localised urban features, such as the cooling effects of Monsanto Forest Park and the Tagus riverside, while resolving the failure of green infrastructures to provide latent heat cooling under extreme desiccation.
Nocturnal thermal retention at 00:00 UTC (Panels c and d) shows the urban core as a significant hotspot, with LST values remaining around 23 °C, in sharp contrast to the cooler western coastal areas. During the 12:00 UTC diurnal maximum (Panels e and f), LST exceeded 40 °C in inland sectors, where MODIS revealed a complex mosaic of surface temperatures. The highest intensities were found in transition zones between the city and rural interior, specifically where sea breezes fail to penetrate. Ultimately, the daily average LST reflects a Northeast to Southwest thermal gradient dictated by the balance between maritime ventilation and urban density, confirming that the most vulnerable areas are high-impervious zones located away from the estuarine cooling buffer.
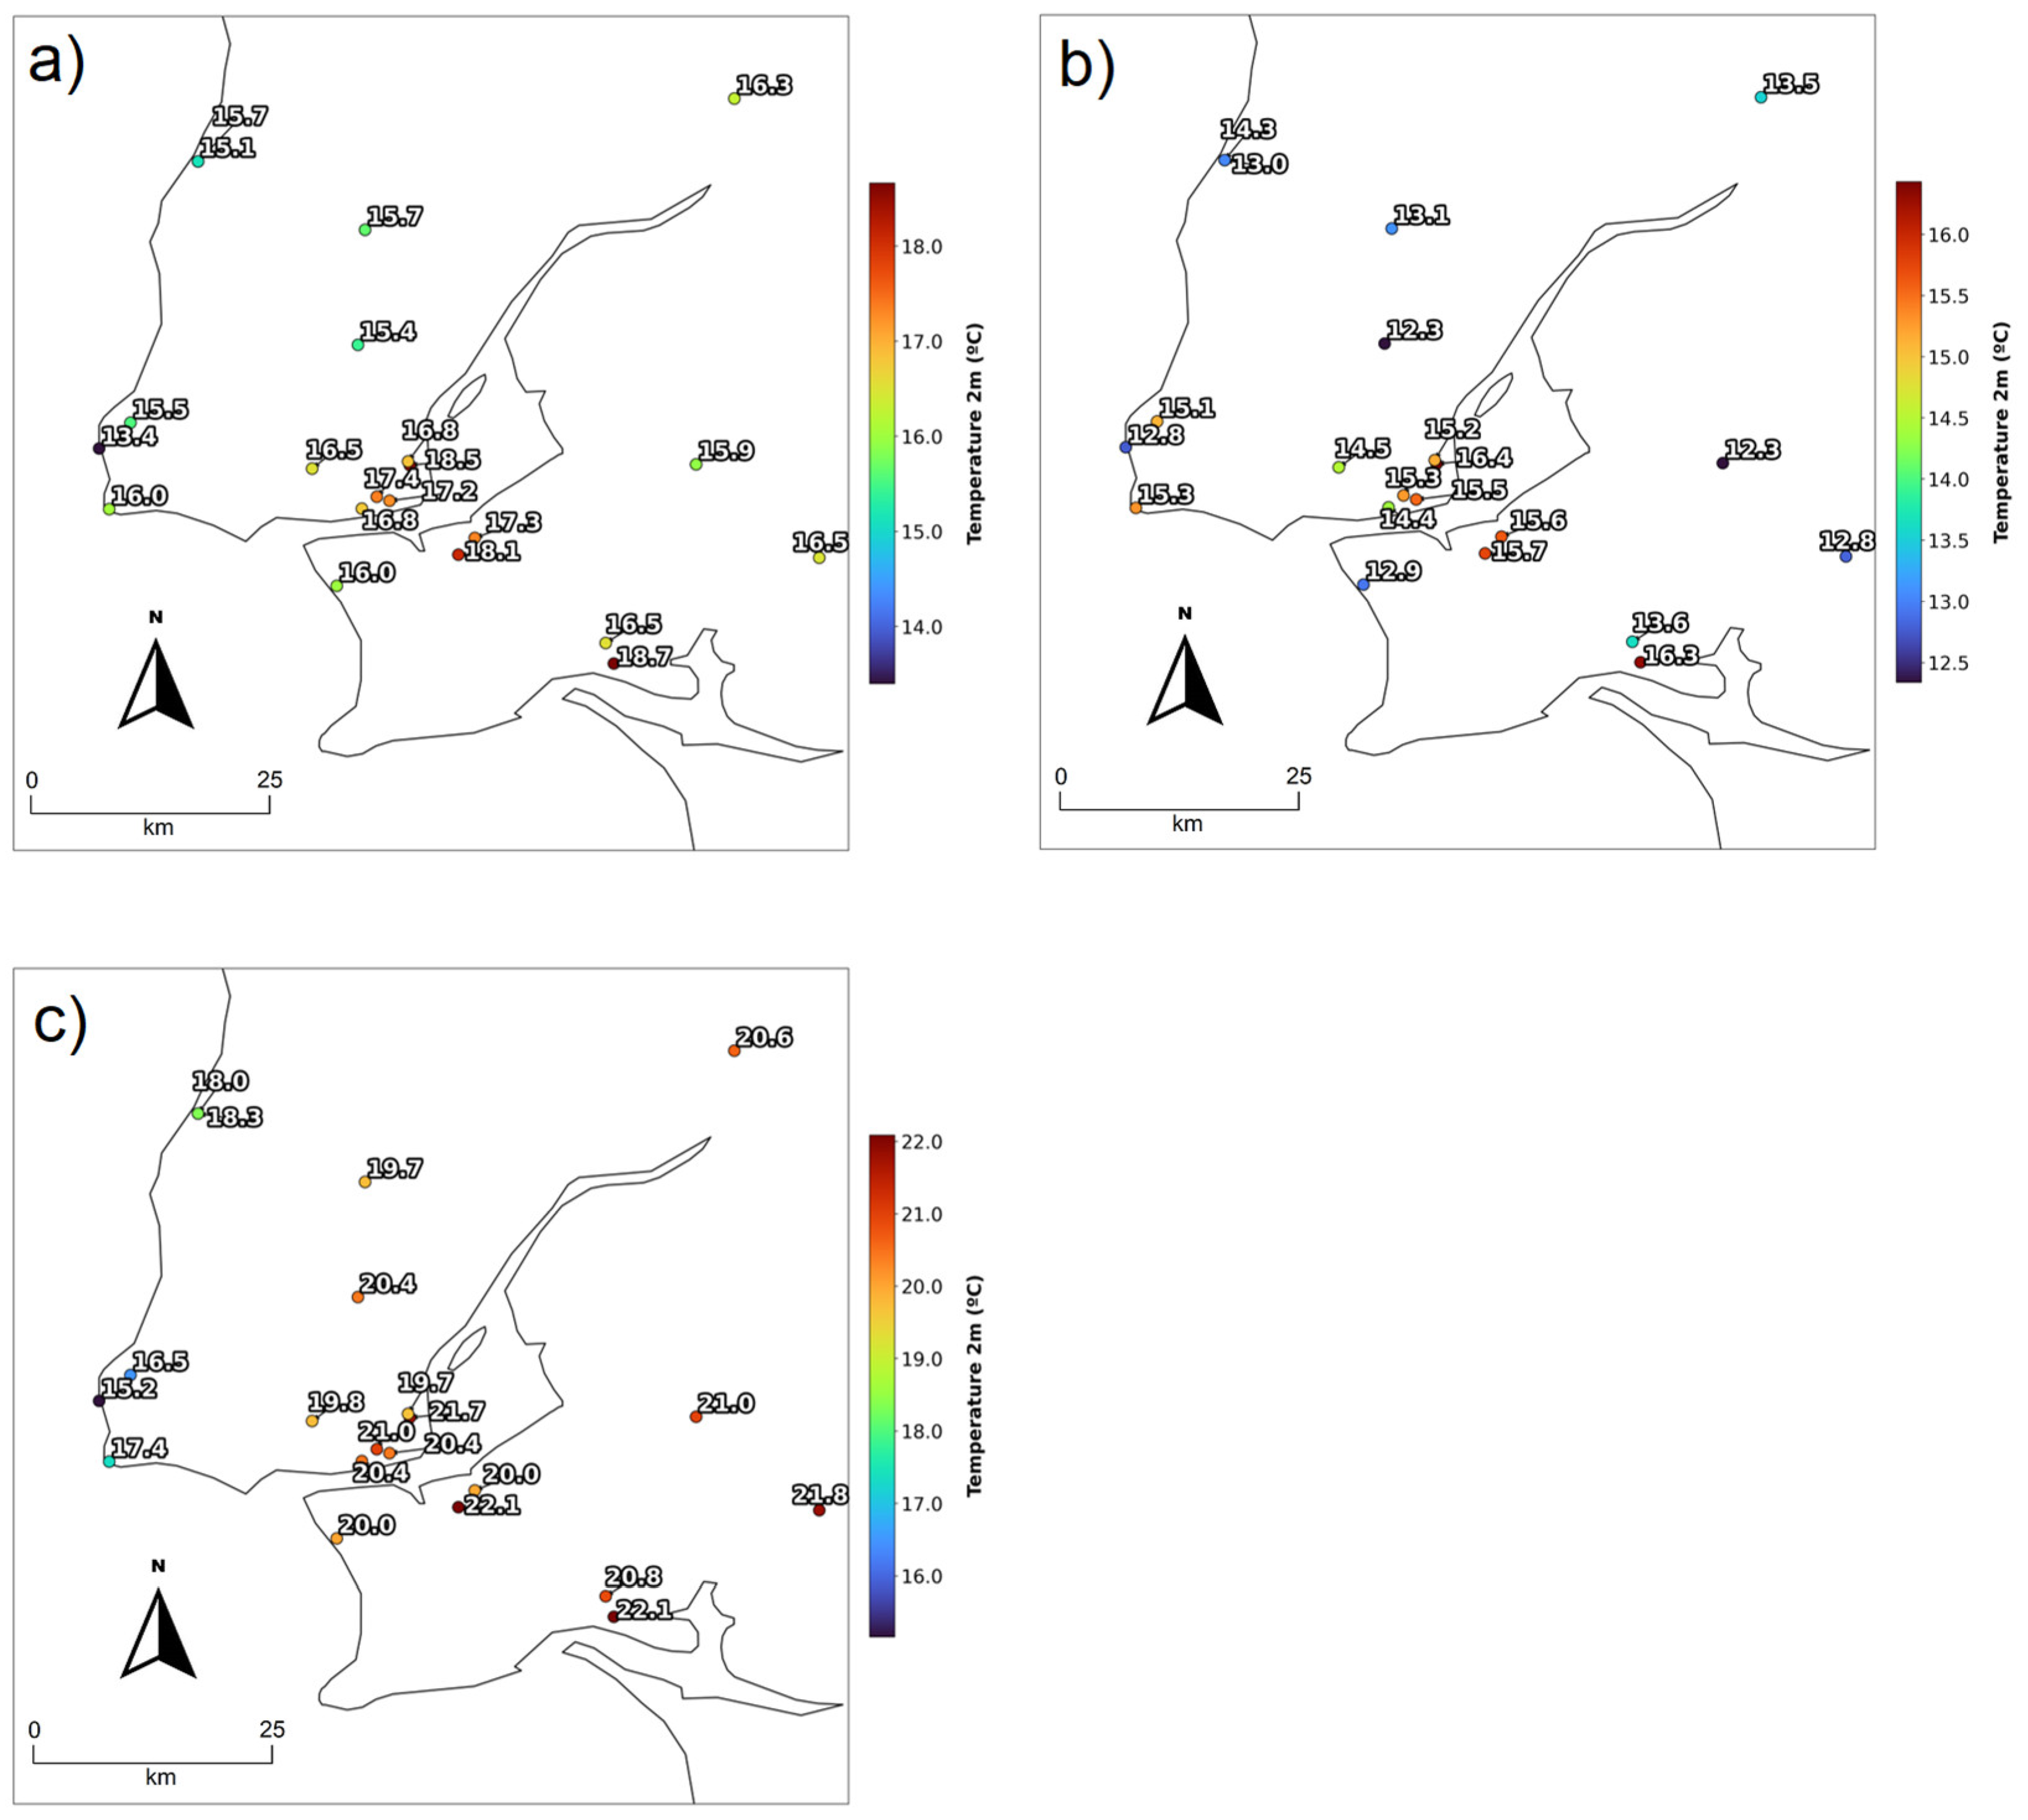
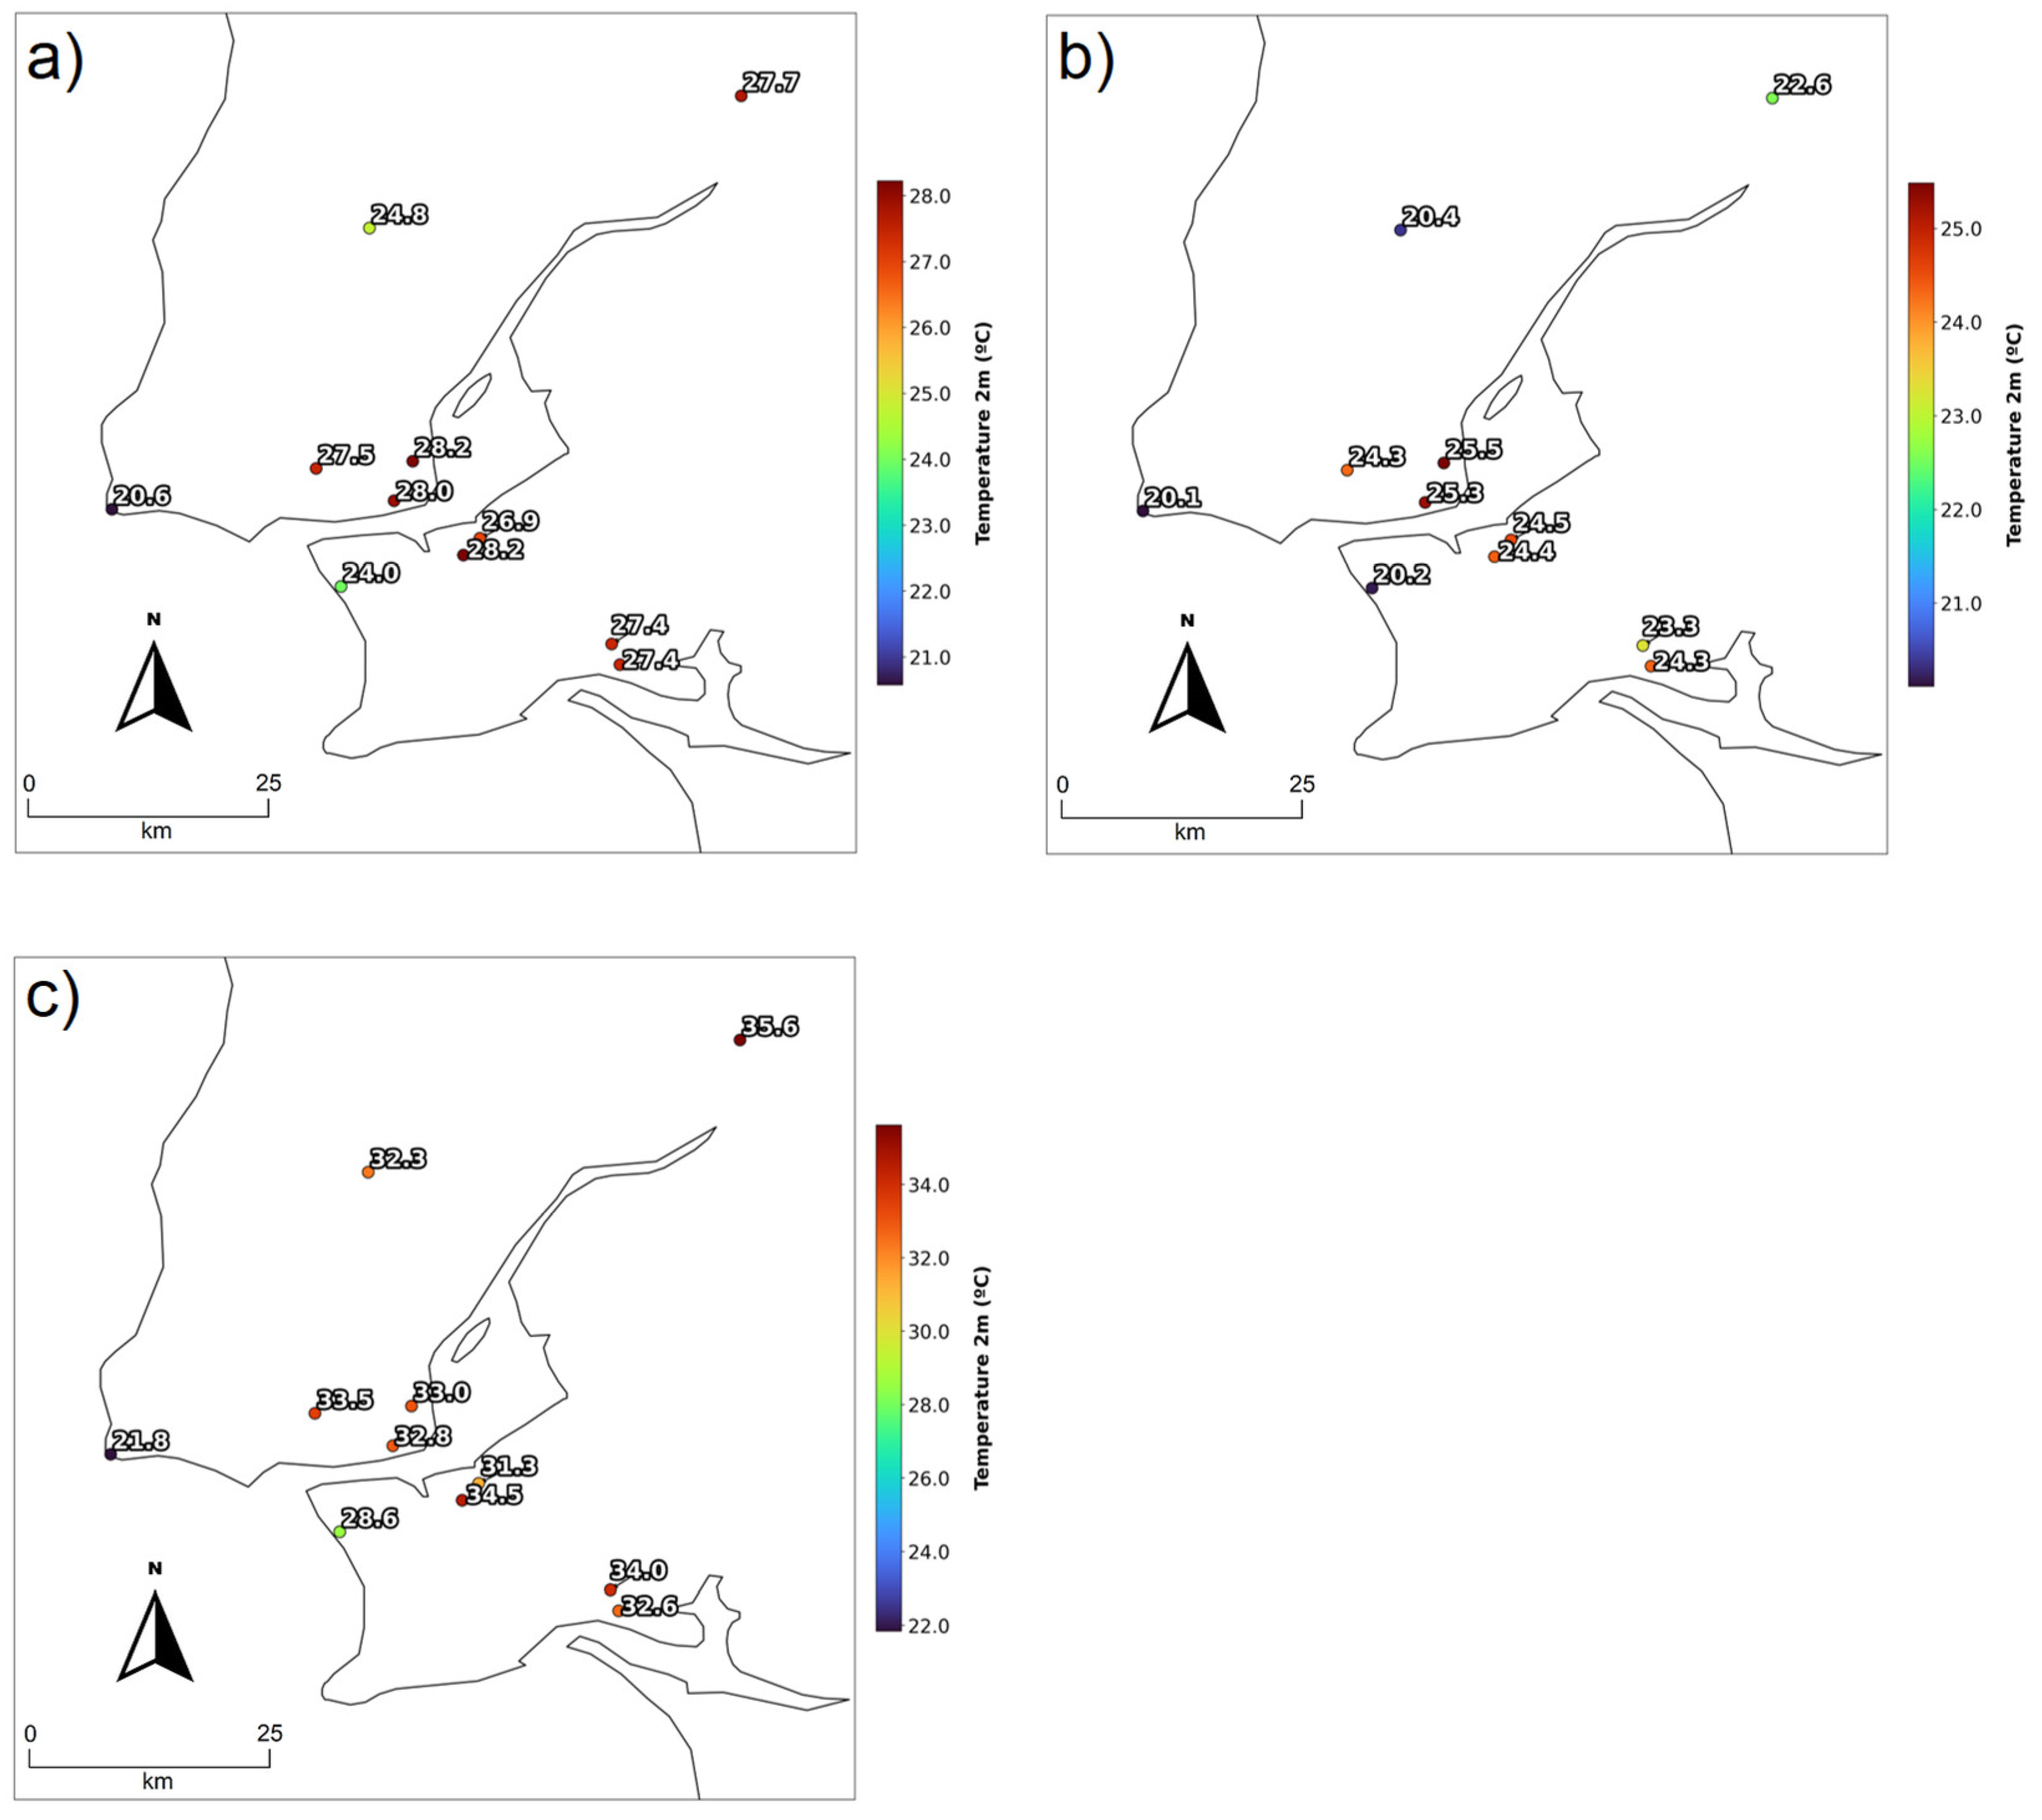
Figure 9 presents the in-situ thermal conditions (T2m) recorded during the 2003 heatwave, thereby directly validating the satellite-derived LST patterns. Several stations recorded daily averages above 27 °C within city limits. This spatial distribution confirms a “heat core” over the central and eastern urban sectors, where the high density of the built environment sustains elevated temperatures throughout the full 24-h cycle. At 00:00 UTC, urban stations still exhibited temperatures between 24 °C and 25 °C. These “tropical nights” posed a significant health risk due to the lack of nocturnal relief.
At 12:00 UTC, T2m ranged from 32 °C to 35 °C. While these are lower than the LST skin temperatures (which exceeded 40 °C), they demonstrate a more homogeneous spatial distribution due to strong convective mixing and regional advection of warm air masses. The observed discrepancy between the midday T2m and the maximum LST is explained by the greater thermal inertia of air, which heats more slowly via conduction from the ground. Consequently, the maximum T2m typically occurs after the LST has already peaked following solar zenith. Ultimately, Figure 9 validates the hotspots identified by remote sensing and emphasises that heat stress remains dangerously high during extreme climatic events in Lisbon.
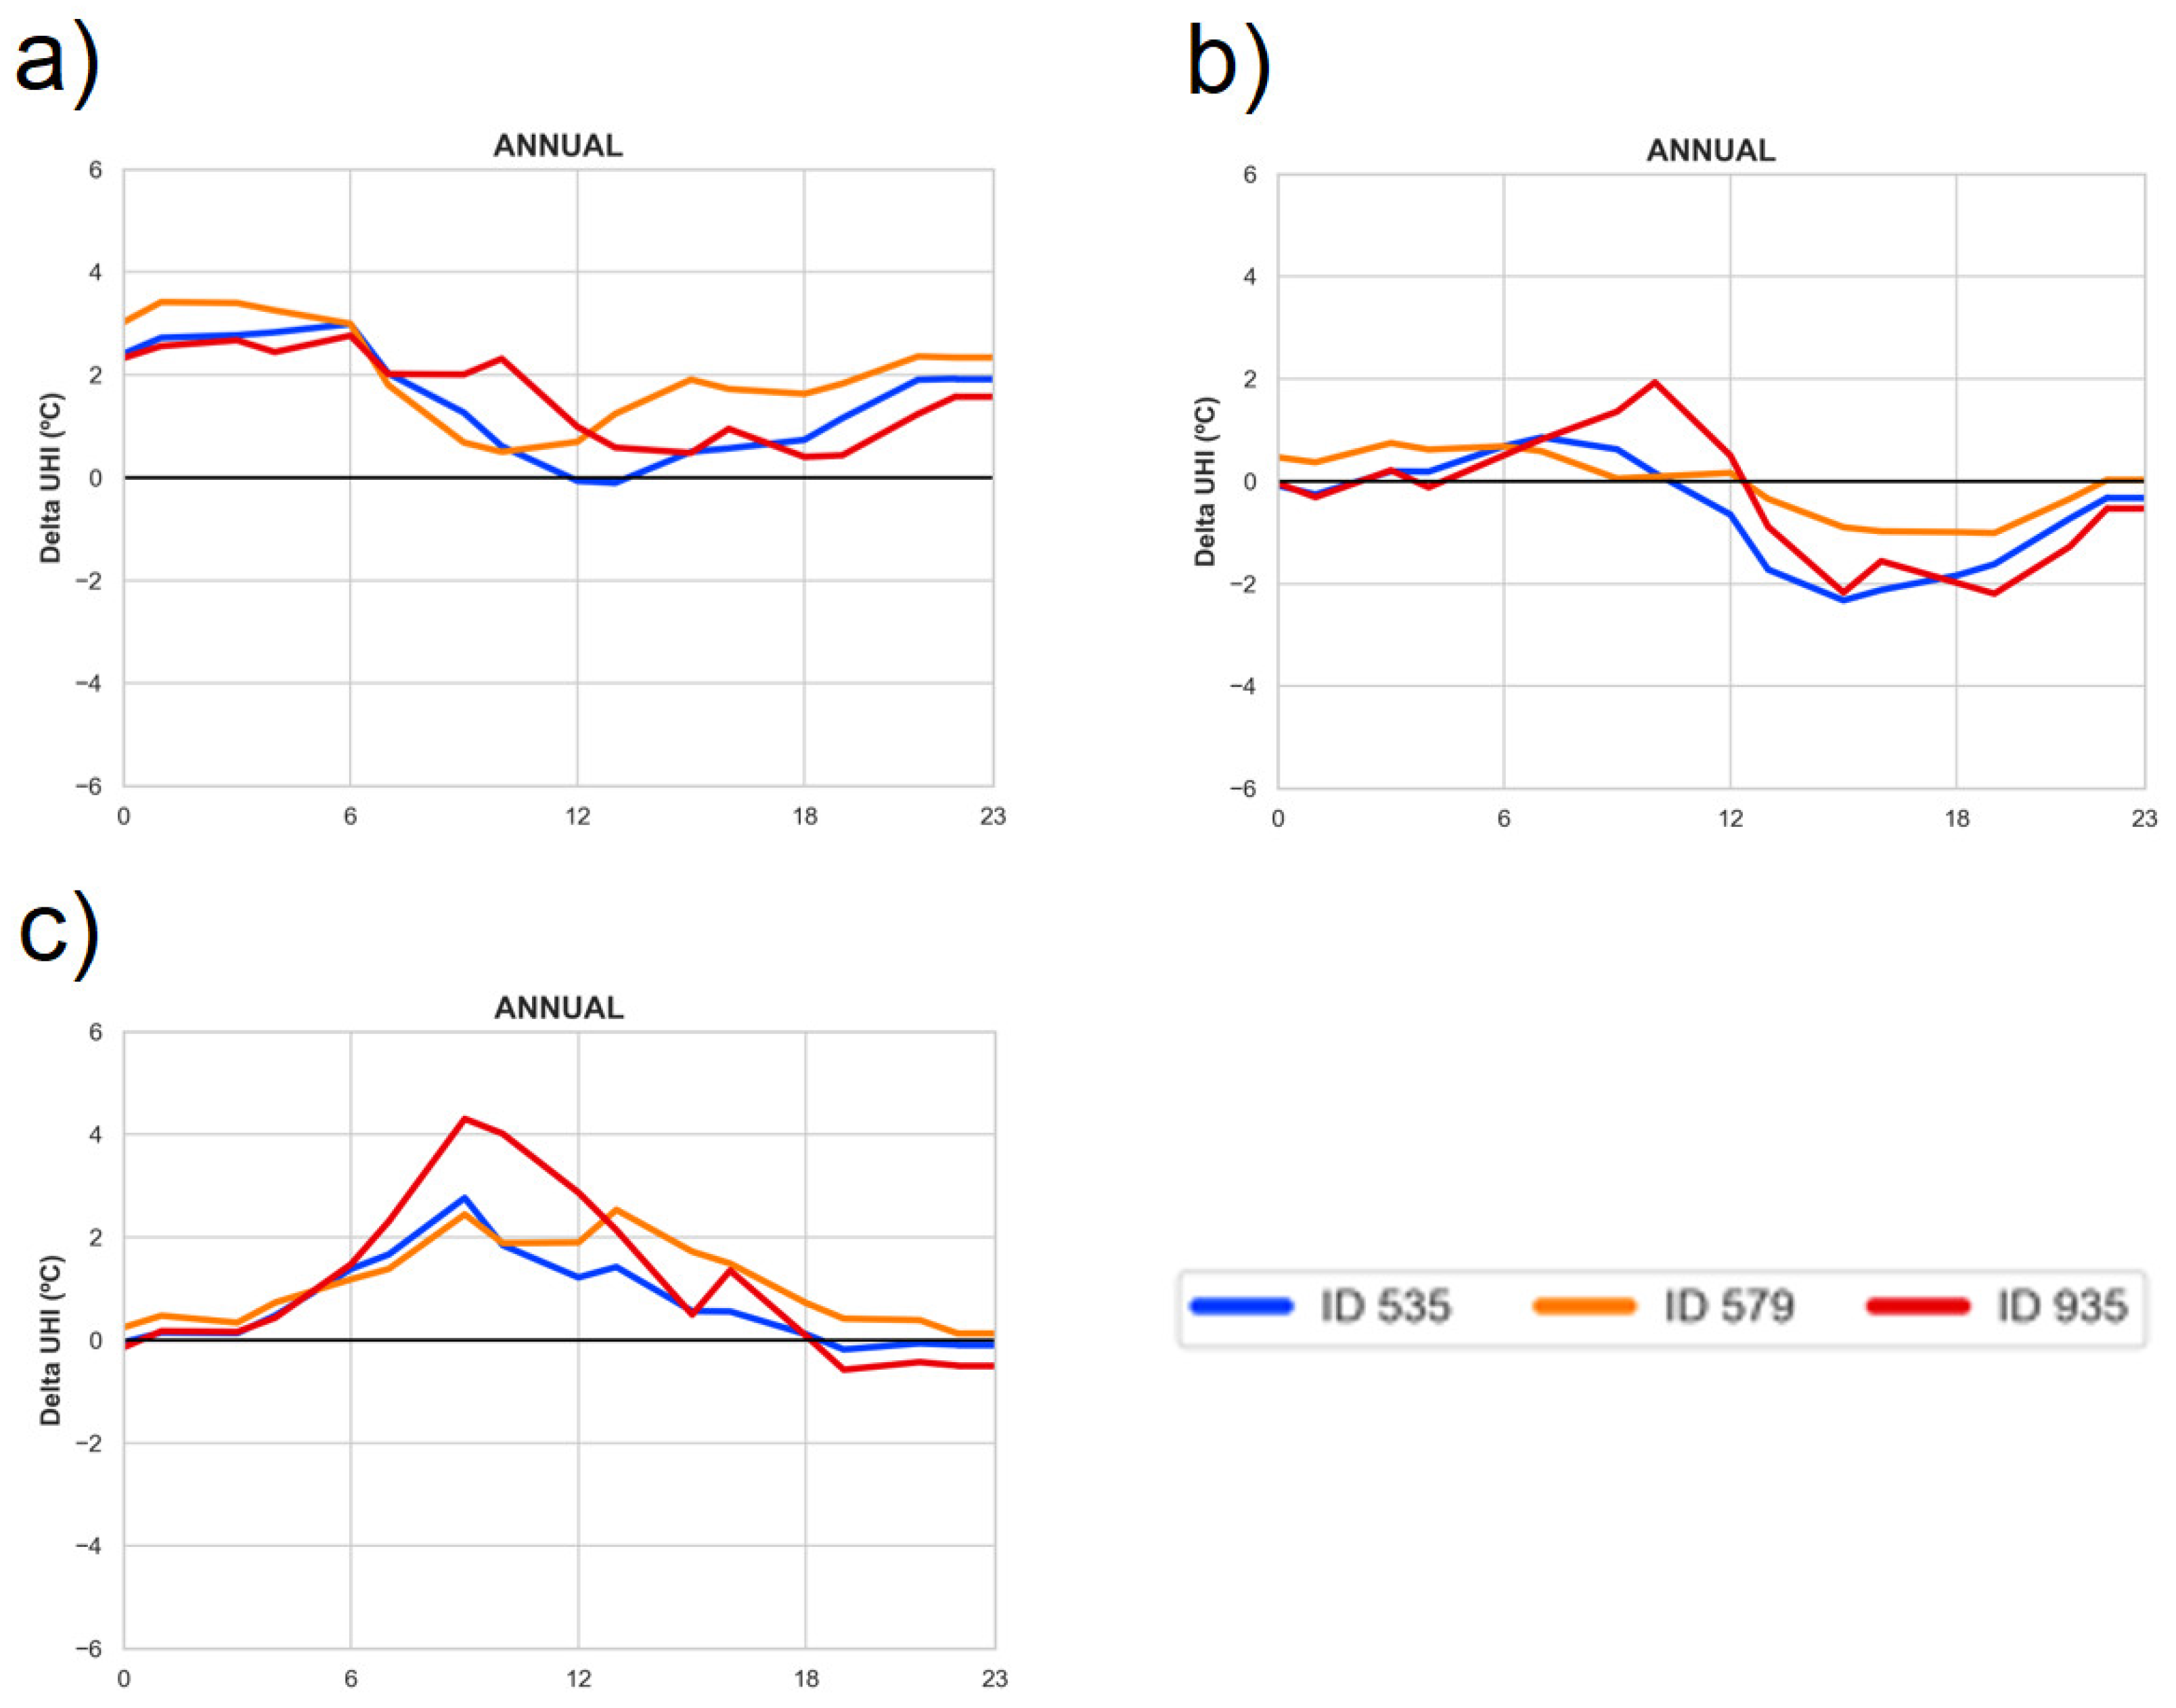
Figure 10 and Figure S20 quantify the hourly intensification of the UHI effect during the 2003 heatwave, expressed as the anomaly [Δ(ΔTu-r)] relative to the 2000–2025 climatological mean. This analysis reveals a persistent nocturnal amplification, in which the heatwave-induced UHI remains 2–4 °C above the climatological norm, particularly relative to IPMA 739 and SNIRH 5420. During this phase (22:00–08:00 UTC), UHI intensity reaches its absolute maximum, frequently oscillating between 4 °C and 6 °C across most urban–rural pairs. At Station U535 (Lisboa/Geofísico), a primary thermal focal point is identified, maintaining a differential exceeding 4.5 °C throughout the pre-dawn hours. This confirms that the continuous urban fabric served as a substantial sensible-heat reservoir, significantly mitigating the nocturnal radiative cooling observed in the rural periphery and leading to a systematic breakdown of standard cooling mechanisms.
A distinct “Morning Lift” is observed between 08:00 and 10:00 UTC, where the urban–rural disparity increases by up to 4 °C above the norm. At Station U935 (Amadora), this intensification peaks at approximately 6 °C near 09:00 UTC, highlighting a severe lack of thermal relief during critical physiological recovery periods. This transitional re-intensification is attributed to the rapid absorption of shortwave radiation by low-albedo urban surfaces, while rural reference stations continue to cool. Conversely, the midday period (12:00–18:00 UTC) is characterised by a sharp decline in UHI intensity, reaching a nadir of −4 °C to 1 °C range.
In summary, the 2003 heatwave acted as a catalyst for UHI intensification in Lisbon, characterised by a “cooling suppression” regime. The maintenance of an absolute nocturnal surplus, occasionally exceeding 4 °C and superimposed upon extreme T2m values, created sustained health risk conditions. These high-frequency in-situ data provide critical ground truth for the regional heat plumes observed in MSG-SEVIRI and MODIS LST products, thereby validating the urban–industrial axis as the most vulnerable sector during extreme climatic events.

3.7. Case Study 2: The 2018 Heatwave

The August 2018 heatwave stands as one of the most intense short-duration thermal events recorded in mainland Portugal, characterised by an extraordinarily rapid temperature escalation driven by Saharan air masses. Unlike the prolonged 2003 event, the 2018 episode saw absolute maximum T2m (Lisboa-Gago Goutinho established a new record of 44 °C), and the Lisbon Metropolitan Area (LMA) reached between 43 °C and 46 °C, shattering previous records. The synoptic suppression of the “Nortada” (seasonal breeze) and the estuarine cooling influence allowed solar radiation to heat urban surfaces without customary mitigation. This resulted in extreme “tropical nights” in which minimum temperatures in the city centre failed to drop below 26 °C, posing a severe threat to public health and increasing wildfire risk at the peri-urban interface.
As illustrated in Figure 11, the multi-platform framework provided a critical evaluation of the LMA’s response to such extreme radiative forcing. High-resolution MODIS data (Panels b and f) revealed LST values exceeding 40 °C at 12:00 UTC, particularly in industrial clusters and high-density urban nodes with low albedo. This spatial precision successfully delineated microclimatic refuges, such as the Monsanto Forest Park and the Atlantic coastal strip, which remained significantly cooler than the surrounding urban fabric: features less distinct in the coarser MSG-SEVIRI pixels. However, MSG-SEVIRI’s high temporal frequency was essential for monitoring rapid heating transitions and showed high spatial consistency with MODIS in identifying primary heat clusters.
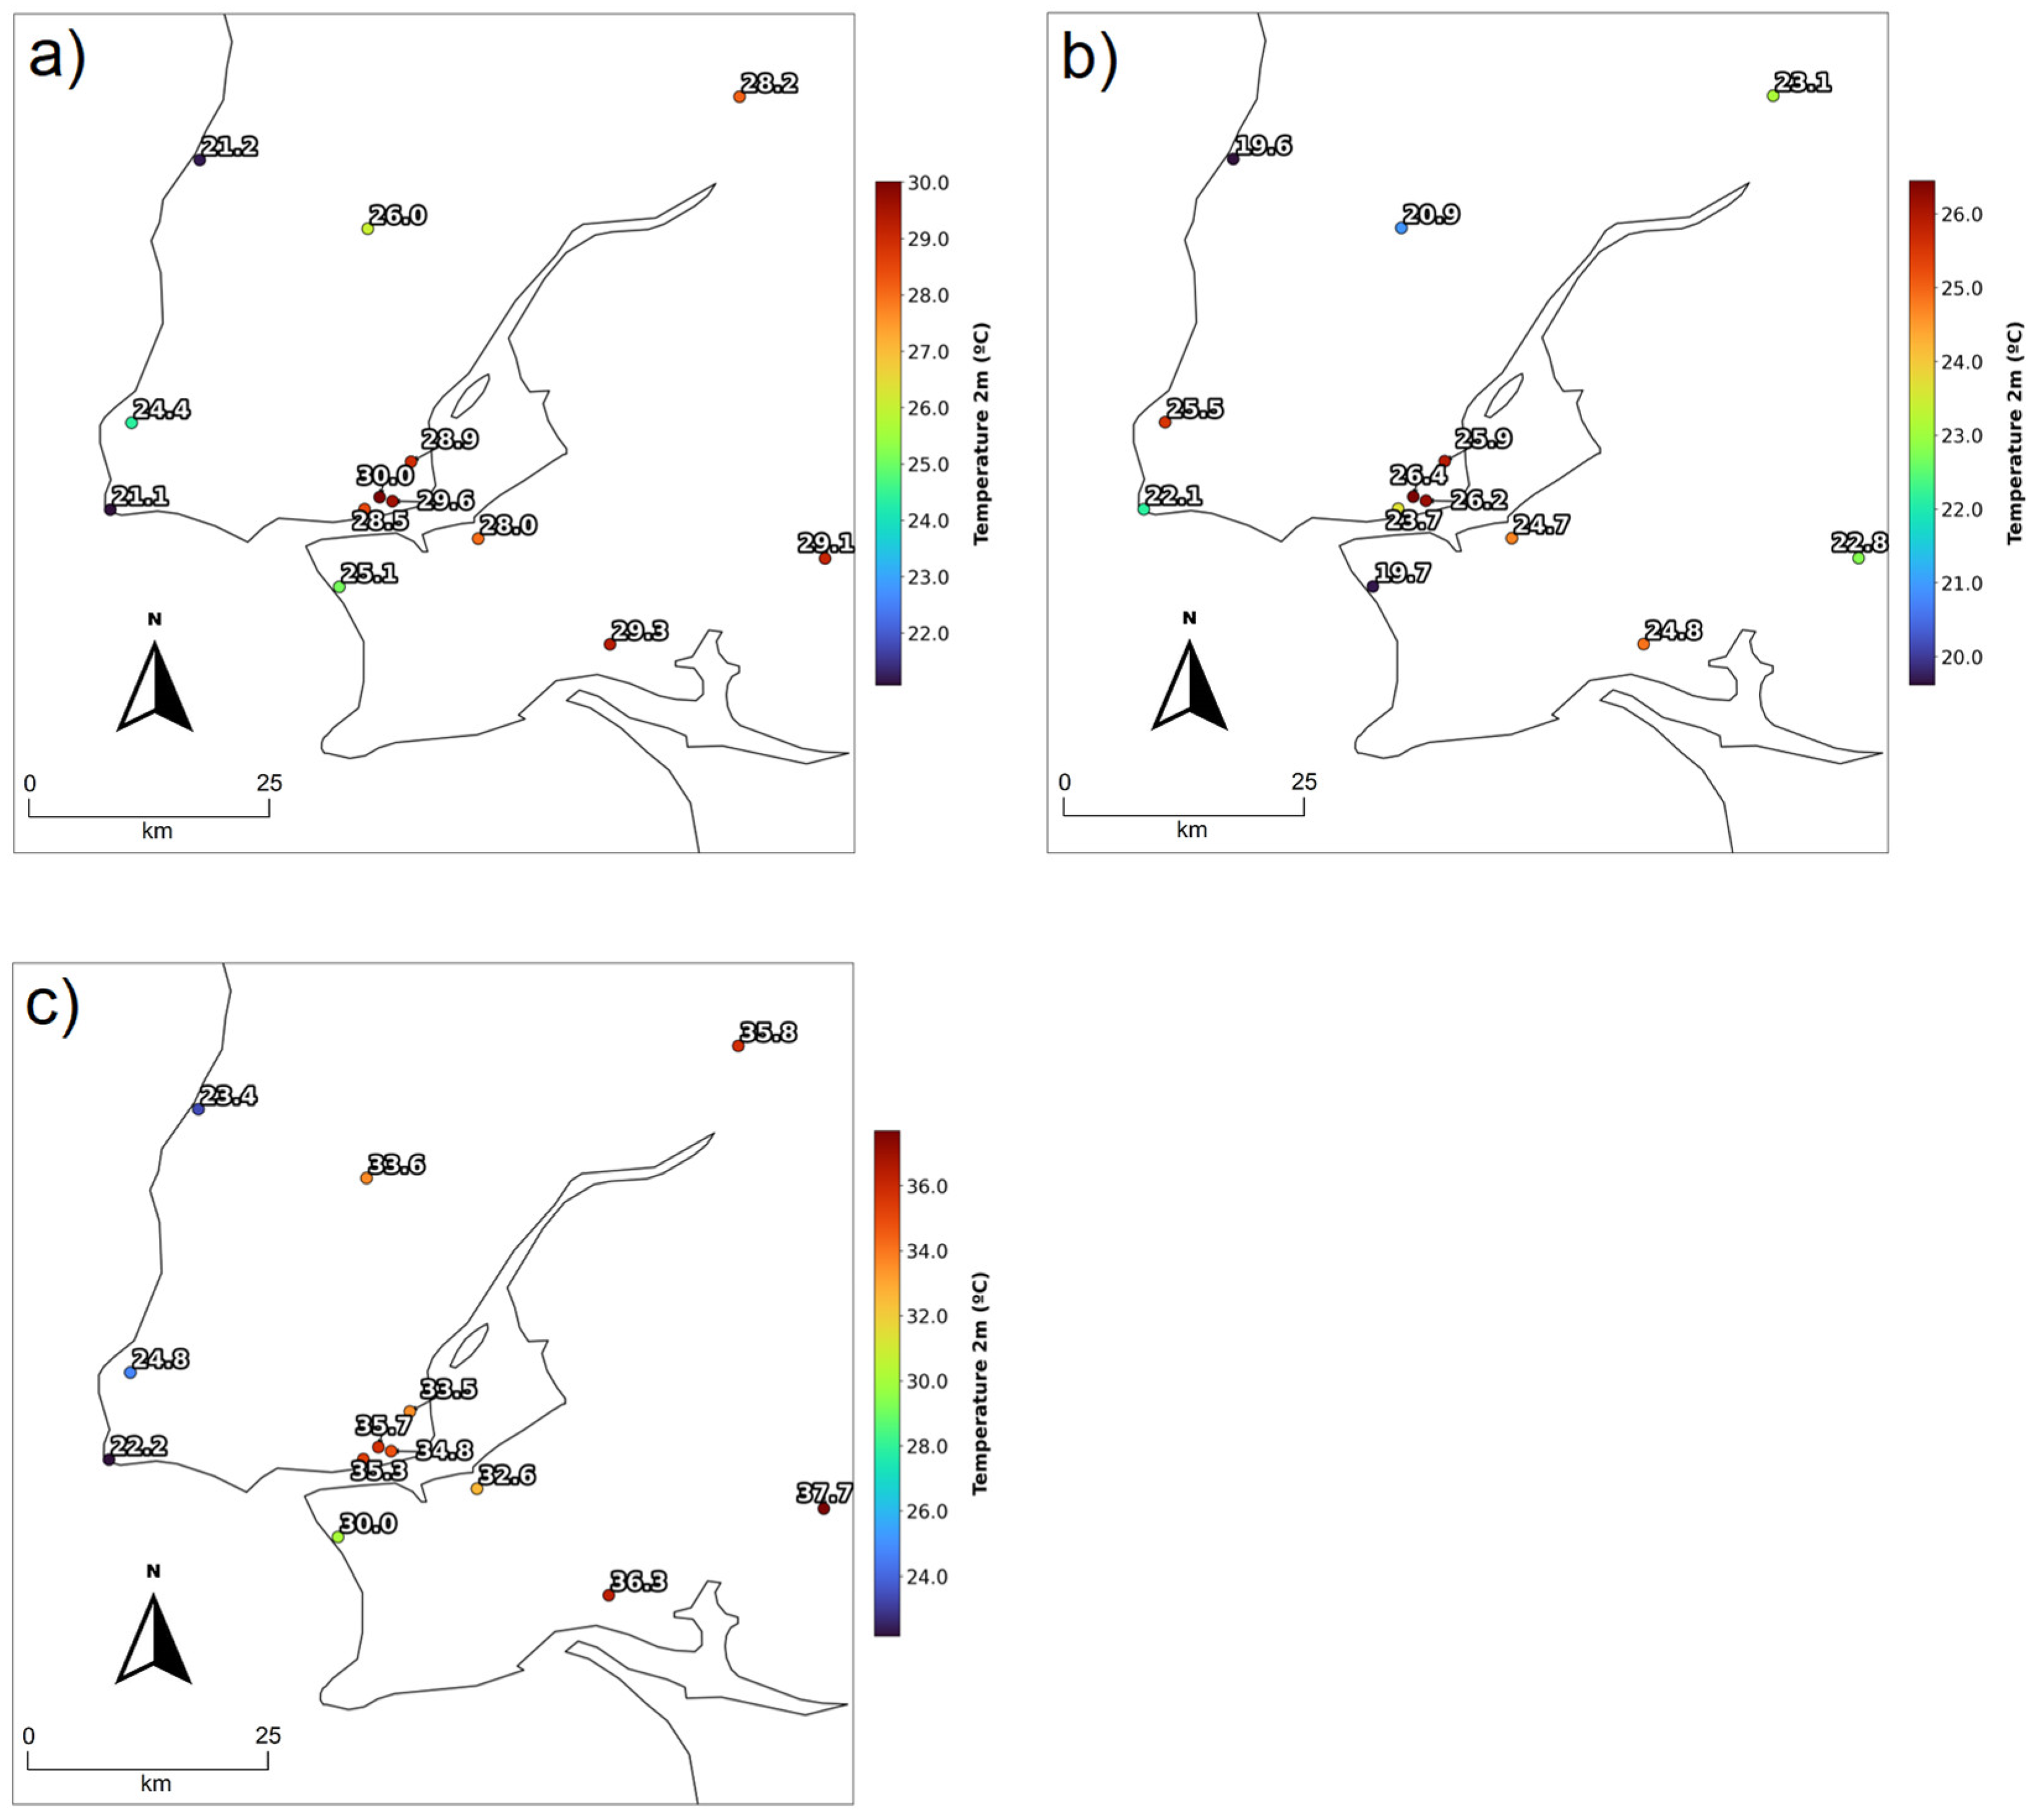
At 00:00 UTC, both sensors captured the persistence of the urban “warm plume,” with LST remaining around 24 °C in central Lisbon. These findings, validated by the in-situ observations in Figure 12, confirm a massive release of stored sensible heat. During the event’s peak, daily terrestrial means exceeded 29 °C in the urban core, while 12:00 UTC temperatures ranged from 33 °C to 36 °C. Nevertheless, stations adjacent to the water body showed more moderate values, confirming that even under extreme forcing, the Tagus estuary provides a vital, albeit limited, thermal buffer.
Figure 13 and Figure S21 quantify the hourly intensification of the UHI effect during the 2018 extreme event, expressed as the anomaly [Δ(ΔTu-r)] relative to the climatological mean. This heatwave was characterised by a pronounced nocturnal “lift,” during which UHI intensity remained consistently 2 °C to 4 °C above average. During the nocturnal phase (22:00–07:00 UTC), absolute UHI magnitudes reached critical levels, oscillating between 5 °C and 7 °C for certain urban–rural pairs (Figure S21a). This lack of nighttime cooling, with urban T2m remaining substantially above comfort thresholds, confirms that the city’s thermal mass significantly trapped the extraordinarily warm and dry Saharan air mass, creating a sustained state of heat stress.
A rapid re-intensification, or “Morning Lift,” is observed post-sunrise (06:00–10:00 UTC), reflecting the velocity at which impervious urban surfaces absorb solar radiation. At Station U919 (Lisboa-Amoreiras), this lift peaked at nearly 5 °C well before the daily maximum temperature was achieved (Figure S21d). Conversely, the transition to the daytime regime (11:00–18:00 UTC) shows a marked divergence depending on the rural reference used. Relative to Station R767, UHI intensity dropped to a nadir of −4 °C to −5 °C, indicating a pronounced Urban Cool Island (UCI) effect, with desiccated rural surfaces reaching temperatures far exceeding those within the shaded urban canopy. However, this convergence was less extreme when using more moisture-regulated references, highlighting that thermal disparity during extreme events is highly sensitive to the vegetation characteristics of the non-urban baseline.
Figure 13 and Figure S21 quantify the hourly intensification of the UHI effect during the 2018 extreme event, expressed as the anomaly [Δ(ΔTu-r)] relative to the climatological mean. During the night period, UHI intensity remained consistently 2 °C to 4 °C stronger than the average, with absolute UHI magnitudes reaching 5 °C to 7 °C for certain urban–rural pairs (Figure S21a).
A rapid UHI re-intensification, or “morning lift,” is observed post-sunrise (06:00–10:00 UTC), reflecting the rapid absorption of solar radiation by impervious urban surfaces. At station 919 (Lisboa-Amoreiras), this lift peaked at nearly 5 °C well before the daily maximum temperature was achieved (Figure S21d). Conversely, the transition to the daytime regime (11:00–18:00 UTC) shows a marked divergence depending on the rural reference used. Relative to station 767, UHI intensity dropped to −4 °C to −5 °C. However, values were less extreme when using more moisture-regulated references, highlighting that thermal disparity during extreme events is highly sensitive to the vegetation characteristics of the non-urban baseline.
The 2018 heatwave was severe, with nocturnal UHI magnitudes occasionally exceeding those observed during the 2003 benchmark. Both station 535 (Lisboa-Geofísico) and station 919 consistently exhibited a substantial UHI surplus relative to the norm, validating the urban fabric as a catalyst for heat retention. These in-situ results provide high-confidence ground truth for the “warm plumes” identified in MSG-SEVIRI and MODIS spatial maps, confirming that the satellite-derived nocturnal anomalies correspond to a real-world air-temperature surplus exceeding 4 °C across the metropolitan area.

3.8. Synthesis of Results and Discussion

Lisbon’s climate is significantly influenced by wind patterns shaped by the city’s topography and proximity to the Tagus River [34], including the effects of sea and estuary breezes. Additionally, land use plays a critical role in these dynamics. At the microscale, vegetation, urban geometry, and albedo were highlighted as the most significant factors affecting climatic conditions. North winds are particularly important, as they help disperse accumulated heat, whether natural or anthropogenic [25], and improve air quality by dispersing atmospheric pollutants. Preserving this effect is essential; thus, avoiding the creation of urban canyons that reduce the city’s natural ventilation and northward exposure is crucial. Such developments could hinder pollutant dispersion and degrade air quality due to increased surface friction from the city’s northward expansion [35,36]. With the ongoing impacts of climate change, urban areas, which are already susceptible to extreme heat, are becoming even more critical hot spots [37,38]. Under these conditions, urban parks, arboreal vegetation, and green roofs are critical tools for mitigating the UHI effect, serving as “climate refuges”. In regions characterised by a hot-summer Mediterranean climate (Csa) under the auspices of Köppen–Geiger classification, as is the case for Lisbon, these nature-based solutions have proven more effective than other environmental determinants [39]. However, it is necessary to keep in mind that adaptation strategies intended to lower urban heat stress do not necessarily result in a proportional reduction in surface temperatures. The design of mitigation policies should therefore look beyond surface heat trends as the primary measure of success [40]. The surface urban heat island persists throughout the day, whereas the canopy-layer urban heat island is primarily nocturnal. Significant discrepancies exist between these two manifestations across the diurnal cycle, as surface temperatures respond rapidly to solar radiative forcing, while T2m within the canopy layer exhibit a lagged warming effect that peaks after sunset [41], with imperviousness being a good predictor of LST with relatively consistent explanatory power in several scientific studies [42]. In addition, the scientific community has found that urbanisation increases the diurnal temperature range as measured by LST but decreases it as measured by T2m [33].
The high sensitivity of UHI magnitudes to the background reference selection represents a core scientific mechanism explored in this cross-sensor framework. By demonstrating that a shift in the rural baseline can alter perceived UHI intensity by more than 3 °C due to localized geographic modulators (e.g., maritime breeze exposure versus inland continentality), these findings expose a critical vulnerability in conventional urban climate diagnostics. Relying on an uncritical, single-baseline approach without accounting for localized microclimates can lead to severe miscalculations. This empirical evidence directly aligns with modern paradigm shifts, such as the Local Climate Zone (LCZ) framework [43], highlighting the scientific necessity of transitioning toward multi-site reference frameworks to ensure accurate data for climate-resilient planning.
The increasing frequency of heatwaves, amid rapid urbanisation, has created a synergistic effect that amplifies local temperature extremes, as evidenced by the 2003 and 2018 case studies. When coupled with the UHI effect and broader climate change, these phenomena significantly degrade urban thermal comfort, especially under projected warming of up to ~+1 °C by 2021–2050 and ~+3.5 °C by 2070–2099 under RCP8.5 [13,44]. The viability of multi-sensor integration for urban climate monitoring has proven to be advantageous and has been previously demonstrated in comparative studies of major European capitals, such as Paris and Madrid [45], highlighting that while the diversity of spatiotemporal resolutions and retrieval methodologies across satellite platforms presents a challenge, it also offers a significant advantage for comprehensive SUHI characterisation. Prior Machine Learning approaches, applied in Madrid, offer an alternative to traditional physically based models by effectively downscaling coarse ERA5 data to resolve complex urban-scale processes, providing significant added value in reproducing both canopy-layer and surface UHI effects, proving that ML-based calibration is a promising technology for bridging the gap between regional climate models and localised urban observations [46]. Similar applications, for example, to the city of Paris, show that the transition toward deep learning-based downscaling as a scalable, cost-effective, and accurate tool for urban climatology offers a viable pathway for the rapid development of climate adaptation and mitigation strategies without the prohibitive resource requirements of traditional atmospheric modelling [47], creating an opportunity for future applications.
By evaluating two types of LST products against in-situ observations, the present approach successfully identified the specific capabilities of different sensors in capturing both the fine-grained spatial gradients and the broader temporal patterns of urban heat. This study reinforces the fundamental relationship between urban morphology and thermal regulation. Since high-density urban zones are composed of materials with high heat capacity and low albedo, they act as significant reservoirs of sensible heat. This relationship remains constant regardless of the diurnal heating and cooling cycle, meaning that the urban fabric’s inability to shed heat is as much a function of its structural density as of solar forcing. Specifically, the continuous, vertical building areas, characterised by deep urban canyons and high surface-to-volume ratios, exhibit the most extreme thermal deviations. This morphology effectively traps longwave radiation and reduces sky view factors, thereby suppressing the radiative cooling mechanisms that are more active in the rural periphery. These results show that urban density and land-use classification are the primary drivers of thermal stress in the Lisbon Metropolitan Area, consistently amplifying the temperature surplus relative to non-urban reference sites [48], with this effect further intensified in heatwave scenarios.

4. Conclusions

The present study confirms that Lisbon’s UHI is a persistent and spatially heterogeneous phenomenon, strongly modulated by land-cover characteristics, urban morphology, and maritime influences. The results demonstrate that the spatial and temporal variability of urban thermal patterns is closely associated with interactions among urbanisation processes, coastal atmospheric circulation, and local topographic complexity, particularly through ventilation effects induced by maritime breezes. The integration of MSG’s high temporal resolution with MODIS’s finer spatial detail, combined with the extensive 2000–2025 in-situ observational dataset, proved highly effective in capturing the thermal complexity of the Lisbon Metropolitan Area and the sub-daily evolution of urban thermal contrasts.
The results further show that satellite-derived LST serves as a robust proxy for monitoring the nocturnal UHI, with differences generally below 1 °C compared with near-surface T2m. However, daytime LST significantly overestimates atmospheric temperatures, with deviations ranging from 2 °C to 8 °C, primarily due to solar radiation, urban geometry, and differential surface heating. These findings confirm a significant temporal decoupling between surface and atmospheric thermal responses, highlighting the methodological challenges of directly using LST as a surrogate for T2m across varying land-use classes and atmospheric conditions.
The synergistic use of MODIS and MSG-SEVIRI data proved to be a reliable and operationally valuable framework for monitoring UHI dynamics at night, even in complex coastal environments, but not during the daytime. In particular, the combination of MODIS’s finer spatial resolution with MSG-SEVIRI’s temporal consistency was essential for mitigating estuarine pixel contamination and accurately characterising sub-daily thermal transitions. Nevertheless, the results also reveal important operational limitations associated with daytime radiative overestimation and estuarine influences, both of which must be carefully considered when applying satellite-derived thermal products to urban climate assessment and planning applications.
The study also demonstrates that the selection of rural reference stations constitutes a critical methodological factor in UHI quantification. While SNIRH 5178 (São Julião do Tojal) effectively represents the broader metropolitan thermal background, IPMA 767 (Pegões) provides a more stable framework for calibrating LST–T2m differences. These findings confirm that reference-site selection exerts a decisive influence on estimated UHI magnitudes and on the interpretation of satellite-derived thermal anomalies.
Ultimately, this research advances urban climatology methodology by transforming a common operational challenge—reference site selection—into a quantified scientific asset. The integration of an extensive 26-year multi-sensor satellite database with near-surface validation provides a robust framework for monitoring coastal Mediterranean environments under extreme thermal stress. Crucially, the proven dependency of UHI metrics on the physical and geographical attributes of background stations challenges the oversimplified ‘urban-versus-rural’ dichotomy. By demonstrating that a baseline shift can alter perceived UHI intensities by more than 3 °C, this study underscores the scientific necessity of transitioning toward multi-site reference frameworks or Local Climate Zones (LCZs). Consequently, this study establishes a new benchmark for future climate risk assessments, providing the reliable and reproducible data required to develop target-oriented heat mitigation strategies and strengthen long-term urban resilience.
Despite methodological sensitivities, the results unequivocally confirm a persistent UHI effect in Lisbon that intensifies substantially during extreme heat events. Analyses of the 2003 and 2018 heatwaves using MSG-SEVIRI and MODIS observations reveal LST anomalies exceeding 10 °C and urban–rural thermal differentials reaching up to 7 °C under conditions of suppressed maritime breezes. These findings demonstrate that heatwave conditions significantly amplify both the intensity and persistence of the UHI, particularly during nocturnal periods when reduced atmospheric ventilation limits thermal dissipation and reinforces the urban heat reservoir effect.
In summary, three executive highlights emerge: first, satellite LST (particularly from MSG-SEVIRI) requires correction before being used as a proxy for midday T2m; second, waterfront urban stations are subject to a “cooling artefact” driven by estuarine mixed-pixels; and third, remote sensing is most academically defensible for nocturnal UHI mapping across LMA, where differences are minimised, and baseline sensitivity remains stable. Overall, the findings highlight the importance of integrating multi-source thermal observations into urban climate research and demonstrate the operational potential of satellite-derived thermal products for long-term UHI assessment in Lisbon. Ultimately, these results provide scientifically grounded support for climate-resilient urban planning and localised heat-mitigation strategies to improve thermal comfort, reduce heat exposure, and strengthen urban resilience under increasingly frequent extreme heat events.

Supplementary Materials

The following supporting information can be downloaded at: https://www.mdpi.com/article/10.3390/land15071209/s1, Table S1: Station name, location, data availability and completeness inventory for the meteorological station network, total number of observations, missing data percentages and land-use category; Figure S1: Spatial distribution of mean LST values (°C) for DJF period. The left column presents data retrieved from the SEVIRI sensor, while the right column displays results from MODIS. The panels represent: (a) daily average (SEVIRI), (b) daily average (MODIS), (c) 00:00 UTC nocturnal average (SEVIRI), (d) 00:00 UTC nocturnal average (MODIS), (e) 12:00 UTC diurnal average (SEVIRI), and (f) 12:00 UTC diurnal average (MODIS). Data represent hourly data over the entire climatological study period; Figure S2: Spatial distribution of mean LST values (°C) for MAM period. The left column presents data retrieved from the SEVIRI sensor, while the right column displays results from MODIS. The panels represent: (a) daily average (SEVIRI), (b) daily average (MODIS), (c) 00:00 UTC nocturnal average (SEVIRI), (d) 00:00 UTC nocturnal average (MODIS), (e) 12:00 UTC diurnal average (SEVIRI), and (f) 12:00 UTC diurnal average (MODIS). Data represent hourly data over the entire climatological study period; Figure S3: Spatial distribution of mean LST values (°C) for JJA period. The left column presents data retrieved from the SEVIRI sensor, while the right column displays results from MODIS. The panels represent: (a) daily average (SEVIRI), (b) daily average (MODIS), (c) 00:00 UTC nocturnal average (SEVIRI), (d) 00:00 UTC nocturnal average (MODIS), (e) 12:00 UTC diurnal average (SEVIRI), and (f) 12:00 UTC diurnal average (MODIS). Data represent hourly data over the entire climatological study period; Figure S4: Spatial distribution of mean LST values (°C) for SON period. The left column presents data retrieved from the SEVIRI sensor, while the right column displays results from MODIS. The panels represent: (a) daily average (SEVIRI), (b) daily average (MODIS), (c) 00:00 UTC nocturnal average (SEVIRI), (d) 00:00 UTC nocturnal average (MODIS), (e) 12:00 UTC diurnal average (SEVIRI), and (f) 12:00 UTC diurnal average (MODIS). Data represent hourly data over the entire climatological study period; Figure S5: Mean hourly air temperature (T2m in ºC), including the 10th and 90th percentiles, and mean hourly (UTC) LST. Annual averages are presented for the selected non-urban reference stations that fulfil the established criteria for this study. Reference stations: (a) 739, (b) 762, (c) 767, (d) 5138, (e) 5178, and (f) 5420. Data represent hourly annual averages over the entire climatological study period; Figure S6: Mean hourly air temperature (T2m in ºC), including the 10th and 90th percentiles, and mean hourly (UTC) LST. Annual averages are presented for the selected urban reference stations that fulfil the established criteria for this study. Reference stations: (a) 535, (b) 579, (c) 919 and (d) 935. Data represent hourly annual averages over the entire climatological study period; Figure S7: Inverse in-situ UHI intensity at each non-urban meteorological station relative to the urban reference stations: (a) 535, (b) 579, (c) 919, and (d) 935. Data represent hourly (UTC) annual averages over the entire climatological study period; Figure S8: Comparison between in-situ UHI intensity (solid line) and UHI estimates derived from SEVIRI (dashed line) and MODIS (cross markers). Data represent hourly (UTC) annual, DJF, MAM, JJA, SON averages over the entire climatological study period. Deviations are plotted for each urban station relative to the non-urban reference baseline: 739; Figure S9: Comparison between in-situ UHI intensity (solid line) and UHI estimates derived from SEVIRI (dashed line) and MODIS (cross markers). Data represent hourly (UTC) annual, DJF, MAM, JJA, SON averages over the entire climatological study period. Deviations are plotted for each urban station relative to the non-urban reference baseline: 762; Figure S10: Comparison between in-situ UHI intensity (solid line) and UHI estimates derived from SEVIRI (dashed line) and MODIS (cross markers). Data represent hourly (UTC) annual, DJF, MAM, JJA, SON averages over the entire climatological study period. Deviations are plotted for each urban station relative to the non-urban reference baseline: 767; Figure S11: Comparison between in-situ UHI intensity (solid line) and UHI estimates derived from SEVIRI (dashed line) and MODIS (cross markers). Data represent hourly (UTC) annual, DJF, MAM, JJA, SON averages over the entire climatological study period. Deviations are plotted for each urban station relative to the non-urban reference baseline: 5138; Figure S12: Comparison between in-situ UHI intensity (solid line) and UHI estimates derived from SEVIRI (dashed line) and MODIS (cross markers). Data represent hourly (UTC) annual, DJF, MAM, JJA, SON averages over the entire climatological study period. Deviations are plotted for each urban station relative to the non-urban reference baseline: 5178; Figure S13: Comparison between in-situ UHI intensity (solid line) and UHI estimates derived from SEVIRI (dashed line) and MODIS (cross markers). Data represent hourly (UTC) annual, DJF, MAM, JJA, SON averages over the entire climatological study period. Deviations are plotted for each urban station relative to the non-urban reference baseline: 5420; Figure S14: Comparative analysis of UHI intensity estimation differences (Satellite minus in-situ) for SEVIRI (dashed line) and MODIS (cross markers). Data represent hourly (UTC) annual, DJF, MAM, JJA, SON averages over the entire climatological study period. Deviations are plotted for each urban station relative to the non-urban reference baseline: 739; Figure S15: Comparative analysis of UHI intensity estimation differences (Satellite minus in-situ) for SEVIRI (dashed line) and MODIS (cross markers). Data represent hourly (UTC) annual, DJF, MAM, JJA, SON averages over the entire climatological study period. Deviations are plotted for each urban station relative to the non-urban reference baseline: 762; Figure S16: Comparative analysis of UHI intensity estimation differences (Satellite minus in-situ) for SEVIRI (dashed line) and MODIS (cross markers). Data represent hourly (UTC) annual, DJF, MAM, JJA, SON averages over the entire climatological study period. Deviations are plotted for each urban station relative to the non-urban reference baseline: 767; Figure S17: Comparative analysis of UHI intensity estimation differences (Satellite minus in-situ) for SEVIRI (dashed line) and MODIS (cross markers). Data represent hourly (UTC) annual, DJF, MAM, JJA, SON averages over the entire climatological study period. Deviations are plotted for each urban station relative to the non-urban reference baseline: 5138; Figure S18: Comparative analysis of UHI intensity estimation differences (Satellite minus in-situ) for SEVIRI (dashed line) and MODIS (cross markers). Data represent hourly (UTC) annual, DJF, MAM, JJA, SON averages over the entire climatological study period. Deviations are plotted for each urban station relative to the non-urban reference baseline: 5178; Figure S19: Comparative analysis of UHI intensity estimation differences (Satellite minus in-situ) for SEVIRI (dashed line) and MODIS (cross markers). Data represent hourly (UTC) annual, DJF, MAM, JJA, SON averages over the entire climatological study period. Deviations are plotted for each urban station relative to the non-urban reference baseline: 5420; Figure S20: In-situ UHI intensity at each urban meteorological station relative to the non-urban reference stations: (a) 739, (b) 5178, and (c) 5420. Data represent hourly averages over the 2003 heatwave period (29/07/2003–14/08/2003); Figure S21: In-situ UHI intensity at each urban meteorological station relative to the non-urban reference stations: (a) 739, (b) 762, (c) 767, (d) 5178, and (e) 5420. Data represent hourly averages over the 2018 heatwave period (01/08/2018–06/08/2018).

Author Contributions

Conceptualization, D.V., G.L. and M.P.; methodology, D.V., G.L. and M.P.; software, D.V.; validation, D.V., G.L. and M.P.; formal analysis, G.L. and M.P.; investigation, D.V.; resources, G.L.; data curation, D.V.; writing—original draft preparation, D.V.; writing—review and editing, G.L. and M.P.; visualization, D.V., G.L. and M.P.; supervision, G.L. and M.P.; project administration, M.P.; funding acquisition, D.V., G.L. and M.P. All authors have read and agreed to the published version of the manuscript.

Funding

This work is supported by National Funds through the FCT—Portuguese Foundation for Science and Technology, under the projects UID/04033/2020 and LA/P/0126/2020 (https://doi.org/10.54499/LA/P/0126/2020). This work was funded by FCT, I.P./MCTES (PT) through national funds (PIDDAC): LA/P/0068/2020 (https://doi.org/10.54499/LA/P/0068/2020), UID/50019/2025—(https://doi.org/10.54499/UID/50019/2025), and by the European Union—NextGenerationEU under projects UID/PRR/50019/2025 (https://doi.org/10.54499/UID/PRR/50019/2025) and UID/PRR2/50019/2025 (https://doi.org/10.54499/UID/PRR2/50019/2025).

Data Availability Statement

The satellite-derived datasets utilised in this study are publicly available and accessible via their respective platforms. Specifically, MSG-SEVIRI data are provided by EUMETSAT via the EUMETSAT Data Store, and MODIS Land Surface Temperature products are available through the NASA Earthdata portal (LP DAAC). Regarding the in-situ meteorological observations, the data were obtained from the Portuguese Institute for Sea and Atmosphere (IPMA) and the National Information System for Water Resources (SNIRH), including records managed by the Instituto Dom Luiz (IDL). These datasets are not publicly available due to institutional data policies and proprietary restrictions. However, they may be made available by the respective data providers upon reasonable request and subject to formal authorisation. Researchers interested in accessing these records should submit a well-justified proposal directly to the data’s legal owners.

Acknowledgments

The authors would like to thank the Portuguese Institute for Sea and Atmosphere (IPMA), the National Information System for Water Resources (SNIRH), and the Instituto Dom Luiz (IDL) for providing and processing the in-situ meteorological station data used in this study.

Conflicts of Interest

The authors declare no conflicts of interest.

Abbreviations

The following abbreviations are used in this manuscript:
CLCCorine Land Cover
CsaKöppen climate classification: Mediterranean hot-summer climate
CUHICanopy Urban Heat Island
DJFDecember, January, February (Winter)
DSTDaylight Saving Time
HWHeatwave
IPMAPortuguese Institute for Sea and Atmosphere
JJAJune, July, August (Summer)
KKelvin
LMALisbon Metropolitan Area
LSTLand Surface Temperature
LULCLand Use and Land Cover
MAMMarch, April, May (Spring)
MODISModerate Resolution Imaging Spectroradiometer
SEVIRIMeteosat Second Generation—Spinning Enhanced Visible and Infrared Imagery
SNIRHNational Information System for Water Resources
SONSeptember, October, November (Autumn)
SUHISurface Urban Heat Island
SVFSky View Factor
T2mAir temperature at 2 m
TmaxMaximum temperature
TminMinimum temperature
TrRural temperature
TuUrban temperature
UHIUrban Heat Island
UTCCoordinated Universal Time
°CDegrees Celsius

References

  1. Milošević, D.D.; Savić, S.M.; Marković, V.; Arsenović, D.; Šećerov, I. Outdoor human thermal comfort in local climate zones of Novi Sad (Serbia) during heat wave period. Hung. Geogr. Bull. 2016, 65, 129–137. [Google Scholar] [CrossRef]
  2. Huang, K.-T.; Yang, S.-R.; Matzarakis, A.; Lin, T.-P. Identifying outdoor thermal risk areas and evaluation of future thermal comfort concerning shading orientation in a traditional settlement. Sci. Total Environ. 2018, 626, 567–580. [Google Scholar] [CrossRef] [PubMed]
  3. Huang, C.-H.; Tsai, H.-H.; Chen, H.-C. Influence of weather factors on thermal comfort in subtropical urban environments. Sustainability 2020, 12, 2001. [Google Scholar] [CrossRef]
  4. Kim, Y.J.; Brown, R.D. A multilevel approach for assessing the effects of microclimatic urban design on pedestrian thermal comfort: The High Line in New York. Build. Environ. 2021, 205, 108244. [Google Scholar] [CrossRef]
  5. Oliveira, S.; Andrade, H. An initial assessment of the bioclimatic comfort in an outdoor public space in Lisbon. Int. J. Biometeorol. 2007, 52, 69–84. [Google Scholar] [CrossRef] [PubMed]
  6. Alcoforado, M.; Lopes, A.; Andrade, H.; Vasconcelos, J. Orientações Climáticas Para o Ordenamento em Lisboa; Universidade de Lisboa: Lisbon, Portugal, 2005; pp. 60–61. Available online: https://www.researchgate.net/publication/262567483_Orientacoes_Climaticas_para_o_Ordenamento_em_Lisboa (accessed on 15 February 2026).
  7. Andrade, H. O clima urbano-natureza, escalas de análise e aplicabilidade. Finisterra 2005, 40. [Google Scholar] [CrossRef]
  8. Alcoforado, M.-J.; Andrade, H.; Lopes, A.; Vasconcelos, J. Application of climatic guidelines to urban planning. Landsc. Urban Plan. 2009, 90, 56–65. [Google Scholar] [CrossRef]
  9. Alcoforado, M.; Andrade, H. Clima e Saúde na cidade. Implicações para o ordenamento. In A Cidade e a Saúde; Santana, P., Ed.; Edições Almedina: Lisbon, Portugal, 2007; pp. 99–118. [Google Scholar]
  10. Lopes, A.; Alves, E.; Alcoforado, M.J.; Machete, R. Lisbon Urban Heat Island Updated: New Highlights about the Relationships between Thermal Patterns and Wind Regimes. Adv. Meteorol. 2013, 2013, 487695. [Google Scholar] [CrossRef]
  11. Alcoforado, M.J.; Andrade, H.; Lopes, A. Urban Climate Maps in Lisbon, Portugal. In Urban Climatic Map—An Information Tool for Sustainable Urban Planning (Chinese Version); Chao, R., Ng, E., Eds.; The China Architecture & Building Press: Beijing, China, 2012; pp. 95–110. ISBN 978-7-112-13637-7. [Google Scholar]
  12. Soares, P.M.M.; Cardoso, R.M.; Semedo, Á.; Chinita, M.J.; Ranjha, R. Climatology of the Iberia coastal low-level wind jet: Weather research forecasting model high-resolution results. Tellus A Dyn. Meteorol. Oceanogr. 2014, 66, 22377. [Google Scholar] [CrossRef]
  13. Lima, D.C.; Bento, V.A.; Lemos, G.; Nogueira, M.; Soares, P.M. A multi-variable constrained ensemble of regional climate projections under multi-scenarios for Portugal—Part II: Sectoral climate indices. Clim. Serv. 2023, 30, 100377. [Google Scholar] [CrossRef]
  14. Lopes, A.; Saraiva, J.; Alcoforado, M. Urban boundary layer wind speed reduction in summer due to urban growth and environmental consequences in Lisbon. Environ. Model. Softw. 2011, 26, 241–243. [Google Scholar] [CrossRef]
  15. Lopes, A. O sobreaquecimento das cidades. Causas e medidas para a mitigação da ilha de calor de Lisboa. Territorium 2008, 15, 39–52. [Google Scholar] [CrossRef] [PubMed]
  16. Andrade, H.; Alcoforado, M.-J. Microclimatic variation of thermal comfort in a district of Lisbon (Telheiras) at night. Theor. Appl. Clim. 2007, 92, 225–237. [Google Scholar] [CrossRef]
  17. Greater London Authority. London’s Urban Heat Island: A Summary for Decision Makers; Greater London Authority: London, UK, 2006.
  18. Rutledge, K.; Ramroop, T.; Boudreau, D.; McDaniel, M.; Teng, S.; Sprout, E.; Costa, H. Urban Heat Island. 2011. Available online: https://www.nationalgeographic.org/encyclopedia/urban-heat-island/ (accessed on 25 January 2026).
  19. Oke, T.R. The energetic basis of the urban heat island. Q. J. R. Meteorol. Soc. 1982, 108, 1–24. [Google Scholar] [CrossRef]
  20. Roth, M.; Oke, T.R. Turbulent transfer relationships over an urban surface. I. Spectral characteristics. Q. J. R. Meteorol. Soc. 1993, 119, 1071–1104. [Google Scholar] [CrossRef]
  21. Sabnis, G. Green Building with Concrete: Sustainable Design and Construction; CRC Press: Boca Raton, FL, USA, 2015. [Google Scholar]
  22. Garratt, J. Boundary layer climates. Earth-Sci. Rev. 1987, 27, 265. [Google Scholar] [CrossRef]
  23. Alverson, K.; Bailey, W.G.; Oke, T.R.; Rouse, W.R. The surface climates of Canada. Arct. Alp. Res. 1997, 30, 418. [Google Scholar] [CrossRef] [PubMed]
  24. Voogt, J.A.; Oke, T.R. Thermal remote sensing of urban climates. Remote Sens. Environ. 2003, 86, 370–384. [Google Scholar] [CrossRef]
  25. Oke, T.; Mills, G.; Christen, A.; Voogt, J. Urban Climate; Cambridge University Press: Cambridge, UK, 2017; pp. 156–158. [Google Scholar]
  26. Oliveira, A.; Lopes, A.; Correia, E.; Niza, S.; Soares, A. Heatwaves and Summer Urban Heat Islands: A Daily Cycle Approach to Unveil the Urban Thermal Signal Changes in Lisbon, Portugal. Atmosphere 2021, 12, 292. [Google Scholar] [CrossRef]
  27. Arnfield, A. Two decades of urban climate research: A review of turbulence, exchanges of energy and water, and the urban heat island. Int. J. Climatol. A J. R. Meteorol. Soc. 2003, 23, 1–26. [Google Scholar] [CrossRef]
  28. Alcoforado, M.-J.; Andrade, H. Nocturnal urban heat island in Lisbon (Portugal): Main features and modelling attempts. Theor. Appl. Clim. 2006, 84, 151–159. [Google Scholar] [CrossRef]
  29. Reis, C. A Eficiência Térmica no Potencial de Arrefecimento de dois Espaços Verdes em Lisboa. Master’s Thesis, Universidade de Lisboa, Lisbon, Portugal, 2018. [Google Scholar]
  30. Geletič, J.; Lehnert, M.; Savić, S.; Milošević, D. Modelled spatiotemporal variability of outdoor thermal comfort in local climate zones of the city of Brno, Czech Republic. Sci. Total Environ. 2018, 624, 385–395. [Google Scholar] [CrossRef] [PubMed]
  31. Lau, K.K.-L.; Shi, Y.; Ng, E.Y.-Y. Dynamic response of pedestrian thermal comfort under outdoor transient conditions. Int. J. Biometeorol. 2019, 63, 979–989. [Google Scholar] [CrossRef] [PubMed]
  32. Lau, K.K.-L.; Tan, Z.; Morakinyo, T.E.; Ren, C. Outdoor Thermal Comfort in Urban Environment: Assessments and Applications in Urban Planning and Design, 1st ed.; Springer: Singapore, 2022. [Google Scholar] [CrossRef]
  33. Du, H.; Zhan, W.; Liu, Z.; Li, J.; Li, L.; Lai, J.; Miao, S.; Huang, F.; Wang, C.; Wang, C.; et al. Simultaneous investigation of surface and canopy urban heat islands over global cities. ISPRS J. Photogramm. Remote Sens. 2021, 181, 67–83, ISSN 0924-2716. [Google Scholar] [CrossRef]
  34. Andrade, H. Bioclima Humano e Temperatura do ar em Lisboa; Universidade de Lisboa: Lisbon, Portugal, 2003. [Google Scholar]
  35. Lopes, A. Modificações no Clima de Lisboa Como Consequência do Crescimento Urbano. Vento, ilha de calor de Superfície e Balanço Energético. In Tese de Doutoramento em Geografia Física Apresentada à Faculdade de Letras da Universidade de Lisboa; Univerisdade de Lisboa: Lisbon, Portugal, 2003; p. 354. [Google Scholar]
  36. Alcoforado, M.J.; Lopes, A.; Andrade, H. Urban Climatic Map Studies in Portugal: Lisbon. In The Urban Climatic Map for Sustainable Urban Living; Ng, E., Ren, C., Eds.; Routledge: London, UK, 2015; Chapter 16. [Google Scholar]
  37. Foshag, K.; Aeschbach, N.; Höfle, B.; Winkler, R.; Siegmund, A.; Aeschbach, W. Viability of public spaces in cities under increasing heat: A transdisciplinary approach. Sustain. Cities Soc. 2020, 59, 102215. [Google Scholar] [CrossRef]
  38. Reis, C.; Lopes, A.; Correia, E.; Fragoso, M. Local weather types by thermal periods: Deepening the knowledge about Lisbon’s urban climate. Atmosphere 2020, 11, 840. [Google Scholar] [CrossRef]
  39. Karimi, A.; Mohammad, P.; García-Martínez, A.; Moreno-Rangel, D.; Gachkar, D.; Gachkar, S. New developments and future challenges in reducing and controlling heat island effect in urban areas. Environ. Dev. Sustain. 2023, 25, 10485–10531. [Google Scholar] [CrossRef]
  40. Du, H.; Zhan, W.; Voogt, J.; Bechtel, B.; Chakraborty, T.C.; Liu, Z.; Hu, L.; Wang, Z.; Li, J.; Fu, P.; et al. Contrasting trends and drivers of global surface and canopy urban heat islands. Geophys. Res. Lett. 2023, 50, e2023GL104661. [Google Scholar] [CrossRef]
  41. Krelaus, L.; Apfel, J.; Sismanidis, P.; Bechtel, B. Differences in the Intensity of Surface and Canopy-Layer Urban Heat Islands in Europe. IEEE J. Sel. Top. Appl. Earth Obs. Remote Sens. 2024, 17, 15222–15242. [Google Scholar] [CrossRef]
  42. Zhou, W.; Qian, Y.; Li, X.; Li, W.; Han, L. Relationships between land cover and the surface urban heat island: Seasonal variability and effects of spatial and thematic resolution of land cover data on predicting land surface temperatures. Landsc. Ecol. 2014, 29, 153–167. [Google Scholar] [CrossRef]
  43. Stewart, I.D.; Oke, T.R. Local climate zones for urban temperature studies. Bull. Am. Meteorol. Soc. 2012, 93, 1879–1900. [Google Scholar] [CrossRef]
  44. Nogueira, M.; Lima, D.C.A.; Soares, P.M.M. An integrated approach to project the future urban climate response: Changes to Lisbon’s urban heat island and temperature extremes. Urban Clim. 2020, 34, 100683. [Google Scholar] [CrossRef]
  45. Hurduc, A.; Ermida, S.L.; DaCamara, C.C. On the Suitability of Different Satellite Land Surface Temperature Products to Study Surface Urban Heat Islands. Remote Sens. 2024, 16, 3765. [Google Scholar] [CrossRef]
  46. Bushenkova, A.; Soares, P.M.M.; Johannsen, F.; Lima, D.C.A. Towards an improved representation of the urban heat island effect: A multi-scale application of XGBoost for Madrid. Urban Clim. 2024, 55, 101982. [Google Scholar] [CrossRef]
  47. Johannsen, F.; Soares, P.M.; Langendijk, G.S. Comparing Deep Learning-Based Downscaling and the SURFEX Land Surface Model on Representing Temperature Extremes and the Urban Heat Island in Paris. In Proceedings of the EGU General Assembly 2026, Vienna, Austria, 3–8 May 2026. Abstract EGU26-11400. [Google Scholar] [CrossRef]
  48. Vilão, D.; Ramos, I.L. Lisbon Urban Climate: Statistical Analysis/Approach for Urban Heat Island Effect Based on a Pioneering Urban Meteorological Network. Atmosphere 2024, 15, 1177. [Google Scholar] [CrossRef]
Figure 1. LULC classifications and geographical distribution of the meteorological stations within the defined study area of the Lisbon Metropolitan Area. These are divided into different providers, such as IPMA and SNIRH, along with the stations’ codes.
Land 15 01209 g001
Figure 2. Conceptual roadmap of Section 3, integrating satellite LST and in-situ air temperature scales.
Land 15 01209 g002
Figure 3. Spatial distribution of mean LST values (°C) for the entire study period. The left column presents data retrieved from the MSG-SEVIRI sensor, while the right column displays results from MODIS. The panels represent: (a) daily average (SEVIRI), (b) daily average (MODIS), (c) 00:00 UTC nocturnal average (SEVIRI), (d) 00:00 UTC nocturnal average (MODIS), (e) 12:00 UTC diurnal average (SEVIRI), and (f) 12:00 UTC diurnal average (MODIS).
Land 15 01209 g003
Figure 4. T2m observations across IPMA and SNIRH meteorological station networks. Data represent hourly (UTC) annual averages over the entire climatological study period. The panels represent: (a) the daily average; (b) 00:00 UTC nocturnal average; (c) 12:00 UTC diurnal average.
Land 15 01209 g004
Figure 5. In-situ UHI intensity at each urban meteorological station relative to the non-urban reference stations: (a) 739, (b) 762, (c) 767, (d) 5138, (e) 5178, and (f) 5420. Data represent hourly (UTC) annual averages over the entire climatological study period.
Land 15 01209 g005
Figure 6. In-situ UHI intensity (solid line) and UHI estimates derived from MSG-SEVIRI (dashed line) and MODIS (cross markers). Data represent hourly (UTC) annual averages over the entire climatological study period. Deviations are plotted for each urban station relative to the non-urban reference baselines: (a) 739, (b) 762, (c) 767, (d) 5138, (e) 5178, and (f) 5420.
Land 15 01209 g006
Figure 7. UHI intensity estimation differences (Satellite minus in-situ) for MSG-SEVIRI (dashed line) and MODIS (cross markers). Data represent hourly (UTC) annual averages over the entire climatological study period. Deviations are plotted for each urban station relative to the non-urban reference baselines: (a) 739, (b) 762, (c) 767, (d) 5138, (e) 5178, and (f) 5420.
Land 15 01209 g007
Figure 8. Spatial distribution of mean LST values (°C) for the 2003 heat wave period (29 July 2003–14 August 2003). The left column presents data retrieved from the MSG-SEVIRI sensor, while the right column displays results from MODIS. The panels represent: (a) daily average (SEVIRI), (b) daily average (MODIS), (c) 00:00 UTC nocturnal average (SEVIRI), (d) 00:00 UTC nocturnal average (MODIS), (e) 12:00 UTC diurnal average (SEVIRI), and (f) 12:00 UTC diurnal average (MODIS).
Land 15 01209 g008
Figure 9. T2m observations across IPMA and SNIRH meteorological station networks during the 2003 heatwave (29 July 2003–14 August 2003). The panels represent: (a) the daily average; (b) 00:00 UTC nocturnal average; (c) 12:00 UTC diurnal average.
Land 15 01209 g009
Figure 10. Difference between in-situ UHI intensity at each urban meteorological station relative to the usual climatological values relative to non-urban reference stations: (a) 739, (b) 5138, and (c) 5420. Data represent the hourly Δ(ΔTu-Tr) calculated as the difference between the 2003 extreme event period (29 July 2003–14 August 2003) and the long-term climatological mean. Positive values indicate an amplification of the urban–rural thermal contrast during the heatwave.
Land 15 01209 g010
Figure 11. Spatial distribution of mean LST values (°C) for the 2018 heat wave period (1 August 2018–6 August 2018). The left column presents data retrieved from the MSG-SEVIRI sensor, while the right column displays results from MODIS. The panels represent: (a) daily average (SEVIRI), (b) daily average (MODIS), (c) 00:00 UTC nocturnal average (SEVIRI), (d) 00:00 UTC nocturnal average (MODIS), (e) 12:00 UTC diurnal average (SEVIRI), and (f) 12:00 UTC diurnal average (MODIS).
Land 15 01209 g011
Figure 12. T2m observations across IPMA and SNIRH meteorological station networks during the 2018 heatwave (1 August 2018–6 August 2018). The panels represent: (a) the daily average; (b) 00:00 UTC nocturnal average; (c) 12:00 UTC diurnal average.
Land 15 01209 g012
Figure 13. Difference between in-situ UHI intensity at each urban meteorological station relative to the usual climatological values relative to non-urban reference stations: (a) 739, (b) 762, (c) 767, (d) 5178, and (e) 5420. Data represent the hourly Δ(ΔTu-Tr) calculated as the difference between the 2018 extreme event period (1 August 2018–6 August 2018) and the long-term climatological mean. Positive values indicate an amplification of the urban–rural thermal contrast during the heatwave.
Land 15 01209 g013
Table 1. Technical specifications and orbital parameters of the MODIS and MSG-SEVIRI satellite products used in the study.
FeatureMODIS (Terra/Aqua, NASA)MSG-SEVIRI (MSG, Eumetsat)
Orbit TypePolar-orbitingGeostationary
(Sun-synchronous)
Spatial Resolution1 km~3 km to 5 km
Temporal Resolution2-day/2-night overpasses15 min
Data ContinuitySnapshot-basedContinuous Diurnal Cycle
Primary StrengthMapping intra-urban thermal gradientsMonitoring heating/cooling rates
Disclaimer/Publisher’s Note: The statements, opinions and data contained in all publications are solely those of the individual author(s) and contributor(s) and not of MDPI and/or the editor(s). MDPI and/or the editor(s) disclaim responsibility for any injury to people or property resulting from any ideas, methods, instructions or products referred to in the content.