Article

Avian Responses to Coastal Urbanization: Spatiotemporal Shifts in Habitat Suitability and Changing Ecological Drivers in a High-Density City


1
School of Architecture and Urban Planning, Shenzhen University, Shenzhen 518060, China
2
State Key Laboratory of Subtropical Building and Urban Science, Guangzhou 518060, China
3
School of Architecture, Tianjin University, Tianjin 300072, China
4
Wellington School of Architecture, Faculty of Architecture and Design Innovation, Victoria University of Wellington, Wellington 6140, New Zealand
5
College of Horticulture and Landscape Architecture, Southwest University, Chongqing 400715, China
*
Author to whom correspondence should be addressed.
Current affiliation: International Federation of Landscape Architects, 10 Rue du Maréchal Joffre, 78000 Versailles, France.
Land 2026, 15(7), 1210; https://doi.org/10.3390/land15071210 (registering DOI)
Submission received: 9 May 2026 / Revised: 25 June 2026 / Accepted: 27 June 2026 / Published: 6 July 2026
(This article belongs to the Section Land, Biodiversity, and Human Wellbeing)

Abstract

Rapid coastal urbanization poses severe threats to biodiversity through habitat fragmentation, making continuous monitoring of urban ecosystems essential. While birds serve as sensitive bio-indicators, the long-term spatiotemporal dynamics of their habitats and temporal shifts in environmental drivers remain poorly understood in high-density megacities. This study addresses this gap by developing a trend-explainable machine learning framework to evaluate avian habitat suitability across the western coast of Shenzhen from 2010 to 2020. We applied a standardized filtering protocol to citizen science data and integrated occupancy modeling with a Random Forest algorithm to simulate habitat distributions at 30 m resolution. Spatiotemporal habitat alterations were quantified using Mann–Kendall trend analysis, while SHAP was utilized to diagnose the changing importance and non-linear thresholds of ecological drivers over the decade. Our findings reveal pronounced spatial heterogeneity among six avian guilds. Habitat quality for terrestrial birds, raptors, and songbirds degraded severely in northern industrial regions, whereas targeted ecological restoration facilitated recovery in southern and western urban cores. The analysis further demonstrates dynamic temporal shifts in environmental responses. The restrictive impact of anthropogenic stressors including population density and nighttime light weakened for terrestrial and canopy-dwelling guilds but intensified for waterfowl. Concurrently, natural elements such as vegetation coverage and proximity to water bodies became increasingly important. Based on these spatiotemporal patterns, we delineated five ecological zones to guide targeted conservation interventions. This research provides an analytical framework linking predictive modeling with mechanistic insights, supporting evidence-based biodiversity conservation and sustainable urban planning in rapidly developing coastal landscapes.

1. Introduction

Rapid urbanization has intensified the competition between humans and wildlife for critical resources like space and food [1,2,3]. We know much about biodiversity, ecosystems, and human wellbeing in our landscapes, but much less about how their interactions influence, and are influenced by, landscape patterns [4]. Regional landscapes represent a pivotal scale domain for studying and practicing sustainability because they integrate human–environment interactions [5,6]. These anthropogenic landscape transformations exert a discernible influence on the distribution and diversity of species, with the magnitude of this impact exhibiting a predictable pattern in relation to urbanization levels [7]. Advanced stages of urbanization are often associated with detrimental effects on wildlife communities [8,9,10], leading to a decline in species richness within urban fauna and a reduction in functional and phylogenetic diversity [11,12]. Consequently, cities must be designed not only to accommodate human needs but also to provide habitats for wildlife, underscoring the necessity of forging a path for coexistence between humans and wild fauna [7,13,14].
Birds are high-trophic-level organisms with wide distributions and high sensitivity to environmental change. As a result, they are strongly affected by urbanization. At the same time, they are among the most thoroughly studied urban taxa, owing to their conspicuousness, well-established survey methodologies, and the availability of abundant long-term data [15,16]. Birds are relatively easy to observe in urban areas [17] and can improve the health and well-being of urban residents [18]. Research on urban ecology through bird diversity has yielded substantial findings. Scholars apply a range of mathematical models to explore the interplay between avian life and urban landscapes [19,20,21,22]. These studies also evaluate environmental determinants of avian habitat quality at various scales, from regional to green space, laying the groundwork for ecological restoration initiatives [23,24].
Transect surveys are a traditional method for bird census, which are relatively accurate but require more time and labor [25,26]. Citizen science data expands the scale of research, eliminating temporal and spatial constraints, thereby enhancing the generalizability of research findings [27,28,29], which offers new opportunities to describe bird distribution and functional composition over large spatiotemporal scales and to test hypotheses [30,31,32]. Databases such as eBird [33], iNaturalist [34], and China Bird Report Center [32] have been applied to the prediction of species distribution [35]. However, citizen science data, being spontaneous geographic data, is influenced by the subjective factors of individual birdwatchers [36] and their spatial selection preferences [30], leading to sampling biases [37]. Therefore, when using citizen science data to predict bird distribution, data preprocessing and model selection are particularly crucial [38]. Common data processing methodologies encompass the application of sparsity techniques to records [38], the strategic selection of records based on predefined recording durations or recorder qualifications [39], and the integrated modeling of both presence and pseudo-absence points to enhance the predictive power of species distribution models [40]. Additionally, it is feasible to employ a more sophisticated modeling approach that mitigates the impact of data bias through ongoing iteration.
At the urban scale, bird distribution is influenced by multiple factors related to the built environment. [41] studied the impact of climate factors on bird hatching, finding that temperature and precipitation affect bird reproduction. Additionally, bird population numbers fluctuate with changes in temperature and precipitation [42]. The influence of topographical factors on birds is indirect; factors such as climate, vegetation, and water sources often exhibit vertical gradient changes, thereby affecting bird composition [43,44] explored the response of bird community composition to environmental differences in land use and vegetation structure. Plant communities can provide birds with safe habitats and foraging conditions [45,46]. Various green spaces, water bodies, and agricultural and forest lands are the primary foraging areas for birds [8,47]. Changes in land use types may also lead to the loss of original bird habitats [48]. One of the primary causes of this is rapid urbanization, which significantly changes the composition, structure, distribution, and nesting behaviors of urban birds [49]. Studies have shown that anthropogenic factors such as population density, number of motor vehicles [50], and noise levels [51] also affect bird distribution [2,52,53,54]. At the same time, the development of green infrastructure can effectively mitigate the threats posed by urbanization to avian survival [55,56]. Large parks and golf courses provide key habitats for birds, offering essential spaces for foraging and nesting [57]. Green roofs and pocket parks can also act as refuges, compensating for habitat loss due to urban expansion [58,59]. Green roofs, particularly those with deeper substrates, native vegetation, and bird-friendly features, have been shown to support diverse bird communities [60] Moreover, preserving isolated mature vegetation within urban developments is vital for enhancing woodland bird habitats, boosting bird abundance and diversity, and improving ecological connectivity in urban landscapes [58]. Various species distribution models (SDMs) are available for determining species diversity and habitat suitability [61,62], such as GARP [63], GAMs [64], and MaxEnt [65]. In recent years, with the advancement of machine learning, models such as Random Forest and artificial neural networks (ANN) have been increasingly applied to species distribution modeling. For example, Bikkina compared the performance of various machine learning models in predicting bird distributions [66]; Linderman et al. employed ANN to predict vegetation distribution using remote sensing data [67]; and Zhao et al. found that Random Forest outperformed MaxEnt in predicting the distribution of two endangered species in China [68]. However, as black-box models, machine learning approaches often suffer from limited interpretability, making it challenging to clearly understand how input variables influence model outputs [69].
Based on the preceding review, citizen science data for species distribution modeling emphasize current distributions, often neglecting temporal dynamics despite the long-term nature of the data. Moreover, applications of machine learning models tend to prioritize predictive performance, with limited focus on interpreting the influence of environmental variables on species distribution patterns. This study aims: (1) to model habitat dynamics by combining citizen-science bird-occurrence records with multi-source environmental variables within a Random Forest (RF) framework, simulating decadal potential distributions of six avian groups. Spatiotemporal changes will be quantified using the Sen-MK method to assess urbanization-driven habitat alterations; (2) to diagnose shifting environmental drivers by applying the SHAP model to systematically evaluate temporal variations in factor importance, interactions, and directional effects on avian distributions under urbanization; (3) to identify critical environmental thresholds governing nonlinear responses in bird distributions, thereby revealing mechanistic pathways through which urbanization and ecological restoration shape long-term avian community dynamics.
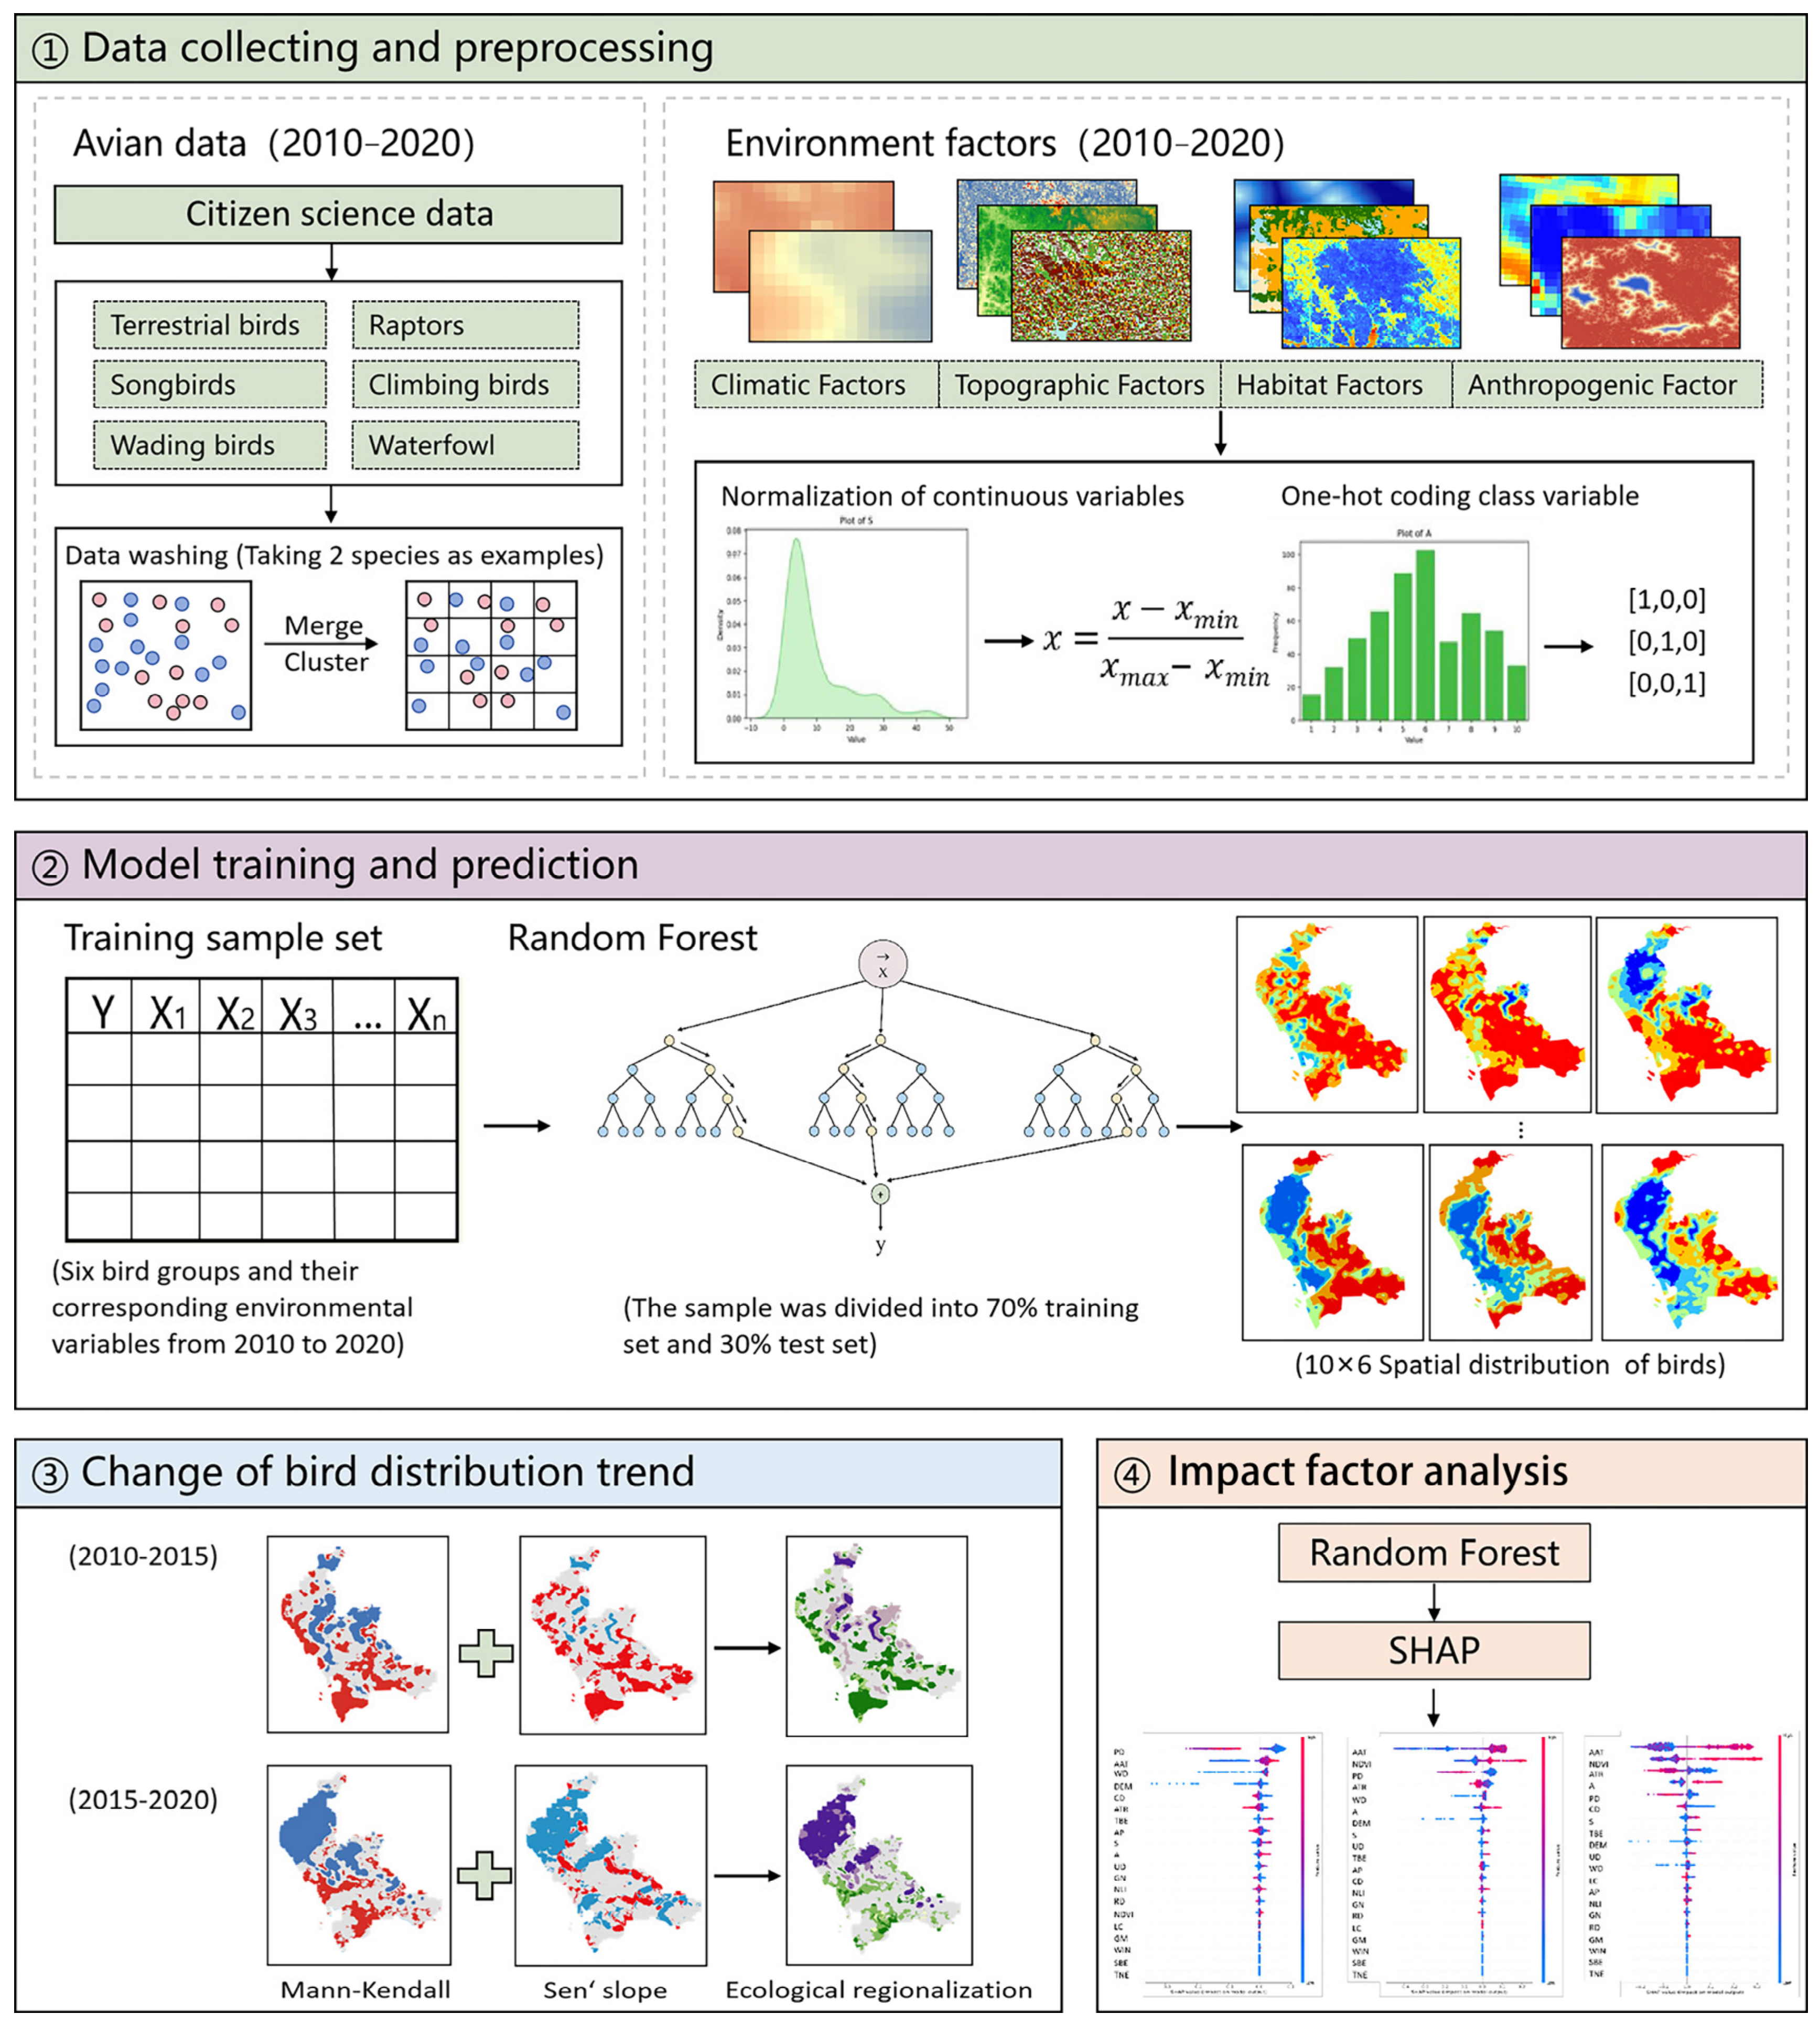
The data analysis framework of this study consists of four main steps (Figure 1). First, data collection and preprocessing include cleaning, interpolation analysis, handling data sparsity, and mask extraction of bird observation and environmental data. Second, model training and prediction involve inputting the bird data and corresponding environmental variables into a Random Forest model. The trained model is then applied to environmental data from different years to generate spatiotemporal bird distribution maps. Third, the Sen-MK method is used to analyze distribution trends and different types of ecological zones based on the observed changes. Finally, a driver analysis is conducted using the SHAP model to explore the specific influence patterns and temporal changes of urban environmental factors on bird distributions.

2. Materials and Methods

2.1. Study Area and Data

2.1.1. Study Area

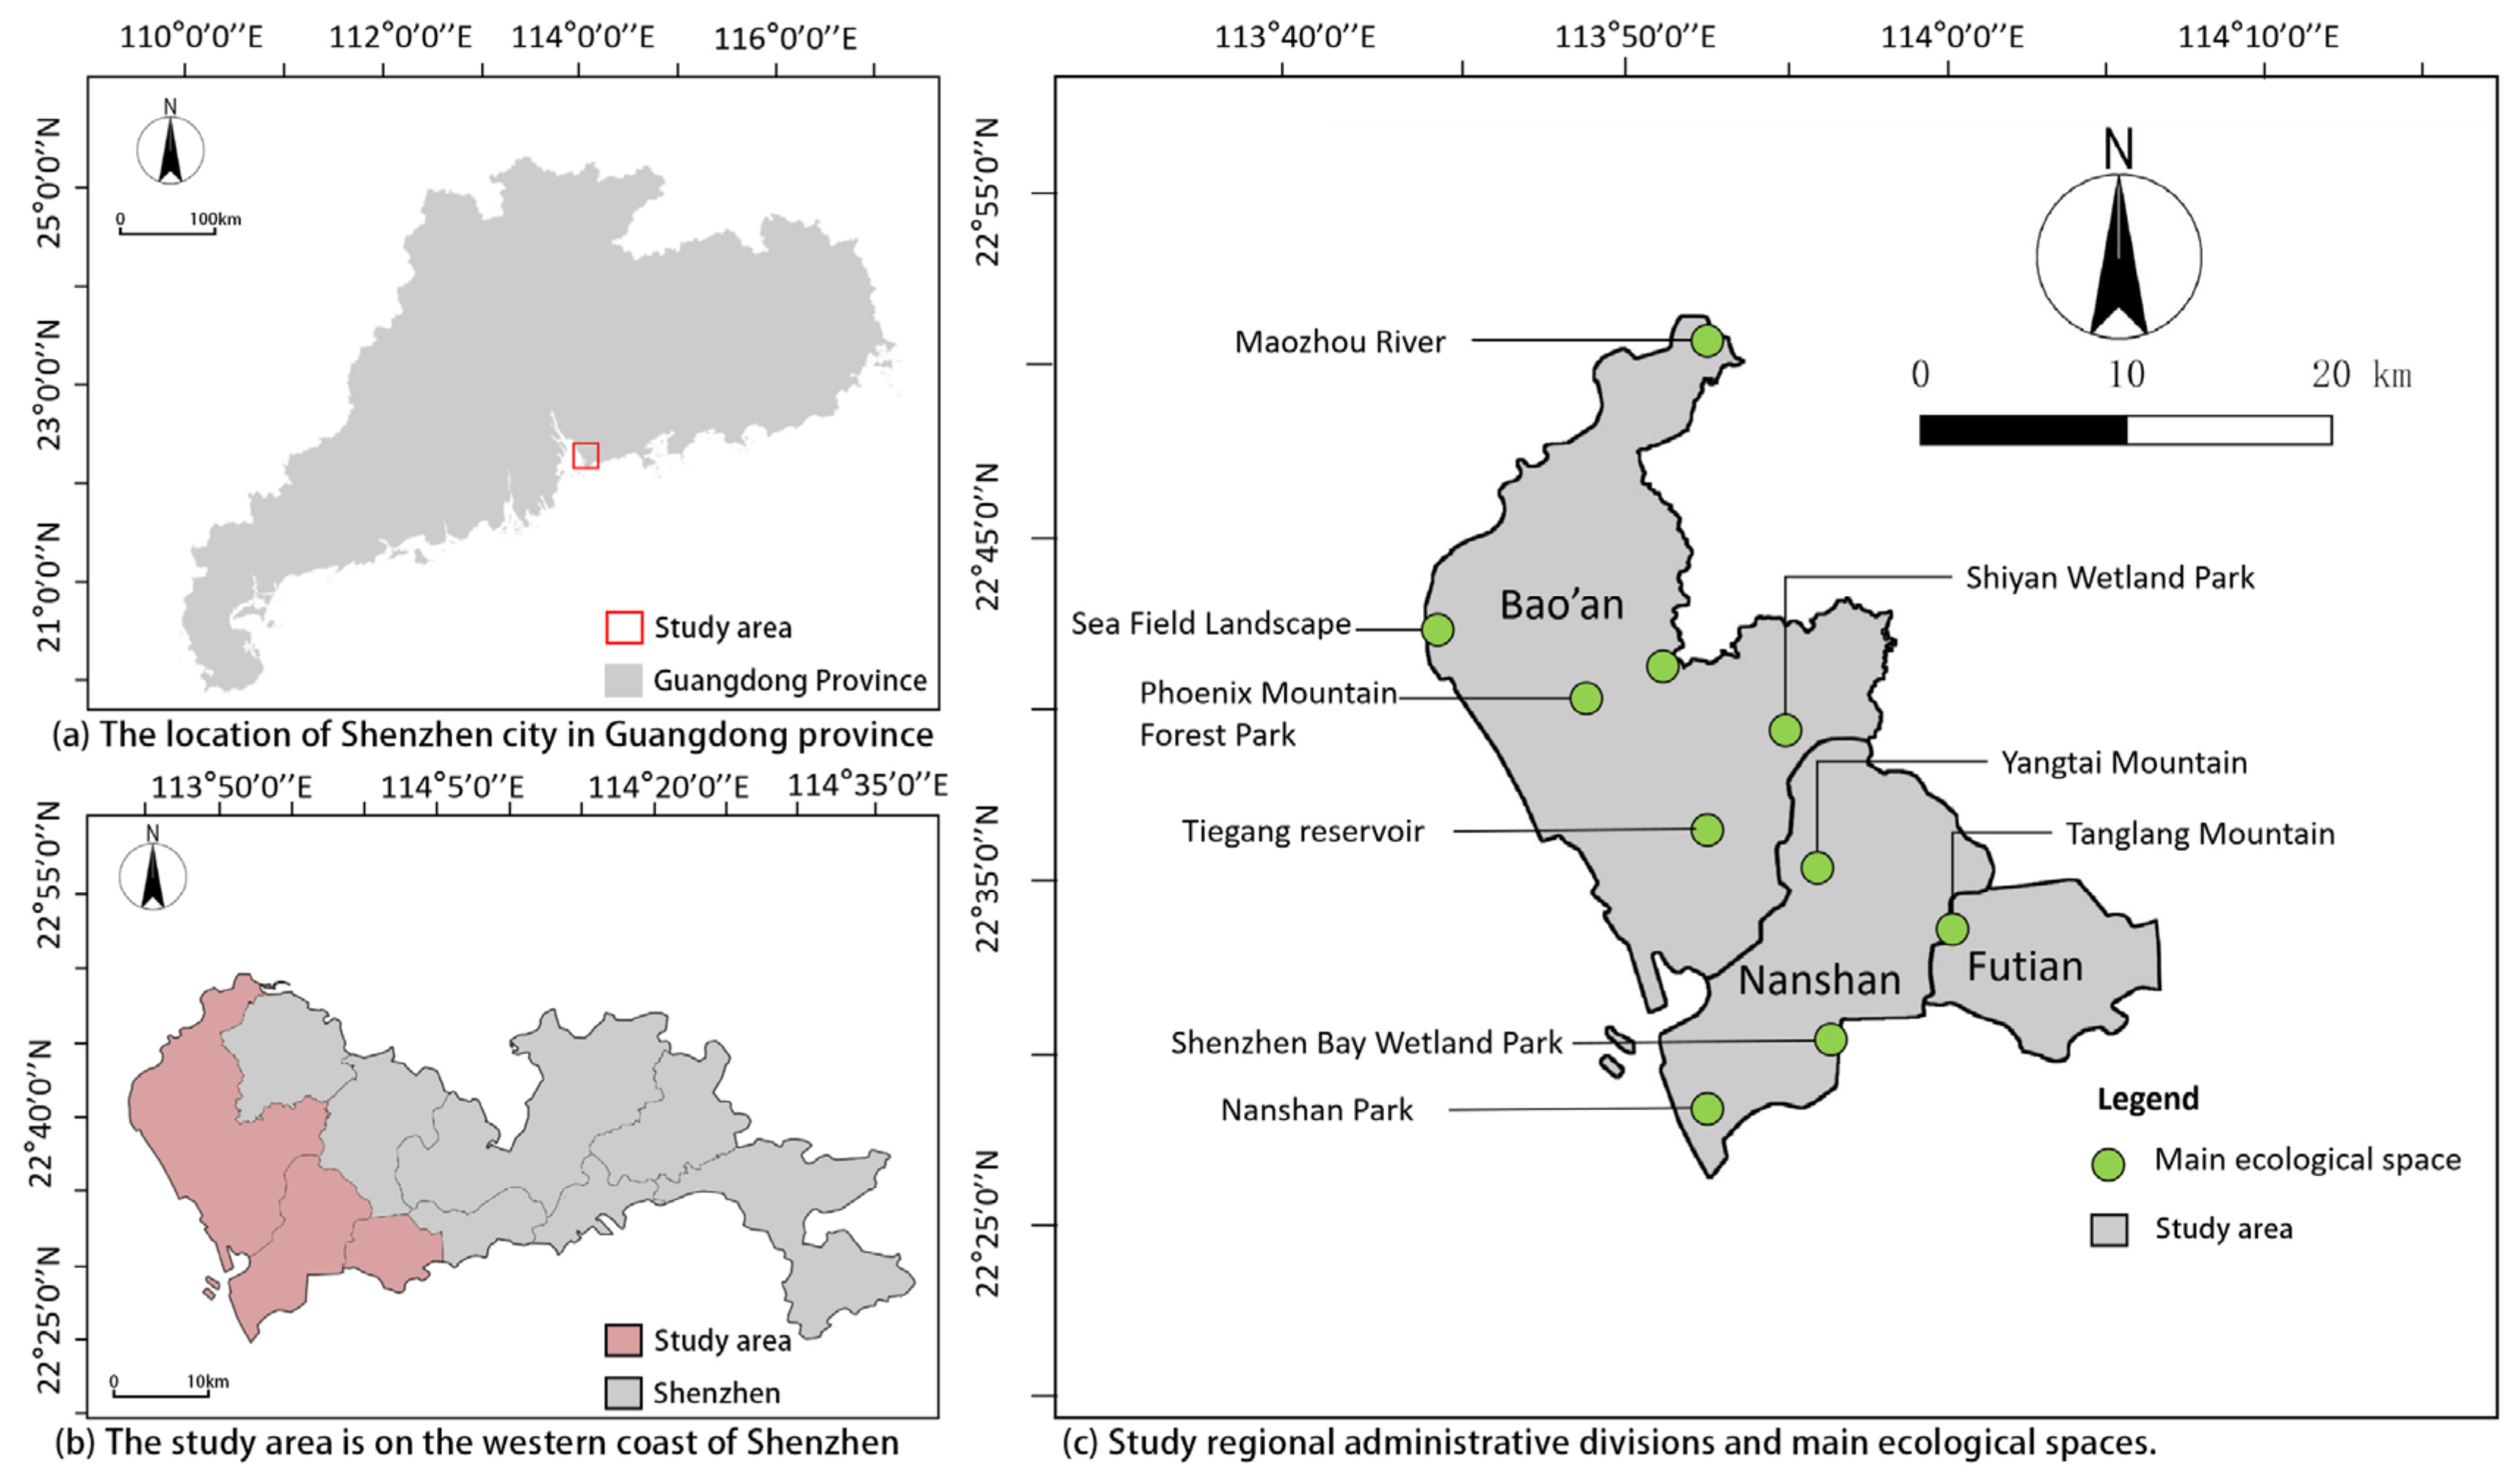
The research area is situated along the western coast of Shenzhen City, Guangdong Province, in southern China, encompassing Bao’an District, Nanshan District, and Futian District. It features a subtropical maritime climate characterized by hot, rainy summers and mild weather in other seasons. The total area of the study area is approximately 663.01 km2, with geographical coordinates ranging from 22°24′ N to 22°51′ N latitude and 113°44′ E to 114°07′ E longitude. The area contains evergreen monsoon forests, broadleaf evergreen forests, mangrove wetlands, bamboo groves and shrublands, creating a complex ecological network. Important conservation sites include Tiegang Reservoir, Xili Reservoir, Phoenix Mountain, Yangtai Mountain Forest Park, and the nationally protected Futian Mangrove Nature Reserve which is being developed as an International Mangrove Center (Figure 2). According to records from the China Bird Report Center (http://www.birdreport.cn), the three administrative districts harbor 275, 331, and 346 bird species respectively, making them vital habitats for numerous bird species. Rapid urbanization has transformed Shenzhen’s coastal landscape through land reclamation and shoreline hardening, while dense development has encroached on ecological spaces. In response, bird-friendly city policies were implemented to balance conservation and growth [70]. This makes the area a valuable case study for sustainable development in high-density coastal cities, offering insights for urban planning that preserves ecosystems amid economic expansion.

2.1.2. Datasets and Variables

(1) Dependent variables: The primary avian data for this study originate from two independent citizen science sources. The eBird database (https://ebird.org/home) was used to construct the training sample for the predictive model. eBird is the world’s largest biodiversity-related citizen science initiative [26], collecting tens of millions of bird observations annually. Each record in eBird contains six key fields (who, where, when, what species, how many, and effort), and the platform’s structure of ‘complete checklists’ along with standardized effort metrics makes it well-suited for generating high-quality training data [26]. The China Bird Report Center (http://www.birdreport.cn) served as an independent external validation source. This platform, which as of 2023 had over 45,000 registered users and approximately 8.4 million records covering 1380 bird species, comprising about 94% of all species in China [32], consists primarily of unstructured presence records. Validation on a truly independent dataset is widely considered the most robust way to assess SDM performance, because it directly tests how well the model can generalise to data that were not used in any stage of model calibration [71]. The two datasets were not merged into a single dataset. Instead, they were used for separate and complementary functions. The filtered and processed eBird data served as the sole input for training the Random Forest model. The independent BirdReport data were reserved exclusively for external validation, providing an unbiased benchmark for assessing the model’s predictive accuracy [71]. In addition, In addition, published ecological literature from the Shenzhen Bird Watching Association (SZBird; http://www.szbird.org.cn/) was used as a qualitative reference during pseudo-absence selection. Established in 2004 as a non-profit local ornithological organization, SZBird is dedicated to promoting birdwatching, conducting ecological surveys, and establishing a fundamental database for wild birds in Shenzhen [72]. Its published regional species checklists, such as the 2025 edition documenting 447 species across 21 orders and 78 families [72], provide qualitative, narrative habitat-preference descriptions for each species. These published descriptions were used during the ecological plausibility screening stage of pseudo-absence selection (see Section 2.2.1) to evaluate whether candidate absence sites were ecologically reasonable.
To ensure data quality and mitigate the inherent uncertainties of citizen science data, we implemented a rigorous multi-step filtering protocol aligned with the eBird Best Practices [73]. The process began with the exclusive retention of ‘complete checklists’ to guarantee the exhaustive reporting of all species detected during each survey. These records were further refined through strict effort-based filters that excluded observations with traveling distances exceeding 1 km or sampling durations outside the 5–240 min range, thereby ensuring a tighter spatial coupling between the reported coordinates and the actual observation sites. To address spatial sampling bias and reduce autocorrelation, we performed spatial thinning by aggregating occurrences onto a 30 m grid and retaining only the single record with the highest sampling effort per cell, This methodology balanced spatial independence with ecological representativeness while controlling for sampling bias, ultimately yielding 1095 occurrence points.
The taxonomic classification of birds was conducted in accordance with The ‘Chinese Bird Classification and Distribution List (Second Edition)’ [74], which resulted in the identification of 20 orders, 82 families, and 406 species. According to the different ecological habits and behavior preferences of birds, the avian species were categorized into six major classes, including waterfowl, songbirds, wading birds, climbing birds, raptors, and terrestrial birds [75,76]. Waterfowl inhabit aquatic environments or water edges, excelling in swimming and diving, and feeding on aquatic plants and animals. Wading birds are adapted to living in marshes and by water, feeding on fish, shrimp, and aquatic insects. Climbing birds live in trees, feeding on fruits, seeds, and insects. Terrestrial birds primarily forage on the ground and are unsuited for long-distance flight. Raptors are fierce carnivorous birds with diverse habitats. Songbirds form the largest group of birds and typically perch in trees [77]. These six major classes follow Zheng’s long-standing tradition in avian ecology [74]. He classified birds by shared habitat use, morphology and behavior; species in each group occupy comparable habitats, use similar foraging substrates, and rely on broadly similar food types [78]. Because they share these traits, they tend to respond to urban stressors in comparable ways, and guild-based analyses are widely used to characterize how urbanization restructures avian communities [79]. For the present study, this grouping gives stable sample sizes per group even where citizen-science records are sparse for rare species, results that map directly onto habitat-scale management decisions rather than single species, and Zheng’s scheme has proved reliable for urban research in China.
The avian community in urban settings comprises several functional groups, including waterfowl such as the Mallard (Anas platyrhynchos), songbirds like the House Sparrow (Passer domesticus), and raptors such as the Peregrine Falcon (Falco peregrinus). Also common are wading birds such as the Great Egret (Ardea alba), climbing birds including the Great Spotted Woodpecker (Dendrocopos major), and terrestrial birds exemplified by the Rock Pigeon (Columba livia). These species represent key ecological guilds and demonstrate varied adaptations to urban environments.
(2) Environmental variables: The effectiveness of model fitting largely depends on the quality of the training datasets, as Chen’s study demonstrated [80]. Climate Data were sourced from the National Climatic Data Center and interpolated using Kriging in ArcGIS 10.8 (ESRI, Redlands, CA, USA) to achieve consistent spatial resolution. Digital elevation model (DEM) data with a resolution of 30 m, sourced from Geographic Spatial Data Cloud, to calculate slope and aspect [81]. Normalized Difference Vegetation Index (NDVI) data were sourced from the Chinese Academy of Sciences Resource and Environment Science Data Center. Population density data were obtained from the LandScan Global Population Database. Road data were sourced from historical records on the OpenStreetMap (OSM) website. Night light data were sourced from the EANTLI nighttime light dataset. All spatial environmental data were resampled to a 30 m × 30 m resolution, masked where necessary, and normalized using raster calculators.
According to the results of the literature review, this study selected four categories comprising 21 influencing variables, which were consistent with the time node of bird data (Table 1). (1) Climate factors include annual mean temperature, annual temperature range, and annual precipitation [41]. Data were sourced from the National Climatic Data Center and interpolated using Kriging to achieve consistent spatial resolution. (2)Topographic factors utilized digital elevation model (DEM) data with a resolution of 30 m, sourced from Geographic Spatial Data Cloud, to calculate slope and aspect [81]. (3) Habitat factors encompass NDVI [46], land use types [43], food availability [47], and distances to water bodies and coastlines. NDVI data were sourced from the Chinese Academy of Sciences Resource and Environment Science Data Center. Land types included nine categories: farmland, forest, shrubland, grassland, water body, ice/snow, bare land, impervious surface, and wetland [82]. Distances were computed as the Euclidean distance from each pixel to the nearest water body or coastline. (4) Anthropogenic factors comprised population density [50], distance to roads [50], distance to urban areas, and nighttime light index [83]. Population density data were obtained from the LandScan Global Population Database. Road data were sourced from historical records on the OpenStreetMap (OSM) website. Distances to urban areas were calculated as the Euclidean distance from each pixel to the nearest urban center, where an urban center refers to the built-up (urban) land-cover class in the land-cover classification of the corresponding year; that is, UD is the Euclidean distance from each pixel to the nearest urban land-cover patch. Night light data were sourced from the EANTLI nighttime light dataset. All spatial environmental data were resampled to a 30 m × 30 m resolution, masked where necessary, and normalized using raster calculators.

2.2. Method

A 30 m grid resolution was selected to balance ecological interpretability with computational feasibility in a highly fragmented urban landscape. The selection of this resolution is strategically designed to capture the high degree of landscape fragmentation characteristic of Shenzhen’s coastal urban fabric, particularly as critical habitat elements including pocket parks, riparian corridors, and isolated tree clusters operate at fine spatial scales that are frequently obscured by coarser resolutions. Importantly, we do not interpret the 30 m grid as the exact location of bird occurrence, but rather as a spatially explicit inference unit for habitat suitability. By integrating these units with high-resolution environmental covariates, the Random Forest model effectively captures the statistical associations between micro-landscape features and avian occupancy. The continuous suitability surfaces generated, when analyzed through Sen-MK trend analysis and SHAP interpretation, provide a robust basis for detecting relative spatiotemporal changes in bird habitat quality. This approach prioritizes the detection of consistent spatial patterns and long-term temporal trends over exact positional accuracy, an orientation that is both mathematically sound and appropriate for regional-scale urban planning applications.
All model training and data processing were performed on an ASUS TUF Gaming A5 laptop (ASUSTeK Computer Inc., Taipei, Taiwan, China) equipped with an NVIDIA GeForce RTX 4060 Laptop GPU (8 GB GDDR6), an AMD Ryzen 7 7735HS processor, and 16 GB RAM.

2.2.1. Random Forest Model

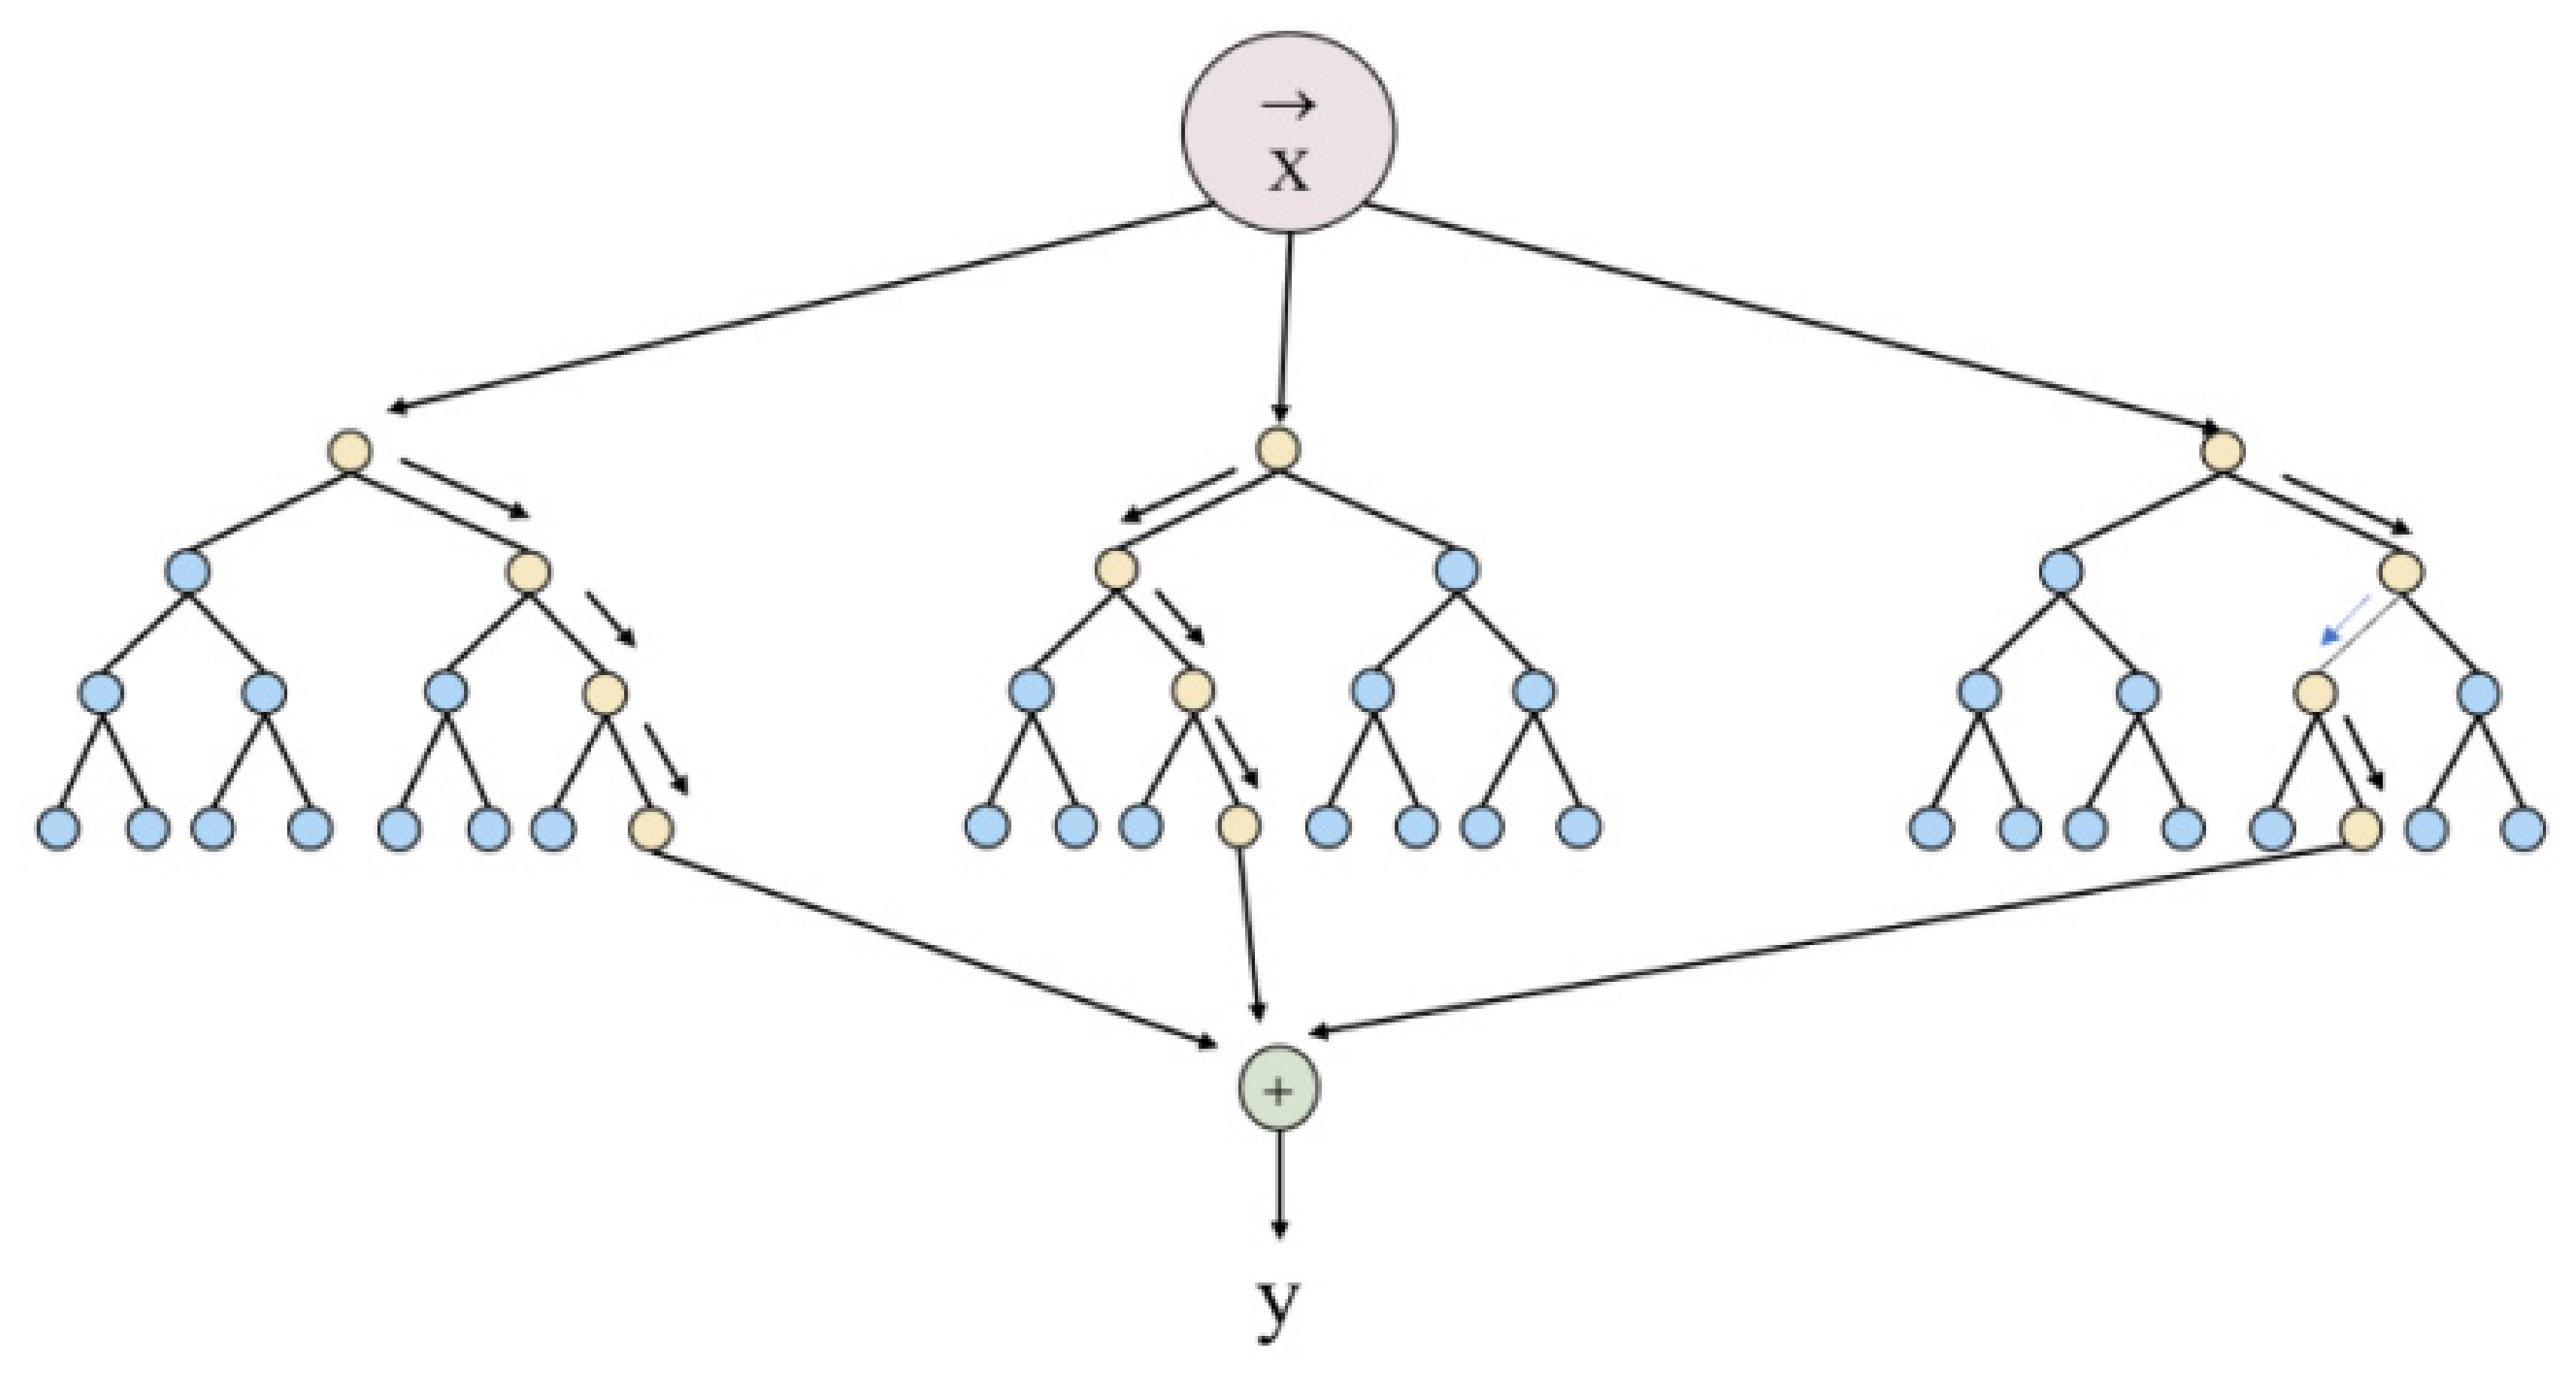
This study uses the Python 3.11 environment with the scikit-learn library (version 1.2.2) and pandas (version 1.5.3), numpy (version 1.24.1) to build a Random Forest model for regression, simulating the potential distribution of birds. This algorithm integrates multiple decision trees to form a ‘forest’, each tree classifies the samples by voting or outputting a predicted value (Figure 3). The Random Forest used in this study ultimately outputs the average of all decision tree predictions to represent the probability of bird occurrence.
RF requires both presence and absence data as input, but reliable true absence data were unavailable in this study [84] Many studies address this by randomly generating pseudo-absence points [85]. However, environmental covariates are distributed unevenly across geographic space [86], and purely random sampling may place pseudo-absences in ecologically suitable habitats, thereby introducing model bias [87]. To reduce this risk, we combined data-driven identification with ecological screening and expert consultation.
Candidate pseudo-absence sites were drawn from eBird and China Bird Report Center records, selecting locations where other species were recorded but the target guild never appeared throughout the study period, following the target-group approach [87]. These candidates were then screened using qualitative habitat-preference descriptions published in the regional checklists of the Shenzhen Bird Watching Association (SZBird; http://www.szbird.org.cn/). These descriptions are not quantitative predictors; they served only to judge whether a recorded absence was ecologically plausible. Candidates matching known habitat requirements of the target guild were removed, as their absence likely reflected incomplete sampling rather than true unsuitability. The remaining candidates were then reviewed by experienced SZBird members, who not only excluded any site they considered potentially suitable based on local field knowledge, but also added supplementary pseudo-absence sites that were not in the initial candidate pool. These additions were made based on the members’ long-term, first-hand observations of local habitat use, ensuring that the final set included ecologically robust absences beyond those derived from the initial records.
This procedure follows established guidance for reducing bias in pseudo-absence selection [88,89] and adds local ecological knowledge as an extra quality filter. Detected species were coded as 1, retained pseudo-absences as 0.
During the model training phase, environmental factors serve as input variables, while the presence or absence of birds is designated as the output. 70% of the data is used as the training set, 30% as the test set, and the parameters are adjusted according to the ROC curve to achieve optimal results. When conducting model simulations, the parameters were kept constant, and a regression-based Random Forest was employed to ensure that the output values ranged between 0 and 1. These output values represent the probability of bird occurrence. The proportion of votes of 1 in the decision tree represents the probability of the appearance of this bird species.
After the model training was completed and parameter optimization was performed via the ROC curve, the study input the environmental variables corresponding to the three target time nodes (2010, 2015, and 2020) into the trained regression-based Random Forest model, respectively. Through model computation, the occurrence probability of different bird species within each 30 m × 30 m grid unit across various years was outputted. This probability value could directly characterize the avian habitat suitability of the corresponding grid unit. Based on this, the spatiotemporal distribution maps of habitats for the six bird groups during the 2010–2020 period were generated, thereby realizing the quantitative characterization of the spatial pattern of bird habitat suitability in different years. The years 2010, 2015, and 2020 were selected as equally spaced five-year nodes to match the temporal availability of the multi-source covariates, most critically the 30 m annual land-cover dataset [82], aligning with the municipal planning cycles that span Shenzhen’s intensive coastal reclamation and subsequent ecological-restoration period. The analysis was not extended to 2025 because consistent versions of all environmental covariates (e.g., the land-cover dataset ends in 2021) were not yet available at the time of this study; this does not undermine our ability to characterize bird diversity trends. A five-year interval is both ecologically meaningful and methodologically sound, as bird communities in urban areas tend to exhibit high temporal similarity, with limited interannual change. This pattern is associated with the colonization and subsequent dominance of widespread generalist species in urban landscapes [90].

2.2.2. SHAP Model

SHAP helps address the “black box” nature of machine learning models. In this study, the SHAP model was employed to enhance the interpretability of the machine learning model. We used the SHAP model for global interpretation of factors, visualized the SHAP values of important factors, and conducted threshold analysis. Equations (1) and (2) show how SHAP values for features are calculated.
f x g z = φ 0 + i = 1 N φ i z i
φ i = S x 1 , . , x p / x i S ! p S 1 ! p ! ( f x S x i f x ( S ) )
where f x represents the model’s output. g z is the explanation function. z 0 , 1 N is a 0/1 vector in an N-dimensional space, indicating the subset of features present in the sample among N features. φ 0 is the average prediction across all samples. φ i denotes the SHAP value for feature. x 1 , . , x p represents the set of all input features. p denotes the number of input features; x 1 , . , x p / x i is the set of all input features excluding feature x i . f x ( S ) is the prediction value for all subsets S of features.
Existing studies typically categorize species distribution modeling into hotspots and coldspots for further ecological analysis. Geographical areas where both human-perceived and physically measured ecological values overlap are referred to as social–ecological “hotspots”, and the opposite are coldspots [91,92,93].

2.2.3. Theil-Sen Median

To spatially delineate ecological zones within the study area, this study applied the Sen-MK trend analysis, which integrates the Theil–Sen Median estimator for quantifying temporal trends with the Mann–Kendall nonparametric test for evaluating statistical significance. The temporal change rates of avian distributions were quantified using the Theil-Sen Median estimator, a robust non-parametric method for trend magnitude analysis. The calculation formula is as follows:
β = M e d i a n ( x i x j i j ) , j > i
where β represents the rate of change; x i and x j denote the data values in year i and year j of the time series, respectively. A β value greater than zero indicates an increasing trend, while a value less than zero indicates a decreasing trend. The greater the absolute value of β , the faster the rate of change.
The statistical significance of Theil-Sen Median trend-derived change rates in avian distributions was assessed using the Mann–Kendall non-parametric test, a robust outlier-resistant method for trend detection in time series data [94,95,96].

3. Results

3.1. Model Performance

In this study, the performance of the Random Forest model was rigorously assessed using the Area Under the Curve (AUC) metric, a widely recognized measure of model accuracy in classification tasks (Table 2). The AUC values obtained for each of the six bird groups demonstrated the model’s robust predictive capabilities. Specifically, terrestrial birds achieved an AUC of 0.90, raptors reached 0.96, songbirds attained 0.97, climbing birds scored 0.98, wading birds also achieved 0.98, and waterfowl obtained an AUC of 0.93. These results collectively indicate that all six bird groups achieved AUC values above 0.9 [93], thereby confirming the high predictive accuracy of the model and its effectiveness in estimating bird occurrences within the study area.

3.2. Bird Distribution and Distribution Changes

3.2.1. Spatial Distribution of Avian Habitat Hotspots and Coldspots

The habitat suitability values predicted by the Random Forest model for each 30 m × 30 m grid cell were classified into five grades using the natural breaks method. Grid cells assigned to the highest suitability grades, indicating significantly higher bird occurrence probability than surrounding areas and favorable ecological conditions, were defined as hotspots. Conversely, grid cells with the lowest suitability grades were designated as coldspots.
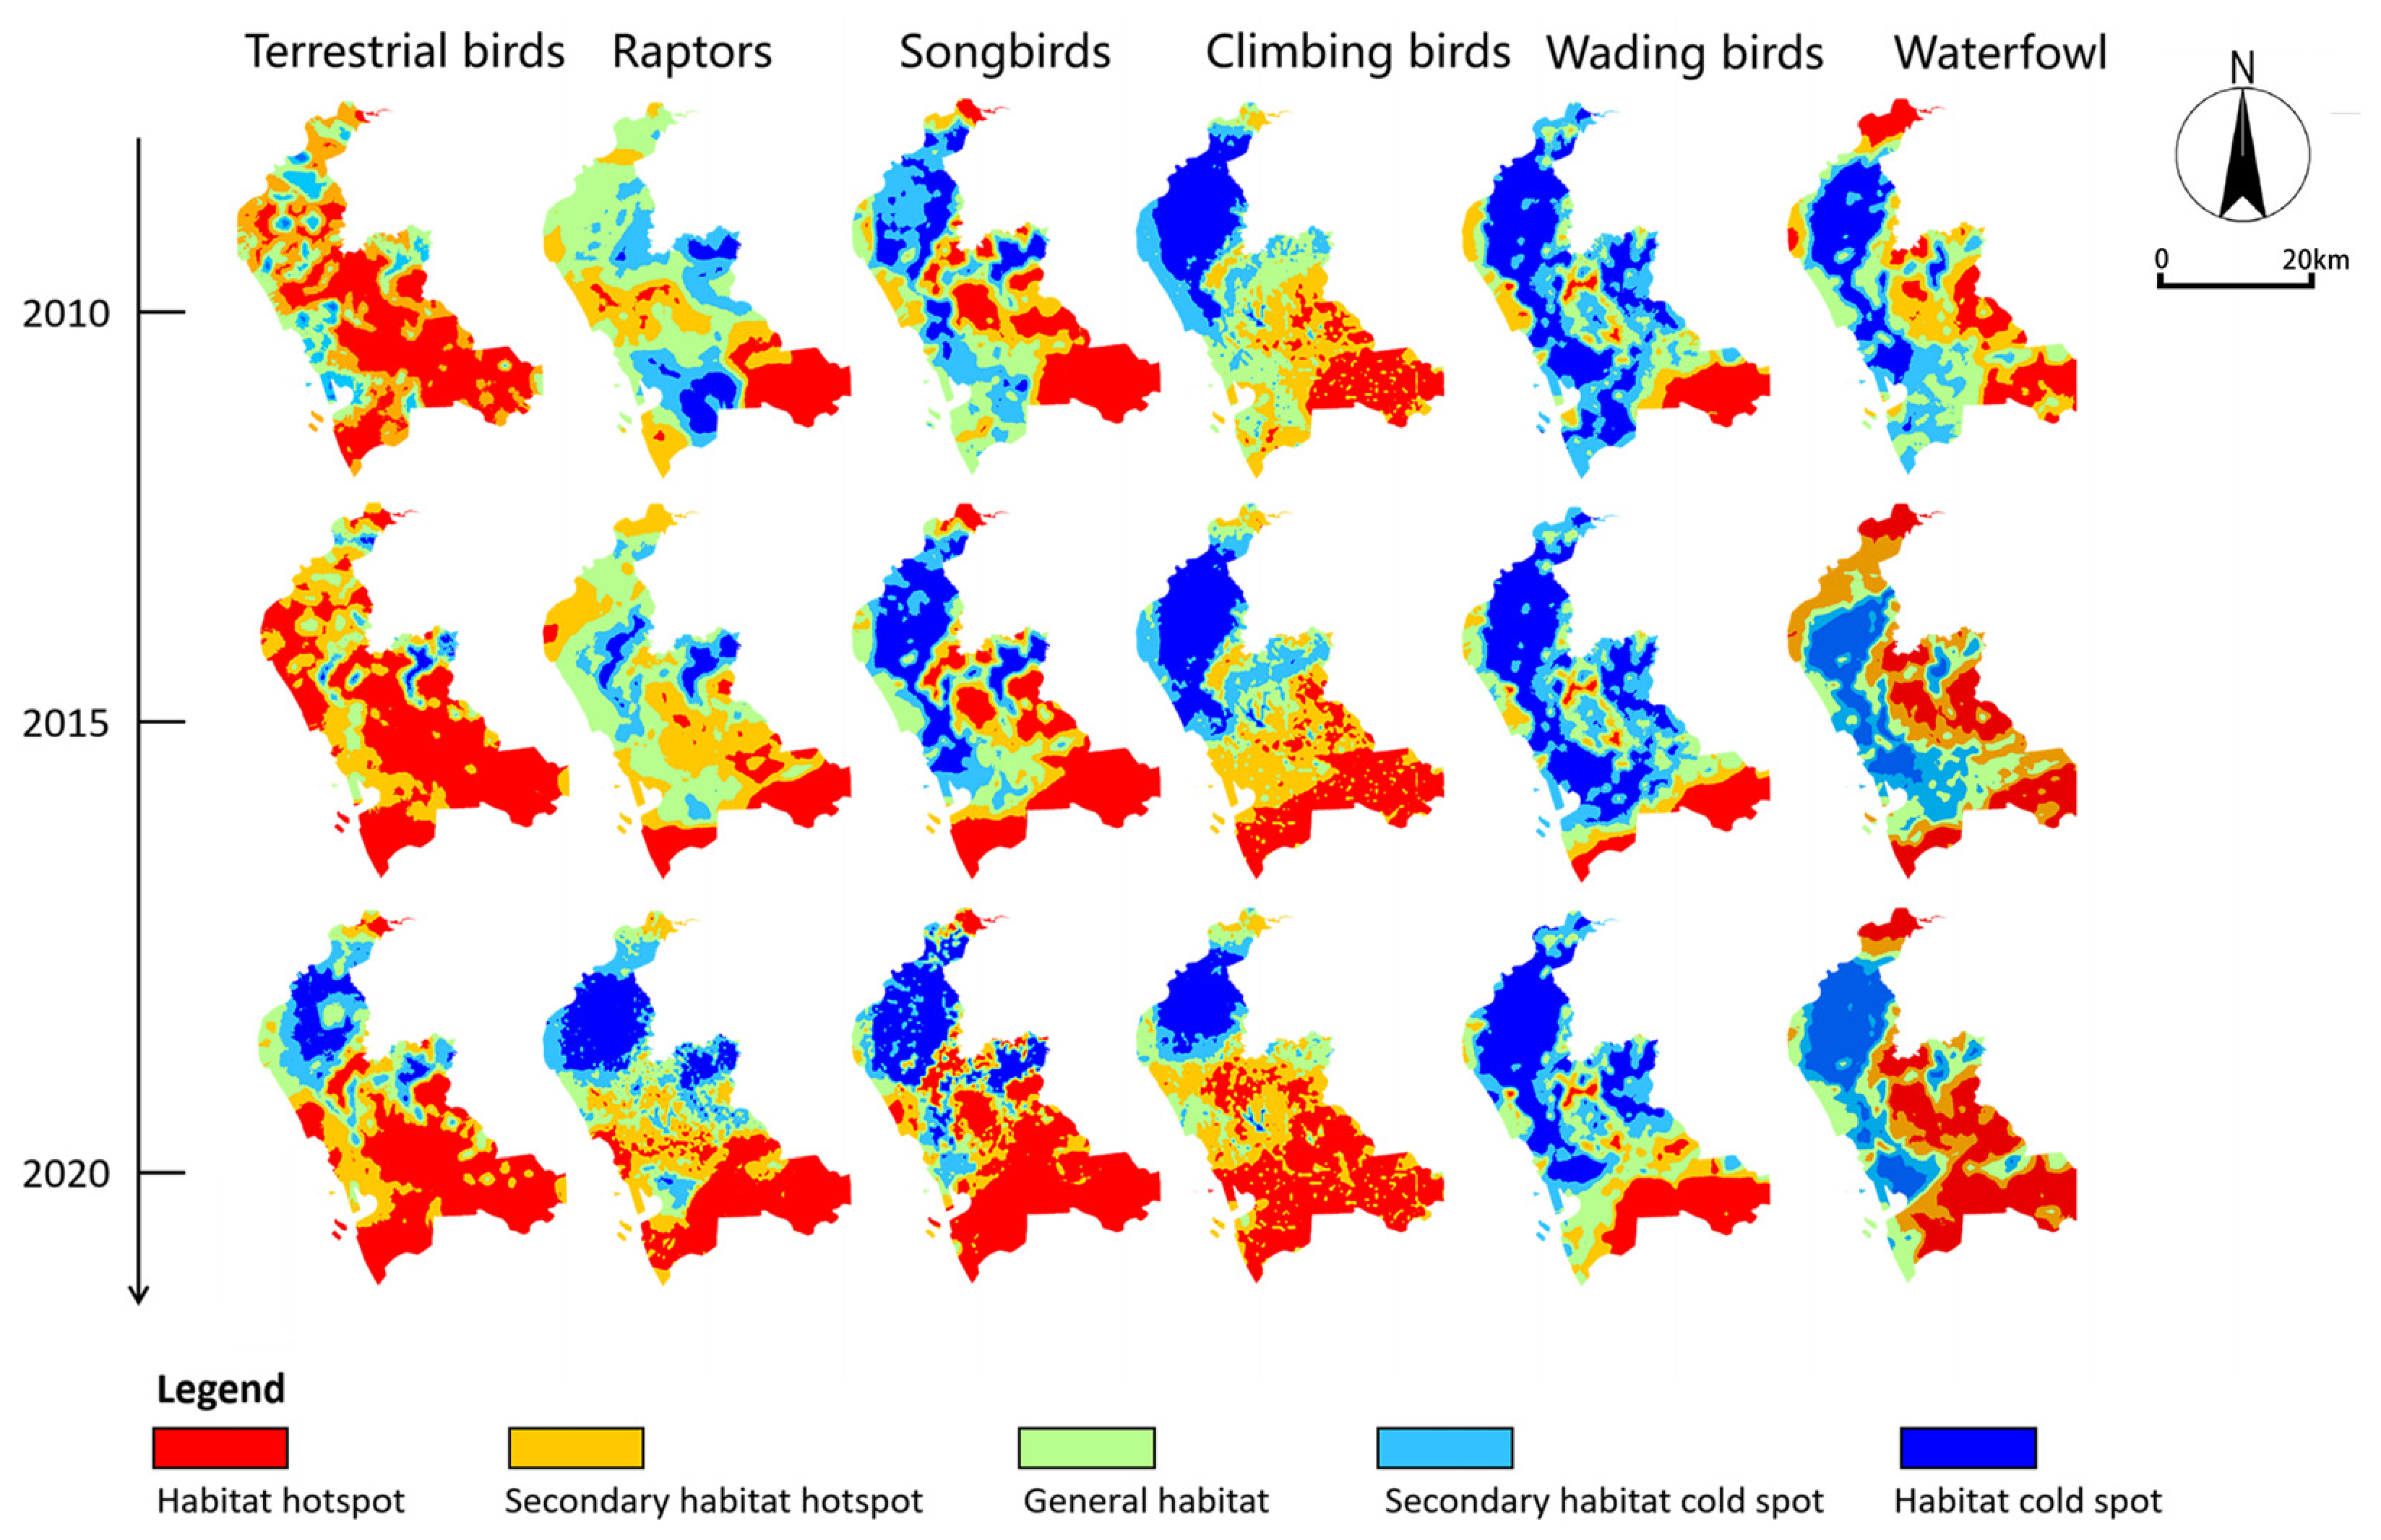
Habitat suitability for six bird groups from 2010 to 2020 was simulated using the Random Forest model. The study area was classified into five habitat categories using the natural breaks method. To illustrate temporal changes, 2010, 2015, and 2020 were selected for visualizing and analyzing hotspot and coldspot distributions (Figure 4).
Terrestrial birds: In 2010, hotspots were in Nanshan Park, Shenzhen Bay, Tiegang Reservoir, and Yangtai Mountain, with scattered hotspots and coldspots in the north. By 2015, southern hotspots were stable, and northern hotspots shifted toward coastal areas. By 2020, southern and central-western hotspots connected, and extensive coldspots appeared in the north, except for a small hotspot near the Maozhou River. For raptors, hotspots in 2010 were in Futian Mangrove, Nanshan Park, and Phoenix Mountain, with coldspots clustered in central Nanshan and northern Yangtai Mountain built-up zones. By 2015, hotspots expanded in Nanshan and emerged near Sea Pastoral Garden. By 2020, southern hotspots became continuous, central hotspots appeared, and large coldspots formed in central Bao’an.
Songbirds showed a different spatial pattern in habitat suitability over the decade. In 2010, their suitable habitats spanned Futian, central Bao’an, and parts of the Maozhou River, contrasted by coldspots in northern Bao’an built-up areas. In 2015, new hotspots emerged in Nanshan Park while suitability declined in Bao’an. By 2020, hotspots covered Nanshan, Futian, and central mountains, with coldspots concentrated near Tiegang Reservoir and eastern industrial parks. Climbing birds showed a clear trend of hotspot expansion over the study period: In 2010, hotspots were mainly in northern Nanshan and parts of Futian, and Bao’an remained largely cold. In 2015, hotspots in Nanshan expanded and connected with Futian. By 2020, these hotspots extended southward to Tiegang Reservoir and Phoenix Mountain, while coldspots in Bao’an decreased.
Wading birds, whose habitat selection is closely linked to aquatic environments, displayed coastline-dependent hotspot distributions. In 2010, hotspots occurred along the northwest coast, southwestern Futian, and green areas near Tiegang Reservoir, with coldspots in areas distant from major water bodies. In 2015, new hotspots emerged along Nanshan’s southern coast, while some previous hotspots weakened. By 2020, hotspots shifted to Shenzhen Bay and linked with Futian, while coldspots expanded in some wetland zones. Waterfowl, another group closely associated with water bodies, focused their hotspots on coastal areas and regions surrounding reservoirs: In 2010, hotspots were found along the southeastern coast and around reservoirs, counterbalanced by coldspots in northern/central coastal Bao’an and Nanshan. In 2015, hotspots expanded around reservoirs and southern ports. By 2020, these hotspots increased and connected across Nanshan and Futian, while northern coastal coldspots became more prominent.

3.2.2. Analysis of Bird Habitat Changes

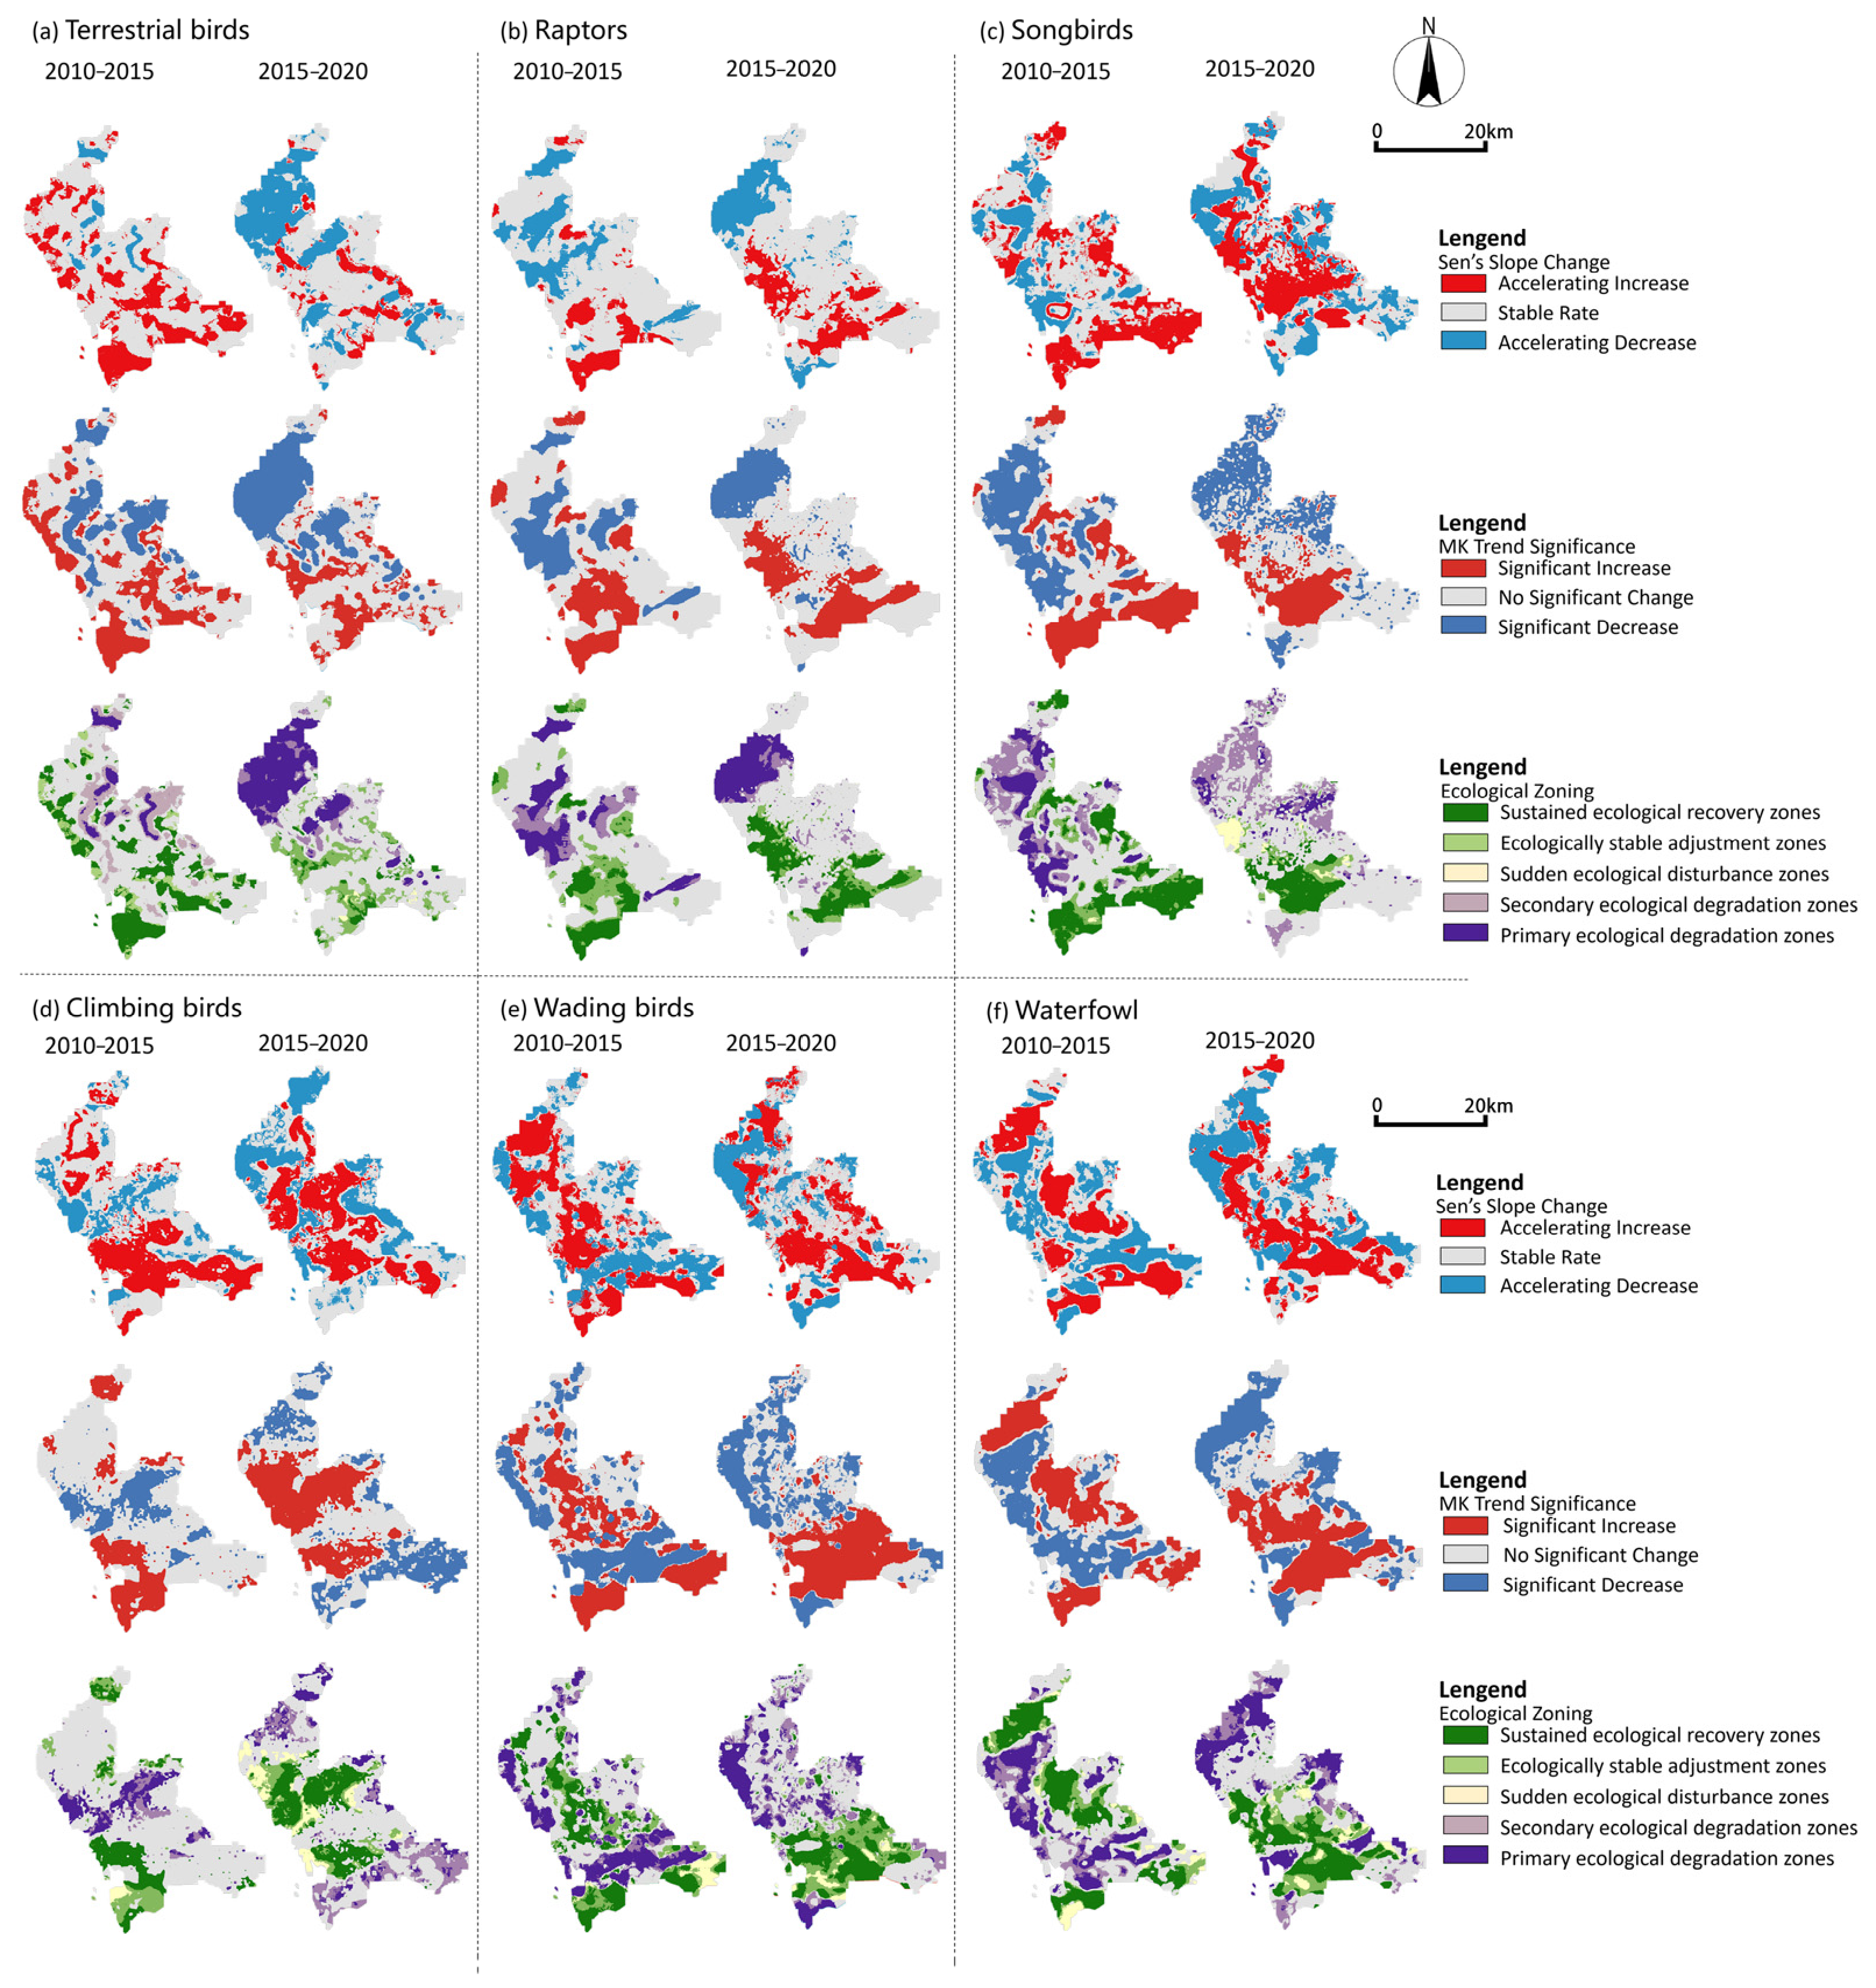
By overlaying Sen’s slope and the Mann–Kendall method, in order to explore the changes more clearly, we divided the time series into two groups: 10–15 and 15–20, and calculated the relevant values for each group on a yearly basis, resulting in five types of regions (Table 3 and Figure 5).
To thoroughly investigate the changes in habitat suitability for six bird groups from 2010 to 2020, the ten-year period was divided into two sub-periods. Sen’s slope estimator was applied to calculate the annual rate of change in habitat suitability for each group during 2010–2015 and 2015–2020, quantifying the temporal dynamics. The Mann–Kendall trend test (α = 0.05) was then used to assess the statistical significance of these changes, categorizing the study area into zones of significant increase, significant decrease, and no significant change. Based on the combined analysis of trend direction and change rate, the region was further classified into five ecological types: sustained ecological recovery zones, ecologically stable adjustment zones, sudden ecological disturbance zones, secondary ecological degradation zones, and primary ecological degradation zones (Table 3 and Figure 5).
From 2010 to 2015, habitat suitability for terrestrial birds improved in the western coastal area, southern Nanshan District, and western Futian District, while it deteriorated in northern Bao’an District. From 2015 to 2020, ecological improvement areas decreased, with severe degradation emerging in northern Bao’an (Figure 5a). For raptors, habitat suitability showed contrasting trends between the two periods: from 2010 to 2015, habitats deteriorated in northern and central Bao’an District but improved steadily in Nanshan District. From 2015 to 2020, habitat restoration occurred in central Bao’an, while northern Bao’an became a degradation hotspot (Figure 5b).
Passerines also exhibited spatial heterogeneity in habitat changes over the decade: during 2010–2015, their habitats declined in northern and western Bao’an, whereas areas near the Maozhou River showed stable improvement. From 2015 to 2020, degradation in the north slowed, but ecological disturbance zones emerged near the airport (Figure 5c). Climbing birds showed a different pattern of habitat change: 2010–2015 saw their habitats recover in the southwestern region and northern Bao’an, while central areas deteriorated. In 2015–2020, edge fluctuations occurred, with scattered degradation hotspots in the south (Figure 5d).
Wading birds, which are highly dependent on aquatic and coastal ecosystems, showed region-specific shifts in habitat suitability. From 2010 to 2015, conditions improved in central and southwestern areas but worsened along the western coast and in central Futian District. By 2015–2020, restoration zones in the central region disappeared, while rapid improvement occurred in Futian and central Nanshan Districts (Figure 5e). Waterfowl, another guild associated with aquatic habitats, showed both local degradation and regional improvement. During 2010–2015, their habitats improved in northern and southern Bao’an but degraded in central and western areas. From 2015 to 2020, habitat degradation was explicitly detected in port-adjacent regions and northern Bao’an District, while a continuous ecological improvement belt was formed, spanning from Tiegang Reservoir to Shenzhen Bay (Figure 5f).

3.3. The Impact of Environmental Variables on Bird Distribution

3.3.1. Analysis of Changes in Global Contribution Proportions of Factors

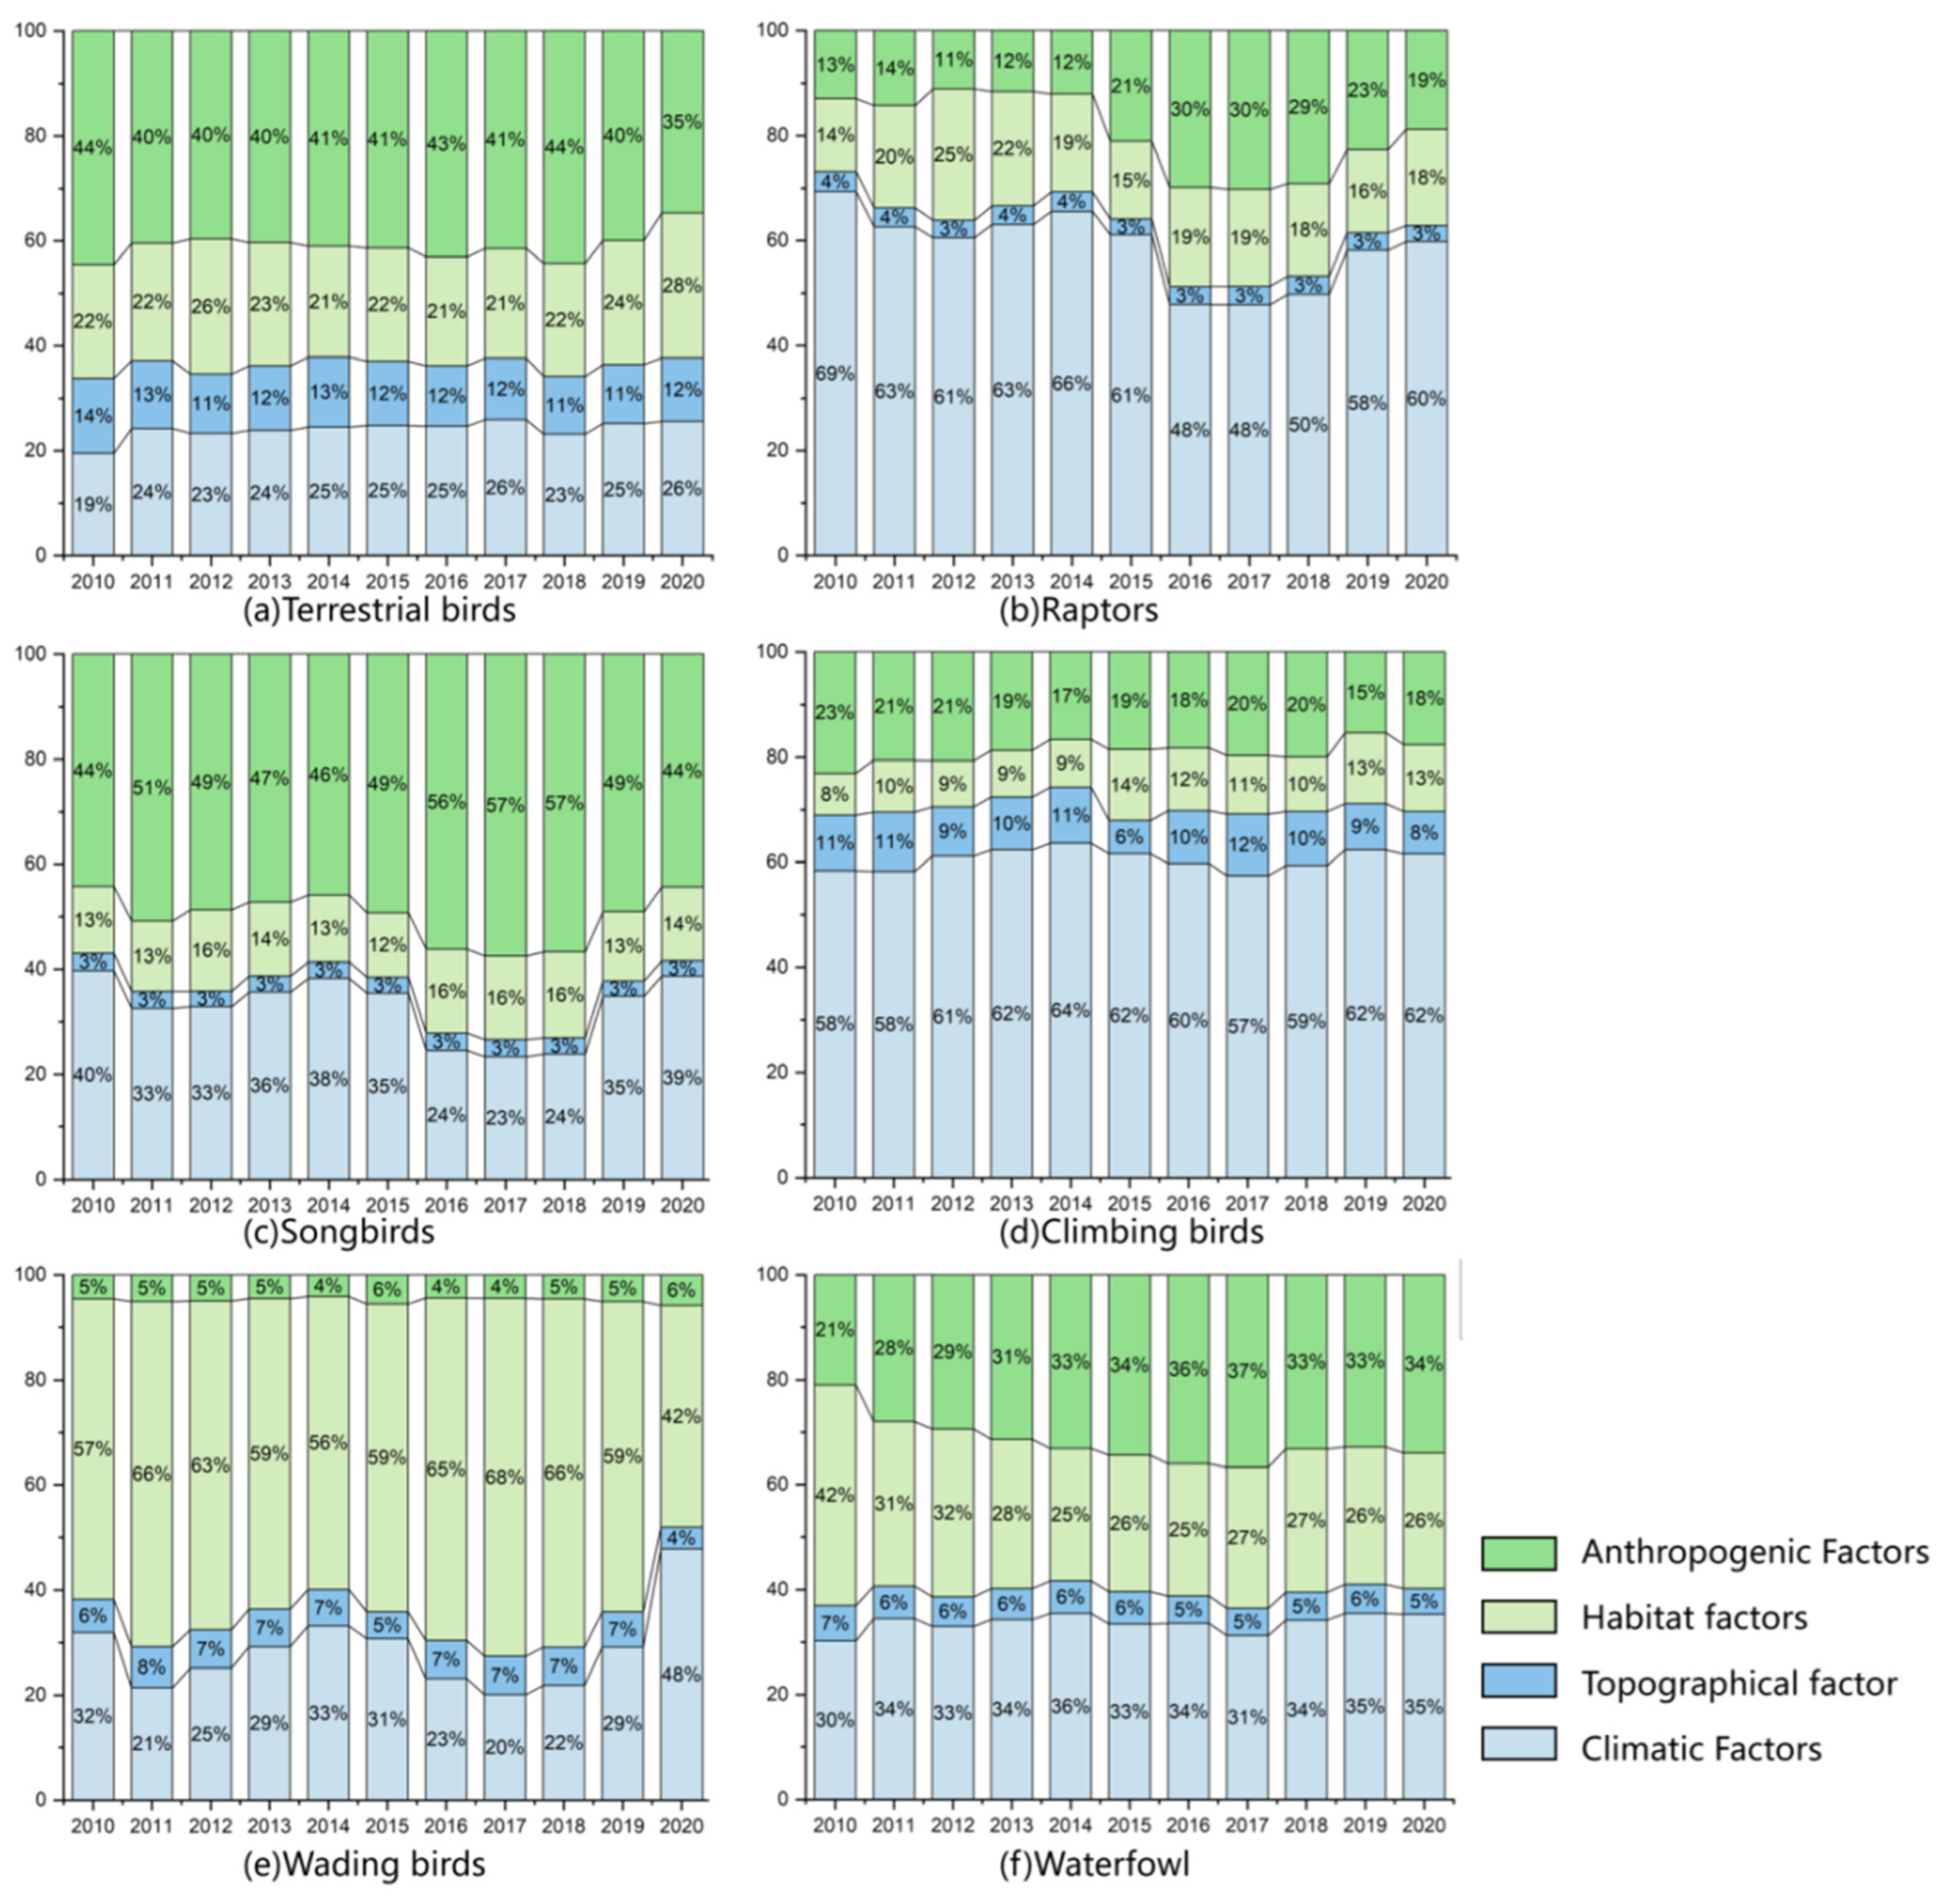
Using the SHAP model, we interpreted the effects of environmental variables by calculating SHAP values for each factor. We further computed the mean absolute SHAP values for four categories to analyze their relative contributions to the survival of different bird guilds over time (Figure 6).
The analysis revealed distinct patterns in the ecological drivers affecting different bird guilds. Terrestrial birds were most strongly influenced by anthropogenic factors, accounting for approximately 40% of the total impact across most years; notably, this contribution peaked at 44% in 2010 and 2018 but declined to 35% by 2020. In contrast, the influence of habitat factors, though fluctuating, exhibited an overall increasing trend from 2015 to 2020. Raptors demonstrated high sensitivity to climatic factors, and the relative roles of habitat and anthropogenic factors shifted over time: habitat factors exerted greater influence than anthropogenic ones from 2010 to 2014, but after 2015, anthropogenic factors increased significantly and surpassed habitat variables in importance. Songbirds, the most species-rich and abundant group in the study area, showed widespread distribution and stable community structure, making them particularly susceptible to anthropogenic disturbances. Anthropogenic impacts on this group peaked between 2016 and 2018, then gradually declined.
Among all guilds, climbing birds were most strongly affected by climatic variables, which had the highest relative contribution. Habitat factors had consistently low and stable effects on this guild, suggesting that the internal environment of climbing bird habitats remained relatively stable. The influence of anthropogenic factors on climbing birds declined initially and then stabilized during the study period. Wading birds were significantly influenced by both habitat and climatic factors. From 2010 to 2020, the impact of habitat factors followed a complex pattern, first decreasing, then increasing, and declining again in later years. As for waterfowl, the contribution of habitat factors declined from 2010 to 2015, while anthropogenic influence increased. From 2015 to 2020, the effects of both factors stabilized, with relatively stable effects on survival, indicating reduced temporal variation in their ecological roles.

3.3.2. Environmental Factors Local Interpretation

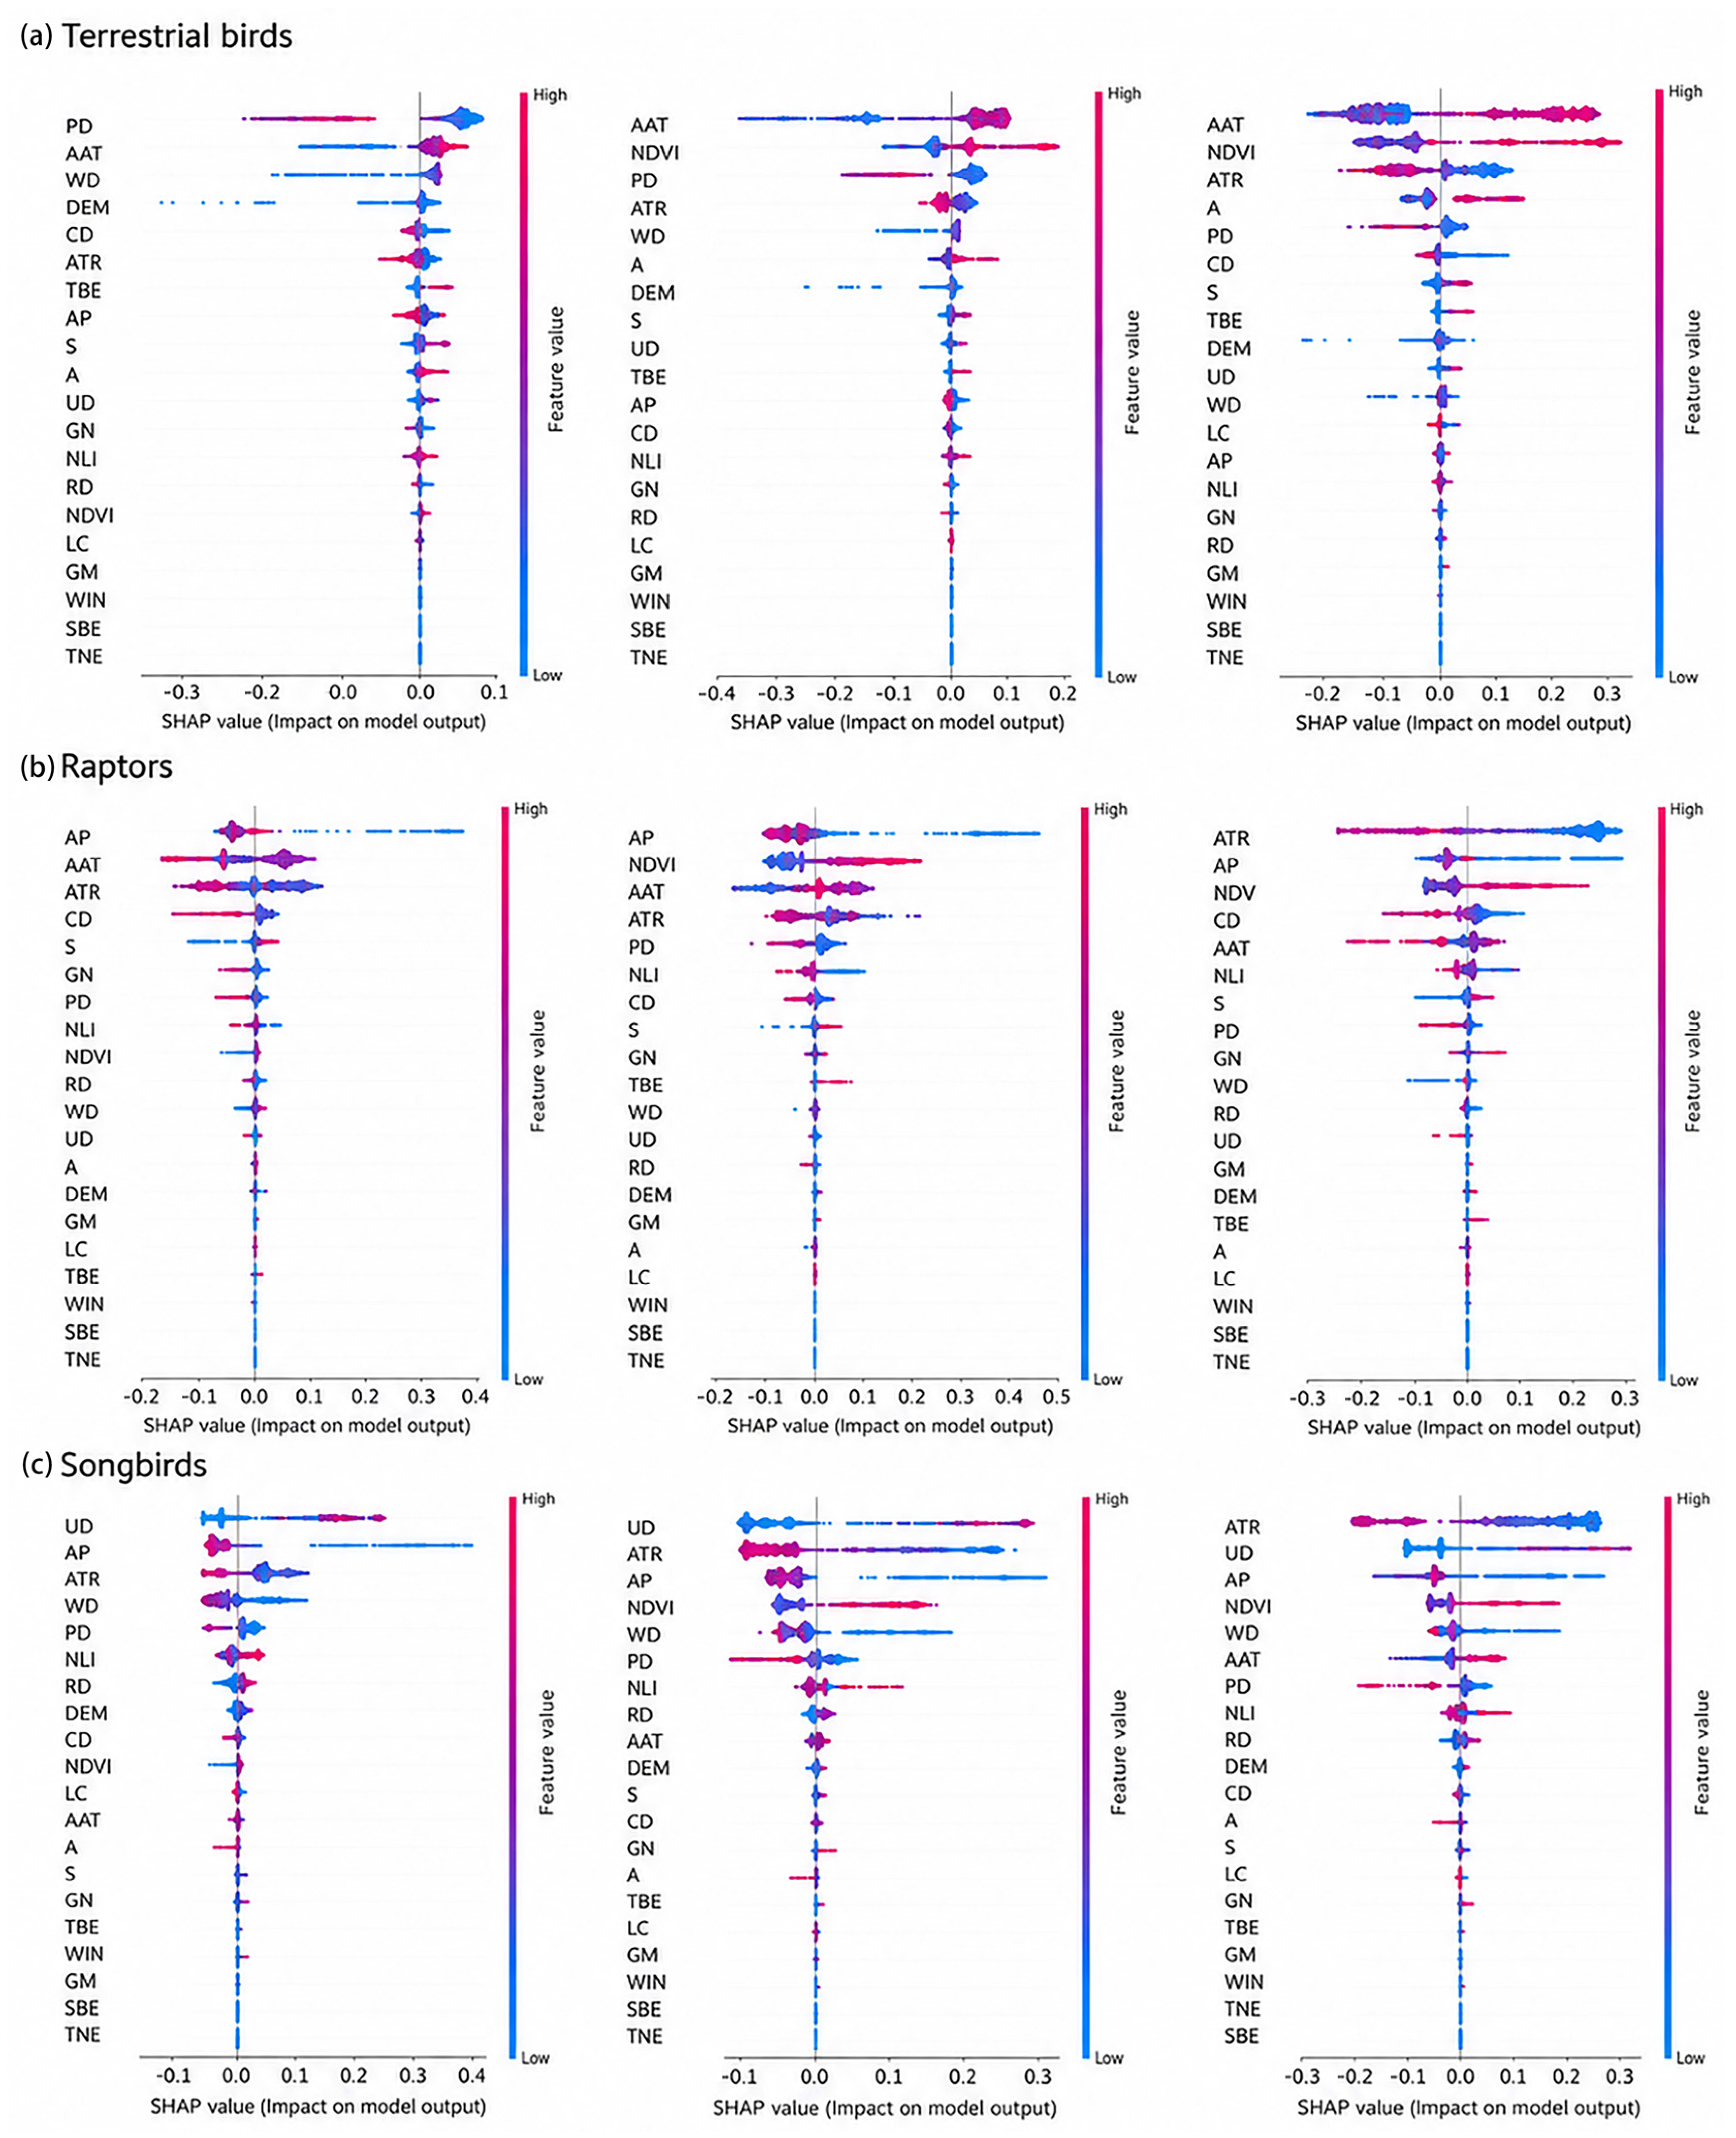
Terrestrial birds prefer land areas at a certain distance from water bodies, and temperature plays a crucial role in their survival. They favor warmer regions with lower temperature variability. The positive impact of NDVI increased over time, as higher vegetation density is associated with greater occurrence probabilities. Population density also significantly affects terrestrial bird survival, but its contribution has gradually declined (Figure 7a).
Raptors are more likely to occur in areas with low precipitation, moderate temperatures, and minimal temperature fluctuations. In both 2010 and 2020, raptors were more frequently distributed near coastal zones. Their survival is increasingly constrained by anthropogenic factors, particularly population density and nighttime light pollution (Figure 7b).
The spatial distribution of songbirds is strongly influenced by the distance to urban areas, with higher occurrence probabilities in more remote regions. However, this influence decreased in 2020 compared to earlier years. Since 2015, NDVI has had a significant positive effect on songbird presence (Figure 7c).
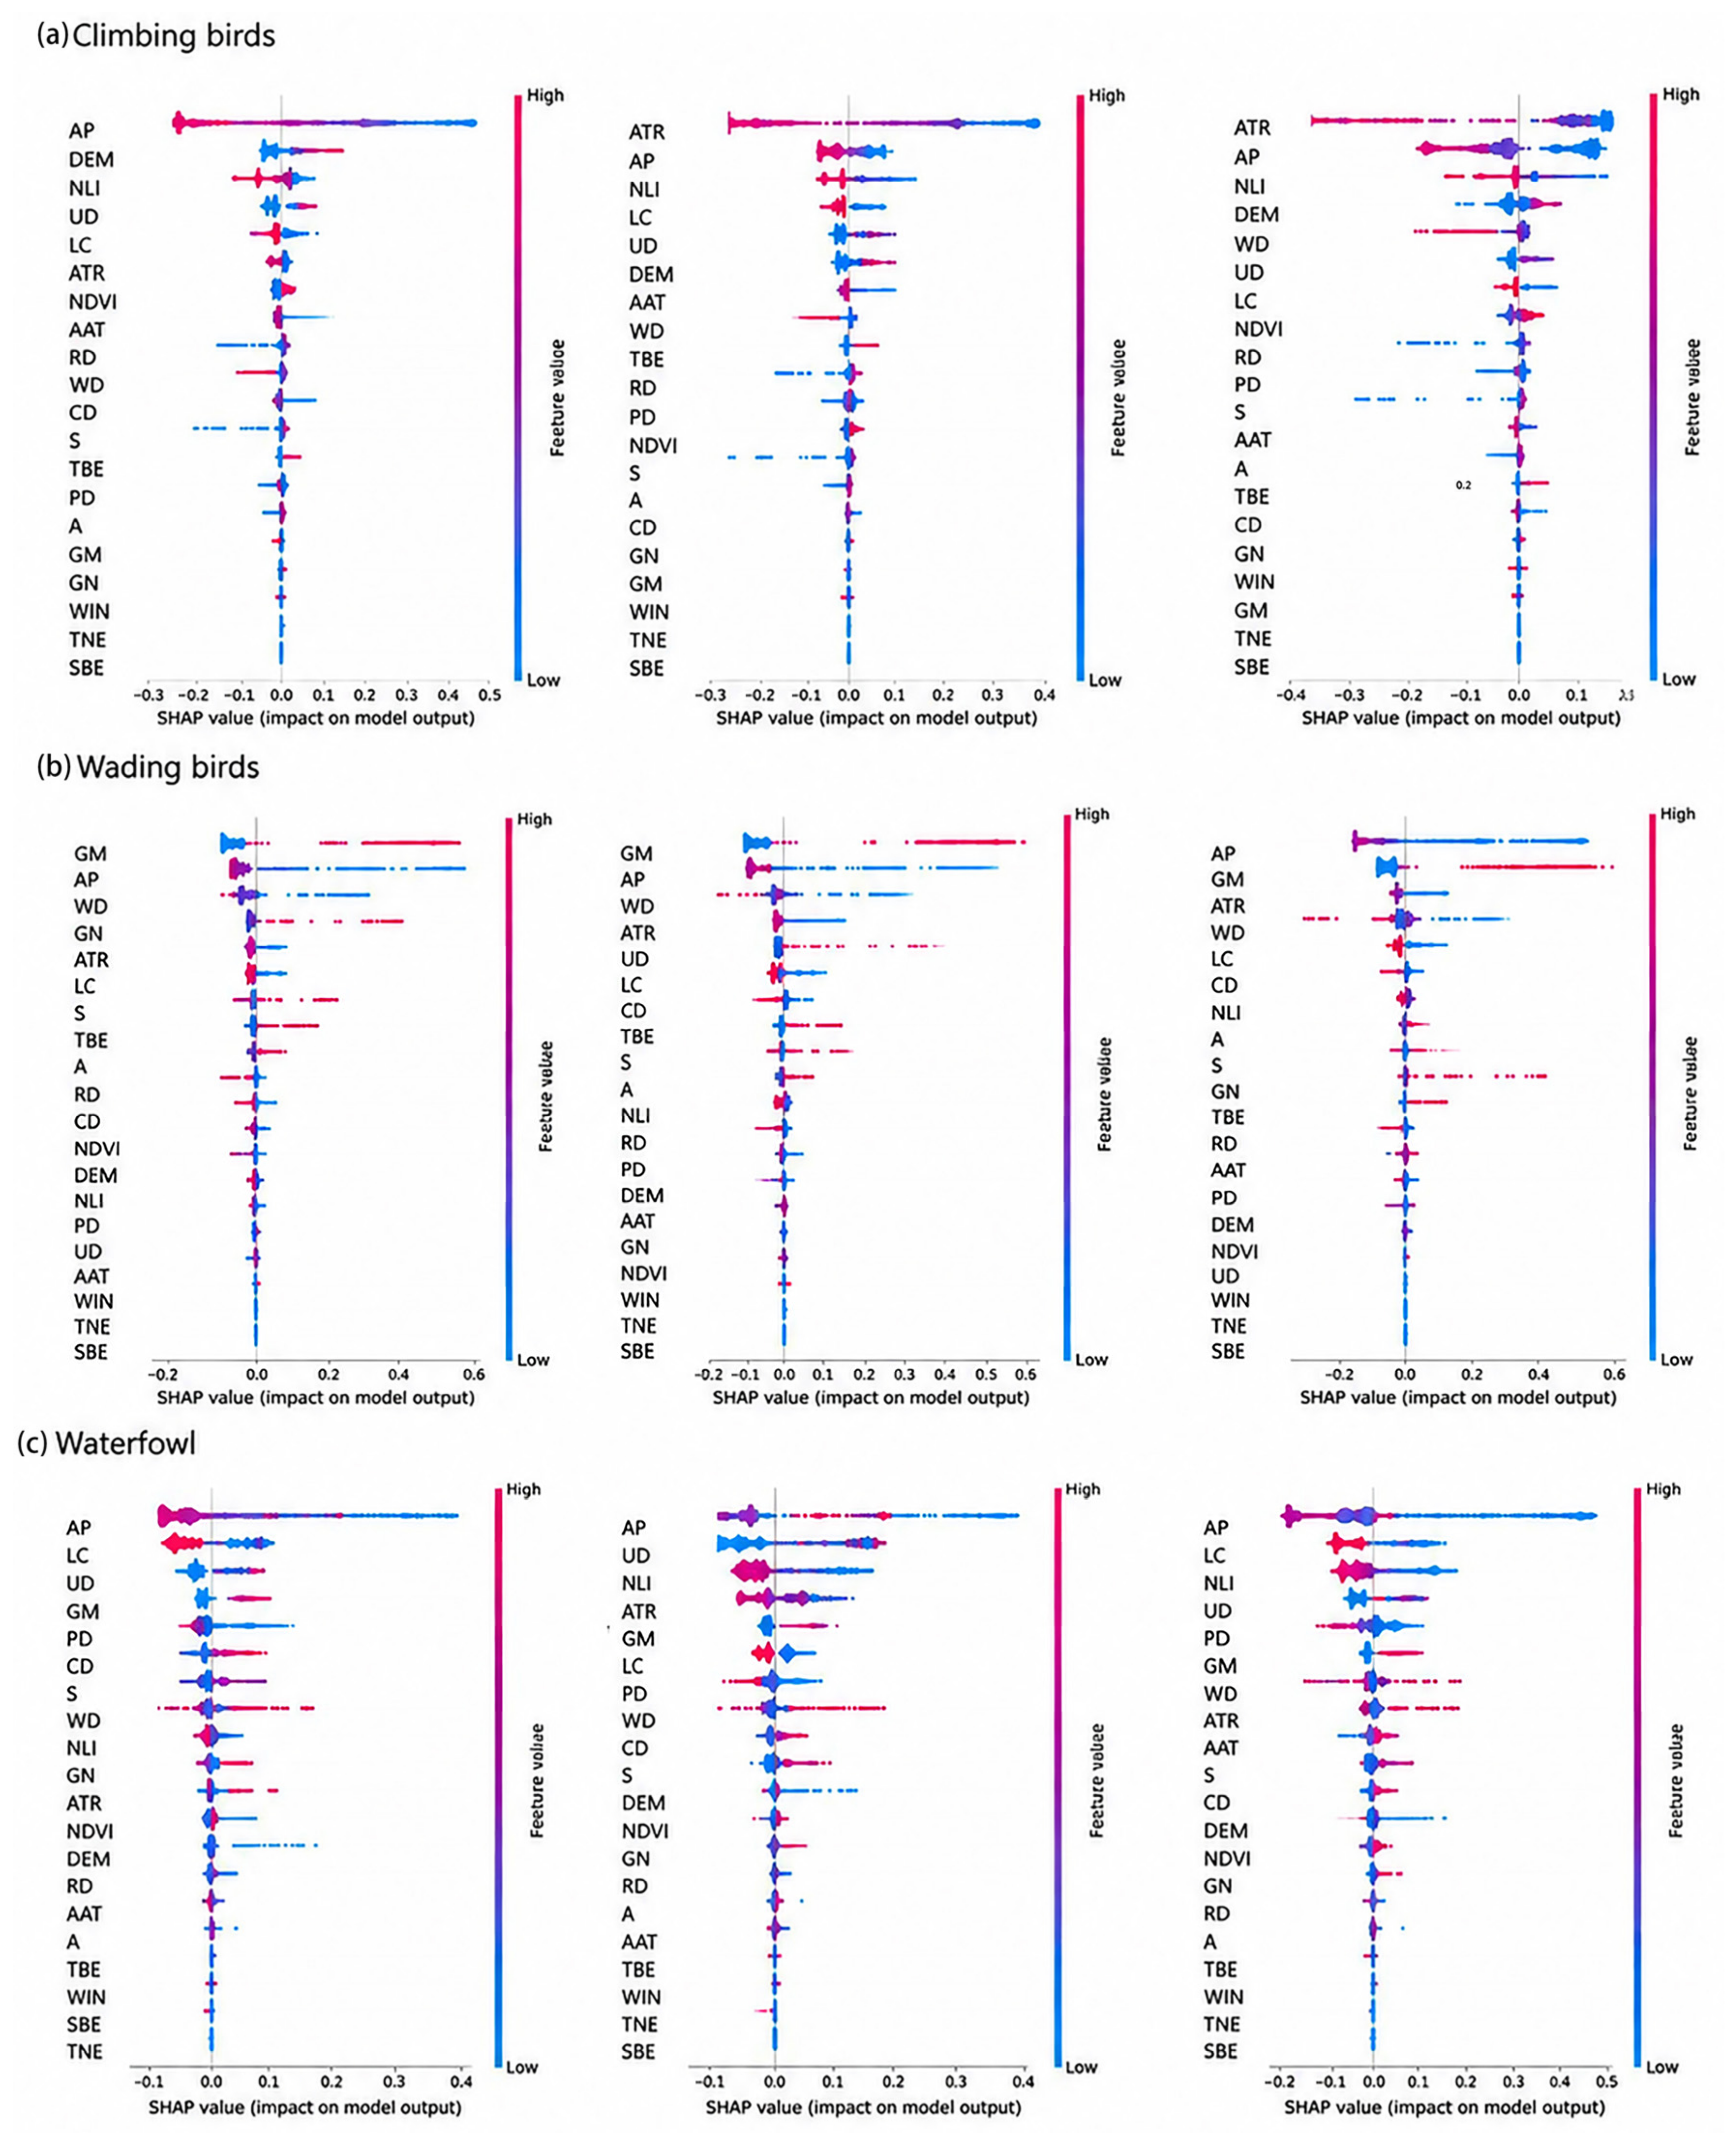
The impact of anthropogenic factors on climbing birds has steadily declined from 2010 to 2020, as reflected in the reduced negative influence of urban areas and nighttime light index (Figure 8a).
Habitat-related factors are particularly critical for wading birds, whose hotspots are typically located in areas with minimal human disturbance, underscoring their high ecological sensitivity and vulnerability to anthropogenic pressure. The proportion of artificial grasslands (GM) had a notable impact. Distance to water bodies remains a key determinant of wading bird distribution. The support provided by natural grasslands (GN) declined sharply in 2015 but later recovered (Figure 8b).
Precipitation significantly influences waterfowl habitat, and unlike other avian groups, some waterfowl species prefer regions with high rainfall, highlighting their unique ecological characteristics. Waterfowl also show a preference for artificial grasslands, though to a lesser extent than wading birds. Among anthropogenic factors, population density, distance to towns, and nighttime light index all have significant effects. Notably, distance to towns exhibits complex effects, with some peri-urban areas providing supportive conditions for waterfowl (Figure 8c).

3.3.3. Key Factor Threshold Analysis

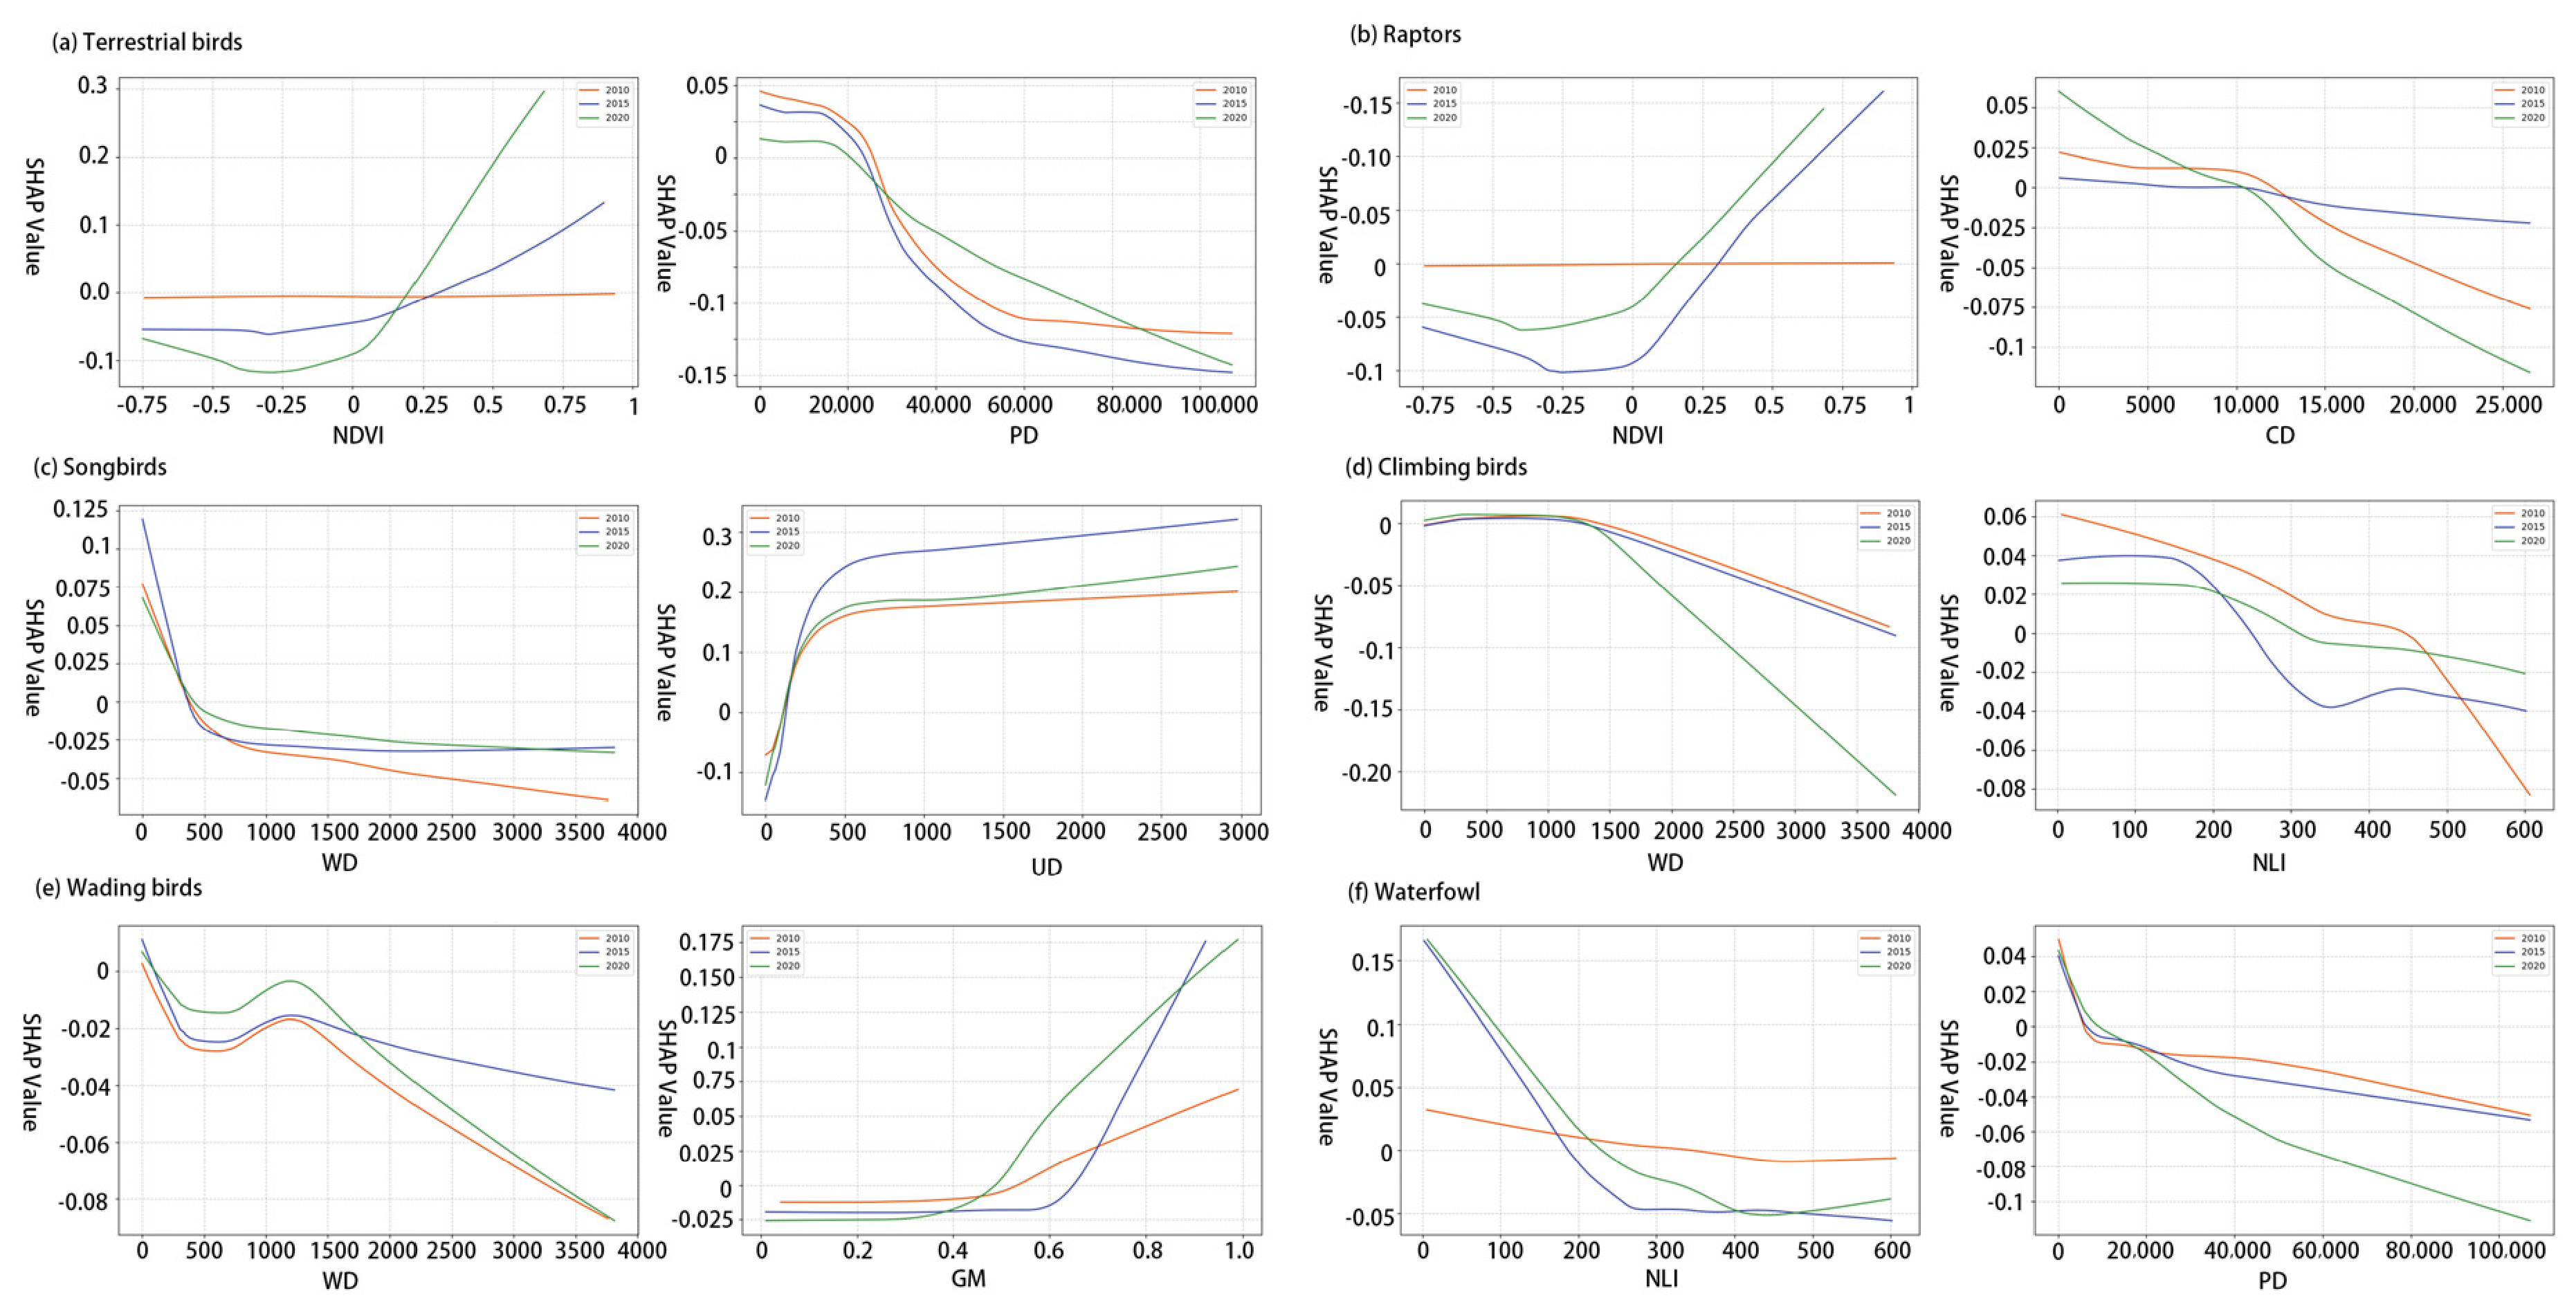
To further quantify the dynamic effects of environmental factors on bird distribution, this study conducted threshold analysis based on SHAP values, revealing the key turning points of different bird groups’ responses to environmental variables. In 2020, terrestrial birds showed greater sensitivity to NDVI. Under low vegetation cover, the negative effect in 2020 was stronger than in 2015, while under high vegetation cover, the positive effect was greater. When population density was below 3000, the positive impact was weakest in 2020 and strongest in 2010; above 3000, the negative effect peaked in 2015 and was weakest in 2020. When density exceeded 9000, the 2020 negative effect surpassed that of 2010 (Figure 9a).
Regarding raptors, the NDVI response curves displayed in 2020 and 2015 were similar, both showing maximum negative impacts between −0.25 and 0. The negative impact of low NDVI was weaker, and the positive impact of high NDVI was stronger in 2020 compared to 2015. Within 10,000 m of the coastline, raptor suitability was highest in 2020 and lowest in 2015; conversely, in inland areas, it was lowest in 2020 and least negative in 2015 (Figure 9b).
Songbirds exhibited distinct responses to water bodies, showing the strongest positive association in 2015 and the weakest in 2020 near water, while the most negative impact in distant areas occurred in 2010. In urban areas, negative effects peaked in 2015; by contrast, in remote areas, suitability was highest in 2015 and lowest in 2010 (Figure 9c).
For climbing birds, suitability near water remained stable across years, but declined sharply beyond 1500 m in 2020. The impact of nighttime light was complex: when below 200, suitability was highest in 2010 and lowest in 2020; between 200–500, it was lowest in 2015; above 500, 2010 showed the strongest negative effect, and 2020 the weakest (Figure 9d).
Wading bird suitability exhibited a distinct spatial gradient declined within 500 m of water, peaking at 500–1200 m (highest in 2020, lowest in 2010), and then declining sharply with distance. The slowest decline was observed in 2015, and the fastest in 2010. In 2020, when artificial grassland coverage exceeded 0.4, suitability increased. Thresholds occurred at ~0.5 in 2010 and 0.6 in 2015. Suitability was lowest in 2010 and higher in 2015 and 2020; at coverage >0.9, it was highest in 2015 (Figure 9e).
Finally, waterfowl were significantly influenced by anthropogenic factors. Nighttime light had a strong effect in 2015 and 2020. Suitability declined rapidly when light intensity was below 300, with little further change above that. Population density over 1500 triggered negative effects, which were strongest in 2020 and weakest in 2010 (Figure 9f).

4. Discussion

4.1. Research Contribution

Citizen-science datasets are increasingly recognized as valuable resources for biodiversity monitoring, yet their application is often constrained by uneven observer effort and spatial sampling bias [36]. Spatial thinning and stringent effort-based filtering can substantially improve the predictive performance of species distribution models, as demonstrated in prior studies [12,31]. At the same time, applying spatial clustering to observation data helps mitigate the biases introduced by clustered observation efforts [27]. The integration of these preprocessing methods systematically reduces the multiple sources of bias arising from observers’ subjective choices in citizen science bird data, thereby enabling more reliable distribution predictions. We rigorously preprocessed spontaneously collected observation data into reliable, high-resolution (30 m) spatial intelligence. This preprocessing strategy reduces several major sources of uncertainty associated with opportunistic observations, improves the ecological realism of training samples, and strengthens model robustness in highly urbanized landscapes. It also addresses the limitations of traditional field surveys in data volume and timeliness, offering a scalable method to capture fine-scale habitat heterogeneity in densely populated coastal cities.
Methodologically, the proposed Random Forest and Sen-MK integrated framework addresses a key gap in previous studies that largely overlooked dynamic ecological processes. Compared with single-period SDMs, the temporal dimension enables the identification not only of where species occur but also of whether habitat quality is improving or deteriorating over time. Indeed, previous comparative assessments have shown that Random Forest tends to predict more pronounced range changes than other SDM methods, making it well suited to detecting urbanisation-driven habitat dynamics [61,62]. Rather than relying on static distributions, the analysis quantifies decadal shifts from 2010 to 2020 in habitat suitability. This allows regions to be classified into five targeted categories, ranging from sustained ecological recovery to primary degradation. This temporal innovation provides a replicable scientific basis for spatial prioritisation in urban conservation planning.
Finally, the incorporation of the SHAP model goes beyond traditional black-box predictive modelling by significantly enhancing the interpretability of machine learning outputs. By revealing nonlinear relationships and quantifying dynamic thresholds for urban environmental factors affecting bird survival, this research bridges the gap between statistical correlation and mechanistic ecological insights. These interpretable outputs are particularly valuable for identifying overlooked habitats that are disproportionately affected by sampling bias. Small urban green spaces that serve as critical habitats for certain bird species are often undersampled or entirely absent from citizen-science records, but SHAP helps to infer their ecological significance from environmental determinants. Such quantifiable baselines contribute direct technical support for long-term environmental monitoring, allowing policymakers to implement precise, numerically driven ecological interventions rather than generalised greening strategies.

4.2. Analysis of Spatio-Temporal Variations in Bird Distribution

The spatial distribution of avian habitat patterns can be employed to assess the ecological quality of various regions, aiding in the identification of critical habitats and areas of ecological deficiency.
Avian habitat hotspots are primarily concentrated in three key areas. Firstly, areas distant from urban centers, such as natural landscapes near Phoenix Mountain, Tiegang Reservoir, and Yangtai Mountain within the study area. These regions fulfill avian requirements for food and habitat, aligning with birds’ preference for natural environments. Secondly, open spaces at the urban periphery, such as Bao’an Airport, where urbanization-induced changes in ecological processes related to foraging create new food sources for birds. These areas also experience lower levels of human disturbance, providing suitable conditions for avian habitation and reproduction. Thirdly, large green parks within urban built-up areas, such as the Mangrove Nature Reserve and Shenzhen Bay Park, are critical for urban ecological protection and restoration.
From the perspective of changes in bird habitat suitability, the northern part of Bao’an District has become a significant hotspot for habitat degradation, posing threats to terrestrial birds, raptors, and passerines. Despite existing rivers and parks, dense industrial parks exert overwhelming environmental pressure, leading to rapid ecological deterioration [97]. This highlights that fragmented ecological spaces in highly urbanized areas may be insufficient to offset the impacts of intensive human development. Conversely, the southern Nanshan District and western Futian District show increasing habitat suitability, especially for terrestrial birds and passerines. This spatial convergence of high-quality habitats between 2015 and 2020 strongly aligns with targeted local ecological restoration initiatives, including the construction of the Shenzhen Bay Coastal Leisure Belt and the citywide park expansion programs. However, this also indicates spatial constraints for suitable habitats in the urban core. Areas around major transportation hubs, such as airports and ports, exhibit fluctuating ecological quality. The airport’s vicinity shows a “zone of ecological disturbance,” where frequent aviation activities destabilize passerine habitats [97,98]. Likewise, declining aquatic bird habitats near ports and in northern Bao’an indicate that transportation infrastructure is a major source of disturbance. Nevertheless, some regions experienced ecological recovery from 2015 to 2020. Habitat quality for raptors in central Bao’an and Futian improved significantly, while climbing birds showed habitat improvements in previously degraded areas. Wading birds exhibited enhanced habitat quality in Futian and Nanshan Districts. These findings suggest that targeted habitat restoration measures for specific avian guilds can be effective.

4.3. The Nonlinear Relationship Between the Urban Environment and Bird Survival

To build more biodiversity-friendly urban environments, a better understanding is needed of how natural conditions and human activities jointly shape species distribution patterns [12,99].
Climate factors exert a profound influence on avian phenology. In the context of highly developed megacities, local microclimatic shifts and the urban heat island effect significantly alter local habitat suitability [100], driving diverse seasonal and spatial responses. This effect is particularly pronounced for migratory birds, which depend heavily on seasonal migration.
Anthropogenic factors often disrupt bird survival. Population density has a significant negative impact on terrestrial birds, songbirds, raptors, and waterfowl [52], correlating positively with urban population size and building density [55]. In landscapes dominated by human activities, bird habitats suffer severe fragmentation [44], reducing the suitability of these areas for bird survival. The influence of nighttime light pollution is particularly evident on raptors, songbirds, and climbers, with their presence probabilities increasing as nighttime light pollution decreases. Nighttime light pollution not only directly affects birds’ feeding and roosting behaviors [53,54,83] but may also indirectly impact birds through disruptions to plant life cycles and predator behaviors. Natural habitats generally provide more favorable conditions for bird survival than urban areas. Areas farther from urban centers tend to support higher bird occurrence, although certain locations near or within urban zones can also be suitable for birds [76,98,101,102]. Habitat fragmentation caused by urban activities significantly affects bird survival. However, urbanization can alter foraging-related ecological processes by providing anthropogenic food sources (e.g., ornamental fruiting plants, supplementary feeding, and food waste) that subsidize urban bird populations, and by shifting frugivore assemblages, which in turn reshapes local seed-dispersal patterns [101,103].
Habitat factors play pivotal roles in shaping the nesting and foraging behaviors of avian species, providing essential prerequisites for their survival. Vegetation cover significantly influences avian species richness [56,102], and high NDVI values notably enhance the habitat suitability for terrestrial birds, raptors, and songbirds. The influence of water bodies exhibits distinct gradient effects across bird guilds: songbirds benefit from proximity to water within 500 m, while waders show peak habitat suitability at 500–1200 m, reflecting their narrow ecological niche for foraging. In contrast, climbing birds experience a sharp decline in habitat suitability beyond 1500 m from water, indicating a strong dependency on riparian forests. This study also found that natural coastal environments provide higher habitat suitability than inland areas. Notably, restored or enhanced coastal areas support even greater bird richness than natural coastal zones [104].
From a threshold dynamics perspective, the positive response of raptors to NDVI intensified by 2020, which was coupled with an amplified negative constraint in low-NDVI areas. In addition, the increased NDVI sensitivity observed in songbirds since 2015 indicates a growing reliance on vegetation cover among urban bird communities. The polarized pattern of coastal influence on raptors, characterized by improved suitability nearshore and reduced suitability offshore, reflects ongoing ecological improvements in the coastal zone. Among anthropogenic factors, population density showed a weakening impact on terrestrial birds but a strengthening negative effect on waterfowl. Rather than a simple behavioral shift, this indicates that as inland urban matrices stabilize, developmental pressures and recreational activities are increasingly concentrated along coastlines, exacerbating the ecological squeeze on wetland-dependent species. The diminishing negative effect of nighttime light on climbing birds, combined with its growing constraint on waterfowl, further supports this coastal encroachment mechanism.

4.4. Strategies and Limitations

This study has several limitations. Although the reliability of citizen science bird observation data was enhanced through manual correction and pseudo-absence supplementation, inherent biases remain. Our pseudo absence selection relied on published habitat descriptions and consultation with experienced local birdwatchers. While this improves ecological plausibility, it inevitably introduces a degree of subjectivity that cannot be fully eliminated. Future studies could adopt more objectively replicable approaches to further strengthen the robustness of pseudo absence assignment. A potential scale mismatch exists between the spontaneous nature of eBird coordinates and the 30 m modeling grain. However, ensemble learning and long-term trend analysis help buffer record-level noise, and the high AUC values (>0.90) across all guilds suggest that consistent environmental signals were captured. Our findings should therefore be interpreted as relative spatiotemporal shifts in habitat quality and decadal trends, which offer higher pragmatic value for identifying ‘Ecological Recovery Zones’ than exact point predictions. In a fragmented urban landscape, original observation locations may not precisely reflect the microhabitat where birds were detected; future studies could integrate higher-resolution tracking data or systematic transect surveys to refine the spatial patterns identified here.
Bird distribution data are currently limited to an annual scale, overlooking seasonal variations and the effects of bird migration. Citizen science observations exhibit stronger seasonal bias and smaller sample sizes at finer temporal intervals, and our modeling framework did not explicitly account for migratory status. Consequently, the habitat suitability estimates presented here primarily reflect average annual conditions rather than seasonal peaks or migratory stopover use. Future research employing seasonal or monthly intervals would better capture intra-annual dynamics.
Small urban green spaces that serve as critical habitats for certain bird species may be undersampled or entirely absent from citizen science records, even after the preprocessing steps applied here [28,37]. Consequently, the model’s predictions might inadvertently underestimate the ecological value of these fine-scale habitats. This issue does not invalidate our broader conclusions on regional trends, but it does suggest that the true habitat importance of pocket parks, riparian corridors, and isolated tree clusters could be underrepresented. Future work combining systematic on-ground surveys with very-high-resolution remote sensing would help verify and complement the patterns detected at the 30 m grain.
The interpretation of ecological trends also requires caution. The observation that anthropogenic influences on terrestrial birds, songbirds, and raptors have weakened while habitat factors have become more important could reflect either behavioral and ecological adjustment by resident species or a compositional shift toward urban-tolerant species—i.e., biotic homogenization [10,13]. Our annual, guild-level data cannot distinguish between these two mechanisms. A more detailed analysis tracking species-level composition changes within each guild would be needed to resolve this ambiguity. Similarly, the six ecological guilds defined here are relatively broad. Species within the same guild can differ markedly in their responses to urban stressors, and guild-level suitability may average over divergent species-level patterns. Expanding the analytical framework to include alternative classifications (e.g., urban exploiters, adapters, and avoiders) or analyzing multiple biodiversity facets (taxonomic, functional, and phylogenetic diversity) would provide a more comprehensive understanding of how urbanization reshapes bird communities.

5. Conclusions

This study systematically investigated the spatio-temporal dynamics of bird distribution and its driving forces in the high-density urban environment of Shenzhen’s western coastal area from 2010 to 2020. By integrating citizen science data with a machine learning-Sen-MK-SHAP framework, we revealed the heterogeneous impacts of urbanization on six avian functional groups and proposed actionable strategies for balancing urban development and biodiversity conservation. The dynamic spatial changes in bird distributions highlight the impact of urban development on the ecological environment. For instance, habitat suitability for terrestrial birds and raptors in northern Bao’an District has significantly declined due to industrial expansion. Songbirds and climbing birds exhibit resilience in urban cores, with habitat hotspots extending into high-density built-up areas, reflecting successful local ecological restoration. In contrast, wading birds and waterfowl face severe habitat fragmentation along the western reclaimed coastline. The influence of anthropogenic factors on terrestrial birds, songbirds, and raptors is gradually weakening, while habitat factors are becoming increasingly important.
The integration of Random Forest, Sen-MK trend analysis, and SHAP interpretability provided a replicable framework for analyzing species–environment interactions across spatio-temporal scales. This approach connects predictive modeling with mechanistic ecological understanding, offering a replicable template for urban biodiversity studies.

Author Contributions

Conceptualization, X.L.; Methodology, Z.W.; Software, Z.W.; Formal analysis, Z.W.; Data curation, Z.W.; Writing—original draft, X.L., A.L. and Z.W.; Writing—review & editing, A.L., B.M. and C.L.; Visualization, A.L.; Supervision, X.L., A.L., B.M. and C.L.; Project administration, C.L.; Funding acquisition, X.L. All authors have read and agreed to the published version of the manuscript.

Funding

This research was funded by the Guangdong Natural Science Foundation (Grant No. 2024A1515011422), and the Shenzhen Natural Science Foundation (Grant No. JCYJ20250604182411016).

Data Availability Statement

The data presented in this study are openly available in ebird at https://ebird.org/home.

Conflicts of Interest

The authors declare no conflict of interest.

References

  1. Basak, S.M.; Hossain, M.S.; O’Mahony, D.T.; Okarma, H.; Widera, E.; Wierzbowska, I.A. Public perceptions and attitudes toward urban wildlife encounters—A decade of change. Sci. Total Environ. 2022, 834, 155603. [Google Scholar] [CrossRef] [PubMed]
  2. König, H.J.; Ceaușu, S.; Reed, M.; Kendall, H.; Hemminger, K.; Reinke, H.; Ostermann-Miyashita, E.-F.; Wenz, E.; Eufemia, L.; Hermanns, T.; et al. Integrated framework for stakeholder participation: Methods and tools for identifying and addressing human–wildlife conflicts. Conserv. Sci. Pract. 2021, 3, e399. [Google Scholar] [CrossRef]
  3. Yu, Z.; Nukina, R.; Xie, Y.; Shibata, S. Public attitudes to urban wild deer (Cervus nippon) and management policies: A case study of Kyoto City, Japan. Glob. Ecol. Conserv. 2024, 51, e02927. [Google Scholar] [CrossRef]
  4. Wu, J.G. Landscape sustainability science (II): Core questions and key approaches. Landsc. Ecol. 2021, 36, 2453–2485. [Google Scholar] [CrossRef]
  5. Fu, B.J.; Liu, Y.X.; Zhao, W.W.; Wu, J.G. The emerging “pattern-process-service-sustainability” paradigm in landscape ecology. Landsc. Ecol. 2025, 40, 54. [Google Scholar] [CrossRef]
  6. Wu, J.G.; Naeem, S.; Elser, J.; Bai, Y.F.; Huang, J.H.; Kang, L.; Pan, Q.M.; Wang, Q.B.; Hao, S.G.; Han, X.G. Testing biodiversity-ecosystem functioning relationship in the world’s largest grassland: Overview of the IMGRE project. Landsc. Ecol. 2015, 30, 1723–1736. [Google Scholar] [CrossRef]
  7. Magle, S.B.; Fidino, M.; Lehrer, E.W.; Gallo, T.; Mulligan, M.P.; Ríos, M.J.; Ahlers, A.A.; Angstmann, J.; Belaire, A.; Dugelby, B.; et al. Advancing urban wildlife research through a multi-city collaboration. Front. Ecol. Environ. 2019, 17, 232–239. [Google Scholar] [CrossRef]
  8. Aronson, M.F.J.; Lepczyk, C.A.; Evans, K.L.; Goddard, M.A.; Lerman, S.B.; MacIvor, J.S.; Nilon, C.H.; Vargo, T. Biodiversity in the city: Key challenges for urban green space management. Front. Ecol. Environ. 2017, 15, 189–196. [Google Scholar] [CrossRef]
  9. Beninde, J.; Veith, M.; Hochkirch, A. Biodiversity in cities needs space: A meta-analysis of factors determining intra-urban biodiversity variation. Ecol. Lett. 2015, 18, 581–592. [Google Scholar] [CrossRef] [PubMed]
  10. Blair, R.B. Land Use and Avian Species Diversity Along an Urban Gradient. Ecol. Appl. 1996, 6, 506–519. [Google Scholar] [CrossRef]
  11. La Sorte, F.A.; Lepczyk, C.A.; Aronson, M.F.J.; Goddard, M.A.; Hedblom, M.; Katti, M.; MacGregor-Fors, I.; Mörtberg, U.; Nilon, C.H.; Warren, P.S.; et al. The phylogenetic and functional diversity of regional breeding bird assemblages is reduced and constricted through urbanization. Divers. Distrib. 2018, 24, 928–938. [Google Scholar] [CrossRef]
  12. Rega-Brodsky, C.C.; Aronson, M.F.J.; Piana, M.R.; Carpenter, E.-S.; Hahs, A.K.; Herrera-Montes, A.; Knapp, S.; Kotze, D.J.; Lepczyk, C.A.; Moretti, M.; et al. Urban biodiversity: State of the science and future directions. Urban Ecosyst. 2022, 25, 1083–1096. [Google Scholar] [CrossRef]
  13. McKinney, M.L. Urbanization as a major cause of biotic homogenization. Biol. Conserv. 2006, 127, 247–260. [Google Scholar] [CrossRef]
  14. Pereira, H.M.; Ferrier, S.; Walters, M.; Geller, G.N.; Jongman, R.H.G.; Scholes, R.J.; Bruford, M.W.; Brummitt, N.; Butchart, S.H.M.; Cardoso, A.C.; et al. Essential Biodiversity Variables. Science 2013, 339, 277–278. [Google Scholar] [CrossRef] [PubMed]
  15. Fraixedas, S.; Lindén, A.; Piha, M.; Cabeza, M.; Gregory, R.; Lehikoinen, A. A state-of-the-art review on birds as indicators of biodiversity: Advances, challenges, and future directions. Ecol. Indic. 2020, 118, 106728. [Google Scholar] [CrossRef]
  16. Gregory, R.D.; van Strien, A.; Vorisek, P.; Gmelig Meyling, A.W.; Noble, D.G.; Foppen, R.P.B.; Gibbons, D.W. Developing indicators for European birds. Philos. Trans. R. Soc. B Biol. Sci. 2005, 360, 269–288. [Google Scholar] [CrossRef] [PubMed]
  17. Strohbach, M.W.; Haase, D.; Kabisch, N. Birds and the City: Urban Biodiversity, Land Use, and Socioeconomics. Ecol. Soc. 2009, 14. Available online: http://www.jstor.org/stable/26268315 (accessed on 26 June 2026). [CrossRef]
  18. Farmer, M.C.; Wallace, M.C.; Shiroya, M. Bird diversity indicates ecological value in urban home prices. Urban Ecosyst. 2013, 16, 131–144. [Google Scholar] [CrossRef]
  19. Morelli, F.; Reif, J.; Díaz, M.; Tryjanowski, P.; Ibáñez-Álamo, J.D.; Suhonen, J.; Jokimäki, J.; Kaisanlahti-Jokimäki, M.-L.; Pape Møller, A.; Bussière, R.; et al. Top ten birds indicators of high environmental quality in European cities. Ecol. Indic. 2021, 133, 108397. [Google Scholar] [CrossRef]
  20. Soifer, L.G.; Donovan, S.K.; Brentjens, E.T.; Bratt, A.R. Piecing together cities to support bird diversity: Development and forest edge density affect bird richness in urban environments. Landsc. Urban Plan. 2021, 213, 104122. [Google Scholar] [CrossRef]
  21. Yang, Y.; Chen, Y.; Ye, Z.; Song, Z.; Xiong, Y. Springtime spatio-temporal distribution of bird diversity in urban parks based on acoustic indices. Glob. Ecol. Conserv. 2024, 53, e02995. [Google Scholar] [CrossRef]
  22. Yu, J.; Ma, X.; Feng, L. Urban bird diversity conservation plan based on the systematic conservation planning approach—A case study of Beijing Ecological Cultivation Area. Ecol. Indic. 2023, 156, 111082. [Google Scholar] [CrossRef]
  23. Santos, E.G.; Wiederhecker, H.C.; Pompermaier, V.T.; Gainsbury, A.M.; Schirmer, S.C.; Morais, C.V.F.; Fontenele, J.L.; de Morais Santana, M.C.; Marini, M.Â. Urbanization reduces diversity, simplifies community and filter bird species based on their functional traits in a tropical city. Sci. Total Environ. 2024, 935, 173379. [Google Scholar] [CrossRef] [PubMed]
  24. Wu, J.G. Effects of changing scale on landscape pattern analysis: Scaling relations. Landsc. Ecol. 2004, 19, 125–138. [Google Scholar] [CrossRef]
  25. Morin, D.J.; Boulanger, J.; Bischof, R.; Lee, D.C.; Ngoprasert, D.; Fuller, A.K.; McLellan, B.; Steinmetz, R.; Sharma, S.; Garshelis, D.; et al. Comparison of methods for estimating density and population trends for low-density Asian bears. Glob. Ecol. Conserv. 2022, 35, e02058. [Google Scholar] [CrossRef]
  26. Sullivan, B.L.; Aycrigg, J.L.; Barry, J.H.; Bonney, R.E.; Bruns, N.; Cooper, C.B.; Damoulas, T.; Dhondt, A.A.; Dietterich, T.; Farnsworth, A.; et al. The eBird enterprise: An integrated approach to development and application of citizen science. Biol. Conserv. 2014, 169, 31–40. [Google Scholar] [CrossRef]
  27. Ahmed, N.; Roth, M.; Hallman, T.A.; Robinson, W.D.; Hutchinson, R.A. Spatial clustering of citizen science data improves downstream species distribution models. Proc. AAAI Conf. Artif. Intell. 2025, 39, 27775–27783. [Google Scholar] [CrossRef]
  28. Callaghan, C.T.; Poore, A.G.B.; Hofmann, M.; Roberts, C.J.; Pereira, H.M. Large-bodied birds are over-represented in unstructured citizen science data. Sci. Rep. 2021, 11, 19073. [Google Scholar] [CrossRef] [PubMed]
  29. Steen, V.A.; Tingley, M.W.; Paton, P.W.C.; Elphick, C.S. Spatial thinning and class balancing: Key choices lead to variation in the performance of species distribution models with citizen science data. Methods Ecol. Evol. 2021, 12, 216–226. [Google Scholar] [CrossRef]
  30. Duan, H.; Xia, S.; Yu, X.; Liu, Y.; Teng, J.; Dou, Y. Using citizen science data to inform the relative sensitivity of waterbirds to natural versus human-dominated landscapes in China. Ecol. Evol. 2020, 10, 7233–7241. [Google Scholar] [CrossRef] [PubMed]
  31. Ingram, M.; Vukcevic, D.; Golding, N. Scaling multi-species occupancy models to large citizen science datasets. arXiv 2022. [Google Scholar] [CrossRef]
  32. Wu, J.; Chen, G.; Callaghan, C.T.; Ren, Q. The effect of grain size on the relationship between urbanization and bird diversity. Appl. Geogr. 2024, 162, 103154. [Google Scholar] [CrossRef]
  33. Duan, H.; Yu, X.; Xia, S.; Liu, Y. Comparison of IUCN and species distribution modeling-estimated ranges of shorebirds in Coastal Mainland China. Glob. Ecol. Conserv. 2022, 38, e02236. [Google Scholar] [CrossRef]
  34. Beninde, J.; Delaney, T.W.; Gonzalez, G.; Shaffer, H.B. Harnessing iNaturalist to quantify hotspots of urban biodiversity: The Los Angeles case study. Front. Ecol. Evol. 2023, 11, 983371. [Google Scholar] [CrossRef]
  35. Li, X.; Wang, Z.; Chen, Y.; Wang, Z.; Kuang, D. Exploring the impact of land use on bird diversity in high-density urban areas using explainable machine learning models. J. Environ. Manag. 2025, 374, 124080. [Google Scholar] [CrossRef] [PubMed]
  36. Callaghan, C.T.; Watson, J.E.M.; Lyons, M.B.; Cornwell, W.K.; Fuller, R.A. Conservation birding: A quantitative conceptual framework for prioritizing citizen science observations. Biol. Conserv. 2021, 253, 108912. [Google Scholar] [CrossRef]
  37. Tang, B.; Clark, J.S.; Gelfand, A.E. Modeling spatially biased citizen science effort through the eBird database. Environ. Ecol. Stat. 2021, 28, 609–630. [Google Scholar] [CrossRef]
  38. Planillo, A.; Fiechter, L.; Sturm, U.; Voigt-Heucke, S.; Kramer-Schadt, S. Citizen science data for urban planning: Comparing different sampling schemes for modelling urban bird distribution. Landsc. Urban Plan. 2021, 211, 104098. [Google Scholar] [CrossRef]
  39. Steen, V.A.; Elphick, C.S.; Tingley, M.W. An evaluation of stringent filtering to improve species distribution models from citizen science data. Divers. Distrib. 2019, 25, 1857–1869. [Google Scholar] [CrossRef]
  40. Guillera-Arroita, G.; Lahoz-Monfort, J.J.; Elith, J.; Gordon, A.; Kujala, H.; Lentini, P.E.; McCarthy, M.A.; Tingley, R.; Wintle, B.A. Is my species distribution model fit for purpose? Matching data and models to applications. Glob. Ecol. Biogeogr. 2015, 24, 276–292. [Google Scholar] [CrossRef]
  41. Coe, B.H.; Beck, M.L.; Chin, S.Y.; Jachowski, C.M.; Hopkins, W.A. Local variation in weather conditions influences incubation behavior and temperature in a passerine bird. J. Avian Biol. 2015, 46, 385–394. [Google Scholar] [CrossRef]
  42. Gasner, M.R.; Jankowski, J.E.; Ciecka, A.L.; Kyle, K.O.; Rabenold, K.N. Projecting the local impacts of climate change on a Central American montane avian community. Biol. Conserv. 2010, 143, 1250–1258. [Google Scholar] [CrossRef]
  43. Morelli, F.; Benedetti, Y.; Su, T.; Zhou, B.; Moravec, D.; Šímová, P.; Liang, W. Taxonomic diversity, functional diversity and evolutionary uniqueness in bird communities of Beijing’s urban parks: Effects of land use and vegetation structure. Urban For. Urban Green. 2017, 23, 84–92. [Google Scholar] [CrossRef]
  44. Smith, A.C.; Fahrig, L.; Francis, C.M. Landscape size affects the relative importance of habitat amount, habitat fragmentation, and matrix quality on forest birds. Ecography 2011, 34, 103–113. [Google Scholar] [CrossRef]
  45. Liu, X.; Zhao, Y.; Zeng, D.; Yang, Y.; Li, W.; Kang, Y.; Wei, G.; Yuan, X.; Bo, S.; Si, X. Characterizing bird species for achieving the win-wins of conserving biodiversity and enhancing regulating ecosystem services in urban green spaces. Urban For. Urban Green. 2023, 87, 128064. [Google Scholar] [CrossRef]
  46. Paker, Y.; Yom-Tov, Y.; Alon-Mozes, T.; Barnea, A. The effect of plant richness and urban garden structure on bird species richness, diversity and community structure. Landsc. Urban Plan. 2014, 122, 186–195. [Google Scholar] [CrossRef]
  47. Aubrechtová, E.; Bydžovská, T.; Horák, J. Blue-green infrastructure and biodiversity: Urbanization and forestation have an important influence on bird diversity in water habitats. Urban For. Urban Green. 2024, 91, 128151. [Google Scholar] [CrossRef]
  48. Thuiller, W.; Pironon, S.; Psomas, A.; Barbet-Massin, M.; Jiguet, F.; Lavergne, S.; Pearman, P.B.; Renaud, J.; Zupan, L.; Zimmermann, N.E. The European functional tree of bird life in the face of global change. Nat. Commun. 2014, 5, 3118. [Google Scholar] [CrossRef] [PubMed]
  49. Bellocq, M.I.; Leveau, L.M.; Filloy, J. Urbanization and Bird Communities: Spatial and Temporal Patterns Emerging from Southern South America. In Ecology and Conservation of Birds in Urban Environments; Murgui, E., Hedblom, M., Eds.; Springer International Publishing: Berlin/Heidelberg, Germany, 2017; pp. 35–54. [Google Scholar] [CrossRef]
  50. Fernández-Juricic, E. Bird community composition patterns in urban parks of Madrid: The role of age, size and isolation. Ecol. Res. 2000, 15, 373–383. [Google Scholar] [CrossRef]
  51. Mulholland, T.I.; Ferraro, D.M.; Boland, K.C.; Ivey, K.N.; Le, M.-L.; LaRiccia, C.A.; Vigianelli, J.M.; Francis, C.D. Effects of Experimental Anthropogenic Noise Exposure on the Reproductive Success of Secondary Cavity Nesting Birds. Integr. Comp. Biol. 2018, 58, 967–976. [Google Scholar] [CrossRef] [PubMed]
  52. Bettencourt, L.M.A.; Lobo, J.; Helbing, D.; Kühnert, C.; West, G.B. Growth, innovation, scaling, and the pace of life in cities. Proc. Natl. Acad. Sci. USA 2007, 104, 7301–7306. [Google Scholar] [CrossRef] [PubMed]
  53. Davies, T.W.; Bennie, J.; Cruse, D.; Blumgart, D.; Inger, R.; Gaston, K.J. Multiple night-time light-emitting diode lighting strategies impact grassland invertebrate assemblages. Glob. Change Biol. 2017, 23, 2641–2648. [Google Scholar] [CrossRef] [PubMed]
  54. de Jong, M.; Jeninga, L.; Ouyang, J.Q.; van Oers, K.; Spoelstra, K.; Visser, M.E. Dose-dependent responses of avian daily rhythms to artificial light at night. Physiol. Behav. 2016, 155, 172–179. [Google Scholar] [CrossRef] [PubMed]
  55. Lewis, C.A.; Cristol, D.A.; Swaddle, J.P.; Varian-Ramos, C.W.; Zwollo, P. Decreased Immune Response in Zebra Finches Exposed to Sublethal Doses of Mercury. Arch. Environ. Contam. Toxicol. 2013, 64, 327–336. [Google Scholar] [CrossRef] [PubMed]
  56. Liu, Z.; Zhou, Y.; Yang, H.; Liu, Z. Urban green infrastructure affects bird biodiversity in the coastal megalopolis region of Shenzhen city. Appl. Geogr. 2023, 151, 102860. [Google Scholar] [CrossRef]
  57. Jasmani, Z.; Ravn, H.P.; van den Bosch, C.C.K. The influence of small urban parks characteristics on bird diversity: A case study of Petaling Jaya, Malaysia. Urban Ecosyst. 2017, 20, 227–243. [Google Scholar] [CrossRef]
  58. James Barth, B.; Ian FitzGibbon, S.; Stuart Wilson, R. New urban developments that retain more remnant trees have greater bird diversity. Landsc. Urban Plan. 2015, 136, 122–129. [Google Scholar] [CrossRef]
  59. Strohbach, M.W.; Lerman, S.B.; Warren, P.S. Are small greening areas enhancing bird diversity? Insights from community-driven greening projects in Boston. Landsc. Urban Plan. 2013, 114, 69–79. [Google Scholar] [CrossRef]
  60. Zhang, S.; Han, D.; She, J.; Shen, Q.; Wang, C. The value of pocket parks in preserving urban butterfly diversity. Urban For. Urban Green. 2024, 99, 128467. [Google Scholar] [CrossRef]
  61. Beaumont, L.J.; Graham, E.; Duursma, D.E.; Wilson, P.D.; Cabrelli, A.; Baumgartner, J.B.; Hallgren, W.; Esperón-Rodríguez, M.; Nipperess, D.A.; Warren, D.L.; et al. Which species distribution models are more (or less) likely to project broad-scale, climate-induced shifts in species ranges? Ecol. Model. 2016, 342, 135–146. [Google Scholar] [CrossRef]
  62. Lawler, J.J.; White, D.; Neilson, R.P.; Blaustein, A.R. Predicting climate-induced range shifts: Model differences and model reliability. Glob. Change Biol. 2006, 12, 1568–1584. [Google Scholar] [CrossRef]
  63. Stockwell, D. The GARP modelling system: Problems and solutions to automated spatial prediction. Int. J. Geogr. Inf. Sci. 1999, 13, 143–158. [Google Scholar] [CrossRef]
  64. Guisan, A.; Edwards, T.C.; Hastie, T. Generalized linear and generalized additive models in studies of species distributions: Setting the scene. Ecol. Model. 2002, 157, 89–100. [Google Scholar] [CrossRef]
  65. Phillips, S.J.; Anderson, R.P.; Schapire, R.E. Maximum entropy modeling of species geographic distributions. Ecol. Model. 2006, 190, 231–259. [Google Scholar] [CrossRef]
  66. Bikkina, V. Comparison of Machine Learning Methods for Predicting Bird Distributions. 2014. Available online: https://ir.library.oregonstate.edu/concern/honors_college_theses/df65v9721 (accessed on 26 June 2026).
  67. Linderman, M.; Liu, J.; Qi, J.; An, L.; Ouyang, Z.; Yang, J.; Tan, Y. Using artificial neural networks to map the spatial distribution of understorey bamboo from remote sensing data. Int. J. Remote Sens. 2004, 25, 1685–1700. [Google Scholar] [CrossRef]
  68. Zhao, Z.; Xiao, N.; Shen, M.; Li, J. Comparison between optimized MaxEnt and random forest modeling in predicting potential distribution: A case study with Quasipaa boulengeri in China. Sci. Total Environ. 2022, 842, 156867. [Google Scholar] [CrossRef] [PubMed]
  69. Yang, W.; Li, Y.; Liu, Y.; Fan, P.; Yue, W. Environmental factors for outdoor jogging in Beijing: Insights from using explainable spatial machine learning and massive trajectory data. Landsc. Urban Plan. 2024, 243, 104969. [Google Scholar] [CrossRef]
  70. DB4403/T 616-2025; Bird-Friendly City Planning and Design Guidelines. Shenzhen Market Supervision and Administration Bureau: Shenzhen, China, 2025. Available online: https://std.samr.gov.cn/db/search/stdDBDetailed?id=36D2CD8A7A52C9EBE06397BE0A0A8861 (accessed on 26 June 2026).
  71. Araújo, M.B.; Pearson, R.G.; Thuiller, W.; Erhard, M. Validation of species–climate impact models under climate change. Glob. Change Biol. 2005, 11, 1504–1513. [Google Scholar] [CrossRef]
  72. SZBird (Shenzhen Bird Watching Society). Available online: http://www.szbird.org.cn (accessed on 26 June 2026).
  73. Strimas-Mackey, M.; Hochachka, W.M.; Ruiz-Gutierrez, V.; Robinson, O.J.; Miller, E.T.; Auer, T.; Kelling, S.; Fink, D.; Johnston, A. Best Practices for Using Ebird Data, Version 2.0; Cornell Lab of Ornithology: Ithaca, NY, USA, 2023; Available online: https://ebird.github.io/ebird-best-practices/ (accessed on 26 June 2026).
  74. Zheng, G. (Ed.) Chinese Bird Classification and Distribution List, 2nd ed.; Science Press: Beijing, China, 2011. [Google Scholar]
  75. Klopfer, P.H.; Hailman, J.P. Habitat Selection in Birds. In Advances in the Study of Behavior; Lehrman, D.S., Hinde, R.A., Shaw, E., Eds.; Academic Press: Cambridge, MA, USA, 1965; Volume 1, pp. 279–303. [Google Scholar] [CrossRef]
  76. Tan, L.Q.; Huang, R.Q.; Hao, P.Y.; Huang, Z.P.; Wang, Y.L. Distribution of Bird Communities and Habitat Corridor Composition Shaped by Environmental Factors in Urbanized Landscapes: A Case Study in Beijing, China. Forests 2025, 16, 1. [Google Scholar] [CrossRef]
  77. Barker, F.K.; Cibois, A.; Schikler, P.; Feinstein, J.; Cracraft, J. Phylogeny and diversification of the largest avian radiation. Proc. Natl. Acad. Sci. USA 2004, 101, 11040–11045. [Google Scholar] [CrossRef] [PubMed]
  78. De Graaf, R.M.; Tilghman, N.G.; Anderson, S.H. Foraging guilds of North American birds. Environ. Manag. 1985, 9, 493–536. [Google Scholar] [CrossRef]
  79. Chace, J.F.; Walsh, J.J. Urban effects on native avifauna: A review. Landsc. Urban Plan. 2006, 74, 46–69. [Google Scholar] [CrossRef]
  80. Chen, B.; Tu, Y.; Song, Y.; Theobald, D.M.; Zhang, T.; Ren, Z.; Li, X.; Yang, J.; Wang, J.; Wang, X.; et al. Mapping essential urban land use categories with open big data: Results for five metropolitan areas in the United States of America. ISPRS J. Photogramm. Remote Sens. 2021, 178, 203–218. [Google Scholar] [CrossRef]
  81. Rahbek, C.; Graves, G.R. Multiscale assessment of patterns of avian species richness. Proc. Natl. Acad. Sci. USA 2001, 98, 4534–4539. [Google Scholar] [CrossRef] [PubMed]
  82. Yang, J.; Huang, X. The 30 m Annual Land Cover Datasets and Its Dynamics in China from 1990 to 2021 (1.0.1); Zenodo: Geneva, Switzerland, 2022. [Google Scholar] [CrossRef]
  83. Ciach, M.; Fröhlich, A. Ungulates in the city: Light pollution and open habitats predict the probability of roe deer occurring in an urban environment. Urban Ecosyst. 2019, 22, 513–523. [Google Scholar] [CrossRef]
  84. Breiman, L. Random Forests. Mach. Learn. 2001, 45, 5–32. [Google Scholar] [CrossRef]
  85. Zhang, L.; Huettmann, F.; Liu, S.; Sun, P.; Yu, Z.; Zhang, X.; Mi, C. Classification and regression with random forests as a standard method for presence-only data SDMs: A future conservation example using China tree species. Ecol. Inform. 2019, 52, 46–56. [Google Scholar] [CrossRef]
  86. Charbonnel, A.; Lambert, P.; Lassalle, G.; Quinton, E.; Guisan, A.; Mas, L.; Paquignon, G.; Lecomte, M.; Acolas, M.-L. Developing species distribution models for critically endangered species using participatory data: The European sturgeon marine habitat suitability. Estuar. Coast. Shelf Sci. 2023, 280, 108136. [Google Scholar] [CrossRef]
  87. Phillips, S.J.; Dudík, M.; Elith, J.; Graham, C.H.; Lehmann, A.; Leathwick, J.; Ferrier, S. Sample selection bias and presence-only distribution models: Implications for background and pseudo-absence data. Ecol. Appl. 2009, 19, 181–197. [Google Scholar] [CrossRef] [PubMed]
  88. Chefaoui, R.M.; Lobo, J.M. Assessing the effects of pseudo-absences on predictive distribution model performance. Ecol. Model. 2008, 210, 478–486. [Google Scholar] [CrossRef]
  89. Milanesi, P.; Mori, E.; Menchetti, M. Observer-oriented approach improves species distribution models from citizen science data. Ecol. Evol. 2020, 10, 12104–12114. [Google Scholar] [CrossRef] [PubMed]
  90. Leveau, L.M. Temporal persistence of taxonomic and functional composition in bird communities of urban areas: An evaluation after a 6-year gap in data collection. Urban Ecosyst. 2022, 25, 9–20. [Google Scholar] [CrossRef]
  91. Alessa, L.; Kliskey, A.; Brown, G. Social–ecological hotspots mapping: A spatial approach for identifying coupled social–ecological space. Landsc. Urban Plan. 2008, 85, 27–39. [Google Scholar] [CrossRef]
  92. Qian, H.; Zhang, J.; Jiang, M. Global patterns of taxonomic and phylogenetic diversity of flowering plants: Biodiversity hotspots and coldspots. Plant Divers. 2023, 45, 265–271. [Google Scholar] [CrossRef] [PubMed]
  93. Zipkin, E.F.; Kinlan, B.P.; Sussman, A.; Rypkema, D.; Wimer, M.; O’Connell, A.F. Statistical guidelines for assessing marine avian hotspots and coldspots: A case study on wind energy development in the US Atlantic Ocean. Biol. Conserv. 2015, 191, 216–223. [Google Scholar] [CrossRef]
  94. Chen, Y.; Zhao, Q.; Liu, Y.; Zeng, H. Exploring the impact of natural and human activities on vegetation changes: An integrated analysis framework based on trend analysis and machine learning. J. Environ. Manag. 2025, 374, 124092. [Google Scholar] [CrossRef] [PubMed]
  95. Mann, H.B. Nonparametric Tests Against Trend. Econometrica 1945, 13, 245–259. [Google Scholar] [CrossRef]
  96. Kendall, M.G. Rank Correlation Methods, 4th ed.; Charles Griffin: London, UK, 1975. [Google Scholar]
  97. Zhao, B.; Wang, N.; Fu, Q.; Yan, H.-K.; Wu, N. Searching a site for a civil airport based on bird ecological conservation: An expert-based selection (Dalian, China). Glob. Ecol. Conserv. 2019, 20, e00729. [Google Scholar] [CrossRef]
  98. Ortega-Álvarez, R.; MacGregor-Fors, I. Living in the big city: Effects of urban land-use on bird community structure, diversity, and composition. Landsc. Urban Plan. 2009, 90, 189–195. [Google Scholar] [CrossRef]
  99. Apfelbeck, B.; Snep, R.P.H.; Hauck, T.E.; Ferguson, J.; Holy, M.; Jakoby, C.; Scott MacIvor, J.; Schär, L.; Taylor, M.; Weisser, W.W. Designing wildlife-inclusive cities that support human-animal co-existence. Landsc. Urban Plan. 2020, 200, 103817. [Google Scholar] [CrossRef]
  100. Butler, C.J. The disproportionate effect of global warming on the arrival dates of short-distance migratory birds in North America. Ibis 2003, 145, 484–495. [Google Scholar] [CrossRef]
  101. Oliveira Hagen, E.; Hagen, O.; Ibáñez-Álamo, J.D.; Petchey, O.L.; Evans, K.L. Impacts of Urban Areas and Their Characteristics on Avian Functional Diversity. Front. Ecol. Evol. 2017, 5, 267008. [Google Scholar] [CrossRef]
  102. Schütz, C.; Schulze, C.H. Functional diversity of urban bird communities: Effects of landscape composition, green space area and vegetation cover. Ecol. Evol. 2015, 5, 5230–5239. [Google Scholar] [CrossRef] [PubMed]
  103. Caughlin, T.; Wheeler, J.H.; Jankowski, J.; Lichstein, J.W. Urbanized landscapes favored by fig-eating birds increase invasive but not native juvenile strangler fig abundance. Ecology 2012, 93, 1571–1580. [Google Scholar] [CrossRef] [PubMed]
  104. Graells, G.; Celis-Diez, J.L.; Corcoran, D.; Gelcich, S. Bird Communities in Coastal Areas. Effects of Anthropogenic Influences and Distance From the Coast. Front. Ecol. Evol. 2022, 10, 807280. [Google Scholar] [CrossRef]
Figure 1. Overview of the four-step analytical framework used in this study. Step 1: data collection and preprocessing. Step 2: Model training and prediction for 2010, 2015, and 2020. Step 3: Change in bird distribution trend. Step 4: Impact factor analysis.
Land 15 01210 g001
Figure 2. Location of the study area and main ecological spaces. (a) The location of Shenzhen city in Guangdong province. (b) The study area is on the western coast of Shenzhen. (c) Study regional administrative divisions and main ecological spaces.
Land 15 01210 g002
Figure 3. Schematic diagram of the Random Forest (RF) model: voting-based classification and average-based regression. The model takes the input feature vector X and feeds it into an ensemble of decision trees. Each tree contains internal decision nodes (light yellow circles) where data is split based on feature rules, and leaf nodes (light blue circles) that output individual tree predictions. The + symbol at the bottom represents the aggregation step: for classification tasks, predictions are combined via majority voting, while for regression tasks, predictions are averaged to produce the final output y. Arrows indicate the direction of data flow through the trees and aggregation process.
Land 15 01210 g003
Figure 4. Prediction results of habitat hotspots and coldspots using the RF model in 2010, 2015 and 2020.
Land 15 01210 g004
Figure 5. Spatial Patterns of Changes in Bird Habitat Suitability and Ecological Zoning.
Land 15 01210 g005
Figure 6. Stacked Percentage Bar Chart of Absolute Mean SHAP Values for Climatic, Topographical, Habitat, and Anthropogenic Factors.
Land 15 01210 g006
Figure 7. SHAP values of environmental factors affecting bird distribution in the Random Forest (RF) model, grouped by three avian guilds. (a) Terrestrial birds, (b) Raptors, and (c) Songbirds. The color gradient (blue to red) represents the magnitude of each environmental feature’s value, from low to high. A positive SHAP value indicates a positive contribution to the model’s prediction of bird presence, while a negative SHAP value indicates a negative SHAP value indicates a negative contribution. The absolute magnitude of the SHAP value corresponds to the strength of the feature’s influence on the model output. For each guild, the three panels from left to right correspond to the years 2010, 2015, and 2020, respectively.
Land 15 01210 g007
Figure 8. SHAP values of various environmental factors affecting climbing birds, wading birds and waterfowl in the RF model, For each guild, the three panels correspond to 2010, 2015 and 2020 (left to right). SHAP values of environmental factors affecting bird distribution in the Random Forest (RF) model, grouped by three avian guilds. (a) climbing birds, (b) wading birds and (c) waterfowl. The color gradient (blue to red) represents the magnitude of each environmental feature’s value, from low to high. A positive SHAP value indicates a positive contribution to the model’s prediction of bird presence, while a negative SHAP value indicates a negative SHAP value indicates a negative contribution. The absolute magnitude of the SHAP value corresponds to the strength of the feature’s influence on the model output. For each guild, the three panels from left to right correspond to the years 2010, 2015, and 2020, respectively.
Land 15 01210 g008
Figure 9. Threshold changes of key factors affecting bird group survival.
Land 15 01210 g009
Table 1. Summary of dependent and independent variables used in the Random Forest model, including variable categories, specific variable names, abbreviations, and data sources.
Variable TypesVariableAbbreviationsData Source
Dependent variables
Bird dataBird occurrence points eBird (input for training) and the China Bird Report Center (external validation)
Environmental variables
Climatic FactorsAnnual Average TemperatureAATNational Climatic Data Center
Annual PrecipitationAPThe National Climatic Data Center
Annual Temperature RangeATRNational Climatic Data Center
Topographical factorDEMDEMGeographic Spatial Data Cloud
SlopeSDerived from DEM
AspectADerived from DEM
Habitat factorsNDVINDVIChinese Academy of Sciences Resource and Environment Science Data Center
Land CoverLC[82]
Water DistanceWDCalculated from land cover data
Coastal DistanceCDCalculated from geographic data
Vegetation TypeGRASS-MANGM[82]
GRASS-NATGN[82]
SHRUBS-BESBE[82]
WATER_INLANDWIN[82]
TREES-BETBE[82]
TREES-NETNE[82]
Anthropogenic FactorsPopulation DensityPDLandScan Global Population Database
Urban DistanceUDCalculated from geographic data
Nighttime Light IndexNLIEANTLI nighttime light dataset
Road DistanceRDOpenStreetMap (OSM)
Table 2. AUC Values of Random Forest Models for Six Bird Groups.
Avian GroupAUC
Terrestrial birds0.90
Raptors0.96
Songbirds0.97
Climbing birds0.98
Wading birds0.98
Waterfowl0.93
Table 3. Classification Criteria of Bird Ecological Zones Based on the Sen-MK Method.
Ecological Zone Types Mann–Kendall ResultSen’s Slope ChangeDescription
Sustained ecological recovery zonesSignificant IncreasingPositive ChangeHabitat suitability for birds increases rapidly, indicating significant environmental improvement.
Ecologically stable adjustment zonesSignificant IncreasingInsignificant ChangeSlight increase in bird diversity with low change rate, likely due to minor ecological fluctuations rather than long-term improvement.
Sudden ecological disturbance zonesSignificant IncreasingNegative ChangeOverall bird diversity increases, but recent decline in rate suggests prior disturbances such as natural disasters, human interference, or short-term extreme climate events.
Secondary ecological degradation zonesSignificant DecreasingInsignificant ChangeClear downward trend in bird diversity with slow degradation rate, indicating gradual ecological decline.
Primary ecological degradation zonesSignificant DecreasingNegative ChangeRapid decline in bird diversity, reflecting severe environmental degradation.
Disclaimer/Publisher’s Note: The statements, opinions and data contained in all publications are solely those of the individual author(s) and contributor(s) and not of MDPI and/or the editor(s). MDPI and/or the editor(s) disclaim responsibility for any injury to people or property resulting from any ideas, methods, instructions or products referred to in the content.