Article

Spatiotemporal Dynamics of Vegetation Net Primary Productivity and Its Responses to Evapotranspiration, Temperature, and Precipitation in the Mu Us Sandy Land (2001–2023)
1
School of Water Conservancy, North China University of Water Resources and Electric Power, Zhengzhou 450046, China
2
Institute of Water Resources of Pastoral Area, Ministry of Water Resources, Hohhot 010018, China
3
Yinshanbeilu Grassland Eco-Hydrology National Observation and Research Station, China Institute of Water Resources and Hydropower Research, Beijing 100038, China
4
Inner Mongolia Autonomous Region Ecological and Agricultural Meteorological Center, Hohhot 010020, China
*
Author to whom correspondence should be addressed.
Land 2026, 15(4), 652; https://doi.org/10.3390/land15040652
Submission received: 6 March 2026 / Revised: 10 April 2026 / Accepted: 13 April 2026 / Published: 15 April 2026
(This article belongs to the Section Land–Climate Interactions)

Abstract

Net primary productivity (NPP) and its response to global climate change are one of the hot topics in global change research. Based on Net primary productivity remote sensing data and meteorological data, this study analyzed the spatiotemporal variation in vegetation NPP in Maowusu sandy land by using Sen trend analysis, Mann–Kendall significance test, coefficient of variation stability analysis, partial correlation and complex correlation analysis, and quantitatively analyzed the response of vegetation NPP to climate factors. The results showed that from 2001 to 2023, the overall vegetation NPP showed a significant upward trend, and the annual average increased from 124.28 g·(m−2·a)−1 to 221.41 g·(m−2·a)−1. The Theil–Sen median slope of NPP was +3.87 g·(m−2·a)−1 with a coefficient of variation (CV) of 0.19, suggesting a robust but spatially variable greening trend. In total, 98.53% of the area showed an upward trend, with a very significant and significant increase area. The overall stability of vegetation NPP was strong, with an average coefficient of variation (CV) of 0.19 and a CV< of 0.30 in 97.96% of the regions, but the local area from southwest to east was highly volatile and there was a risk of secondary desertification. The influence of climate factors on vegetation NPP had significant spatial heterogeneity: precipitation was the key driving factor, and most areas were positively correlated. Potential evapotranspiration was positively correlated in the central and northern regions, and negatively correlated in some southern areas. The overall temperature has a negative effect, and only the local area has a weak promoting effect. Multi-correlation analysis shows that vegetation NPP is the result of the synergy of multiple climatic factors, and the hydrothermal coupling mechanism plays a decisive role in its spatial pattern. This study can provide a scientific basis for the restoration of vegetation ecosystems, environmental protection policy formulation, ecological protection and high-quality development of the Yellow River Basin in Maowusu Sandy Land.

1. Introduction

Net primary productivity (NPP) refers to the net increase in organic matter accumulated by green plants through photosynthesis per unit time and unit space [1]. It is not only the fundamental energy source for Earth’s ecosystem food chains but also a key indicator for measuring vegetation carbon sequestration capacity and reflecting ecosystem dynamics [2,3]. Vegetation NPP holds significant scientific value for land use assessment, ecosystem health evaluation, and environmental change monitoring [4,5]. Currently, numerous studies have focused on the response of vegetation NPP to climate change, especially in arid and semi-arid regions [6,7]. Scholars generally agree that precipitation is the primary climatic factor limiting vegetation growth in such regions, while the influence of temperature shows considerable spatial heterogeneity [8]. As a typical ecologically fragile and climate-sensitive area, vegetation dynamics in the Mu Us Sandy Land have drawn consistent research attention. Existing studies have largely assessed vegetation restoration in this region based on vegetation indices such as the normalized difference vegetation index (NDVI) and enhanced vegetation index (EVI), and have preliminarily explored the influences of precipitation and temperature. However, compared to these “greenness” indices, NPP more directly characterizes ecosystem productivity and carbon sink function, offering better insight into the ecological effects of vegetation restoration [9,10].
Precipitation is the main climatic factor driving vegetation NPP in China’s arid and semi-arid regions, generally exerting a positive effect that often outweighs that of temperature [11]. Temperature can extend the growing season and enhance photosynthetic efficiency, with particularly notable effects in high-altitude areas such as the Tibetan Plateau [12]. The Mu Us Sandy Land, located in the “U”-shaped bend of the Yellow River, represents a typical ecologically fragile and climate-sensitive zone, highly susceptible to climate change and human activities [13]. Although research methods investigating the relationship between vegetation NPP and climatic factors have expanded in recent years—including trend analysis, stability assessment, and correlation analysis—existing studies still present several limitations. First, while existing research indicates precipitation (Pre) and temperature (Temp) as primary drivers of NPP in arid regions, most studies show considerable spatial heterogeneity in temperature effects [14,15,16]. However, a critical gap remains in understanding the role of potential evapotranspiration (Pet), a key indicator of atmospheric water demand, in regulating NPP dynamics. Second, analytical approaches often rely on simple correlation or single-factor regression, which fails to disentangle the interactive effects among multiple climatic factors or reveal their synergistic mechanisms. Third, for the Mu Us Sandy Land, systematic research on long-term spatiotemporal NPP changes and their response to multiple hydrothermal factors remains scarce, particularly regarding comprehensive quantitative assessments combining partial and multiple correlation analyses [17]. Globally, dryland greening has been a dominant trend under climate change [18,19], yet the underlying mechanisms—particularly the competition between energy and water limitations—remain debated. The Mu Us Sandy Land, as a typical ecologically fragile zone within the Eurasian steppe, serves as a critical case study to test these global theories under a water-limited regime.
Previous studies in this region have predominantly utilized standard trend analysis (e.g., Sen’s slope and Mann–Kendall tests) to correlate vegetation indices with basic climate variables like precipitation and temperature. While robust, these approaches often overlook the role of atmospheric evaporative demand. Our study advances beyond these earlier works by incorporating potential evapotranspiration as a key variable. By applying partial correlation analysis, we disentangle the complex interactions between water supply (precipitation) and water demand (potential evapotranspiration), providing a more nuanced understanding of whether the ecosystem is transitioning from an energy-limited to a water-limited regime. To address these specific gaps, particularly the lack of integrated analysis of evaporative demand, we ask: How do the complex interactions between water supply (precipitation) and atmospheric water demand (potential evapotranspiration) regulate vegetation net primary productivity (NPP) in the Mu Us Sandy Land under a changing climate?
Therefore, this study takes the Mu Us Sandy Land as its focus, integrating MODIS NPP data (2001–2023) and multi-source climate data (temperature, precipitation, and potential evapotranspiration). Using Sen’s trend analysis, the Mann–Kendall test, coefficient of variation (CV) analysis, and partial and multiple correlation analyses, the study aims to: (1) reveal the spatiotemporal variation trends and spatial differentiation characteristics of vegetation NPP; (2) quantitatively assess the response of NPP to temperature, precipitation, and potential evapotranspiration and its spatial heterogeneity; and (3) clarify the influence mechanisms of synergistic climatic effects on NPP. By doing so, this research addresses the current lack of comprehensive consideration of potential evapotranspiration in existing studies and provides a scientific basis for ecological restoration and adaptive management in the region.

2. Materials and Methods

2.1. Research Area Overview

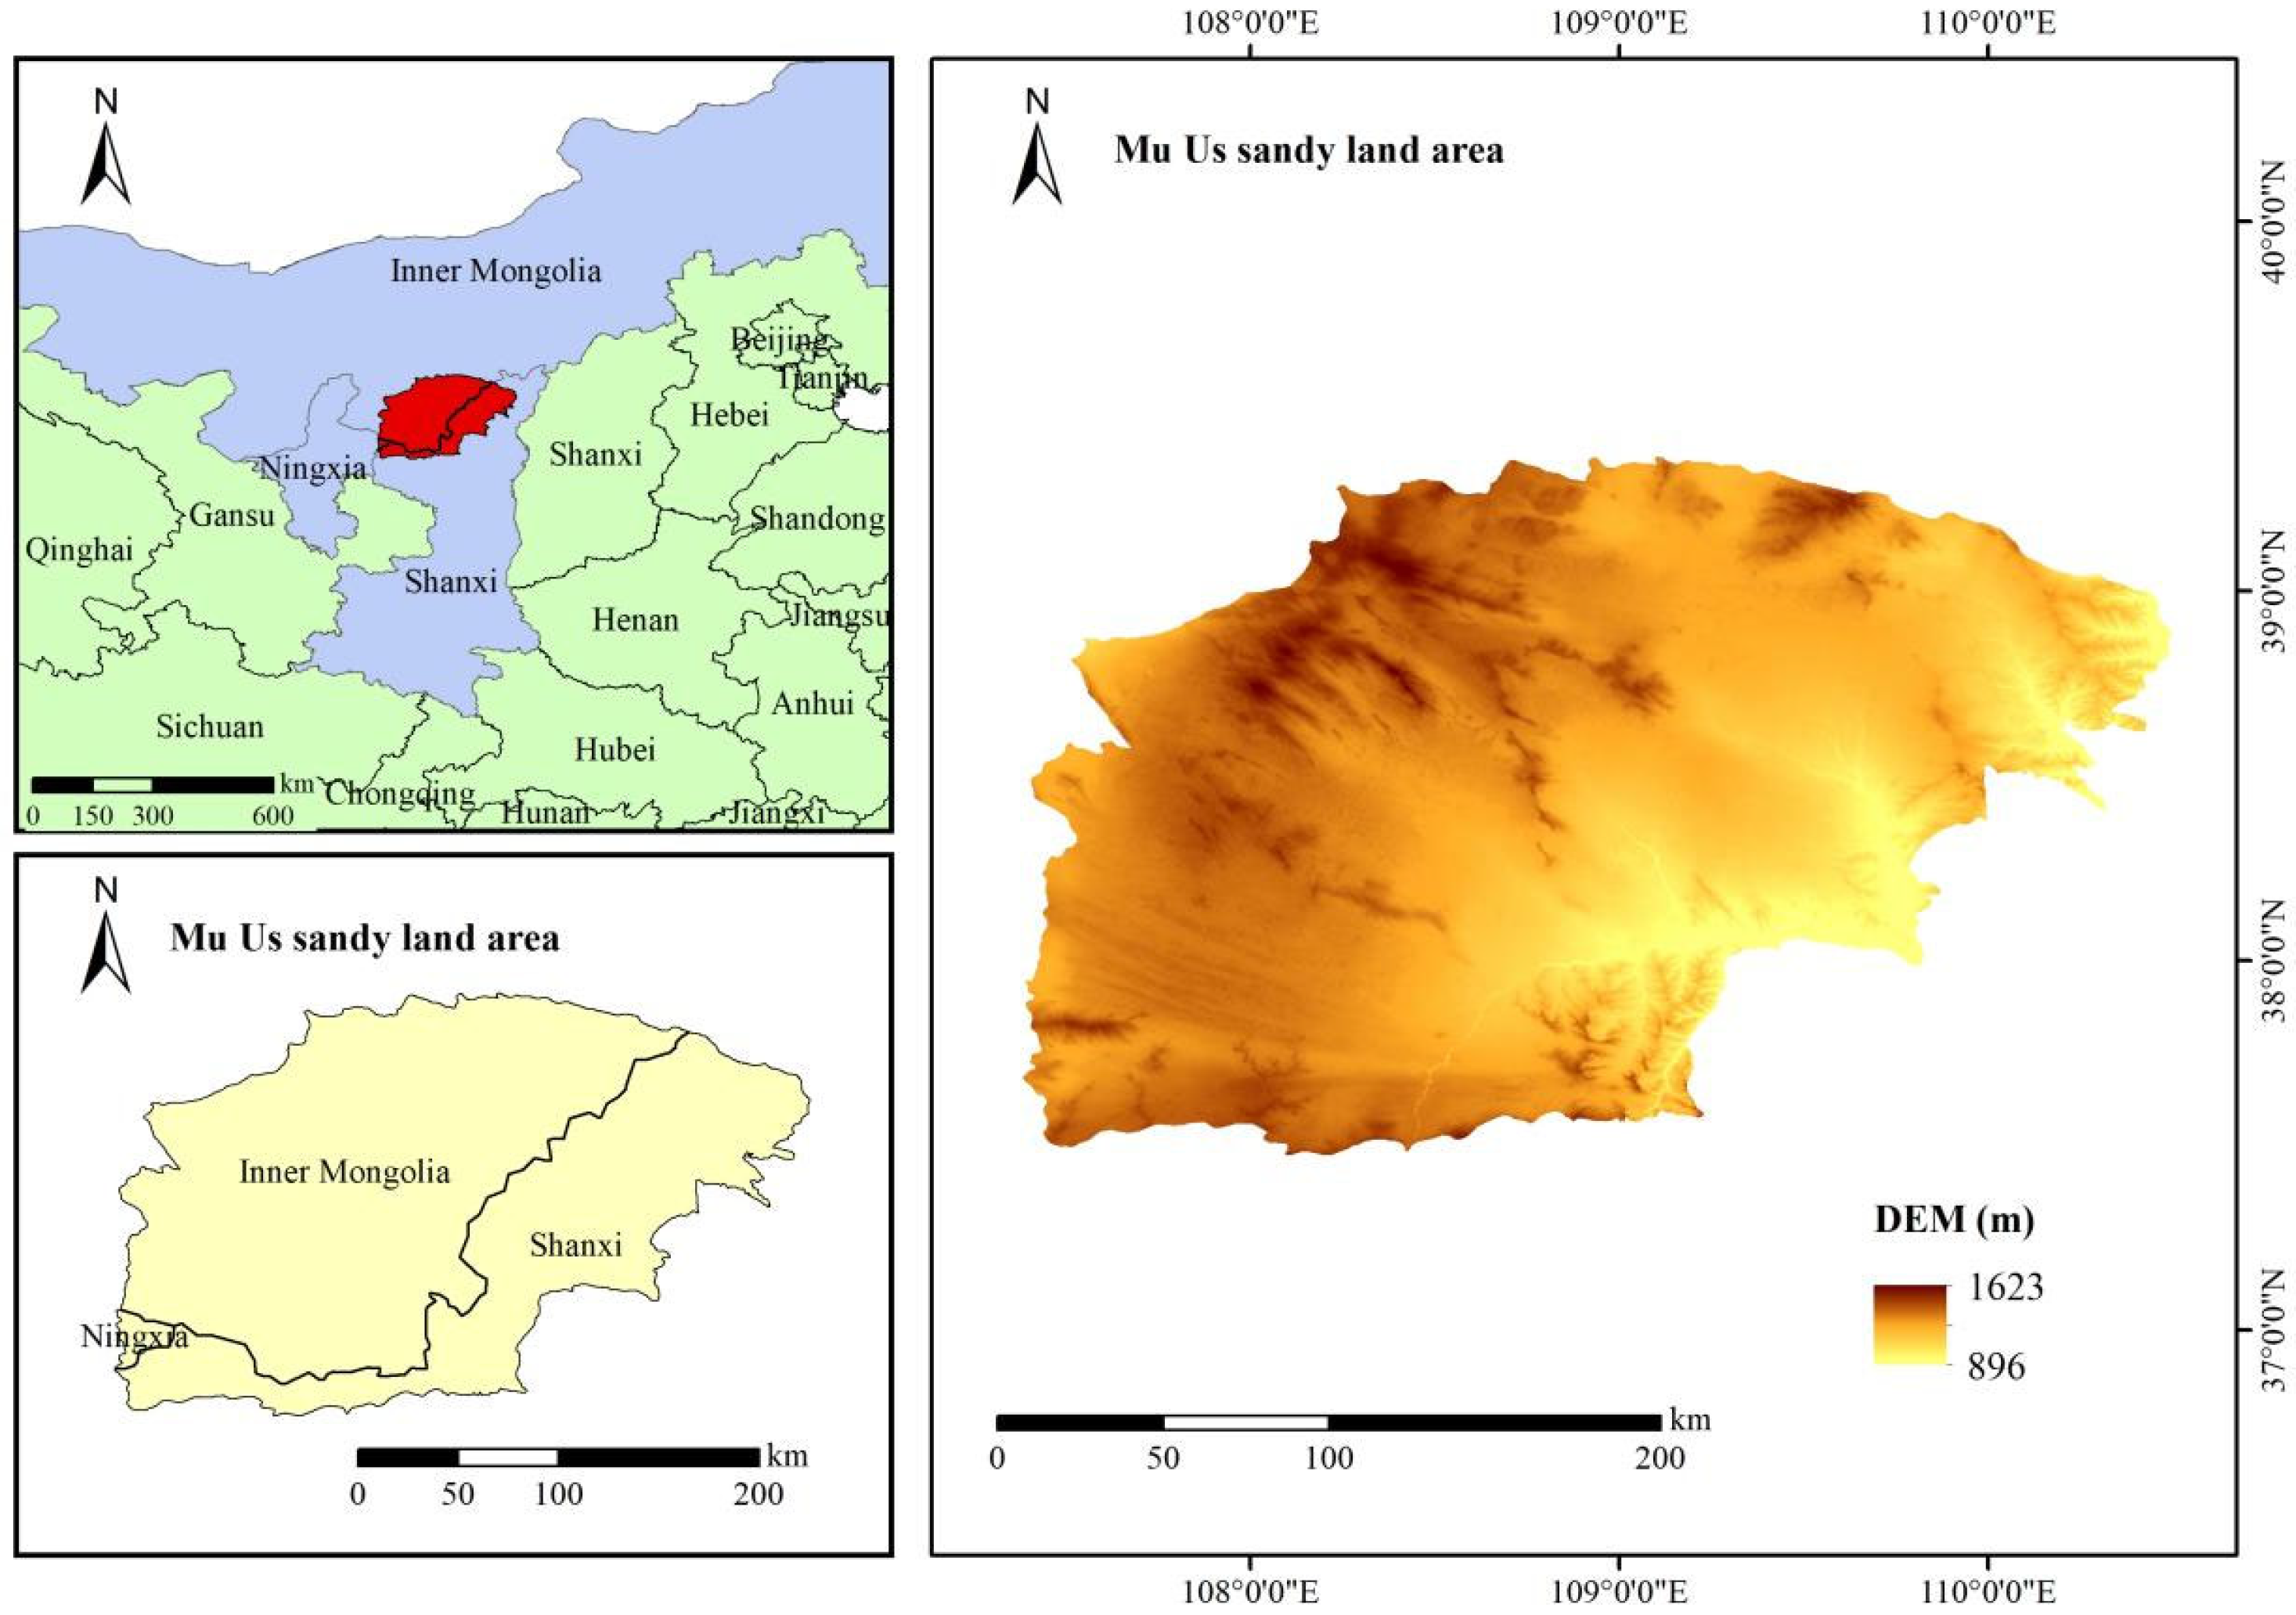
The Mu Us Sandy Land is one of the four major sand lands in China. It is located at the junction of Inner Mongolia Autonomous Region, Shaanxi Province, and Ningxia Hui Autonomous Region (Figure 1), with an elevation of 718~2148 m. The climate in the study area is a continental semiarid climate, with northwest winds as the main ones in spring and winters and southeasterly winds as the main ones in summer [20]. The annual precipitation is 200~490 mm, decreasing from southeast to northwest, 60~80% of the precipitation occurs in summer, with an average annual precipitation of 292.0 mm (1981–2020) [21]. The temperature in the years is 7.4~9.0 °C, the annual average temperature is 8.1 °C (1954–2014), the temperature difference between winter and summer is 28 °C, and the temperature difference between day and night is 20 °C [22]. The relative humidity of the air in the multi-year period is 46.0~60.4%, and the average annual relative humidity of the air is 52.7% (1981–2015) [23]; the annual potential evapotranspiration is reported as 1800–2500 mm [24], with a multi-year average of 2266 mm (1985–2008) [25]. The calculated annual potential evapotranspiration range of 861–1146 mm in this study is significantly lower than the broad literature estimates of 1800–2500 mm. This difference is primarily attributed to the use of the Penman–Monteith algorithm, which accounts for canopy resistance and specific humidity, compared to the temperature-based or pan-evaporation methods often cited in older regional literature. In contrast, the potential evapotranspiration computed in this study using the modified Penman–Monteith method ranges from approximately 861 to 1146 mm/a during 2001–2023. The soil nutrient content is low, and the wild and sandy soil is the most widely distributed. The remaining soil types include chestnut calcium soil, brown calcium soil, meadow soil and saline-alkali soil [26]. Overall, vegetation cover gradually improves from northwest to southeast, with the main vegetation types including desert steppe, typical steppe, and sandy shrubland. The spatial differentiation of these underlying surface conditions (soil and vegetation) provides an important background environment for the spatial heterogeneity of net primary productivity (NPP) of vegetation in this region.

2.2. Data Source and Preprocessing

In this study, vegetation NPP data were obtained from NASA Earth Science Data website (NASA-EARTHDATA) (https://lpdaac.usgs.gov/products/mod17a3hgfv061/ (accessed on 20 November 2025)), with units of gC/m2/a and a spatial resolution of 500 m. This dataset has been widely used in different regions and the results are reliable [27,28]. Average temperature, precipitation, and potential evapotranspiration data were obtained from the National Tibetan Plateau Scientific Data Center (http://data.tpdc.ac.cn (accessed on 25 November 2025)). This dataset was generated based on observational data from 756 meteorological stations of the China Meteorological Administration, using topographic correction and spatial interpolation methods, with a spatial resolution of 1 km × 1 km. Data quality assessment showed that, compared with station observations, the average correlation coefficient for daily precipitation data was 0.89, with an RMSE of 2.36 mm; the average correlation coefficient for daily average temperature was 0.96, with an RMSE of 1.32 °C. Potential evapotranspiration was calculated using a modified Penman–Monteith method.
To unify the spatiotemporal scale, ArcGIS 10.8 and MATLAB R2024a were used to perform batch processing on the above raster data, including format conversion, bilinear interpolation resampling, and projection clipping, to obtain long-term time series data for the Mu Us Sandy Land region from 2001 to 2023, with a resolution of 1 km. MODIS MOD17A3HGF NPP data has been converted using the officially provided scaling factor (0.0001) prior to use, and invalid and low-quality pixels are filtered out through the Quality Assessment (QA) layer. We utilized the MOD17A3HGF NPP product. While known to potentially underestimate NPP in extremely sparse canopies due to algorithmic constraints, its global validation and high spatial resolution (500 m) make it the most suitable dataset for capturing regional gradients in the Mu Us, especially after rigorous QA/QC filtering.

2.3. Research Methods

While the combined use of Theil–Sen slope estimation and the Mann–Kendall test is widely applied to trend analysis of long-term ecological data, it is important to note that these methods primarily reveal statistical relationships between variables, rather than strict causal relationships. Furthermore, simple linear correlation analysis may not fully capture the nonlinear responses and lag effects between climate variables and NPP. This study primarily focuses on contemporaneous responses; future research should consider incorporating lag analysis and nonlinear models to more comprehensively reveal these complex relationships.

2.3.1. Trend Analysis

To accurately identify the long-term trend of vegetation NPP and assess its statistical significance, this study employs a combination of Theil–Sen Median trend analysis [29] and a Mann–Kendall (M–K) nonparametric test [30]. Theil–Sen Median Method: Unlike an ordinary least square regression, which is sensitive to outliers and non-normal distributions, the Theil–Sen estimator calculates the median slope from all pairwise combinations of data points. This robustness is crucial for ecological time series data which often contain anomalies. The slope is calculated as:
s l o p e = M e d i a n x i − x j j − i
Mann–Kendall Test: The M–K test is used to determine if the trend is statistically significant without assuming a specific data distribution. The test statistic SS is defined as:
S = ∑ i = 1 n − 1 ∑ j = i + 1 n sgn ( x j − x i )
sgn θ = 1 , θ > 0 0 , θ = 0 − 1 , θ < 0
Z m k = S − 1 var S S > 0 0 S = 0 S − 1 var S S < 0
var S = n ( n − 1 ) ( 2 n + 5 ) − ∑ i = 1 n t i ( i − 1 ) ( 2 i + 5 ) 18
Trend-Free Pre-Whitening (TFPW): (Detail added per Reviewer’s request) Since climate and vegetation time series often exhibit significant serial correlation (autocorrelation), which can inflate the significance levels in M–K tests, we applied the TFPW method. This process involves: Detrending the original time series using the Theil–Sen slope. Calculating the lag-1 autocorrelation coefficient of the residuals. Removing the autocorrelation by pre-whitening the residuals. Re-adding the trend to obtain the final de-noised series.
Only after this rigorous autocorrelation removal was the M–K test performed to ensure the validity of the trend significance.

2.3.2. Stability Analysis

To assess the ability of vegetation ecosystems to resist external disturbances and the potential risk of secondary desertification, this study used the coefficient of variation (CV) to quantify the volatility of the NPP time series [31]. To more accurately measure interannual volatility after removing long-term trends, the NPP coefficient of variation used in this paper for stability analysis is calculated based on the detrended residual sequence.
CV is the ratio of standard deviation to mean. Its advantage is that it eliminates the influence of dimensions, facilitates spatial comparison, and can intuitively reflect relative volatility. The lower the CV value, the more stable the vegetation productivity is over time.
C V = σ N P P ¯
where CV is the vegetation NPP coefficient of variation, σ is the vegetation NPP standard deviation, and NPP is the vegetation NPP average.
CV calculated on detrended residuals (Theil–Sen slope removed).
Formula:
CVres = σres/μ × 100%.

2.3.3. Correlation Analysis of Driving Factors

To clarify the independent and synergistic effects of multiple climatic factors on NPP and address collinearity issues inherent in simple correlation analysis, we employed a combined approach of partial correlation and multiple correlation analysis.
Partial correlation analysis quantifies the “pure” relationship between a specific factor (e.g., potential evapotranspiration) and NPP while controlling for other factors (e.g., temperature and precipitation), thereby isolating independent contributions.
Multiple correlation analysis evaluates the combined explanatory power of all considered climatic factors (precipitation, temperature, and potential evapotranspiration) on NPP, revealing the overall strength of multi-factor synergy [32,33,34].
The correlation analysis calculations are shown in Formulas (7)–(9).
R x y = ∑ i = 1 n [ ( x i − x ¯ ) ( y i − y ¯ ) ] ∑ i = 1 n ( x i − x ¯ ) 2 ∑ i = 1 n ( y i − y ¯ ) 2
R y 1 ⋅ 23 = R y 1 ⋅ 2 − R y 3 ⋅ 2 R 13 ⋅ 2 ( 1 − R y 3 ⋅ 2 ) 2 ( 1 − R 13 ⋅ 2 ) 2
R y ⋅ 123 = 1 − ( 1 − R y 1 2 ) ( 1 − R y 2 ⋅ 1 2 ) ( 1 − R y 3 ⋅ 12 2 )
Partial correlation coefficients were tested using the t-test (p < 0.05), and multiple correlation coefficients were tested using the F-test (p < 0.05). Considering that performing independent statistical tests on a large number of spatial pixels would introduce multiple comparison problems, we used a false discovery rate control method to correct the p-values of all pixels. The ‘significantly relevant’ regions reported in the paper and displayed on the map are based on the corrected results. Other partial correlation and multiple correlation analyses are calculated based on outlier sequences (i.e., annual values minus the 2001–2023 averages). We note that there is an approximate independence between FDR correction hypothesis tests, and there is spatial autocorrelation in raster data. FDR correction is often considered conservative in such applications, but we acknowledge that this is a methodological limitation. While Sen’s slope and Mann–Kendall are standard, they are particularly appropriate for ecohydrological time series which are often non-normally distributed and sensitive to outliers (e.g., drought years). The partial correlation analysis was chosen specifically to disentangle the collinearity between temperature and potential evapotranspiration, a common issue in arid regions.
Partial/multiple correlations were computed on an anomaly series (annual values minus 2001–2023 mean).
Controlled variables were explicitly specified in each test.

3. Results

3.1. Spatial and Temporal Changes in Vegetation NPP

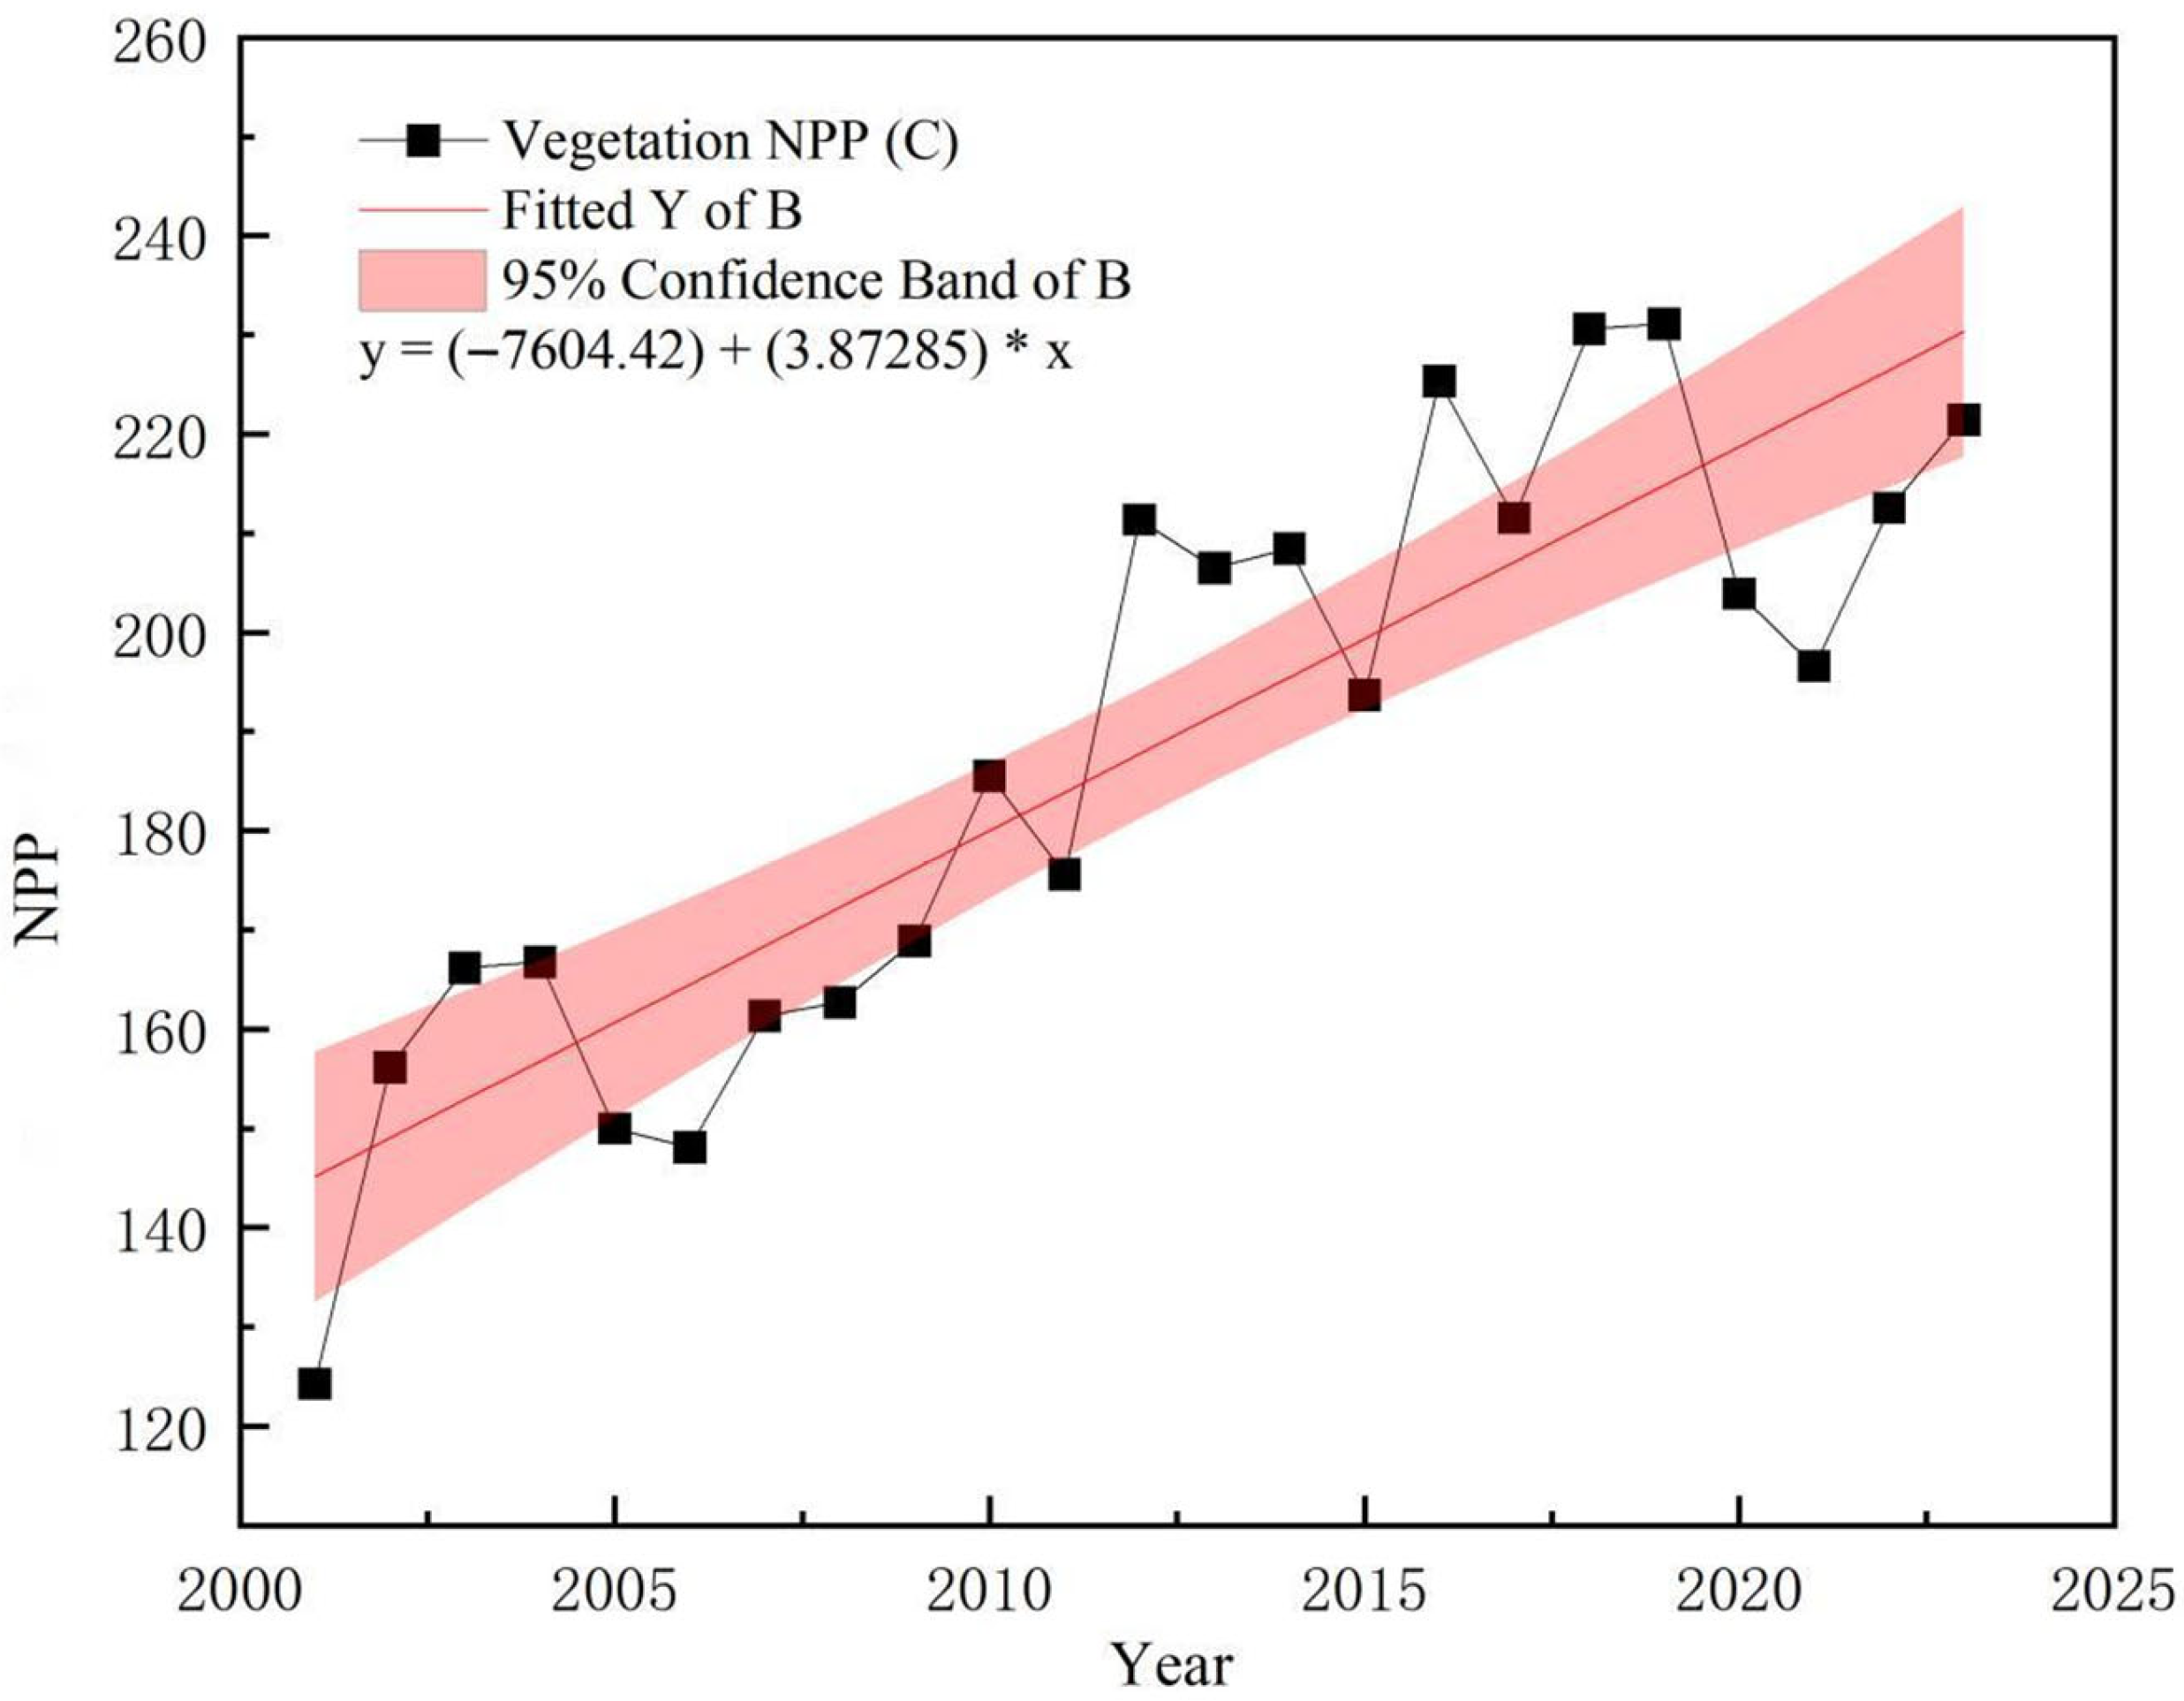
As shown in Figure 2, the net primary productivity (NPP) of Mu Us Sandy Land vegetation exhibited an overall increasing trend from 2001 to 2023, with significant interannual variability. The black square data points in the figure gradually increase with the increase in year, indicating that the NPP value is increasing year by year, marking a significant improvement in ecosystem productivity. Specifically, the annual average value of vegetation NPP increased from 124.28 g·(m−2·a)−1 in 2001 to 231.09 g·(m−2·a)−1 in 2019, with a total increase of 106.81 g·(m−2·a)−1. However, the annual average NPP in 2023 fell to 221.41 g·(m−2·a)−1, a decrease of 9.68 g·(m−2·a)−1 compared with the NPP value in 2019. Despite fluctuations, the multi-year average of NPP in Mu Us sand vegetation remained at 187.74 g·(m−2·a)−1.
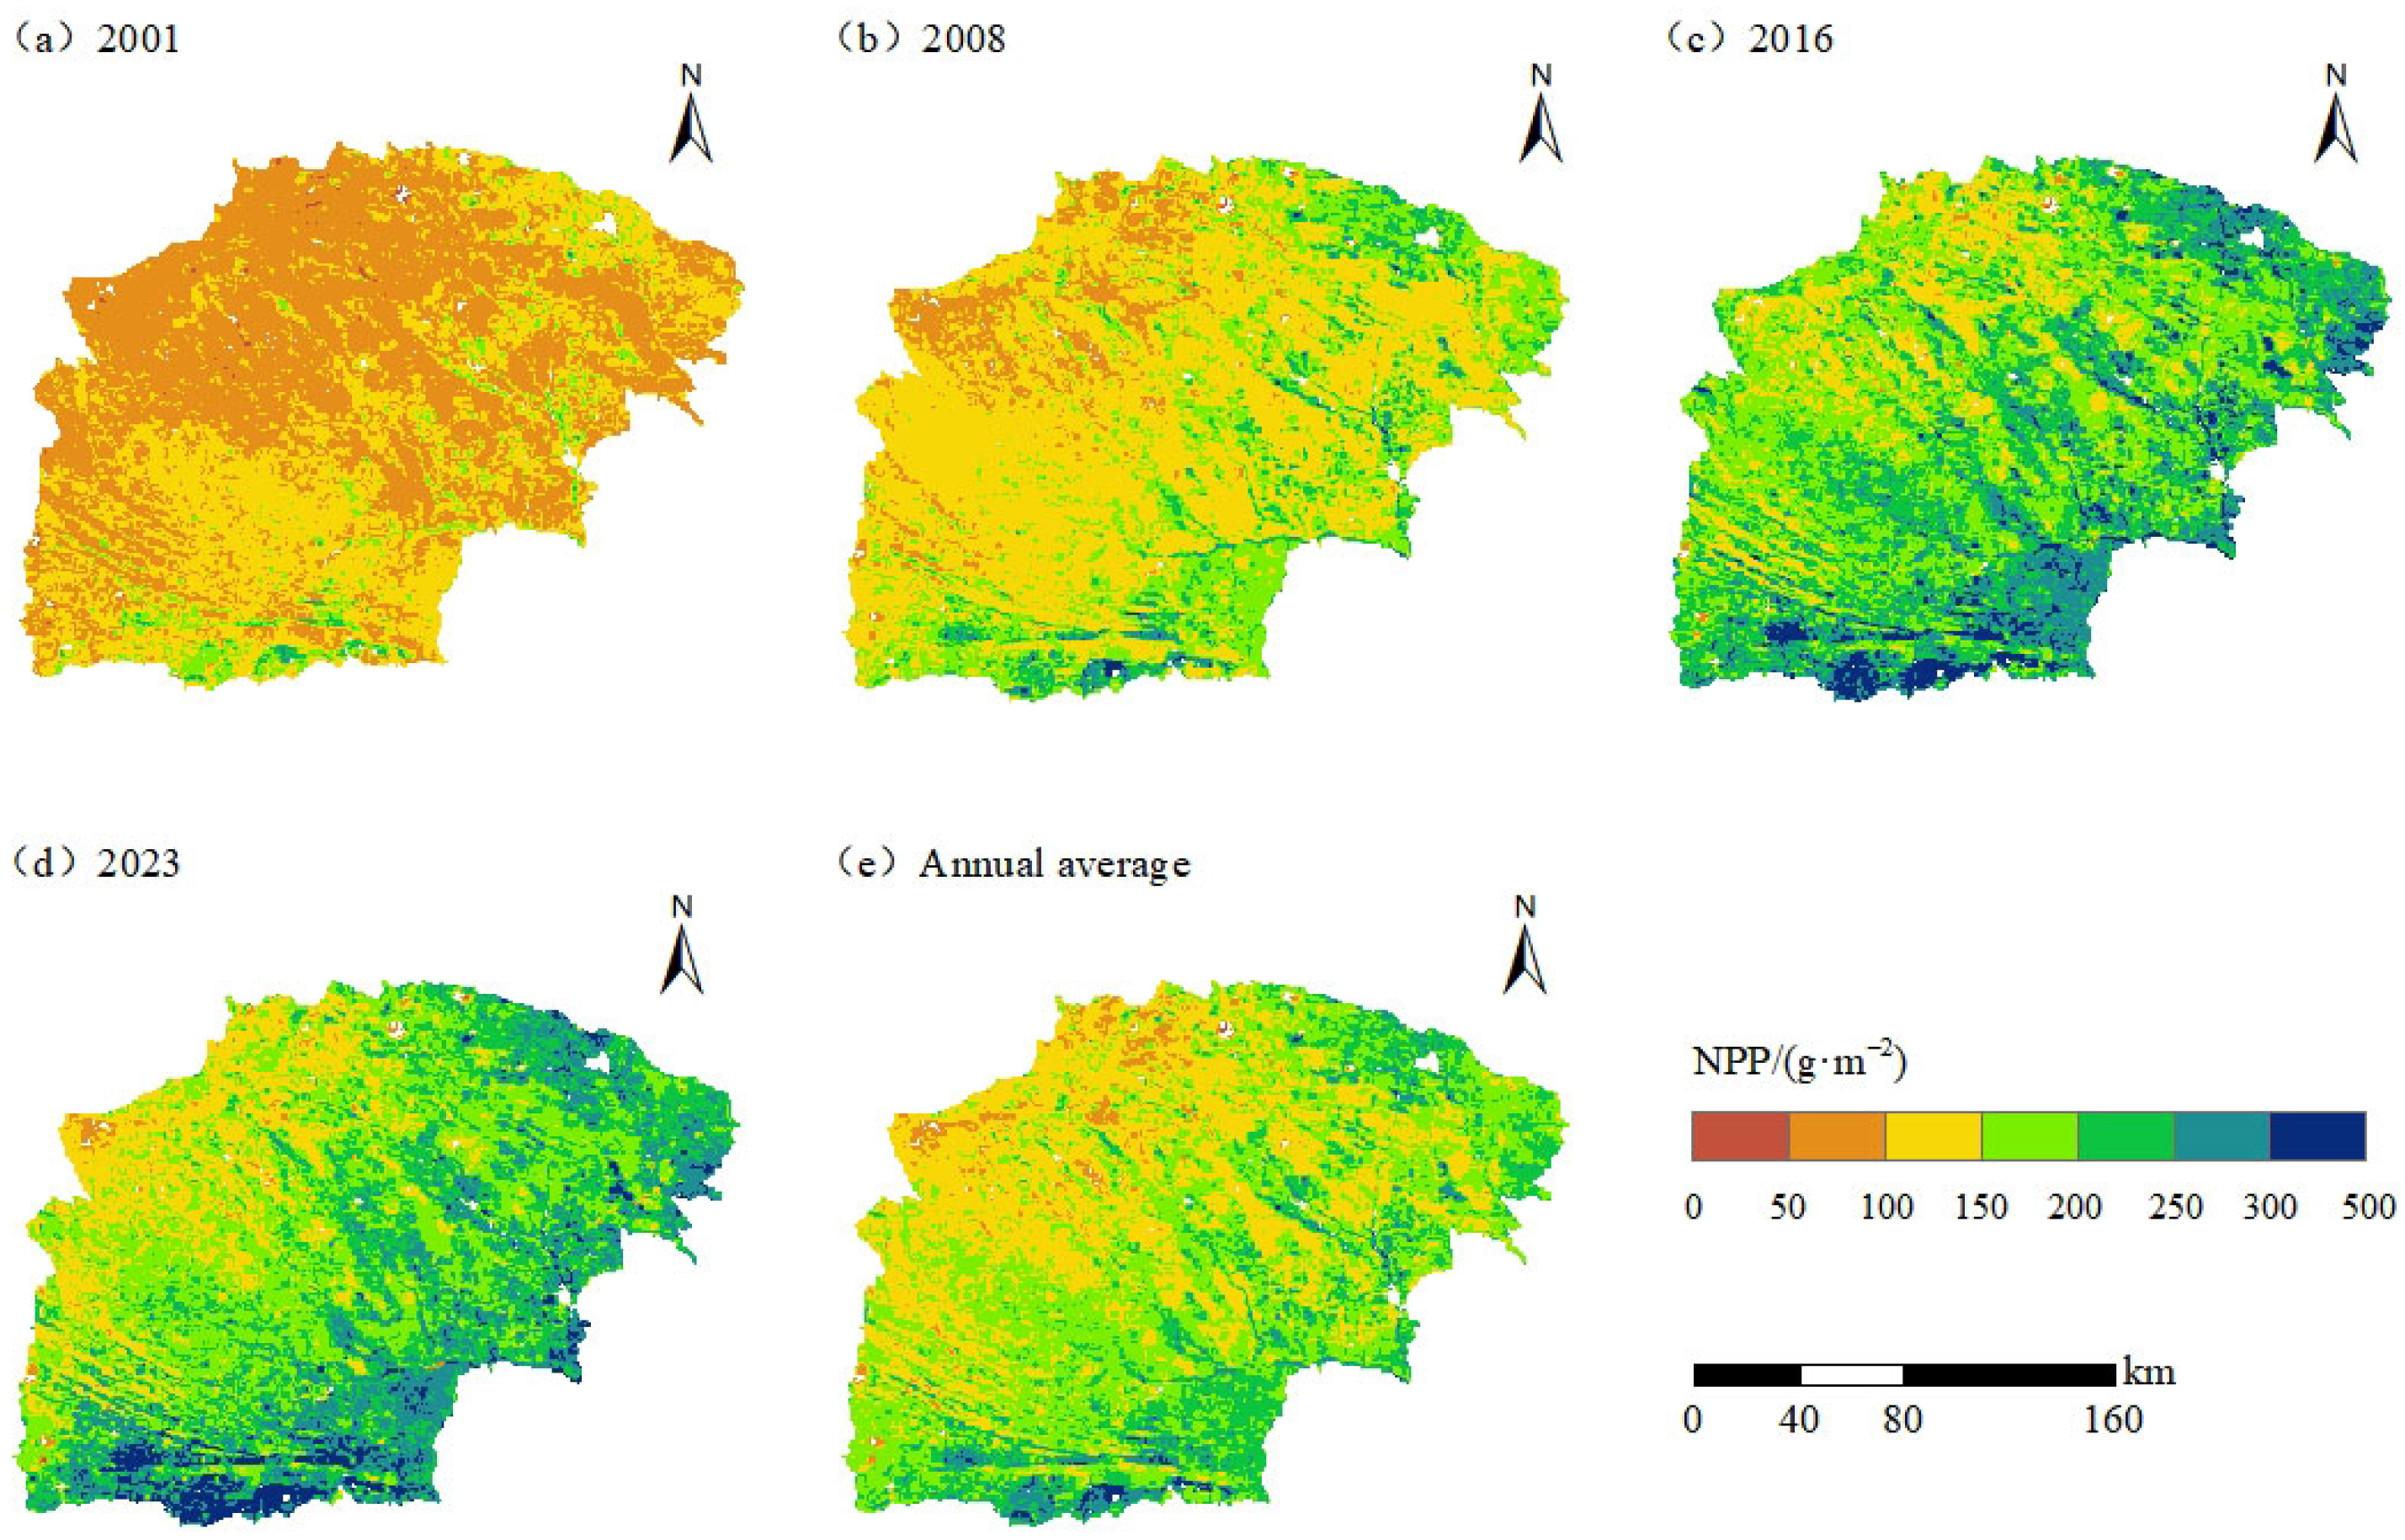
Figure 3 analyzes the differences and trends of NPP in spatial distribution in Mu Us sand, which is a distribution pattern that gradually increases from north to south. Figure 3a shows that in 2001, the average annual NPP of vegetation in Mu Us sand is 124.28 g·(m−2·a)−1; when the vegetation NPP range is 50~150 g·(m−2·a)−1, it accounts for about 94.65% of the total area. Figure 3b shows that in 2008, the average annual NPP of vegetation in Mu Us Sandy Land rose to 162.66 g·(m−2·a)−1; when the vegetation NPP value ranges from 50 to 150 g·(m−2·a)−1, it accounts for about 68.33% of the total area in the northern and central regions. Figure 3c shows: in 2016, the average annual NPP of vegetation in Mu Us sand is 225.34 g·(m−2·a)−1; when the vegetation NPP value ranges from 100~150 g·(m−2·a)−1, the areas located in the north account for about 14.79% of the total area; when the vegetation NPP value ranges from 200~250 g·(m−2·a)−1, the areas located in the northwest and central areas account for about 35.9% of the total area. Figure 3d shows: in 2023, the average annual NPP of vegetation in Mu Us sand is 221.41 g·(m−2·a)−1; when the vegetation NPP value ranges from 150~200 g·(m−2·a)−1, the areas located in the south account for about 34.32% of the total area; when the vegetation NPP value ranges from 200~400 g·(m−2·a)−1, it is located in the south and eastern regions, accounting for about 46.33% of the total area. Figure 3e shows that the average annual change in vegetation NPP in the northern Mu Us Sandy Land is 0~150 g·(m−2·a)−1, accounting for about 39.50% of the total area; the average annual change in vegetation NPP in the central region is 150~200 g·(m−2·a)−1, accounting for about 39.93% of the total area; the average annual change in vegetation NPP in the southern and southeastern regions is 200~400 g·(m−2·a)−1, accounting for about 20.57% of the total area.
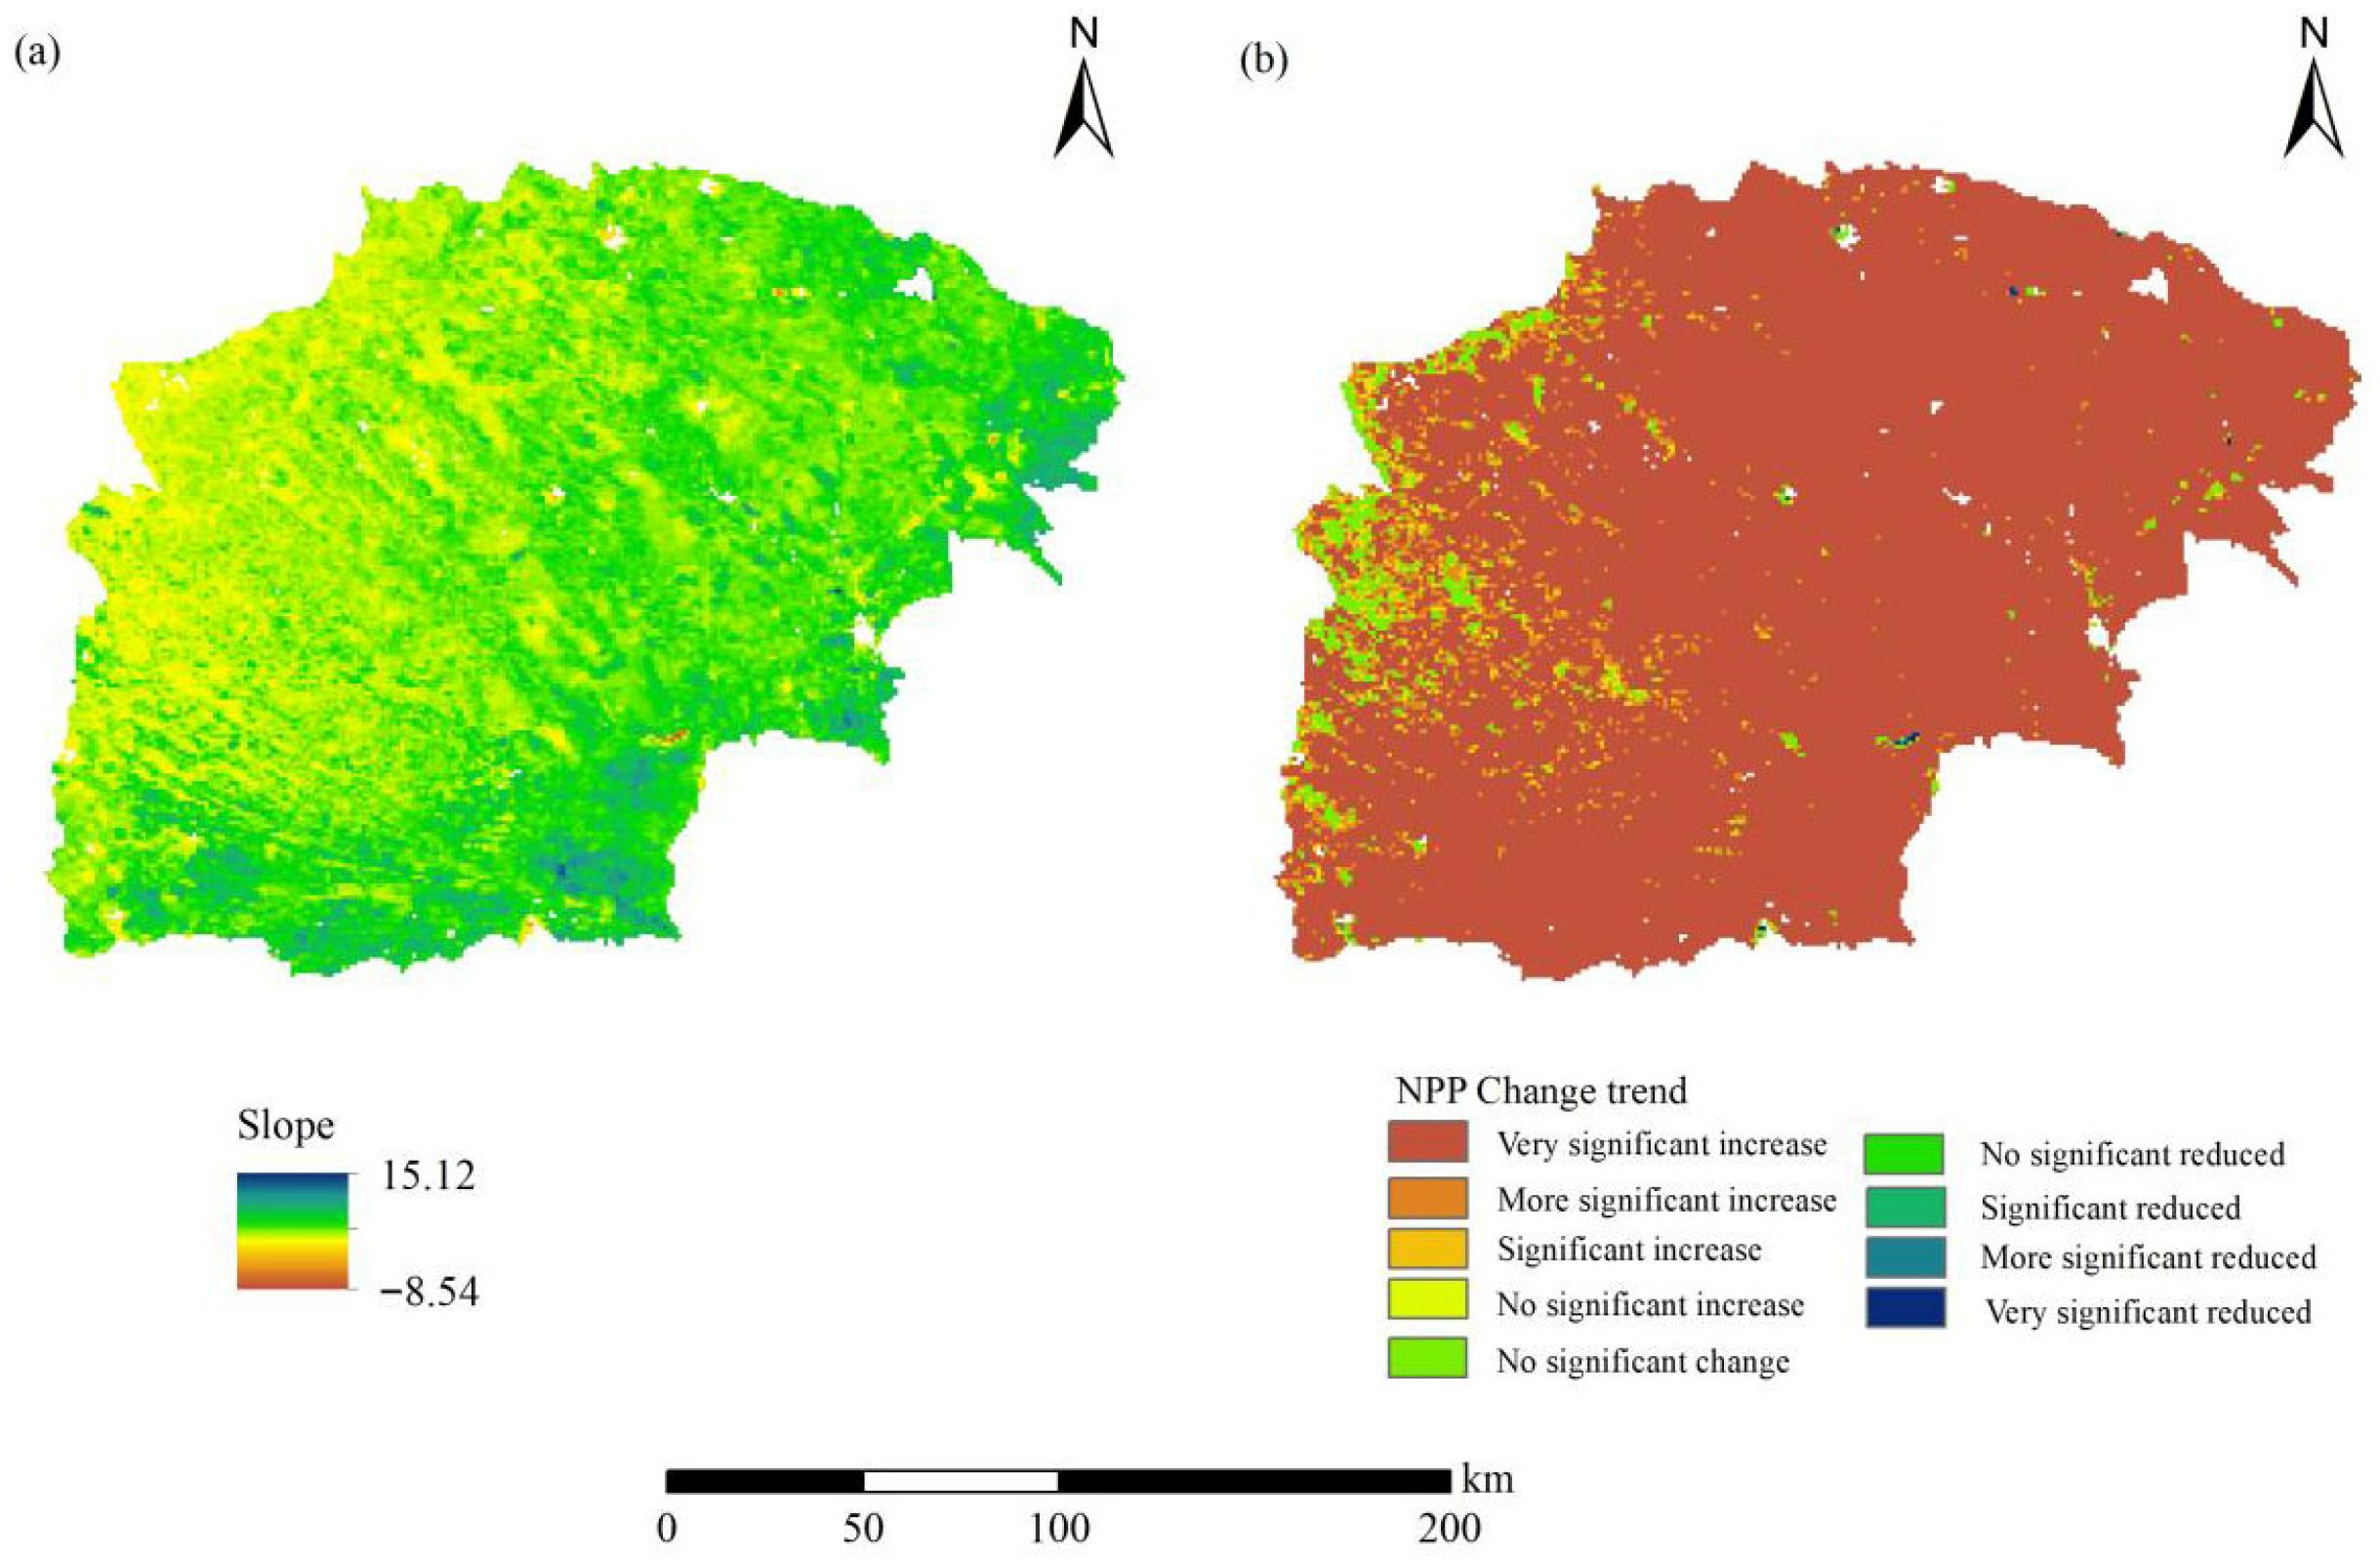
As shown in Figure 4a, the linear trend rate of NPP in Mu Us sand vegetation is between −8.54 and 15.12 g·(m−2·a)−1. Theil–Sen Median slope estimation combined with the Mann–Kendall test was used to calculate the NPP of Mu Us sand 2001–2023, and the significance of the NPP change trend of Mu Us sand vegetation was tested and the study was divided into nine partitions (Figure 4b). The partition basis is shown in Table 1 for details. The calculation results show that the NPP in Mu Us sand is mainly showing a growth trend and shows a spatial difference of “fast in the east and slow in the west”: 98.53% of the areas in Mu Us sand are showing an upward trend, while the areas with a downward trend account for only 1.47%. Among them, areas with extremely significant (p < 0.01) increase and significant increase (p < 0.05) account for the vast majority of the total area, about 36,441.09 km2; this shows that vegetation restoration and vegetation growth in these areas are stable, and have good vegetation growth conditions, and have strong resistance to sand encroachment. Vegetation NPP showed a very significant decrease (p < 0.01) and a significant decrease (p < 0.05). The area was located in the eastern and central Mu Us Sandy Land, accounting for about 0.053% of the total area. While the M–K test indicated statistical significance in 98.53% of pixels, the magnitude of change (Sen’s slope) varied. Areas with low-magnitude but significant trends were primarily located in the hyper-arid western margin, suggesting that while statistically detectable, the ecological shift in these zones is currently minimal.

3.2. Analysis of NPP Stability in Vegetation

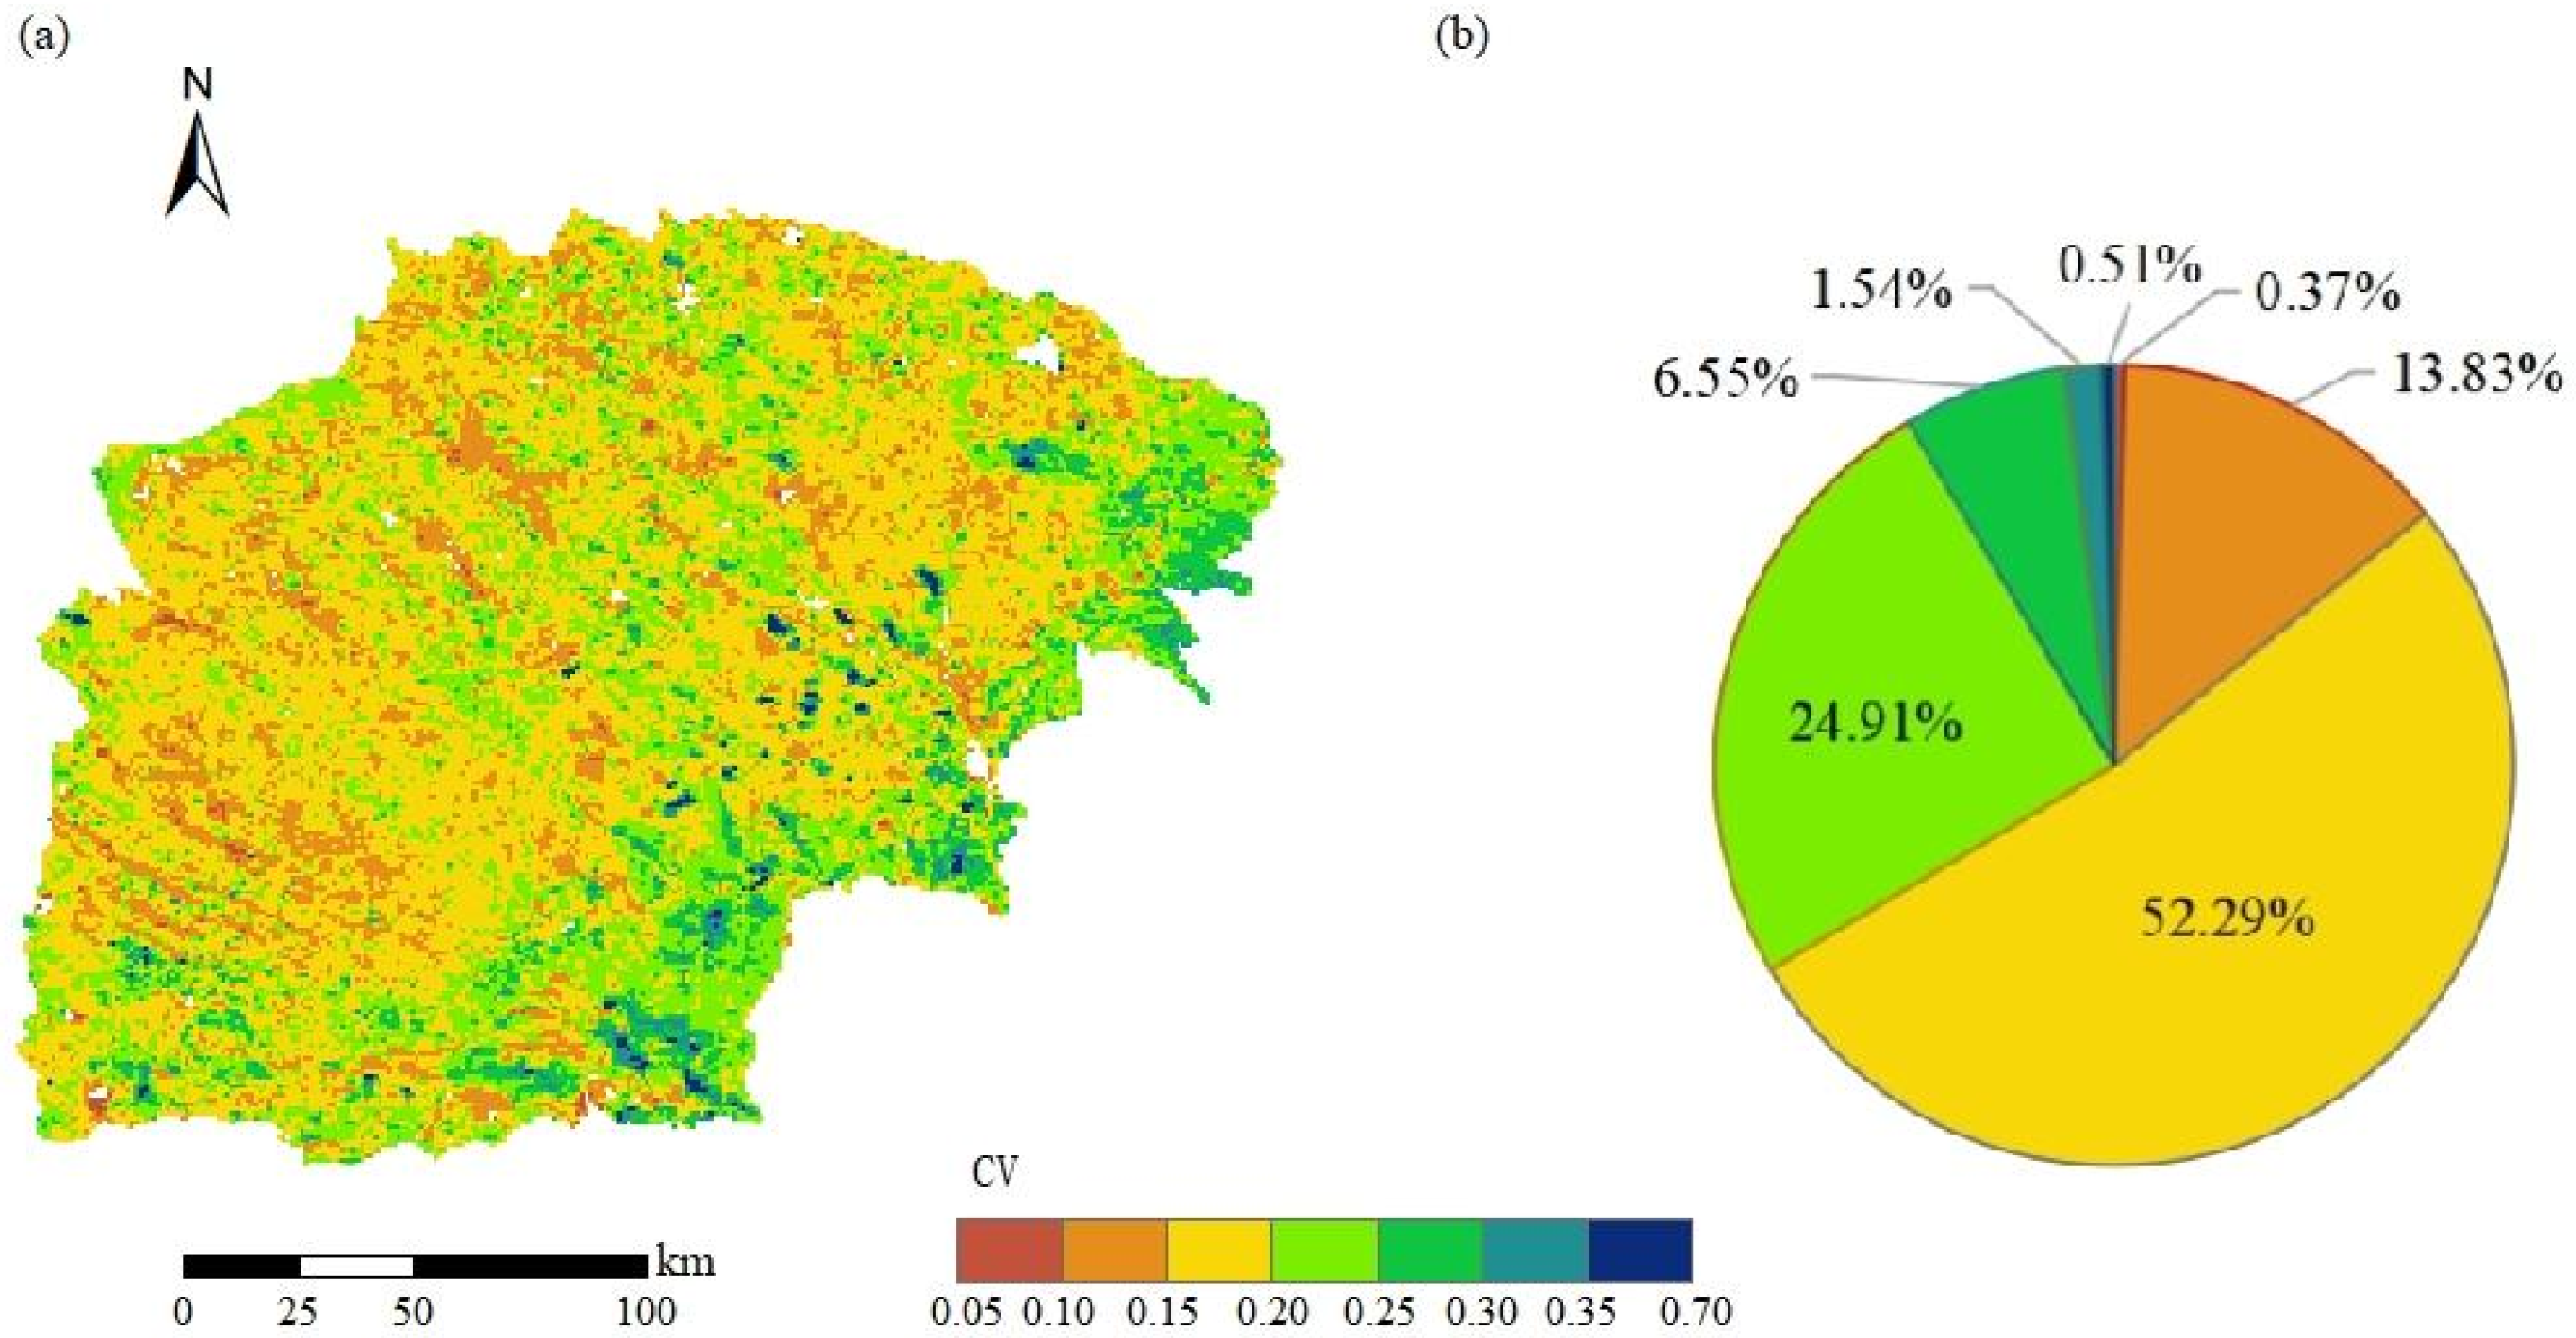
The temporal stability of vegetation NPP is closely related to the ability of vegetation ecosystems to resist external interference. If the time stability of vegetation NPP is poor, the higher the risk of secondary desertification. Figure 5 shows that the coefficient of variation value of NPP in Mu Us sand vegetation from 2001 to 2023 was 0.05~0.70, and the average was 0.19. The overall volatility of vegetation in this study area was relatively low, and the vegetation conditions were relatively stable. When the CV value of NPP in Mu Us sand vegetation is in the range of 0.05~0.30, it accounts for about 97.96% of the total area, and the CV index in this area is generally less than 0.30. The vegetation in this area has little fluctuation over time and is low in degree of external influence. The vegetation state has high stability and can resist the invasion of foreign adverse factors. When the CV of vegetation NPP in the central and northwest areas of the study area is between 0.20 and 0.25, it accounts for about 24.91% of the total area, about 9484.12 km2, indicating that the vegetation in this area has little fluctuation over time and the vegetation recovery is relatively stable. When the CV value of vegetation NPP from the southwest to the east of the study area is between 0.30 and 0.70, it accounts for about 2.05% of the total area, about 781.42 km2, with the maximum change of 0.33. Regions exhibiting a low coefficient of variation (CV) indicate high temporal stability and lower interannual variability in vegetation productivity.

3.3. Response of Vegetation NPP to Potential Evapotranspiration, Temperature and Precipitation

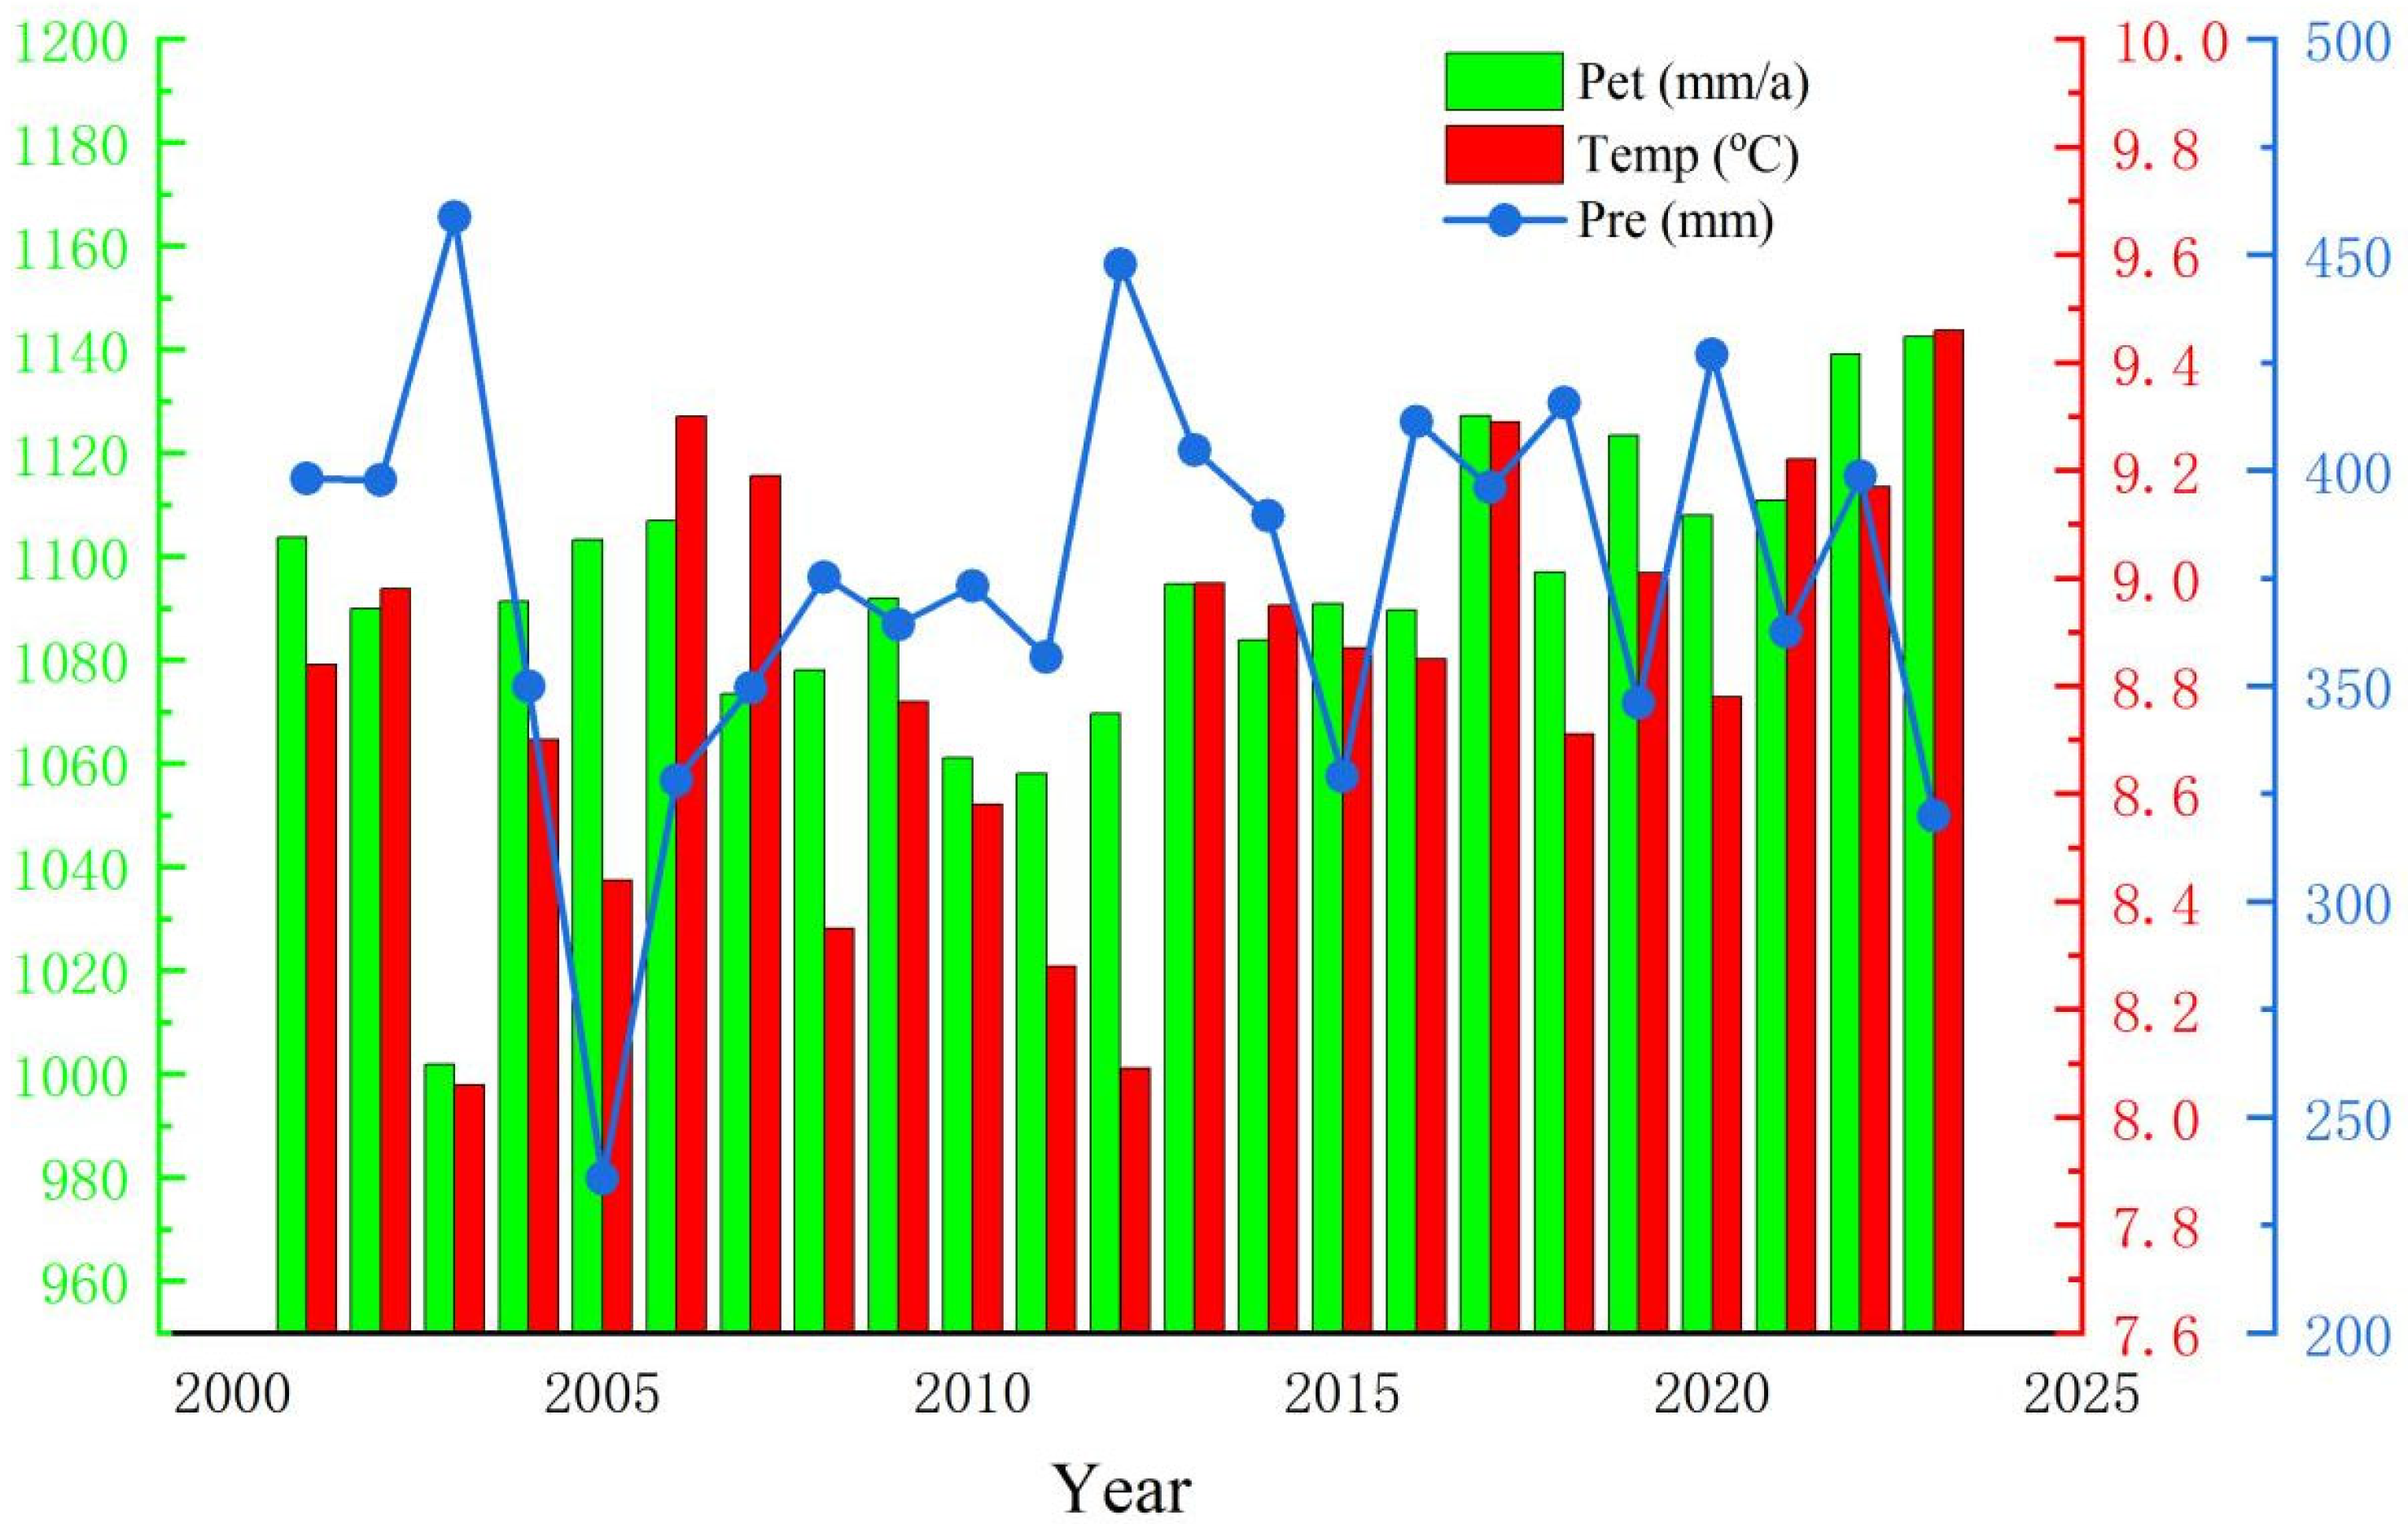
Between 2001 and 2023, the main climatic factors in the Mu Us Sandy Land exhibited a consistent spatial pattern of decreasing from southeast to northwest, and all showed significant interannual fluctuations. Under multi-year average conditions, the spatial distribution of potential evapotranspiration, temperature, and precipitation was highly coordinated, forming the basic framework of the region’s hydrothermal configuration. Among these, the interannual variability of precipitation was particularly prominent, with its fluctuation amplitude significantly greater than that of other climatic elements (Figure 6), providing a crucial climatic background for the interannual variation in vegetation productivity. Overall, the climate of the study area is characterized by water scarcity and significant fluctuations, and abundant energy but high evapotranspiration potential. This combination of hydrothermal factors constitutes a complex background for influencing vegetation growth.
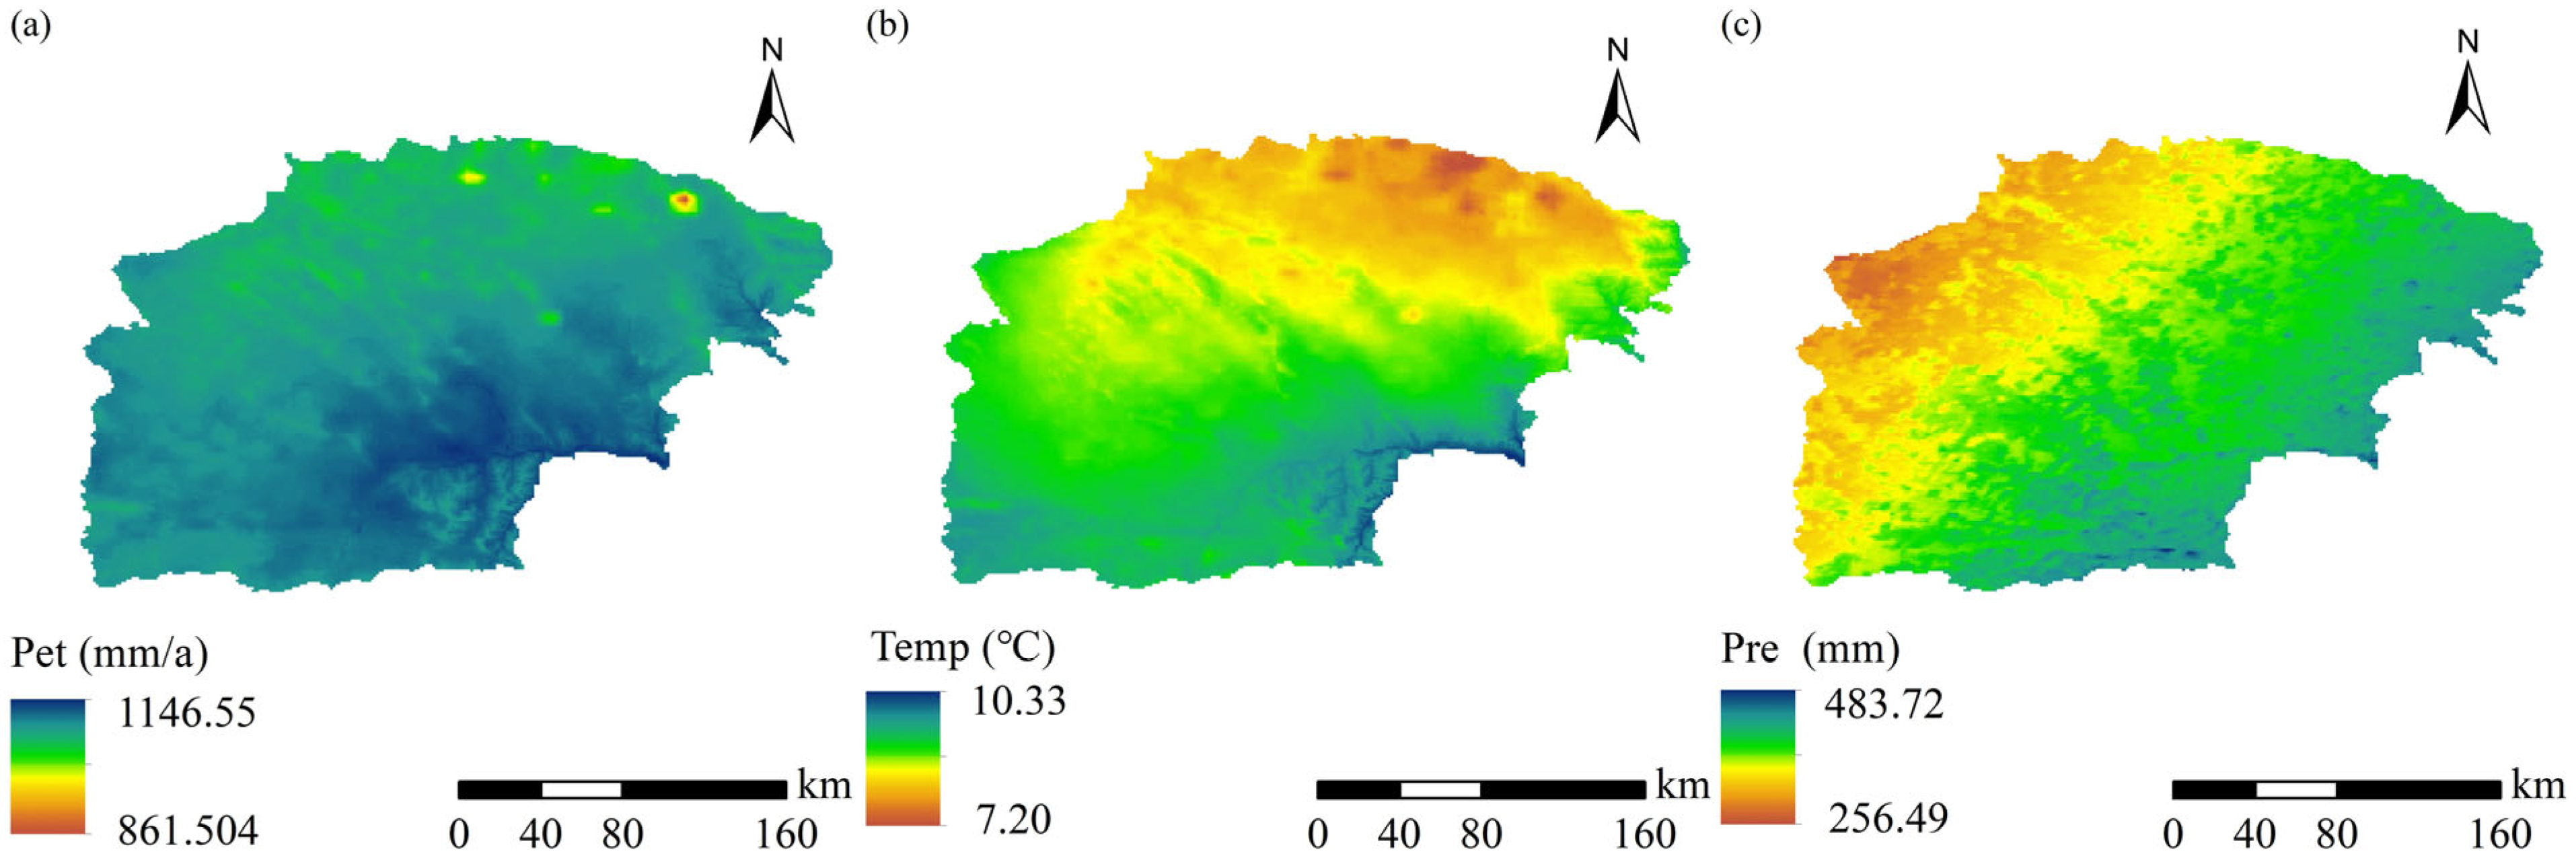
From 2001 to 2023, the annual average potential evapotranspiration of Mu Us sand showed a higher potential evapotranspiration in the entire region, with the values in most areas above 1000 mm/year. The potential evapotranspiration amount showed a significant spatial difference in the Mu Us region, and the overall trend was to decrease from southeast to northwest (Figure 7a). Numerically, the high value is 1146.55 mm/a and the low value is 861.504 mm/a. The potential evapotranspiration capacity within the study area is significant. The central and northern parts of the country are affected by solar radiation and wind, and the water dispersion potential is greater. The average annual temperature of Mu Us Sandy Land from 2001 to 2023 was higher overall. The average annual temperature in the study area ranges from 7.20 °C to 10.33 °C, with an average of 8.76 °C, and generally shows a decreasing spatial pattern from southeast to northwest. The overall temperature showed a decreasing trend from south to north. The temperature in the southern region was relatively high (Figure 7b), the highest temperature was 10.33 °C, and the lowest temperature was 7.20 °C. The higher temperature in the south may be conducive to vegetation growth, but may also aggravate water evaporation and increase drought risk. The temperature in the north is low, which may limit the length of the vegetation season. The average annual precipitation in Mu Us sand from 2001 to 2023 was generally low, with most areas below 400 mm, and the overall precipitation showed a decreasing trend from southeast to northwest, which was basically consistent with the spatial distribution trend of potential evapotranspiration and temperature (Figure 7c). The annual precipitation is the highest at 483.72 mm and the lowest is 256.49 mm. The precipitation space is unevenly distributed in the study area. The south or edge may be affected by the terrain (such as windward slopes) and atmospheric circulation, and precipitation is more abundant. More precipitation in the southeast is conducive to vegetation restoration and ecosystem stability, while less precipitation in the northwest is, with higher drought risk and stronger ecological fragility.
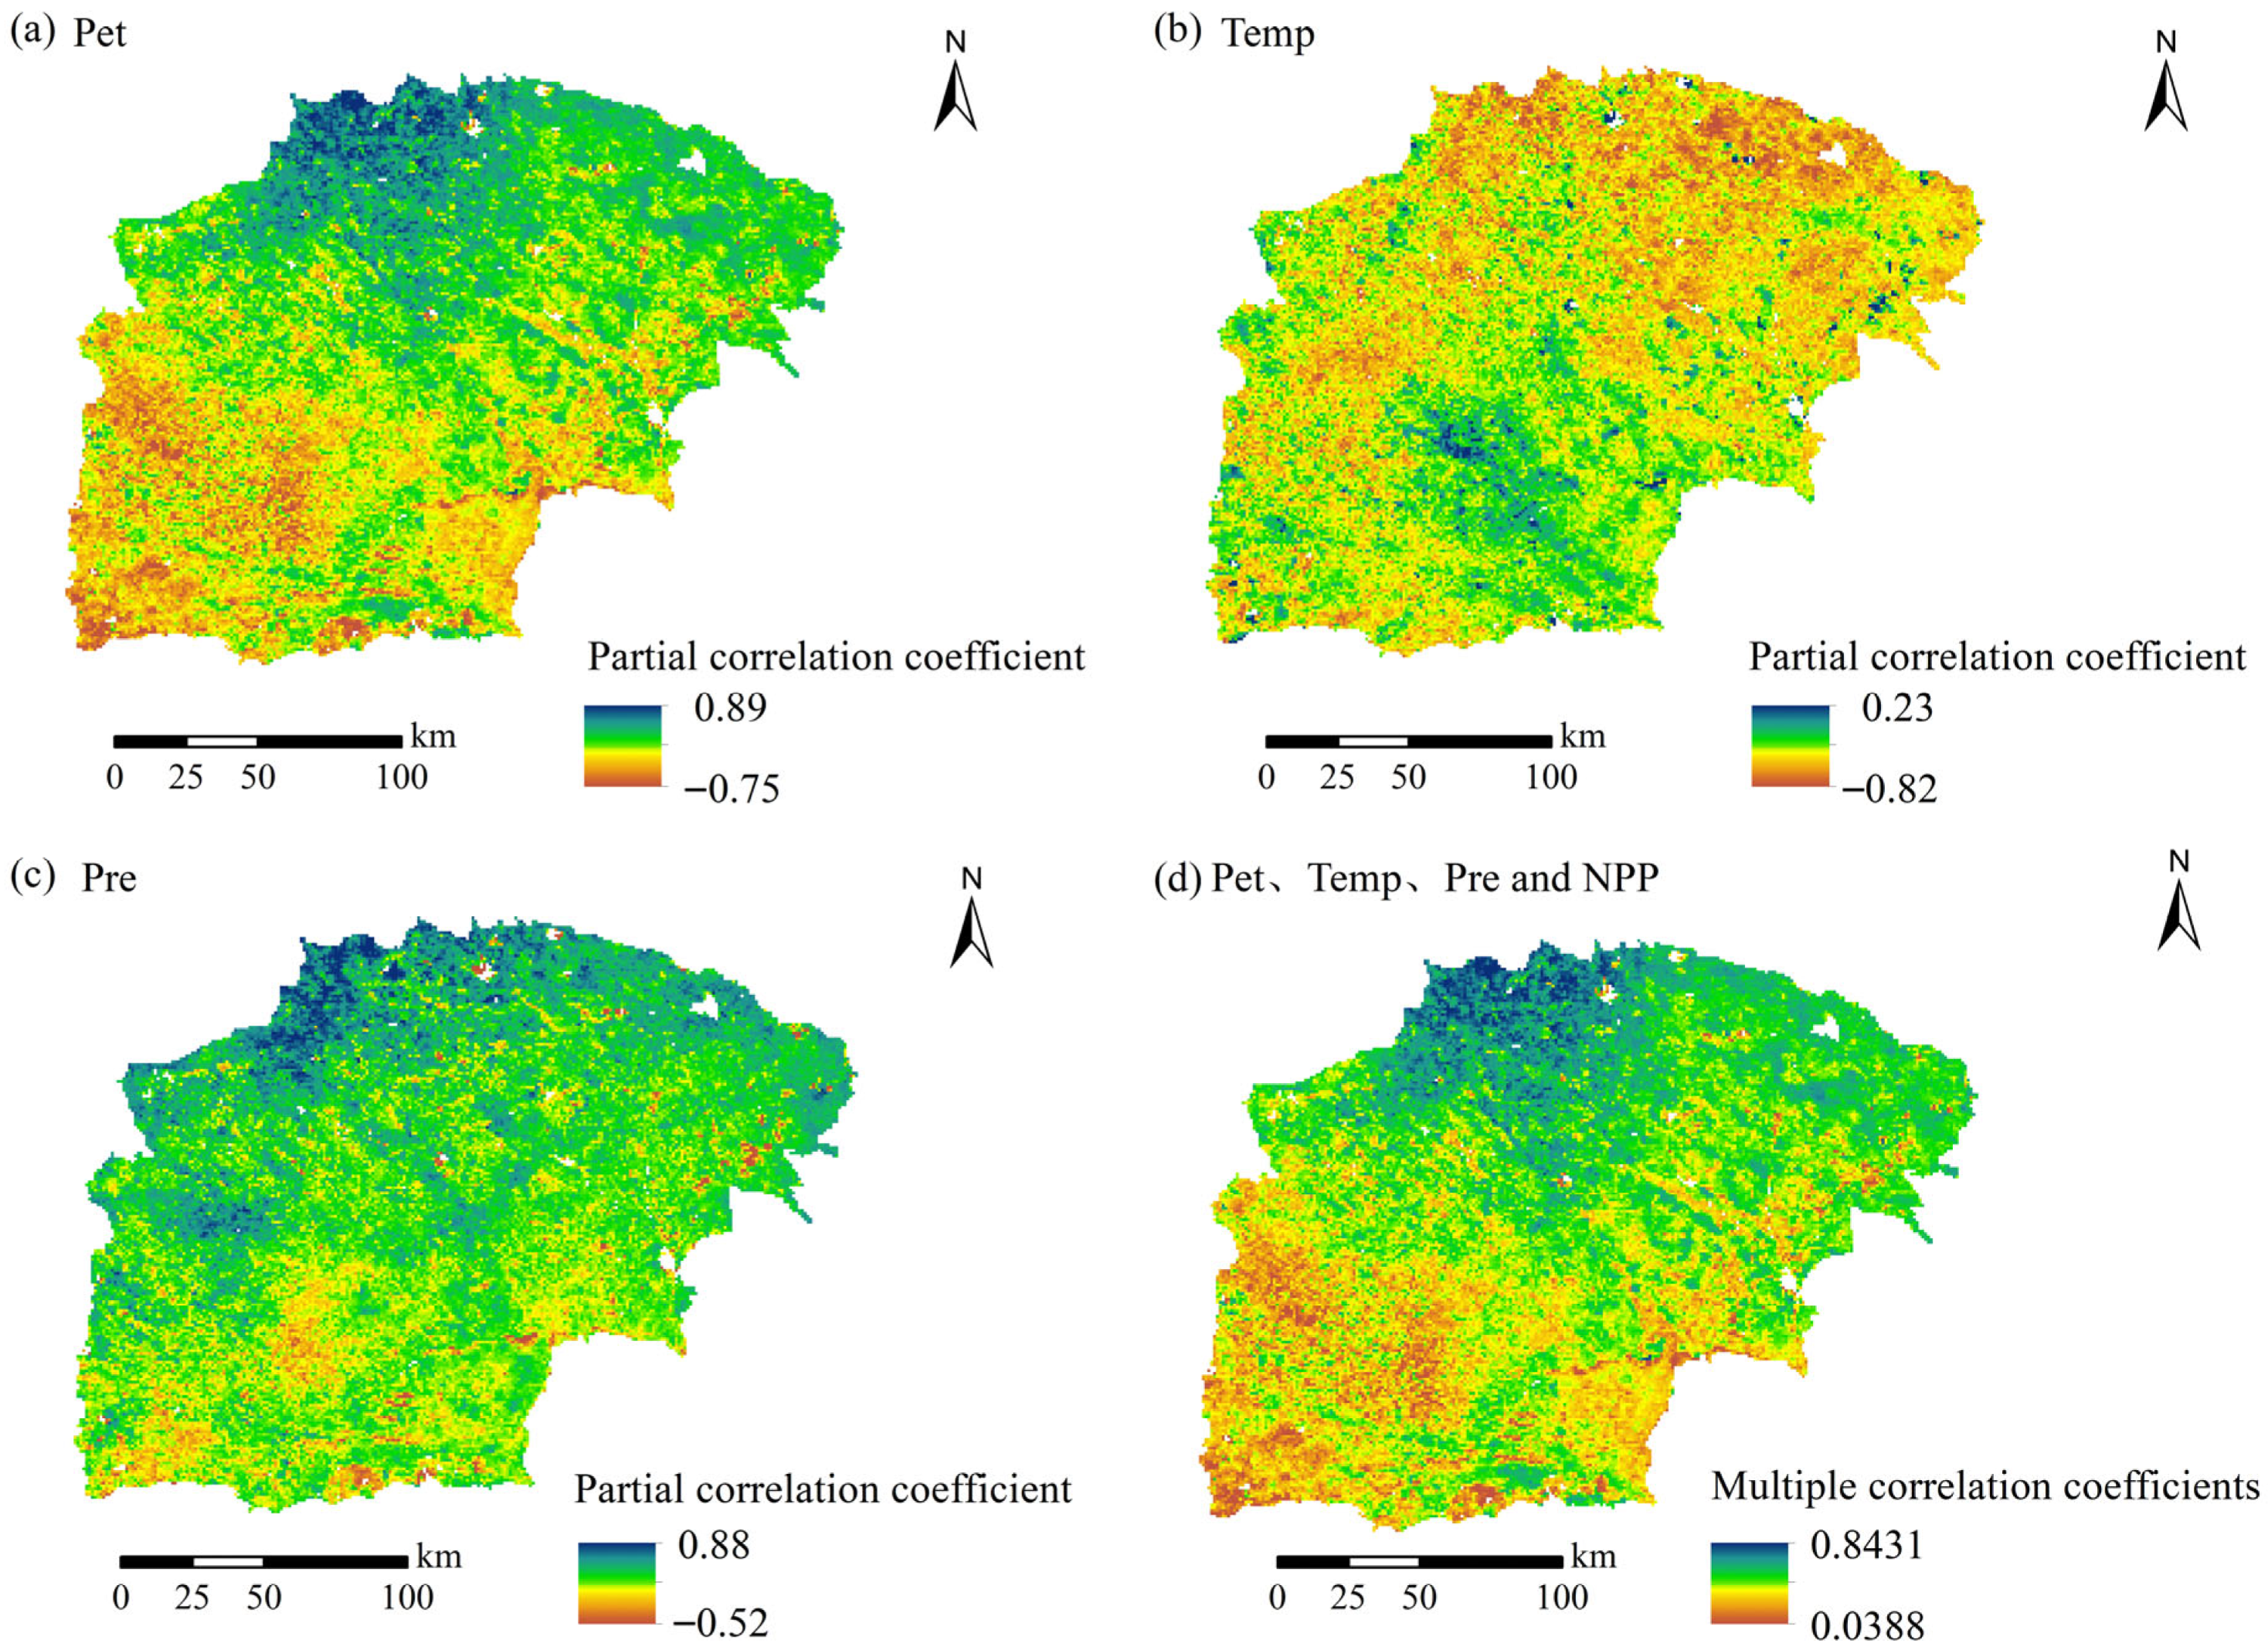
The partial correlation coefficients of vegetation NPP and potential evapotranspiration in the Mu Us Sandy Land area were between −0.75 and 0.89, showing obvious spatial heterogeneity, mainly showing a positive correlation trend (Figure 8a). NPP is positively correlated with potential evapotranspiration, especially in the central and northern regions, indicating that NPP increases with the increase in potential evapotranspiration, which may promote the improvement of vegetation NPP, which responds relatively largely to potential evapotranspiration. In the southern and eastern parts, NPP is shown to be negatively correlated with potential evapotranspiration. The increase in potential evapotranspiration may lead to water deficiency and inhibit vegetation growth. Vegetation NPP has a relatively small response to potential evapotranspiration. The partial correlation coefficients of vegetation NPP and temperature in Mu Us Sandy Land area ranged from −0.82 to 0.23, and the overall promotion effect was weaker than inhibition (Figure 8b). Some areas in the central and northern regions showed weak positive correlation, while most areas in the southern and eastern regions showed negative correlation, reflecting that the impact of temperature on NPP is mostly negative or weak positive. It may be due to the drought of the Mu Us climate that the increase in temperature aggravates evaporation and increases water stress and inhibits vegetation growth after exceeding a certain threshold. Only a few areas with good water and heat matching have weak promotion. From the overall perspective of the correlation between vegetation NPP and temperature in Mu Us sandy areas, vegetation NPP has a relatively small response to temperature. The partial correlation coefficients of vegetation NPP and precipitation in the Mu Us Sandy Land area are between −0.52 and 0.88, and high-value areas are widely distributed. Precipitation is the key driver of vegetation NPP in the Mu Us Sandy Land area (Figure 8c). Precipitation is scarce in arid areas, and moisture is a restriction factor for vegetation growth. Increased precipitation can replenish soil moisture and promote photosynthesis. Therefore, NPP in most areas is positively correlated with precipitation, especially in the central and northern regions. In some southern and eastern regions, precipitation and NPP show a negative correlation, which may be influenced by multiple factors such as extreme precipitation events, soil properties, or human management. Further verification with field observations is needed. The complex correlation coefficients of vegetation NPP and potential evapotranspiration, temperature, and precipitation in the Mu Us Sandy Land area were between 0.0388 and 0.8431, and the average complex correlation coefficient reached 0.50 (Figure 8d). The re-correlation between NPP and potential evapotranspiration, temperature, and precipitation is high, especially in the central and northern regions. The overall higher value distribution reflects the combined effect of potential evapotranspiration, temperature and precipitation on NPP, and vegetation NPP has a strong response to potential evapotranspiration, temperature, and precipitation. The NPP in Mu Us vegetation is a result of the coordinated driving of multiple hydrothermal factors. A single factor cannot be fully explained. For example, precipitation is dominated, but it needs to be combined with evaporation and temperature to see the moisture balance. Although high temperatures are inhibited, they can adjust the length of the growing season in combination with precipitation. Multi-factor interaction shapes the spatial pattern of NPP.

4. Discussion

4.1. Analysis of the Trend of Vegetation NPP Changes

This study found that the total vegetation coverage (NPP) of the Mu Us Sandy Land showed a significant upward trend from 2001 to 2023 [35,36], with the annual average increasing from 124.28 g·(m−2·a)−1 to 221.41 g·(m−2·a)−1, and 98.53% of the area showed an upward trend, which is consistent with the conclusion of previous studies that “the vegetation in the Mu Us Sandy Land is continuously recovering” [37]. The observed substantial increase in NPP may appear significant. However, this result is corroborated by the rigorous partial correlation analysis presented in Section 3.3. The high magnitude of the increase can be attributed to the specific hydro-climatic regime of the region. As shown in the correlation results (Figure 8c), NPP is strongly positively correlated with precipitation. The period 2001–2023 coincided with a regional climate shift where the 10-year moving average of precipitation showed a slight upward trend (Figure 6), while potential evapotranspiration showed a declining trend after 2010. This shift in the aridity index created more favorable water balance conditions, directly driving the high NPP growth rates observed in the calculations. The statistical robustness of the trend (confirmed by M–K test at p < 0.01 for 98.53%of the area) suggests that this is a systematic regional response rather than an artifact of the dataset.
However, this study further found that NPP decreased slightly after 2019 (9.68 g·(m−2·a)−1 less in 2023 than in 2019). This fluctuation was not captured in previous studies and may be related to the increased water stress caused by the potential evapotranspiration reaching its peak (1142.49 mm/a) and the temperature reaching 9.46 °C in 2023, suggesting that short-term extreme climate may interfere with the long-term recovery trend. Spatially, NPP shows a distribution pattern of “increasing from north to south and faster in the east and slower in the west.” This pattern is highly consistent with the spatial heterogeneity of precipitation [38], further supporting the view that the spatial differentiation of vegetation productivity in arid and semi-arid regions is mainly controlled by water conditions. The difference of “faster in the east and slower in the west” may stem from the different regional hydrothermal combinations: the eastern part of the study area is closer to the semi-humid transition zone, and the water conditions are relatively better than those in the typical arid core area in the west, providing relatively favorable background climate conditions for vegetation growth.
Analysis of the coefficient of variation revealed that the overall NPP stability of vegetation in the Mu Us Sandy Land was relatively high (average CV = 0.19, with CV < 0.30 in 97.96% of the area), indicating that the ecosystem exhibited strong resistance to climate fluctuations [39,40]. However, the CV values in some areas from the southwest to the east were higher (>0.30), showing significant fluctuations. These areas happen to be regions with high precipitation variability and strong potential evapotranspiration, and the interannual instability of the hydrothermal combination may be the key climatic cause of fluctuations in vegetation productivity and high vulnerability of the ecosystem [41].

4.2. Response of Vegetation NPP to Climate Factors

This study, through partial correlation and multiple correlation analyses, revealed significant spatial heterogeneity in the response of vegetation NPP (natural potential productivity) to climatic factors in the Mu Us Sandy Land, deepening our understanding of the hydrothermal driving mechanisms in this region.
Precipitation is the most critical climatic driver of vegetation NPP in the Mu Us Sandy Land, showing a significant positive correlation in most areas. While temperature plays a role in regulating metabolic rates, the semi-arid nature of the Mu Us Sandy Land imposes a strict limitation on plant growth based on water availability. In such environments, the amount and timing of rainfall directly determine the soil moisture available for plant uptake, which is the prerequisite for photosynthetic activity. This finding has profound implications for ongoing ecological restoration efforts. It suggests that the success of vegetation recovery in this region is fundamentally tied to precipitation patterns. Since the implementation of large-scale afforestation and re-vegetation projects, the ecosystem’s carrying capacity has been increasingly dependent on rainfall variability. Therefore, our results underscore the importance of adopting climate-resilient restoration strategies—favoring native, drought-tolerant species—that align with the natural precipitation regime to ensure the long-term stability of the restored ecosystem. The impact of potential evapotranspiration on NPP exhibits spatial differentiation: a positive correlation in the central and northern regions and a negative correlation in the south. This phenomenon reveals the key role of water conditions in regulating the effects of energy factors [42]: in the relatively arid central and northern regions, the increase in potential evapotranspiration is often accompanied by enhanced solar radiation, which may promote photosynthesis under non-extreme water stress; while in the relatively water-sufficient south, excessively high potential evapotranspiration may exacerbate water deficit, thereby inhibiting growth. This highlights that water availability is a prerequisite for determining the ecological effects of energy factors.
The overall effect of temperature on NPP is mainly negative or weakly positive, which is consistent with the general pattern of “warming exacerbates water stress” in arid areas. This study found that only in local areas of the central and northern regions with relatively matched water conditions, temperature showed a slight promoting effect, which may be due to the moderate extension of the growing season. This subtle difference indicates that the direction and intensity of the effect of temperature are highly dependent on the local water background, and simple warming is not always beneficial.

4.3. Limitations

This study primarily addresses climatic drivers of NPP; all interpretations are framed within this climatic context. Although partial correlation statistically controls for inter-factor interactions, real-world vegetation dynamics result from combined climate and human activity effects (e.g., ecological engineering, land-use change, grazing). We did not quantify human factors; thus, the identified climate responses represent “net climatic effects” under contemporary human influences. Future work could introduce human-activity indicators, land-use data, or attribution models (e.g., residual analysis, geographical detector) to disentangle relative contributions. Moreover, our analysis focused on linear, contemporaneous relationships; nonlinearities and lagged responses between climate and vegetation warrant further investigation. It is acknowledged that this study relies solely on remote sensing data and meteorological reanalysis datasets without direct field validation. While the MOD17A3HGF product has been validated globally, local discrepancies may exist. To mitigate this, we employed a False Discovery Rate (FDR) control in our correlation analyses to minimize the risk of Type I errors (false positives) across the massive spatial dataset (over 1 million pixels). Furthermore, the use of detrended residuals for stability analysis (CV) ensures that the calculated volatility is independent of the long-term linear trend, providing a conservative estimate of ecosystem stability.

5. Conclusions

Based on MODIS NPP data and climatic factors (potential evapotranspiration, temperature, precipitation) from 2001 to 2023, this study analyzed spatiotemporal NPP changes and climatic responses in the Mu Us Sandy Land. Key conclusions are:
(1)
Vegetation NPP increased significantly, from 124.28 to 221.41 g·m−2, demonstrating rather than definitively stating. The spatial pattern “increasing from north to south, faster in east and slower in west” reflects regional hydrothermal gradients and human intervention.
(2)
NPP stability was generally high (mean CV = 0.19; 97.96% of area with CV < 0.30), indicating enhanced low interannual variability in productivity. Small zones from southwest to east showed higher CV, requiring targeted management to prevent secondary desertification.
(3)
Climate impacts on NPP were spatially heterogeneous: precipitation was the dominant driver, given that precipitation was identified as the critical driver of NPP, our findings suggest significant implications for the regional hydrological cycle. Potential evapotranspiration correlated positively in central/north but negatively in parts of the south, and temperature mostly showed weak negative effects, with warming likely intensifying water stress.
(4)
Multiple correlation analysis confirmed that NPP is governed by synergistic climate interactions, with water–heat coupling playing a key role. Vegetation NPP in the Mu Us Sandy Land has increased markedly, primarily driven by precipitation but modulated by spatially varying effects of evapotranspiration and temperature.
In summary, the NPP of vegetation in the Maowusu sandy land showed an overall upward trend from 2001 to 2023, with remarkable ecosystem restoration results, precipitation playing a leading role in climate factors, and spatial differences in the effects of evapotranspiration and air temperature. In the future, multi-factor comprehensive analysis and human activity impact assessment should be further strengthened to provide scientific support for regional ecological governance and sustainable development.

Author Contributions

Conceptualization: S.Z.; Methodology: S.Z., W.Z., Y.Z.; Formal analysis: S.Z., Y.Z., Y.W.; Writing—original draft preparation: S.Z.; Writing—review and editing: S.Z., Y.Z., Y.Z.; Resources: W.W.; Supervision: W.W., Y.W., Z.Z., C.Z. All authors have read and agreed to the published version of the manuscript.

Funding

This research was supported by the National Natural Science Foundation of China (grant number 42401022), the Science and Technology Plan Program of Inner Mongolia Autonomous Region (grant numbers 2022YFHH0100 and 2024KJHZ0014), the National Natural Science Foundation of China (grant number 52509026), the Key support projects by foreign experts (grant number D20240120), the Natural Science Foundation of Inner Mongolia (grant number 2025QN05082), the Key R&D and Achievement Transformation Program of Inner Mongolia Autonomous Region (2025YFHH0005).

Data Availability Statement

The datasets used and analyzed during the current study are available from the corresponding author on reasonable request.

Acknowledgments

Thanks to Fei Wang for your help in subsequent revisions, funding sources.

Conflicts of Interest

The authors declare no competing interests.

References

  1. Lieth, H. Modeling the primary productivity of the world. In Primary Productivity of the Biosphere; Springer: Berlin/Heidelberg, Germany, 1975; pp. 237–263. [Google Scholar]
  2. Tang, X.; Starr, G.; Staudhammer, C.L.; Zhang, K.; Li, L.; Li, N.; Ajloon, F.H.; Gong, Y. VCPNET: A new dataset to benchmark vegetation carbon phenology metrics. Ecol. Inform. 2024, 82, 102741. [Google Scholar]
  3. Zhu, L.; Sun, W.; Wu, J.; Fan, D. Spatiotemporal Distribution of Carbon Sink Indicators—NPP and Its Driving Analysis in Ordos City, China. Appl. Sci. 2023, 13, 6457. [Google Scholar] [CrossRef] [Scilit]
  4. Xue, P.; Liu, H.; Zhang, M.; Gong, H.; Cao, L. Nonlinear Characteristics of NPP Based on Ensemble Empirical Mode Decomposition from 1982 to 2015—A Case Study of Six Coastal Provinces in Southeast, China. Remote Sens. 2021, 14, 15. [Google Scholar]
  5. Zhao, M.; Aa, G.; Zhang, J.; Velicogna, I.; Liang, C.; Li, Z. Ecological restoration impact on total terrestrial water storage. Nat. Sustain. 2020, 4, 56–62. [Google Scholar] [CrossRef] [Scilit]
  6. Ruiz-Pérez, G.; Vico, G. Effects of Temperatur and water availability on Northern European boreal forests. Front. For. Glob. Change 2020, 3, 34. [Google Scholar]
  7. Liu, Y.; Yang, Y.; Wang, Q.; Du, X.; Li, J.; Gang, C.; Zhou, W.; Wang, Z. Evaluating the responses of net primary productivity and carbon use efficiency of global grassland to climate variability along an aridity gradient. Sci. Total Environ. 2019, 652, 671–682. [Google Scholar]
  8. Cao, D.; Zhang, J.; Zhang, T.; Yao, F.; Ji, R.; Zi, S.; Li, H.; Cheng, Q. Spatiotemporal variations and driving factors of global terrestrial vegetation productivity gap under the changing of climate, CO2, landcover and N deposition. Sci. Total Environ. 2023, 880, 162753. [Google Scholar]
  9. Xue, S.; Ma, B.; Wang, C.; Li, Z. Identifying key landscape pattern indices influencing the NPP: A case study of the upper and middle reaches of the Yellow River. Ecol. Model. 2023, 484, 110457. [Google Scholar] [CrossRef] [Scilit]
  10. Xue, Y.; Bai, X.; Zhao, C.; Qiu, T.; Li, Y.; Luo, G.; Wu, L.; Chen, F.; Li, C.; Ran, C.; et al. Spring photosynthetic phenology of Chinese vegetation in response to climate change and its impact on net primary productivity. Agric. For. Meteorol. 2023, 342, 109734. [Google Scholar] [CrossRef] [Scilit]
  11. Zhang, Y.; Zhang, M.; Qu, D.; Duan, W.; Wang, J.; Su, P.; Guo, R. Water Use Strategies of Dominant Species (Caragana korshinskii and Reaumuria soongorica) in Natural Shrubs Based on Stable Isotopes in the Loess Hill, China. Water 2020, 12, 1923. [Google Scholar] [CrossRef] [Scilit]
  12. Kabano, P.; Lindley, S.; Harris, A. Evidence of urban heat island impacts on the vegetation growing season length in a tropical city. Landsc. Urban Plan. 2021, 206, 103989. [Google Scholar] [CrossRef] [Scilit]
  13. Guo, Q.; Fu, B.; Shi, P.; Cudahy, T.; Zhang, J.; Xu, H. Satellite Monitoring the Spatial-Temporal Dynamics of Desertification in Response to Climate Change and Human Activities across the Ordos Plateau, China. Remote Sens. 2017, 9, 525. [Google Scholar] [CrossRef] [Scilit]
  14. Liu, Q.; Zhang, T.; Li, Y. Comparative Analysis of Fractional Vegetation Cover Estimation Based on Multi-sensor Data in a Semi-arid Sandy Area. Chin. Geogr. Sci. 2019, 29, 166–180. [Google Scholar]
  15. Yang, X.; Xu, X.; Stovall, A.; Chen, M.; Lee, J.-E. Recovery: Fast and Slow—Vegetation Response During the 2012–2016 California Drought. J. Geophys. Res. Biogeosci. 2021, 126, e2020JG005976. [Google Scholar] [CrossRef] [Scilit]
  16. Yao, J.; Li, Z.; Yao, W.; Xiao, P.; Zhang, P.; Xie, M.; Wang, J.; Mei, S. The Compound Response Relationship between Hydro-Sedimentary Variations and Dominant Driving Factors: A Case Study of the Huangfuchuan basin. Sustainability 2023, 15, 13632. [Google Scholar] [CrossRef] [Scilit]
  17. Qi, K.; Zhu, J.; Zhu, J.; Zheng, X.; Wang, G.; Li, M. Impacts of the world’s largest afforestation program (Three-North Afforestation Program) on desertification control in sandy land of China. GISci. Remote Sens. 2023, 60, 2167574. [Google Scholar] [CrossRef] [Scilit]
  18. Yan, Y.; Piao, S.; Hammond, M.W.; Chen, A.; Hong, S.; Xu, H.; Munson, S.M.; Myneni, R.B.; Allen, C.D. Climate-induced tree-mortality pulses are obscured by broad-scale and long-term greening. Nat. Ecol. Evol. 2024, 8, 912–923. [Google Scholar]
  19. Shao, X.; Gao, X.; Cai, Y.; Zhang, Z.; Zhou, S.; Tian, L.; Zhao, X. Past Precipitation Stored in Deep Soils Sustains Greening of Dryland Tree Plantations in Northern China. Earth’s Future 2025, 13, e2025EF006181. [Google Scholar] [CrossRef] [Scilit]
  20. Jia, F.; Lu, R.; Gao, S.; Li, J.; Liu, X. Holocene aeolian activities in the southeastern Mu Us Sand Land, China. Aeolian Res. 2015, 19, 267–274. [Google Scholar] [CrossRef] [Scilit]
  21. Yang, Y.; Wang, X.; He, Y.; Zhang, K.; Mo, F.; Zhang, W.; Liu, G. Using Isotopic Labeling to Investigate Artemisia ordosica Root Water Uptake Depth in the Eastern Margin of Mu Us Sandy Land. Sustainability 2022, 14, 15149. [Google Scholar] [CrossRef] [Scilit]
  22. Huang, G.; Zhu, H.; Zhang, J.; Liu, B. Analysis of the Characteristics of Climate Change in the Ecologically Vulnerable Area of the Mu Us Dune Field under the Background of Global Warming. Remote Sens. 2021, 13, 627. [Google Scholar] [CrossRef] [Scilit]
  23. Chen, Y.; Liu, X.; Ma, Y.; He, J.; He, Y.; Zheng, G.; Gao, W.; Ma, C. Variability analysis and the conservation capacity of soil water storage under different vegetation types in arid regions. Catena 2023, 230, 107269. [Google Scholar] [CrossRef] [Scilit]
  24. Li, M.; Zhong, S.; Luo, Y.; Liu, Q.; Li, X. A Study of the Change in Surface Parameters during the Last Four Decades in the MuUs Desert Based on Remote Sensing Data. Remote Sens. 2022, 14, 4025. [Google Scholar] [CrossRef] [Scilit]
  25. Zhang, Z.; Wang, W.; Gong, C.; Zhao, M.; Franssen, H.-J.H.; Brunner, P. Salix psammophila afforestations can cause a decline of the water table, prevent groundwater recharge and reduce effective infiltration. Sci. Total Environ. 2021, 780, 146336. [Google Scholar] [CrossRef] [Scilit]
  26. Li, Z.; Deng, Y.; Mu, H.; Song, Y. Evaluation of Aeolian Sand Collapsibility Based on Physical Indicators in the Mu Us Sandy Land, China. Appl. Sci. 2024, 14, 11238. [Google Scholar] [CrossRef] [Scilit]
  27. Wang, W.; Cao, C.; Shao, X.; Blonski, S.; Choi, T.; Uprety, S.; Zhang, B.; Bai, Y. Evaluation of 10-Year NOAA/NASA Suomi NPP and NOAA-20 VIIRS Reflective Solar Band (RSB) Sensor Data Records (SDR) over Deep Convective Clouds. Remote Sens. 2022, 14, 3566. [Google Scholar] [CrossRef] [Scilit]
  28. Yin, C.; Chen, X.; Luo, M.; Meng, F.; Sa, C.; Bao, S.; Yuan, Z.; Zhang, X.; Bao, Y. Quantifying the Contribution of Driving Factors on Distribution and Change of Net Primary Productivity of Vegetation in the Mongolian Plateau. Remote Sens. 2023, 15, 1986. [Google Scholar] [CrossRef] [Scilit]
  29. Sen, P.K. Estimates of the Regression Coefficient Based on Kendall’s Tau. J. Am. Stat. Assoc. 2012, 63, 1379–1389. [Google Scholar] [CrossRef]
  30. Rani, S.; Singh, S.; Purohit, S. Evaluating Daytime and Nighttime Land Surface Temperature Pattern and Trends in India: A Comparative Analysis of Satellite and Reanalysis Data. Earth Syst. Environ. 2024, 9, 3479–3500. [Google Scholar] [CrossRef] [Scilit]
  31. Koc, H.; Simsek, M.H.; Akkus, M. Evaluation of corneal endothelial parameters in patients with methamphetamine use disorder. BMC Ophthalmol. 2025, 25, 454. [Google Scholar] [CrossRef] [Scilit]
  32. Liu, S.; Gu, Y.; Wang, H.; Lin, J.; Zhuo, P.; Ao, T. Response of Vegetation Coverage to Climate Drivers in the Min-Jiang River Basin along the Eastern Margin of the Tibetan Plat-Eau, 2000–2022. Forests 2024, 15, 1093. [Google Scholar] [CrossRef] [Scilit]
  33. Xue, B. Quality degradation evaluation of brick-timber structure houses built before 1950 in Shanghai. Proc. Inst. Civ. Eng.-Eng. Hist. Herit. 2025, 178, 122–129. [Google Scholar]
  34. Zheng, G.; Wei, G.; Han, F.; Cao, Y.; Gao, F. Study on the Response Mechanism of Climate and Land Use Change to Evapotranspiration in Aksu River Basin. Atmosphere 2024, 15, 1055. [Google Scholar] [CrossRef] [Scilit]
  35. Liu, Z.; Wang, D.; Han, L.; Kang, H.; Cao, X. Vegetation Quality Assessment of the Shaanxi Section of the Yellow River Basin Based on NDVI and Rain-Use Efficiency. Land 2025, 14, 166. [Google Scholar] [CrossRef] [Scilit]
  36. Yang, L.; Shi, L.; Li, J.; Kong, H.; Shan, Z. Spatiotemporal variation pattern and spatial coupling relationship between NDVI and LST in Mu Us Sandy Land. Open Geosci. 2024, 16, 20220691. [Google Scholar] [CrossRef] [Scilit]
  37. Cao, Y.; Pang, Y.; Jia, X. Vegctation growth in Mu Us sandy land from 2001 to 2016. Bull. Soil Water Conserv. 2019, 39, 29–37. [Google Scholar]
  38. Gao, W.; Zheng, C.; Liu, X.; Lu, Y.; Chen, Y.; Wei, Y.; Ma, Y. NDVI-based vegetation dynamics and their responses to climate change and human activities from 1982 to 2020: A case study in the Mu Us Sandy Land, China. Ecol. Indic. 2023, 137, 108745. [Google Scholar] [CrossRef] [Scilit]
  39. Hui, C.; Liu, J.; He, W.; Xu, P.; Nguyen, N.T.; Lv, Y.; Huang, C. Shifted vegetation resilience from loss to gain driven by changes in water availability and solar radiation over the last two decades in Southwest China. Agric. For. Meteorol. 2025, 368, 110543. [Google Scholar] [CrossRef] [Scilit]
  40. Luo, M.; Tuansheng, L. Spatial and temporal analysis of landscape ecological quality in Yulin. Environ. Technol. Innov. 2021, 23, 101700. [Google Scholar] [CrossRef] [Scilit]
  41. Wang, Z.; Shi, C.; Ma, Y. Spatial and Temporal Changes of Vegetation Net Primary Pro-ductivity and Its Driving factors in Mu Us Sandy Land. Acta Agrestia Sin. 2024, 32, 2962–2972. [Google Scholar]
  42. Lisovets, O.; Podorozhniy, S.; Tutova, H.; Molozhon, K.; Kunakh, O.; Zhukov, O. Hemeroby reveals the dynamics of vegetation cover following the destruction of the Kakhovka Reservoir. PeerJ 2025, 13, e19607. [Google Scholar] [CrossRef] [Scilit]
Figure 1. Geographical schematic diagram of Mu Us Sandy Land area.
Land 15 00652 g001
Figure 2. Interannual variation in vegetation NPP in the Mu Us Sandy Land from 2001 to 2023. The black square data points represent annual averages; the red line indicates the linear trend; C = coefficient of determination; A = slope of the trend line; Y = NPP (g·(m−2·a)−1); B = intercept of the trend line.
Land 15 00652 g002
Figure 3. Average annual change of NPP in Mu Us Sandy Land from 2001 to 2023.
Land 15 00652 g003
Figure 4. Spatial dynamics and significance testing of NPP in Mu Us Sandy Land from 2001 to 2023. (a) NPP trend analysis, (b) NPP significance analysis.
Land 15 00652 g004
Figure 5. NPP variation coefficient of vegetation in Mu Us Sandy Land from 2001 to 2023. (a) Stability spatial distribution, (b) Proportion of CV area.
Land 15 00652 g005
Figure 6. The annual average of Pet, Temp and Pre in Mu Us Sandy Land from 2001 to 2023.
Land 15 00652 g006
Figure 7. Spatial distribution of annual mean of Pet, Temp and Pre in Mu Us Sandy Land. (a) Spatial distribution of potential evapotranspiration, (b) Spatial distribution of temperature, (c) Spatial distribution of precipitation.
Land 15 00652 g007
Figure 8. The correlation coefficient between vegetation NPP and evapotranspiration and Temp and Pre.
Land 15 00652 g008
Table 1. Mann–Kendall test trend categories.
βZ ≤ 1.65Trend TypeTrend Features
β > 02.58 < Z4Very significant increase
1.96 < Z ≤ 2.583More significant increase
1.65 < Z ≤ 1.962Significant increase
Z ≤ 1.651No significant increase
β = 0Z0No significant change
β < 0Z ≥ −1.65−1No significant reduced
−1.96 < Z ≤ −1.65−2Significant reduced
−2.58 < Z ≤ −1.96−3More significant reduced
Z < −2.58−4Very significant reduced
Disclaimer/Publisher’s Note: The statements, opinions and data contained in all publications are solely those of the individual author(s) and contributor(s) and not of MDPI and/or the editor(s). MDPI and/or the editor(s) disclaim responsibility for any injury to people or property resulting from any ideas, methods, instructions or products referred to in the content.