Article

Spatiotemporal Variations in Grain Yields and Their Responses to Climatic Factors in Northeast China During 1993–2022

1
Jangho Architecture College, Northeastern University, Shenyang 110169, China
2
Institute of Geographic Sciences and Natural Resources Research, Chinese Academy of Sciences, Beijing 100101, China
*
Author to whom correspondence should be addressed.
Land 2025, 14(8), 1693; https://doi.org/10.3390/land14081693
Submission received: 21 July 2025 / Revised: 16 August 2025 / Accepted: 18 August 2025 / Published: 21 August 2025

Abstract

Global warming impacts agricultural production and food security, particularly in high-latitude regions with high temperature sensitivity. As a major grain-producing area in China and one of the fastest-warming regions globally, Northeast China (NEC) has received considerable research attention. However, the existing literature lacks sufficient exploration of the spatiotemporal heterogeneity in climate change impacts. Based on data on rice, corn, and soybean yields, as well as temperature, rainfall, and sunshine duration in NEC from 1993 to 2022, this study employs Sen’s slope estimation, the Mann–Kendall (MK) test, spatial autocorrelation analysis, and the Geographically and Temporally Weighted Regression (GTWR) model to analyze the spatiotemporal evolution of grain yields and their responses to climate change. The results show that ① 1993–2022 witnessed an overall rise in grain yields per unit area in NEC, with Liaoning growing fastest. Rice yields increased regionally; corn yields rose in Liaoning and Jilin, while soybean yields increased only in Liaoning. During the growing season, rainfall trended upward with fluctuations, temperatures rose steadily, and sunshine duration declined in Heilongjiang. ② Except for corn and soybeans in the early period, other crops exhibited significant yield spatial agglomeration. High–high agglomeration areas first expanded, then shrank, eventually shifting northward to the region of Jilin Province. ③ Climatic factors show marked spatiotemporal heterogeneity in impacts: positive effect areas of rainfall and temperature expanded northward; sunshine duration’s influence weakened, but its negative effect areas spread. ④ Differences in crop responses are closely linked to their physiological characteristics, regional climate evolution, and agricultural adaptation measures. This study provides a scientific basis for formulating region-specific agricultural adaptation strategies to address climate change in NEC.

1. Introduction

Climate change has become a critical global issue, significantly impacting ecological stability and human societal functions [1]. According to the IPCC’s Sixth Assessment Report, the global mean surface temperature increased by approximately 1.1 °C between 2011 and 2020 compared to pre-industrial levels [2]. Agriculture, highly dependent on climatic conditions, is particularly vulnerable to climate change. Variations in key climatic factors (e.g., temperature, rainfall, sunshine duration) directly influence crop growth cycles, yield, and quality. Moreover, the increasing frequency and intensity of extreme weather events (e.g., heavy rainfall, droughts, and heatwaves) further destabilize agricultural production, posing severe threats to global food security [3]. Therefore, investigating the effects of climate change on food production is essential for mitigating climate-related risks and safeguarding food security.
In recent years, numerous scholars have conducted research on the impact of climate change on food production. Their research primarily focuses on three key areas: the impacts of climate disasters on food yields, the assessment of climate production potential, and the influence of climate change on the spatial distribution of crop production [4,5,6,7,8]. Common methodologies include field experiments, crop modeling, and statistical analyses [9]. For instance, Yan et al. demonstrated through field experiments that diversified cropping systems enhance wheat yield stability under climate variability, providing direct empirical evidence through controlled variable testing [10,11,12]. Meanwhile, Karunaratne et al. developed process-based crop models integrating crop phenology, climatic parameters, and soil properties to simulate and quantify climate–crop interactions [13,14,15,16]. While these approaches elucidate crop–environment mechanisms, they are often methodologically complex, limited in temporal and spatial scalability, and not suitable for large-scale or long-term studies [17]. In contrast, statistical approaches are more suitable for analyzing long-term, large-scale yield trends and projecting future climate impacts [1,18,19]. Among these, panel data models are widely adopted in climate–food research due to their ability to capture temporal dynamics and spatial variability simultaneously. However, statistical methods have an inherent limitation of simplifying real-world systems: the impacts of agricultural management practices such as fertilization intensity, irrigation conditions, crop variety improvement, and sowing date adjustments can rarely be completely isolated through variable control. Moreover, traditional models such as Ordinary Least Squares (OLS) and logistic regression, although capable of providing global average estimation results, fail to adequately account for spatial heterogeneity and thus cannot reflect the differential responses of different regions under climate impacts [20,21]. Critically, climate change impacts on agriculture exhibit significant spatiotemporal heterogeneity: crop–climate responses vary across regions and may shift within the same region over time [22]. Thus, it is necessary to incorporate considerations of spatiotemporal heterogeneity into the analysis.
China ranks among the nations most severely impacted by climate-related extreme events. The Chinese government and relevant authorities have prioritized the impacts of climate change and extreme climatic events on food security [23]. Scholars have investigated various crops and regions, laying a foundation for formulating climate-resilient food security strategies [24,25,26]. Northeast China (NEC), as a vital grain-producing area and commodity grain base in China, contributes 21% to the national grain output. Its production of corn, rice, and soybeans accounts for a significant proportion nationwide, serving as the “cornerstone” of food security [27]. However, as the highest-latitude region in China, the three northeastern provinces are not only prone to natural disasters such as droughts, floods, and low-temperature freezing but also highly sensitive to climate change. Thus, the impact of climate change on food production in this region has long been a research hotspot, with studies focusing on three key aspects: First, the direct impact of climatic factors. For instance, Dong et al. found that climate change since 1980 has increased rice yields in NEC by 10%, although future extreme high temperatures may offset this effect [28]. Zhang et al. pointed out that the negative effects of high temperatures on corn can be offset by the positive contributions of increased accumulated temperature, yet future compound drought and high-temperature stress will become the primary constraint on corn production [29,30]. Second, the interaction between climate change and other factors. For example, Song et al. argued that the combined effects of black soil degradation and climate change have exacerbated declines in crop yields, with soil thinning acting as the dominant factor [31,32]. Third, agricultural adaptation strategies for mitigating climate change impacts. Scholars have proposed strategies including variety optimization and tillage techniques to reduce the risk of yield losses caused by climate fluctuations [33,34,35,36].
Despite the progress made in current research, three key gaps remain to be addressed: First, regarding the mechanisms by which climatic factors affect crop yields, while the impacts of temperature and rainfall have been widely verified, the influence of sunshine duration on crops in high-latitude regions remains underexplored. Additionally, analysis of the correlation between climate change and crop yields since 2010 is insufficient. Second, most existing studies have been conducted at the regional average or provincial scale, with inadequate exploration of the spatiotemporal heterogeneity in grain yields at the municipal level. Third, in terms of crop comparisons and holistic associations, research often focuses on individual crops, lacking a comparative analysis of differential responses among staple crops to climate factors.
To address these gaps, this study focuses on the three northeastern provinces, exploring the spatiotemporal heterogeneity of rice, corn, and soybean yields at the municipal scale, as well as the underlying climate-driven factors. The main objectives are (1) to investigate the spatiotemporal variation trends of major grain crop yields and climatic factors from 1993 to 2022 using Sen’s slope and the MK test; (2) to analyze the spatial relationships of grain yields during the periods of 1993–2002, 2003–2012, and 2013–2022 using Moran’s I model; and (3) to examine the spatiotemporal heterogeneity in the impacts of temperature, rainfall, and sunshine duration on grain crop yields via the GTWR model.

2. Materials and Methods

2.1. Study Area

NEC is located in northernmost China (118°53′–135°05′ E, 38°43′–53°33′ N), which includes Heilongjiang, Jilin, and Liaoning provinces (Figure 1). It has 2.78 × 10⁷ hectares of farmland, accounting for 16.5% of China’s total arable land area [37]. The region features a diverse climate, with the northern part characterized by a cold temperate humid climate and the western part by a semi-humid climate. The annual average temperature ranges from −4.2 °C to 10.9 °C, decreasing progressively from south to north. The annual rainfall decreases from 1070 mm in the southeast to 450 mm in the northwest, with the majority of rainfall concentrated in the summer and autumn seasons (May to September), which coincides closely with the growing period of the region’s major grain crops. Corn, rice, and soybeans, as the principal grain crops in NEC, exhibit pronounced seasonality and are harvested only once a year.
Meteorological data, including daily meteorological records for prefecture-level cities in the study area from 1993 to 2022, were obtained from the China Meteorological Data Sharing Service System (CMDS; http://data.cma.cn/, accessed on 15 July 2025). The dataset comprises daily average temperature, daily rainfall, and sunshine duration, offering a robust foundation for investigating the production characteristics and spatiotemporal dynamics of grain crops. To align with the crop growing season, the average temperature, total rainfall, and total sunshine duration of meteorological stations in each prefecture-level city were calculated for the period from May to September each year. Crop yield data were comprehensively collected from the China Statistical Yearbook, Heilongjiang Statistical Yearbook, Jilin Statistical Yearbook, Liaoning Statistical Yearbook, and statistical yearbooks of various prefecture-level cities. These data span the period of 1993–2022 and include information on the planting area and yields of grain, rice, corn, and soybeans in each city, offering a robust foundation for investigating the production characteristics and spatiotemporal dynamics of grain crops.

2.2. Framework

The methodological framework of this study is illustrated in Figure 2, with the specific process as follows: First, time series data of growing-season meteorological factors and crop yields are constructed. The MK test is used to determine the significance of trends in each time series, and Sen’s slope is employed to quantify the annual change rate. Second, a spatial weight matrix is constructed based on the adjacency of prefecture-level cities. The global and local Moran’s I indices of grain crop yields are calculated across three periods (1993–2002, 2003–2012, and 2013–2022) to explore the spatial clustering effects and local spatial associations of grain crop yields. Finally, the GTWR model is used to quantify the spatiotemporal heterogeneity of the impacts of climatic factors on grain crop yields. In this model, crop yield is taken as the dependent variable, while growing-season temperature, precipitation, and sunshine duration serve as independent variables. Adaptive spatiotemporal bandwidths are adopted for coefficient estimation, aiming to reveal variations in the intensity and direction of impacts across different spatiotemporal units and to identify potential spatial dependence characteristics. Collectively, these methods form an interconnected, progressively layered analytical framework across spatiotemporal dimensions, providing a robust scientific basis for formulating grain production policies in response to climate change.

2.3. Methods

2.3.1. Methods of Trend Analysis

To assess the impact of climate change on regional food production security and identify key climatic drivers, this study systematically analyzed two key datasets spanning 1993–2022: time series of climatic variables (rainfall, temperature, and sunshine duration) and yields of major grain crops (rice, corn, and soybeans). For trend detection, the MK test and Sen’s slope estimation were selected—both nonparametric methods. Firstly, hydrological, meteorological, and crop yield data often deviate from strict normal distributions and contain extreme values; nonparametric methods, which impose no strict requirements on data distribution, are therefore well-suited for such data. Secondly, compared to traditional parametric methods, the MK test and Sen’s slope estimation are more robust to extreme outliers, enabling more reliable trend assessments. These methods are widely used and recognized in environmental science, hydrology, and agricultural meteorology, serving as standard tools for long-term trend analysis [1,38,39].
In the specific analysis process, this study performed MK tests at a 95% confidence level (α = 0.05). The null hypothesis (H0) was that the data series has no statistically significant monotonic upward or downward trend, while the alternative hypothesis (H1) was that the data series has a significant monotonic trend. If the calculated p-value is ≤0.05, the null hypothesis is rejected, indicating a statistically significant monotonic trend. For time series identified as having a significant trend by the MK test, Sen’s slope estimator (Equation (1)) is employed to quantify the rate of trend change, such as changes in precipitation (mm), temperature (°C), or yield (e.g., kg/ha) per year. Sen’s slope provides a robust estimate of the median slope of the trend, accurately reflecting the magnitude and direction of the trend.
Q i = x j x k j k   i = 1,2 , 3 , N  
where x j and x k represent the data values in year j and year k (where j > k ), respectively. Sen’s slope estimator is defined as the median of the N values of these Q i . Specifically, if N is an odd number, Sen’s estimator is calculated as Qmed = Q(N+1)/2; if N is an even number, it is calculated as Qmed = [QN/2+Q(N+2)/2]/2. Finally, a two-tailed test is performed on Qmed within the 100%(1 − α) confidence interval to derive the true slope.

2.3.2. The Analysis Method of Spatial Pattern of Major Food Crop Yields in NEC

The spatial distribution of grain yield is not isolated. Its spatial correlation characteristics are influenced not only by the spatial differentiation of natural conditions (e.g., climate and soil) but also by regional variations in socioeconomic factors (such as agricultural technology and policy interventions) [40,41,42,43]. Specifically, these spatial correlation characteristics manifest as spatial dependence (similarity among adjacent regions) and spatial heterogeneity (differences across regions). To explore their inherent patterns and provide a basis for identifying the spatial patterns of climate–yield relationships, this study performed spatial autocorrelation analysis on grain yield. Spatial autocorrelation analysis is a key tool for revealing correlations between attribute values of spatial units and those of their neighboring units, and it can be categorized into global and local spatial autocorrelation. Global Moran’s I, for instance, is used to measure the intensity of global spatial autocorrelation in grain yield across the study area and to determine whether high-value or low-value regions exhibit a significant clustering trend [44,45,46]. Its calculation formula is as follows:
  I = n i = 1 n j = 1 n W i j X i X ¯ X j X ¯ ( i = 1 n j = 1 n W i j ) · i = 1 n X i X ¯ 2
where n represents the number of spatial units; X i and X j denote the yield per unit area of city i and city j , respectively; X ¯ is the average value of yield; and W i j is the weight matrix used to measure the spatial association between city i and city j . Under normal circumstances, W is defined based on the adjacency criterion: W i j takes the value of 1 when city i is adjacent to city   j , and 0 otherwise. The value range of Moran’s I ranges from −1 to 1. A positive value indicates a positive correlation, meaning that the yield presents a spatially clustered distribution; a negative value indicates a negative correlation, implying a spatially dispersed distribution of yield; and a value of 0 indicates a random spatial distribution. The significance of the global Moran’s I is tested by the standardized Z-score, whose calculation formula is as follows:
  Z I = I E I V a r I
where E I and V a r I are the expected value and variance of Moran’s I, respectively.
To further analyze the local agglomeration hotspots or outlier regions of yield between each prefecture-level city and its neighboring units, this study employs the local Moran’s I for analysis, whose calculation formula is as follows:
I i = 1 S 2 x i x ¯ j = 1 n w i j x j x ¯
The significance of the local Moran’s I is measured by its Z-score, with the calculation formula as follows:
Z I i = I E I i V a r I i
where E I i and V a r I i denote the expected value and variance of the local Moran’s I, respectively. I i refers to the local Moran’s I, which can identify four types of spatial association: H-H clustering ( I i > 0, Z > 0), where high-value units are surrounded by high-value neighboring units; L-L clustering ( I i > 0, Z > 0), in which low-value units are adjacent to low-value neighboring units; L-H outliers ( I i < 0, Z > 0), meaning low-value units are adjacent to high-value neighboring units; and H-L outliers ( I i < 0, Z > 0), where high-value units are surrounded by low-value neighboring units.

2.3.3. GTWR Model for Associating Grain Yield with Climatic Factors in NEC

Against the background of global warming, clarifying the impact mechanisms of climate change on crop yields is crucial for ensuring food security, and this topic has long been a research hotspot in the academic community [47,48]. Current research methods primarily include crop simulation models, regression analysis, and spatial statistical methods. Among these, traditional regression models such as OLS and logistic regression can provide global average estimation results but fail to address spatial heterogeneity. GWR can capture the spatial heterogeneity of parameters but is only applicable to cross-sectional data analysis. Given these limitations, this study employs the GTWR model to estimate the spatiotemporal heterogeneity of climatic factors’ impacts on grain yield. As an extension of the GWR model, GTWR incorporates both temporal and spatial information in constructing the weight matrix, thus enabling it to capture the spatiotemporal non-stationary characteristics of coefficients. It has been widely applied in various fields [49,50,51]. The model expression is as follows:
  y i = β 0 μ i , γ i , t i + k = 1 n β k μ i , γ i , t i x i , k + ε i
where y i represents the grain yield at location i; β 0 μ i , γ i , t i is the intercept term; ε i denotes the random error; x i , k stands for the independent variable at location i, corresponding to the three factors in this study, namely temperature, precipitation, and sunshine duration; β k μ i , γ i , t i is the local coefficient for each factor; and μ i , γ i , t i indicates the spatial and temporal attributes of location i, where μ i , γ i and t i ,   respectively, represent the latitude, longitude, and time of location i. This study takes cities as the basic research units. Therefore, we extracted the centroid of each city to obtain the longitude and latitude of each region.
The estimation of β k μ i , γ i , t i is based on the following formula:
  β ^ μ i , γ i , t i = x T W μ i , γ i , t i x 1   x T W μ i , γ i , t i y
where x T denotes the transpose of x; and W μ i , γ i , t i is an n × n weight matrix of observations that accounts for spatial and temporal distances. This matrix incorporates a space–time distance decay function w i j determined by the Gaussian distance decay function:
  w i j = e x p μ i μ j 2 + γ i γ j 2 h s 2 + t i t j 2 h t 2
where h s is the spatial bandwidth, and h t is the temporal bandwidth. The size of the bandwidth is determined by the number of points included in the fitting process. In the calculation process, the adaptive bandwidth is selected.
The Variance Inflation Factor (VIF) is employed to avoid multicollinearity among factors, and a t-test is conducted to assess the statistical significance of the GTWR coefficients.

3. Results

3.1. Temporal and Spatial Variations in Major Grain Crop Yields in NEC

We calculated Sen’s slope for yield per unit area and conducted the MK test for major grain crops in NEC. As shown in Figure 3a, from 1993 to 2022, yield per unit area in NEC showed a significant upward trend (p < 0.05), with annual increase rates of 73.292 kg/(hm2·a) in Liaoning Province, 66.182 kg/(hm2·a) in Heilongjiang Province, and 62.073 kg/(hm2·a) in Jilin Province. At the prefecture-level city scale, except for a few cities such as Baishan City and Songyuan City, all other regions showed a growing trend. However, the spatial distribution of yield per unit area exhibits obvious imbalance: the high-value areas are concentrated in central cities such as Siping and Changchun, while the low-value areas are mainly distributed in cities such as Heihe and Yichun in northern Heilongjiang Province.
As shown in Figure 3b, rice yields across NEC also exhibited a significant upward trend (p < 0.05), with annual increases of 48.369 kg/(hm2·a) in Heilongjiang, 36.490 kg/(hm2·a) in Jilin, and 26.160 kg/(hm2·a) in Liaoning. At the prefecture-level city scale, the high-value areas of rice yield are concentrated in central cities such as Songyuan and Siping, while the low-value areas are distributed in cities in northwestern Heilongjiang Province and western Liaoning Province. In contrast, the spatial distribution of the growth trend presents the opposite pattern, with the high-growth areas located in cities in western Liaoning Province and northeastern Heilongjiang Province.
As shown in Figure 3c, for corn, yields in Liaoning and Jilin showed significant upward trends (p < 0.05), at 36.413 kg/(hm2·a) and 37.868 kg/(hm2·a) annually, respectively, while in Heilongjiang, the annual increase of 29.373 kg/(hm2·a) was not statistically significant. At the prefecture-level city scale, the spatial distribution of corn yield exhibits heterogeneity, with contiguous high-yield areas formed in cities such as Changchun, Siping, Tieling, and Shenyang—specifically the “Golden Corn Belt”. In terms of the spatial distribution of growth trends, the northeastern part of Heilongjiang Province and most cities in Liaoning Province belong to high-growth areas.
As shown in Figure 3d, only Liaoning Province recorded a significant upward trend in soybean yields (p < 0.05), with an annual increase of 33.891 kg/(hm2·a). In contrast, Jilin and Heilongjiang provinces showed downward trends, with annual decreases of 6.628 kg/(hm2·a) and 1.956 kg/(hm2·a), respectively. At the prefecture-level city scale, regions with relatively high soybean yields are concentrated in cities such as Songyuan, Changchun, and Jilin in Jilin Province, while high-growth areas are mainly distributed in cities like Dalian and Dandong in Liaoning Province.

3.2. Spatiotemporal Variations in Climatic Variables in NEC

Monthly and average rainfall, temperature, and sunshine duration during the growing season in NEC were subjected to the MK test and Sen’s slope calculation.
As shown in Figure 4a, average rainfall in NEC exhibited a fluctuating upward trend. Among these, average rainfall in Heilongjiang Province showed a significant upward trend (p < 0.05) with an increase rate of 0.5411 mm/a. The increase rates of average rainfall in Jilin and Liaoning provinces were 0.2992 mm/a and 0.2653 mm/a, respectively, but these increases were not statistically significant. However, Liaoning and Jilin provinces exhibited a decreasing trend in July rainfall, with rates of −1.685 mm/a and −0.604 mm/a, respectively. Such reductions may trigger water stress, potentially leading to a decline in grain yield. Moreover, the spatial distribution of average rainfall across the three northeastern provinces exhibits significant heterogeneity, characterized by a “south—high and north—low” pattern.
As shown in Figure 4b, average temperature during the growing season in NEC showed an upward trend, with increase rates of 0.023 °C/a in Liaoning, 0.018 °C/a in Jilin, and 0.011 °C/a in Heilongjiang. Among these, the average growing-season temperature in Liaoning and Jilin, and the average July temperature in Jilin, exhibited significant upward trends (p < 0.05). Influenced by latitude, significant spatial differences exist in average temperature across the three provinces, characterized by a unimodal distribution pattern with higher temperatures in southwestern and central Liaoning. Additionally, due to monsoon effects, cities in eastern Liaoning and Heilongjiang have experienced more rapid warming.
As shown in Figure 4c, sunshine duration during the growing season in Jilin and Liaoning showed an upward trend, with change rates of 0.492 h/a and 0.211 h/a, respectively. In contrast, Heilongjiang exhibited a downward trend, with a change rate of −0.628 h/a. In terms of spatial distribution, sunshine duration followed a “higher in the west, lower in the east” pattern, with relatively higher values in cities such as Baicheng, Qiqihar, and Daqing. The spatial distribution of the change trend showed a “lower in the north, higher in the south” pattern, with relatively higher increase rates in southern and central Liaoning.

3.3. Spatial Patterns of Major Grain Crop Yields in NEC

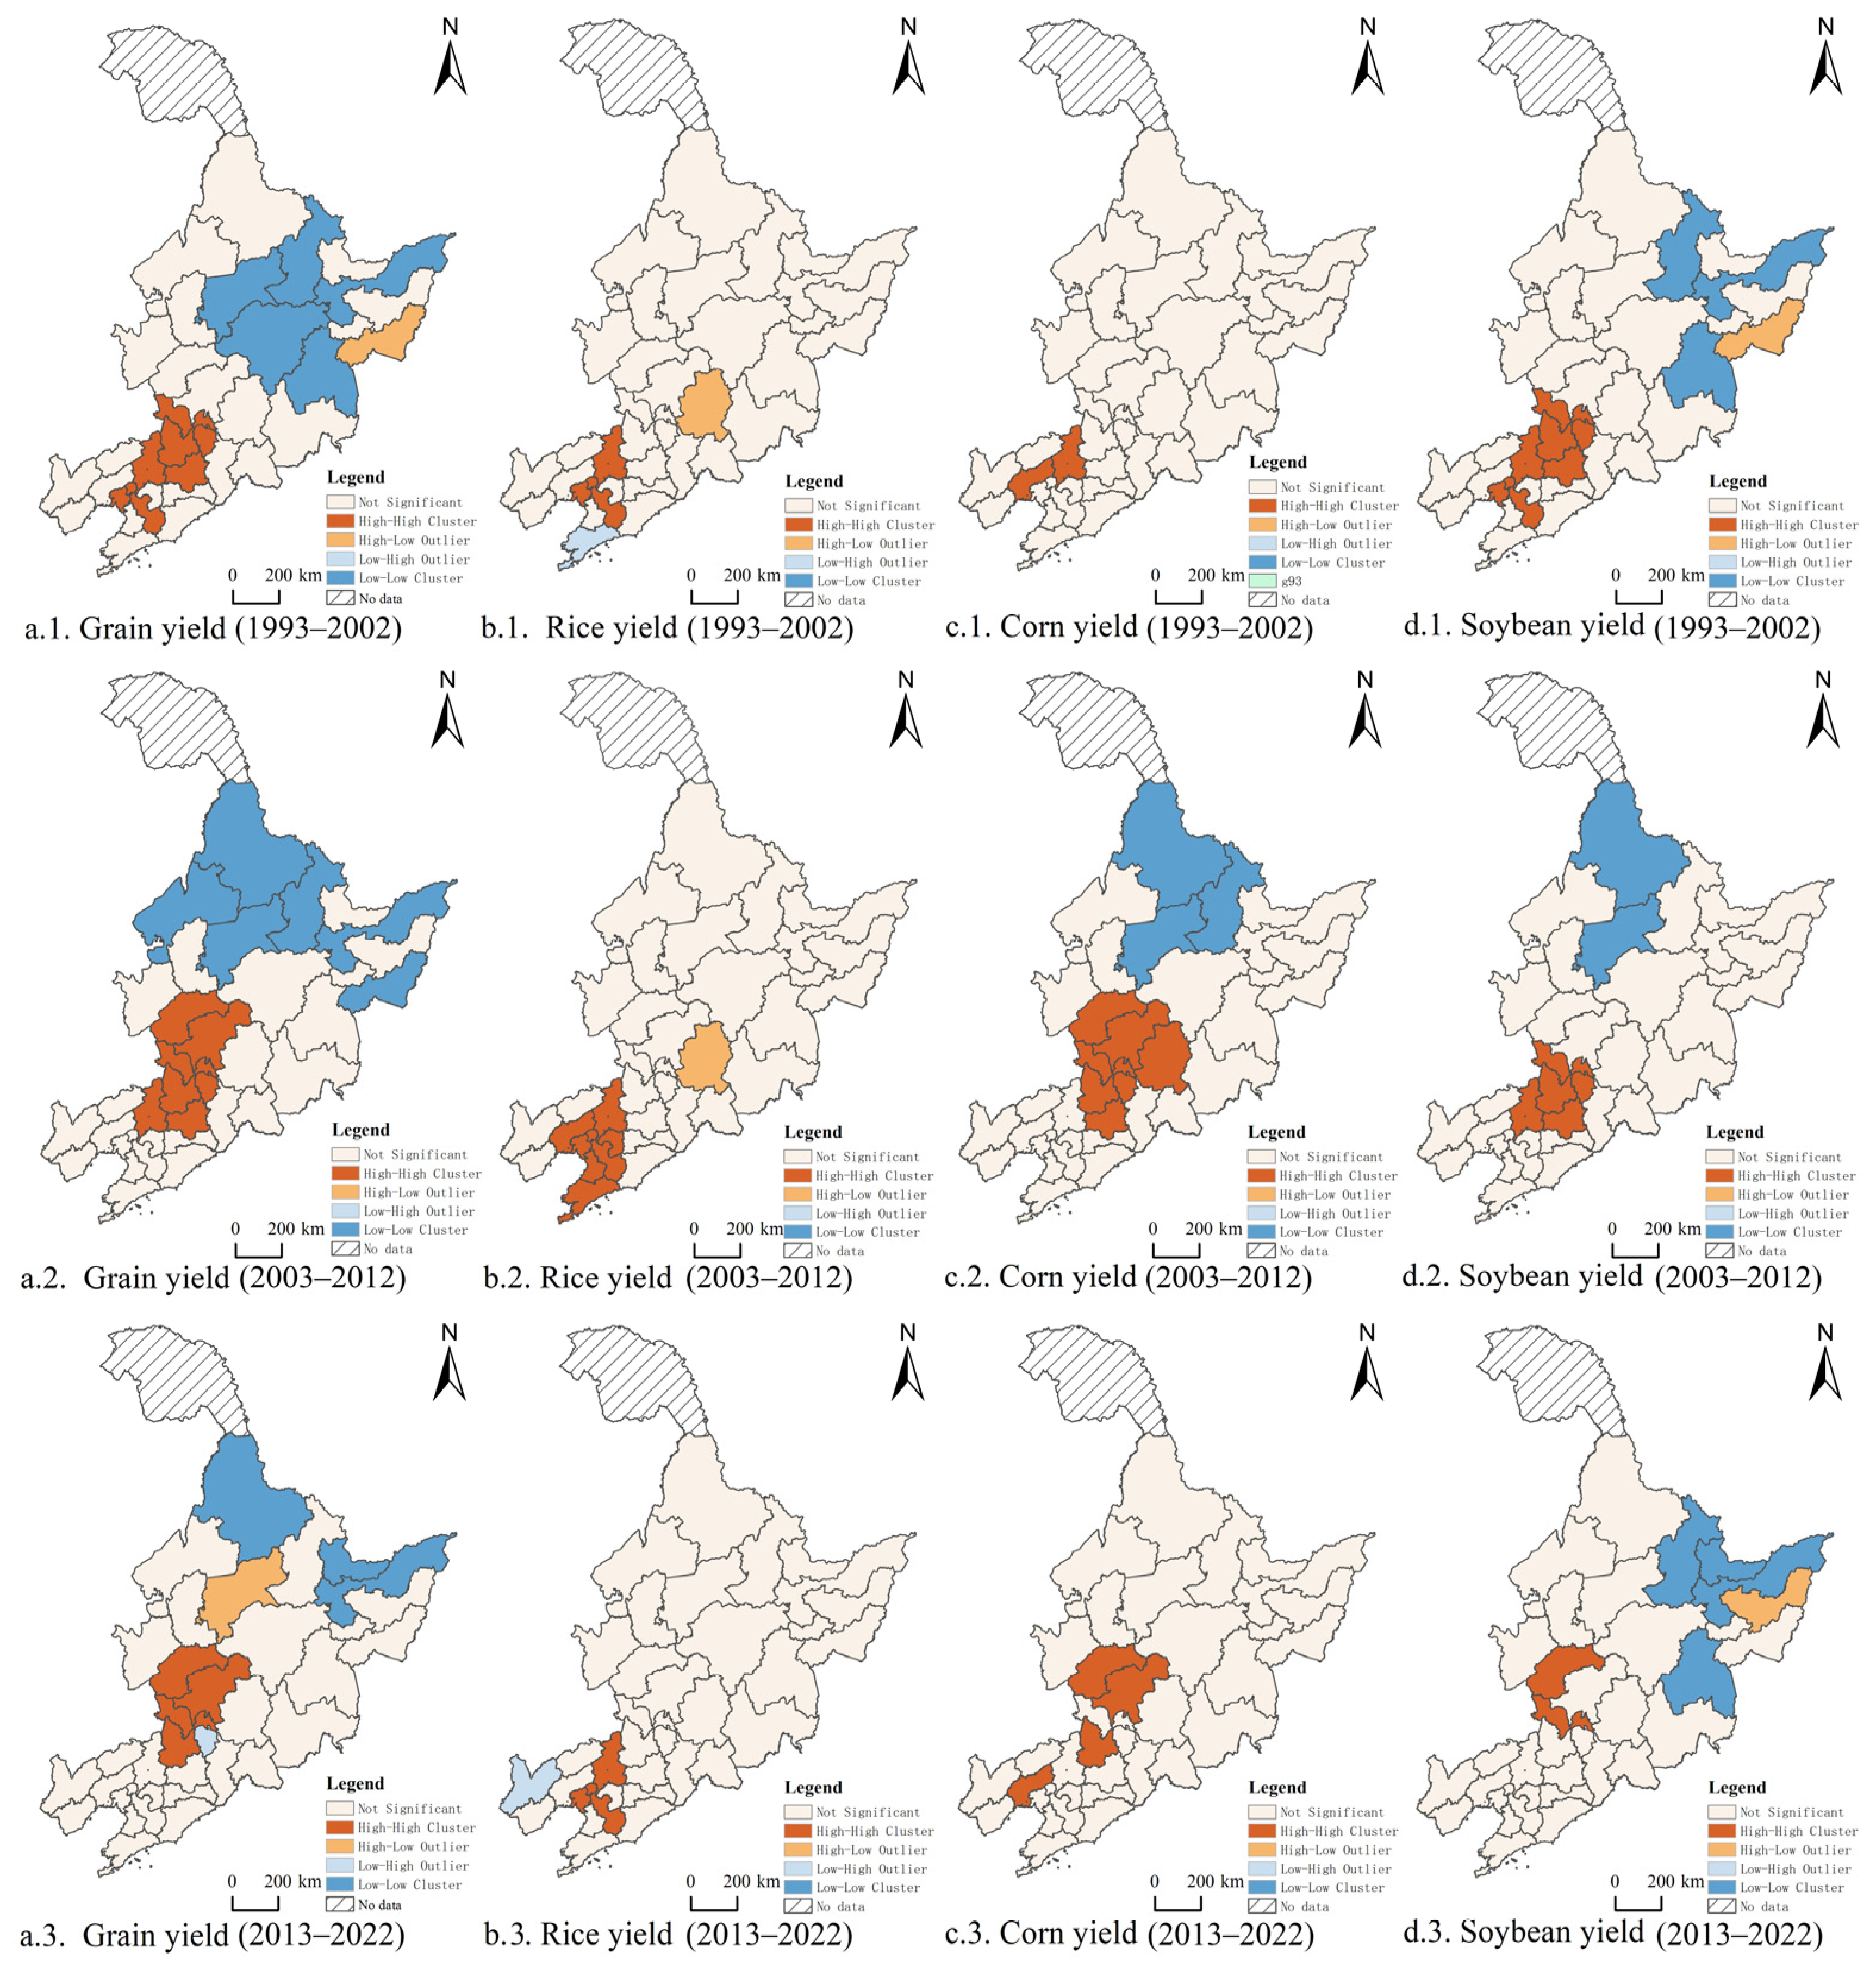
Table 1 presents the estimated results of the global Moran’s I and its Z-values from 1993 to 2022. The results indicate that all global Moran’s I scores are positive. Except for corn and soybeans in the period of 1993–2002, the Moran’s I values of all crops in other periods passed the significance test at different levels, suggesting that the distribution of yield per unit area of each grain crop exhibits spatial agglomeration.
Figure 4 presents the results of the local Moran’s I analysis from 1993 to 2022, clearly revealing the spatial clustering characteristics of major grain crops’ yield per unit area and their temporal evolution patterns.
For total grain (Figure 5a), during 1993–2002, significant “high–high” clusters in yield per unit area formed in border regions of Jilin and Liaoning provinces, such as Siping and Tieling. From 2003 to 2012, the extent of “high–high” clusters expanded further, while “low–low” clusters contracted correspondingly. During 2013–2022, “high–high” clusters shifted northward, with cities like Songyuan and Changchun (Jilin Province) emerging as new high-yield grain hubs.
For rice (Figure 5b), a small-scale “high–high” cluster formed in central Liaoning during 1993–2002. This cluster expanded to central and southern Liaoning cities (e.g., Shenyang, Dalian) from 2003 to 2012. However, the “high–high” clustering trend weakened in 2013–2022.
For corn (Figure 5c), spatial distribution characteristics showed that, during 1993–2002, agglomeration centers formed in Liaoning’s Shenyang and Jinzhou. From 2003 to 2012, corn’s spatial agglomeration intensified significantly, with “high–high” clusters in Jilin’s Songyuan and Changchun, and “low–low” clusters in Heilongjiang’s Heihe and Yichun. During 2013–2022, “high–high” clusters contracted.
For soybeans (Figure 5d), spatial distribution exhibited a distinct evolutionary trajectory. During 1993–2002, “high–high” clusters formed in Liaoning–Jilin border cities (e.g., Siping, Tieling), while “low–low” clusters appeared in eastern Heilongjiang (e.g., Yichun, Jiamusi). From 2003 to 2012, “high–high” clusters diminished in scope and shifted northward. This trend strengthened in 2013–2022, with new agglomeration centers emerging in Jilin’s Songyuan and Siping.

3.4. The Response of Grain Yield to Climate Change in NEC

This study selects rainfall, temperature, and sunshine duration during the growing season as independent variables to investigate how the yields of major grain crops in the three northeastern provinces respond to climate change. The VIF values of these three variables are all less than 5, indicating the absence of multicollinearity; thus, they are suitable for exploring the relationship between climate change and grain yield. The adjusted R2 of the GTWR model is 0.6225, meaning that the selected variables can explain 62.25% of the variation in grain yield. Therefore, the GTWR model, combined with the selected variables, can effectively detect the spatiotemporal heterogeneity of the climatic drivers of yield. As shown in the summary table of GTWR coefficient estimates (Table 2), the coefficients of the independent variables vary significantly across space and time, exerting distinct negative or positive effects on yield.

3.4.1. Spatiotemporal Effects of Rainfall

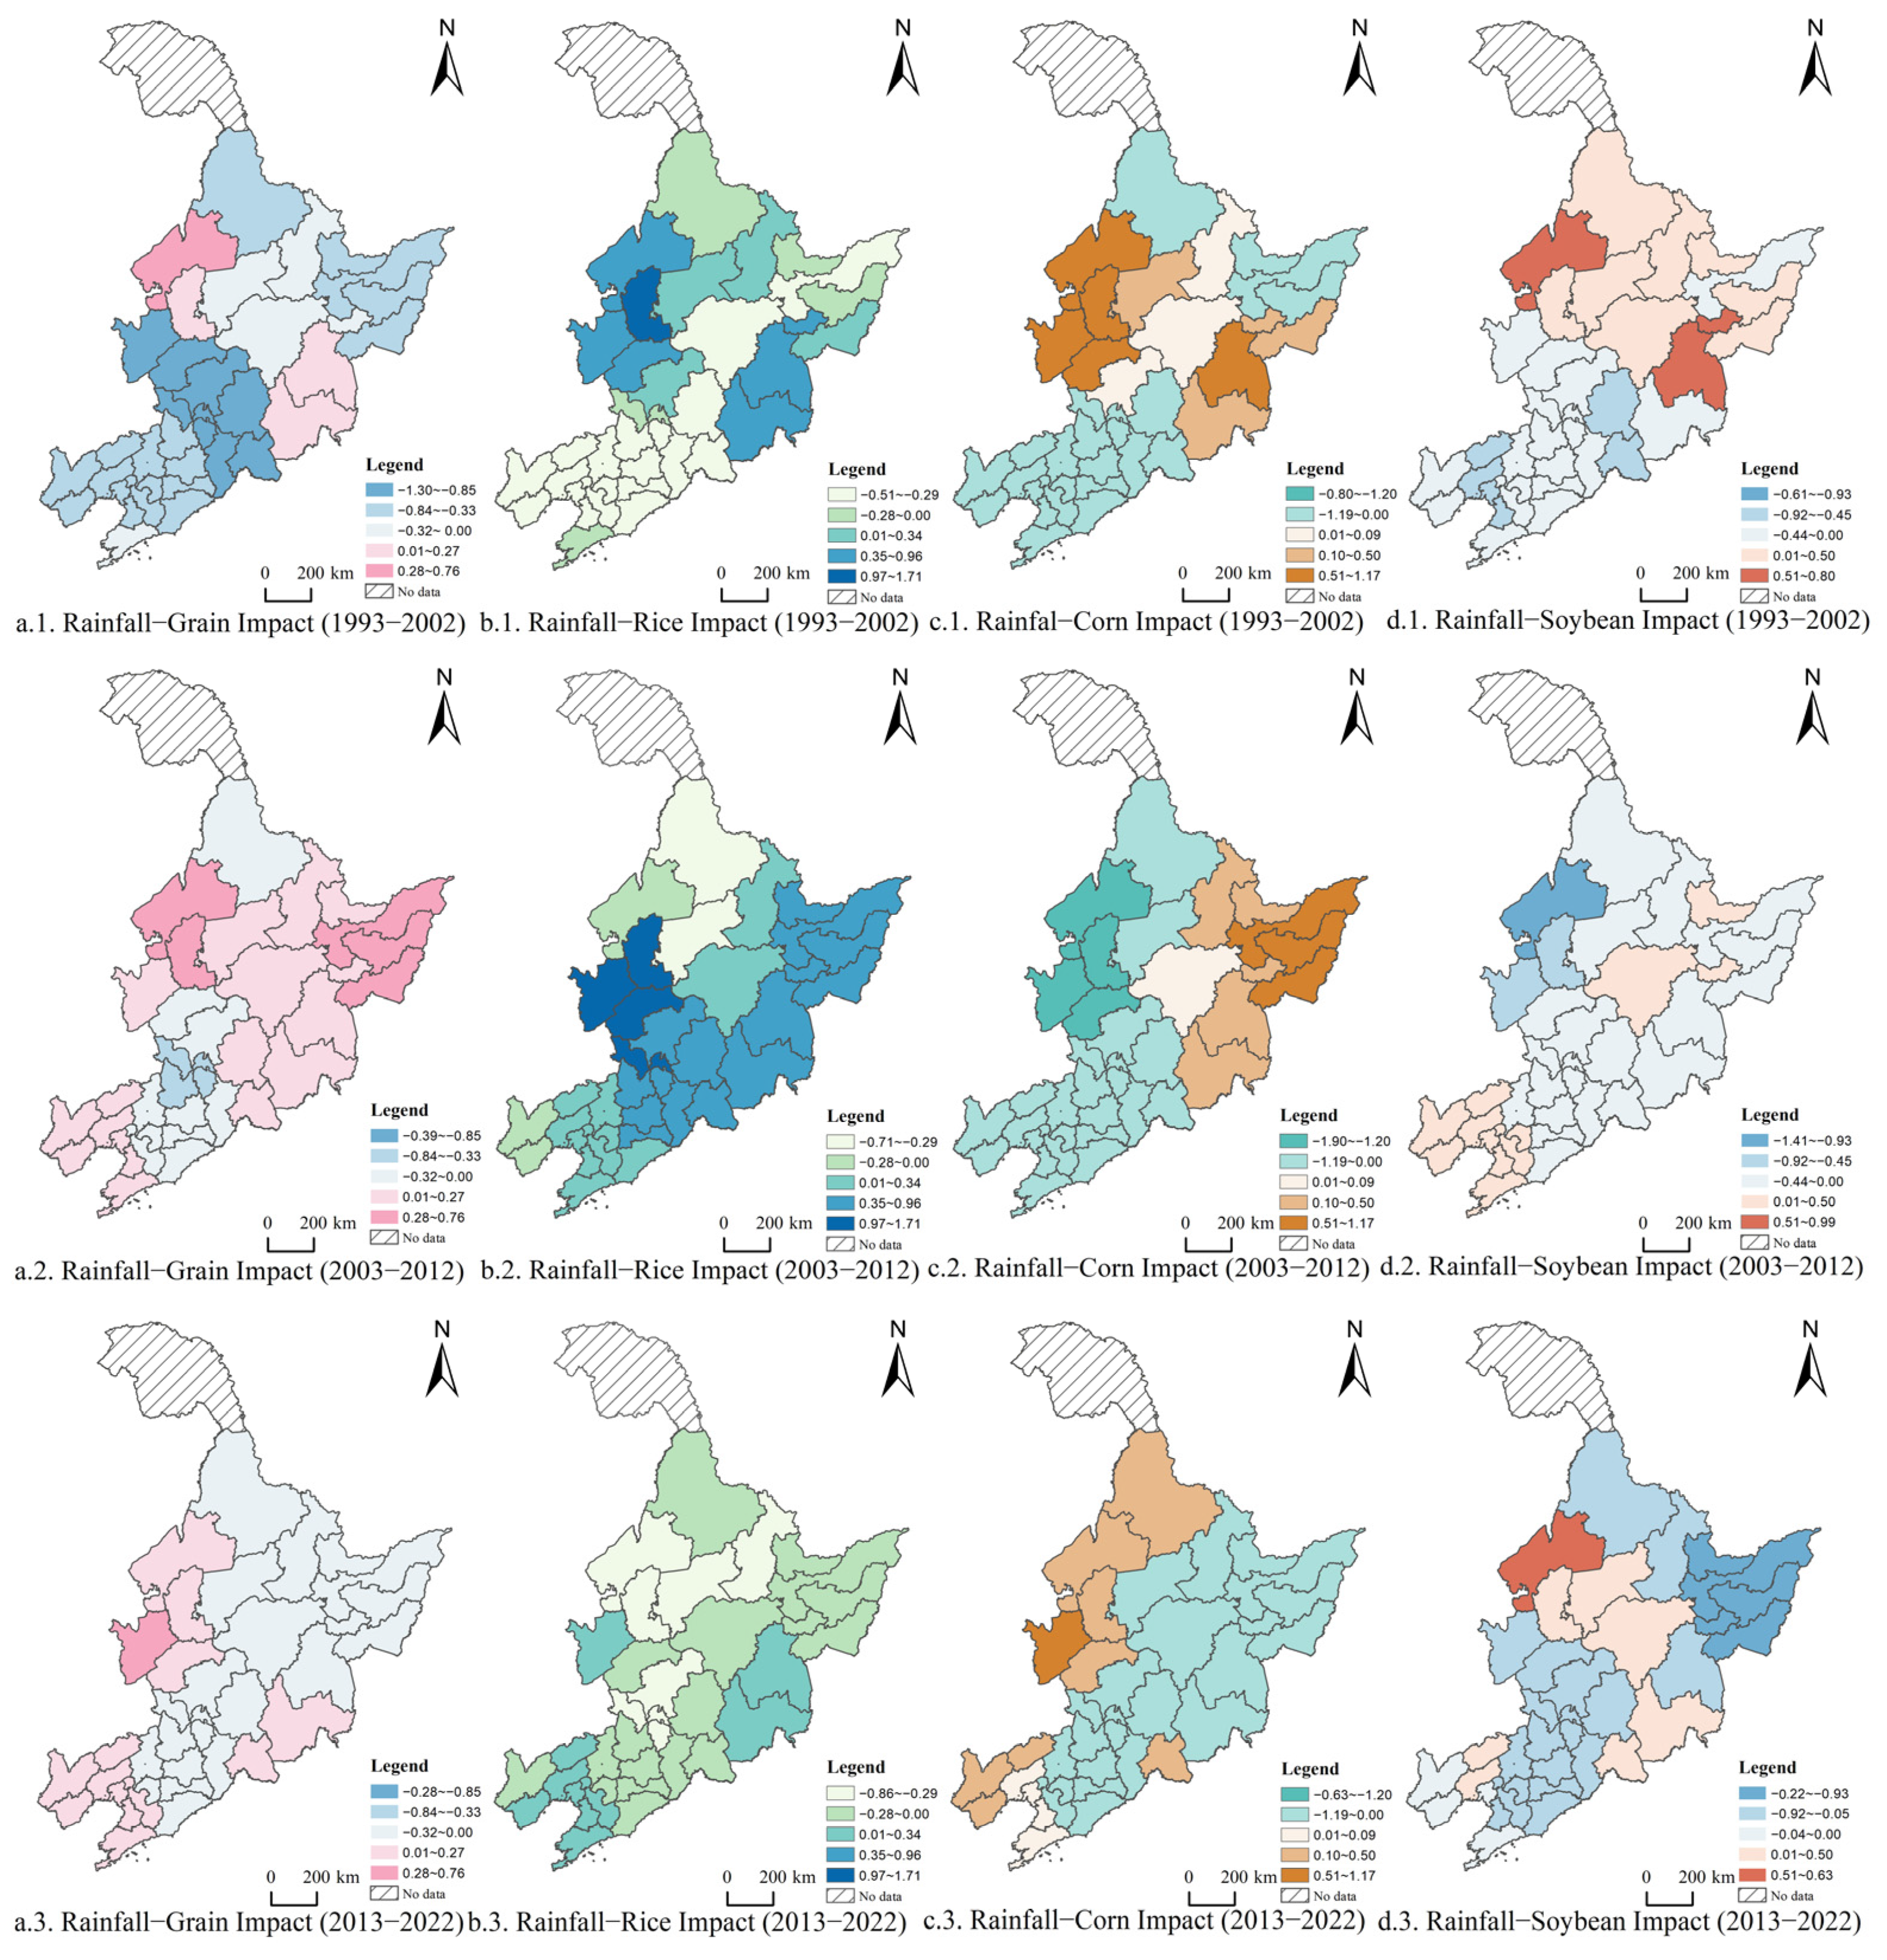
Based on the GTWR model analysis, the spatiotemporal variations in the rainfall factor are shown in Figure 6.
For total grain (Figure 6a), the impact of rainfall on yield per unit area first increased and then decreased, eventually stabilizing. From 1993 to 2002, regression coefficients ranged from −1.295 to 0.357. Regions such as Changchun and Siping in Jilin Province exhibited a strong negative effect, while Mudanjiang and Qiqihar in Heilongjiang Province showed a positive effect, with significant regional differentiation. From 2003 to 2012, coefficients increased to the range of −0.3871 to 0.7551: negative effects in Jilin Province weakened, while positive effects shifted northward to areas such as Shuangyashan and Jixi in northeastern Heilongjiang. From 2013 to 2022, coefficients ranged from −0.2817 to 0.5789, with reduced regional differences, forming a new west—high and east—low differentiation pattern.
For rice (Figure 6b), the positive effect of rainfall on rice yield per unit area first increased and then decreased, while the negative effect continued to strengthen; regional differences expanded initially and then narrowed. From 1993 to 2002, coefficients ranged from −0.5063 to 1.1820, exhibiting a spatial pattern that weakened from north to south. Cities such as Daqing, Mudanjiang, and Songyuan had stronger positive effects, while Liaoning Province showed a negative effect. From 2003 to 2012, coefficients increased to the range of −0.7082 to 1.7063, with widened regional differences: cities such as Daqing and Baicheng exhibited significant positive effects. From 2013 to 2022, coefficients ranged from −0.8558 to 0.2312, with narrowed regional differences. Cities such as Jinzhou and Panjin, and Baicheng and Yanbian showed stronger positive effects.
For corn (Figure 6c), the impact of rainfall on corn yield per unit area decreases from north to south, showing a distinct north-to-south gradient distribution, with the absolute values of regression coefficients decreasing over time. From 1993 to 2002, coefficients ranged from −0.7988 to 1.1615: cities such as Daqing and Baicheng at the Jilin–Heilongjiang border exhibited stronger positive effects, while Liaoning Province showed a negative effect. From 2003 to 2012, coefficients ranged from −1.9046 to 0.6565, with widened regional differences and an east—high and west—low pattern emerging; cities such as Shuangyashan and Jixi in Heilongjiang exhibited significant positive effects. From 2013 to 2022, coefficients ranged from −0.6278 to 0.5005, with narrowed regional differences: cities such as Baicheng and Daqing in the west exhibited positive effects, while Qitaihe and Jixi in northeastern Heilongjiang showed negative effects.
For soybeans (Figure 6d), the impact of rainfall on soybean yield per unit area exhibits a north–south differentiated spatial pattern, with the negative effect continuously increasing and the positive effect first decreasing then increasing. From 1993 to 2002, coefficients ranged from −0.6132 to 0.7025: cities such as Qiqihar and Mudanjiang in Heilongjiang exhibited stronger positive effects, forming a north—high and south—low pattern. From 2003 to 2012, coefficients ranged from −1.4088 to 0.2256: cities such as Chaoyang and Dalian in Liaoning exhibited higher positive effects, presenting a south—high and north—low distribution. From 2013 to 2022, coefficients increased to the range of −1.2230 to 0.6630, with reduced regional differences; cities such as Qiqihar and Suihua in Heilongjiang exhibited significant positive effects.

3.4.2. Spatiotemporal Effects of Temperature

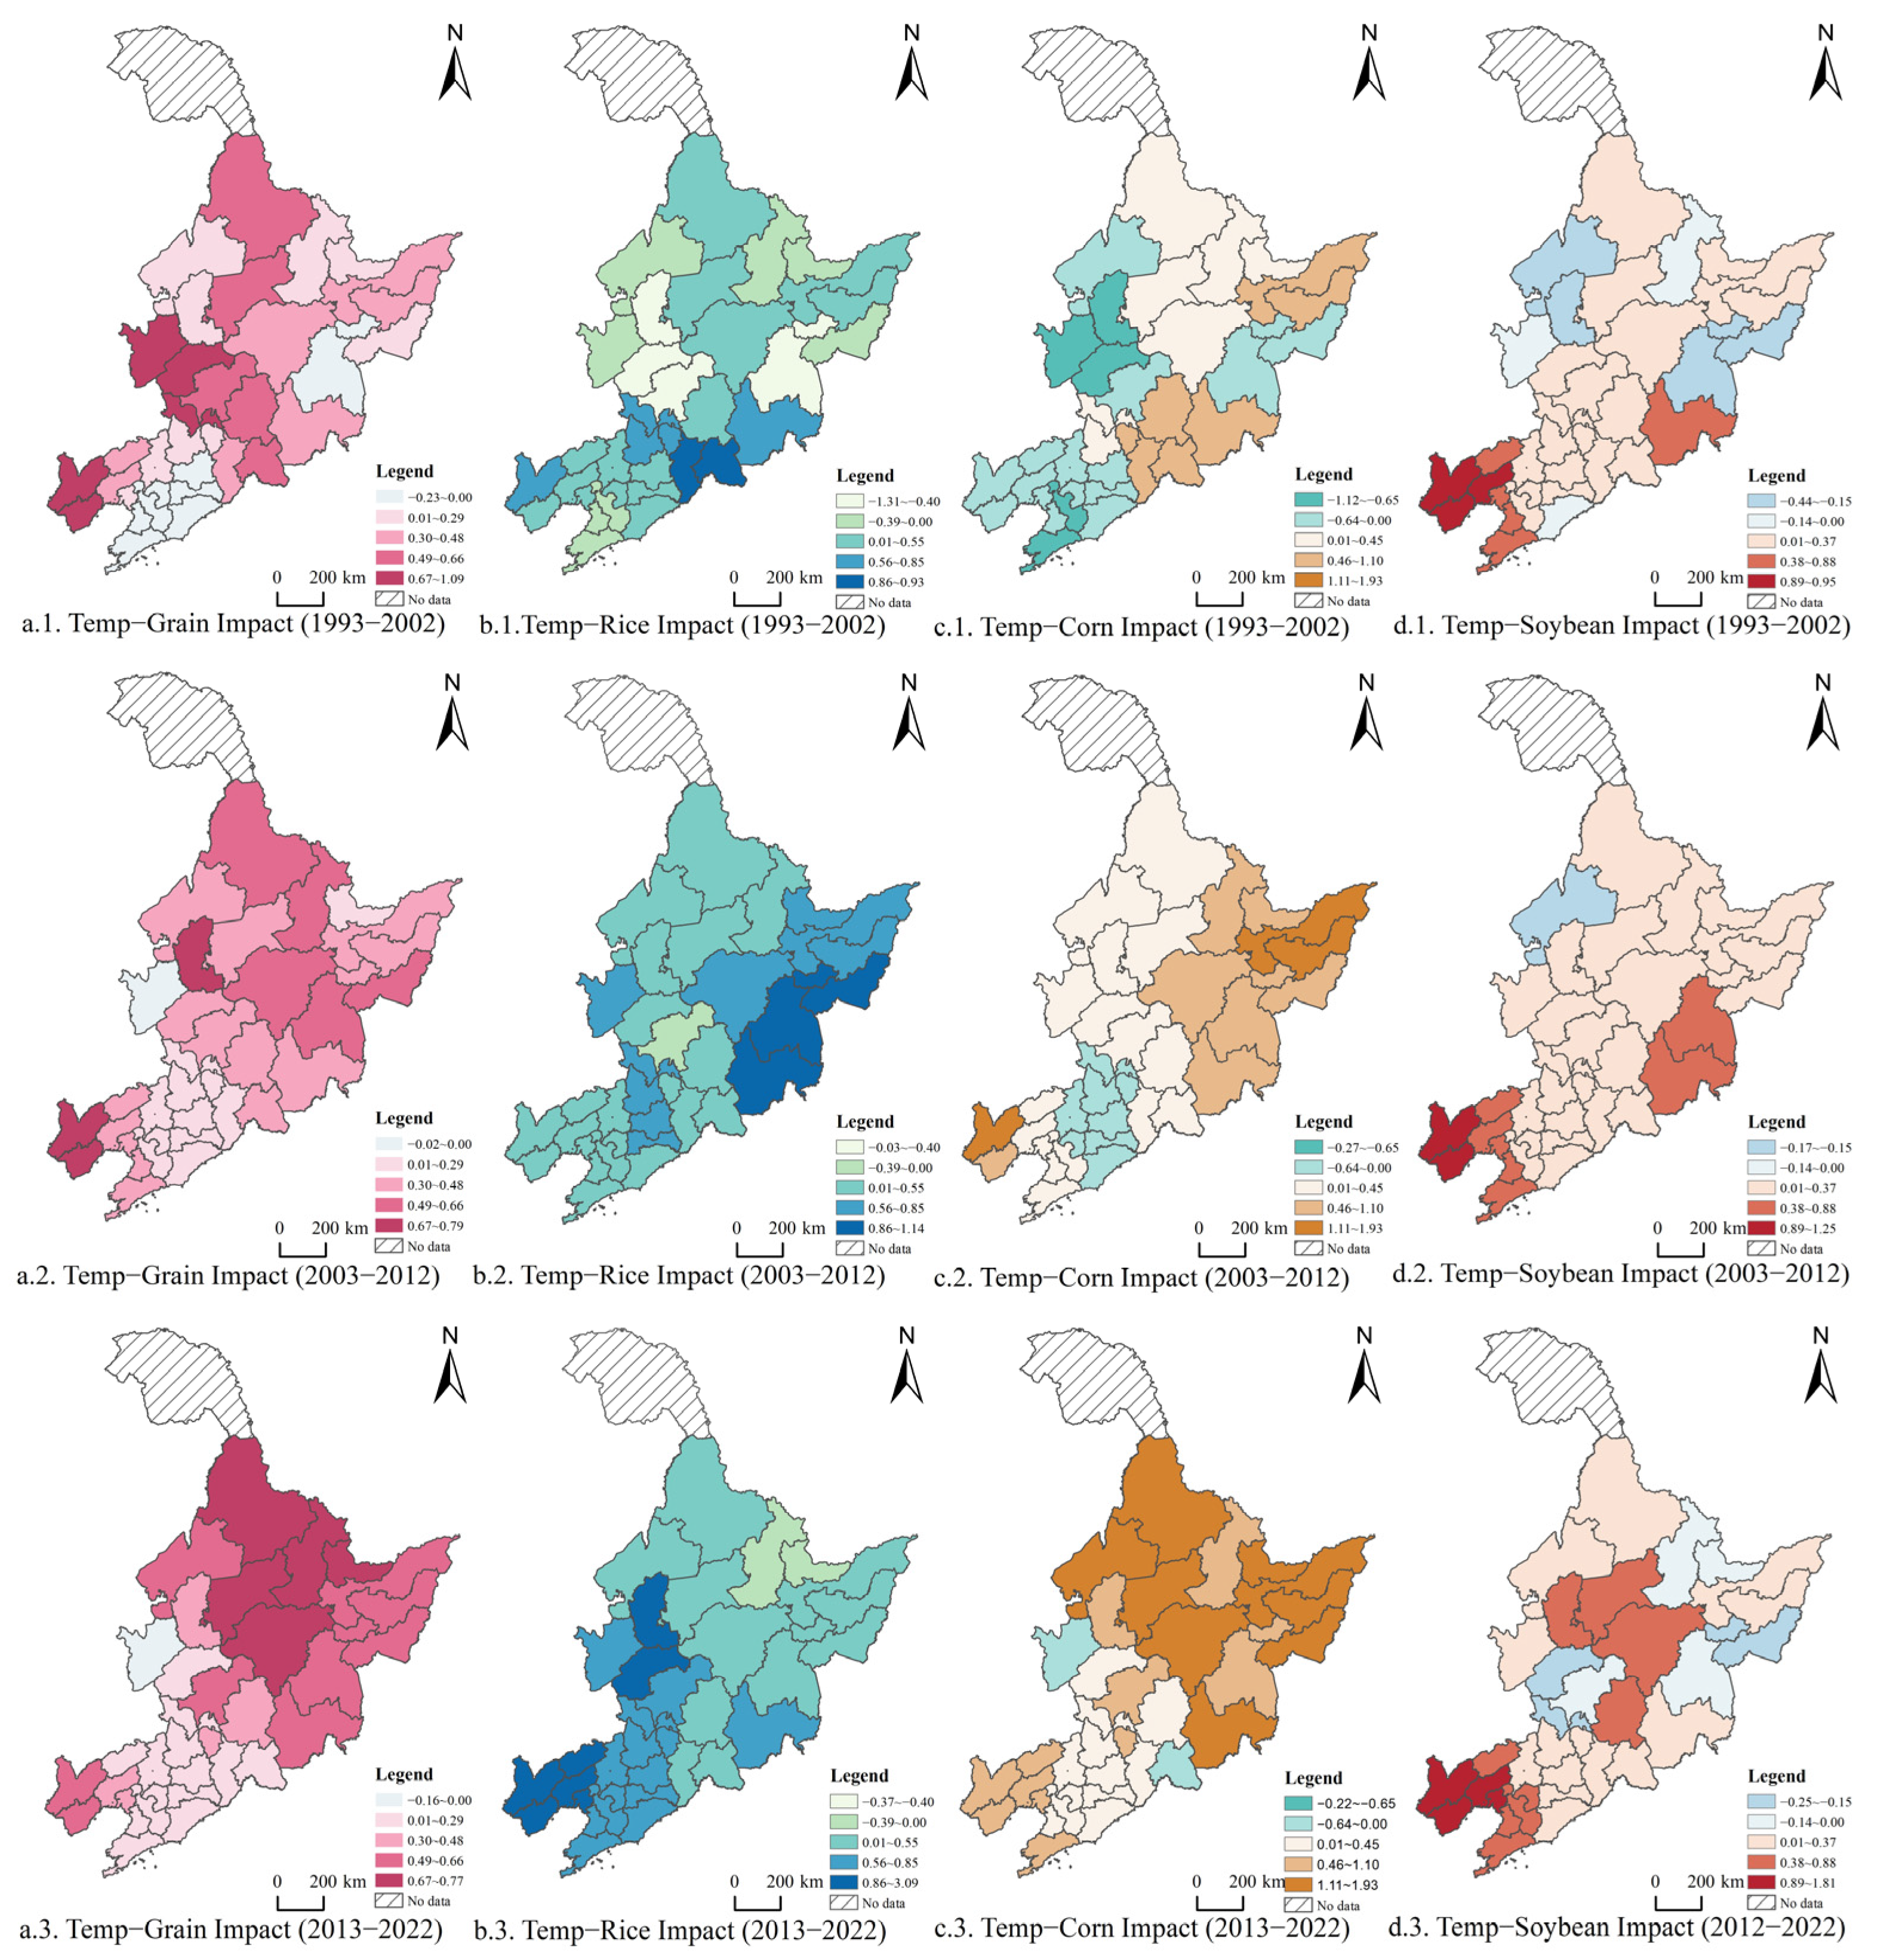
Based on the GTWR model analysis, the spatiotemporal variations in the temperature factor are shown in Figure 7.
For total grain (Figure 7a), the impact of temperature on yield per unit area decreases from north to south, with the absolute values of regression coefficients decreasing temporally. During 1993–2002, regression coefficients range from −0.2258 to 1.0853. Higher positive effects are observed in eastern Liaoning cities (e.g., Chaoyang, Huludao) and Jilin cities (e.g., Baicheng, Songyuan), while negative effects appear in southern Liaoning (e.g., Dalian, Dandong). Overall, the spatial pattern exhibits multi-level dispersion with intermingled high and low values, lacking a significant clustering trend. During 2003–2012, coefficients range from −0.0227 to 0.7864, with narrowed regional differences. Higher positive effects distribute across northern Heilongjiang, Jilin, and southern Liaoning, forming a gradient spatial distribution. During 2013–2022, coefficients range from −0.1615 to 0.7722, with pronounced spatial differentiation: high-value areas concentrate in Heilongjiang (e.g., Harbin, Suihua), while low-value areas dominate Liaoning and Jilin, presenting a north—high and south—low gradient.
For rice (Figure 7b), the positive effect of temperature on rice yield per unit area gradually strengthens, while the negative effect continuously weakens, gradually forming a “lower in the north and higher in the south” spatial pattern. During 1993–2002, coefficients range from −1.3096 to 0.9289, with higher positive effects in Liaoning–Jilin border cities (e.g., Tonghua, Baishan). During 2003–2012, coefficients increase to the range of −0.0308 to 1.1383, with significant positive effects in eastern Heilongjiang and Jilin (e.g., Yanbian, Mudanjiang). During 2013–2022, coefficients range from −0.3741 to 3.0939, with positive effects strengthening markedly and forming a south—high and north—low gradient; high-value areas concentrate in western Liaoning (e.g., Huludao, Chaoyang).
For corn (Figure 7c), the impact of temperature on corn yield per unit area exhibits a “higher in the north and lower in the south” spatial differentiation pattern, with the positive effect strengthening over time and the negative effect gradually weakening. During 1993–2002, coefficients range from −1.1152 to 0.8828, with significant negative effects overall; only a few regions (e.g., Baishan, Yanbian in Jilin; Jiamusi, Jixi in Heilongjiang) show stronger positive effects. During 2003–2012, coefficients increase to −0.2702 to 1.1376: negative effects weaken, while positive effects strengthen in eastern Heilongjiang (e.g., Shuangyashan, Jiamusi), initially forming a north—high and south—low pattern. During 2013–2022, coefficients further increase to −0.2207 to 1.9248, with positive effects continuing to strengthen and the north—high and south—low spatial differentiation becoming significant; high-value areas concentrate in Heilongjiang (e.g., Harbin, Suihua).
For soybeans (Figure 7d), the magnitude of the positive impact of temperature on soybean yield per unit area has strengthened over time. During 1993–2002, coefficients range from −0.4372 to 0.9543, showing a south—high and north—low differentiation pattern: high-value areas concentrate in southern Liaoning (e.g., Chaoyang, Huludao), while low-value areas dominate Heilongjiang. During 2003–2012, coefficients increase to −0.1725 to 1.2496, with positive effects expanding; only western Heilongjiang (Qiqihar) exhibits a negative effect. During 2013–2022, coefficients rise to −0.2460 to 1.8102, with high-value areas primarily in Liaoning and central Heilongjiang, forming a dual-core agglomeration spatial pattern.

3.4.3. Spatiotemporal Effects of Sunshine Duration

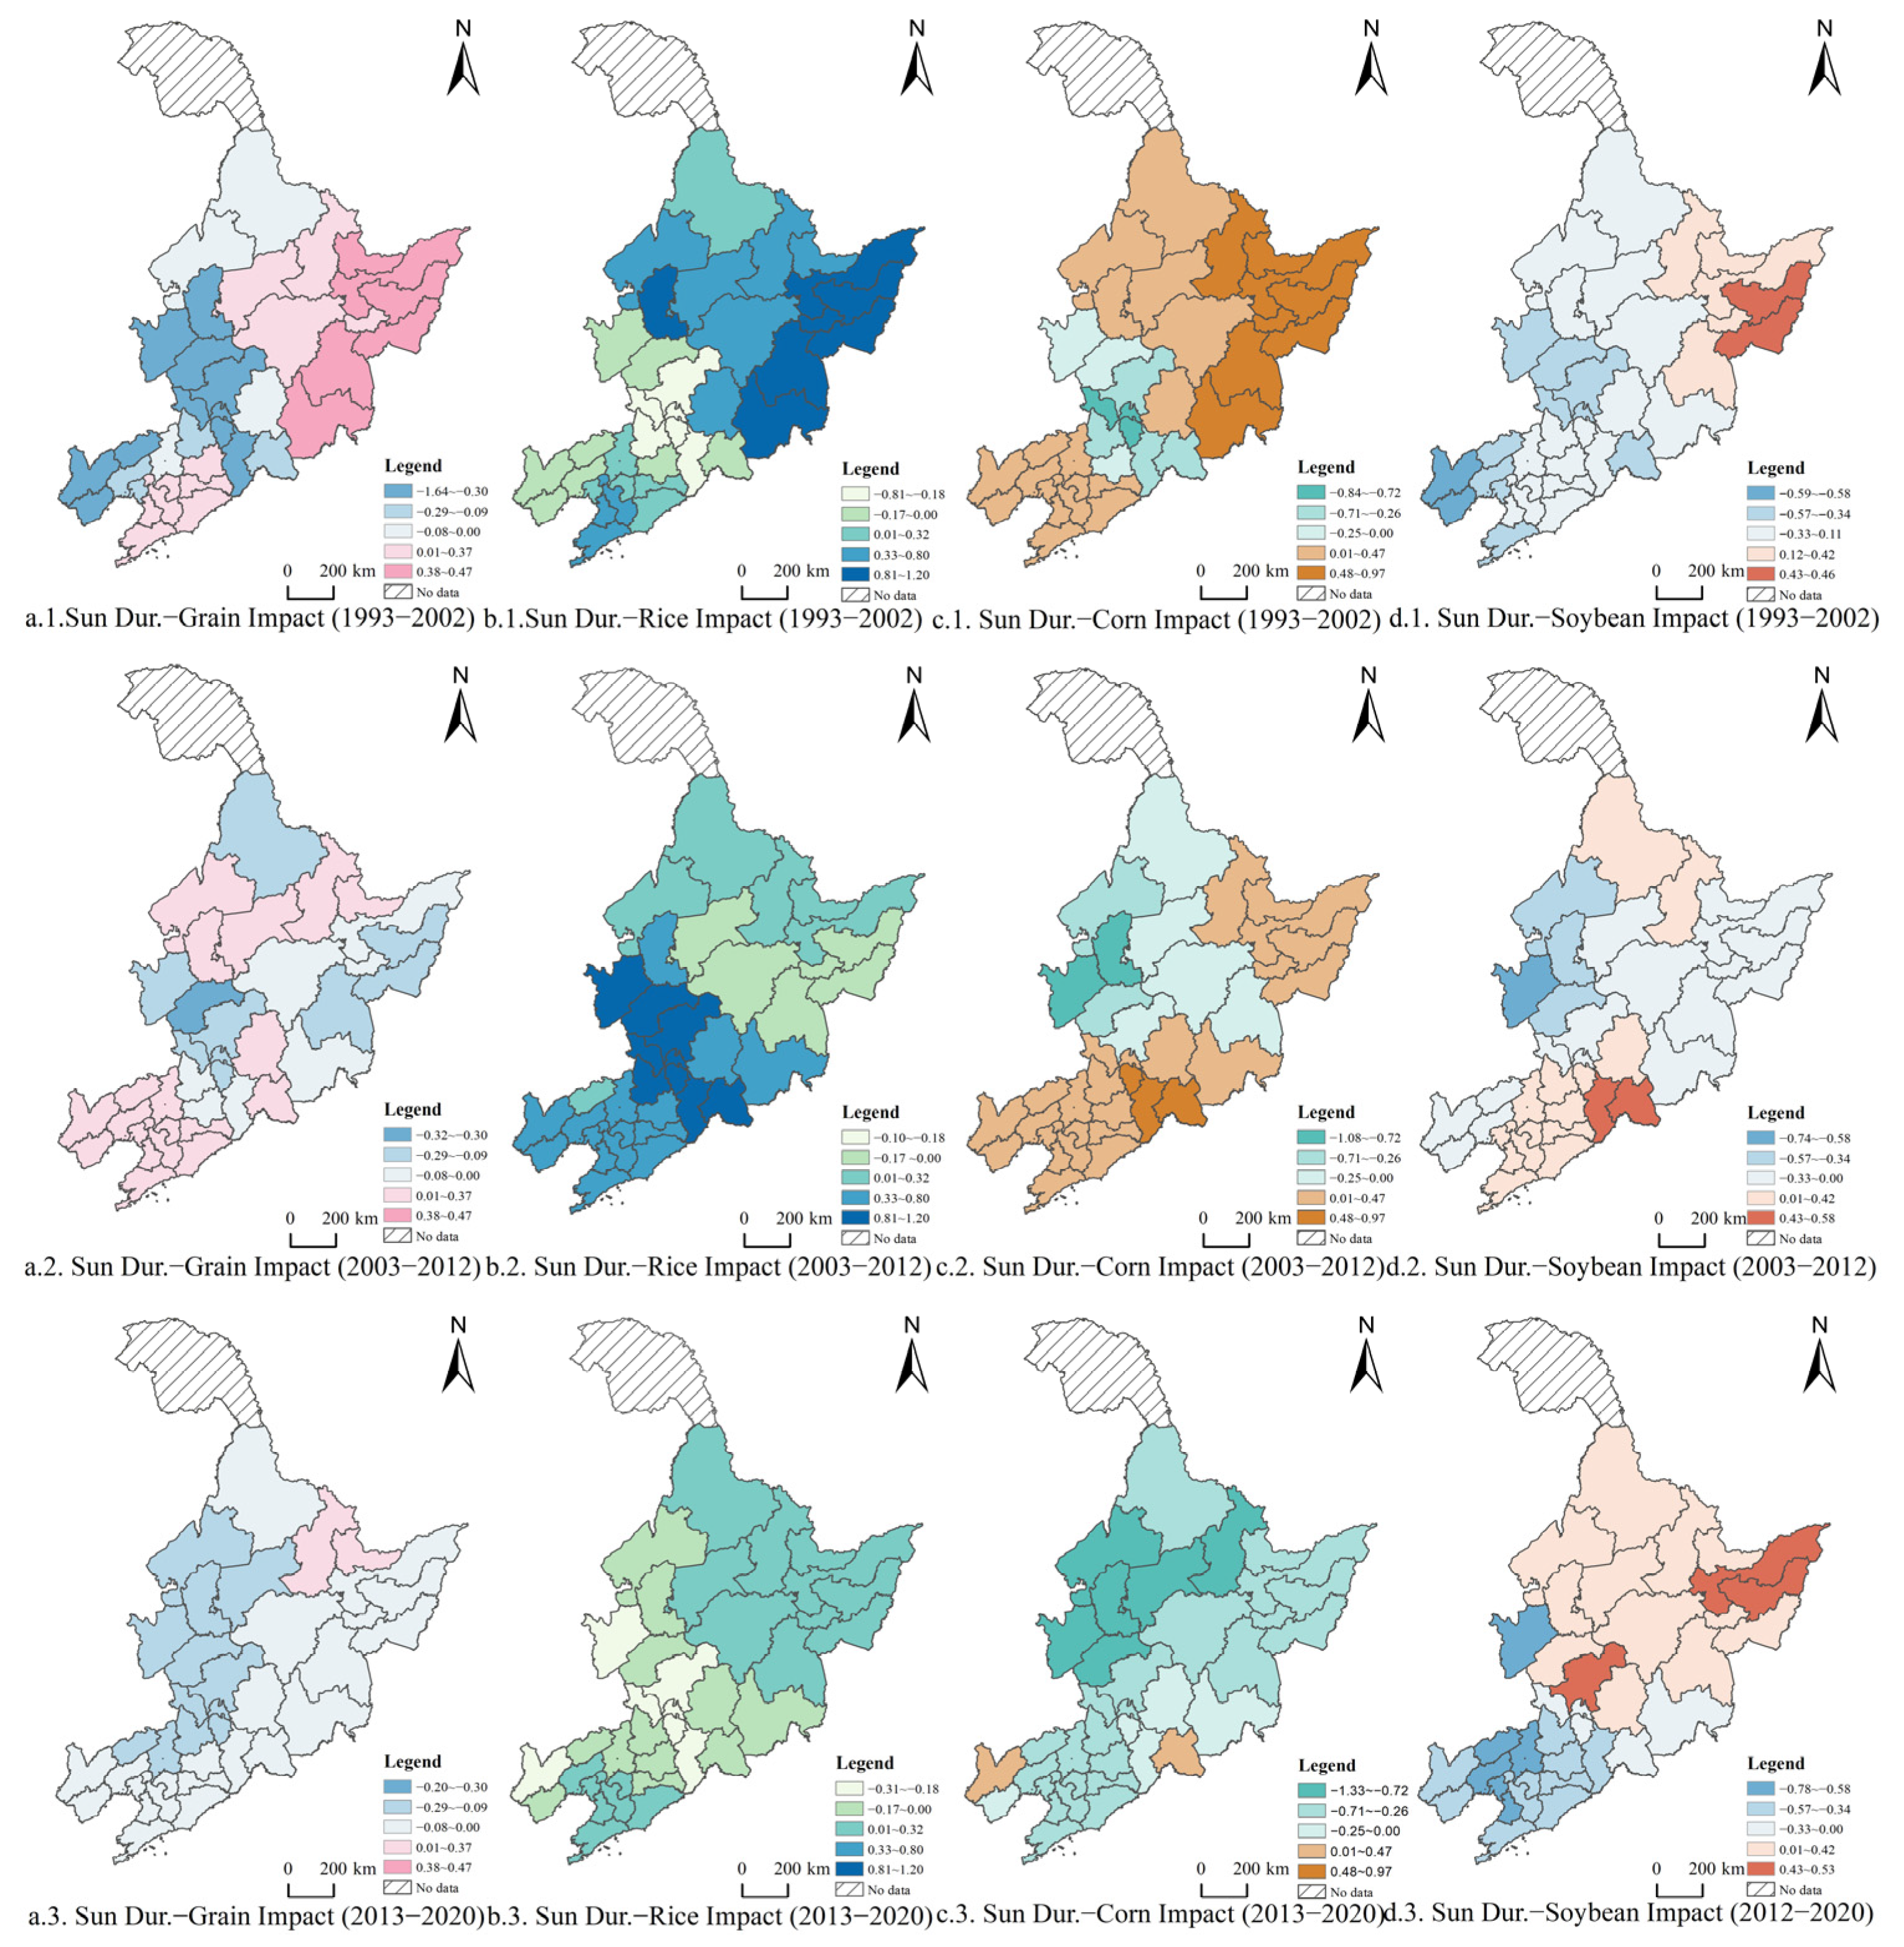
Based on the GTWR model analysis, the spatiotemporal variations in sunshine duration are shown in Figure 8.
For total grain (Figure 8a), the impact of sunshine duration on yield per unit area weakens over time. During 1993–2002, regression coefficients range from −1.6440 to 0.4663. Areas with stronger positive effects are concentrated in Heilongjiang Province and eastern Jilin (e.g., Yanbian in Jilin; Mudanjiang in Heilongjiang), while regions with stronger negative effects dominate Liaoning Province and western Jilin (e.g., Siping, Chaoyang), presenting a spatial pattern of “higher in the east and lower in the west”. During 2003–2012, coefficients span −0.3246 to 0.1512, with negative effects expanding geographically. Higher negative effects are observed in eastern Heilongjiang (e.g., Mudanjiang, Jixi) and Jilin cities including Songyuan and Changchun. During 2013–2020, coefficients are in the range of −0.1989 to 0.0335, with negative effects continuing to spread spatially. Only Yichun and Hegang in Heilongjiang exhibit positive effects, forming an overall “lower in the east and higher in the west” distribution.
For rice (Figure 8b), the impact of sunshine duration on rice yield per unit area exhibits a spatial differentiation pattern of “higher in the north and lower in the south”, with its influence weakening over time. During 1993–2002, coefficients range from −0.8091 to 0.9089: strong positive effects are evident in eastern Heilongjiang (e.g., Mudanjiang, Yanbian), while negative effects appear in border regions of Liaoning and Jilin (e.g., Siping, Tieling). During 2003–2012, coefficients increase to 0.1022 to 1.2041, with all effects being positive; high-value areas concentrate in Jilin cities such as Siping and Tieling. During 2013–2020, coefficients span −0.3134 to 0.1880, with reduced regional differences. Stronger positive effects occur in Heilongjiang and southern Liaoning, whereas negative effects are observed in Jilin cities including Siping and Changchun.
For corn (Figure 8c), the positive effect of sunshine duration on corn yield per unit area weakens over time, while the negative effect gradually strengthens. During 1993–2002, coefficients range from −0.8437 to 0.9690, with significant positive effects overall. High-value areas lie in eastern Heilongjiang (e.g., Mudanjiang, Yanbian), while negative effects are found in Jilin cities such as Siping and Baishan. During 2003–2012, coefficients decrease to −1.0823 to 0.9336, with negative effects spreading. Significant negative effects are observed in western Heilongjiang (e.g., Baicheng, Daqing), with obvious regional differences forming a “higher in the south and lower in the north” spatial pattern. During 2013–2020, coefficients further decrease to −1.3252 to 0.2636, with negative effects continuing to expand. More significant negative effects are evident in Heilongjiang cities including Qiqihar and Suihua.
For soybeans (Figure 8d), the impact of sunshine duration on soybean yield per unit area exhibits a spatial differentiation pattern of “higher in the north and lower in the south”. During 1993–2002, coefficients range from −0.5862 to 0.4599, with significant negative effects overall; only northeastern Heilongjiang cities such as Shuangyashan and Jixi show positive effects. During 2003–2012, coefficients span −0.7375 to 0.5807, with positive effects expanding moderately. Strengthened positive effects are observed in Liaoning and eastern Jilin cities including Baishan and Tonghua. During 2013–2020, coefficients range from −0.7774 to 0.5284: positive effects persist in Heilongjiang and northern Jilin, while negative effects dominate Liaoning and southern Jilin.

4. Discussion

4.1. Spatiotemporal Pattern Characteristics of Grain Yield

Global climate warming has led to rising temperatures, uneven spatiotemporal distribution of precipitation, and frequent drought events, posing a severe threat to agricultural production. In-depth research on the impact of climate change on grain yield is of great significance for effectively addressing future climate risks and ensuring global food security, a topic that has currently attracted widespread attention from scholars both domestically and internationally [52,53].
This study analyzes the variational trends of unit yields of major crops and climate factors in NEC from 1993 to 2022. The results show that except for the decrease in soybean yield per unit area in Liaoning and Jilin, the yields per unit area of other crops all exhibit an upward trend. Climatically, there are trends of rising temperatures, fluctuating rainfall, and a gradual decrease in sunshine duration, with spatial heterogeneity. This finding is consistent with the research conclusions of Yaqun L [54].
In addition, this study employed global and local Moran’s I to identify the spatiotemporal agglomeration patterns of crop yields per unit area at the prefecture-level city scale in NEC across three time periods: 1993–2002, 2003–2012, and 2013–2022. The results indicate that the hotspots (high–high agglomeration) of crop yields per unit area in NEC have exhibited dynamic changes over time, including expansion, migration, and contraction. This change is closely related to the combined driving forces of climate warming, policy adjustments, and the diffusion of agricultural technologies [55]. Meanwhile, regional differences are significant: due to its higher latitude and lower accumulated temperature, Heilongjiang Province has become the main distribution area of low-yield agglomerations; in contrast, Liaoning and Jilin provinces, relying on superior natural conditions and policy support, have emerged as core high-yield areas.

4.2. Research on Spatiotemporal Heterogeneity of Climatic Driving Factors

Numerous studies have examined the spatial distribution of crop yields and their driving factors [56,57,58,59], but these studies have failed to fully consider differences among crops and spatiotemporal variations in driving factors. Therefore, this study introduces the GTWR model, with prefecture-level cities as the research unit, to analyze the spatiotemporal heterogeneity of factors driving the yield per unit area of major grain crops in NEC across three periods: 1993–2002, 2003–2012, and 2013–2022. Three key climatic variables—average rainfall, average temperature, and average sunshine duration during the growing season—are selected to quantify the specific impact of climate change on crop yield per unit area. Spatiotemporal differences in coefficients estimated by the GTWR model reveal the spatiotemporal heterogeneity of driving factors. Regional crop management policies should fully account for such heterogeneity to accommodate local variations, thereby providing targeted support for agricultural decision-making.

4.2.1. Spatiotemporal Heterogeneity Effects of Rainfall

Rainfall exerts a significant spatiotemporally heterogeneous impact on crop yield per unit area. Temporally, its influence has gradually shifted from being dominated by negative effects to the emergence of positive effects, with regional disparities first expanding and then narrowing toward equilibrium. Spatially, areas with positive effects expanded from Changchun and Siping (Jilin Province) to northeastern Heilongjiang Province, eventually forming a “higher in the west and lower in the east” pattern. Notably, this pattern conflicts to some extent with the overall uncertainty in precipitation trends (e.g., insignificant precipitation growth in Jilin and Liaoning provinces). However, the sustained growth of crop yields indicates that a single precipitation factor cannot fully explain this dynamic, necessitating a comprehensive analysis incorporating non-climatic factors.
The underlying mechanisms are as follows: In the early stage, underdeveloped agricultural infrastructure and frequent waterlogging disasters led to significant negative effects. Global warming has driven the northward shift of rain belts, increasing rainfall in regions such as Heilongjiang; coupled with improved farmland water conservancy facilities, this has significantly enhanced positive effects. Urbanization in the eastern region has weakened rainfall’s promotional impact on crop yields, while newly reclaimed farmland in the west has achieved stable yield responses by supporting irrigation infrastructure and crop variety improvement, thereby narrowing regional gaps.
Furthermore, different crops show significant differences in their responses to rainfall. The positive effect of rainfall on rice has first increased and then decreased, while the negative effect has continued to strengthen. The high-value areas have shifted westward from Heilongjiang and Jilin to the northern part of Liaoning. The impact of rainfall on corn decreases from north to south. In the eastern part of Heilongjiang, the positive effect was significant during 2003–2012; however, in some areas, it turned into a negative effect due to waterlogging during 2013–2022. The north–south differentiation pattern of soybeans has evolved over time: from 1993 to 2002, Heilongjiang exhibited a north—high, south—low positive pattern; from 2003 to 2012, Liaoning shifted to a south—high, north—low pattern; and from 2013 to 2022, the positive effect in Heilongjiang rebounded.
The reasons stem from differences in the intrinsic mechanisms of crops: Rice is water-loving, and the increase in rainfall in western Jilin and Heilongjiang from 2003 to 2012 promoted the yield per unit area; however, from 2013 to 2022, the improvement of drought-resistant varieties in northern Liaoning led to the southward shift of the positive effect [60]. Corn is sensitive to water during the tasseling stage: in Liaoning and Jilin, the decrease in rainfall in July from 2003 to 2012 led to negative effects, while the increase in rainfall during the same period in the eastern part of Heilongjiang formed a positive effect [61,62]. Soybeans have concentrated water demand during the flowering and pod-setting stage: in the early period, rainfall in Heilongjiang was well-matched with the water demand; in the middle period, increased rainfall in Liaoning led to a positive effect; and in the later period, the positive effect in Heilongjiang rebounded through variety improvement and crop rotation [63].

4.2.2. Spatiotemporal Heterogeneity of Temperature

The spatiotemporal heterogeneity of temperature exerts a significant impact on yield per unit area. Over time, the absolute regression coefficient has continuously decreased, indicating that the impact of temperature is becoming more stable and regional differences are gradually narrowing. Spatially, high-value areas of positive effects have gradually expanded from eastern Liaoning and western Jilin to northern Heilongjiang, northern Jilin, and southern Liaoning, ultimately forming a north—high, south—low pattern. Locations such as Harbin and Suihua in Heilongjiang have emerged as high-value centers. This change is mainly attributed to the following factors: In the early stage, agricultural production had insufficient adaptability to temperature, and extreme temperature events often led to reduced yields; global warming has increased accumulated temperature in the three northeastern provinces, improving thermal conditions in high-latitude regions such as Heilongjiang and extending crop growing seasons; and advances in agricultural technology, including the promotion of cold-resistant varieties, have enhanced crops’ adaptability to temperature changes, thereby stabilizing regional differences in temperature impacts.
In addition, different crops exhibit significant differences in their responses to temperature. Rice shows a gradually increasing positive effect and a decreasing negative effect, with high-value areas shifting southward to western Liaoning. Corn exhibits a north—high, south—low pattern, with its positive effect continuously strengthening. For soybeans, a south—high, north—low distribution was observed in the early period; however, from 2013 to 2022, a dual-core high-value area formed in Liaoning and central Heilongjiang. These differences are closely related to crop-specific characteristics: rice has high demand for accumulated temperature, and the significant improvement in thermal conditions in western Liaoning has greatly promoted its growth; corn prefers warm conditions, and increased accumulated temperature in Heilongjiang has extended its growing period and boosted yields [64,65]; and soybeans are sensitive to temperature—specifically, the combined effects of increased accumulated temperature in central Heilongjiang and stable thermal conditions in Liaoning have enhanced the positive effect, while the development of cold-resistant varieties has further improved their adaptability to temperature changes [66,67].

4.2.3. Spatiotemporal Heterogeneity of Solar Radiation Duration

The spatiotemporal heterogeneity of the sunshine duration exerts a significant impact on the grain yield per unit area. Over time, its influence on yield has weakened, with negative effects gradually expanding, while only certain regions in Heilongjiang remain under positive effects. The spatial impact pattern of sunshine duration on grain yield per unit area has shifted from “higher in the east and lower in the west” to “lower in the east and higher in the west”; meanwhile, high-value areas of positive effects have gradually contracted from eastern Heilongjiang and Jilin to localized regions such as Yichun and Hegang. The primary drivers of this transformation are as follows: In the early stage, agricultural production was highly dependent on natural light conditions, and ample sunshine in eastern regions facilitated yield increases. In later periods, climate change induced increased cloud cover and reduced sunshine the duration in Heilongjiang. Additionally, intensified air pollution in central and western regions has diminished the effectiveness of sunlight. Meanwhile, uneven adoption of agricultural technologies—such as supplementary lighting equipment—across regions has gradually weakened the yield impact of sunshine duration and reshaped the pattern of regional differences.
Furthermore, different crops exhibit distinct responses to sunshine the duration. The impact of the sunshine duration on rice has weakened over time; its spatial distribution has transitioned from an early north—high, south—low pattern to a more dispersed pattern with reduced regional disparities in later periods. For corn, positive effects of the sunshine duration have declined while negative effects have intensified, with high-value areas gradually vanishing from eastern Heilongjiang. Soybeans have consistently maintained a north—high, south—low pattern, though the scope of their positive effects first expanded and then contracted.
These variations are closely linked to the photosynthetic traits of crops: Rice is light-sensitive during the heading stage. In the early period, a long sunshine duration in eastern Heilongjiang promoted grain filling, but in later periods, narrowing regional climate differences weakened this effect. Corn is a sun-loving crop; a reduced sunshine duration directly inhibits photosynthesis, exacerbating negative effects. For soybeans, a long sunshine duration during the growing season in northern Heilongjiang sustained positive effects, whereas urbanization-induced declines in atmospheric visibility in southern Liaoning and Jilin diminished the yield-promoting role of sunshine [68].

4.3. Policy Recommendations

As one of China’s major grain-producing regions, NEC is highly sensitive to climate change. The above results indicate that the impacts of different climate drivers on crop yields exhibit spatiotemporal heterogeneity, with variations in responses across different crops. To enhance the adaptability of agricultural systems, differentiated policy recommendations should be formulated.
In eastern urbanized areas such as central and southern Liaoning, rainwater harvesting facilities should be constructed, and water-saving irrigation technologies for rice should be promoted. In rain-fed agricultural regions of northeastern Heilongjiang, waterlogging control engineering works should be strengthened, and the planting area of waterlogging-tolerant crops should be expanded. In newly reclaimed farmlands in the west, drip irrigation equipment should be deployed, and crop rotation patterns implemented to improve rainfall use efficiency [69]. In high-latitude regions of Heilongjiang, leveraging the advantages of increased accumulated temperature, early rice seedling cultivation techniques should be promoted and the planting area of mid–late-maturing corn varieties expanded. In areas with favorable thermal conditions in western Liaoning, temperature-controlled seedling cultivation technologies should be adopted and crop rotation demonstration sites established. In central Jilin, cultivation practices that increase soil temperature and preserve moisture should be adopted to mitigate the impact of high temperatures on crop growth. In areas with a low sunshine duration in eastern Heilongjiang, LED supplementary lighting equipment should be installed in soybean-growing regions to enhance light availability. In central Jilin, the cultivation of crops with high light requirements should be reduced, while the planting area of shade-tolerant rice varieties should be expanded. In southern Liaoning, pollution control efforts should be strengthened to ensure adequate light conditions for farmland.
Based on crop-specific characteristics, targeted strategies can be formulated as follows: For rice, drought-tolerant varieties should be adopted in Heilongjiang, while dryland seedling raising and sparse planting techniques should be promoted in Liaoning. For corn, waterlogging-resistant varieties should be planted in eastern Heilongjiang and water-saving irrigation implemented in western Jilin. For soybeans, crop rotation systems should be implemented in Heilongjiang, while Liaoning should leverage its climatic advantages to grow high-protein soybeans.

4.4. Limitations and Future Prospects

This study selected rainfall, temperature, and sunshine duration to analyze their impacts on crop yields; however, the mechanisms through which global warming exerts its influences are complex. For instance, elevated CO2 concentrations can enhance crop photosynthetic efficiency, while soil salinization and acidification may affect root growth. Notably, some discrepancies between climate trends and the general growth in crop yields have not been fully elucidated, which may be closely related to other dynamic factors not included in this study, such as changes in the application intensity of agrochemicals and the improvement and upgrading of farmland infrastructure. These unconsidered factors might have, to a certain extent, buffered the potential negative impacts of climate fluctuations on yields or directly driven yield increases, resulting in the current assessment failing to fully cover the driving mechanisms behind changes in crop yields. In terms of spatial scale, constrained by the availability of statistical data, this study adopted prefecture-level cities as the unit of analysis. While this scale can reflect macro-regional characteristics, it struggles to capture micro-level influences such as topographic differences at the county level, the degree of farmland fragmentation, and variations in irrigation facilities.
Future research can advance in two aspects: First, expand the analytical dimension of influencing factors. In addition to integrating environmental data such as CO2 concentrations and soil properties, priority should be given to incorporating anthropogenic management factors such as trends in agrochemical use, irrigation water efficiency, and improvements in farmland infrastructure. This will enable the interactive effects between these factors and climatic variables in crop yield changes to be quantified, thereby more clearly elucidating the causes of discrepancies between climate trends and yield growth. Second, optimize the spatial analysis scale by combining remote sensing data with county-level statistical data and adopting grid-scale analysis to break the fragmentation of geographical continuity caused by administrative boundaries, thus improving the accuracy of characterizing spatial heterogeneity.

5. Conclusions

Based on the data of major grain crop yields and climate factors in NEC from 1993 to 2022, this study employed Sen’s slope, the MK test, spatial autocorrelation analysis, and the GTWR model to conduct an in-depth analysis of the spatiotemporal evolution characteristics of grain yields and their responses to climate change. The main conclusions are as follows:
(1) Spatiotemporal variations in grain yields: From 1993 to 2022, grain yield in NEC showed an overall significant upward trend, with Liaoning Province exhibiting the fastest growth. Rice yield increased significantly across all three provinces, with Heilongjiang Province achieving the highest growth rate. The corn yield rose significantly in Liaoning and Jilin provinces, while Heilongjiang Province showed no significant growth. Soybean yield only increased significantly in Liaoning Province, whereas it declined in Jilin and Heilongjiang provinces.
(2) Spatiotemporal variations in climate factors: During the growing season in NEC, average rainfall showed a fluctuating upward trend, except for a decreasing trend in July rainfall in Liaoning Province. Average temperature increased consistently, with significant growth rates in Liaoning and Jilin provinces. The sunshine duration increased in Jilin and Liaoning provinces but decreased in Heilongjiang Province. Spatially, rainfall exhibited a “south—high, north—low” distribution pattern and a “north—high, south—low” growth rate pattern; temperature was characterized by higher values in the south with faster growth rates; and the sunshine duration showed a “west—high, east—low” distribution pattern and a “south-increasing, north-decreasing” variation pattern.
(3) Spatial characteristics of grain yield: Global Moran’s I indicates that, except for early-stage corn and soybeans, other crops exhibited significant spatial agglomeration in yield. The scope of high–high agglomeration areas first expanded, then narrowed, and migrated northward to Jilin Province.
(4) From 1993 to 2022, overall grain yield in NEC increased, with climate factors showing significant spatiotemporal heterogeneity in their impacts. Rainfall’s impact on grain yield shifted from negative to positive, with regional disparities becoming more balanced; areas with positive effects expanded from Jilin to northeastern Heilongjiang, forming a “west—high, east—low” pattern. Temperature’s impact stabilized, with reduced regional differences; high-value areas of positive effects spread to Heilongjiang and northern Jilin, forming a “north—high, south—low” pattern. The impact of the sunshine duration weakened, with negative effects spreading, and its spatial pattern shifted from “east—high, west—low” to “east—low, west—high”.
(5) Crop-specific response differences: For rainfall, rice’s positive response first strengthened and then weakened, with high-value areas migrating westward; corn showed a shift from positive to negative effects in some regions due to waterlogging; and soybean responses exhibited fluctuating north–south differentiation over time. For temperature, positive effects on rice and corn expanded southward and northward, respectively, while soybeans formed dual-core high-value areas. For the sunshine duration, rice’s response weakened with a scattered distribution; corn’s positive response continued to decline; and soybeans maintained a “north—high, south—low” pattern, though the scope of positive effects changed significantly. These differences are closely linked to crop physiological characteristics, regional climate evolution, and agricultural adaptation measures.

Author Contributions

Conceptualization, R.P. and D.S.; methodology, R.P. and W.S.; software, W.S.; validation, R.P. and D.S.; formal analysis, D.S. and W.S.; investigation, R.P. and D.S.; resources, W.S. and D.S.; data curation, D.S.; writing—original draft preparation, R.P. and W.S.; writing—review and editing, W.S. and R.P.; visualization, W.S.; supervision, W.S.; project administration, W.S.; funding acquisition, R.P. All authors have read and agreed to the published version of the manuscript.

Funding

This research received no external funding. The corresponding author’s personal funds were used for publication expenses, and the research was supported by the research team’s internal resources.

Data Availability Statement

All data for this paper are properly cited and can be referred to in the reference list.

Conflicts of Interest

The authors declare no conflicts of interest.

Abbreviations

The following abbreviations are used in this manuscript:
OLSOrdinary Least Squares
NECNortheast China
GTWRGeographically and Temporally Weighted Regression
CMDSChina Meteorological Data Sharing Service System
MKMann–Kendall
VIFVariance Inflation Factor

References

  1. Nzali, C.T.; Abdelbaki, C.; Kumar, N. Assessing the Effects of Climate Variability on Maize Yield in the Municipality of Dschang-Cameroon. Land 2024, 13, 1360. [Google Scholar] [CrossRef]
  2. Muñoz, I.; Schmidt, J.; Weidema, B.P. The indirect global warming potential of methane oxidation in the IPCC’s sixth assessment report. Environ. Res. Lett. 2024, 19, 121002. [Google Scholar] [CrossRef]
  3. Fu, J.; Jian, Y.; Wang, X.; Li, L.; Ciais, P.; Zscheischler, J.; Wang, Y.; Tang, Y.; Müller, C.; Webber, H.; et al. Extreme rainfall reduces one-twelfth of China’s rice yield over the last two decades. Nat. Food 2023, 4, 416–426. [Google Scholar] [CrossRef] [PubMed]
  4. Wang, B.; Li, L.; Feng, P.; Chen, C.; Luo, J.-J.; Taschetto, A.S.; Harrison, M.T.; Liu, K.; Liu, D.L.; Yu, Q.; et al. Probabilistic analysis of drought impact on wheat yield and climate change implications. Weather Clim. Extrem. 2024, 45, 100708. [Google Scholar] [CrossRef]
  5. Heilemann, J.; Klassert, C.; Samaniego, L.; Thober, S.; Marx, A.; Boeing, F.; Klauer, B.; Gawel, E. Projecting impacts of extreme weather events on crop yields using LASSO regression. Weather Clim. Extrem. 2024, 46, 100738. [Google Scholar] [CrossRef]
  6. Rawat, M.; Sharda, V.; Lin, X.; Roozeboom, K. Climate Change Impacts on Rainfed Maize Yields in Kansas: Statistical vs. Process-Based Models. Agronomy 2023, 13, 2571. [Google Scholar] [CrossRef]
  7. He, Q.; Zhou, G.; Liu, J. Progress in Studies of Climatic Suitability of Crop Quality and Resistance Mechanisms in the Context of Climate Warming. Agronomy 2022, 12, 3183. [Google Scholar] [CrossRef]
  8. Asseng, S.; Cammarano, D.; Basso, B.; Chung, U.; Alderman, P.D.; Sonder, K.; Reynolds, M.; Lobell, D.B. Hot spots of wheat yield decline with rising temperatures. Glob. Change Biol. 2017, 23, 2464–2472. [Google Scholar] [CrossRef]
  9. Feng, X.; Tian, H.; Cong, J.; Zhao, C. A method review of the climate change impact on crop yield. Front. For. Glob. Change 2023, 6, 1198186. [Google Scholar] [CrossRef]
  10. Yan, Z.; Xu, Y.; Chu, J.; Guillaume, T.; Bragazza, L.; Li, H.; Shen, Y.; Yang, Y.; Zeng, Z.; Zang, H. Long-term diversified cropping promotes wheat yield and sustainability across contrasting climates: Evidence from China and Switzerland. Field Crop. Res. 2025, 322, 109764. [Google Scholar] [CrossRef]
  11. Drebenstedt, I.; Marhan, S.; Poll, C.; Kandeler, E.; Högy, P. Annual cumulative ambient precipitation determines the effects of climate change on biomass and yield of three important field crops. Field Crop. Res. 2023, 290, 108766. [Google Scholar] [CrossRef]
  12. Zhuang, H.; Zhang, Z.; Han, J.; Cheng, F.; Li, S.; Wu, H.; Mei, Q.; Song, J.; Wu, X.; Zhang, Z.; et al. Stagnating rice yields in China need to be overcome by cultivars and management improvements. Agric. Syst. 2024, 221, 104134. [Google Scholar] [CrossRef]
  13. Karunaratne, A.S.; Chaogejilatu; Iizumi, T. A climate impact attribution of historical rice yields in Sri Lanka using three crop models. Sci. Rep. 2025, 15, 15360. [Google Scholar] [CrossRef]
  14. Qin, M.; Zheng, E.; Hou, D.; Meng, X.; Meng, F.; Gao, Y.; Chen, P.; Qi, Z.; Xu, T. Response of Wheat, Maize, and Rice to Changes in Temperature, Precipitation, CO2 Concentration, and Uncertainty Based on Crop Simulation Approaches. Plants 2023, 12, 2709. [Google Scholar] [CrossRef] [PubMed]
  15. Noia, R.D., Jr.; Olivier, L.; Wallach, D.; Mullens, E.; Fraisse, C.W.; Asseng, S. A simple procedure for a national wheat yield forecast. Eur. J. Agron. 2023, 148, 126868. [Google Scholar] [CrossRef]
  16. Jägermeyr, J.; Müller, C.; Ruane, A.C.; Elliott, J.; Balkovic, J.; Castillo, O.; Faye, B.; Foster, I.; Folberth, C.; Franke, J.A.; et al. Climate impacts on global agriculture emerge earlier in new generation of climate and crop models. Nat. Food 2021, 2, 873–885. [Google Scholar] [CrossRef] [PubMed]
  17. Hu, T.; Zhang, X.; Khanal, S.; Wilson, R.; Leng, G.; Toman, E.M.; Wang, X.; Li, Y.; Zhao, K. Climate change impacts on crop yields: A review of empirical findings, statistical crop models, and machine learning methods. Environ. Model. Softw. 2024, 179, 106119. [Google Scholar] [CrossRef]
  18. Villa-Falfán, C.; Valdés-Rodríguez, O.A.; Vázquez-Aguirre, J.L.; Salas-Martínez, F. Climate Indices and Their Impact on Maize Yield in Veracruz, Mexico. Atmosphere 2023, 14, 778. [Google Scholar] [CrossRef]
  19. Lesk, C.; Rowhani, P.; Ramankutty, N. Influence of extreme weather disasters on global crop production. Nature 2016, 529, 84–87. [Google Scholar] [CrossRef]
  20. Liu, Y.; Fan, Y.; Yue, J.; Jin, X.; Ma, Y.; Chen, R.; Bian, M.; Yang, G.; Feng, H. A model suitable for estimating above-ground biomass of potatoes at different regional levels. Comput. Electron. Agric. 2024, 222, 109081. [Google Scholar] [CrossRef]
  21. Sharma, A.; Kumar, J.; Redhu, M.; Kumar, P.; Godara, M.; Ghiyal, P.; Fu, P.; Rahimi, M. Estimation of rice yield using multivariate analysis techniques based on meteorological parameters. Sci. Rep. 2024, 14, 12626. [Google Scholar] [CrossRef]
  22. Li, S.; Liu, Y.; Shao, Y.; Wang, X. Impact of Climate Change on Crop-cropland Coupling Relationship: A Case Study of the Loess Plateau in China. Chin. Geogr. Sci. 2025, 35, 92–110. [Google Scholar] [CrossRef]
  23. Furtak, K.; Wolińska, A. The impact of extreme weather events as a consequence of climate change on the soil moisture and on the quality of the soil environment and agriculture—A review. CATENA 2023, 231, 107378. [Google Scholar] [CrossRef]
  24. Zhan, P.; Zhu, W.; Zhang, T.; Li, N. Regional inequalities of future climate change impact on rice (Oryza sativa L.) yield in China. Sci. Total. Environ. 2023, 898, 165495. [Google Scholar] [CrossRef]
  25. Zheng, J.; Zhang, S. Assessing the Impact of Climate Change on Winter Wheat Production in the North China Plain from 1980 to 2020. Agriculture 2025, 15, 449. [Google Scholar] [CrossRef]
  26. Yuan, R.; Wang, K.; Ren, D.; Chen, Z.; Guo, B.; Zhang, H.; Li, D.; Zhao, C.; Han, S.; Li, H.; et al. An Analysis of Uncertainties in Evaluating Future Climate Change Impacts on Cotton Production and Water Use in China. Agronomy 2025, 15, 1209. [Google Scholar] [CrossRef]
  27. Xu, Q.; Liang, H.; Wei, Z.; Zhang, Y.; Lu, X.; Li, F.; Wei, N.; Zhang, S.; Yuan, H.; Liu, S.; et al. Assessing Climate Change Impacts on Crop Yields and Exploring Adaptation Strategies in Northeast China. Earth’s Futur. 2024, 12, e2023EF004063. [Google Scholar] [CrossRef]
  28. Dong, X.; Zhang, T.; Yang, X.; Li, T.; Li, X. Rice yield benefits from historical climate warming to be negated by extreme heat in Northeast China. Int. J. Biometeorol. 2023, 67, 835–846. [Google Scholar] [CrossRef]
  29. Zhang, Y.; Zhao, Y.; Sun, Q.; Chen, S. Negative effects of heat stress on maize yield were compensated by increasing thermal time and declining cold stress in northeast China. Int. J. Biometeorol. 2022, 66, 2395–2403. [Google Scholar] [CrossRef]
  30. Zhang, C.; Gao, J.; Liu, L.; Wu, S. Compound drought and hot stresses projected to be key constraints on maize production in Northeast China under future climate. Comput. Electron. Agric. 2024, 218, 108688. [Google Scholar] [CrossRef]
  31. Song, Y.; Li, Z.; Sun, J.; Chen, H.; Fu, J.; He, X.; Biswas, A.; Zheng, F.; Li, Z. Soil thinning dominates crop yield reduction among various degradation types in the typical black soil region of Northeast China. Eur. J. Agron. 2025, 169, 127694. [Google Scholar] [CrossRef]
  32. Song, Y.; Li, Z.; Chen, H.; Sun, J.; He, X.; Fu, J.; Zheng, F.; Li, Z. Responses of crop yield and soil quality to organic material application in the black soil region of Northeast China. Soil Tillage Res. 2025, 253, 106690. [Google Scholar] [CrossRef]
  33. Lv, Y.-J.; Zhang, X.-L.; Gong, L.; Huang, S.-B.; Sun, B.-L.; Zheng, J.-Y.; Wang, Y.-J.; Wang, L.-C. Long-term reduced and no tillage increase maize (Zea mays L.) grain yield and yield stability in Northeast China. Eur. J. Agron. 2024, 158, 127217. [Google Scholar] [CrossRef]
  34. Dong, X.; Zhang, T.; Yang, X.; Li, T. Breeding priorities for rice adaptation to climate change in Northeast China. Clim. Change 2023, 176, 75. [Google Scholar] [CrossRef]
  35. Zhang, C.; Gao, J.; Liu, L.; Wu, S. Simulating the effects of optimizing sowing date and variety shift on maize production at finer scale in northeast China under future climate. J. Sci. Food Agric. 2024, 104, 3637–3647. [Google Scholar] [CrossRef]
  36. He, C.; Niu, J.; Xu, C.; Han, S.; Bai, W.; Song, Q.; Dang, Y.P.; Zhang, H. Effect of conservation tillage on crop yield and soil organic carbon in Northeast China: A meta-analysis. Soil Use Manag. 2022, 38, 1146–1161. [Google Scholar] [CrossRef]
  37. Xiao, D.; Yang, X.; Bai, H.; Tang, J.; Tao, F. Trends and climate response in the yield of staple crops across Northeast China. Front. Sustain. Food Syst. 2024, 7, 1246347. [Google Scholar] [CrossRef]
  38. Kartal, V.; Emiroglu, M.E. Hydrological Drought and Trend Analysis in Kızılırmak, Yeşilırmak and Sakarya Basins. Pure Appl. Geophys. 2024, 181, 1919–1943. [Google Scholar] [CrossRef]
  39. Battisti, R.; Dapper, F.P.; da Silva, A.C.S.; Mesquita, M.; da Silva, M.V.; Andrade, R.R.; Lopes, A.G.C. Assessing Precipitation Trends Between 1960 and 2021 Using Multiple Trend Indexes in the GOIÁS State and Federal District, Brazil. Int. J. Clim. 2025, 45, e8750. [Google Scholar] [CrossRef]
  40. Wang, Z.; Zhang, E.; Chen, G. Spatiotemporal Variation and Influencing Factors of Grain Yield in Major Grain-Producing Counties: A Comparative Study of Two Provinces from China. Land 2023, 12, 1810. [Google Scholar] [CrossRef]
  41. Zhao, Y.; Tao, H.; He, P.; Yao, X.; Cheng, T.; Zhu, Y.; Cao, W.; Tian, Y. Annual 30 m winter wheat yield mapping in the Huang-Huai-Hai plain using crop growth model and long-term satellite images. Comput. Electron. Agric. 2023, 214, 108335. [Google Scholar] [CrossRef]
  42. Yin, F.; Sun, Z.; You, L.; Müller, D. Determinants of changes in harvested area and yields of major crops in China. Food Secur. 2024, 16, 339–351. [Google Scholar] [CrossRef]
  43. Hu, R.; Fan, J.; Wu, Y.; Zhou, R. Analysis of Temporal and Spatial Variation Characteristics of TPP and Yield Gap of Agricultural Land Grading Crops, Using Hohhot City in Inner Mongolia as an Example. Pol. J. Environ. Stud. 2023, 32, 1595–1607. [Google Scholar] [CrossRef]
  44. Su, H.; Chen, Y.; Tan, H.; Zhou, A.; Chen, G.; Chen, Y. 5 Concentrations in China Using a Global-Local Regression Model Considering Global Spatial Autocorrelation and Local Spatial Heterogeneity. Remote Sens. 2022, 14, 4545. [Google Scholar] [CrossRef]
  45. Yang, Y.; Fu, B. Spatial Heterogeneity of Urban Road Network Fractal Characteristics and Influencing Factors. Sustainability 2023, 15, 12141. [Google Scholar] [CrossRef]
  46. Deng, W.; Cheng, Y.-F.; Yu, H.; Peng, L.; Kong, B.; Hou, Y.-T. Spatio-temporal characteristics of population and economy in transitional geographic space at the southern end of “Hu Huan-yong Line”. J. Mt. Sci. 2022, 19, 350–364. [Google Scholar] [CrossRef]
  47. Li, N.; Hu, J.; Jiang, C.; Ding, Y.; Wei, W.; Wang, F.; He, L.; Liu, H. Crop Yield Estimation Method for Use in Agricultural Field, Involves Constructing Random Forest Regression Model According to Optimal Yield Impact Factor, Relative Climate Yield and Crop Yield, and Estimating Crop Yield in Area to Be Tested According to Random Forest Regression Model. Patent CN116562446-A, 8 August 2023. [Google Scholar]
  48. Wan, C.; Gao, P.; Song, C.; Zhang, Y.; Ye, S. Method for Processing Influence of Meteorological Events on Crop Unit Production used in Agricultural Information Field, Involves Determining Prediction Error Based on Predicted Single Yield and Actual Single Yield, and Determining Risk Factor for Each Climate Feature Based on Prediction Error. Patent CN119378737-A, 28 January 2025. [Google Scholar]
  49. Zhao, M.-S.; Chen, X.-Q.; Xu, S.-J.; Qiu, S.-Q.; Wang, S.-H. Spatial Prediction Modeling for Soil pH Based on Multiscale Geographical Weighted Regression (MGWR) and Its Influencing Factors. Huan Jing Ke Xue=Huanjing Kexue 2023, 44, 6909–6920. [Google Scholar] [CrossRef] [PubMed]
  50. Yang, Z.; Ren, Y.; Shen, L.; Liao, X.; Kwan, M.-P. Spatiotemporal evolutions and drivers of ground-level ozone in China (2015–2020): A GTWR-Kriging approach. Environ. Res. 2025, 279, 121748. [Google Scholar] [CrossRef]
  51. Liu, L.; Liu, Y.; Cheng, F.; Yu, Y.; Wang, J.; Wang, C.; Nong, L.; Deng, H. Remote sensing estimation of regional PM 2.5 based on GTWR model-A case study of southwest China. Environ. Pollut. 2024, 351, 124057. [Google Scholar] [CrossRef]
  52. Habib-Ur-Rahman, M.; Ahmad, A.; Raza, A.; Hasnain, M.U.; Alharby, H.F.; Alzahrani, Y.M.; Bamagoos, A.A.; Hakeem, K.R.; Ahmad, S.; Nasim, W.; et al. Impact of climate change on agricultural production; Issues, challenges, and opportunities in Asia. Front. Plant Sci. 2022, 13, 925548. [Google Scholar] [CrossRef]
  53. Nidumolu, U.; Gobbett, D.; Hayman, P.; Howden, M.; Dixon, J.; Vrieling, A. Climate change shifts agropastoral-pastoral margins in Africa putting food security and livelihoods at risk. Environ. Res. Lett. 2022, 17, 095003. [Google Scholar] [CrossRef]
  54. Liu, Y.; Wang, J. Revealing Annual Crop Type Distribution and Spatiotemporal Changes in Northeast China Based on Google Earth Engine. Remote Sens. 2022, 14, 4056. [Google Scholar] [CrossRef]
  55. Liu, Y.; Liu, X.; Liu, Z. Effects of climate change on paddy expansion and potential adaption strategies for sustainable agriculture development across Northeast China. Appl. Geogr. 2022, 141, 102667. [Google Scholar] [CrossRef]
  56. Deng, X.; Huang, Y.; Yuan, W.; Zhang, W.; Ciais, P.; Dong, W.; Smith, P.; Qin, Z. Building soil to reduce climate change impacts on global crop yield. Sci. Total. Environ. 2023, 903, 166711. [Google Scholar] [CrossRef]
  57. Qiao, L.; Wang, X.; Smith, P.; Fan, J.; Lu, Y.; Emmett, B.; Li, R.; Dorling, S.; Chen, H.; Liu, S.; et al. Soil quality both increases crop production and improves resilience to climate change. Nat. Clim. Change 2022, 12, 574–580. [Google Scholar] [CrossRef]
  58. Ombogo, O.; Karanja, A.M. Regression Models in Forecasting Crop Yield under Climate Change Scenarios. Int. J. Innov. Res. Dev. 2022, 11, 143–147. [Google Scholar] [CrossRef]
  59. Marcinkowski, P.; Piniewski, M. Future changes in crop yield over Poland driven by climate change, increasing atmospheric CO2 and nitrogen stress. Agric. Syst. 2024, 213, 103813. [Google Scholar] [CrossRef]
  60. Xiao, X.; Zhang, J.; Liu, Y. Impacts of Crop Type and Climate Changes on Agricultural Water Dynamics in Northeast China from 2000 to 2020. Remote Sens. 2024, 16, 1007. [Google Scholar] [CrossRef]
  61. Dong, M.; Zhao, J.; Li, E.; Liu, Z.; Guo, S.; Zhang, Z.; Cui, W.; Yang, X. Effects of Changing Climate Extremes on Maize Grain Yield in Northeast China. Agronomy 2023, 13, 1050. [Google Scholar] [CrossRef]
  62. Song, Y.; Linderholm, H.W.; Luo, Y.; Xu, J.; Zhou, G. Climatic Causes of Maize Production Loss under Global Warming in Northeast China. Sustainability 2020, 12, 7829. [Google Scholar] [CrossRef]
  63. Guo, S.; Guo, E.; Zhang, Z.; Dong, M.; Wang, X.; Fu, Z.; Guan, K.; Zhang, W.; Zhang, W.; Zhao, J.; et al. Impacts of mean climate and extreme climate indices on soybean yield and yield components in Northeast China. Sci. Total. Environ. 2022, 838, 156284. [Google Scholar] [CrossRef]
  64. Li, T.; Zhang, X.-P.; Liu, Q.; Liu, J.; Chen, Y.-Q.; Sui, P. Yield penalty of maize (Zea mays L.) under heat stress in different growth stages: A review. J. Integr. Agric. 2022, 21, 2465–2476. [Google Scholar] [CrossRef]
  65. Kouame, A.K.; Bindraban, P.S.; Kissiedu, I.N.; Atakora, W.K.; El Mejahed, K. Identifying drivers for variability in maize (Zea mays L.) yield in Ghana: A meta-regression approach. Agric. Syst. 2023, 209, 103667. [Google Scholar] [CrossRef]
  66. Xin, M.; Zhang, Z.; Han, Y.; Feng, L.; Lei, Y.; Li, X.; Wu, F.; Wang, J.; Wang, Z.; Li, Y. Soybean phenological changes in response to climate warming in three northeastern provinces of China. Field Crop. Res. 2023, 302, 109082. [Google Scholar] [CrossRef]
  67. Guo, S.; Zhang, Z.; Zhang, F.; Yang, X. Optimizing cultivars and agricultural management practices can enhance soybean yield in Northeast China. Sci. Total. Environ. 2023, 857, 159456. [Google Scholar] [CrossRef]
  68. De Souza, A.P.; Burgess, S.J.; Doran, L.; Hansen, J.; Manukyan, L.; Maryn, N.; Gotarkar, D.; Leonelli, L.; Niyogi, K.K.; Long, S.P. Soybean photosynthesis and crop yield are improved by accelerating recovery from photoprotection. Science 2022, 377, 851–854. [Google Scholar] [CrossRef]
  69. Liu, X.; Cao, K.; Li, M. Assessing the impact of meteorological and agricultural drought on maize yields to optimize irrigation in Heilongjiang Province, China. J. Clean. Prod. 2024, 434, 139897. [Google Scholar] [CrossRef]
Figure 1. Location of the study area. The land use data were sourced from the National Earth System Science Data Center (https://www.geodata.cn/, accessed on 15 July 2025).
Land 14 01693 g001
Figure 2. Research framework.
Land 14 01693 g002
Figure 3. Temporal and spatial variations in major grain crop yields in NEC. Note: The unit of crop yield per unit area is kg/hm2, and the unit of annual yield change rate (Sen’s slope) is kg/(hm2·a). All yield data are total annual yields, as Northeast China adopts a one-crop-per-year system.
Land 14 01693 g003
Figure 4. Spatiotemporal variations in climatic variables in NEC. Note: The unit of average rainfall is mm, average temperature is °C, and average sunshine duration is hours. All data represent the average values from May to September (growing season) of each year.
Land 14 01693 g004
Figure 5. Local autocorrelation results of crop yield per unit area in the three northeastern provinces.
Land 14 01693 g005
Figure 6. Spatial distribution of rainfall impact coefficients estimated by the GTWR model. The classification of coefficients was performed using the natural breaks method and was adjusted by the authors to separate negative and positive values and to ensure consistent intervals for each crop across different years (the same method applied in Figure 7 and Figure 8).
Land 14 01693 g006
Figure 7. Spatial distribution of temperature impact coefficients estimated by the GTWR model.
Land 14 01693 g007
Figure 8. Spatial distribution of sunshine duration impact coefficients estimated by the GTWR model.
Land 14 01693 g008
Table 1. Results of spatial autocorrelation analysis.
Crop TypeTime PeriodMoran’ s I ValueZ-Scorep-Value
Grain1993–20020.53095.03610.0000 ***
2003–20120.54375.23120.0000 ***
2013–20220.26433.13250.0017 **
Rice1993–20020.21342.23020.0257 *
2003–20120.28825.23120.0000 ***
2013–20220.10693.13250.0017 **
Corn1993–20020.15521.6915 0.0907
2003–20120.45724.51550.0001 ***
2013–20220.26062.69260.0071 **
Soybean1993–20020.04301.03220.3020
2003–20120.19322.05110.0403 *
2013–20220.21312.31300.0207 *
Note: * denotes statistical significance at the p < 0.05 level; ** denotes significance at the p < 0.01 level; *** denotes significance at the p < 0.001 level.
Table 2. The strength and direction of the impact of climatic factors on major grain crops.
1993–20022003–20122013–2022
Min.Max.MeanSDMin.Max.MeanSDMin.Max.MeanSD
GrainRainfall−1.29500.3573−0.53230.4094−0.38710.75510.05000.2516−0.28170.5789−0.01530.1477
Temperature−0.22581.08530.30000.3169−0.02270.78640.36420.2024−0.16150.77220.41190.2365
Sunshine duration−1.64400.4663−0.12390.5346−0.32460.1512−0.01750.1171−0.19890.0335−0.07350.0596
RiceRainfall−0.50631.1820−0.07780.4638−0.70821.70630.42740.5128−0.85580.2312−0.11320.2264
Temperature−1.30960.92890.06750.5154−0.03081.13830.49560.2879−0.37413.09390.65420.6630
Sunshine duration−0.80910.90890.23310.4367−0.10221.20410.47680.3990−0.31340.1880−0.02530.1402
CornRainfall−0.79881.1615−0.19110.5476−1.90460.6565−0.31240.6194−0.62780.5005−0.08050.2715
Temperature−1.11520.8828−0.10420.5188−0.27021.13760.37680.4295−0.22071.92480.72860.5443
Sunshine duration−0.84370.96900.17650.4641−1.08230.93360.06020.3850−1.32520.2636−0.53260.3591
SoybeanRainfall−0.61320.7025−0.13280.3741−1.40880.2256−0.14930.3330−1.22300.6330−0.23190.4497
Temperature−0.43720.95430.20520.3541−0.17251.24960.31670.2918−0.24601.81020.34640.4865
Sunshine duration−0.58620.4599−0.11880.3188−0.73750.5807−0.01670.2348−0.77740.5284−0.14270.4065
Note: In the table, Mean reflects the average impact intensity of the climatic factor on crop yield, and its positive or negative value directly indicates the direction of impact (positive values represent positive promotion, while negative values represent negative inhibition); Min. and Max., respectively, represent the extreme range of impact intensity within the period, reflecting the magnitude of spatial differences; SD reflects the spatiotemporal variability of impact intensity, with larger values indicating more significant differences in impacts between regions or across periods.
Disclaimer/Publisher’s Note: The statements, opinions and data contained in all publications are solely those of the individual author(s) and contributor(s) and not of MDPI and/or the editor(s). MDPI and/or the editor(s) disclaim responsibility for any injury to people or property resulting from any ideas, methods, instructions or products referred to in the content.