Article

Water-Yield Variability and Its Attribution in the Yellow River Basin of China over Four Decades

1
Institute of Loess Plateau, Shanxi University, Taiyuan 030006, China
2
Engineering Technology Innovation Center for Ecological Protection and Restoration in the Middle Yellow River, Ministry of Natural Resources, Taiyuan 030024, China
3
Department of Earth System Science, Ministry of Education Key Laboratory for Earth System Modeling, Institute for Global Change Studies, Tsinghua University, Beijing 100084, China
4
School of Information and Communication Engineering, Dalian University of Technology, Dalian 116024, China
5
College of Land Science and Technology, China Agricultural University, Beijing 100193, China
*
Authors to whom correspondence should be addressed.
Land 2025, 14(8), 1579; https://doi.org/10.3390/land14081579
Submission received: 27 May 2025 / Revised: 16 July 2025 / Accepted: 31 July 2025 / Published: 2 August 2025
(This article belongs to the Section Landscape Ecology)

Abstract

The water-yield function in the Yellow River Basin (YRB) of China for maintaining the basin’s ecological water balance plays a crucial role. Understanding its spatiotemporal variation and the underlying drivers in the basin is crucial for the management, utilization, and development of water resources. Thus, we used the InVEST model to explore its spatiotemporal dynamics across multiple scales (“basin–county–pixel”). Then, we integrated socio-economic and natural factors to elucidate the driving forces and spatial heterogeneity of water-yield dynamics. Our findings indicated that water-yield trends increased in 71.76% of the YRB, and significant water-yield increases were detected in 13.9% of the basin over the past 40 years. A phase-wise comparison revealed a shift in water yield from a decreasing trend in the first two decades to a significant increasing trend in the last two decades. Hotspot analysis revealed that hotspots of increasing water-yield trends have shifted from the downstream section of the basin toward the southwest, while hotspots of decreasing water-yield trends first concentrated in the basin’s southern part and then disappeared. Both natural and socioeconomic factors have exerted positive and negative impacts on water-yield dynamics. Among them, the dynamics of water yield have been predominantly driven by natural variables.

1. Introduction

The environmental functions and benefits maintained by ecosystems are collectively known as ecosystem services, which enable humans to obtain various direct and indirect advantages necessary for survival [1,2]. Ecosystem functions are essential for human survival and form the foundation of ecosystem services, which are vital for sustaining both socioeconomic development and ecosystem well-being [3,4]. Yet, rapid socioeconomic development and rapid population growth have resulted in severe water shortages, which constrain economic and social progress, affecting food and energy production [5]. Land-use and land-cover patterns are also reshaped by human activities [6], and such alterations to the underlying surface significantly impact water yield [7]. Particularly in China, where water resources are under immense pressure [8], water-yield research at the basin scale increasingly emphasizes spatial quantification and visual assessment [9]. On the one hand, it is essential for maintaining biodiversity, ensuring ecological stability, and alleviating extreme weather events such as droughts [10,11]. On the other hand, water yield also plays a critical role in supporting human consumption, industry, agriculture, hydropower generation, recreation, and fisheries [12]. Hence, the investigation of spatiotemporal variations in water yield is fundamental to sustainable water resource management and has important relevance to regional socioeconomic progress.
As the second-largest river basin, the YRB in China spans a vast region characterized by diverse geomorphological features, substantial climatic variations, and a multitude of sub-basins [13], serving both as a key economic region and a critical ecological barrier [14]. The YRB provides essential water resources for China but faces challenges like environmental degradation and water scarcity due to both natural factors and human activities [15]. Recent studies have indicated that water depletion in the lower reaches of the Yellow River threatens the supply of freshwater resources throughout the basin [16]. The midstream and downstream of the YRB experience severe soil erosion, dry climates, and complex terrain, directly threatening water and soil conservation in the basin [17]. To improve the basin’s ecological environment, numerous measures have been implemented, including ecological restoration projects and large-scale land reclamation since the Reform and Opening-Up, terracing, afforestation, grass planting, and the enactment of the Yellow River Protection Law in 2022 [18]. Therefore, it is important for ensuring the sustainable water supply of the YRB to study and identify the water-yield trends and their drivers.
Numerous tools and models have recently been applied to quantify and visualize hydrological ecosystem services. These models can broadly be classified into two types: those based on conventional hydrological principles and those specialized for ecosystem service evaluation. Traditional hydrological models include the MIKE System Hydrological European (MIKESHE), the Topography-based Hydrological Model (TOPMODEL), and the Soil and Water Assessment Tool (SWAT), while specialized ecosystem service models include ARtifical Intelligence for Environment & Sustainability (ARIES) and Integrated Valuation of Ecosystem Services and Trade-offs (InVEST). Compared to other models, the InVEST model integrates the assessment and quantification of ecosystem services with GIS technology, offering merits such as flexible parameter adjustment and strong spatial representation and it has been widely applied in different regions [19,20]. By considering the impact of land use and cover changes (LULCs) on water yield, the InVEST model allows for the quantitative assessment of water yield across diverse landscapes [21]. Moreover, numerous studies based on the InVEST model have been conducted to analyze the spatiotemporal dynamics of water yield in the YRB and its various regions, achieving good results [22,23,24]. However, there are still deficiencies in the study of the long-term spatiotemporal evolution of water yield in YRB.
At the regional scale, understanding the factors that influence water yield is crucial for water-scarce China. Due to the spatiotemporal dynamics and complexity of the water-yield process, it is affected by a combination of factors. In the water-scarce YRB, strong interdependencies between ecological restoration, agricultural output, and socioeconomic development are exhibited [25]. Extensive research has explored how land use and land-cover changes (LUCC) and climate variability influence water yield. The rapid increase of construction land area is mainly due to urban expansion, which is mainly manifested in the expansion outward from the city as the core [26]. As other land types are transformed into construction land, the resulting impervious surfaces inhibit precipitation infiltration [27], thereby considerably increasing water yield in these regions. Thus, urbanization has been recognized as a crucial driver of increased water yield, and it can be observed that bare land and construction land have the maximum water-yield coefficient, followed by forestland, farmland, and grassland [28]. Desertification control measures implemented since the 1980s in the Kubuqi and Mu Us Deserts have increased vegetation cover and have played a key role in water and soil conservation [29]. Water-yield regulation mechanisms in grassland and cultivated land are similar to those of forests. However, due to variations in root depth, species, and vegetation density among land types, the water-yield regulation effect displays difference [30]. The conversion of cropland to grassland leads to increased water yield, which further increases water yield as grassland area expands [31]. Water production has also been affected by the increase in forest land area, primarily because plantations intercept more surface runoff than natural forests, and their spatial extent continues to expand [32]. Moreover, forests with deeper root systems and denser canopies are more effective at intercepting precipitation. Their high transpiration rates, combined with increased soil infiltration, ultimately lead to a decrease in surface runoff [33]. These observations demonstrate that LUCCs directly or indirectly affect water yield. In addition to LUCCs, climatic factors are also considered drivers of water-yield variation [34]. The increase in water production upstream of YRB has been driven by rising temperatures and a growing trend in precipitation [35]. Between 1995 and 2018, water yield in the YRB was significantly affected by precipitation, while LUCC had a smaller impact [24]. Such studies have predominantly assessed how water yield is affected by LUCC and climate change. However, the extent to which other factors contribute to water-yield trends remains insufficiently quantified.
Motivated by the above considerations, this study is designed to investigate the following aspects: (1) investigating the long-term impacts of land use change on water yield in the Yellow River Basin; (2) revealing the spatiotemporal changes of water yield across different scales and between two sub-periods in the YRB; and (3) quantifying the driving mechanisms underlying the trends in water-yield dynamics in the basin. To answer these questions, first, we investigate the temporal evolution of land use in the YRB from 1980 to 2019. Then, we assess the spatiotemporal dynamics and multi-scale (“basin–county–pixel”) heterogeneity of water yield based on the InVEST model. Subsequently, we use Ordinary Least Squares (OLS) to assess the global contribution of different driving variables. Finally, based on the OLS results, the spatial variation in the impact of key predictors is captured using Geographically Weighted Regression (GWR), thereby revealing localized relationships between water-yield trends and their underlying drivers.

2. Materials and Methods

2.1. Study Area

Located at 96–119° E, 32–42° N, the Yellow River Basin covers 1900 km (E–W) × 1100 km (N–S) (Figure 1a). The basin covers an area of 795,800 square kilometers, with a main river stretching 5464 km from source to estuary and an elevation drop of 4480 m. Its spans nine provincial areas across the country: Shandong, Shannxi, Henan, Shanxi, Inner Mongolia, Gansu, Qinghai, Ningxia, and Sichuan. The basin discharges 58 billion cubic meters of natural water yearly, a volume that represents 2% of China’s total river runoff [36]. The mid-latitude location of the YRB subjects it to a climate regime governed by both monsoonal circulations and complex atmospheric mechanisms. The basin exhibits significant climatic differences across regions, primarily falling within the plateau climate zones, middle temperate, and southern temperate zones. The YRB has long been an area for agricultural economic development in China. Agricultural productivity in the basin is concentrated in its Fenwei Basin, Ningmeng River Plain, and Yellow River Irrigation Area. Additionally, according to Figure 1b, cropland, shrubland, forestland, grassland, wetland, water, unused land, and snow/ice in the YRB account for 25.01%, 6.84%, 7.02%, 46.45%, 1.57%, 4.75%, 1.18%, 8.16%, and 0.02%, respectively.

2.2. Data and Processing

2.2.1. InVEST Model Input Data

The InVEST Annual Water Yield model is driven by a substantial amount of input data, including that on soil, moisture, climate, DEM, socioeconomic factors, and land use and land cover (LULC). The 90 m resolution DEM (SRTM V4.1) was downloaded from the Geospatial Data Cloud website. The Hydrology module in ArcGIS was employed to extract the YRB river network based on DEM data. The annual LULC data spanning from 1980 to 2019 was extracted from the publicly available China’s Land-Use/cover Datasets-A (CLUD-A) product, which has a 30 m resolution [37]. Earth System Science Data provided the 1000 m resolution precipitation dataset used in this study [38]. The Cold and Arid Regions Science Data Center provided the HWSD v1.1 soil dataset used in this research, which has a resolution of 1000 m (Available online: http://www.ncdc.ac.cn (accessed on 10 July 2024)). The annual average potential evapotranspiration data had a resolution of 1000 m [39]. To ensure that the InVEST model is correctly exported, raster data were first reprojected to WGS_1984_World_Mercator and then cropped according to the YRB boundary. The Z parameter typically ranges from 1 to 30. We calibrated the Z parameter by comparing the estimated values with the actual measurements for each year, with the Z parameter set to 12.8. We obtained the water-yield measurement values for detecting parameter Z from the “Yellow River Water Resources Bulletin” (available online: https://www.yrcc.gov.cn/gzfw/szygb (accessed on 20 July 2024)).

2.2.2. Grid Datasets of Water Yield for Driving Factors

To assess the driving forces behind the water-yield dynamics in the YRB, we selected 10 influencing factors (detailed in Section 2.3). GDP data for 2019 with a resolution of 1000 m was downloaded from https://doi.org/10.1080/15481603.2016.1276705 [40]. Road data was downloaded from https://www.openstreetmap.org (accessed on 5 May 2024) [41], and subsequently road density was computed utilizing ArcGIS Pro. Here, we consider construction land as human settlements and vectorize it to obtain the boundaries of human settlements within the YRB. Subsequently, the calculation of human-settlement accessibility metrics was implemented via ArcGIS Pro’s distance analysis tool. Then, the slope tool in ArcGIS Pro was employed to derive slope information from the DEM data. From the Resources and Environmental Science Data Center, we obtained soil sand content data with a 1000 m resolution (RESDC, available online: https://www.resdc.cn (accessed on 13 May 2024)). Vegetation cover data for 2019 (250 m resolution) were obtained from the National Tibetan Plateau Scientific Data Center [42].

2.3. Methods

Figure 2 outlines the research framework of this study, which includes the input datasets, core model (InVEST), analytical methods, and key outputs. The analysis is based on annual water-yield data (1980–2019), with the temporal breakpoint set at the year 2000. This choice aligns with the launch of several major ecological restoration programs, such as the Natural Forest Protection Program (1998–2000), the Grain for Green Program (1999), the Key Soil and Water Conservation Program (1999–2000), and the Western Development Strategy (2000), which collectively brought about a substantial policy and land-use shift in the YRB.

2.3.1. LULC Analysis Method

To identify the sources of increase and directions of decrease in each LULC within the YRB, the LULC transition matrix was applied over the full period (1980–2019) as well as the two sub-periods (1980–1999 and 2000–2019). The LULC transition matrix was visualized using chord diagrams generated in OriginLab 2021 9.8.0.200 [43].

2.3.2. The InVEST Annual Water Yield Model

The InVEST Annual Water Yield model estimates water yield at the grid-cell scale by applying the water balance principle [44]. It is assumed in the model that all water produced within a pixel ultimately drains to the outlet through surface flow, groundwater, or baseflow, without distinguishing among these pathways. This primarily highlighted spatial heterogeneity in water-yield estimation. Water yield was estimated using the long-term average precipitation and Budyko curve [45], with additional consideration given to soil-moisture consumption depth and surface evaporation.
The InVEST model and its variants have been widely applied and recognized as mature tools. For example, it was used with a water-conservation formula to simulate spatiotemporal variations in the Malian River Basin [46]. A random forest algorithm was employed alongside the model to assess the contributing factors of water yield in the Sanjiangyuan area [47] and was coupled with the SDSM (Statistical Downscaling Technique Model) to evaluate the future impact of climate change on water resources in the East Asian monsoon basin [48]. Additionally, InVEST quantified multiple ecosystem services—including soil conservation, water yield, food supply, carbon storage, and habitat quality—and explored trade-offs among them [49]. Therefore, we applied InVEST 3.14.1 Workbench to calculate water yield in this study. The core equation of the module is
Y ( x ) = 1 A E T ( x ) P ( x ) · P ( x )
where Y ( x ) denotes the annual water yield and A E T ( x ) represents the actual evapotranspiration for grid cell x. It was estimated by using the Budyko curve as a function of climate and vegetation properties [50,51]; P ( x ) is the annual precipitation.
A E T ( x ) P ( x ) = 1 + P E T ( x ) P ( x ) 1 + P E T ( x ) P ( x ) 1 / ω  
where P E T ( x ) indicates the potential evapotranspiration, and ω is introduced as a parameter accounting for regional soil and climate conditions.
ω ( x ) = Z A E T ( x ) P ( x ) + 1.25
where ω ( x ) is calculated based on the approach to the precipitation, AWC (plant’s available water content), and a seasonality factor Z, which reflects the seasonal distribution and temporal concentration of precipitation. A higher Z value generally indicates a more uniform distribution of precipitation throughout the year, which affects actual evapotranspiration and consequently influences the estimation of water yield [52].

2.3.3. Temporal Trend Analysis Method

Building upon InVEST-modeled annual water-yield maps at pixel resolution, we performed temporal trend analysis using least-squares linear regression for three distinct periods in the basin: the entire four decades (1980–2019) and two sub-periods (1980–1999, 2000–2019) [53]. Additionally, the F-test was applied to each pixel to assess whether interannual variations in water yield were statistically significant. According to the statistical significance (p-value) and change rate (slope), the trends in water-yield changes were classified as significantly decreasing (slope < 0, p ≤ 0.05), significantly increasing (slope > 0, p ≤ 0.05), non-significantly increasing (slope > 0, p > 0.05), and non-significantly decreasing (slope < 0, p > 0.05).

2.3.4. Spatial Hotspots Detection Method

In the YRB, hotspot analysis was conducted at the county level for three periods to identify clusters with significant decreases and increases in water yield during the study period, thereby determining key areas for water-resource protection and development. Geographic data rarely follow a normal distribution; sometimes the detection of cold or hotspots are prevented in the output result because the data is strongly skewed left or right [54]. Accordingly, a logarithmic transformation can be applied to calculate trends’ absolute values (i.e., Rd and Ri) and then apply it to hotspot analysis [55]. The statistical significance of Gi* can be tested using the standardized Z-value, and the ArcGIS 10.7’s Hot Spot Analysis with Rendering tool was used to analyze the cold- and hotspot regions of water-yield trends across the YRB. The output of the Getis–Ord Gi* statistic in the YRB is represented by a Z-score for each county. High-value clustering is indicated when the Z-score exceeds 1.65, while low-value clustering is identified when it falls below −1.65. Based on the statistical results, the cold- and hotspot areas were classified into seven categories.

2.3.5. Attribution Analysis Method

Indicator System. The dynamic changes in water yield in the YRB studied in this paper are influenced by various natural geographic and anthropogenic factors. Therefore, we selected slope (Slope), soil sand content (Persand), vegetation coverage (FVC), absolute precipitation (Pre), precipitation trend (Pretrend), potential evapotranspiration (Evap), and potential evapotranspiration trend (Evaptrend) as natural variables, and gross domestic product (GDP), distance to human settlement areas (Disur), and road density (Roden) as social variables to construct the indicator system for dynamic attribution analysis of water yield.
Relative importance calculation. To assess how strongly each variable in the indicator framework affects the water-yield trend, this paper uses the relaimp package in R 4.4.1 for relative importance analysis. The calculated correlation coefficients indicate the strength of association among variables [53], with higher values suggesting a stronger influence on water-yield trends.
Geographically weighted regression. Upon completing the global assessment of the driving forces influencing water-yield trends, spatial heterogeneity in the relationship between water-yield trends and its drivers were explained using geographically weighted regression [20,56]. The average values of independent variables per county in the YRB, along with the water-yield change rate, were derived using ArcGIS Pro v3.0.2 and served as input data for the GWR analysis. The regression coefficients of the significant variables selected by OLS were plotted to describe the local associations between water-yield dynamics and their determining factors across the YRB. It is worth noting that for each local model the optimal bandwidth was determined using the golden search method during parameter optimization [57].

3. Results

3.1. LUCC Analysis in the Yellow River Basin

We calculated the LULC changes in the YRB over the three study periods using a land-use transition matrix (Figure 3). Grassland and cropland, which make up about 45% and more than 25% of the YRB’s total area, respectively, represent the main LULC types. Next are unused land, forestland, and shrubland, each occupying more than 5% of the area. The remaining areas collectively represent less than 5% of the basin area, including water bodies, construction land, snow/ice, and wetlands. During the research period, the areas of different LULCs changed continuously in the YRB (Figure 3d). As the expansion of grassland from 2000 to 2019 exceeded the grassland reduction from 1980 to 1999, a 0.33% increase in the total grassland coverage within the YRB over the past four decades was witnessed. Meanwhile, construction land coverage in the YRB increased rapidly, with the growth rate increasing from 354.90 km2yr−1 during 1980–1999 to 1211.20 km2yr−1 during 2000–2019. Conversely, cropland, unused land, and wetland coverage in the YRB have shown a persistent decreasing trend, with reductions of 6.36%, 3.34%, and 7.72%. Regarding other land-use types, like water bodies, their area changes show an unstable fluctuation pattern. The results of LUCC across the three time periods (Figure 3a–c) showed that cropland loss in the YRB is primarily due to conversion to grassland, construction land, and forestland. The period 2000–2019 saw a 72.15% growth in cropland conversion to forestland and grassland relative to the previous two decades (1980–1999). Most of the grassland loss in the YRB is primarily due to land conversion for cropland expansion. Additionally, we observed a small amount of construction land being converted into cropland in the region.

3.2. Analysis of Surface Runoff Changes in the Yellow River Basin

3.2.1. Dynamic of Water Yield in Different LULCs in the Yellow River Basin

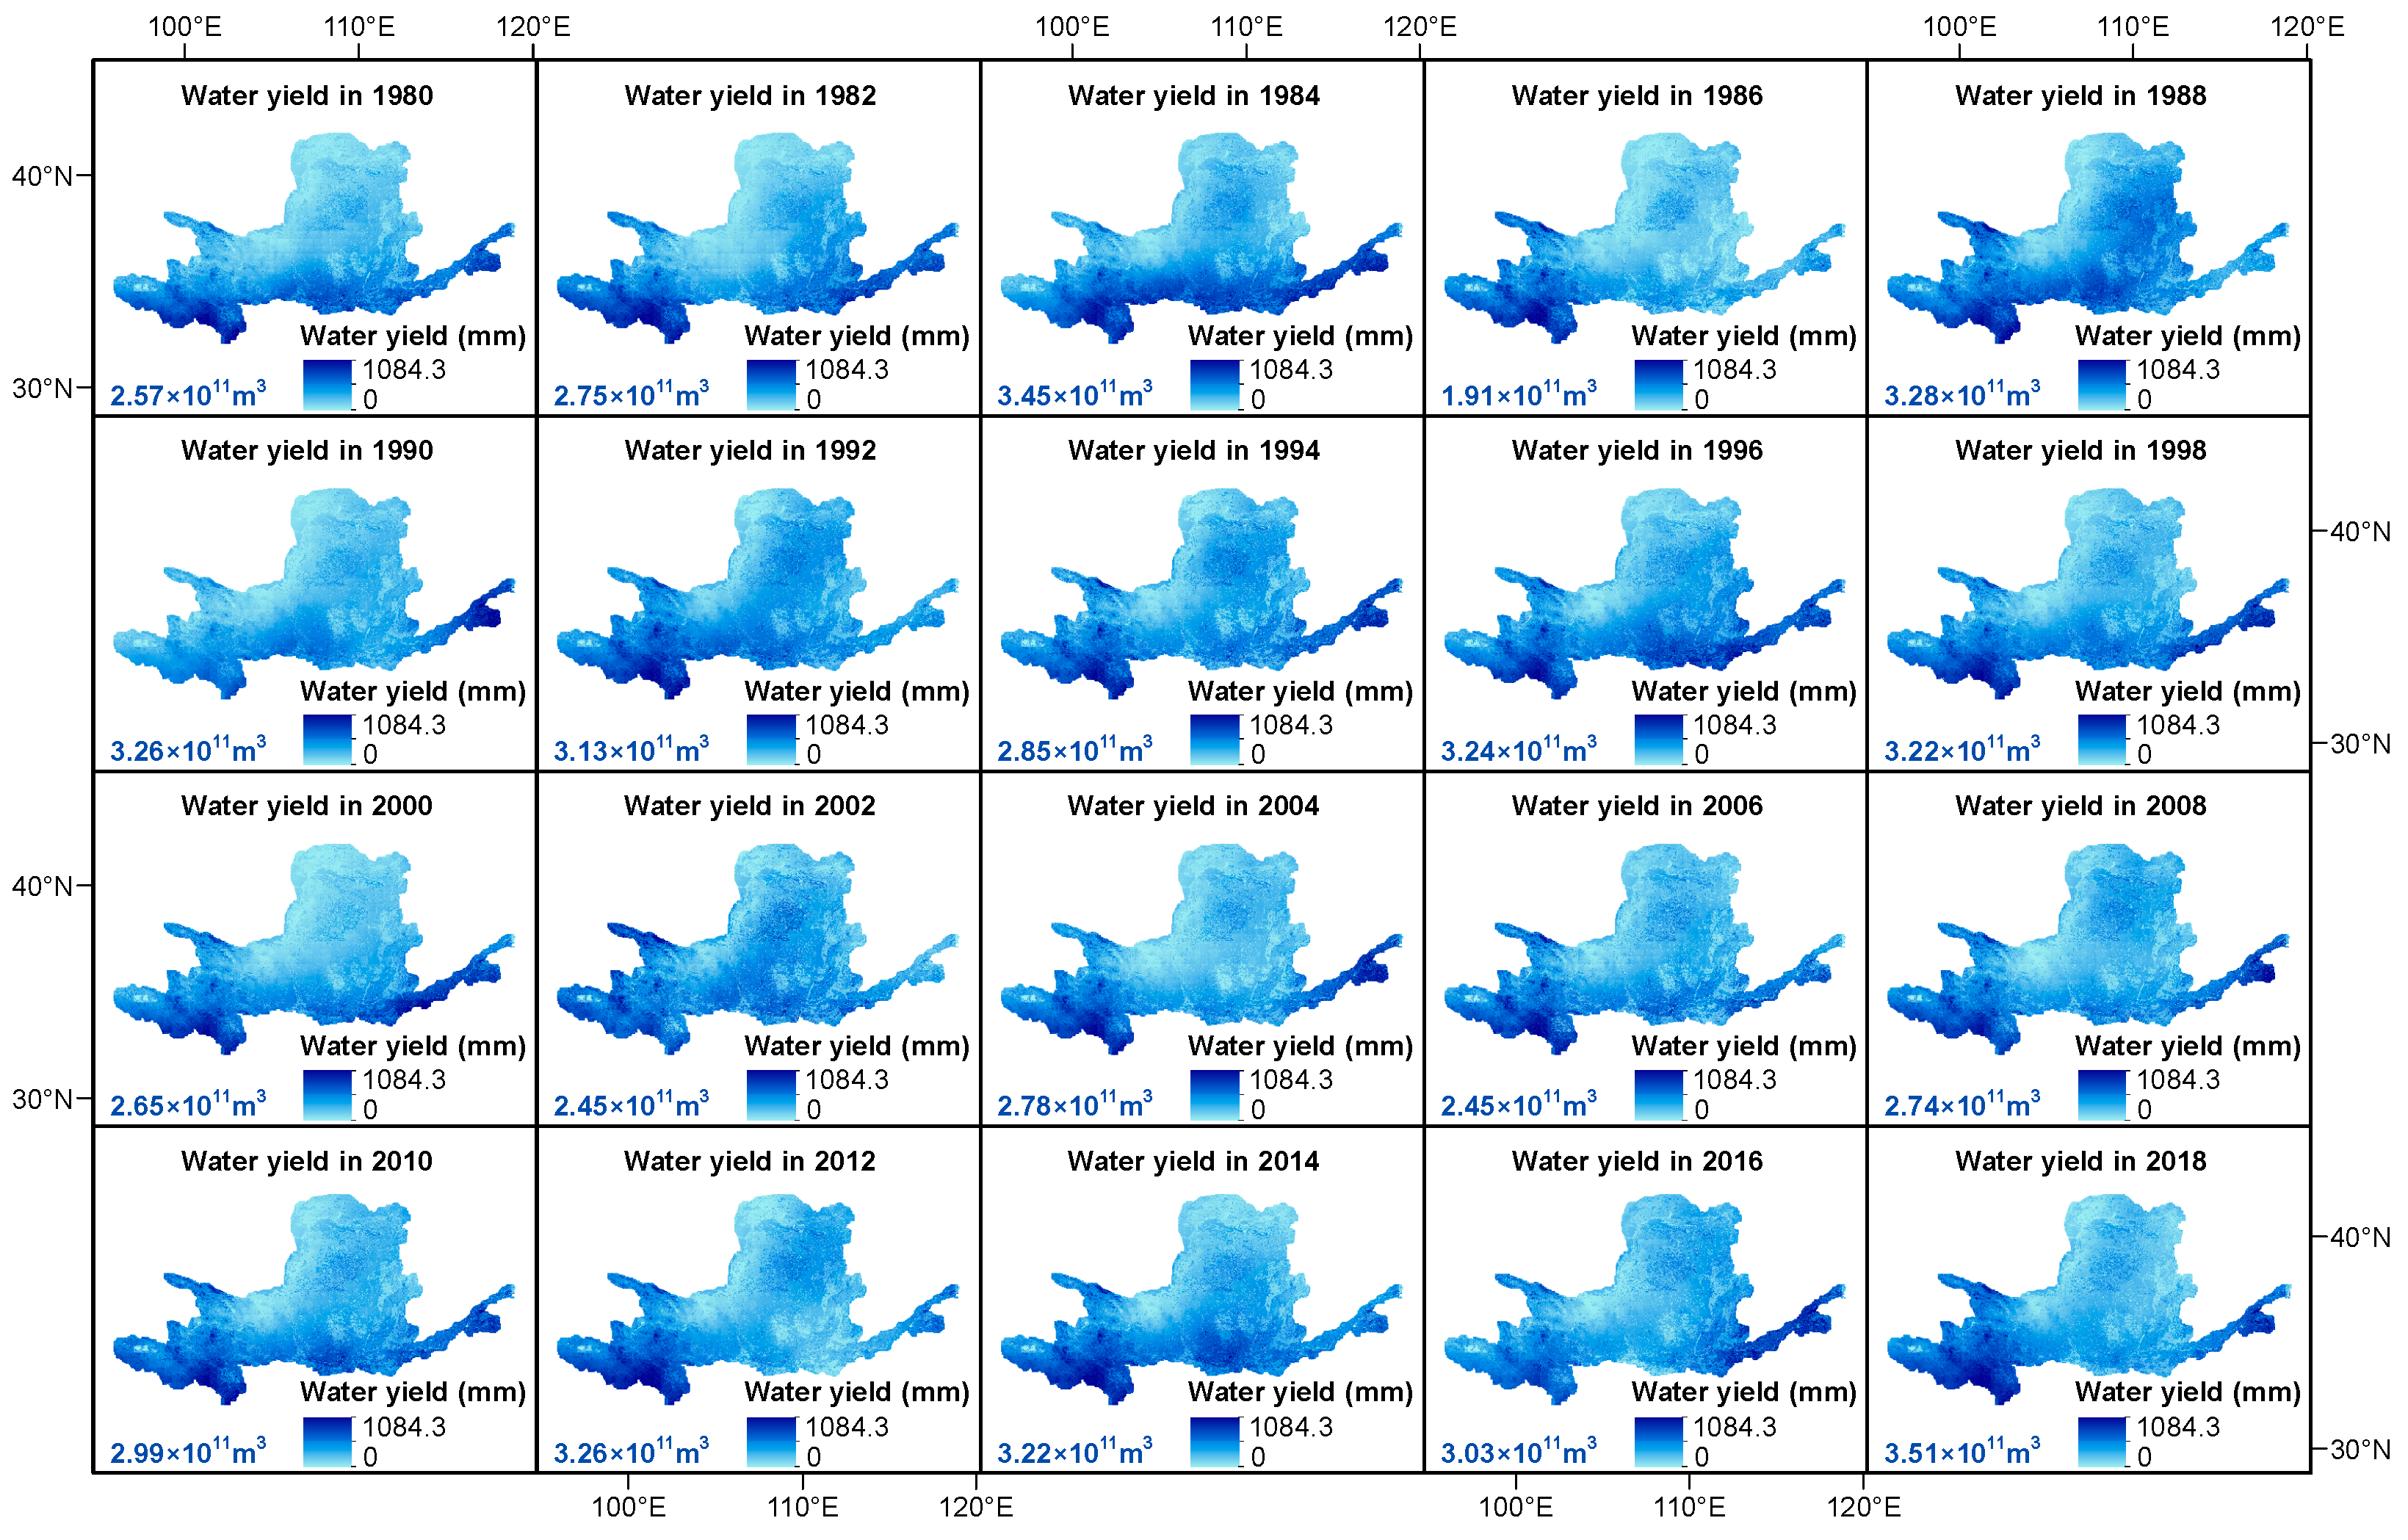
Based on the InVEST model, annual water yield in the YRB from 1980 to 2019 was generated (Figure A1). Following this, annual water-yield totals were analyzed for both the overall YRB and different LULCs (Figure 4). According to the basin-scale analysis (Figure 4a), the mean water-yield depth in the YRB during the last four decades was 238.9 mm, and the maximum and minimum water-yield depths were, respectively, observed in 2019 (347.08 mm) and 1986 (152.2 mm). Furthermore, although the YRB’s annual water yield increased at the rate of 7.57 × 10¹¹ m3yr−1 (p > 0.1) from 1980 to 2019, water yield increased at a rate of 3.68 × 10¹¹ m3yr−1 (p < 0.1) from 2000 to 2019, indicating a statistically significant upward trend.
However, water-yield changing trends in the YRB vary significantly across different LULCs (Figure 4b–j). With forest and construction land excluded, specifically, over the past four decades, grassland, wetlands, shrubland, unused land, and snow/ice, respectively, showed water-yield increases at rates of 1.69 × 10¹¹ m3yr−1, 0.89 × 10⁹ m3yr−1, 8.97 × 10¹⁰ m3yr−1, 7 × 10¹⁰ m3yr−1, and 2.67 × 10⁸ m3yr−1 (p > 0.1). A general pattern of decrease (1980–1999) followed by increase (2000–2019) in water yield was observed across these land types, while cropland, forestland, and water bodies, respectively, showed water-yield decreases at rates of 1.01 × 10¹¹ m3yr−1, 1.08 × 10¹⁰ m3yr−1, and 1.12 × 10⁹ m3yr−1 (p > 0.1). In contrast, a pattern of increase (2000–2019) followed by decrease (1980–1999) in water yield was observed in the forestland. Additionally, construction land recorded an increasing trend in water yield during both phases.

3.2.2. Temporal Variations of Water Yield at the Pixel Scale in the Yellow River Basin

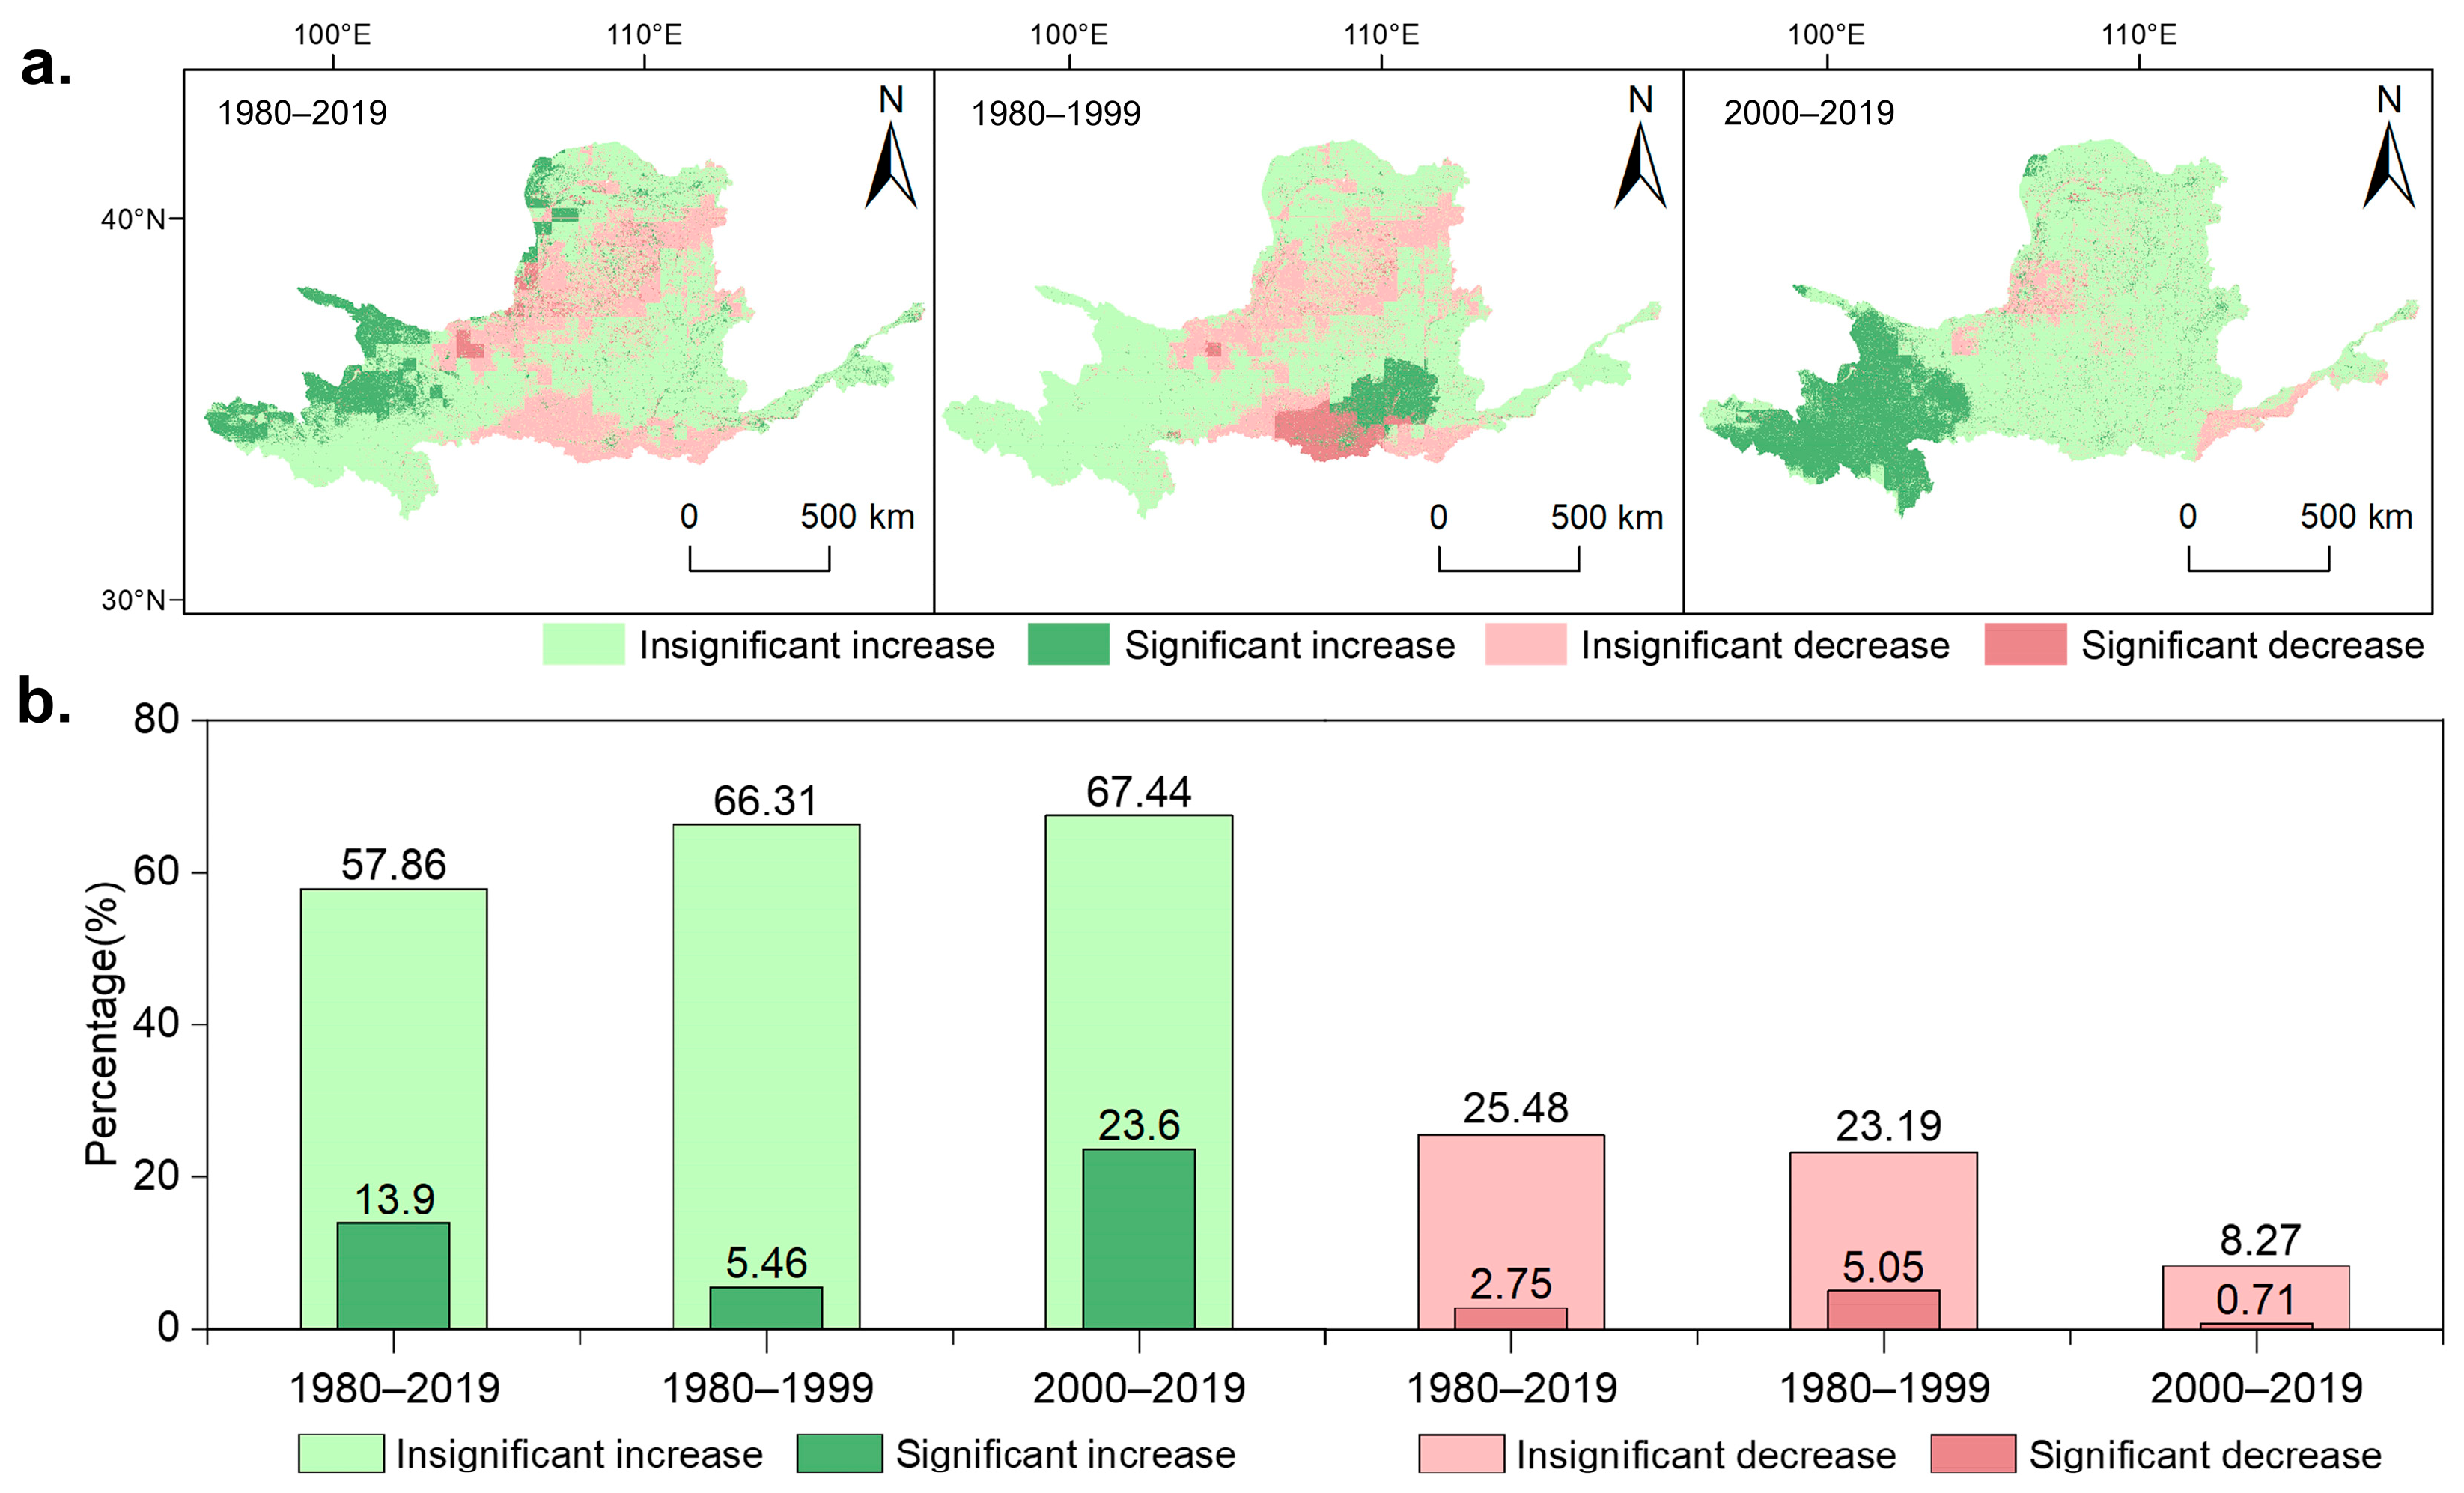
Least-squares linear regression was applied to estimate the water-yield trend at the pixel scale across the entire YRB during 1980–2019 (Figure 5a). Pixel-scale statistics reveal that over the last 40 years, although 71.76% of the YRB experienced an increase in water yield, only 13.90% of the area exhibited a significant increase, which was predominantly found on the western boundary of the basin (Figure 5b). The area with significant decrease in water yield occupied the smallest proportion, only 2.75%; the significant decrease is primarily observed in the upstream of the YRB, especially near Yinchuan. Comparison between the two periods indicates that the proportion of areas exhibiting significant increases in water yield consistently surpassed that of areas with significant decreases. Notably, in the second sub-period, the proportion of regions with significantly increased water yield (23.60%) greatly exceeded that with a significant decrease (0.71%). Over time, the area with significantly increased water yield shifted from the Fen River confluence in the midstream to the basin’s source area, with its proportion rising from 5.46% to 23.60%. The area with significantly decreased water yield disappeared at the junction of the Jing River and Wei River in the southern YRB (Xi’an), resulting in a decrease in the proportion of this trend from 5.05% to 0.71%.

3.3. Spatial Heterogeneity of Water-Yield Changes in the Yellow River Basin

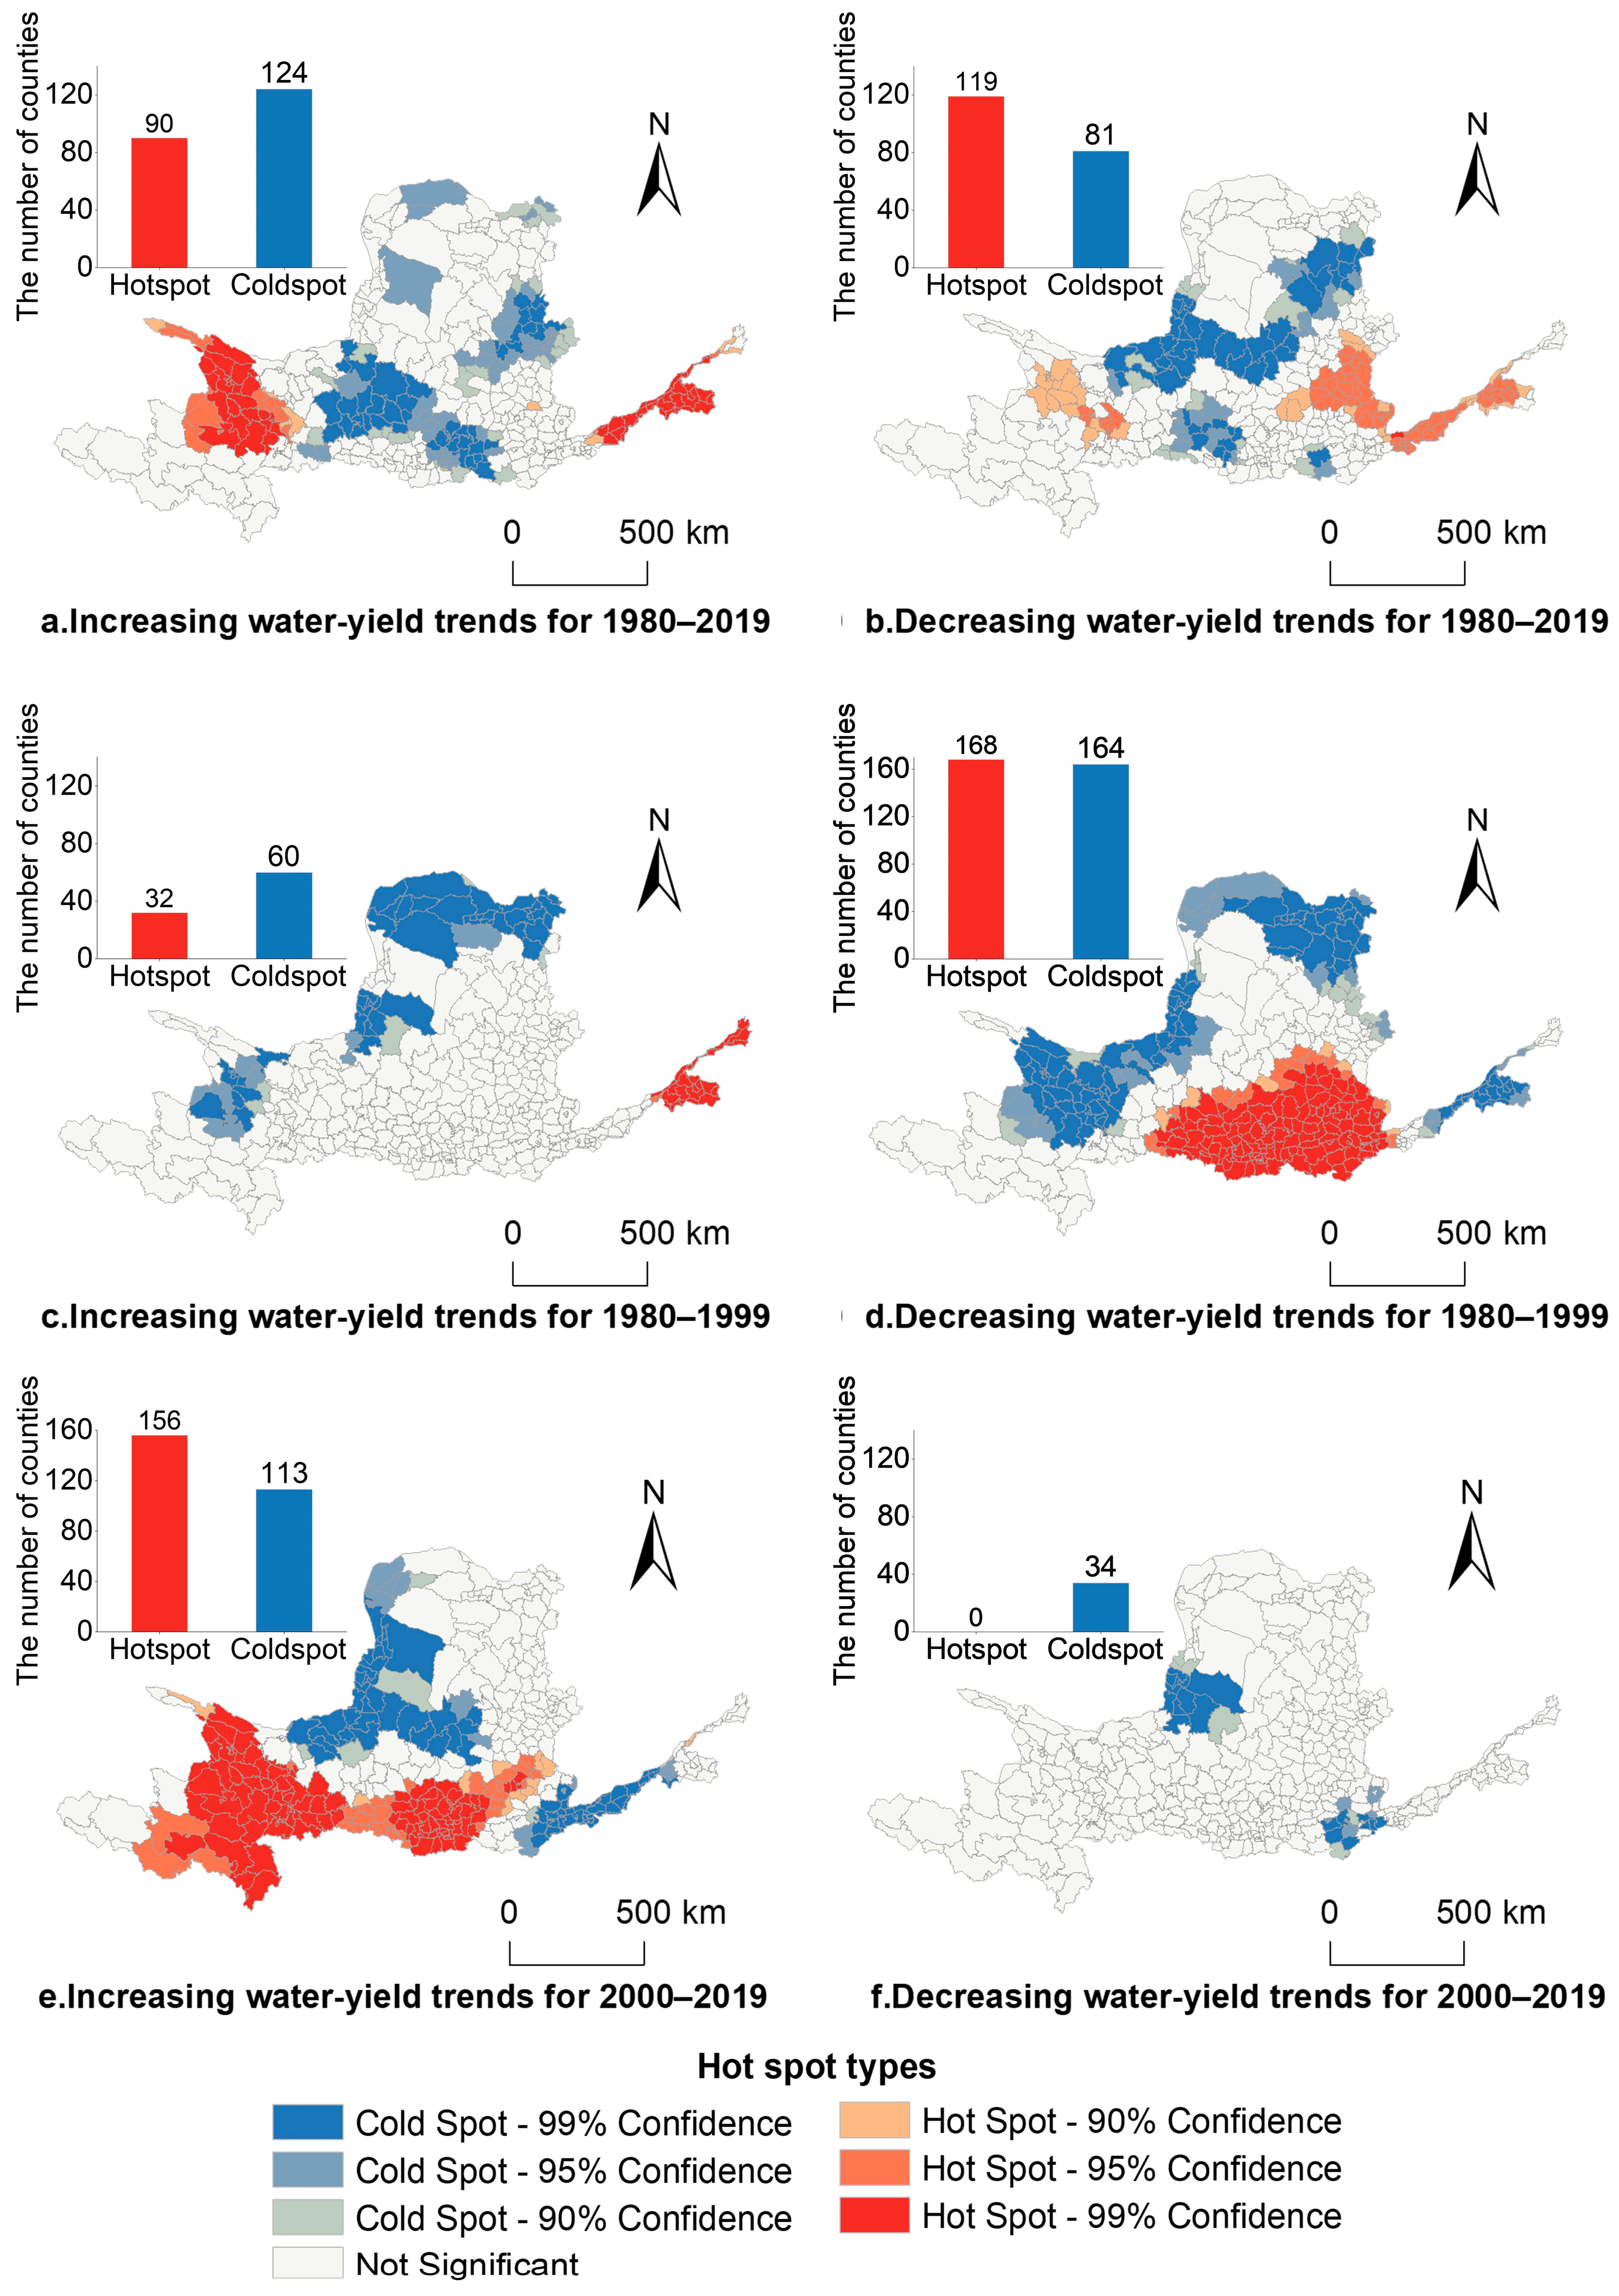
Based on the county-scale, zonal statistics of water-yield trends were conducted for three time periods in the YRB. To reveal the spatial clustering patterns of significant increases and decreases in water yield, hotspot maps were produced using the Getis–Ord Gi* (d) statistic (Figure 6).
During the study period, hotspots of significantly increasing water-yield trends (Figure 6a) were primarily located in the downstream region of the YRB and the upstream Xining section. Cold spots were concentrated in Lanzhou and Xi’an in the upstream, as well as in Taiyuan in the middle reaches. The hotspot analysis of significantly decreasing water-yield trends (Figure 6b) revealed that most hotspots were concentrated in the downstream section of the YRB and the southeastern part of midstream, while cold-spots were mainly situated in the central area of the YRB.
The phase comparison showed that hotspots of significantly increasing water-yield trends (Figure 6c,e) shifted from being concentrated in the downstream YRB during 1980–1999 to the middle and upstream regions during 2000–2019. Cold spots disappeared in the northern YRB, particularly in the southeastern parts of Inner Mongolia and the northern part of Qinghai, while they started to spread towards the northwest and downstream regions, almost doubling in number. For hotspots of significantly decreasing water-yield trends (Figure 6d,f), they were concentrated at the confluence of the Jing, Fen, and Wei rivers during 1980–1999, but vanished completely by 2000–2019. In the first phase cold spots of significantly decreased water yield were primarily concentrated in the northern and northwestern sections of the YRB and in the downstream regions. But by the second phase, most of them had disappeared, leaving only two concentrated areas: the confluence of the middle and downstream YRB, and the city of Yinchuan in the upstream YRB.

3.4. Driving Factors Influencing Water-Yield Changing Trends in the Yellow River Basin

3.4.1. Global Variable Analysis of Factors Influencing Water-Yield Changing Trends

To evaluate water-yield trend variations in the YRB, the OLS model was used to analyze the contributions of socio-economic and natural drivers. The relaimpo package in R was used to quantify the contribution of each driving factor to the trends in water-yield change (Table 1). The results demonstrate that the water-yield trends across the YRB were well-explained by the OLS regression model, with a coefficient of determination (R2) of 92.27%. Six factors were found to significantly influence the water-yield changing trends. Specifically, water-yield change trends exhibited a significant negative correlation with both potential evapotranspiration and slope, while GDP, FVC, Pre, and Pretrend exhibited significant positive correlations. The increasing trend in water yield was primarily associated with the rise in Pretrend (relative importance = 11.44%) and the decline in potential Evaptrend (relative importance = 71.58%). The decrease in water yield was found to slow down in areas farther from human settlements. Additionally, over the past four decades, natural variables are the dominant factors affecting the water-production dynamics of YRB with a contribution of 93.54% to the total relative importance (Table 1). In contrast, socio-economic factors accounted for just 6.45% of the relative importance.

3.4.2. Local Variable Analysis of Water-Yield Change Drivers

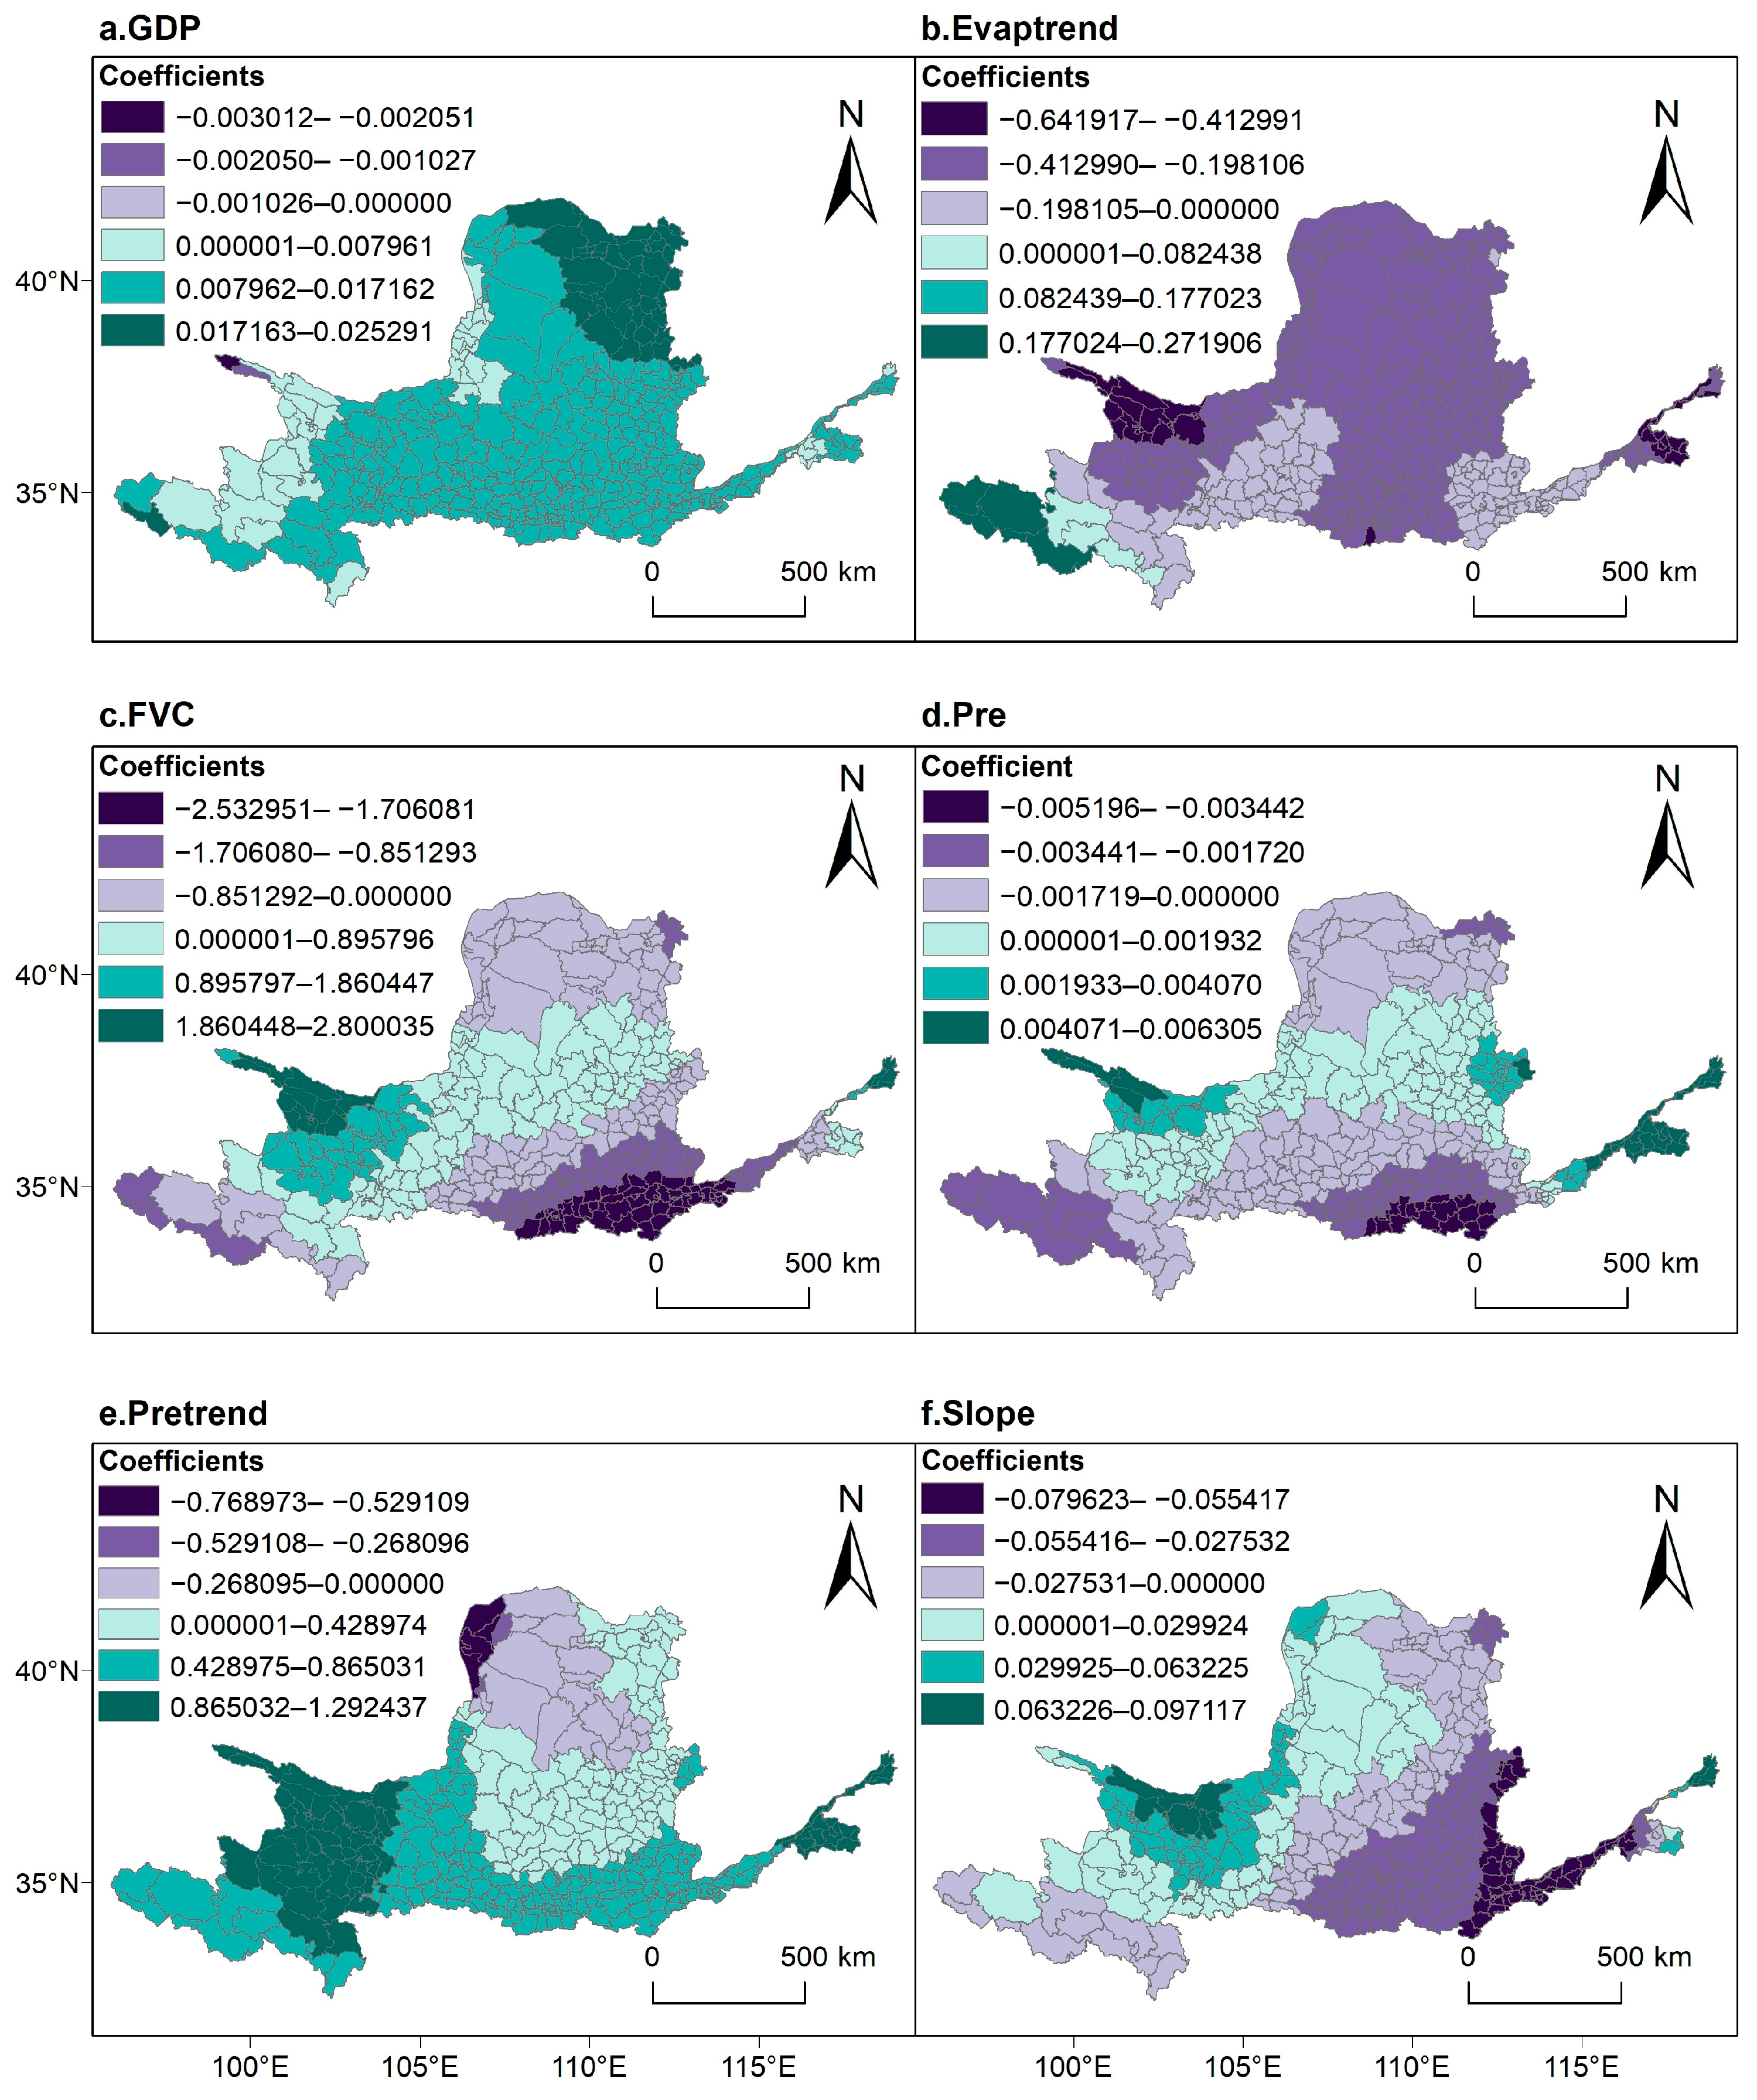
As mentioned earlier, six important drivers contributed to over 92% (92.27%) of the water-yield dynamics. Next, the spatial heterogeneity of the six driving factors on water-yield trends was assessed using bivariate local Moran’s index analysis. From the GWR coefficient map, it is clear that each driver exhibited dual effects on water-yield dynamics, with geographically distinct areas showing either positive or negative relationships (Figure 7). In the YRB, a large area of water-yield changing trends shows a positive correlation with GDP, with coefficients decreasing from northeast to southwest (Figure 7a), displaying a multi-band spatial pattern. Our analysis suggests potential positive correlations between anthropogenic development intensity and water-yield increases in certain areas of the YRB. Regarding natural variables, the trends of water yield in the headwater area of the YRB are positively correlated with the trends in potential Evaptrend and Pretrend. In this region, other natural variables show a negative correlation with water yield (Figure 7b–f). Notably, a negative correlation between Evaptrend and water yield in non-headwater regions indicate that a large amount of Evaptrend leads to a decrease in these areas. The northern basin exhibited a decrease in the trends of water yield due to simultaneous increases in Evaptrend and Pretrend and higher FVC. The southeastern region of the basin exhibits positive relationships for FVC, Pre, and Slope, which progressively reverse to negative correlations in the southwest, exhibiting a multi-belt spatial pattern.

4. Discussion

4.1. Implications of the Results

Since land surface changes directly influence water-yield dynamics, we analyzed LUCC and the water-yield trends in the YRB to clarify the LUCC’s impact on water yield. Driven by programs such as the Grain-for-Green and Three-North Shelter Forest, the YRB has experienced notable ecological transformation, and the area of forestland has shifted from a decreasing trend between 1980 and 1999 to an increasing trend between 2000 and 2019 (Figure 3d), with its water yield showing a decreasing trend (Figure 4d). As plantation forest areas continue to expand and tree age increases, the development of more extensive root systems and denser canopies significantly enhances rainfall interception. This process further reduces surface runoff and consequently leads to a decrease in the water yield of forest land. Over the past 40 years, the decreasing trend in water yield can be linked to the loss of crop land, due to both the implication of ecological policies like the Grain for Green Program and urban expansion. Meanwhile, due to the implementation of the above policy, a significant amount of grassland has been converted, and its area has increased (Figure 3d), leading to an increased water-yield trend (Figure 4c). The increased water yield in grassland is partly because of the large conversion of crop lands and unused lands into grasslands (Figure 3c), which further increases water yield as grassland area expands. The swift growth of built-up land has resulted in the continuous expansion of impervious surfaces, which in turn has resulted in higher water yield. Notably, although the R2 values obtained in the temporal trend analysis are relatively low, this is common in environmental time series due to high interannual variability. Our primary focus is on the direction of change and statistical significance; therefore, when p < 0.05, we consider the trend to be meaningful and valid. These findings highlight the importance of macro-level land management, particularly for land types that are highly sensitive to precipitation changes, such as grasslands, forestlands, and construction land. Based on water-yield demands and other ecological indicators, ecological red lines for each land type should be planned. An expansion in impermeable surface area promotes an increase in water yield, but a large amount of surface runoff entering urban underground drainage systems has not been fully utilized by humans [58]. Therefore, optimizing urban drainage and maximizing the use of precipitation is crucial, and establishing rainwater collection and storage systems in urban areas can help alleviate water-scarcity pressures.
An overall water-yield increasing trend has been observed in the YRB during the past four decades. On the one hand, areas with significant increases in water yield are more extensive than those with significant decreases. On the other hand, the YRB has seen an accelerating trend in significant water-yield increase and a gradual slowdown in the rate of significant decrease over the past four decades (Figure 5b). This is attributed to built-up land’s accelerated expansion in the YRB over the past four decades (Figure 3d), particularly in the densely populated downstream regions [59], where rapid urban expansion in these areas has resulted in the concentration of numerous water-yield increase hotspots. The trend of increasing water yield and its spatial hotspots are mainly distributed in the upstream area of the basin (Figure 5a). In addition to LUCCs, we consider the increase in water yield in the upstream region to have been driven by the increase in precipitation (Figure 7e). Furthermore, due to the desertification control measures implemented in the Kubuqi and Mu Us Deserts, an increasing trend in water yield has been observed as a result of converting sandy land into forestland and grassland areas. This explains why certain areas in the middle areas of the basin show increasing water-yield trends, even though the overall trend there is decreasing.
The trends in water-yield changes across the YRB are driven not only by LUCCs but also by various natural and socio-economic factors. Therefore, the global relationships between water-yield trends and ten selected variables were examined using the OLS regression model, including three socio-economic and seven natural factors. Our findings show that, over the past four decades, water-yield dynamics in the YRB have been primarily driven by natural physical factors, particularly potential evapotranspiration, precipitation, vegetation cover, and slope. Among these, Pretrend is the dominant driver of water-yield dynamics among natural physical factors (relative importance = 71.58%), which is consistent with multiple study results [12,60]. Contrary to our expectations, the global factor analysis revealed water-yield trends to be significantly negatively associated with Slope (Table 1). This results from policies promoting the conversion of cropland on slopes steeper than 25 degrees or steep terraces into forests and grasslands in the YRB [61]. Additionally, the results of local factor analysis seem to explain the issue: the southeastern YRB exhibits a dominant pattern of negative correlation between Slope and water-yield trends (Figure 7f), particularly in the downstream region. These areas are densely populated with urban agglomerations and have well-developed ecological and social service facilities. On slopes outside construction land, vegetation is planted to reduce surface runoff and prevent soil erosion, while within construction land, urban drainage systems have been established to prevent excessive precipitation accumulation in low-lying areas during heavy rainfall and to make full use of precipitation resources. As for socio-economic factors, GDP is positively correlated with water-yield dynamics, with a stronger correlation than some natural factors. We attribute this to urbanization, which drives issues such as urban wastewater discharge, land conversion to construction land, and the expansion of impervious surfaces, all of which ultimately lead to increased water yield [27].
Our study provides several insights for water-yield management. First, with the YRB as a key region for China’s ‘Grain for Green’ afforestation program, future efforts should consider the scale of forest planting to mitigate water-resource pressures. Second, while rapid urbanization can harm surrounding ecological land [62], it may also increase water yield. Thus, promoting a steady pace of urban development and supporting rainwater collection and storage systems are crucial for sustaining water-yield ecosystem services. Finally, the natural environment within the YRB is complex, with significant spatial heterogeneity, and water-yield dynamics respond differently to the same driving factors across different regions. Therefore, water-yield management in the basin should adopt a regionally tailored, zoned approach.

4.2. Uncertainties and Limitations

The YRB covers a vast area with large differences in surface environments. Complex terrain features are not considered in the InVEST Annual Water Yield model; the accuracy of the parameters for ecosystem service functions simulated at a large scale is difficult to guarantee. Additionally, the same Z value was applied across the entire study area, neglecting the distinct climatic and precipitation conditions across the different reaches of the YRB. After testing various Z values, we selected one that approximates the YRB’s actual water yield. However, reliable prediction of water yield by the model still depends on validation through extensive field measurements. Furthermore, the soil-particle size (silt, clay, and sand content) and plant-available water-content data used in the InVEST model were sourced from the World Soil Database, and bedrock depth was used in place of maximum root depth. While this phenomenon does not alter the YRB’s overall water-yield pattern, it reduces the model’s simulation accuracy. Even when the absolute values are less reliable, the InVEST model remains applicable for evaluating water-yield changing trends under environmental-change scenarios in the YRB and yields actionable scientific recommendations to inform water-conservation measures, utilization planning, and regulatory decision-making. The main reason for choosing 2000 as the time breakpoint is based on the launch of major ecological projects during this period. However, we acknowledge that this choice lacks statistical validation and may oversimplify the gradual nature of hydrological responses. Future studies should apply formal detection methods to refine breakpoint selection.

5. Conclusions

This study evaluates 40-year water-yield changing trends across different LULC types in the YRB and the dynamic characteristics of water yield from a multi-scale perspective. In addition, we quantitatively assessed the relative contributions of both socio-economic and natural factors to water-yield trends. We can conclude that the YRB has experienced an increasing trend in water yield over the past four decades, with different LULCs exhibiting varying rates of change. The area of regions with significantly increased water yield in 2000–2019 is larger than that in 1980–1999, while the area with significantly decreased water yield has decreased. Hotspots of significantly increased water yield are mainly concentrated in the central part of the downstream regions and upstream regions, while the hotspots of significantly decreased water yield are concentrated in the eastern midstream, all of which are human-dense areas. Furthermore, our attribution analysis shows that natural variables were the dominant drivers of water-yield dynamics in the YRB during the past four decades. Finally, the different responses of water-yield dynamics to spatial drivers were revealed, suggesting that broad-scale water-yield management in the YRB requires a tailored approach that comprehensively considers multiple factors.
Although the spatiotemporal dynamics of water production in YRB have been analyzed, this study has several limitations that highlight directions for future research. First, although the InVEST model can be used to effectively evaluate ecosystem services, it lacks the capacity to simulate complex hydrological processes. Future work should consider coupling InVEST with process-based hydrological models to more accurately represent water-cycle mechanisms in the basin. Second, while this study focused on water yield, issues such as soil erosion and sediment transport remain critical in the YRB. A comprehensive assessment can be achieved by integrating these ecological processes, while evaluating how different ecosystem functions interact or conflict. Moreover, given the limitations of input data and the environmental complexity of the YRB, future research should prioritize refining the accuracy of input variables, with particular attention to the Z parameter, which influences the spatial variability of water yield, thereby enhancing model reliability.

Author Contributions

L.L.: Writing—Original draft preparation, Conceptualization, Methodology, Software, Visualization. X.C.: Conceptualization, Supervision, Funding acquisition, Writing—Review & Editing. Y.C.: Methodology. H.Y.: Project administration, Writing—Review and Editing. Z.D. (Ziqiang Du): Writing—Review and Editing. Z.W.: Writing—Review and Editing. T.L.: Writing—Review and Editing. Z.D. (Zhenrong Du): Writing—Review and Editing. X.L.: Project administration, Writing—Review and Editing. Y.L.: Conceptualization, Writing—Review and Editing. All authors have read and agreed to the published version of the manuscript.

Funding

This work was supported by the National Natural Science Foundation of China (grant number: 42201279); and The Talents Project for Wenying Young Scholars of Shanxi University (grant number: 5311).

Data Availability Statement

The original contributions presented in the study are included in the article, further inquiries can be directed to the corresponding authors.

Conflicts of Interest

The authors declare no conflicts of interest.

Abbreviations

The following abbreviations are used in this manuscript:
YRBYellow River Basin
InVESTIntegrated Valuation of Ecosystem Services and Trade-offs
LULCLand use and land cover
LUCCLand use and land cover change
LULCsLand use and land covers
DEMDigital Elevation Model
GWRGeographically Weighted Regression
OLSOrdinary Least Squares

Appendix A

Figure A1. Annual pixel-level water-yield maps in the YRB over 1980–2019. The map presents pixel-level water-yield maps at two-year intervals, with blue annotations in the subfigures indicating the total water yield within the YRB for the corresponding year.
Land 14 01579 g0a1

References

  1. Costanza, R.; de Groot, R.; Braat, L.; Kubiszewski, I.; Fioramonti, L.; Sutton, P.; Farber, S.; Grasso, M. Twenty Years of Ecosystem Services: How Far Have We Come and How Far Do We Still Need to Go? Ecosyst. Serv. 2017, 28, 1–16. [Google Scholar] [CrossRef]
  2. Fu, B.; Zhang, L. Land-Use Change and Ecosystem Services: Concepts, Methods and Progress. Prog. Geogr. 2014, 33, 441–446. [Google Scholar] [CrossRef]
  3. Chen, X.; Lin, S.; Tian, J.; Wang, Y.; Ye, Y.; Dong, S.; Gong, X.; Lin, Q.; Zhu, L. Simulation Study on Water Yield Service Flow Based on the InVEST-Geoda-Gephi Network: A Case Study on Wuyi Mountains, China. Ecol. Indic. 2024, 159, 111694. [Google Scholar] [CrossRef]
  4. Egoh, B.; Rouget, M.; Reyers, B.; Knight, A.T.; Cowling, R.M.; Van Jaarsveld, A.S.; Welz, A. Integrating Ecosystem Services into Conservation Assessments: A Review. Ecol. Econ. 2007, 63, 714–721. [Google Scholar] [CrossRef]
  5. D’Odorico, P.; Davis, K.F.; Rosa, L.; Carr, J.A.; Chiarelli, D.; Dell’Angelo, J.; Gephart, J.; MacDonald, G.K.; Seekell, D.A.; Suweis, S.; et al. The Global Food-Energy-Water Nexus. Rev. Geophys. 2018, 56, 456–531. [Google Scholar] [CrossRef]
  6. Winkler, K.; Fuchs, R.; Rounsevell, M.; Herold, M. Global Land Use Changes are Four Times Greater than Previously Estimated. Nat. Commun. 2021, 12, 2501. [Google Scholar] [CrossRef]
  7. Zhang, L.; Cheng, L.; Chiew, F.; Fu, B. Understanding the Impacts of Climate and Landuse Change on Water Yield. Curr. Opin. Environ. Sustain. 2018, 33, 167–174. [Google Scholar] [CrossRef]
  8. Wang, J.; Li, Y.; Huang, J.; Yan, T.; Sun, T. Growing Water Scarcity, Food Security and Government Responses in China. Glob. Food Secur. 2017, 14, 9–17. [Google Scholar] [CrossRef]
  9. Sun, G.; Zhou, G.; Zhang, Z.; Wei, X.; McNulty, S.G.; Vose, J.M. Potential Water Yield Reduction Due to Forestation across China. J. Hydrol. 2006, 328, 548–558. [Google Scholar] [CrossRef]
  10. Dietz, K.; Zörb, C.; Geilfus, C. Drought and Crop Yield. Plant Biol. 2021, 23, 881–893. [Google Scholar] [CrossRef]
  11. Liu, N.; Sun, P.; Caldwell, P.V.; Harper, R.; Liu, S.; Sun, G. Trade-off between Watershed Water Yield and Ecosystem Productivity along Elevation Gradients on a Complex Terrain in Southwestern China. J. Hydrol. 2020, 590, 125449. [Google Scholar] [CrossRef]
  12. Pessacg, N.; Flaherty, S.; Brandizi, L.; Solman, S.; Pascual, M. Getting Water Right: A Case Study in Water Yield Modelling Based on Precipitation Data. Sci. Total Environ. 2015, 537, 225–234. [Google Scholar] [CrossRef]
  13. Chen, Q.; Chen, Y.H.; Wang, M.J.; Jiang, W.G.; Hou, P.; Li, Y. Change of Vegetation Net Primary Productivity in Yellow River Watersheds from 2001 to 2010 and Its Climatic Driving Factors Analysis. Yingyong Shengtai Xuebao 2014, 25, 2811–2818. [Google Scholar]
  14. Xi, J. Speech at the Symposium on Ecological Protection and High-Quality Development of the Yellow River Basin. China Water Resour. 2019, 20, 1–3. [Google Scholar]
  15. Chen, Y.; Fu, B.; Zhao, Y.; Wang, K.; Zhao, M.M.; Ma, J.; Wu, J.-H.; Xu, C.; Liu, W.; Wang, H. Sustainable Development in the Yellow River Basin: Issues and Strategies. J. Clean. Prod. 2020, 263, 121223. [Google Scholar] [CrossRef]
  16. Liu, Y.; Song, H.; An, Z.; Sun, C.; Trouet, V.; Cai, Q.; Liu, R.; Leavitt, S.W.; Song, Y.; Li, Q. Recent Anthropogenic Curtailing of Yellow River Runoff and Sediment Load is Unprecedented over the Past 500 y. Proc. Natl. Acad. Sci. USA 2020, 117, 18251–18257. [Google Scholar] [CrossRef]
  17. Xiao, Y.; Guo, B.; Lu, Y.; Zhang, R.; Zhang, D.; Zhen, X.; Chen, S.; Wu, H.; Wei, C.; Yang, L. Spatial–Temporal Evolution Patterns of Soil Erosion in the Yellow River Basin from 1990 to 2015: Impacts of Natural Factors and Land Use Change. Geomat. Nat. Hazards Risk 2021, 12, 103–122. [Google Scholar] [CrossRef]
  18. Fan, X.; Ma, Z.; Yang, Q.; Han, Y.; Mahmood, R.; Zheng, Z. Land Use/Land Cover Changes and Regional Climate over the Loess Plateau during 2001–2009. Part I: Observational Evidence. Clim. Change 2015, 129, 427–440. [Google Scholar] [CrossRef]
  19. Redhead, J.W.; Stratford, C.; Sharps, K.; Jones, L.; Ziv, G.; Clarke, D.; Oliver, T.H.; Bullock, J.M. Empirical Validation of the InVEST Water Yield Ecosystem Service Model at a National Scale. Sci. Total Environ. 2016, 569–570, 1418–1426. [Google Scholar] [CrossRef] [PubMed]
  20. Wang, X.; Chu, B.; Feng, X.; Li, Y.; Fu, B.; Liu, S.; Jin, J. Spatiotemporal Variation and Driving Factors of Water Yield Services on the Qingzang Plateau. Geogr. Sustain. 2021, 2, 31–39. [Google Scholar] [CrossRef]
  21. Sharp, R.; Chaplin-Kramer, R.; Wood, S.; Guerry, A.; Tallis, H.; Ricketts, T.; Nelson, E.; Ennaanay, D.; Wolny, S.; Olwero, N.; et al. InVEST User’s Guide; The Natural Capital Project: Standford, CA, USA, 2018. [Google Scholar]
  22. Che, X.; Jiao, L.; Qin, H.; Wu, J. Impacts of Climate and Land Use/Cover Change on Water Yield Services in the Upper Yellow River Basin in Maqu County. Sustainability 2022, 14, 10363. [Google Scholar] [CrossRef]
  23. Wu, C.; Qiu, D.; Gao, P.; Mu, X.; Zhao, G. Application of the InVEST Model for Assessing Water Yield and Its Response to Precipitation and Land Use in the Weihe River Basin, China. J. Arid Land 2022, 14, 426–440. [Google Scholar] [CrossRef]
  24. Yang, J.; Xie, B.; Zhang, D.; Tao, W. Climate and Land Use Change Impacts on Water Yield Ecosystem Service in the Yellow River Basin, China. Environ. Earth Sci. 2021, 80, 72. [Google Scholar] [CrossRef]
  25. Yin, L.; Feng, X.; Fu, B.; Wang, S.; Wang, X.; Chen, Y.; Tao, F.; Hu, J. A Coupled Human-Natural System Analysis of Water Yield in the Yellow River Basin, China. Sci. Total Environ. 2021, 762, 143141. [Google Scholar] [CrossRef] [PubMed]
  26. Li, L.; Sato, Y.; Zhu, H. Simulating Spatial Urban Expansion Based on a Physical Process. Landsc. Urban Plan. 2003, 64, 67–76. [Google Scholar] [CrossRef]
  27. Xu, J.; Liu, S.; Zhao, S.; Wu, X.; Hou, X.; An, Y.; Shen, Z. Spatiotemporal Dynamics of Water Yield Service and Its Response to Urbanisation in the Beiyun River Basin, Beijing. Sustainability 2019, 11, 4361. [Google Scholar] [CrossRef]
  28. Li, S.; Yang, H.; Lacayo, M.; Liu, J.; Lei, G. Impacts of Land-Use and Land-Cover Changes on Water Yield: A Case Study in Jing-Jin-Ji, China. Sustainability 2018, 10, 960. [Google Scholar] [CrossRef]
  29. Wang, X.; Zhang, C.; Hasi, E.; Dong, Z. Has the Three Norths Forest Shelterbelt Program Solved the Desertification and Dust Storm Problems in Arid and Semiarid China? J. Arid Environ. 2010, 74, 13–22. [Google Scholar] [CrossRef]
  30. Lang, Y.; Song, W.; Zhang, Y. Responses of the Water-Yield Ecosystem Service to Climate and Land Use Change in Sancha River Basin, China. Phys. Chem. Earth Parts A B C 2017, 101, 102–111. [Google Scholar] [CrossRef]
  31. Qiu, D.; Xu, R.; Gao, P.; Mu, X. Effect of Vegetation Restoration Type and Topography on Soil Water Storage and Infiltration Capacity in the Loess Plateau, China. Catena 2024, 241, 108079. [Google Scholar] [CrossRef]
  32. Sun, S.; Xiang, W.; Ouyang, S.; Hu, Y.; Peng, C. Balancing Water Yield and Water Use Efficiency Between Planted and Natural Forests: A Global Analysis. Glob. Change Biol. 2024, 30, e17561. [Google Scholar] [CrossRef] [PubMed]
  33. Filoso, S.; Bezerra, M.O.; Weiss, K.C.; Palmer, M.A. Impacts of Forest Restoration on Water Yield: A Systematic Review. PLoS ONE 2017, 12, e0183210. [Google Scholar] [CrossRef]
  34. Ahmed, M.A.A.; Abd-Elrahman, A.; Escobedo, F.J.; Cropper, W.P., Jr.; Martin, T.A.; Timilsina, N. Spatially-Explicit Modeling of Multi-Scale Drivers of Aboveground Forest Biomass and Water Yield in Watersheds of the Southeastern United States. J. Environ. Manag. 2017, 199, 158–171. [Google Scholar] [CrossRef]
  35. Qin, L. Variation of Precipitation and Temperature in Yellow River Basin during the Last 50 Years. Chin. J. Agrometeorol. 2012, 33, 475. [Google Scholar] [CrossRef]
  36. Guo, L.; Zhu, W.; Wei, J.; Wang, L. Water Demand Forecasting and Countermeasures across the Yellow River Basin: Analysis from the Perspective of Water Resources Carrying Capacity. J. Hydrol. Reg. Stud. 2022, 42, 101148. [Google Scholar] [CrossRef]
  37. Xu, Y.; Yu, L.; Peng, D.; Zhao, J.; Cheng, Y.; Liu, X.; Li, W.; Meng, R.; Xu, X.; Gong, P. Annual 30-m Land Use/Land Cover Maps of China for 1980–2015 from the Integration of AVHRR, MODIS and Landsat Data Using the BFAST Algorithm. Sci. China Earth Sci. 2020, 63, 1390–1407. [Google Scholar] [CrossRef]
  38. Peng, S.; Ding, Y.; Liu, W.; Li, Z. 1 Km Monthly Temperature and Precipitation Dataset for China from 1901 to 2017. Earth Syst. Sci. Data 2019, 11, 1931–1946. [Google Scholar] [CrossRef]
  39. Ding, Y.; Peng, S. Spatiotemporal Change and Attribution of Potential Evapotranspiration over China from 1901 to 2100. Theor. Appl. Climatol. 2021, 145, 79–94. [Google Scholar] [CrossRef]
  40. Zhao, N.; Liu, Y.; Cao, G.; Samson, E.L.; Zhang, J. Forecasting China’s GDP at the Pixel Level Using Nighttime Lights Time Series and Population Images. GIScience Remote Sens. 2017, 54, 407–425. [Google Scholar] [CrossRef]
  41. Haklay, M.; Weber, P. Openstreetmap: User-Generated Street Maps. IEEE Pervasive Comput. 2008, 7, 12–18. [Google Scholar] [CrossRef]
  42. Gao, J.; Shi, Y.; Zhang, H.; Chen, X.; Zhang, W.; Shen, W.; Xiao, T.; Zhang, Y. China Regional 250m Fractional Vegetation Cover Data Set (2000–2022). Natl. Tibet. Plateau Data Cent. 2022. [Google Scholar] [CrossRef]
  43. Chen, X.; Yu, L.; Cao, Y.; Xu, Y.; Zhao, Z.; Zhuang, Y.; Liu, X.; Du, Z.; Liu, T.; Yang, B.; et al. Habitat Quality Dynamics in China’s First Group of National Parks in Recent Four Decades: Evidence from Land Use and Land Cover Changes. J. Environ. Manag. 2023, 325, 116505. [Google Scholar] [CrossRef]
  44. Boithias, L.; Acuña, V.; Vergoñós, L.; Ziv, G.; Marcé, R.; Sabater, S. Assessment of the Water Supply:Demand Ratios in a Mediterranean Basin under Different Global Change Scenarios and Mitigation Alternatives. Sci. Total Environ. 2014, 470–471, 567–577. [Google Scholar] [CrossRef] [PubMed]
  45. Zhang, C.; Li, W.; Zhang, B.; Liu, M. Water Yield of Xitiaoxi River Basin Based on InVEST Modeling. J. Resour. Ecol. 2012, 3, 50–54. [Google Scholar] [CrossRef]
  46. Gao, Y.; Song, Y.; Yang, L.; Hu, Y.; Hao, J.; Tian, J.; Li, Z. Revealing Spatiotemporal Heterogeneity of Water Conservation and Its Drivers: Enlightenment to Water Ecology Protection and Restoration. J. Environ. Manag. 2024, 370, 122517. [Google Scholar] [CrossRef]
  47. Xie, X.; Peng, M.; Zhang, L.; Chen, M.; Li, J.; Tuo, Y. Assessing the Impacts of Climate and Land Use Change on Water Conservation in the Three-River Headstreams Region of China Based on the Integration of the InVEST Model and Machine Learning. Land. 2024, 13, 352. [Google Scholar] [CrossRef]
  48. Yang, D.; Liu, W.; Xu, C.; Tao, L.; Xu, X. Integrating the InVEST and SDSM Model for Estimating Water Provision Services in Response to Future Climate Change in Monsoon Basins of South China. Water 2020, 12, 3199. [Google Scholar] [CrossRef]
  49. Wei, J.; Hu, A.; Gan, X.; Zhao, X.; Huang, Y. Spatial and Temporal Characteristics of Ecosystem Service Trade-Off and Synergy Relationships in the Western Sichuan Plateau, China. Forests 2022, 13, 1845. [Google Scholar] [CrossRef]
  50. Fu, B. On the Calculation of the Evaporation from Land Surface. Sci. Atmos. Sin. 1981, 5, 23. [Google Scholar] [CrossRef]
  51. Zhang, L.; Hickel, K.; Dawes, W.; Chiew, F.H.; Western, A.; Briggs, P. A Rational Function Approach for Estimating Mean Annual Evapotranspiration. Water Resour. Res. 2004, 40, W02502. [Google Scholar] [CrossRef]
  52. Donohue, R.J.; Roderick, M.L.; McVicar, T.R. Roots, Storms and Soil Pores: Incorporating Key Ecohydrological Processes into Budyko’s Hydrological Model. J. Hydrol. 2012, 436, 35–50. [Google Scholar] [CrossRef]
  53. Chen, X.; Yu, L.; Hou, S.; Liu, T.; Li, X.; Li, Y.; Du, Z.; Li, C.; Wu, H.; Gao, G.; et al. Unraveling Carbon Stock Dynamics and Their Determinants in China’s Loess Plateau over the Past 40 Years. Ecol. Indic. 2024, 159, 111760. [Google Scholar] [CrossRef]
  54. Singh, P.P.; Sabnani, C.S.; Kapse, V.S. Hotspot Analysis of Structure Fires in Urban Agglomeration: A Case of Nagpur City, India. Fire 2021, 4, 38. [Google Scholar] [CrossRef]
  55. Xu, H.; Croot, P.; Zhang, C. Discovering Hidden Spatial Patterns and Their Associations with Controlling Factors for Potentially Toxic Elements in Topsoil Using Hot Spot Analysis and K-Means Clustering Analysis. Environ. Int. 2021, 151, 106456. [Google Scholar] [CrossRef] [PubMed]
  56. Chen, L.; Qi, Q.; Wu, H.; Feng, D.; Zhu, E. Will the Landscape Composition and Socio-Economic Development of Coastal Cities Have an Impact on the Marine Cooling Effect? Sustain. Cities Soc. 2023, 89, 104328. [Google Scholar] [CrossRef]
  57. Murakami, D.; Tsutsumida, N.; Yoshida, T.; Nakaya, T.; Lu, B. Scalable GWR: A Linear-Time Algorithm for Large-Scale Geographically Weighted Regression with Polynomial Kernels. Ann. Am. Assoc. Geogr. 2020, 111, 459–480. [Google Scholar] [CrossRef]
  58. Shi, T.; Zhang, X.; Du, H.; Shi, H. Urban Water Resource Utilization Efficiency in China. Chin. Geogr. Sci. 2015, 25, 684–697. [Google Scholar] [CrossRef]
  59. Jianhua, L.; Liangchao, H.; Qiting, Z. Evaluation of Harmonious Development of Economy-Population-Resource-Environment in the Lower Reaches of the Yellow River. Resour. Sci. 2021, 43, 412–422. [Google Scholar] [CrossRef]
  60. Rohatyn, S.; Rotenberg, E.; Ramati, E.; Tatarinov, F.; Tas, E.; Yakir, D. Differential Impacts of Land Use and Precipitation on “Ecosystem Water Yield”. Water Resour. Res. 2018, 54, 5457–5470. [Google Scholar] [CrossRef]
  61. Wang, F.; Mu, X.; Li, R.; Fleskens, L.; Stringer, L.C.; Ritsema, C.J. Co-Evolution of Soil and Water Conservation Policy and Human–Environment Linkages in the Yellow River Basin since 1949. Sci. Total Environ. 2015, 508, 166–177. [Google Scholar] [CrossRef]
  62. Shi, Q.; Gu, C.-J.; Xiao, C. Multiple Scenarios Analysis on Land Use Simulation by Coupling Socioeconomic and Ecological Sustainability in Shanghai, China. Sustain. Cities Soc. 2023, 95, 104578. [Google Scholar] [CrossRef]
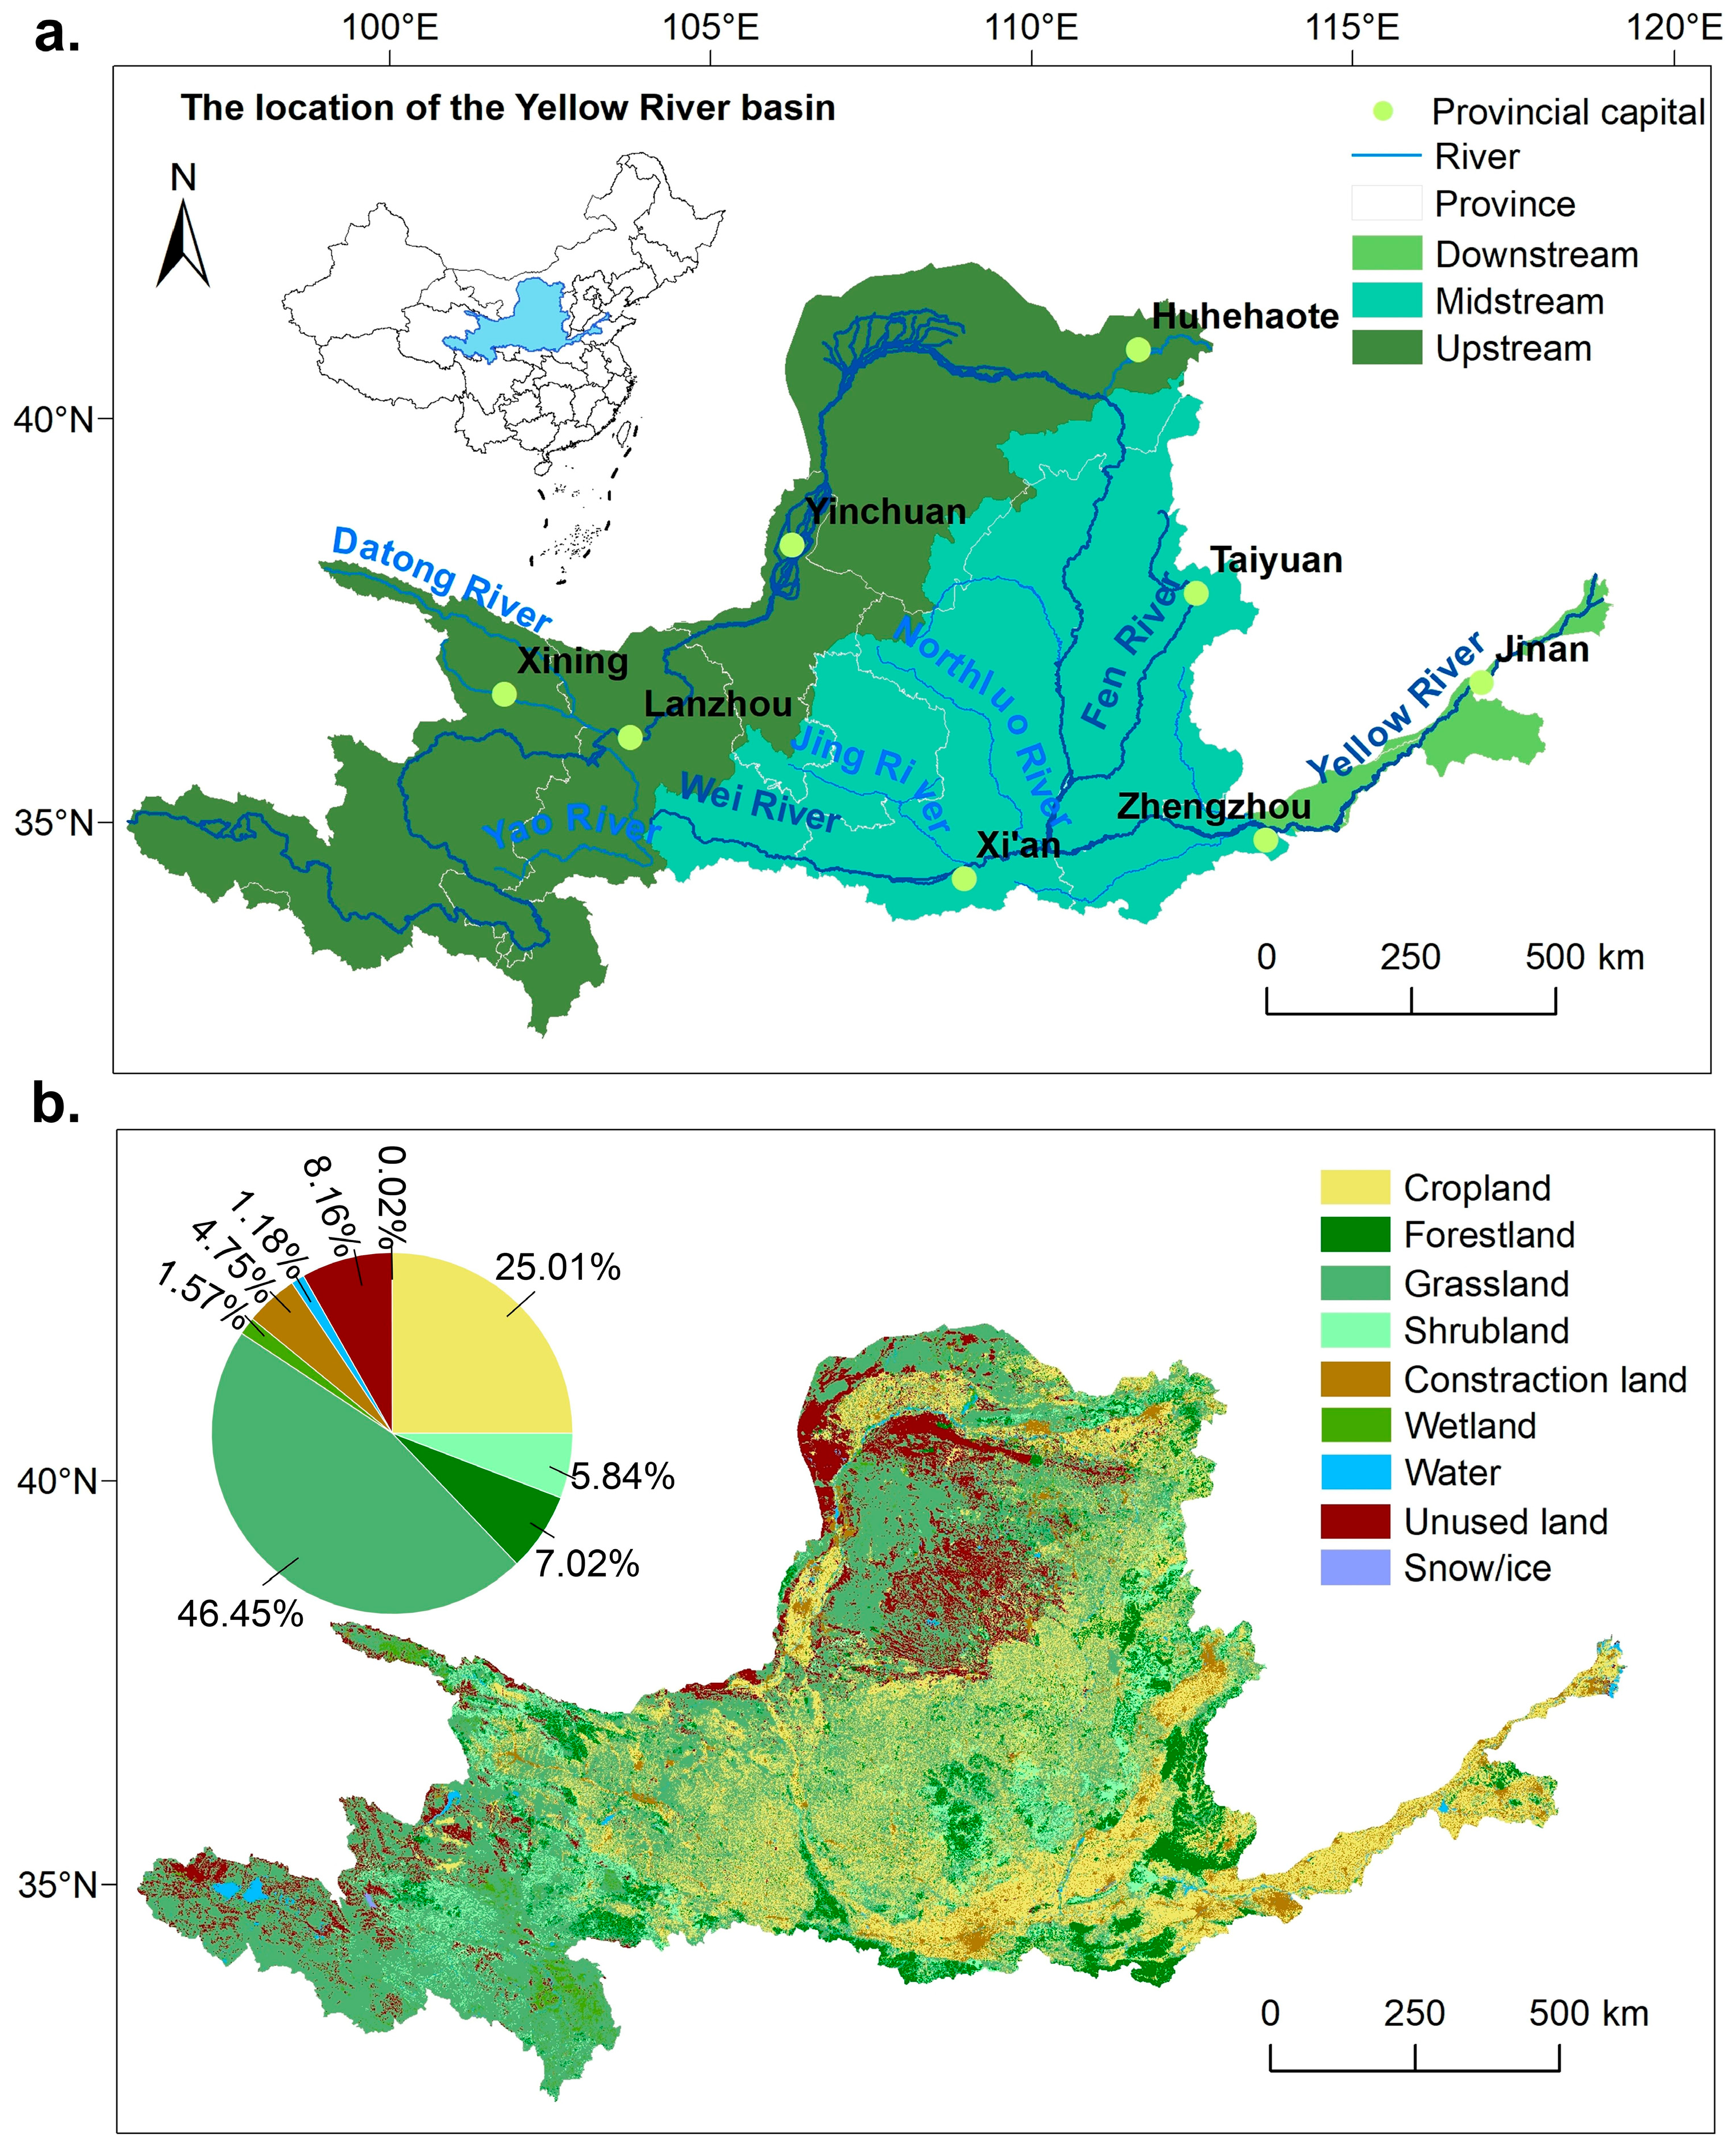
Figure 1. The study area. (a) Location of the YRB. (b) Land cover types’ proportion and distribution.
Land 14 01579 g001
Figure 2. Research methodology framework.
Land 14 01579 g002
Figure 3. YRB’s LUCC during the period 1980–2019. The chord diagrams (ac) represents LUCC in the YRB for the periods 1980–1999, 2000–2019, and 1980–2019, respectively. (d) The bar chart compares the areas of different LULCs in 1980, 2000, and 2019. The changes in different LULCs’ area during the three study periods (1980–1999, 2000–2019, and 1980–2019) are distinguished by yellow, blue, and pink annotations.
Land 14 01579 g003
Figure 4. Time series of water-yield changes for different land types.
Land 14 01579 g004
Figure 5. The pixel-scale total water-yield storage-density trends for the YRB over three periods. (a) The total water-yield trends density map of pixel-scale. (b) Bar chart showing the percentage of pixels with increasing and decreasing water-yield trends in 1980–2019 and its two sub-periods.
Land 14 01579 g005
Figure 6. Hotspot map of changing trends in the water yield across the YRB. The left panels (a,c,e) show the hotspot maps of increasing water-yield trends for 1980–2019, 1980–1999, and 2000–2019 in the YRB, respectively; the right panels (b,d,f) show the hotspot maps of decreasing water-yield trends for 1980–2019, 1980–1999, and 2000–2019 in the YRB, respectively.
Land 14 01579 g006
Figure 7. Spatial distribution maps of GWR coefficients.
Land 14 01579 g007
Table 1. Results of the OLS model regarding relative importance. *, **, and *** indicate statistical significance at the 0.05, 0.01, and 0.001 levels, respectively.
VariableCoefficientt Valuep ValueRelative
Importance
GDP2.11 × 10−217.42<2 × 10¹⁶ ***5.174 × 10⁻²
Disur−4.83 × 10⁻³−1.620.119.441 × 10−3
Roden1.81 × 10−40.640.523.408 × 10−3
Evap3.44 × 10−50.140.898.298 × 10−3
Evaptrend−4.57 × 10⁻¹−27.63<2 × 10⁻¹⁶ ***1.144 × 10⁻¹
FVC4.08 × 10−13.378.12 × 10−4 ***6.695 × 10⁻³
Pre5.43 × 10−42.746.48 × 10−3 **2.162 × 10⁻²
Pretrend9.32 × 10−162.20<2 × 10⁻¹⁶ ***7.158 × 10⁻¹
Slope−1.61 × 10⁻²−6.541.87 × 10−10 ***4.427 × 10⁻²
Persand4.02 × 10−31.610.112.433 × 10−2
(Intercept)−3.74 × 10⁻¹−2.070.04 *
Multiple R20.92
F-statistic490.90
p-value<2.2 × 10⁻¹⁶
Disclaimer/Publisher’s Note: The statements, opinions and data contained in all publications are solely those of the individual author(s) and contributor(s) and not of MDPI and/or the editor(s). MDPI and/or the editor(s) disclaim responsibility for any injury to people or property resulting from any ideas, methods, instructions or products referred to in the content.