

Assessing Urban Park Accessibility via Population Projections: Planning for Green Equity in Shanghai


Abstract
1. Introduction
2. Materials and Methods
2.1. Study Area
2.2. Data Source
2.3. Research Methodology
2.3.1. Fuzzy C-Means Clustering (FCM)
2.3.2. Gaussian-Based Two-Step Floating Catchment Area Method (Ga2SFCA)
- Low Accessibility: Bottom 25%;
- Medium-Low Accessibility: 25–50%;
- Medium-High Accessibility: 50–75%;
- High Accessibility: Top 25%.
2.3.3. Dynamic Park Accessibility Assessment Model Based on Human Population Projection (HPP-Ga2SFCA)
- A CAGR is constructed using historical population data from 2000, 2010, and 2020 at the neighborhood committee level.
- The projected population for each unit over a 10-year horizon is estimated based on the computed growth rate.
- These forecasted population figures replace the current population values in the Ga2SFCA model, allowing for a dynamic simulation of park accessibility under future population scenarios.
3. Results
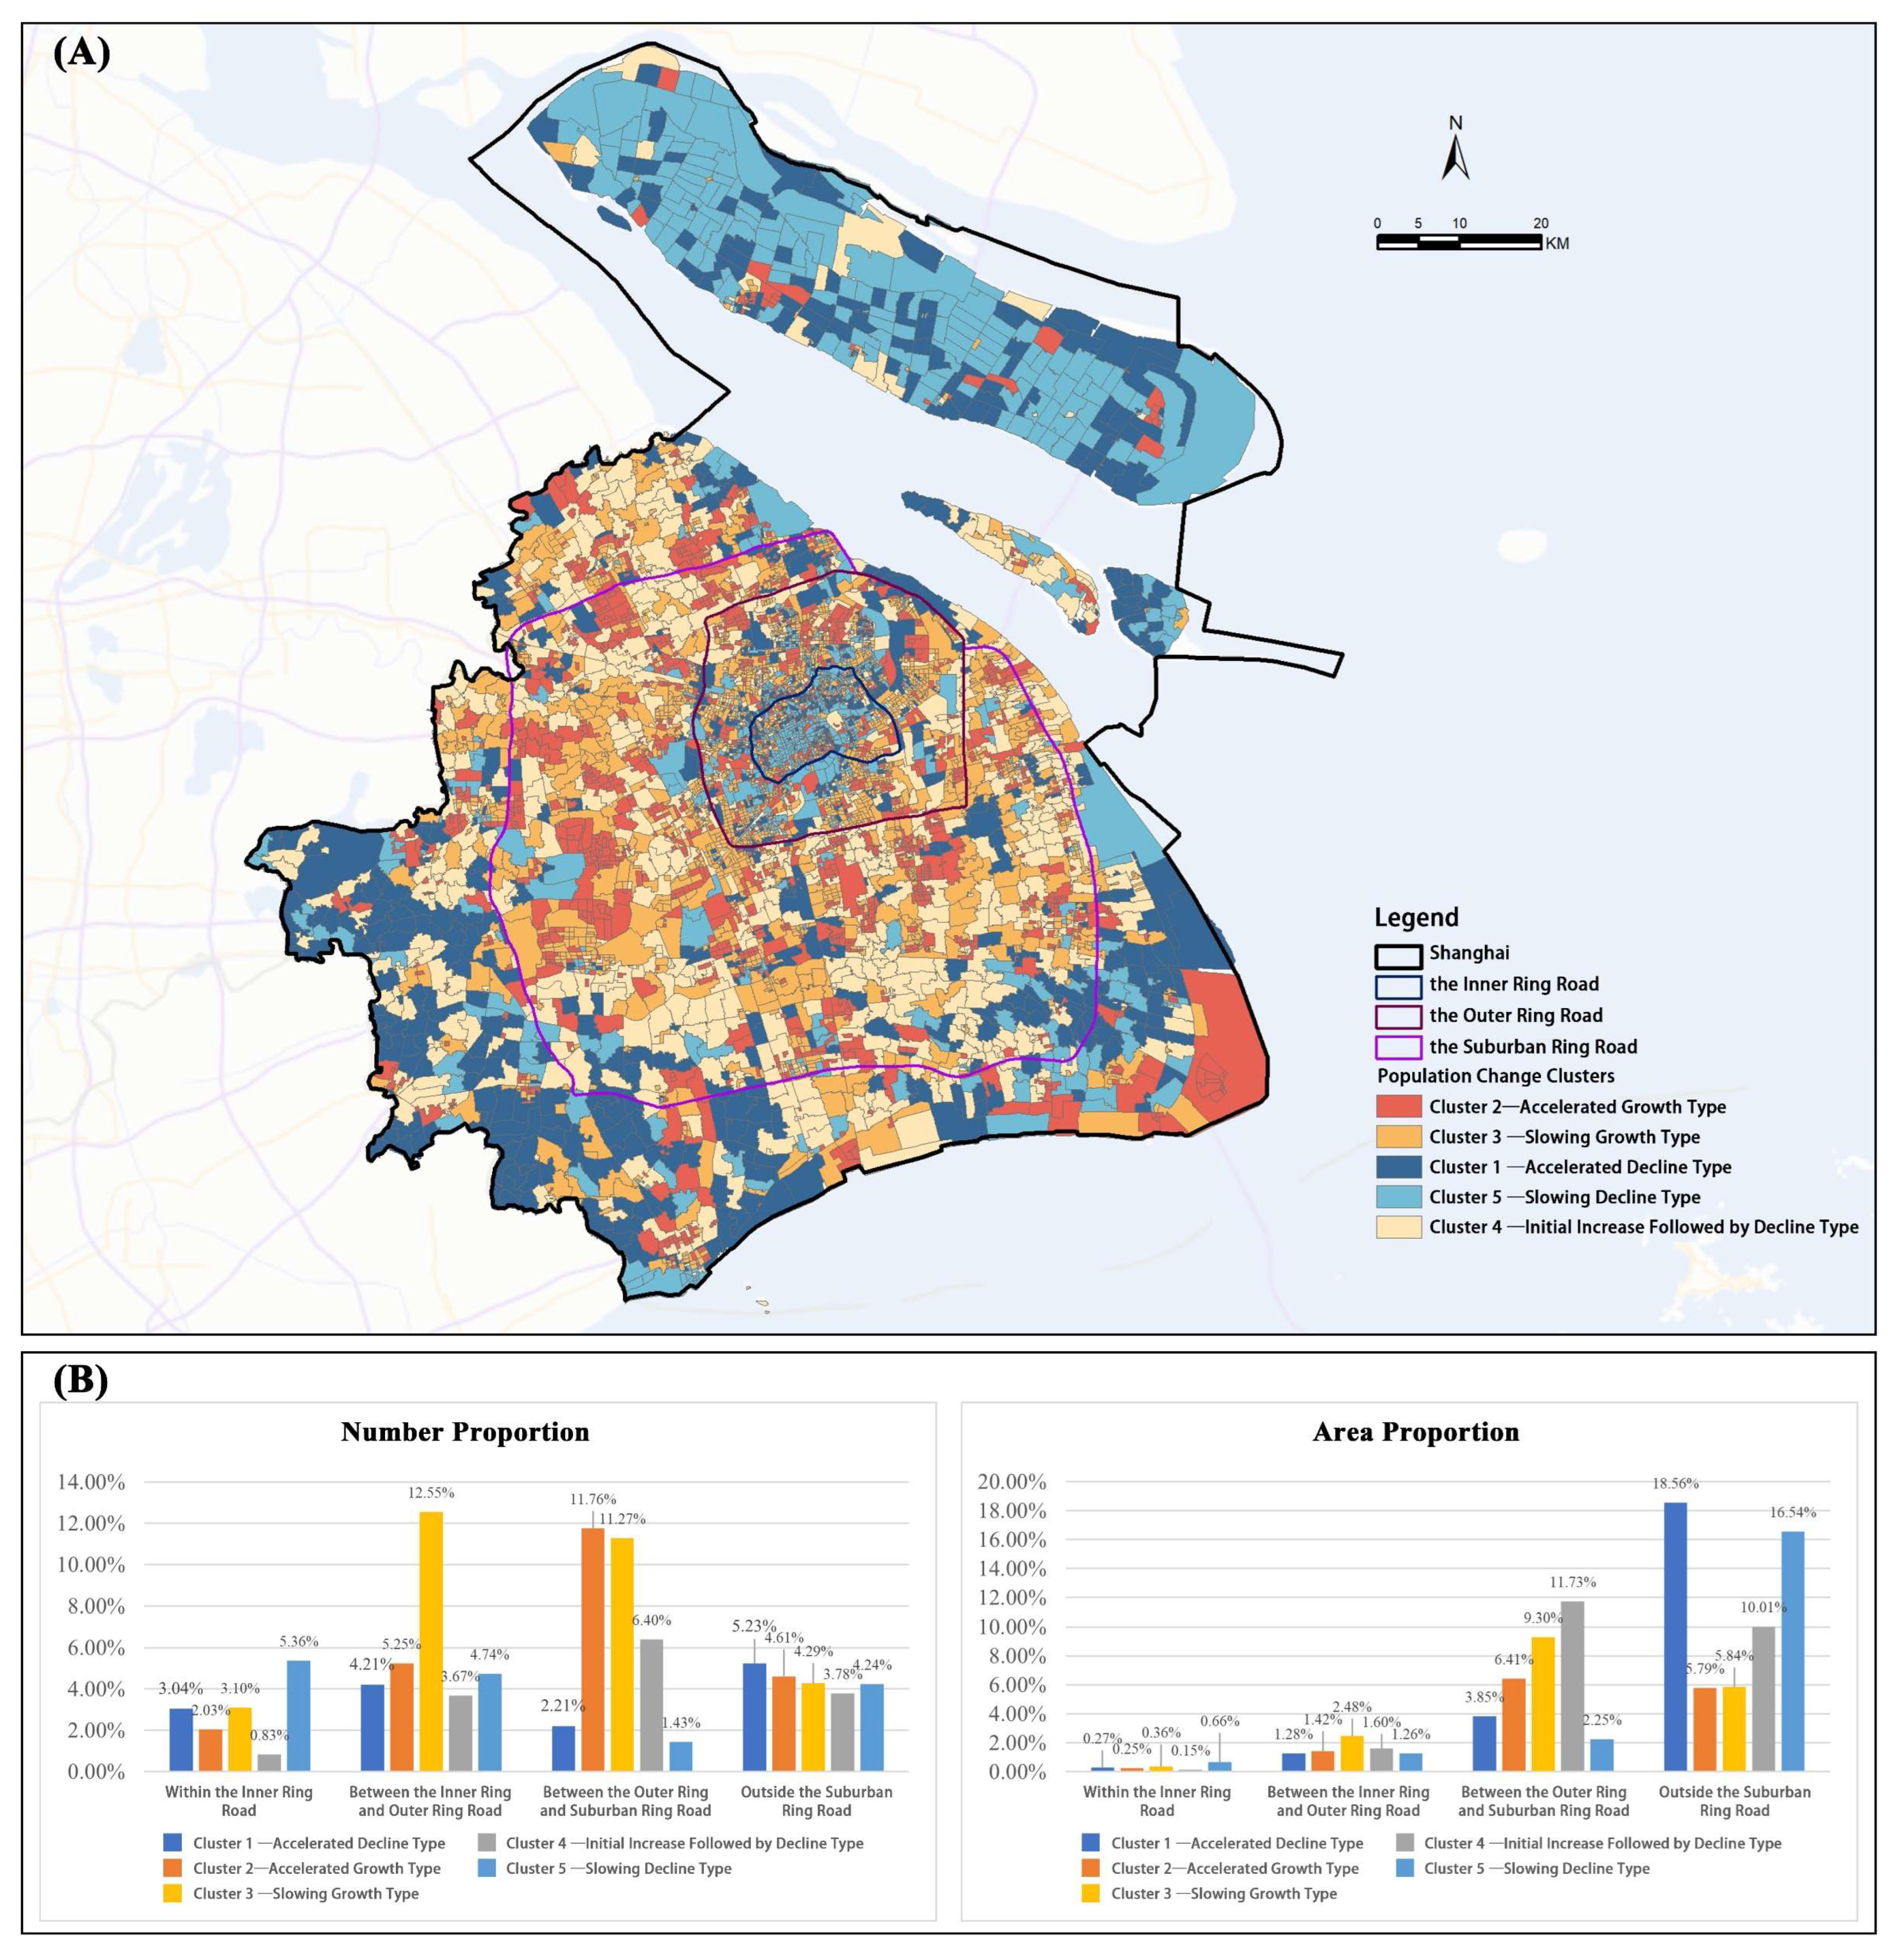
3.1. Clustering Analysis of Population Change Patterns
- Population Growth:
- (1)
- Accelerated Growth (Cluster 2): This cluster exhibits a consistent increase in the growth rate over time.
- (2)
- Slowing Growth (Cluster 3): Initially experiencing rapid growth, this cluster shows a gradual decline in growth rate over time, as indicated by its fitted slope values and temporal trajectories.
- Population Decline:
- (1)
- Accelerated Decline (Cluster 1): This cluster is characterized by an increasing rate of population decline over time.
- (2)
- Slowing Decline (Cluster 5): Although it begins with a rapid decline in population, the rate of decline slows in the second decade, as evidenced by its fitted slope values and temporal trends.
- Population Fluctuation:
- (1)
- Initial Increase Followed by Decline (Cluster 4): This pattern features an initial rise in population, followed by a subsequent decrease, as revealed by its temporal trajectory and slope values.
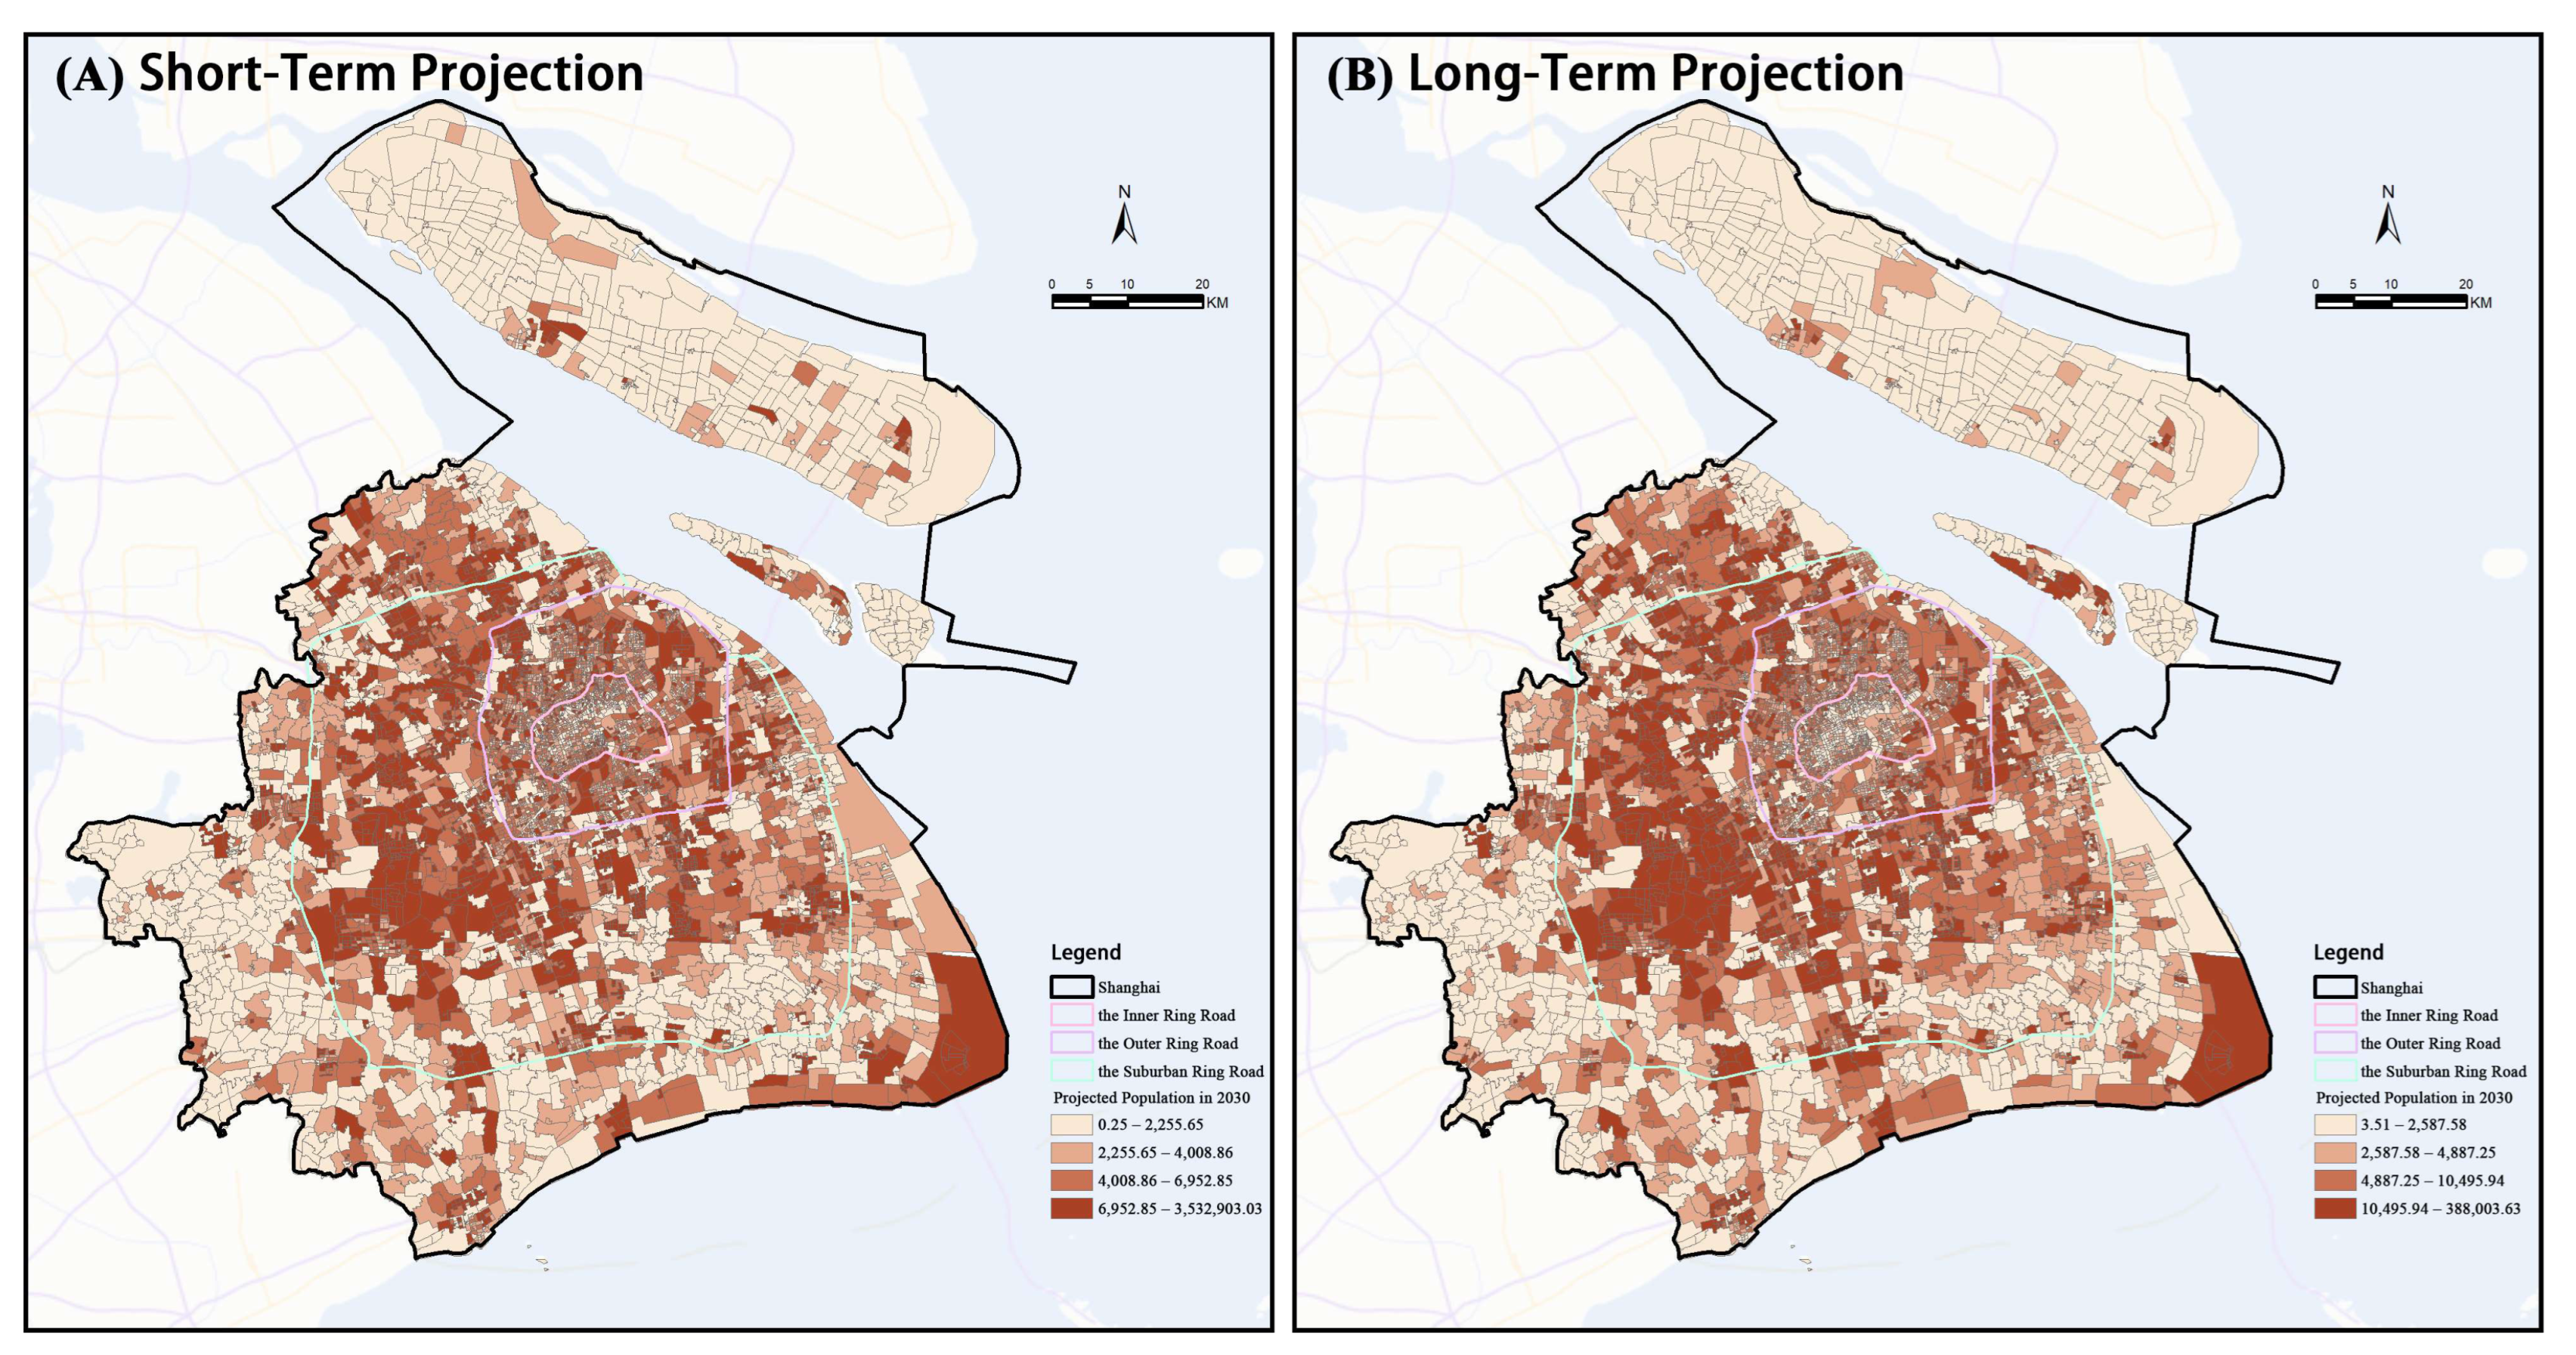
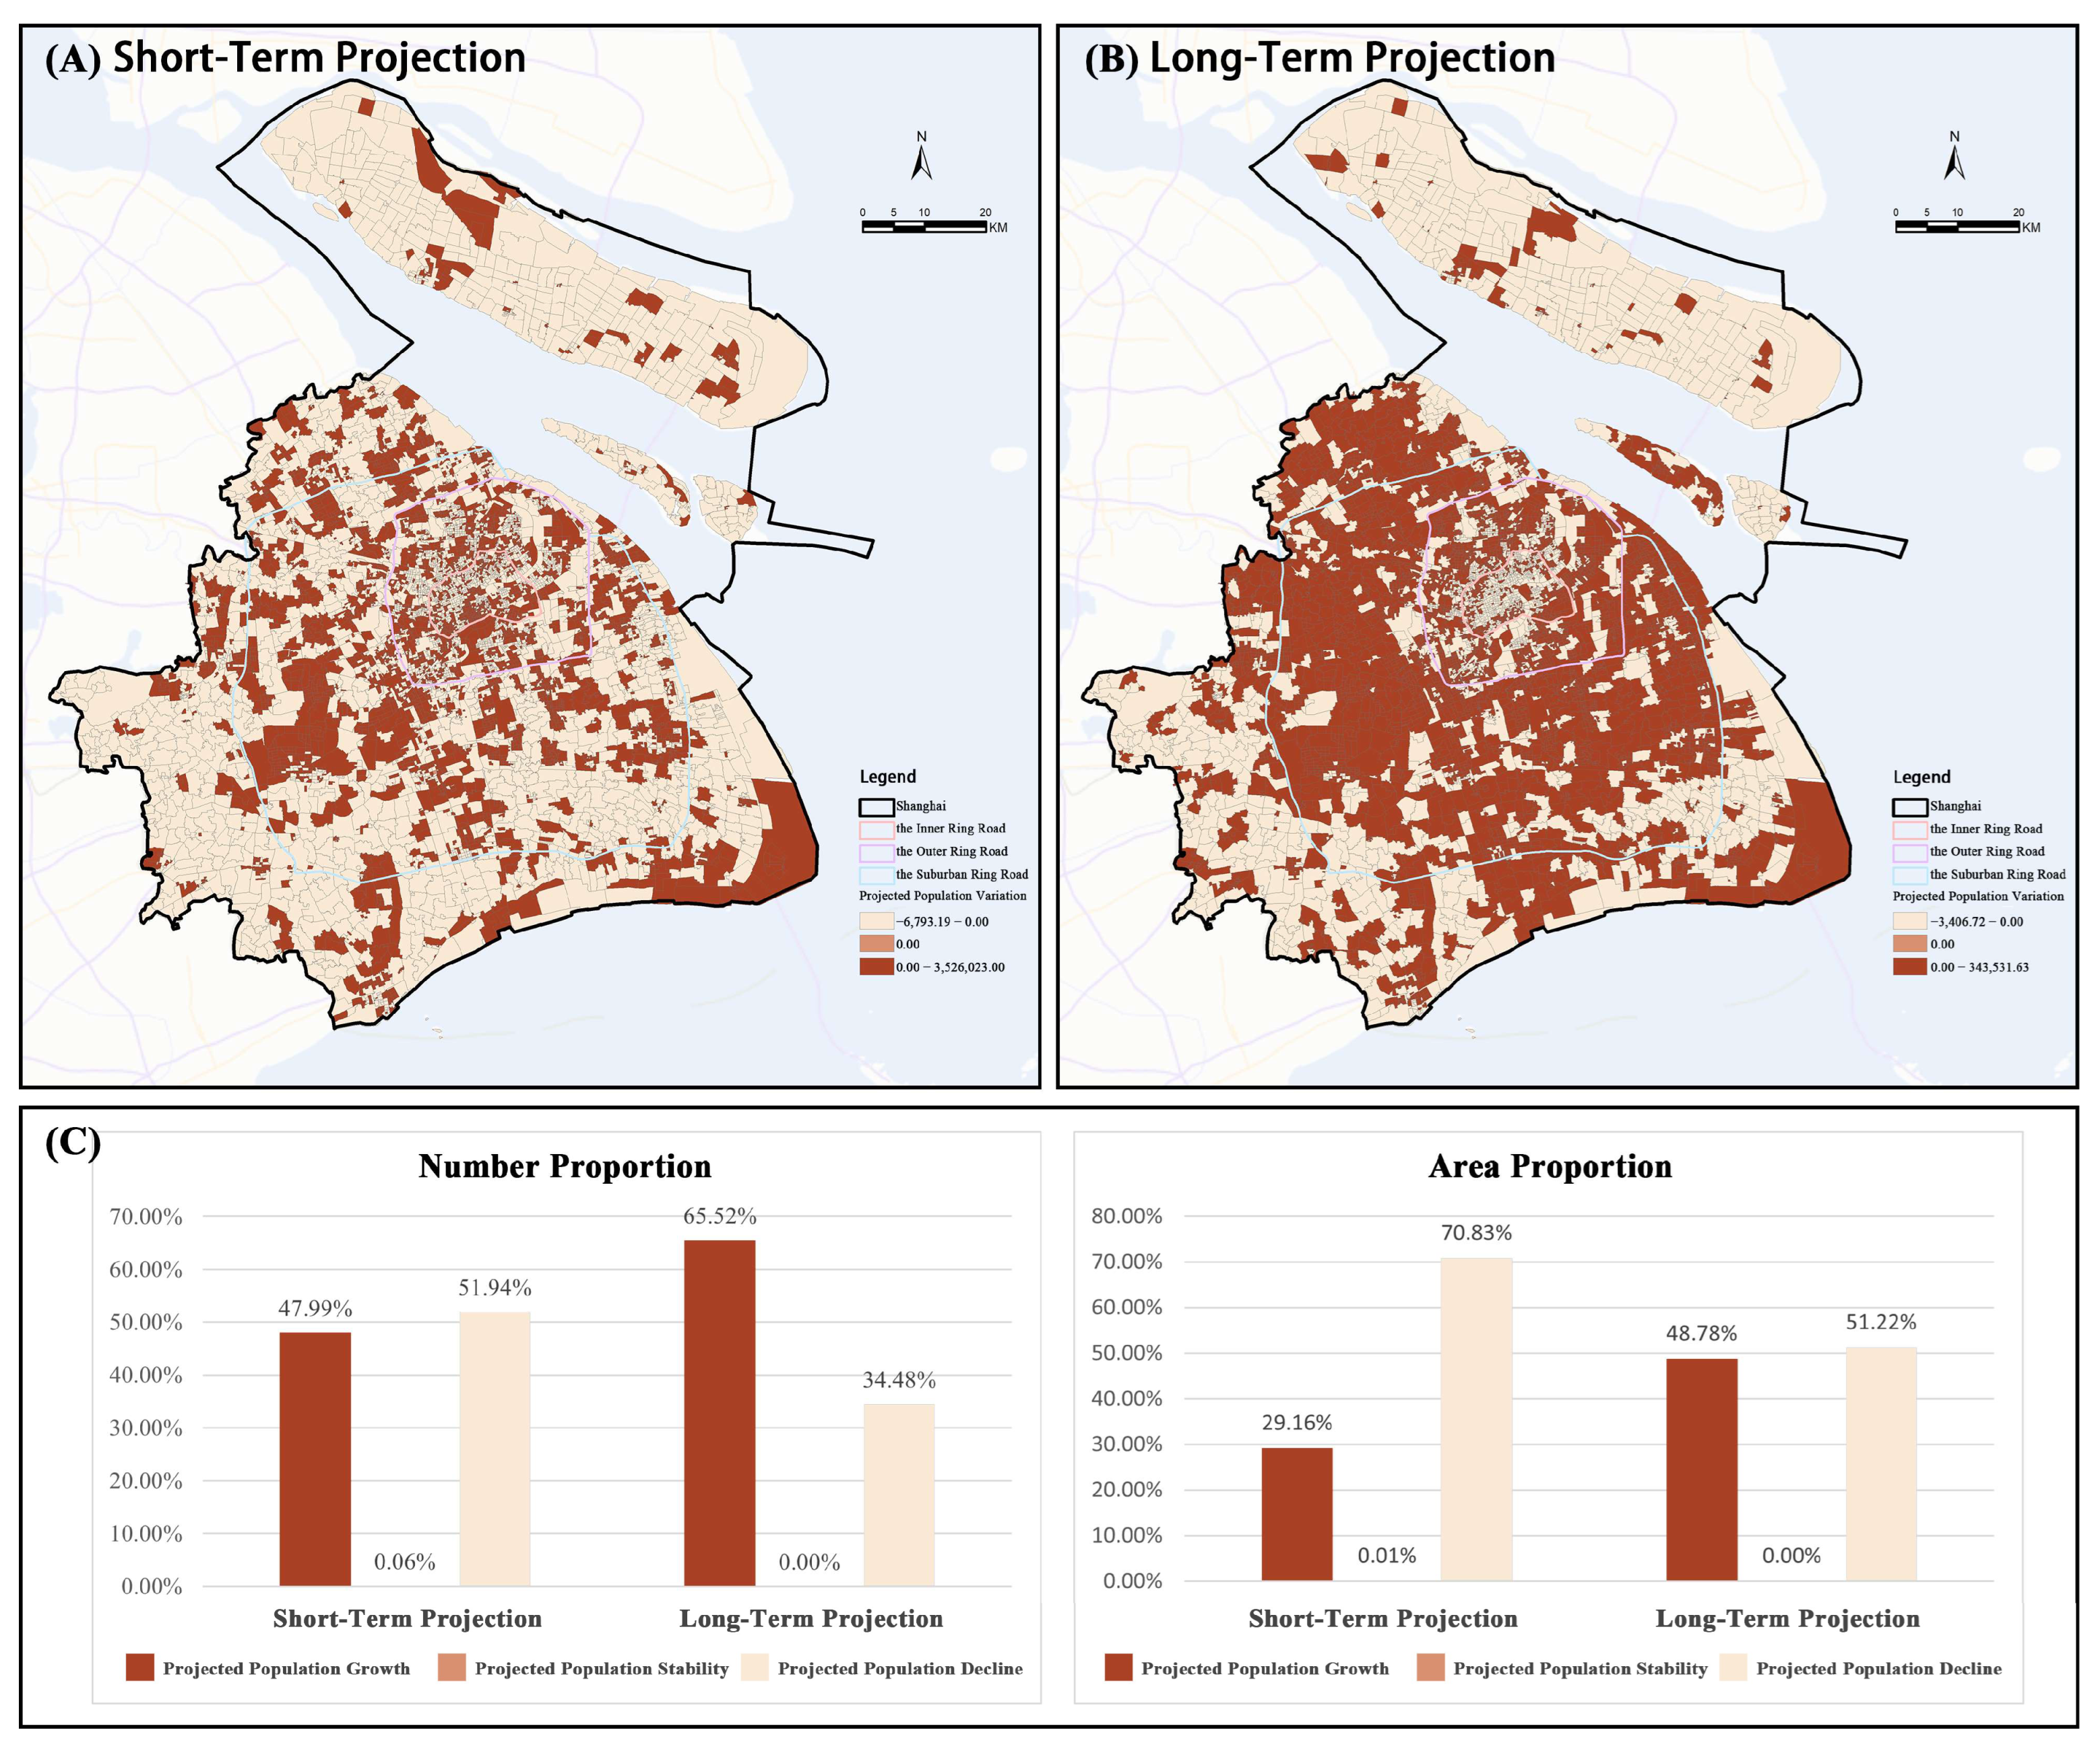
3.2. Spatial Patterns of Projected Population Growth
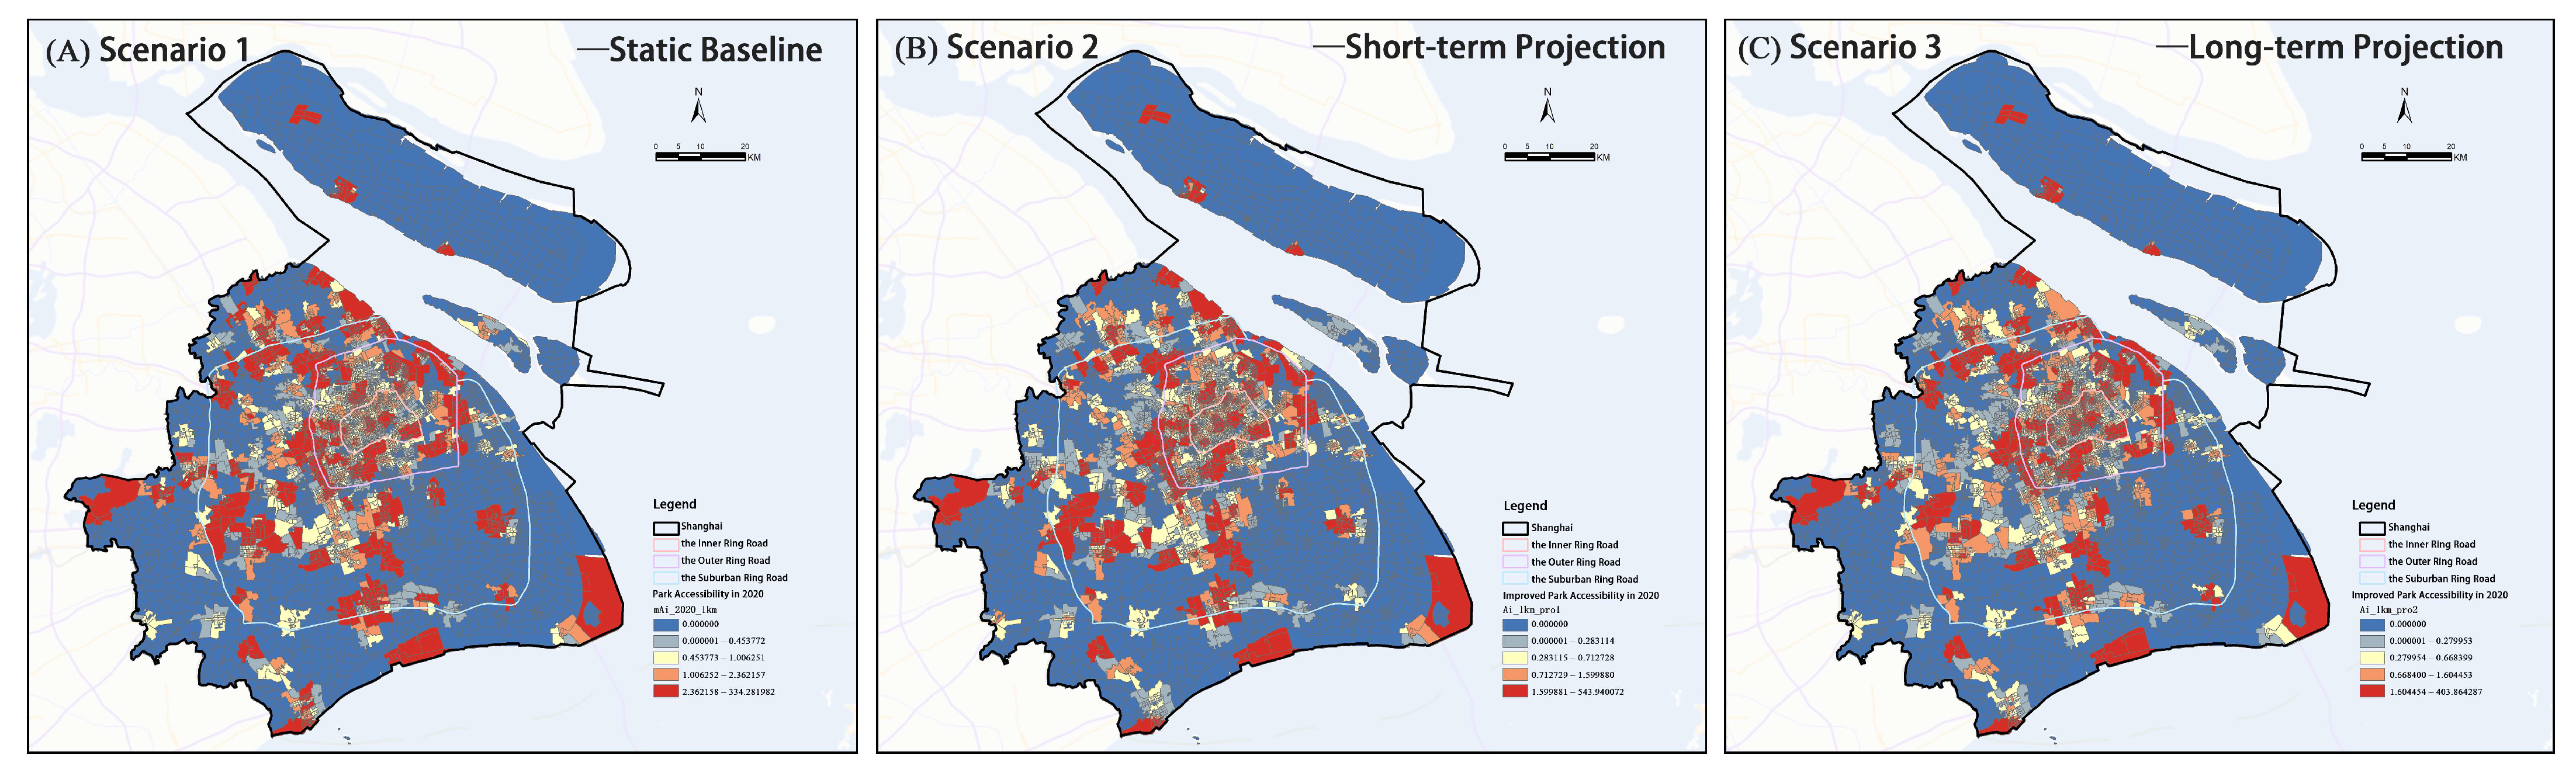
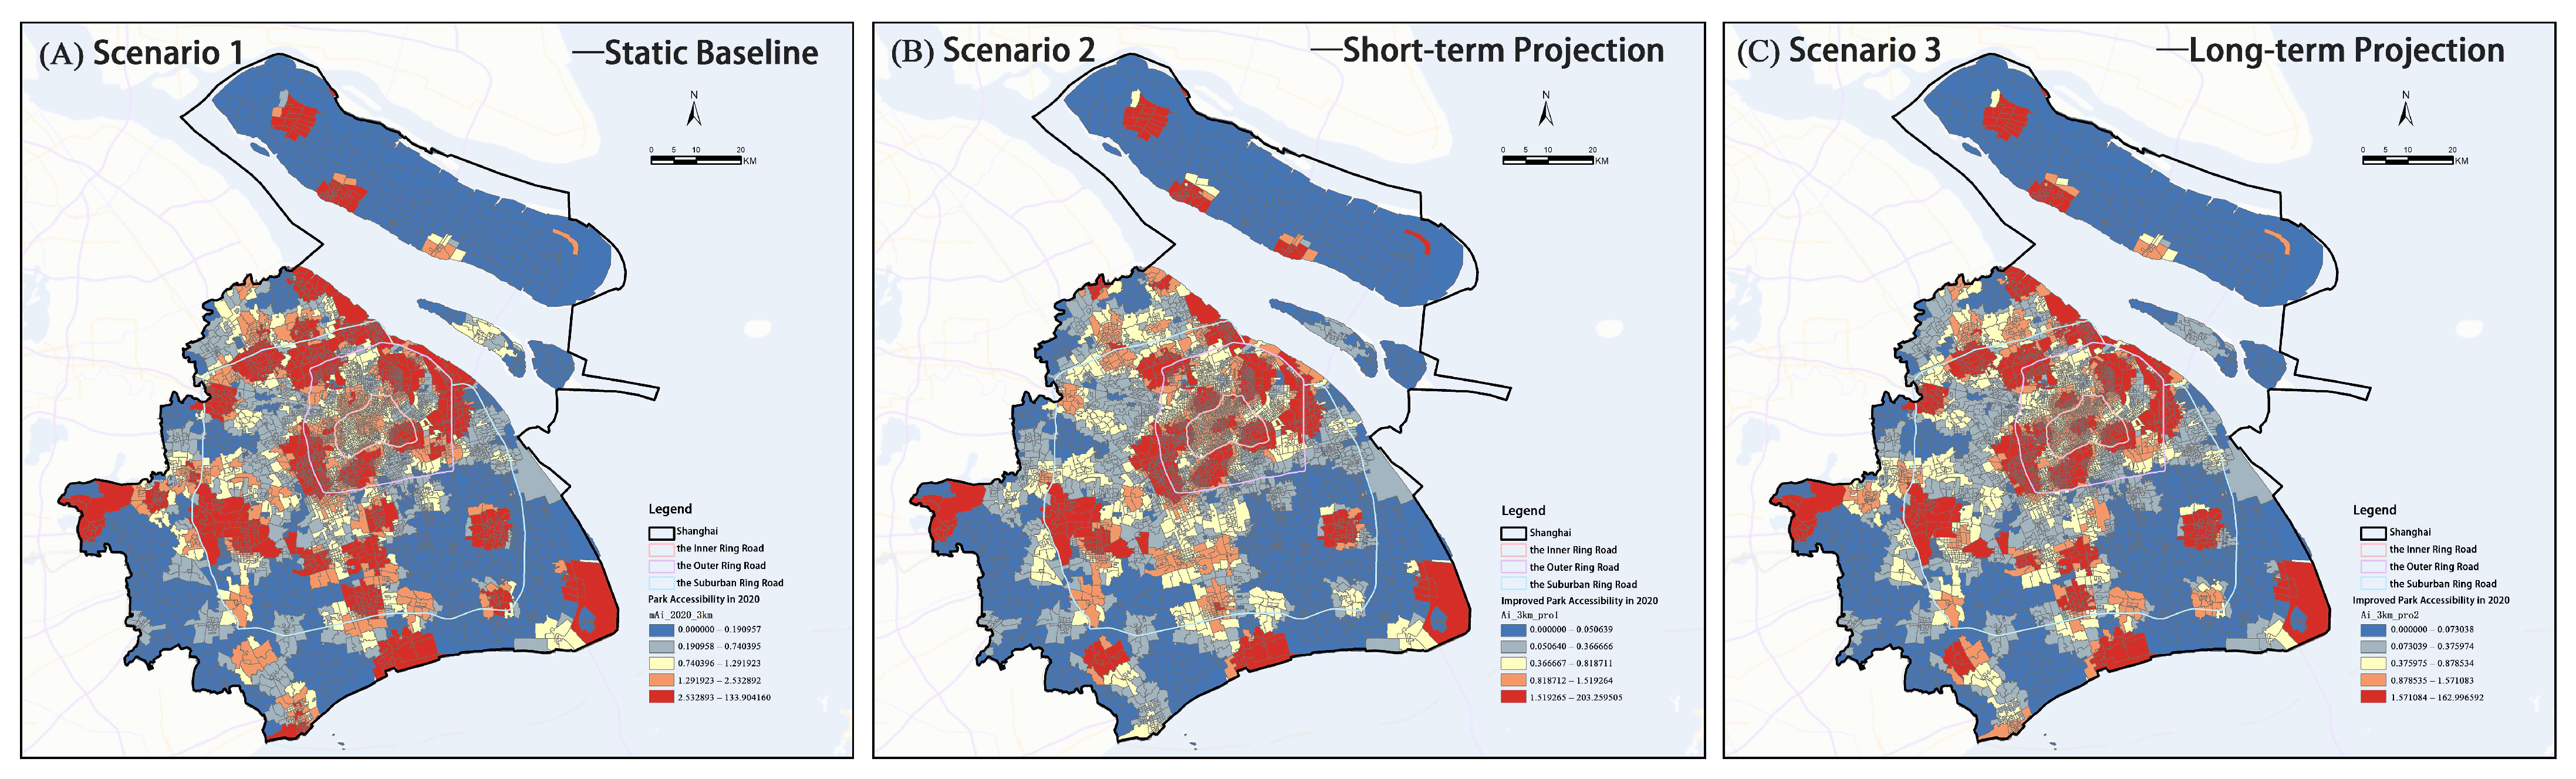
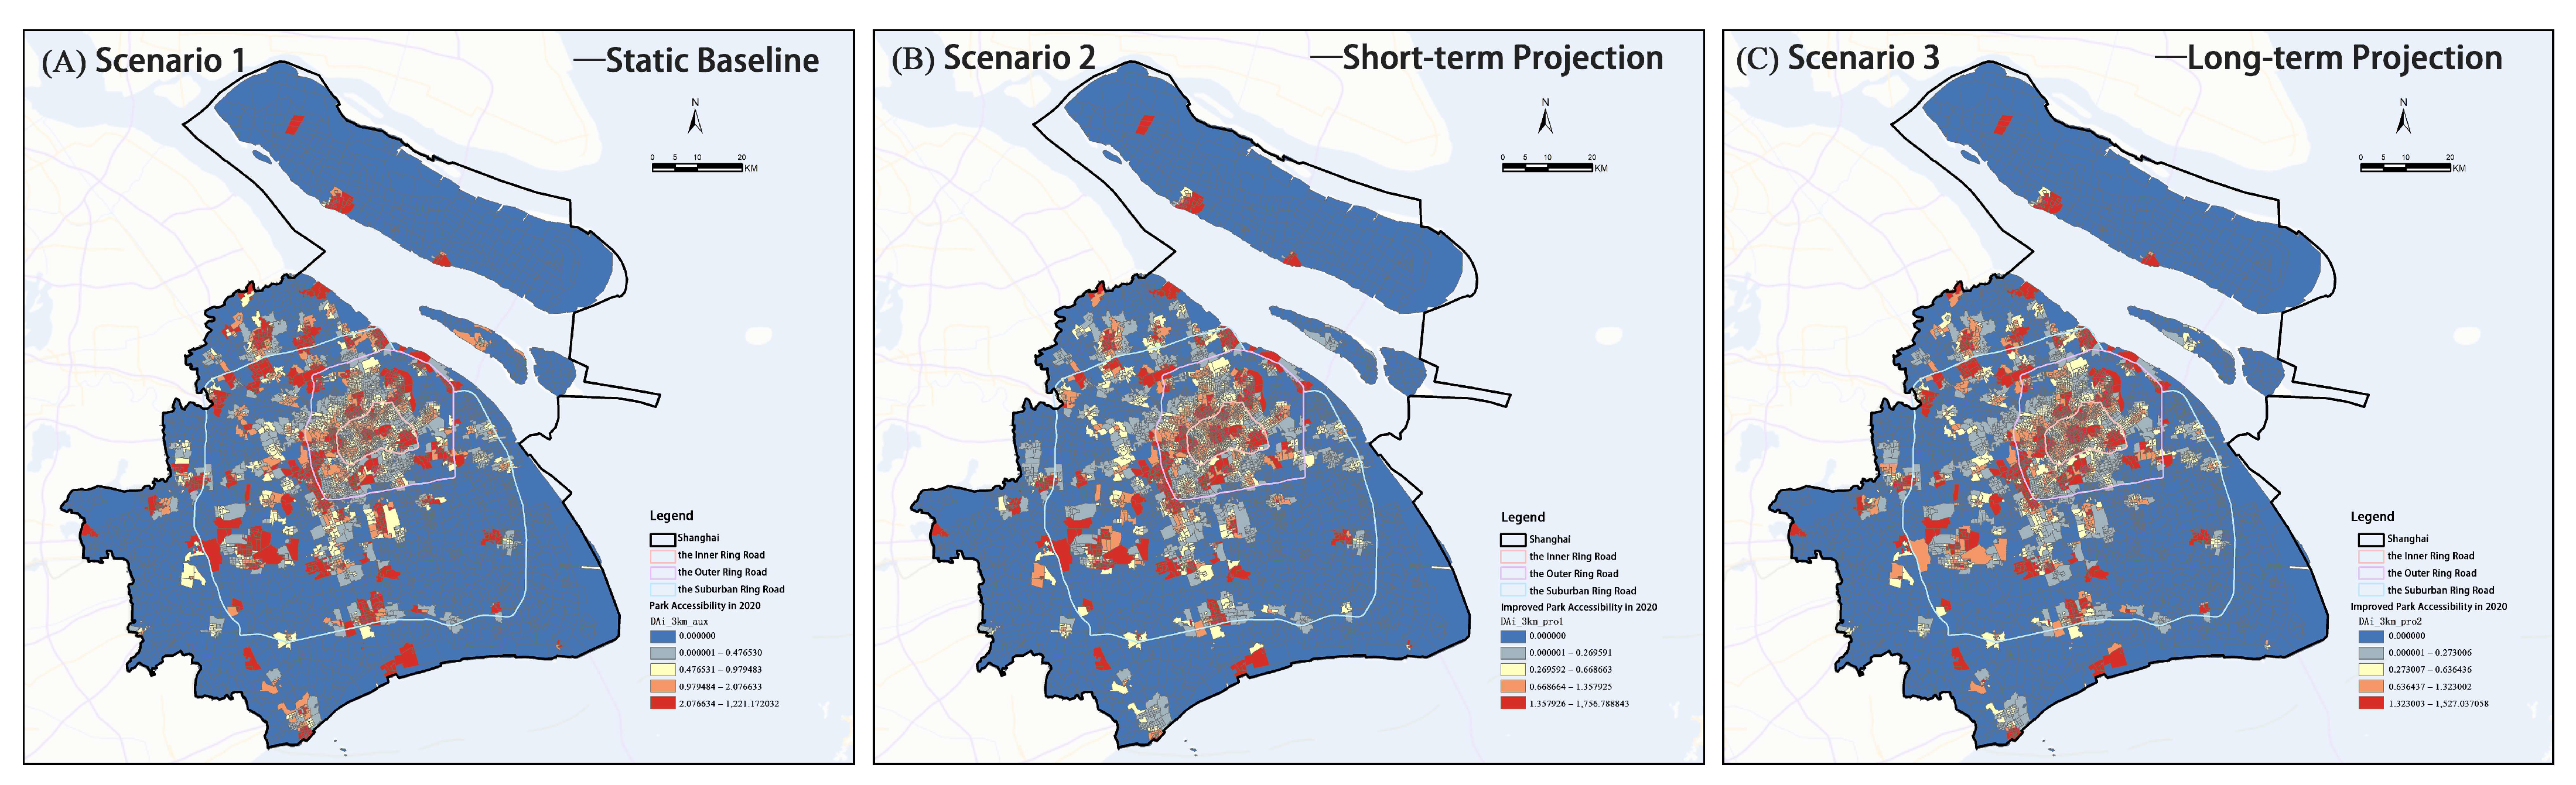
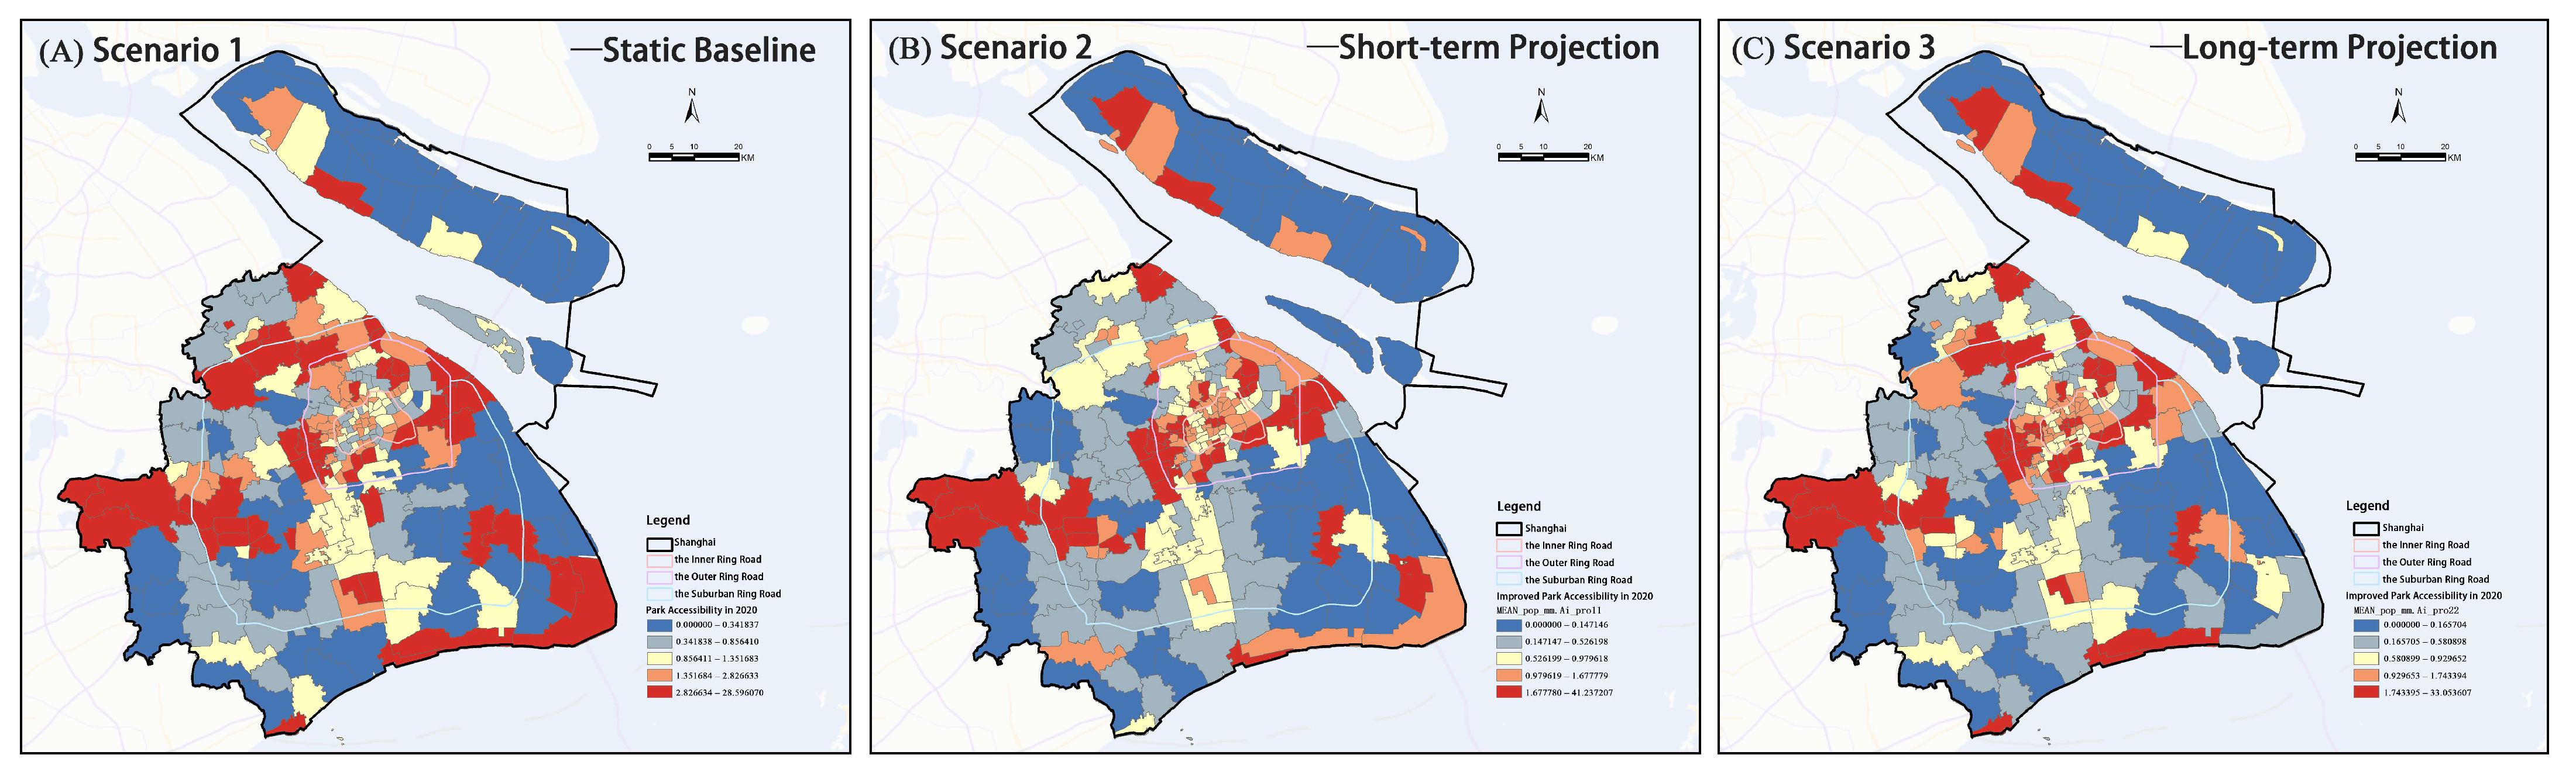
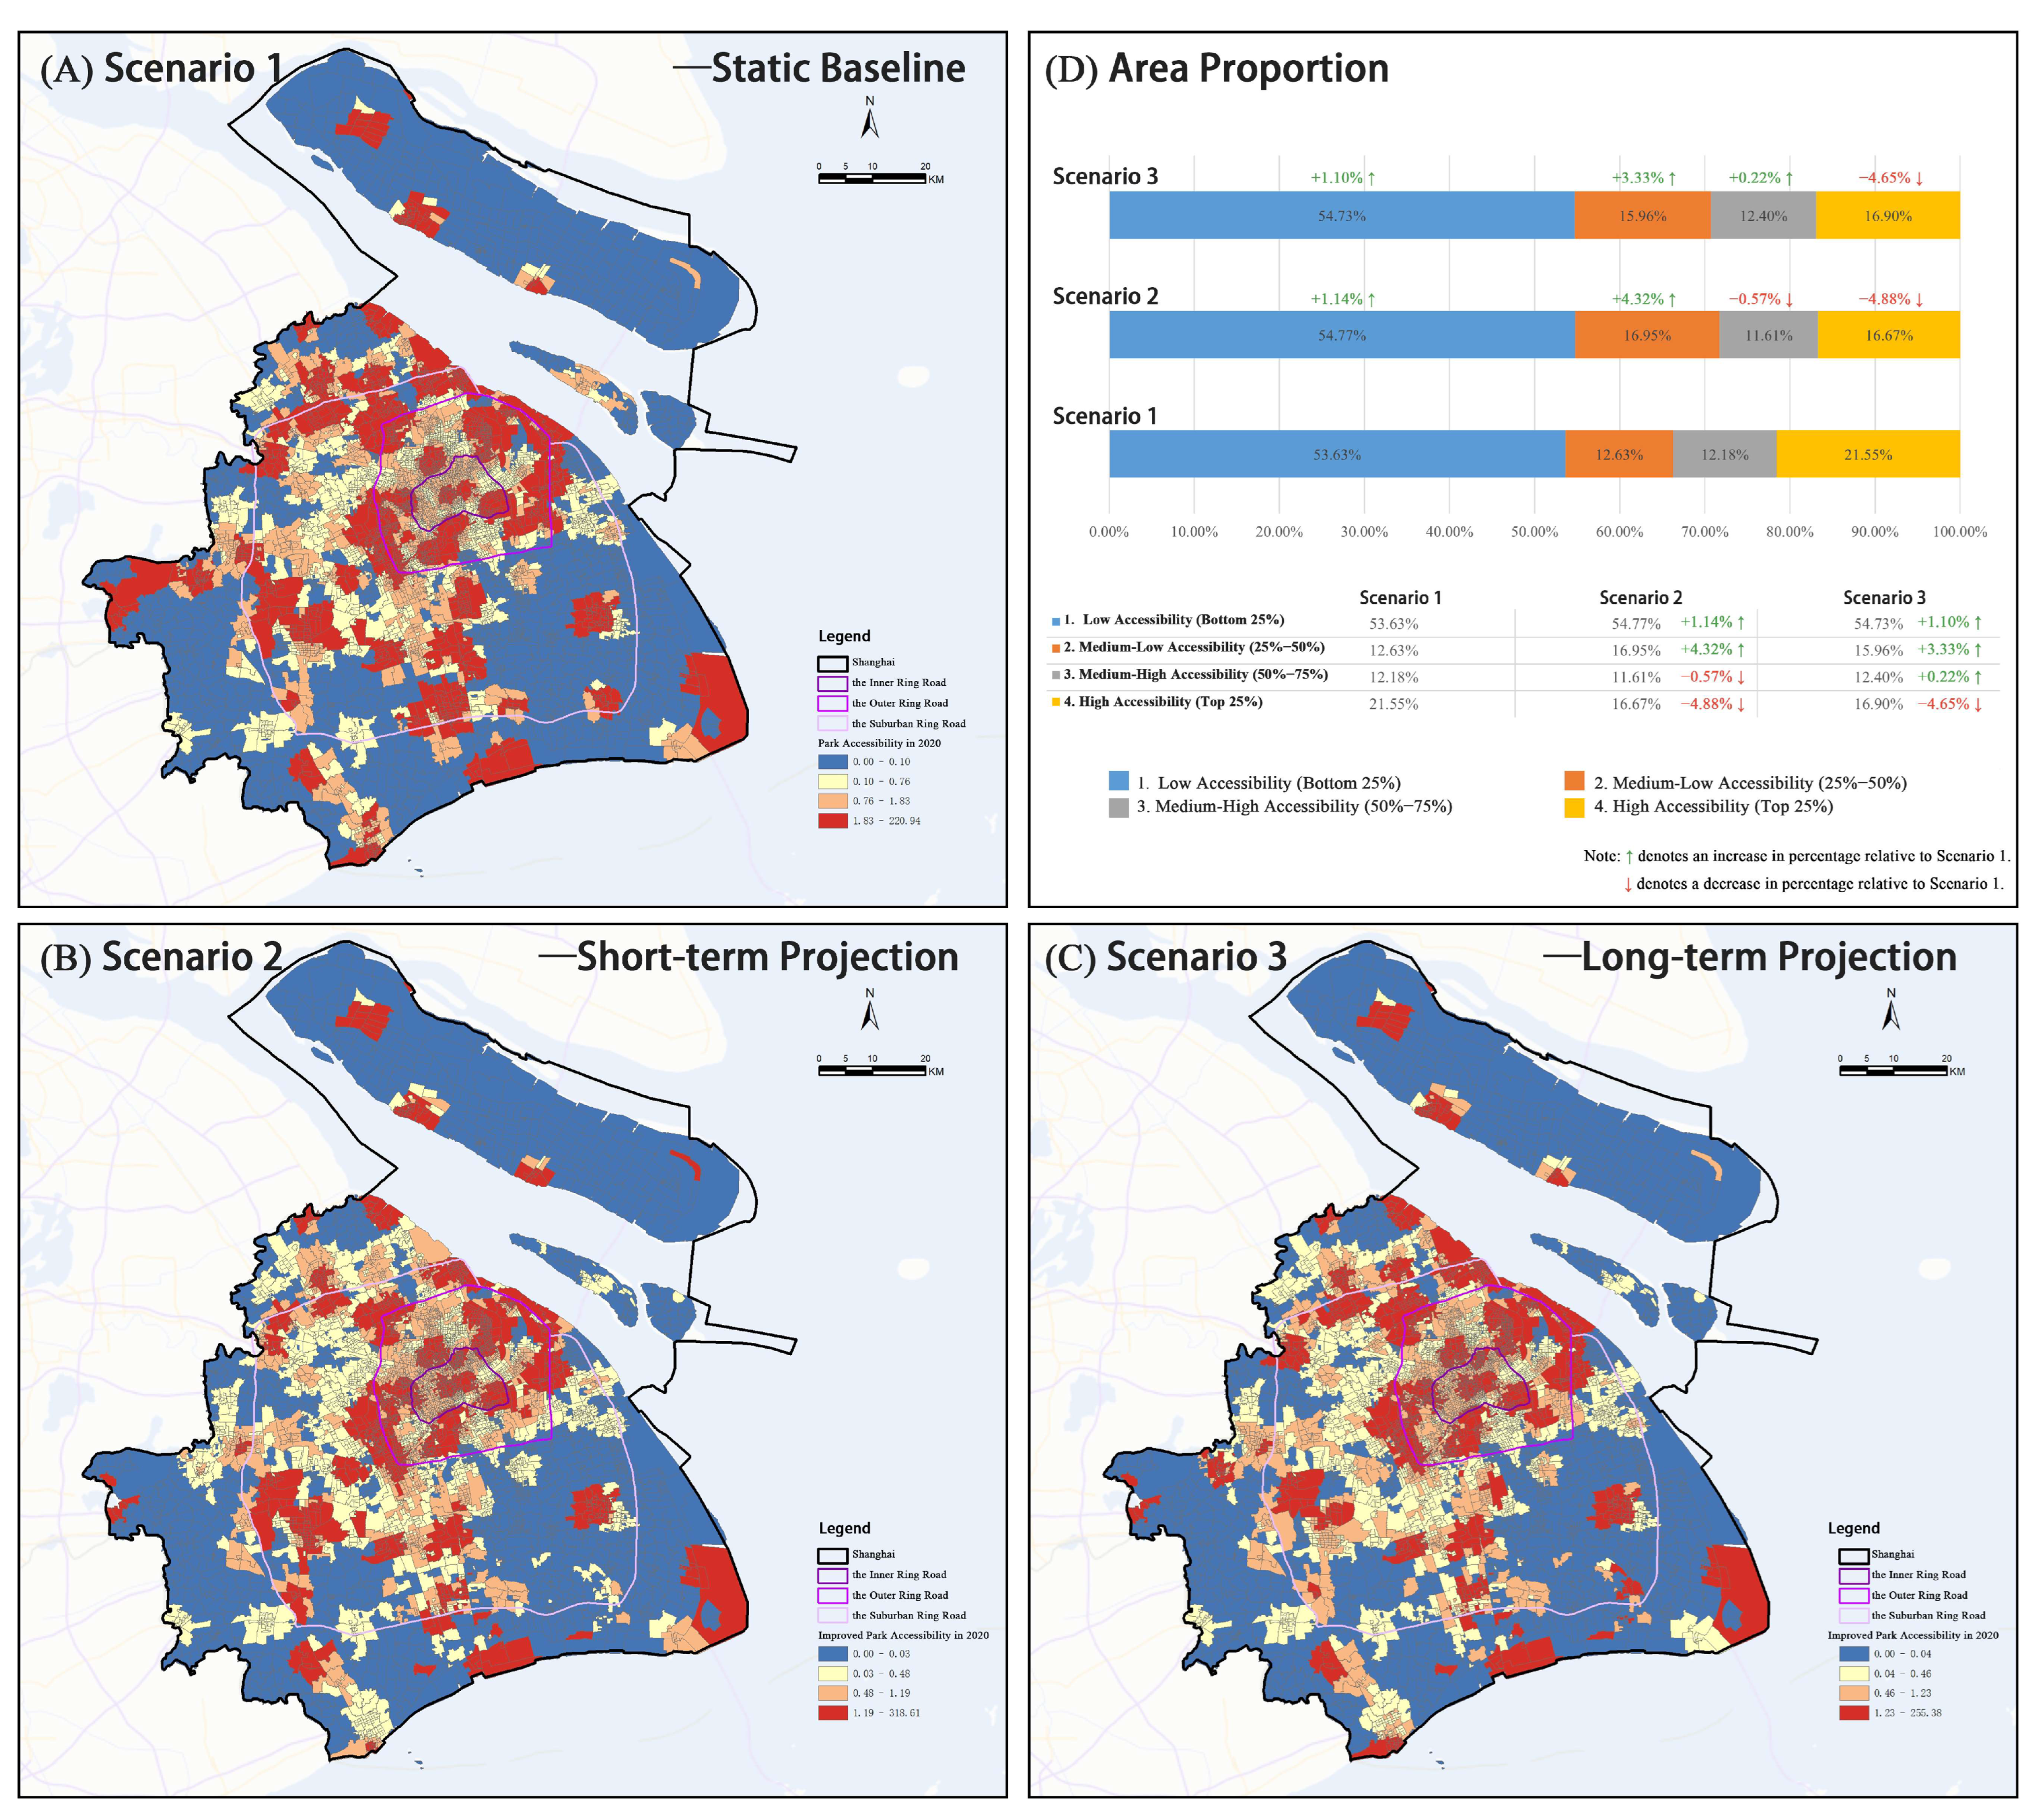
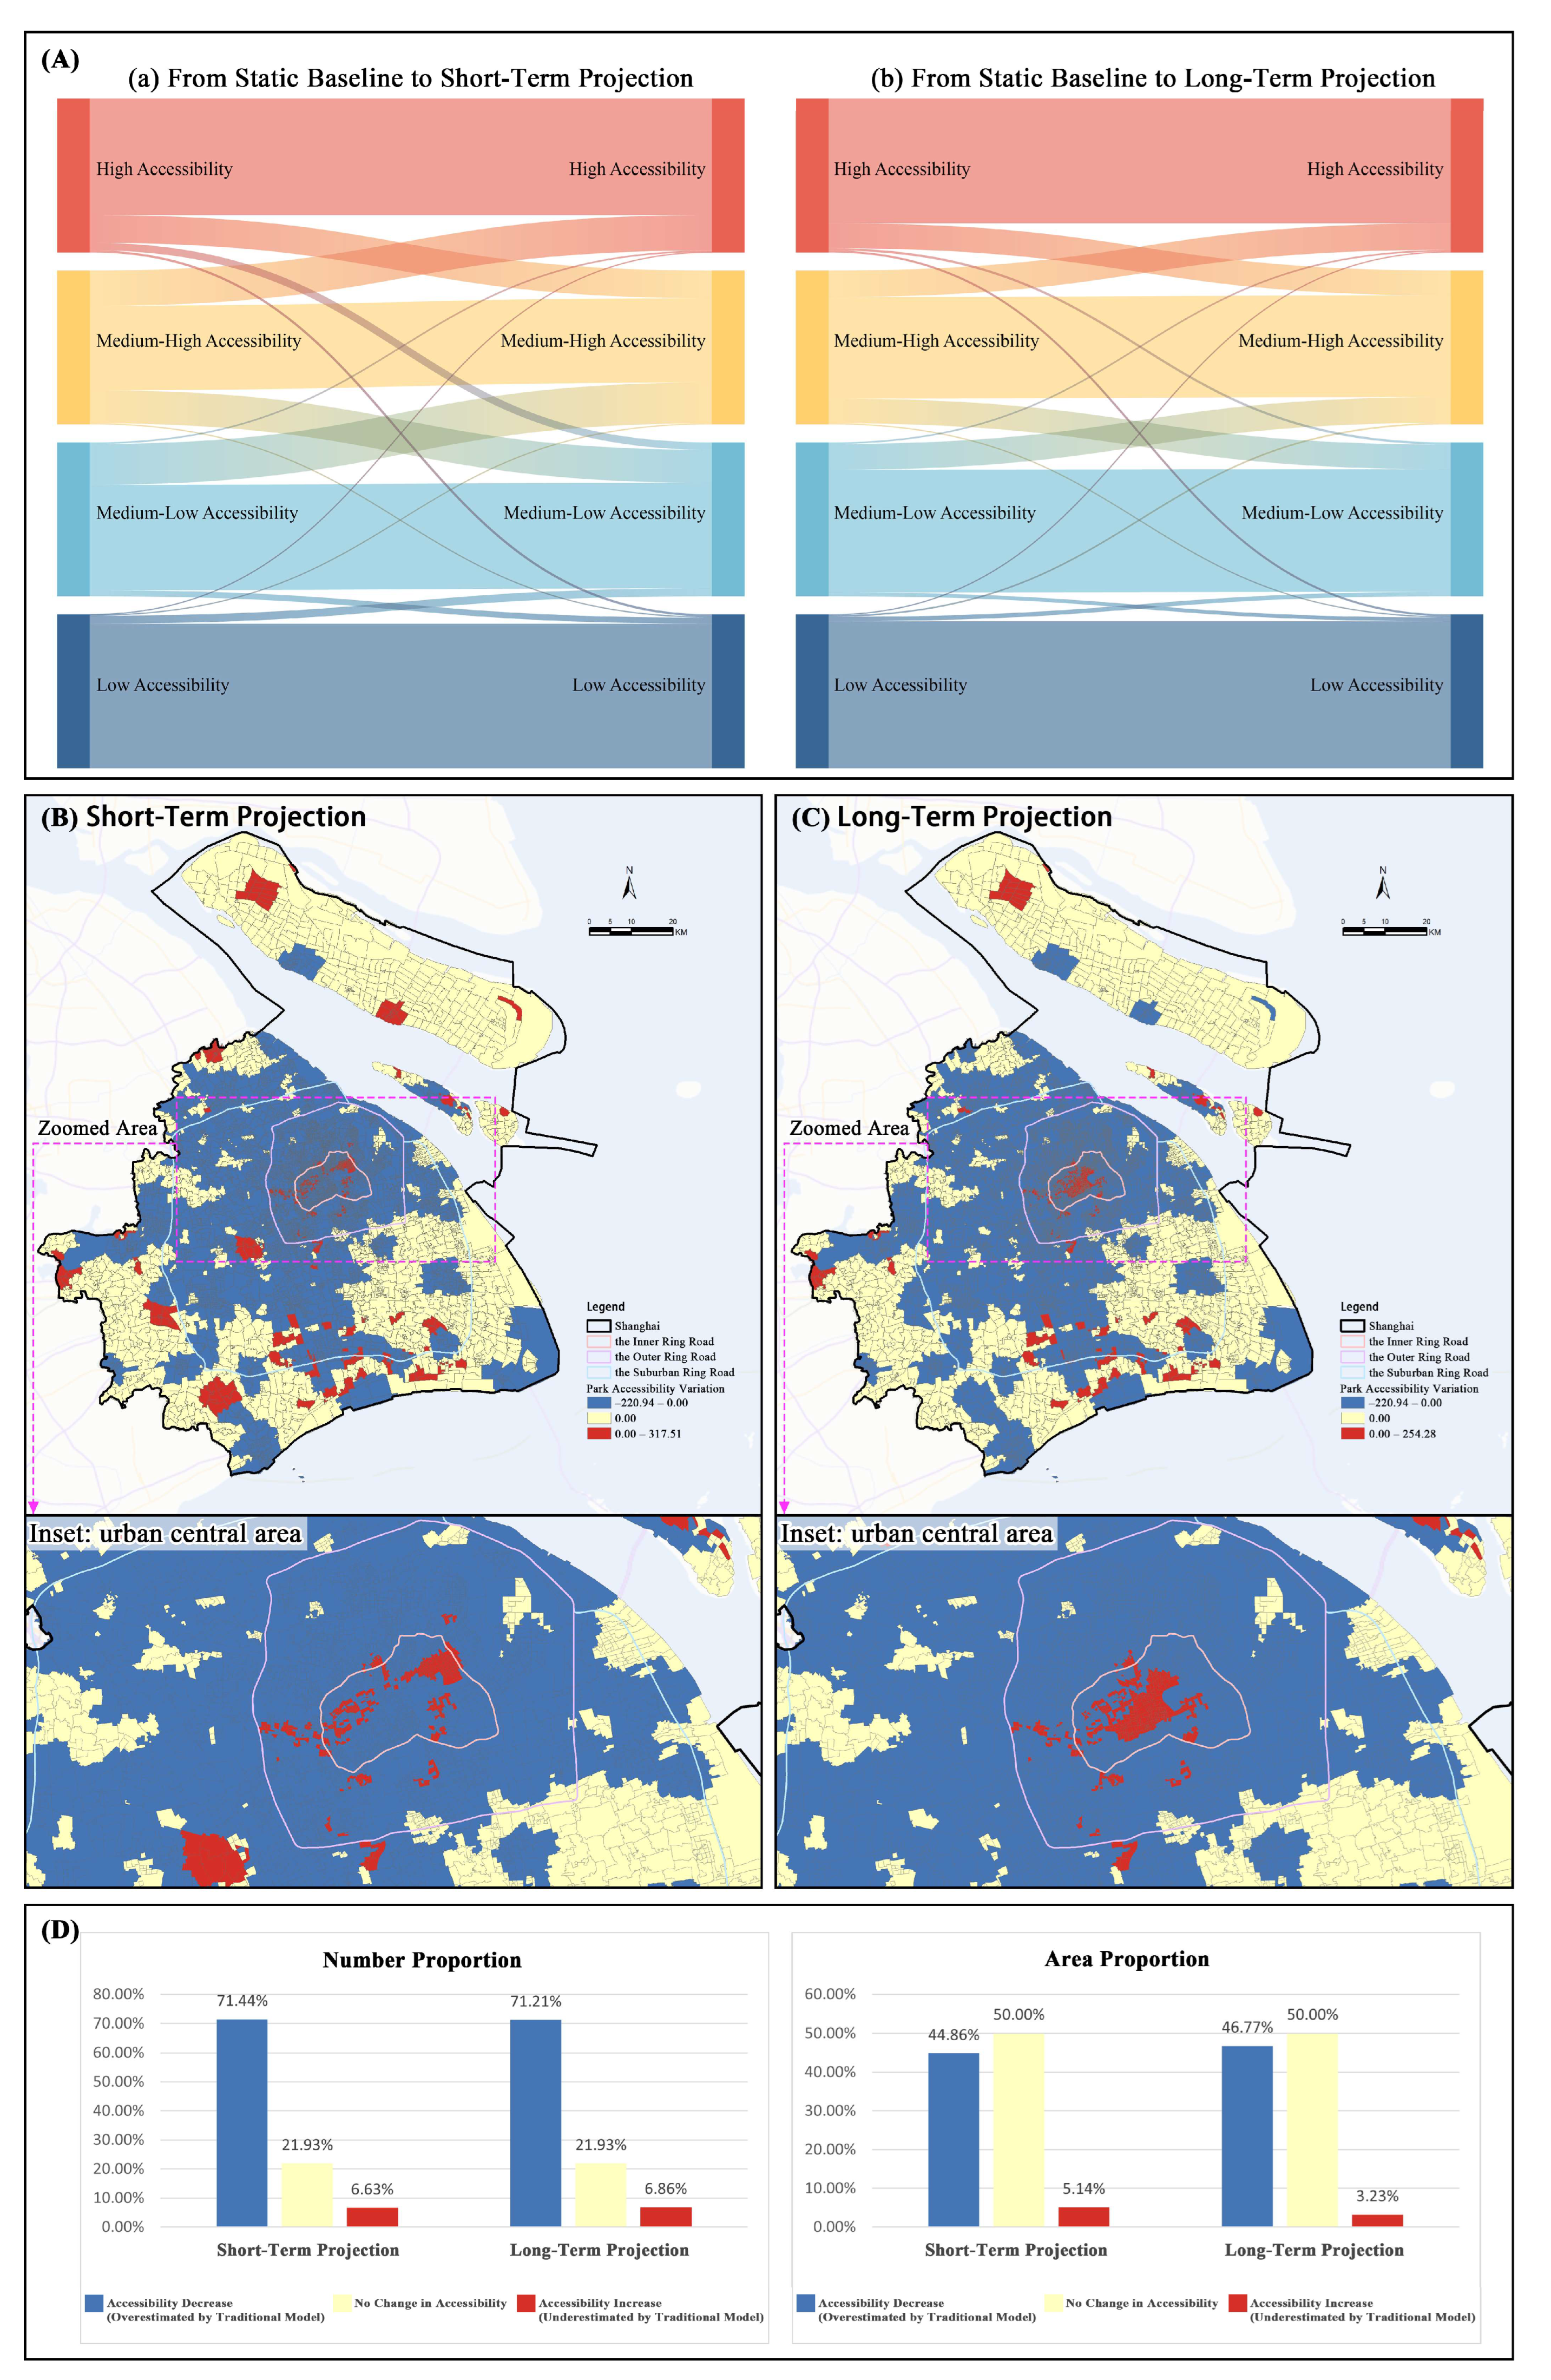
3.3. Comparative Evaluation of Park Accessibility Models
- Scenario 1: Static baseline, using the Ga2SFCA method with 2020 census data.
- Scenario 2: Short-term projection, applying the HPP-Ga2SFCA method using 2030 population projections based on 2010–2020 growth rates.
- Scenario 3: Long-term projection, applying the HPP-Ga2SFCA method using 2030 population projections based on 2000–2020 compound growth rates.
4. Discussion
4.1. Main Findings
- (1)
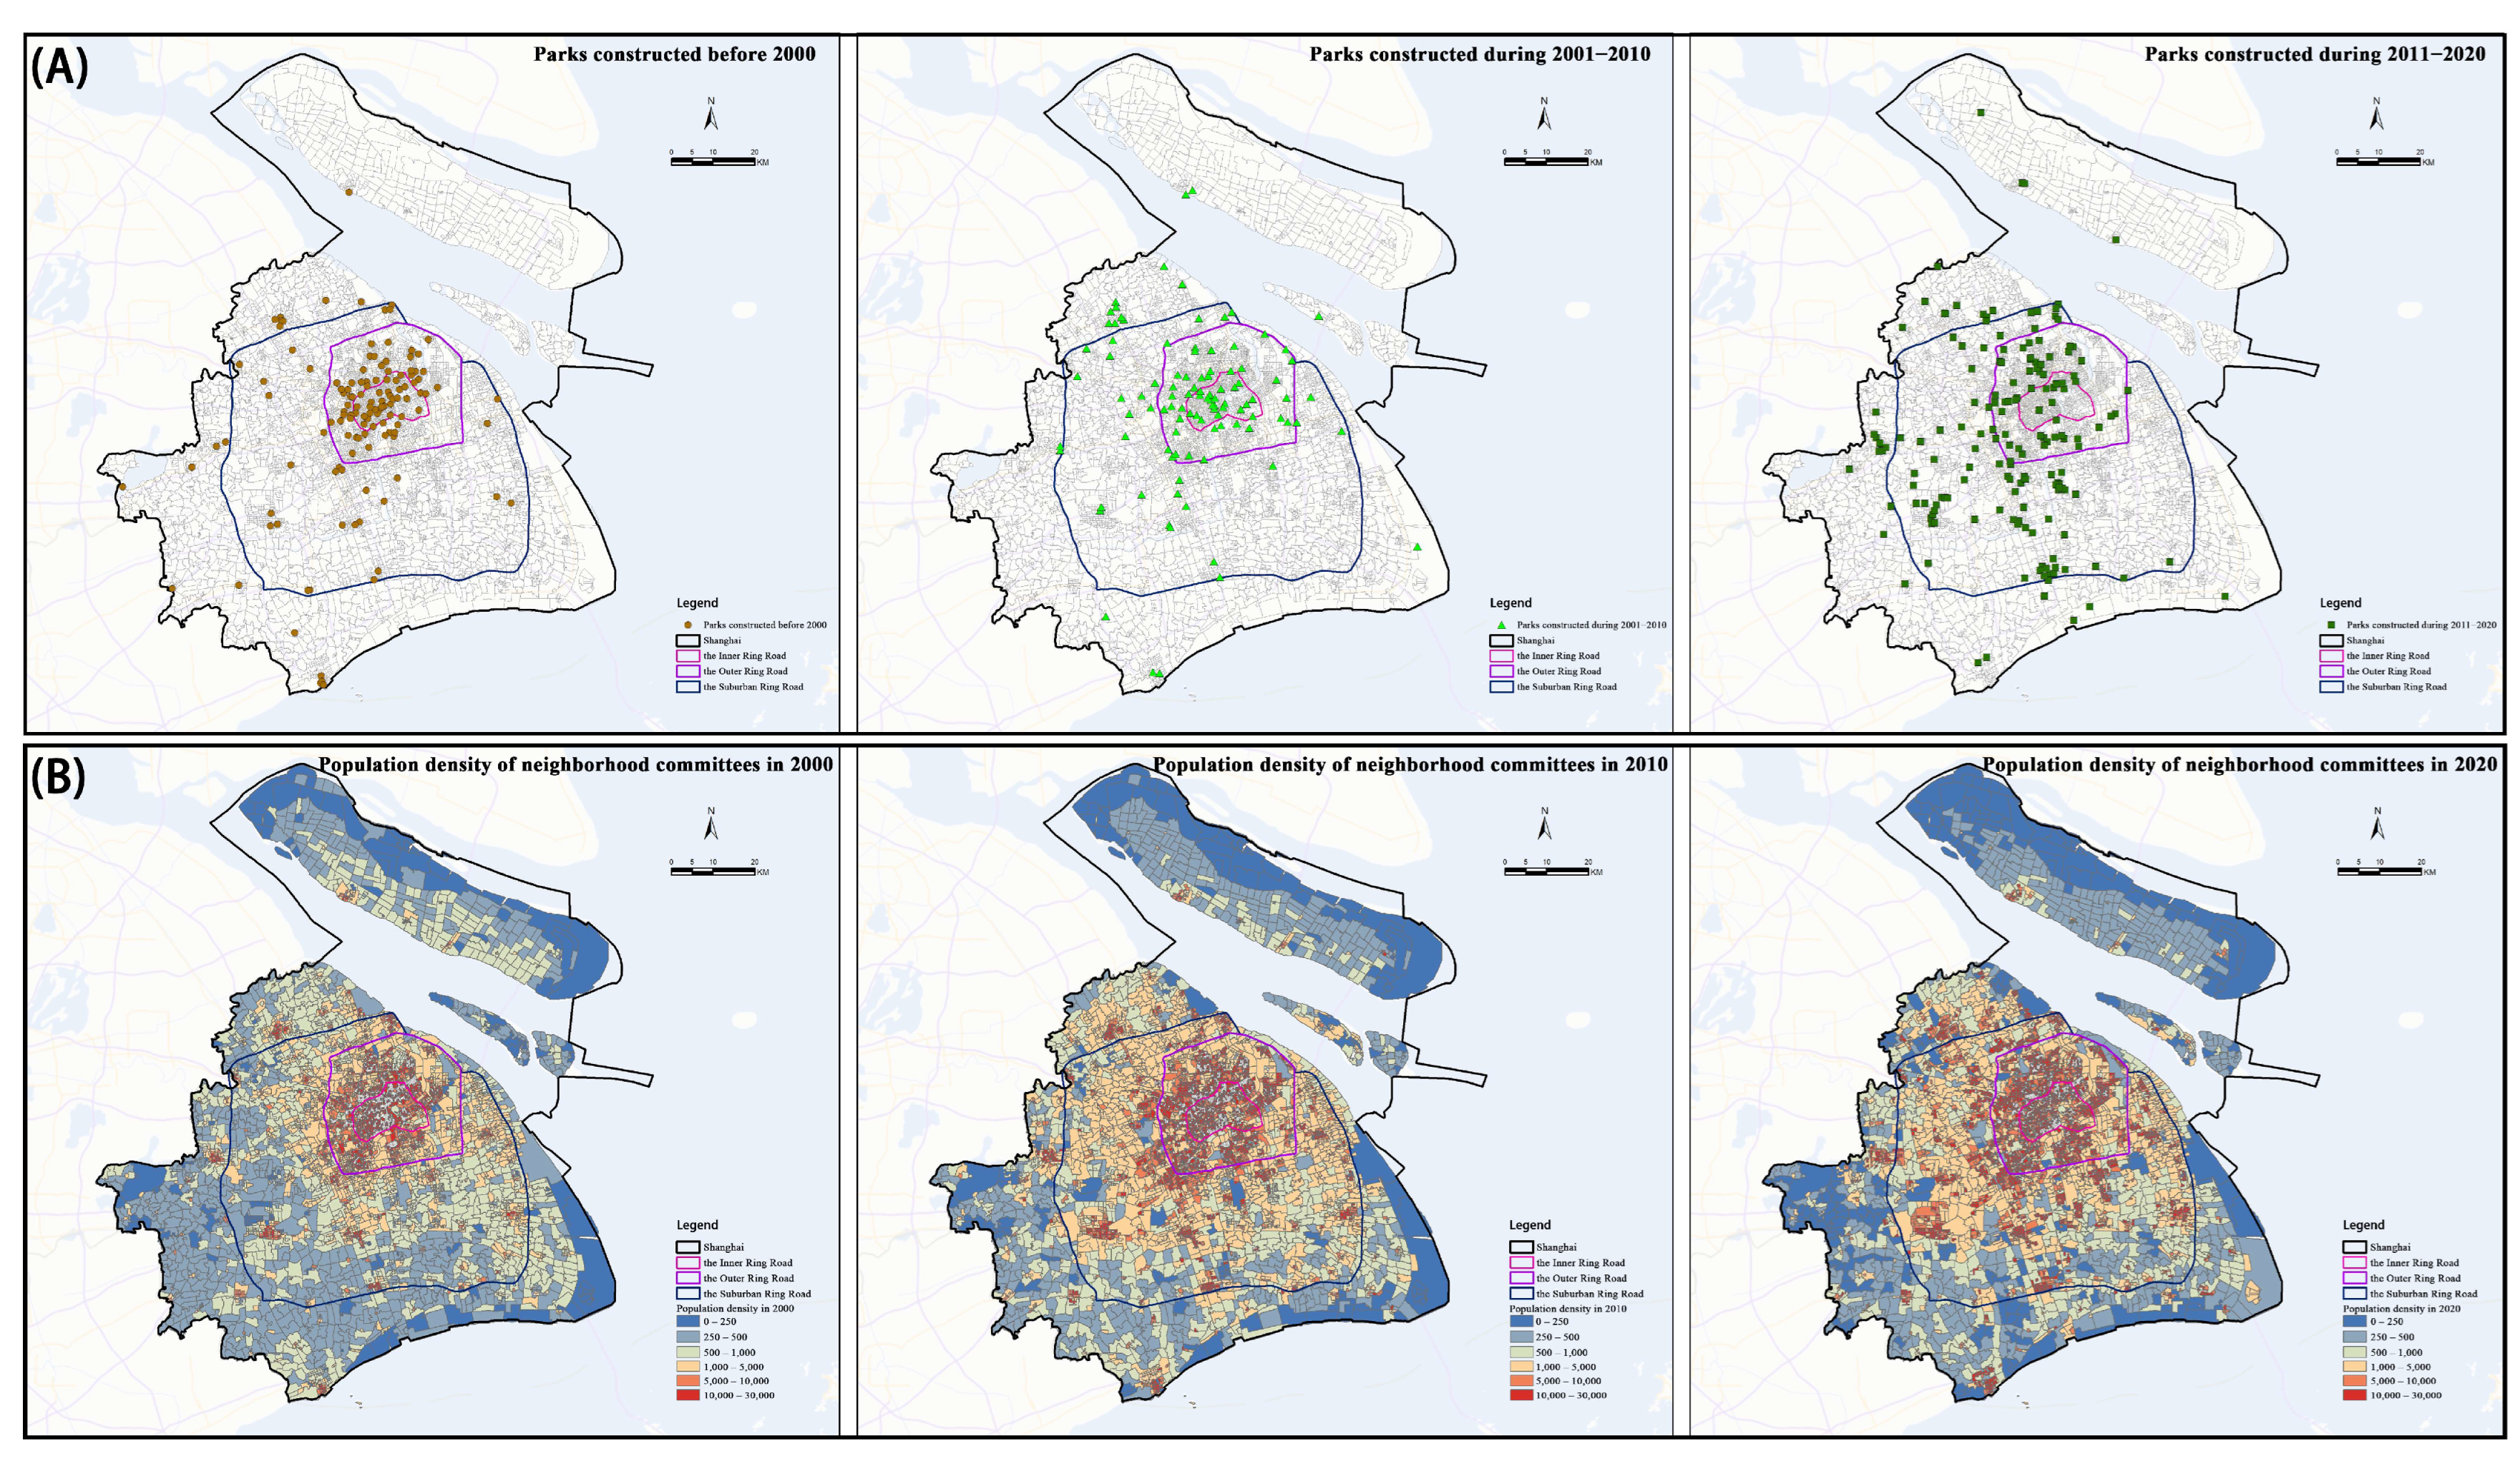
- Population dynamics and spatial patterns (2000–2020): Time-series clustering revealed five distinct types of population change trajectories, grouped into three broader categories—(i) Population Growth (Accelerated Growth, Slowing Growth), (ii) Population Decline (Accelerated Decline, Slowing Decline), and (iii) Population Fluctuation (Initial Increase Followed by Decline). Neighborhood committees in the growth category accounted for 54.86% of all units but only 31.85% of the total area, indicating that growth was concentrated in relatively small urban zones. Conversely, population decline occurred in fewer units but spanned larger spatial areas. The most common pattern was Slowing Growth, characterized by rapid early growth followed by moderation. Accelerated Decline had the widest spatial extent. Spatially, population decline was most evident in both the city center and the peripheral zones, while rapid population aggregation primarily occurred in the area between the inner and suburban rings.
- (2)
- Future population projections and spatial patterns: Under both short-term and long-term projection scenarios, population hotspots in 2030 are expected to be concentrated near the outer ring, while cold spots will largely be located in the inner ring and beyond the suburban ring. The long-term scenario projects that 65.52% of neighborhood committees (covering 48.78% of the area) will experience population growth, especially in the transitional zone between the inner and suburban rings. In contrast, the short-term scenario, 51.94% of units (covering 70.83% of the area) will experience population decline, reflecting a more spatially balanced distribution. These contrasting outcomes highlight the complex and nonlinear trajectory of Shanghai’s demographic evolution over the past two decades, as well as the sensitivity of population projections to differing temporal frameworks.
- (3)
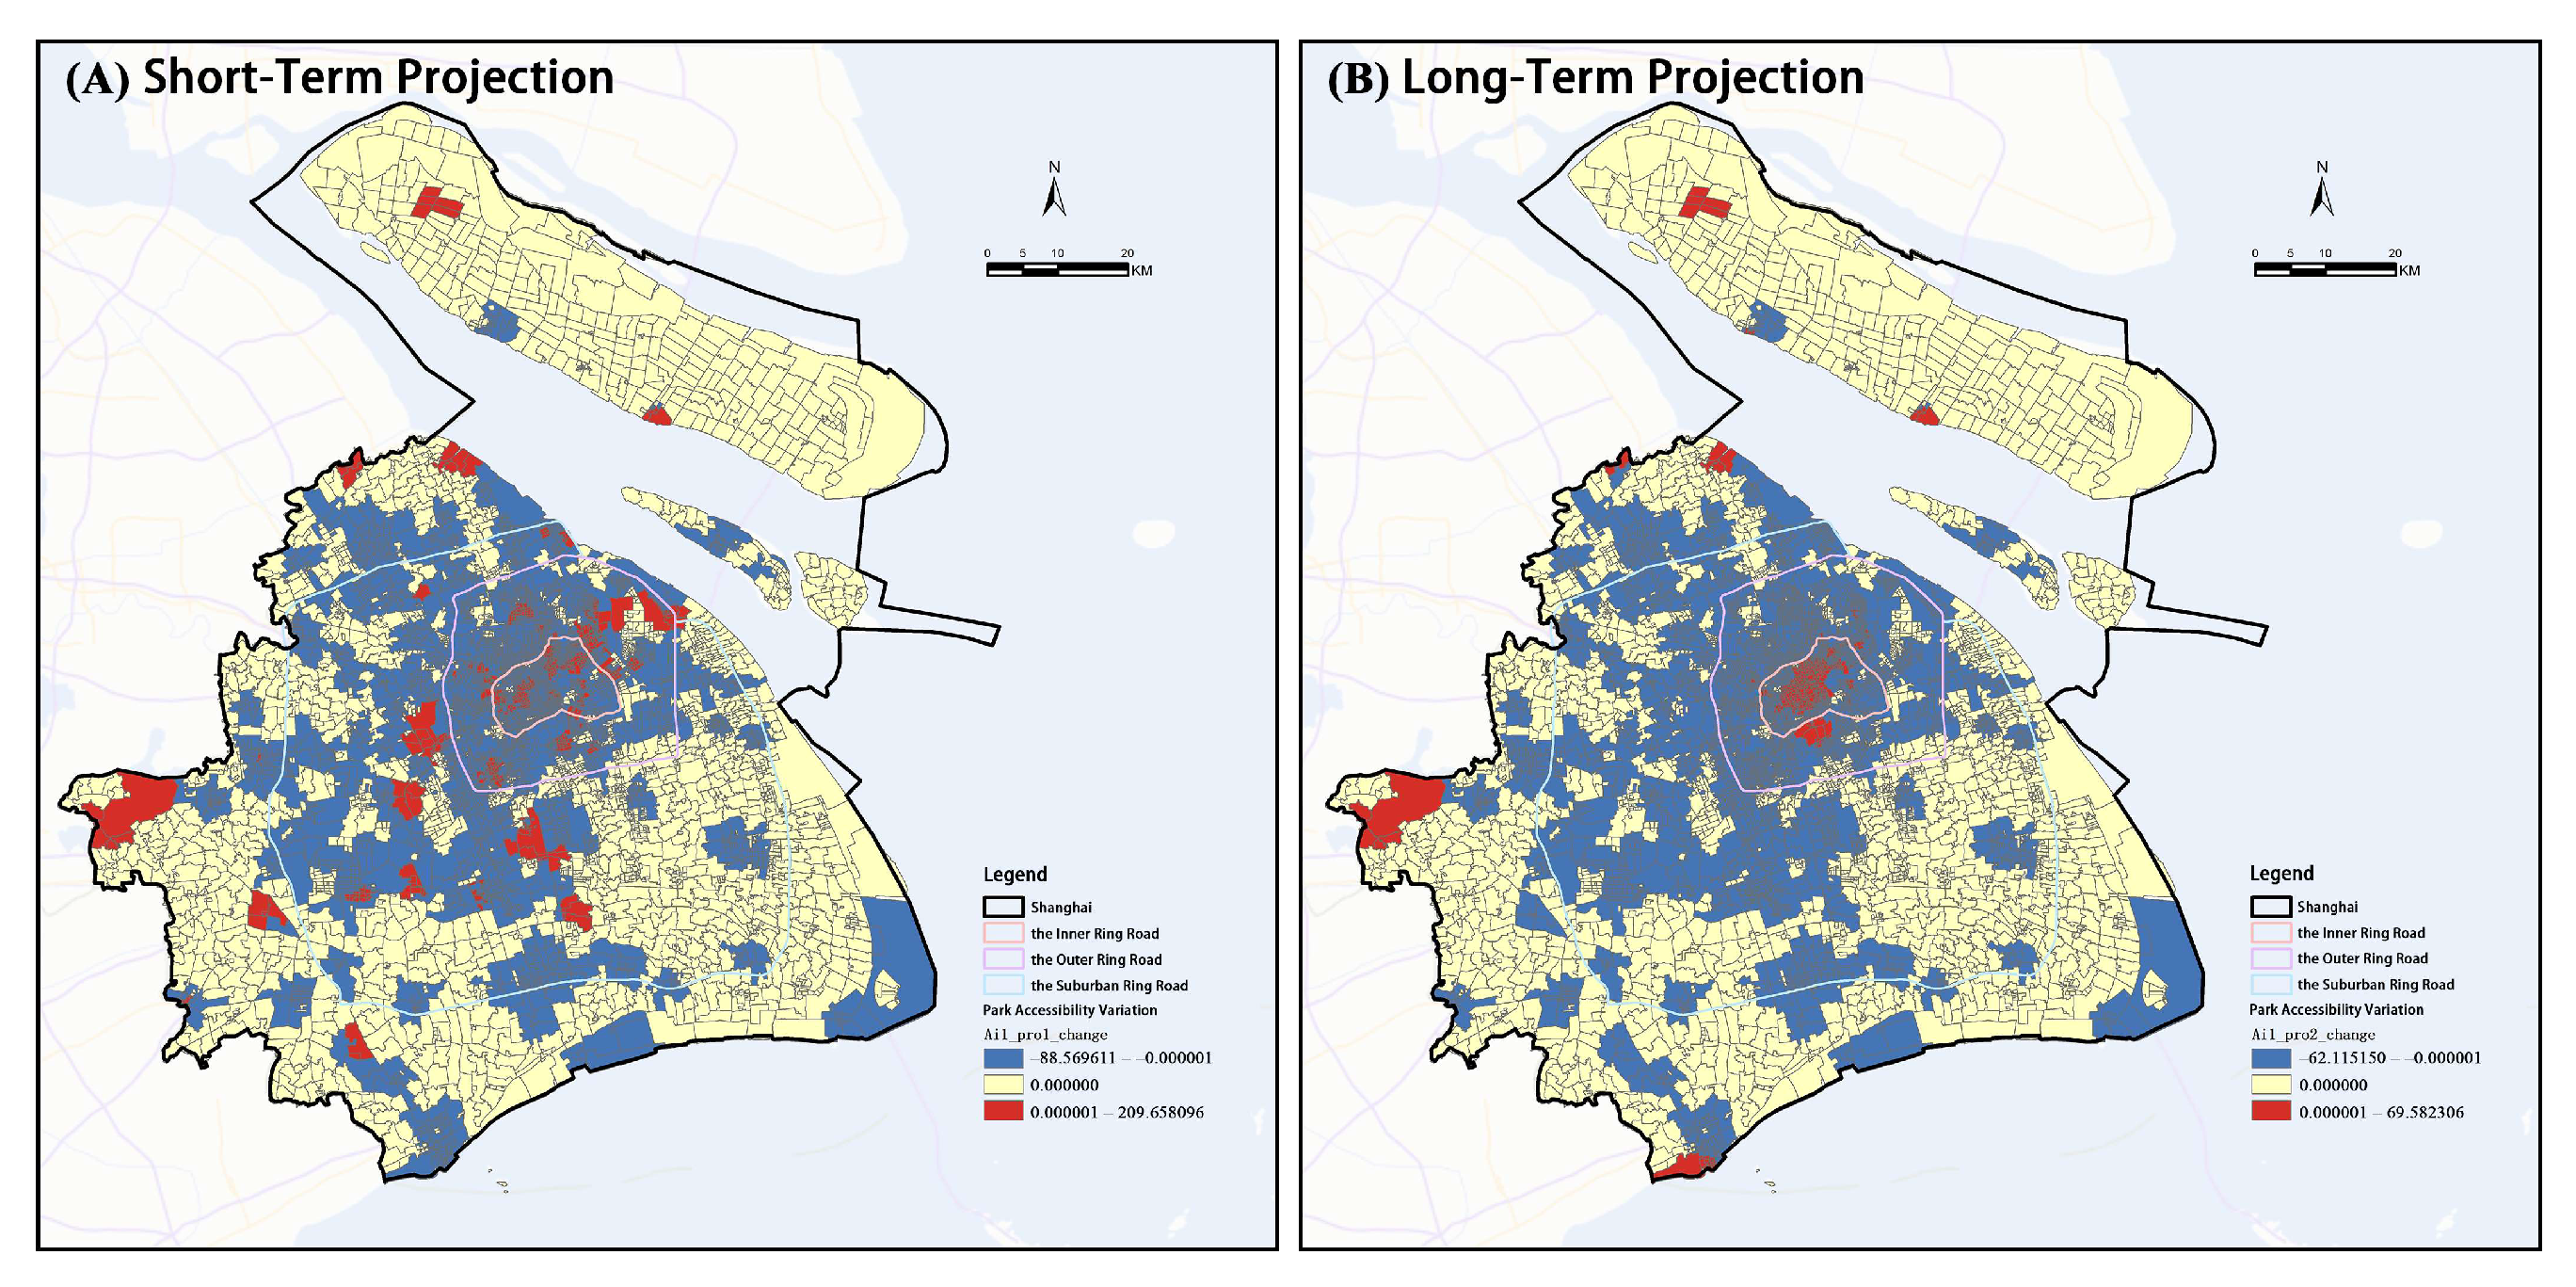
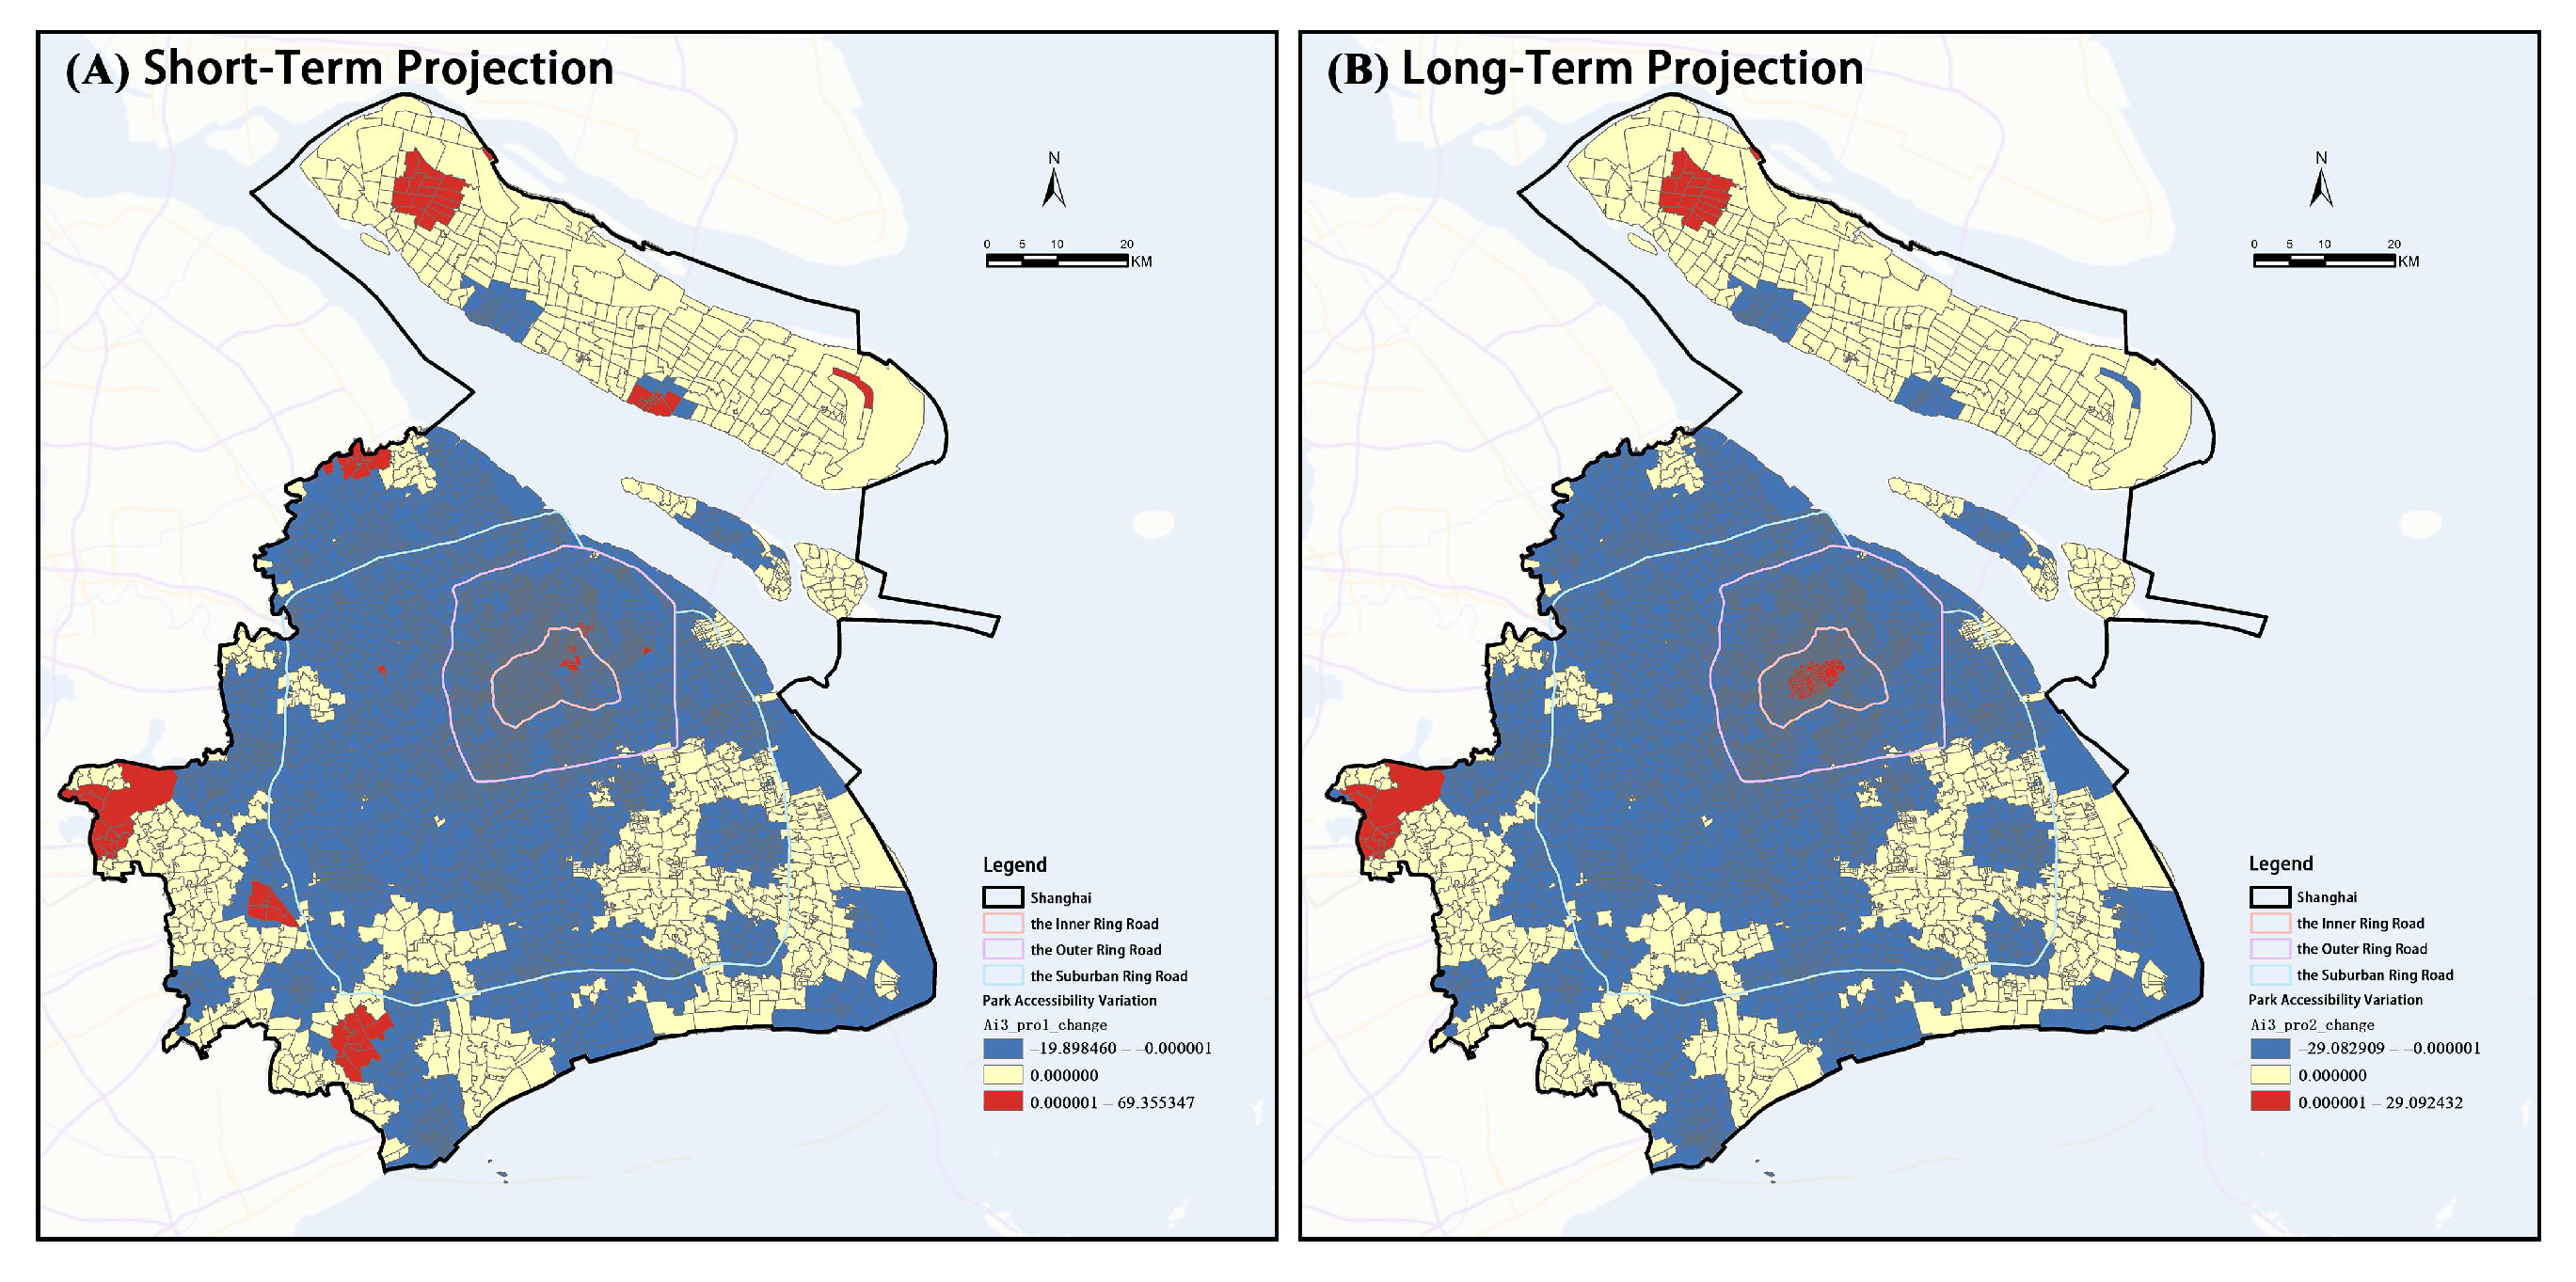
- Improved park accessibility assessments: Static assessments that do not account for population dynamics were found to overestimate park accessibility by approximately 40%. By integrating population forecasts, the dynamic model allowed for more accurate identification of future service gaps and highlighted emerging stress on areas currently considered well-served. The model revealed a tendency for service pressure to shift toward zones presently classified as having medium or low accessibility, indicating a potential dilution of service levels under future demographic conditions. Furthermore, the study identified spatial mismatches in traditional model outputs. Around 71% of neighborhood committees may have been underestimated in terms of accessibility, while approximately 45% of the city’s area may face overestimation risks. Overestimated zones were typically located in areas expected to undergo significant population growth, particularly between the inner and suburban rings, whereas underestimated zones were scattered throughout the inner ring and on the suburban fringe.
4.2. Practical Planning Insights
4.3. Advantages and Limitations
5. Conclusions
Author Contributions
Funding
Data Availability Statement
Acknowledgments
Conflicts of Interest
Abbreviations
| 2SFCA | Two-step floating catchment area |
| Ga2SFCA | Gaussian-based two-step floating catchment area |
| HPP | Human population projection |
| FCM | Fuzzy C-means clustering |
| CAGR | Compound annual growth rate |
| MAUP | Modifiable areal unit problem |
Appendix A
Appendix A.1. Euclidean Distance-Based Accessibility Under Varying Radii
Appendix A.2. Network Distance-Based Accessibility with Point-Based Features

Appendix A.3. Modifiable Areal Unit Problem (MAUP) Test

References
- Chiesura, A. The role of urban parks for the sustainable city. Landsc. Urban Plann. 2004, 68, 129–138. [Google Scholar] [CrossRef]
- Kaczynski, A.T.; Henderson, K.A. Environmental correlates of physical activity: A review of evidence about parks and recreation. Leis. Sci. 2007, 29, 315–354. [Google Scholar] [CrossRef]
- Chawla, L. Benefits of Nature Contact for Children. J. Plan. Lit. 2015, 30, 433–452. [Google Scholar] [CrossRef]
- Konijnendijk, C.C.; Annerstedt, M.; Nielsen, A.B.; Maruthaveeran, S. Benefits of Urban Parks: A Systematic Review; A report for IPFRA.; Copenhagen & Alnarp Press: Copenhagen, Denmark, 2013. [Google Scholar]
- WHO. Urban Green Spaces and Health; WHO Regional Office for Europe: Copenhagen, Denmark, 2016. [Google Scholar]
- United Nations-Department of Economic and Social Affairs-Sustainable Development. Transforming Our World: The 2030 Agenda for Sustainable Development; United Nations: New York, NY, USA, 2015. [Google Scholar]
- Lineberry, R.L. Review of Equality and Urban Policy: The Distribution of Municipal Public Services. Contemp. Sociol. 1979, 8, 81–82. [Google Scholar] [CrossRef]
- Rich, R.C. Neglected Issues in the Study of Urban Service Distributions—Research Agenda. Urban Stud. 1979, 16, 143–156. [Google Scholar] [CrossRef]
- Talen, E.; Anselin, L. Assessing spatial equity: An evaluation of measures of accessibility to public playgrounds. Environ. Plan. A 1998, 30, 595–613. [Google Scholar] [CrossRef]
- Xiao, Y.; Wang, Z.; Li, Z.; Tang, Z. An assessment of urban park access in Shanghai—Implications for the social equity in urban China. Landsc. Urban Plann. 2017, 157, 383–393. [Google Scholar] [CrossRef]
- Rodenbiker, J. Social justice in China’s cities: Urban-rural restructuring and justice-oriented planning. Trans. Plan. Urban Res. 2022, 1, 184–198. [Google Scholar] [CrossRef]
- Wolch, J.; Wilson, J.P.; Fehrenbach, J. Parks and Park Funding in Los Angeles: An Equity-Mapping Analysis. Urban Geogr. 2005, 26, 4–35. [Google Scholar] [CrossRef]
- Ferguson, M.; Roberts, H.E.; McEachan, R.R.C.; Dallimer, M. Contrasting distributions of urban green infrastructure across social and ethno-racial groups. Landsc. Urban Plann. 2018, 175, 136–148. [Google Scholar] [CrossRef]
- Nicholls, S. Measuring the accessibility and equity of public parks: A case study using GIS. Manag. Sport Leis. 2001, 6, 201–219. [Google Scholar] [CrossRef]
- Comber, A.; Brunsdon, C.; Green, E. Using a GIS-based network analysis to determine urban greenspace accessibility for different ethnic and religious groups. Landsc. Urban Plann. 2008, 86, 103–114. [Google Scholar] [CrossRef]
- Van Herzele, A.; Wiedemann, T. A monitoring tool for the provision of accessible and attractive urban green spaces. Landsc. Urban Plann. 2003, 63, 109–126. [Google Scholar] [CrossRef]
- Yin, H.; Xu, J. Spatial accessibility and equity of parks in Shanghai. Urban Stud. 2009, 16, 71–76. [Google Scholar] [CrossRef]
- Hansen, W.G. How Accessibility Shapes Land Use. J. Am. Inst. Plann. 1959, 25, 73–76. [Google Scholar] [CrossRef]
- Rigolon, A. A complex landscape of inequity in access to urban parks: A literature review. Landsc. Urban Plann. 2016, 153, 160–169. [Google Scholar] [CrossRef]
- Neutens, T.; Schwanen, T.; Witlox, F.; De Maeyer, P. Equity of Urban Service Delivery: A Comparison of Different Accessibility Measures. Environ. Plan. A 2010, 42, 1613–1635. [Google Scholar] [CrossRef]
- Zhang, X.; Lu, H.; Holt, J.B. Modeling spatial accessibility to parks: A national study. Int. J. Health Geogr. 2011, 10, 31. [Google Scholar] [CrossRef]
- Maroko, A.R.; Maantay, J.A.; Sohler, N.L.; Grady, K.L.; Arno, P.S. The complexities of measuring access to parks and physical activity sites in New York City: A quantitative and qualitative approach. Int. J. Health Geogr. 2009, 8, 34. [Google Scholar] [CrossRef]
- Radke, J.; Mu, L. Spatial Decompositions, Modeling and Mapping Service Regions to Predict Access to Social Programs. Ann. GIS 2000, 6, 105–112. [Google Scholar] [CrossRef]
- Luo, W.; Wang, F.H. Measures of spatial accessibility to health care in a GIS environment: Synthesis and a case study in the Chicago region. Environ. Plan. B-Plan. Des. 2003, 30, 865–884. [Google Scholar] [CrossRef] [PubMed]
- Wang, F. Measurement, Optimization, and Impact of Health Care Accessibility: A Methodological Review. Ann. Assoc. Am. Geogr. 2012, 102, 1104–1112. [Google Scholar] [CrossRef] [PubMed]
- Chen, X.; Jia, P. A comparative analysis of accessibility measures by the two-step floating catchment area (2SFCA) method. Int. J. Geogr. Inf. Sci. 2019, 33, 1739–1758. [Google Scholar] [CrossRef]
- Liang, Y.; Xie, Z.; Chen, S.; Xu, Y.; Xin, Z.; Yang, S.; Jian, H.; Wang, Q. Spatial Accessibility of Urban Emergency Shelters Based on Ga2SFCA and Its Improved Method: A Case Study of Kunming, China. J. Urban Plan. Dev. 2023, 149, 05023013. [Google Scholar] [CrossRef]
- Wu, W.; Zheng, T. Establishing a “dynamic two-step floating catchment area method” to assess the accessibility of urban green space in Shenyang based on dynamic population data and multiple modes of transportation. Urban For. Urban Green. 2023, 82, 127893. [Google Scholar] [CrossRef]
- Gu, K.; Liu, J.; Wang, D.; Dai, Y.; Li, X. Analyzing the Supply and Demand Dynamics of Urban Green Spaces Across Diverse Transportation Modes: A Case Study of Hefei City’s Built-Up Area. Land 2024, 13, 1937. [Google Scholar] [CrossRef]
- Mao, L.; Nekorchuk, D. Measuring spatial accessibility to healthcare for populations with multiple transportation modes. Health Place 2013, 24, 115–122. [Google Scholar] [CrossRef]
- Liang, H.; Yan, Q.; Yan, Y.; Zhang, Q. Using an improved 3SFCA method to assess inequities associated with multimodal accessibility to green spaces based on mismatches between supply and demand in the metropolitan of Shanghai, China. Sustain. Cities Soc. 2023, 91, 104456. [Google Scholar] [CrossRef]
- Zhang, L.; Chen, P.; Hui, F. Refining the accessibility evaluation of urban green spaces with multiple sources of mobility data: A case study in Shenzhen, China. Urban For. Urban Green. 2022, 70, 127550. [Google Scholar] [CrossRef]
- Liao, Y.; Furuya, K. A Case Study on Children’s Accessibility in Urban Parks in Changsha City, China: Developing an Improved 2SFCA Method. Land 2024, 13, 1522. [Google Scholar] [CrossRef]
- Luo, W.; Chen, H.; Yang, Z.; Liu, J. Accessibility and Equity of Park Green Spaces: Considering Differences in Walking Speeds Across Age Groups. Land 2024, 13, 2240. [Google Scholar] [CrossRef]
- Gao, L.; Xu, Z.; Shang, Z.; Li, M.; Wang, J. Assessing Urban Park Accessibility and Equity Using Open-Source Data in Jiujiang, China. Land 2025, 14, 9. [Google Scholar] [CrossRef]
- Yang, Y.; He, R.; Tian, G.; Shi, Z.; Wang, X.; Fekete, A. Equity Study on Urban Park Accessibility Based on Improved 2SFCA Method in Zhengzhou, China. Land 2022, 11, 2045. [Google Scholar] [CrossRef]
- Xiao, Y.; Wang, D.; Fang, J. Exploring the disparities in park access through mobile phone data: Evidence from Shanghai, China. Landsc. Urban Plann. 2019, 181, 80–91. [Google Scholar] [CrossRef]
- Dai, D. Racial/ethnic and socioeconomic disparities in urban green space accessibility: Where to intervene? Landsc. Urban Plann. 2011, 102, 234–244. [Google Scholar] [CrossRef]
- Dai, D. Black residential segregation, disparities in spatial access to health care facilities, and late-stage breast cancer diagnosis in metropolitan Detroit. Health Place 2010, 16, 1038–1052. [Google Scholar] [CrossRef]
- Gould, K.; Lewis, T. The environmental injustice of green gentrification: The case of Brooklyn’s prospect park. In The World in Brooklyn: Gentrification, Immigration, and Ethnic Politics in a Global City; Lexington Books: Lanham, MD, USA, 2012. [Google Scholar]
- Pearsall, H. From Brown to Green? Assessing Social Vulnerability to Environmental Gentrification in New York City. Environ. Plan. C Gov. Policy 2010, 28, 872–886. [Google Scholar] [CrossRef]
- Checker, M. Wiped Out by the “Greenwave”: Environmental Gentrification and the Paradoxical Politics of Urban Sustainability. City Soc. 2011, 23, 210–229. [Google Scholar] [CrossRef]
- Curran, W.; Hamilton, T. Just green enough: Contesting environmental gentrification in Greenpoint, Brooklyn. Local Environ. 2012, 17, 1027–1042. [Google Scholar] [CrossRef]
- Goodling, E.; Green, J.; McClintock, N. Uneven development of the sustainable city: Shifting capital in Portland, Oregon. Urban Geogr. 2015, 36, 504–527. [Google Scholar] [CrossRef]
- Conway, D.; Li, C.Q.; Wolch, J.; Kahle, C.; Jerrett, M. A Spatial Autocorrelation Approach for Examining the Effects of Urban Greenspace on Residential Property Values. J. Real Estate Financ. Econ. 2010, 41, 150–169. [Google Scholar] [CrossRef]
- Anguelovski, I. Beyond a Livable and Green Neighborhood: Asserting Control, Sovereignty and Transgression in the Casc Antic of Barcelona. Int. J. Urban Reg. Res. 2013, 37, 1012–1034. [Google Scholar] [CrossRef]
- Anguelovski, I. New Directions in Urban Environmental Justice:Rebuilding Community, Addressing Trauma, and Remaking Place. J. Plan. Educ. Res. 2013, 33, 160–175. [Google Scholar] [CrossRef]
- Anguelovski, I.; Connolly, J.J.; Garcia-Lamarca, M.; Cole, H.; Pearsall, H. New scholarly pathways on green gentrification: What does the urban ‘green turn’ mean and where is it going? Prog. Hum. Geogr. 2019, 43, 1064–1086. [Google Scholar] [CrossRef]
- Quinton, J.; Nesbitt, L.; Sax, D. How well do we know green gentrification? A systematic review of the methods. Prog. Hum. Geogr. 2022, 46, 960–987. [Google Scholar] [CrossRef] [PubMed]
- Hunter, R.F.; Cleland, C.; Cleary, A.; Droomers, M.; Wheeler, B.W.; Sinnett, D.; Nieuwenhuijsen, M.J.; Braubach, M. Environmental, health, wellbeing, social and equity effects of urban green space interventions: A meta-narrative evidence synthesis. Environ. Int. 2019, 130, 104923. [Google Scholar] [CrossRef] [PubMed]
- United Nations Department of Economic and Social Affairs Department, P.D. World Population Prospects 2022; United Nations Publication: New York, NY, USA, 2022. [Google Scholar]
- Fan, P.; Xu, L.; Yue, W.; Chen, J. Accessibility of public urban green space in an urban periphery: The case of Shanghai. Landsc. Urban Plann. 2017, 165, 177–192. [Google Scholar] [CrossRef]
- Li, Z.; Wu, F. Tenure-based residential segregation in post-reform Chinese cities: A case study of Shanghai. Trans. Inst. Br. Geogr. 2008, 33, 404–419. [Google Scholar] [CrossRef]
- Shen, J.; Xiao, Y. Emerging divided cities in China: Socioeconomic segregation in Shanghai, 2000–2010. Urban Stud. 2019, 57, 1338–1356. [Google Scholar] [CrossRef]
- Xiao, Y.; Li, H.; Huang, X.; Chang, J. Can state-led urban regeneration occur without gentrification? Appl. Geogr. 2025, 177, 103560. [Google Scholar] [CrossRef]
- Kumar, L.; Mfuzz, M.F. A software package for soft clustering of microarray data. Bioinformation 2007, 2, 5–7. [Google Scholar] [CrossRef]
- Yang, Y.; Xue, J.; Qian, J.; Qian, X. Mapping energy inequality between urban and rural China. Appl. Geogr. 2024, 165, 103220. [Google Scholar] [CrossRef]
- Huang, Y.; Lin, T.; Zhang, G.; Jones, L.; Xue, X.; Ye, H.; Liu, Y. Spatiotemporal patterns and inequity of urban green space accessibility and its relationship with urban spatial expansion in China during rapid urbanization period. Sci. Total Environ. 2022, 809, 151123. [Google Scholar] [CrossRef]
- Shi, L.; Halik, Ü.; Abliz, A.; Mamat, Z.; Welp, M. Urban Green Space Accessibility and Distribution Equity in an Arid Oasis City: Urumqi, China. Forests 2020, 11, 690. [Google Scholar] [CrossRef]
- Jerzyk, M. Gentrification’s Third Way: An Analysis of Housing Policy & (and) Gentrification in Providence. Harv. Law Policy Rev. 2009, 3, 413–415. [Google Scholar]
- Kennedy, M.; Leonard, P. Dealing with Neighborhood Change: A Primer on Gentrification and Policy Choices; Brookings Institution Center on Urban and Metropolitan Policy: Washington, DC, USA, 2001. [Google Scholar]
- Shen, J.; Luo, X.; Sun, Z. Housing (de-)financialisation under state entrepreneurialism in China: The revival of affordable housing and Shanghai’s shared-ownership housing scheme. Trans. Plan. Urban Res. 2022, 1, 269–288. [Google Scholar] [CrossRef]
- Tong, M.; Yan, Z.; Chao, L. Research on a Grey Prediction Model of Population Growth Based on a Logistic Approach. Discret. Dyn. Nat. Soc. 2020, 2020, 2416840. [Google Scholar] [CrossRef]
- Guo, X.; Zhang, R.; Xie, N.; Jin, J. Predicting the Population Growth and Structure of China Based on Grey Fractional-Order Models. J. Math. 2021, 2021, 7725125. [Google Scholar] [CrossRef]
- Riiman, V.; Wilson, A.; Milewicz, R.; Pirkelbauer, P. Comparing artificial neural network and cohort-component models for population forecasts. Popul. Rev. 2019, 58, 100–116. [Google Scholar] [CrossRef]
- Li, D.; Yu, Y.; Wang, B. Urban population prediction based on multi-objective lioness optimization algorithm and system dynamics model. Sci. Rep. 2023, 13, 11836. [Google Scholar] [CrossRef]
- Wong, D.W.S. The Modifiable Areal Unit Problem (MAUP). In WorldMinds: Geographical Perspectives on 100 Problems: Commemorating the 100th Anniversary of the Association of American Geographers 1904–2004; Janelle, D.G., Warf, B., Hansen, K., Eds.; Springer: Dordrecht, The Netherlands, 2004; pp. 571–575. [Google Scholar]
- Openshaw, S. Ecological Fallacies and the Analysis of Areal Census Data. Environ. Plan. A 1984, 16, 17–31. [Google Scholar] [CrossRef]


| Category | Cluster | Cluster Name | Number of Units | Proportion (%) | Total Area (km2) | Area Proportion (%) |
|---|---|---|---|---|---|---|
| Population Growth | Cluster 2 | Accelerated Growth Type | 1456 | 23.65% | 1301.97 | 13.87% |
| Cluster 3 | Slowing Growth Type | 1922 | 31.22% | 1687.53 | 17.98% | |
| Total | 3378 | 54.86% | 2989.5 | 31.85% | ||
| Population Decline | Cluster 1 | Accelerated Decline Type | 904 | 14.68% | 2248.23 | 23.96% |
| Cluster 5 | Slowing Decline Type | 971 | 15.77% | 1943.69 | 20.71% | |
| Total | 1875 | 30.45% | 4191.92 | 44.67% | ||
| Population Fluctuation | Cluster 4 | Initial Increase Followed by Decline Type | 904 | 14.68% | 2203.64 | 23.48% |
| Scenario | Accessibility Model | Mean | Standard Deviation | Min. | Max. | Median |
|---|---|---|---|---|---|---|
| Scenario 1: Static baseline | Traditional Ga2SFCA | 2.13 | 7.44 | 0.00 | 220.94 | 0.76 |
| Scenario 2: Short-term projection | Improved HPP-Ga2SFCA | 1.30 | 9.09 | 0.00 | 318.61 | 0.48 |
| Scenario 3: Long-term projection | Improved HPP-Ga2SFCA | 1.28 | 7.38 | 0.00 | 255.38 | 0.46 |
Disclaimer/Publisher’s Note: The statements, opinions and data contained in all publications are solely those of the individual author(s) and contributor(s) and not of MDPI and/or the editor(s). MDPI and/or the editor(s) disclaim responsibility for any injury to people or property resulting from any ideas, methods, instructions or products referred to in the content. |
© 2025 by the authors. Licensee MDPI, Basel, Switzerland. This article is an open access article distributed under the terms and conditions of the Creative Commons Attribution (CC BY) license (https://creativecommons.org/licenses/by/4.0/).
Share and Cite
Cen, L.; Xiao, Y. Assessing Urban Park Accessibility via Population Projections: Planning for Green Equity in Shanghai. Land 2025, 14, 1580. https://doi.org/10.3390/land14081580
Cen L, Xiao Y. Assessing Urban Park Accessibility via Population Projections: Planning for Green Equity in Shanghai. Land. 2025; 14(8):1580. https://doi.org/10.3390/land14081580
Chicago/Turabian StyleCen, Leiting, and Yang Xiao. 2025. "Assessing Urban Park Accessibility via Population Projections: Planning for Green Equity in Shanghai" Land 14, no. 8: 1580. https://doi.org/10.3390/land14081580
APA StyleCen, L., & Xiao, Y. (2025). Assessing Urban Park Accessibility via Population Projections: Planning for Green Equity in Shanghai. Land, 14(8), 1580. https://doi.org/10.3390/land14081580