Article

The Relationship Between Population Shrinkage, Ageing, and New-Type Urbanization in Counties: The Case of Jilin Province, China

1
Northeast Institute of Geography and Agroecology, Chinese Academy of Sciences, Changchun 130102, China
2
College of Resources and Environment, University of Chinese Academy of Sciences, Beijing 100049, China
*
Authors to whom correspondence should be addressed.
Land 2025, 14(7), 1474; https://doi.org/10.3390/land14071474
Submission received: 27 June 2025 / Revised: 13 July 2025 / Accepted: 14 July 2025 / Published: 16 July 2025

Abstract

Counties are important vehicles for implementing the new-type urbanization strategy in China. However, some counties are experiencing population shrinkage and ageing, and the decline in the working-age population will constrain the process of new-type urbanization, but this has not received sufficient attention from academia and government policymakers. This paper takes Jilin Province, China, which is experiencing significant population shrinkage and ageing, as a case study to examine the spatial–temporal characteristics of population shrinkage and ageing at the county level and their relationship with new-type urbanization. This study found the following: (1) From 2014 to 2020, counties in Jilin Province experienced significant population shrinkage and ageing. (2) There is a certain correlation between population shrinkage and ageing. Ageing is the most obvious in counties with moderate shrinkage, followed by counties with mild shrinkage. (3) Although a new-type urbanization strategy has been implemented, the level of new-type urbanization in counties with population shrinkage and ageing is generally low and shows a trend of rising first and then falling. (4) Population shrinkage and ageing are positively correlated with new-type urbanization. The more severe the population shrinkage or ageing, the lower the level of new-type urbanization. It is necessary to take measures to alleviate the new-type urbanization dilemma in areas with population shrinkage and ageing, in order to promote sustainable regional development.

1. Introduction

Urbanization is a process of institutional change involving the transfer and concentration of rural populations to cities, resulting in the non-agriculturalization of industry and employment structures [1]. Over the past 40 years of reform and opening up, China has maintained a sustained and rapid pace of urbanization [2]. From 1978 to 2024, China’s urbanization rate increased from 17.92% to 67%, an increase of 49.08%, with an average annual growth rate of 1.07%. Lu Dadao, an academician of the Chinese Academy of Sciences, pointed out that China’s large-scale, rapid urbanization has come at a huge cost in terms of environmental pollution, with infrastructure overwhelmed and natural resources facing serious difficulties in sustaining growth [3]. In March 2014, the Central Committee of the Communist Party of China and the State Council issued the National New-Type Urbanization Plan (2014–2020), which aims to promote people-oriented urbanization [4]. China is shifting from traditional land-oriented urbanization to new-type urbanization that focuses on people. New-type urbanization is characterized by people-oriented urban–rural integration, industry–city interaction, conservation and intensification, ecological liveability, and harmonious development [1,2,3,4]. Traditional urbanization mainly focuses on land urbanization, while new-type urbanization is comprehensive, focusing on the urbanization of population, society, economy, land, and the environment [4]. Humans are at the core of economic development and the driving force behind urbanization. However, some regions in China are facing the dual pressures of population shrinkage and ageing, which may constrain the development of new-type urbanization. Population shrinkage tends to be dominated by the loss of young and middle-aged people, exacerbating ageing [5]. New-type urbanization faces severe challenges in areas with population shrinkage and ageing. Therefore, this paper attempted to explore the relationship between population shrinkage, ageing, and new-type urbanization in areas experiencing population shrinkage and ageing. In addition, we also attempted to evaluate the effectiveness of the new-type urbanization strategy in areas experiencing population shrinkage and ageing after the promulgation of the National New-Type Urbanization Plan. The dilemma of new-type urbanization in areas experiencing population shrinkage and ageing should receive more attention in order to promote sustainable regional development.
The rest of this paper is structured as follows: Section 2 provides a literature review. Section 3 presents the study area, data, and methods. Section 4 analyzes the empirical results. Section 5 and Section 6 compare and discuss the empirical results and draw conclusions.

2. Literature Review

2.1. Theory of New-Type Urbanization

The urbanization theory mainly originates from theories related to population migration. The most influential ones include Ravinstein’s push–pull theory [6], Schultz’s population migration theory [7], Todaro’s urban–rural population migration theory [8], Lewis’s dual economic development model [9], and Lipton’s urban bias theory [10]. Although these theories express different views, they all maintain the main point that the focus of rural populations in towns and cities is urbanization. Traditional urbanization often focuses on economic growth as its core objective, emphasizing urban expansion and infrastructure construction while neglecting the coordinated development of population, society, and the environment. This has led to a series of urban problems, such as overcrowding, environmental pollution, and resource shortages [11,12]. In contrast, new-type urbanization emphasizes a people-oriented approach and focuses on balanced development across multiple dimensions, including population, economy, society, space, ecology, and income gaps [13]. New-type urbanization is the cornerstone of China’s modernization strategy and a multi-dimensional comprehensive development process. Since the release of the National New-Type Urbanization Plan (2014–2020), China’s urbanization strategy has undergone a significant transformation. In the early stages of policy implementation, the focus of new-type urbanization was on breaking down the urban–rural dichotomy, promoting the urbanization of migrant workers, and improving the level of equality in basic public services [14]. However, the advancement of new-type urbanization has not been smooth sailing. The impact of economic targets on new-type urbanization exhibits an inverted U-shaped relationship, meaning that moderate economic growth targets help to promote new-type urbanization, but overly high targets may have a constraining effect [13]. In terms of the environment, the impact of new-type urbanization on resource pressure is also worth noting. There is an inverted U-shaped relationship between new-type urbanization and pressure on water resources and energy and food systems. China’s current level of urbanization has exceeded the threshold of the environmental Kuznets curve [15,16]. On the whole, China’s new-type urbanization strategy is conducive to economic growth, environmental optimization, narrowing the urban–rural gap, and sustainable regional development.

2.2. Measuring New-Type Urbanization

Traditional urbanization levels are measured mainly by a single indicator, namely the proportion of the urban population to the total population [17,18,19,20,21,22]. New-type urbanization is a comprehensive development model based on multiple dimensions, including people-oriented urban–rural coordination, sustainable development, and harmonious coexistence [23]. Therefore, scholars often use a comprehensive indicator system to measure the level of new-type urbanization [13,15,24,25]. Scholars generally select indicators from dimensions such as population, land, economy, society, and ecology and use subjective weighting methods and objective weighting methods to determine the weights of the indicators [26,27,28,29,30]. Subjective weighting methods include expert scoring methods and the Analytic Hierarchy Process (AHP), while objective weighting methods include entropy weighting methods and principal component analysis (PCA). Referring to the existing literature, this paper selects 19 indicators from the aspects of population, economy, society, land, and the environment and uses the CRITIC weighting method to determine the weights of the indicators to measure the level of new-type urbanization.

2.3. Research Scale of New-Type Urbanization

New-type urbanization is a complex, multi-level systemic process. Scholars have conducted detailed research from different spatial scales. A large body of literature focuses on three scales: national, regional, and urban. Lu (2015) and Chen et al. (2016) analyzed the background and challenges of China’s new-type urbanization from a national perspective [3,12]. The literature at the national scale emphasizes regional coordinated development and the development process of new-type urbanization. The provincial-level literature focuses on comparisons between different provinces and their own development processes [31,32,33,34]. Wang et al. (2023), Xia et al. (2024), and Xiao et al. (2023) quantitatively assessed the level of new-type urbanization in different provinces and compared the relationship between new-type urbanization and the environment and energy and food production in different provinces [31,32,33]. Wang et al. (2021) used Shandong Province as an example to analyze the coupling and coordination of urbanization, economy, and the environment, as well as the evolution process and trends [34]. A lot of the literature studies the differences in the level of new-type urbanization between different cities at the prefecture-level city scale [35,36,37,38,39]. Most of the literature at the prefecture level focuses on the impact of new-type urbanization on public service provision and urban resilience [36,37]. The number of documents at the county level is relatively small. Meng et al. (2024) studied the equalization of basic public services in county-level cities in the context of new-type urbanization [30]. In May 2022, the General Office of the Communist Party of China Central Committee and the General Office of the State Council issued the “Opinions on Promoting Urbanization with Counties as an Important Vehicle,” pointing out that county towns are an important part of China’s urban system and a key support for the integrated development of urban and rural areas and that urbanization should be implemented with counties as an important vehicle [40]. Based on this, this paper discusses the evolution and spatial–temporal differences in new-type urbanization from the county level.

2.4. New-Type Urbanization, Population Shrinkage, and Ageing

In many parts of the world, populations are ageing, and fertility rates have fallen to very low levels, leading to both population shrinkage and ageing [5,41,42]. Population shrinkage is attracting attention mainly through the phenomena of ageing and shrinking cities [5]. Unlike the concept of shrinking cities, the population shrinkage and ageing discussed in this article refer to changes in the demographic structure at the regional level, rather than in urbanized areas. Jarzebski et al. (2021) discussed the impact of population shrinkage and ageing on urban sustainability [5]. It is worth noting that an increase in the proportion of older people in a country may place greater economic and social pressure on the working-age population, thereby further reducing the birth rate and/or delaying childbearing, leading to population shrinkage [43]. Population growth has been at the heart of the debate on sustainable development and urbanization [44]. Population shrinkage and ageing pose significant challenges to urbanization but have received limited attention in policy and practice to date.
Based on the above literature review, this paper discusses the relationship between population shrinkage, ageing, and new-type urbanization at the county level. This paper aims to conduct the following: (1) Evaluate the spatial and temporal differences in the level of new-type urbanization in counties experiencing population shrinkage and ageing. (2) Explore the relationship between population shrinkage, ageing, and new-type urbanization at the county level.

3. Study Area and Methods

3.1. Study Area

The study area is Jilin Province in northeastern China, which spans 121°38′–131°19′ E and 40°50′–46°19′ N, covering an area of 187,400 km2 (Figure 1). Jilin Province is a typical example of population shrinkage and ageing in China. In 2014, the total population of Jilin Province was 27.524 million. By 2020, this had decreased to 25.771 million, and by 2023, it had further decreased to 23.3941 million. Between 2014 and 2020, Jilin Province’s total population decreased by 1.753 million, a decline of 6.37%, averaging approximately 300,000 people per year. Between 2020 and 2023, Jilin Province’s total population decreased by 2.3769 million, a significant decline of 9.22%, averaging approximately 800,000 people per year. The population shrinkage in Jilin Province is showing an accelerating trend. In 2014, the population aged 60 and above in Jilin Province was 4.6958 million, increasing to 6.0512 million in 2020 and further increasing to 6.2683 million in 2023. From 2014 to 2020, Jilin Province’s ageing rate was 17.23%, gradually increasing to 23.48% in 2020 and 26.79% in 2023, indicating that the province has entered a moderately ageing society. This paper mainly discusses the issue of new-type urbanization in counties against the backdrop of population shrinkage and ageing. Therefore, the research unit is the county, with a total of 39 county-level cities, of which 24 are located in eastern Jilin Province and 15 in the western part.

3.2. Methods

3.2.1. CRITIC

CRITIC is an objective weighting method proposed by Diakoulaki [45]. It comprehensively measures the objective weights of indicators by utilizing the comparison strength and correlation between indicators. Comparison strength is represented by standard deviation; the larger the standard deviation, the greater the volatility, and the higher the weight. Conflict is represented by the correlation coefficient; the larger the correlation coefficient between indicators, the smaller the conflict, and the lower the weight. When calculating weights, the comparison strength and conflict indicators are multiplied and normalized to obtain the final weight.
(1) Normalization of indicators. For positive indicators, the following is used:
x i j , = X i j m i n X 1 j , X 2 j , , X n j ) m a x X 1 j , X 2 j , , X n j ) m i n X 1 j , X 2 j , , X n j )
For negative indicators, the following is used:
x i j , = m a x X 1 j , X 2 j , , X n j ) X i j m a x X 1 j , X 2 j , , X n j ) m i n X 1 j , X 2 j , , X n j )
where x i j , represents standardized values. X i j represents the j th indicator for the i th county.
(2) Calculation of the comparative strength of indicators, expressed as standard deviation:
x ¯ j = 1 n i = 1 n x i j
S j = i = 1 n x i j x ¯ j 2 n 1
where S j represents the standard deviation of the j th indicator. x ¯ j represents the mean value of indicator j .
(3) Calculation of the conflict between indicators using the correlation coefficient:
R i j = n = 1 1 r i j
where R i j denotes conflict. r i j denotes the correlation coefficient between indicators i and j .
The correlation coefficient is used to express the correlation between indicators. The stronger the correlation with other indicators, the smaller the conflict between this indicator and other indicators, reflecting more of the same information and thus more repetitive evaluation content. This weakens the evaluation strength of this indicator to a certain extent, so the weight assigned to this indicator should be reduced.
(4) Calculation of information content based on standard deviation and the correlation coefficient:
C j = S j n = 1 p 1 r i j
where C j denotes information content. The larger C j is, the greater the role of the jth indicator in the entire evaluation indicator system, and the more weight it should be assigned.
(5) Calculation of objective weights:
W j = C j j = 1 p C j
where W j represents the weight of the j th indicator.

3.2.2. The Calculation of the Level of New-Type Urbanization

U c = W c 1 X c 1 + W c 2 X c 2 + + W c n X c n
where U c is the new-type urbanization level of county c , X c n is the standardized value of the nth indicator of county c , and W c n is the weight of the nth indicator of county c .

3.2.3. Measurement of Population Shrinkage

Population growth and shrinkage are expressed by the rate of change in the total population of a county [46]. The formula is as follows:
R c = R c t + n R c t R c t × 100 %
where R c is the population change rate in county c , while R c t + n and R c t are the total population in county c in periods t + n and t , respectively.
Due to the large difference in population size between China and Western countries, the criteria for classifying the degree of population shrinkage mainly refer to the literature of Chinese scholars [47]. Scholars generally use −2% and −5% to distinguish between moderate and severe shrinkage. Considering that the population decline in Jilin Province is more significant, this paper uses −5% and −10% to distinguish between moderate and severe shrinkage. This paper classifies the degree of population change into four categories: −5% ≤ R c < 0 is mild shrinkage, −10% ≤ R c < −5% is moderate shrinkage, R c < −10% is severe shrinkage, and R c > 0 is population growth.

3.2.4. Measurement of Ageing

This paper uses the proportion of the population aged 60 and above to measure the degree of ageing. Referring to international standards for classifying population ageing [48], a proportion of 10% of the population aged 60 and above is considered mild ageing; a proportion of 20% is considered moderate ageing; and a proportion of 30% is considered severe ageing.

3.2.5. Bivariate Spatial Autocorrelation

This paper uses the bivariate spatial autocorrelation measure to examine the relationship between the average level of new-type urbanization from 2014 to 2020 and the average annual population change rate and average annual ageing level. The formula is as follows:
x ¯ = 1 n i = 1 n x i
I = n i = 1 n j = 1 n W i j x i x ¯ x j x ¯ i = 1 n j = 1 n W i j i = 1 n x i x ¯ 2
where I denotes the value of Moran’s I. n denotes the number of counties. x i and x j denote the attribute values of counties i and j , respectively. x ¯ represents the mean value. W i j represents the spatial weight matrix.

3.3. Index System

New-type urbanization is people-centred urbanization, emphasizing a shift from “land urbanization” to “human urbanization” [1]. The proportion of the urban population in the total population is the main indicator for measuring the level of urbanization. In the context of new-type urbanization, in order to highlight “human urbanization,” the indicators for measuring the level of urbanization are gradually becoming more comprehensive. Referring to the existing literature [4,13,32], this paper selects 19 indicators from five aspects, namely population, economy, society, land, and the environment, to comprehensively evaluate the level of new-type urbanization in counties. Population urbanization remains an important indicator for measuring the level of urbanization. Two indicators are selected: the proportion of the urban population in the total population and the proportion of employees in the secondary and tertiary industries. Economic development provides support for new-type urbanization in terms of financing and consumption. Five indicators were selected: per capita GDP, the proportion of the secondary and tertiary industries in GDP, the total retail sales of consumer goods, the fixed-asset investment growth rate, and the number of enterprises of a designated size. Social urbanization is an important manifestation of “human urbanization” and involves many dimensions. Therefore, this paper selects eight indicators to measure social urbanization: the proportion of general public service expenditure, per capita disposable annual income of urban households, total number of schools of all types and levels, number of beds in medical and health institutions, number of urban residents receiving minimum living allowances, participation rate in basic pension insurance for urban employees, total number of books and periodicals in the library, and the percentage of public safety expenditure. Although new-type urbanization has shifted from land-oriented to population-oriented, land is still the carrier of urbanization and continues to play a very important role. Two indicators were selected: urban construction land development speed and urban construction land development intensity. Environmental urbanization reflects the quality and sustainability of new-type urbanization. Two indicators were selected: the percentage of expenditure on energy conservation and protection and the number of sewage treatment plants. The weights of the indicators are determined using the critic method, as shown in Table 1.

3.4. Data Sources and Processing

The data on the total population and elderly population of counties are from the Jilin Statistical Yearbook (2015–2021). The data on new-type urbanization are from the Jilin Statistical Yearbook (2015–2021) and the National Economic and Social Development Statistical Bulletin (2014–2020) of each county. Missing data for some years are filled in using linear interpolation. The land cover data is sourced from the annual land cover data for China with a resolution of 30 m from 1985 to 2023, published by Professors Yang Jie and Huang Xin of Wuhan University [49]. We first obtained the impervious layer and used a mask to extract the impervious layer of counties in Jilin Province. Then, we combined the POI location data of county towns and townships to obtain the contiguous urban construction land in counties in Jilin Province from 2014 to 2020. The POI data came from Amap (https://lbs.amap.com/). Finally, we calculated the development speed and intensity of urban construction land. Urban construction land development speed refers to the annual growth rate of urban construction land; urban construction land development intensity refers to the proportion of urban construction land in the total area of the county.

4. Results

4.1. Spatio-Temporal Patterns of Population Shrinkage and Ageing in Counties

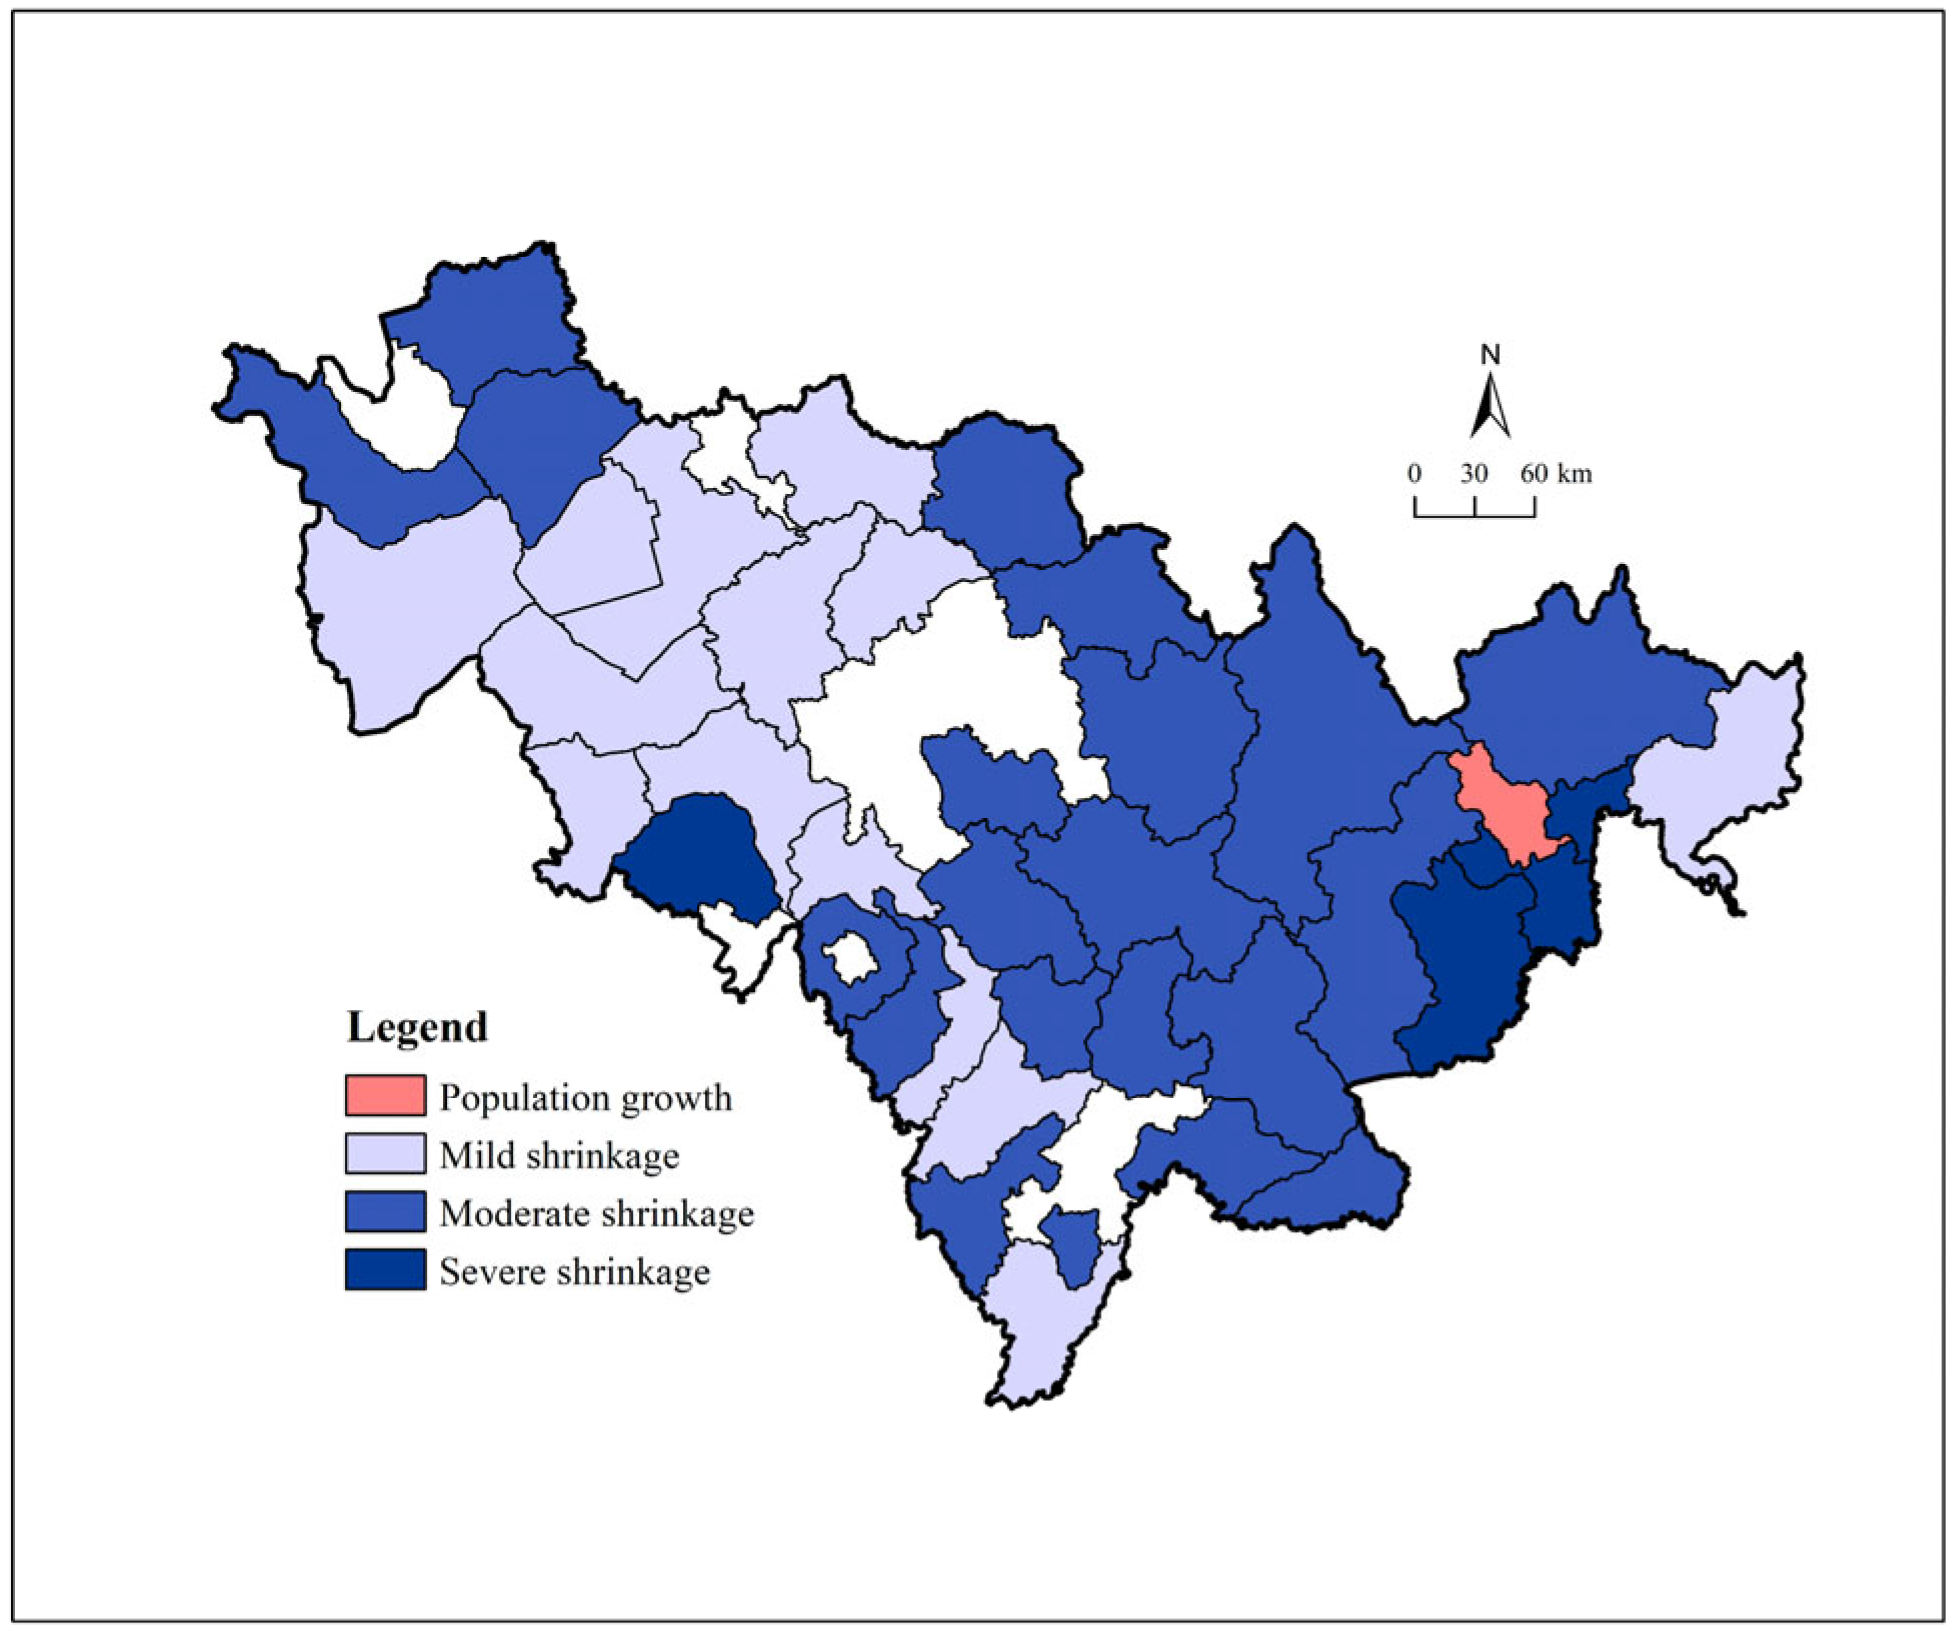
4.1.1. Population Shrinkage
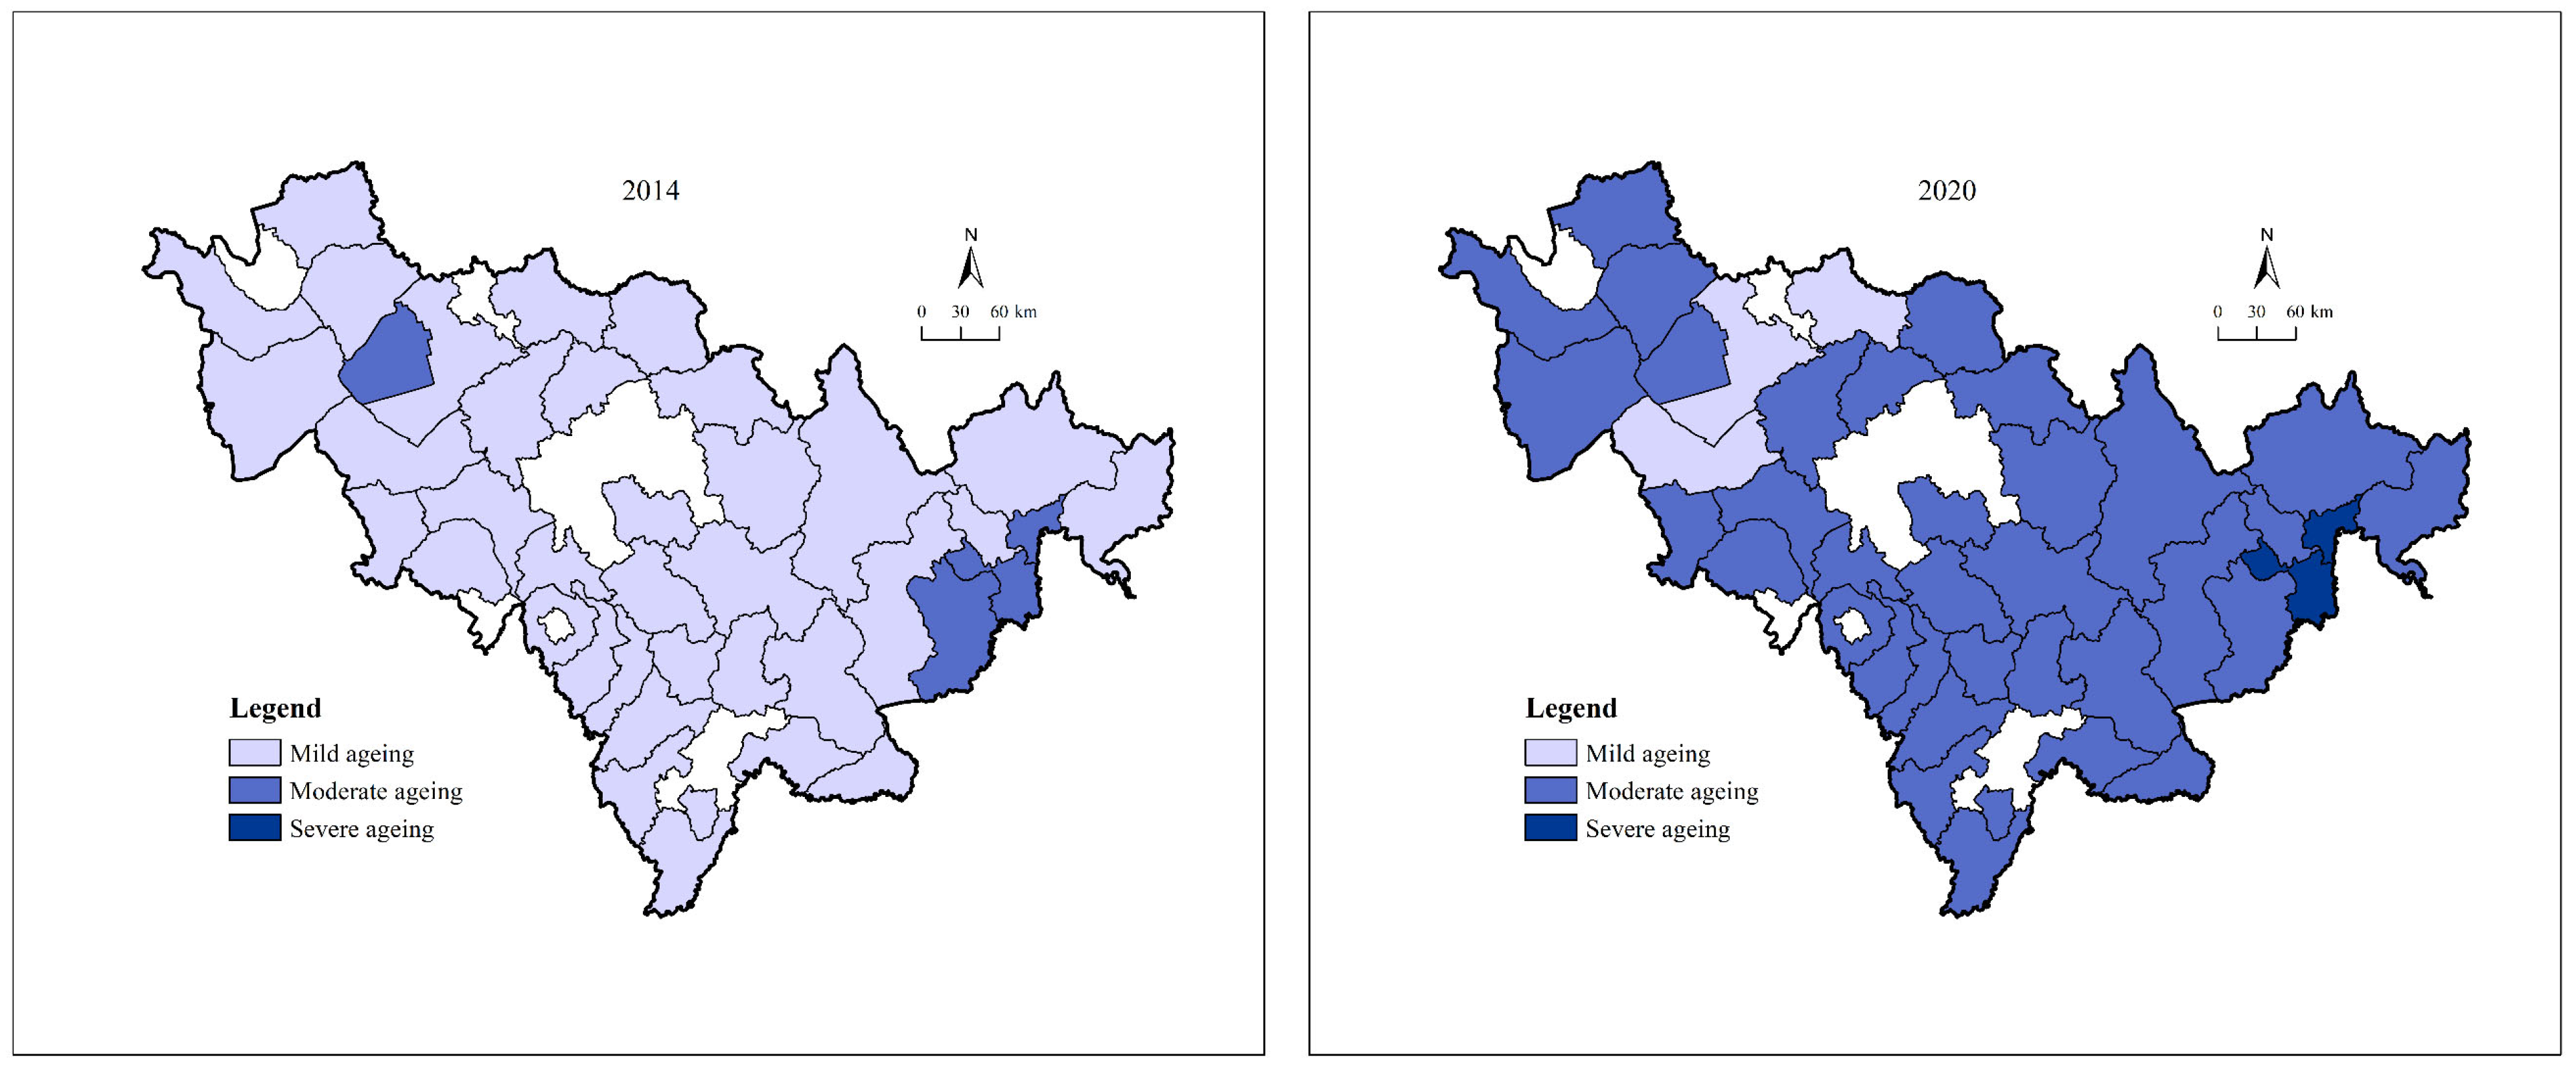
The population of the counties in Jilin Province decreased by a total of 961 thousand people, or 5.52% in 2014–2020. The counties, in general, are in a state of moderate shrinkage. From 2014 to 2020, 38 out of the 39 counties in Jilin Province experienced population shrinkage. Only one county’s population is growing, namely Yanji, which is the seat of the state government and the political, economic and cultural centre of the Yanbian Korean Autonomous Prefecture. The shrinking counties are dominated by moderate shrinkage, with 20 counties, or 52.63%, in total. There are 14 counties with mild shrinkage, accounting for 36.84% of the total. The other four counties are in the severe shrinkage category. Overall, the eastern counties of Jilin Province experienced a higher degree of population shrinkage than the western counties (Figure 2). The eastern counties are dominated by severe and moderate shrinkage, while the western counties are dominated by mild shrinkage. Three of the four severe shrinkage counties are located in the eastern region. Four-fifths of the counties with moderate shrinkage are located in the eastern region, while 71.43% of the counties with mild shrinkage are located in the western region.

4.1.2. Ageing

Whether in 2014 or in 2020, all counties in Jilin Province have showed varying degrees of ageing. From 2014 to 2020, the ageing rate in the counties of Jilin Province rose from 17.22% to 22.96%, and the population of the elderly over 60 years old increased by 1,779,200, or by as much as 59.40%, moving from a mildly ageing society to a moderately ageing society. In 2014, 35 of the 39 counties were in a mildly ageing society, while 34 counties were in a moderately ageing society in 2020. During this period, the number of counties with moderate ageing increased by 30, the number of counties with mild ageing decreased by 32, and the number of counties with severe ageing increased from zero to two. In 2014, mildly ageing counties were widely distributed in Jilin Province, while 75% of moderately ageing counties were located in eastern Jilin Province (Figure 3). By 2020, moderately ageing counties were widely distributed in Jilin Province, and there were more moderately ageing counties in the east than in the west. The two severely ageing counties are all located in eastern Jilin Province, and both evolved from moderately ageing counties. Overall, counties in eastern Jilin Province have a higher degree of ageing than those in the west.

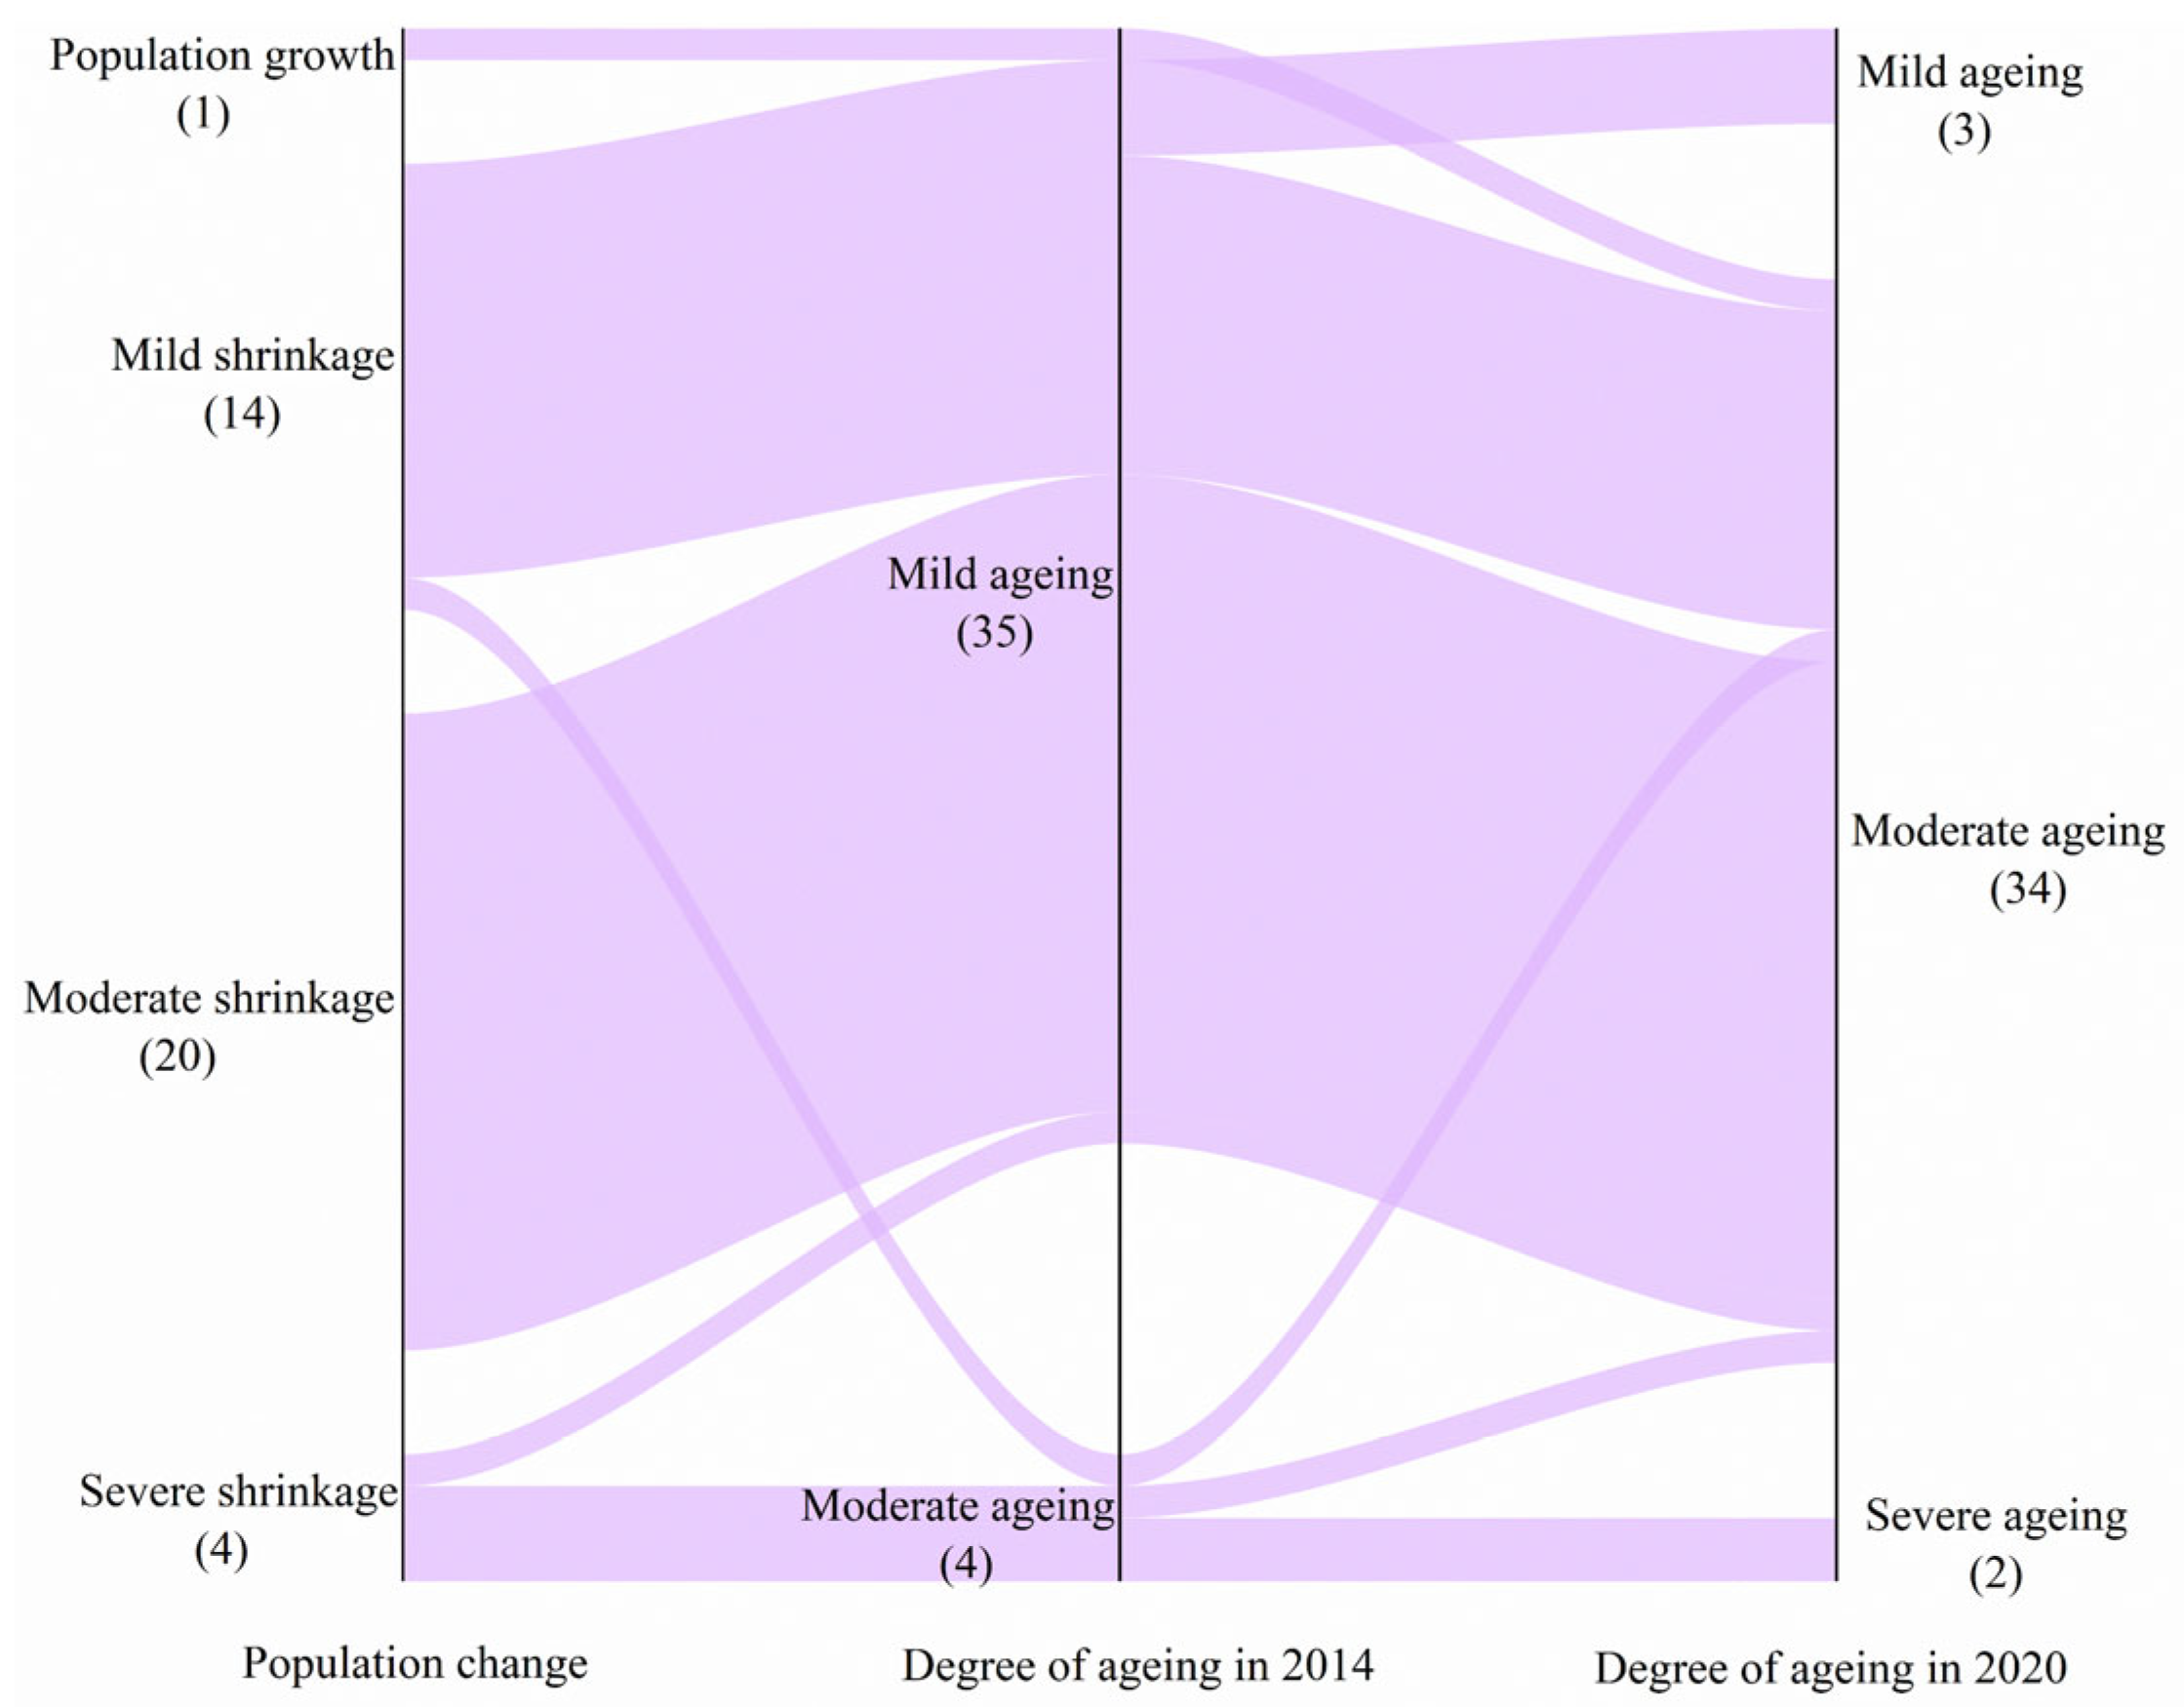
4.1.3. Relationship Between Population Change and Ageing

Between 2014 and 2020, 87.18% of counties show an increase in ageing, regardless of population change (Figure 4). Ten of the counties with mild shrinkage shifted from mild ageing in 2014 to moderate ageing in 2020, or 71.43%. All of the counties with moderate shrinkage shifted from mild ageing to moderate ageing. Half of the severely shrinking counties shifted from moderate ageing in 2014 to severe ageing in 2020. Ageing has similarly deepened in the population growth counties, shifting from mild to moderate ageing. In general, the ageing trend is most pronounced in the moderately shrinking counties, followed by the mildly shrinking counties, and then the severely shrinking counties.

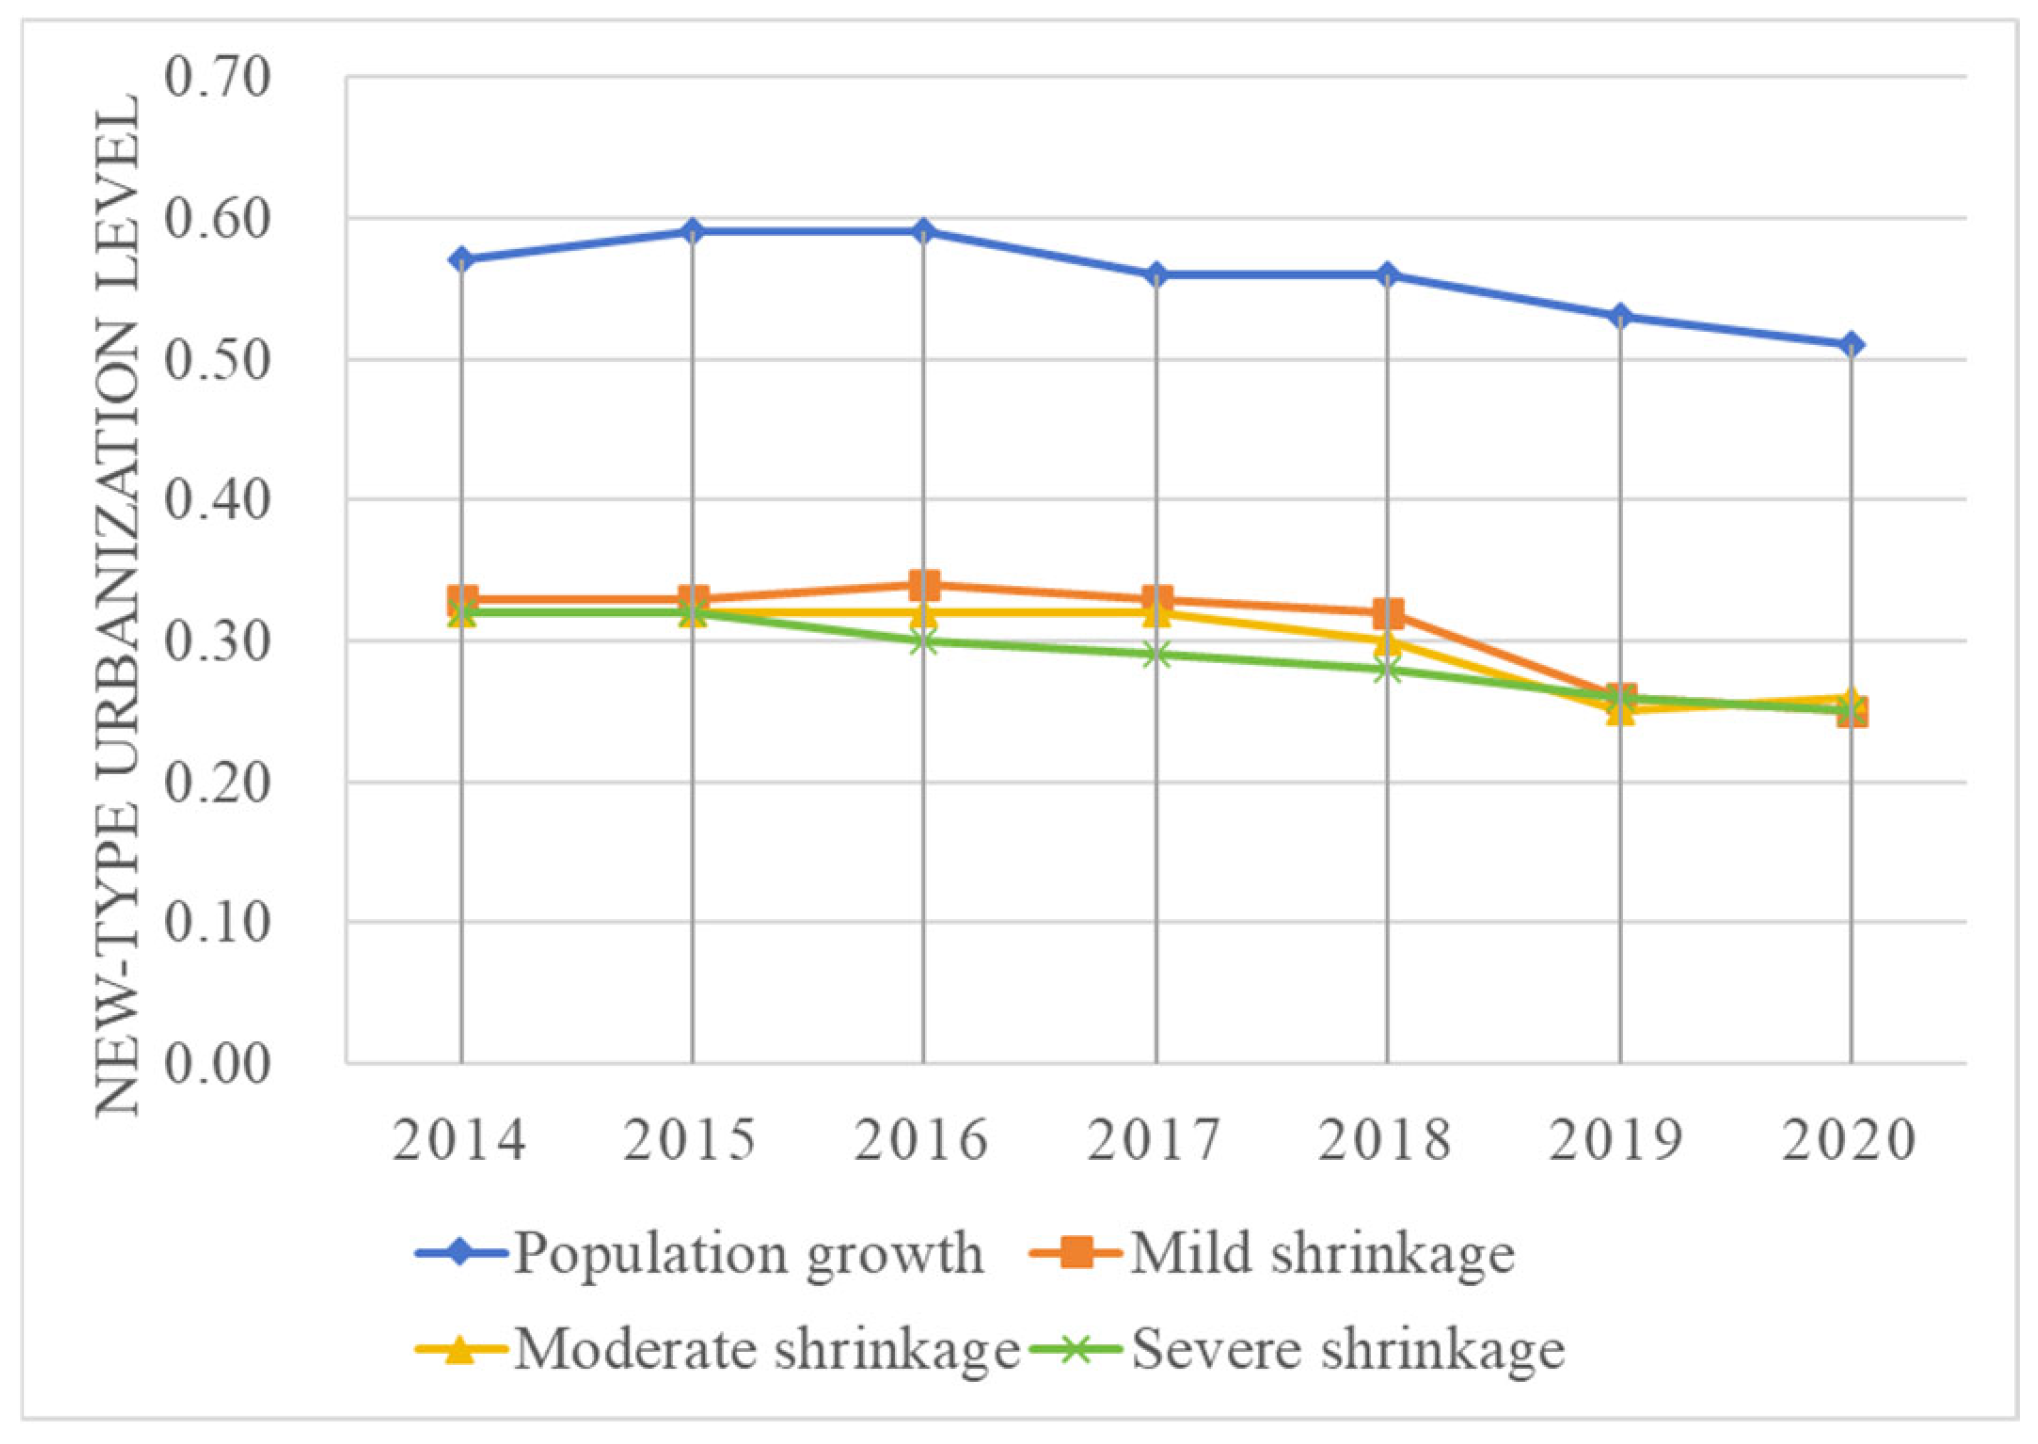
4.2. Spatio-Temporal Patterns of New-Type Urbanization Levels in Counties

In general, the level of new-type urbanization in the counties of Jilin Province in 2014–2020 is low, with an average value of only 0.31, a maximum value of 0.59 in Yanji in 2016, and a minimum value of 0.17 in Tongyu in 2020 (Table 2). Similarly to the trend in population shrinkage and ageing, the level of new-type urbanization in the counties of Jilin Province was generally on a downward trend from 2014 to 2020, except for Meihekou. Even Yanji, which has the highest level of new-type urbanization, showed a downward trend, from 0.57 in 2014 to 0.51 in 2020. The average level of new-type urbanization in counties decreased from 0.33 in 2014 to 0.26 in 2020.
Almost all counties saw a decline in the level of new-type urbanization from 2014 to 2020. In 2014, 14 counties had a level of new-type urbanization below 0.30, which increased to 30 by 2020. The number of counties with a new-type urbanization level of 0.30–0.40 decreased from 23 in 2014 to 8 in 2020. From 2014 to 2020, the level of new-type urbanization in the counties of Jilin Province showed a decreasing trend from east to west (Figure 5). In 2014, the level of new-type urbanization in the eastern and western counties of Jilin Province was close. However, the decline in the level of new-type urbanization in the western counties of Jilin Province was more pronounced compared to the eastern counties in 2020.

4.3. Relationship Between Population Shrinkage, Ageing, and New-Type Urbanization

Using the bivariate spatial autocorrelation method, Moran’s I for the average level of new-type urbanization and the average annual population change rate from 2014 to 2020 was 0.343 (p-value was 0.003; z-score was 3.7945). In other words, the higher the population change rate, the higher the level of new-type urbanization. That is, there is a clear positive correlation between the degree of population shrinkage and the level of new-type urbanization. The more severe the population shrinkage, the lower the level of new-type urbanization (Figure 6). In each year from 2014 to 2020, the average level of new-type urbanization is the highest in counties with population growth, followed by counties with mild shrinkage, then counties with moderate shrinkage, and finally counties with severe shrinkage.
Moran’s I for the average ageing rate and the average level of new-type urbanization from 2014 to 2020 was −0.228 (p-value was 0.01; z-score was −2.5940). There is a positive correlation between ageing and the level of new-type urbanization. In other words, the more severe the ageing, the lower the level of new-type urbanization. Except for 2019 and 2020, the level of new-type urbanization was the highest in counties with mild ageing in Jilin Province, followed by counties with moderate ageing and then counties with severe ageing (Figure 7). Beginning in 2019, the relationship between ageing and new-type urbanization reversed. That is, the higher the degree of ageing, the higher the level of new-type urbanization.

5. Discussion

In November 2012, the Chinese government proposed the new-type urbanization strategy, marking a shift from traditional land-oriented urbanization to a new type of people-oriented urbanization [4]. In 2014, the Central Committee of the Communist Party of China and the State Council issued the National New-Type Urbanization Plan (2014–2020). Now, this plan is fully implemented. At the same time, the Chinese government is vigorously promoting urbanization centred on counties [40]. However, some counties are experiencing population shrinkage and ageing, which may greatly reduce the effectiveness of the new-type urbanization strategy. Therefore, this paper selects Jilin Province, which has experienced significant population shrinkage and ageing, as a case study, to evaluate the evolution of new-type urbanization at the county level and its relationship with population shrinkage and ageing.
Almost all counties in Jilin Province have experienced population shrinkage, except for Yanji City. Similarly to the findings of other studies, population shrinkage has become a trend in some regions [5,43,50,51]. Faced with continued population loss, the sustainable development and new-type urbanization of counties will be affected. Population shrinkage will exacerbate regional ageing, and our findings confirm this conclusion. Like other regions [52], all counties in Jilin Province are experiencing the phenomenon of ageing, and the trend is intensifying. Population shrinkage and ageing present a vicious cycle. Population shrinkage in Jilin Province is often caused by industrial decline. The decline of the industry has led to a reduction in employment opportunities, which in turn has triggered the migration of the working-age population. The loss of young and middle-aged people has changed the population structure and exacerbated ageing. Our study also found a certain correlation between population shrinkage and ageing. The phenomenon of ageing is the most evident in counties with moderate population shrinkage, followed by counties with slight population shrinkage. With the adjustment of China’s economic structure, the traditional industries in Northeast China have lost their competitive edge, while emerging industries have not been sufficiently developed, leading to a sharp decline in employment opportunities and forcing a large number of workers to migrate elsewhere. At the same time, resource-depleted cities face industrial decline, further exacerbating population loss. Economic transition difficulties, resource depletion, and reduced employment opportunities are the main causes of population shrinkage in Northeast China, which have led to the migration of young and middle-aged workers, thereby exacerbating the ageing of the population.
After the implementation of the new-type urbanization strategy, the level of new-type urbanization in most regions has been continuously improving [4,12,13,14]. Contrary to the findings of most studies, our research shows that the level of new-type urbanization in most counties in Jilin Province first rose and then declined. Although counties are important vehicles for urbanization, most of them are covered by rural areas. The capacity of county seats is insufficient to drive the process of new-type urbanization in counties. Moreover, population shrinkage and ageing severely constrain the development of new-type urbanization. Our study proves that population shrinkage and ageing are positively correlated with new-type urbanization. The more severe the population shrinkage or ageing, the lower the level of new-type urbanization. Human resources are an important driving force for regional development, and the ageing demographic structure and decline in the young and middle-aged workforce will inevitably affect the process of urbanization. In addition, county-level governments face dual pressures stemming from “population outflow” and “urbanization objectives”. On one hand, national urbanization plans emphasize enhancing the quality of public services (e.g., healthcare and education), yet population decline leads to reduced tax revenues and increased fiscal strain. On the other hand, to meet performance targets (such as growth in fixed-asset investment), local governments may overemphasize land-based development, thereby deviating from the central principle of “people-centred” urbanization. This contradiction is especially evident in resource-depleted counties in Jilin Province (e.g., Liaoyuan and Baishan), which further impedes improvements in urbanization quality.
Faced with population shrinkage and ageing, as well as a decline in the level of new-type urbanization, counties in Jilin Province urgently need to solve this difficult problem to promote sustainable regional development. First, local governments need to face and accept issues such as population shrinkage, ageing, and the declining levels of new-type urbanization. Second, local governments need to take measures to alleviate population loss, such as improving public services, paying attention to vulnerable groups, and increasing the happiness and satisfaction of the resident population. Third, local governments need to take measures to retain their population and attract newcomers, such as increasing labour-intensive industries and introducing new industries. Fourth, the development of urbanization in counties requires more policy support from the national and provincial levels. Fifth, the government needs to work with social forces such as enterprises and individuals to promote the healthy development of population and urbanization. Sixth, eastern and western counties should adopt differentiated development strategies. Eastern counties face more serious population shrinkage, ageing, and new-type urbanization challenges, requiring more policy and financial support from the central and provincial governments. Eastern counties are mainly mountainous, with a beautiful ecological environment, making them suitable for the development of specialized forest-based economies and tourism. Eastern counties should control the disorderly expansion of urban construction land, focus on improving the level of public services in county seats, and apply the theory of compact cities. The terrain in the western counties is flat, consisting mainly of farmland and saline–alkali land. On the one hand, western counties should vigorously develop modern agriculture, extend industrial chains, and enhance the level of industrial integration and product added value. On the other hand, western counties can utilize saline–alkali land to develop new energy industries such as wind power and photovoltaic power. For urban development, western counties should also focus on the development of county seats, enhance their carrying capacity, and retain their population and attract newcomers.

6. Conclusions

This paper focuses on the development process of new-type urbanization in areas experiencing population shrinkage and ageing. Taking Jilin Province in China as an example, this paper discusses the spatial–temporal evolution of population shrinkage and ageing, the development of new-type urbanization, and its relationship with population shrinkage and ageing from the perspective of the county level. The conclusions are as follows:
(1) It is necessary to study population shrinkage, ageing, and new-type urbanization from the county level. (2) Jilin Province’s counties have experienced significant population shrinkage and ageing, and these trends are intensifying. Furthermore, the more severe the population shrinkage, the more severe the ageing. (3) Against the backdrop of population shrinkage and ageing, the level of new-type urbanization in Jilin Province’s counties is generally low and shows a change process of first rising and then falling. (4) Population shrinkage and ageing are positively correlated with new-type urbanization. That is, the more severe the population shrinkage or ageing, the lower the level of new-type urbanization.
While this study has some interesting and valuable findings, there are still some limitations. This paper focuses only on new-type urbanization in areas experiencing population shrinkage and ageing. In the future, comparative studies should be conducted on new-type urbanization in counties with population growth and healthy population structures in order to obtain more valuable findings. Considering that the aim is to evaluate the effects of the implementation of the National New-Type Urbanization Plan (2014–2020), the research period was set as 2014–2020. The National New-Type Urbanization Plan (2021–2035) has already been implemented, and we will conduct follow-up research in the future to extend the research period.

Author Contributions

Conceptualization, G.Z. and P.Z.; methodology, G.Z.; software, G.Z.; validation, Z.M.; formal analysis, G.Z.; resources, G.Z. and Z.M.; data curation, G.Z.; writing—original draft preparation, G.Z.; writing—review and editing, G.Z. and P.Z.; funding acquisition, G.Z. All authors have read and agreed to the published version of the manuscript.

Funding

This research was funded by Science and Technology Development Plan Project of Jilin Province, China, grant number 20220508025RC.

Data Availability Statement

The data presented in this study are available on request from the corresponding author.

Conflicts of Interest

The authors declare no conflicts of interest.

References

  1. Zhang, J.; Wang, G.; Li, J.; Lu, Q. Population changes in urbanization progress and the influence on land use in Suizhou City. Prog. Geogr. 2004, 23, 87–96. (In Chinese) [Google Scholar]
  2. Cao, G.; Liu, T. Rising role of inland regions in China’s urbanization in the 21st century: The new trend and its explanation. Acta Geogr. Sin. 2011, 66, 1631–1643. (In Chinese) [Google Scholar]
  3. Lu, D.; Chen, M. Several viewpoints on the background of compiling the “National New Urbanization Planning (2014–2020)”. Acta Geogr. Sin. 2015, 70, 179–185. (In Chinese) [Google Scholar]
  4. Chen, M.; Liu, W.; Lu, D.; Chen, H.; Ye, C. Progress of China’s new-type urbanization construction since 2014: A preliminary assessment. Cities 2018, 78, 180–193. [Google Scholar] [CrossRef]
  5. Jarzebski, M.P.; Elmqvist, T.; Gasparatos, A.; Fukushi, K.; Eckersten, S.; Haase, D.; Goddness, J.; Khoshkar, S.; Saito, O.; Takeuchi, K.; et al. Ageing and population shrinking: Implications for sustainability in the urban century. Npj Urban Sustain. 2021, 1, 17. [Google Scholar] [CrossRef]
  6. Dorigo, G.; Tobler, W. Push-Pull Migration Laws. Ann. Assoc. Am. Geogr. 1983, 73, 1–17. [Google Scholar] [CrossRef]
  7. Majelantle, R.G.; Navaneetham, K. Migration and fertility: A review of theories and evidences. J. Glob. Econ. 2013, 1, 1000101. [Google Scholar] [CrossRef]
  8. Chaudhuri, S.; Mukhopadhyay, U. The Harris–Todaro Migration Model and Introduction of the Informal Sector. In Revisiting the Informal Sector; Springer: New York, NY, USA, 2010. [Google Scholar]
  9. Ghosh, D. The metamorphosis of Lewis’s dual economy model. J. Econ. Methodol. 2007, 14, 5–25. [Google Scholar] [CrossRef]
  10. Yan, D.; Sun, W.; Li, P.; Liu, C.; Li, Y. Effects of economic growth target on the urban–rural income gap in China: An empirical study based on the urban bias theory. Cities 2025, 156, 105518. [Google Scholar] [CrossRef]
  11. Bai, X.; Shi, P.; Liu, Y. Society: Realizing China’s urban dream. Nature 2014, 509, 158–160. [Google Scholar] [CrossRef] [PubMed]
  12. Chen, M.; Liu, W.; Lu, D. Challenges and the way forward in China’s new-type urbanization. Land Use Policy 2016, 55, 334–339. [Google Scholar] [CrossRef]
  13. Deng, B.; Zhong, F. Leading or constraining? Development of new-type urbanization under economic growth targets. Land 2023, 12, 916. [Google Scholar] [CrossRef]
  14. Chen, M.; Gong, Y.; Lu, D.; Ye, C. Build a people-oriented urbanization: China’s new-type urbanization dream and Anhui model. Land Use Policy 2016, 80, 1–9. [Google Scholar] [CrossRef]
  15. Huang, M.; Guo, Q.; Zhang, G.; Tang, Y.; Wu, X. Spatiotemporal coupling of new-type urbanization and ecosystem services in the Huaihe River Basin, China: Heterogeneity and regulatory strategy. Land 2025, 14, 286. [Google Scholar] [CrossRef]
  16. Yu, Y.; Zhao, K.; Du, Y. Nexus between new-type urbanization, economic development, and haze pollution in China: A spatial analysis. J. Urban Plan. Dev. 2024, 150, 04024043. [Google Scholar] [CrossRef]
  17. Nichol, J.E.; King, B.; Ding, X.L. Sustainable urbanization. Int. J. Remote Sens. 2013, 34, 755–758. [Google Scholar] [CrossRef]
  18. Chen, M.; Liu, W.; Tao, X. Evolution and assessment on China’s urbanization 1960–2010: Under-urbanization or over-urbanization? Habitat Int. 2013, 38, 25–33. [Google Scholar] [CrossRef]
  19. Mulligan, G.F. Revisiting the urbanization curve. Cities 2013, 32, 113–122. [Google Scholar] [CrossRef]
  20. Yang, X. China’s rapid urbanization. Science 2013, 342, 310. [Google Scholar] [CrossRef]
  21. Yang, D.F.; Yin, C.Z.; Long, Y. Urbanization and sustainability in China: An analysis based on the urbanization Kuznets-curve. Plan. Theory 2013, 12, 391–405. [Google Scholar] [CrossRef]
  22. Merrifield, A. The urban question under planetary urbanization. Int. J. Urban Reg. Res. 2013, 37, 909–922. [Google Scholar] [CrossRef]
  23. Chen, M.; Zhou, Y.; Huang, X.; Ye, C. The integration of new-type urbanization and rural revitalization strategies in China: Origin, reality and future trends. Land 2021, 10, 207. [Google Scholar] [CrossRef]
  24. Cao, N.; Ling, S.; Cui, X. Measurement and comparative analysis of Chinese new-type urbanization and eco-environment system coordination. Sustainability 2025, 17, 1824. [Google Scholar] [CrossRef]
  25. Li, P.; Li, T. Spatiotemporal analysis of ecosystem services and the impact of new-type urbanization: A case study of Chengdu, China. Ecol. Indic. 2025, 171, 113191. [Google Scholar] [CrossRef]
  26. Lin, B.; Zhu, J. Impact of new-type urbanization on energy intensity: A city-level analysis. Energy Econ. 2021, 99, 105292. [Google Scholar] [CrossRef]
  27. Liu, J.; Ma, X.; Jia, W.; Zhang, S. Can new-type urbanization construction narrow the urban-rural income gap? Evidence from China. Sustainability 2022, 14, 14725. [Google Scholar] [CrossRef]
  28. Lu, Y.; Song, W.; Lyu, Q. Assessing the effects of the new-type urbanization policy on rural settlement evolution using a multiagent model. Habitat Int. 2022, 127, 102622. [Google Scholar] [CrossRef]
  29. Ma, H.; Wang, K.; Fang, C. How does new-type urbanization promote green development efficiency in China? The mediating role of governments, enterprises, and residents. J. Environ. Manag. 2025, 6, 100241. [Google Scholar] [CrossRef]
  30. Meng, Y.; Hao, Z.; Shang, S. Analysis of the equalization effect of basic public services in new-type urbanization: A case study of county regions in Guizhou, China. Heliyon 2024, 10, e39922. [Google Scholar] [CrossRef]
  31. Wang, J.; Han, S.; Lin, H.; Wu, P.; Yuan, J. New-type urbanization ecologically reshaping China. Heliyon 2023, 9, e12925. [Google Scholar] [CrossRef]
  32. Xia, Q.; Tian, G.; Zhao, D.; Zhao, Q.; Varis, O. Effects of new-type urbanization on resource pressure: Evidence from a water-energy-food system perspective in China. Sustain. Cities Soc. 2024, 107, 105411. [Google Scholar] [CrossRef]
  33. Xiao, Y.; Huang, H.; Qian, X.; Zhang, L.; An, B. Can new-type urbanization reduce urban building carbon emissions? New evidence from China. Sustain. Cities Society 2023, 90, 104410. [Google Scholar] [CrossRef]
  34. Wang, Y.; Geng, Q.; Si, X.; Kan, L. Coupling and coordination analysis of urbanization, economy and environment of Shandong Province, China. Environ. Dev. Sustain. 2021, 23, 10397–10415. [Google Scholar] [CrossRef]
  35. Wang, Y.; Wang, L. New-type urbanization and rural revitalization: A study on the coupled development of the Yangtze River Economic Belt, China. PLoS ONE 2025, 20, e0314724. [Google Scholar] [CrossRef]
  36. Yu, J.; Hu, W.; Hou, L. Towards more resilient cities—Analyzing the impact of new-type urbanization on urban resilience: Considering spatial spillover boundaries. Sustain. Cities Soc. 2024, 114, 105735. [Google Scholar] [CrossRef]
  37. Yuan, C.; Zhang, B.; Xu, J.; Lyu, D.; Liu, J.; Hu, Z.; Han, Y. Impact of new-type urbanization pilot policy on public service provision: Evidence from China. Cities 2025, 161, 105853. [Google Scholar] [CrossRef]
  38. Zhang, Q.; Kong, Q.; Zhang, M.; Huang, H. New-type urbanization and ecological wellbeing performance: A coupling coordination analysis in the middle reaches of the Yangtze River urban agglomerations, China. Ecol. Indic. 2024, 159, 111678. [Google Scholar] [CrossRef]
  39. Zhang, S.; Huang, C.; Li, X.; Song, M. The spatial-temporal evolution and influencing factors of the coupling coordination of new-type urbanization and ecosystem services value in the Yellow River Basin. Ecol. Indic. 2024, 166, 112300. [Google Scholar] [CrossRef]
  40. Zhou, R.; Guo, Y.; Wu, Y. Exploration on the innovation model of county urbanization development with the resource constraints in China. Sustainability 2023, 15, 16129. [Google Scholar] [CrossRef]
  41. UN. Population Dynamics. World Population Dynamics. World Population Prospects 2019 Revision; United Nations: New York, NY, USA, 2019. [Google Scholar]
  42. UN. World Population Ageing 2019: Highlights; United Nations: New York, NY, USA, 2019. [Google Scholar]
  43. Bricker, D.; Ibbitson, J. Empty Planet: The Shock of Global Population Decline; Random House Audio: Woodland Hills, CA, USA, 2019. [Google Scholar]
  44. De Sherbinin, A.; Carr, D.; Cassels, S.; Jiang, L. Population and environment. Annu. Rev. Environ. Resour. 2007, 32, 345–373. [Google Scholar] [CrossRef]
  45. Wang, L.; Yuan, M.; Li, H.; Chen, X. Exploring the coupling coordination of urban ecological resilience and new-type urbanization: The case of China’s Chengdu–Chongqing Economic Circle. Environ. Technol. Innov. 2023, 32, 103372. [Google Scholar] [CrossRef]
  46. Xie, M.; Feng, Z.; Guan, H.; Hao, F.; Wang, S.; Chang, X. Population shrinkage and its influence on housing prices: A mediation perspective based on commercial amenities. Habitat Int. 2024, 151, 103151. [Google Scholar] [CrossRef]
  47. Gao, W.; Yang, L.; Zhao, X.; Li, T. Spatiotemporal patterns and influencing factors of population shrinkage in the Yellow River Basin from the perspective of the Major Function Oriented Zone. Geogr. Res. 2025, 44, 1565–1586. (In Chinese) [Google Scholar]
  48. Wang, H.; Chen, H. Aging in China: Challenges and Opportunities. China CDC Wkly 2022, 4, 601–602. [Google Scholar]
  49. Yang, J.; Huang, X. The 30m annual land cover datasets and its dynamics in China from 1985 to 2023. Earth Syst. Sci. Data 2024, 13, 3907–3925. [Google Scholar] [CrossRef]
  50. Zou, Y.; Zhu, X.; Pu, C. Four decades of population expansion and shrinkage across Chinese cities. Environ. Plan. B-Urban Anal. City Sci. 2025, 52, 1271–1274. [Google Scholar] [CrossRef]
  51. Li, H.; Lo, K.; Zhang, P. Population shrinkage in resource-dependent cities in China: Processes, patterns and drivers. Chin. Geogr. Sci. 2019, 30, 1–15. [Google Scholar] [CrossRef]
  52. Ao, R.; Chang, L. Influencing mechanism of regional ageing in China based on the Structural Equation Model. Acta Geogr. Sin. 2020, 75, 1572–1584. (In Chinese) [Google Scholar]
Figure 1. Study area.
Land 14 01474 g001
Figure 2. Spatial patterns of population shrinkage in the counties of Jilin province.
Land 14 01474 g002
Figure 3. Spatial patterns of ageing in the counties of Jilin Province.
Land 14 01474 g003
Figure 4. The evolution of ageing in the context of population shrinkage.
Land 14 01474 g004
Figure 5. Spatial evolution of new-type urbanization levels.
Land 14 01474 g005
Figure 6. Relationship between population shrinkage and new-type urbanization.
Land 14 01474 g006
Figure 7. Relationship between ageing and new-type urbanization.
Land 14 01474 g007
Table 1. New-type urbanization index system.
Primary IndicatorsSecondary IndicatorsWeightingStandard DeviationConflictInformation
PopulationProportion of urban population in total population (%)7.24%0.2415.913.82
Proportion of employees in the secondary and tertiary industries (%)3.84%0.1414.492.02
EconomyPer capita GDP (Yuan per person)6.13%0.2214.483.23
Proportion of the secondary and tertiary industries in GDP (%)5.53%0.1915.002.92
Total retail sales of consumer goods (CNY ten thousand)5.53%0.2114.162.92
Fixed-asset investment growth rate (%)3.56%0.1117.301.88
Number of enterprises of designated size (units)6.53%0.2215.353.44
SocietyProportion of general public service expenditure (%)4.74%0.1517.142.50
Per capita disposable annual income of urban households (Yuan per person)4.64%0.1417.452.45
Total number of schools of all types and levels (units)8.59%0.2418.724.53
Number of beds in medical and health institutions (units)5.37%0.1815.992.84
Number of urban residents receiving minimum living allowances (persons)5.46%0.1518.992.88
Participation rate in basic pension insurance for urban employees (%)6.28%0.2115.903.31
Total number of books and periodicals in the library (thousands)5.54%0.1915.162.93
Percentage of public safety expenditure (%)5.20%0.1716.322.74
LandUrban construction land development speed (%)4.84%0.1517.512.56
Urban construction land development intensity (%)4.31%0.1514.662.27
EnvironmentPercentage of expenditure on energy conservation and protection (%)3.38%0.1017.301.78
Number of sewage treatment plants (units)3.29%0.1016.651.74
Table 2. Changes in the level of new-type urbanization in the counties of Jilin Province.
Counties2014201520162017201820192020
Antu0.280.280.260.260.250.240.24
Changbai0.350.340.330.350.330.280.31
Changling0.330.330.350.350.320.230.22
Daan0.280.270.270.270.250.180.23
Dehui0.420.400.370.380.360.260.27
Dongfeng0.330.340.320.320.320.260.24
Dongliao0.270.270.270.270.230.250.22
Dunhua0.400.410.380.380.320.330.32
Fusong0.360.360.380.410.420.360.33
Fuyu0.340.340.350.340.320.240.22
Gongzhuling0.400.410.430.450.430.370.36
Helong0.330.350.320.290.260.250.23
Huadian0.380.390.390.400.350.270.27
Huinan0.280.290.290.280.260.230.24
Hunchun0.390.390.420.430.400.360.36
Ji’an0.290.300.310.290.270.260.25
Jiaohe0.360.360.370.340.330.240.25
Jingyu0.320.310.290.290.290.280.28
Linjiang0.330.340.350.350.340.320.31
Lishu0.280.270.270.270.260.230.21
Liuhe0.300.290.270.250.250.220.22
Longjing0.290.280.260.260.250.240.23
Meihekou0.350.390.420.430.440.390.37
Nongan0.340.340.350.350.330.230.22
Panshi0.330.340.370.350.360.270.28
Qian’an0.330.360.320.300.290.210.21
Qianguo0.350.350.380.380.360.260.25
Shuangliao0.300.290.270.250.240.240.24
Shulan0.300.310.300.290.280.190.18
Taonan0.270.250.240.240.230.190.20
Tonghua0.330.310.330.310.310.230.26
Tongyu0.230.230.220.240.200.160.17
Tumen0.370.370.360.340.340.310.30
Wangqing0.310.330.330.300.280.270.27
Yanji0.570.590.590.560.560.530.51
Yitong0.250.260.260.250.220.200.20
Yongji0.240.230.250.240.260.180.19
Yushu0.340.350.390.400.380.260.25
Zhenlai0.290.290.300.290.260.190.22
Average value0.330.330.330.330.310.260.26
Disclaimer/Publisher’s Note: The statements, opinions and data contained in all publications are solely those of the individual author(s) and contributor(s) and not of MDPI and/or the editor(s). MDPI and/or the editor(s) disclaim responsibility for any injury to people or property resulting from any ideas, methods, instructions or products referred to in the content.

