Article

Evaluation of Socially and Culturally Coordinated Development in Cities of Yangtze River Economic Belt and Its Spatial Correlation

1
Center for Modern Chinses City Studies, East China Normal University, Shanghai 200062, China
2
Institute of Urban Development, East China Normal University, Shanghai 200062, China
*
Authors to whom correspondence should be addressed.
Land 2025, 14(6), 1226; https://doi.org/10.3390/land14061226
Submission received: 28 April 2025 / Revised: 3 June 2025 / Accepted: 4 June 2025 / Published: 6 June 2025

Abstract

In the process of Chinese-style modernisation, the socially and culturally coordinated development of cities in the Yangtze River Economic Belt is important for promoting regional coordinated development, enhancing the balance of public services, and strengthening cultural soft power. This study used quantitative methods, including the construction of an indicator system, spatial correlation analysis, and Zipf’s rank-size rule, on data from 2011 to 2021 to analyse the capacity for coordinated social and cultural development and assessed the spatial distribution characteristics of the Yangtze River Economic Belt. The study found that the overall level of social and cultural coordination among the cities in the Yangtze River Economic Belt steadily improved; however, significant regional disparities still exist, particularly in areas such as social security and cultural integration. Spatially, a “high in the east, low in the west” pattern is observed, with the Yangtze River Delta city cluster leading development, the midstream cluster playing a supportive role, and the Chengdu–Chongqing city cluster showing significant internal disparities. Core cities such as Shanghai, Hangzhou, Wuhan, and Chengdu demonstrated driving effects in areas such as culture, education, and healthcare; however, some peripheral cities remain underdeveloped. This study suggests the need to enhance the development of the Yangtze River’s culture, promote the development of cultural industry clusters, foster the integration of various business models, leverage scientific and educational resources, optimise the cultural consumption market, and achieve the coordinated development of the social and cultural sectors, thereby enabling the Yangtze River Economic Belt to play a greater role in Chinese-style modernisation.

1. Introduction

The Yangtze River, regarded as the mother river of the Chinese nation, plays a pivotal role in the country’s overall development. The Yangtze River Economic Belt (YREB), spanning eastern, central, and western China, accounts for nearly half of the nation’s population and economic output. It carries a rich cultural heritage, from Ba-Shu traditions to Jiangnan water towns, and serves as a cradle of Chinese civilization. Since the 18th National Congress of the CPC, President Xi Jinping has chaired four key symposiums on the YREB’s development, emphasizing the protection and promotion of Yangtze River culture and the creative transformation of China’s cultural legacy [1]. Scholars have increasingly focused on the Yangtze River’s culture, noting its growing prominence over Yellow River culture [2]. As a synthesis of traditional, revolutionary, and socialist cultures, it embodies the values, philosophy, and moral codes of the Chinese nation [3]. Key traits include its historical depth [4], regional diversity [5,6], inclusiveness [7], openness, and innovation [8]. It plays a vital role in strengthening national cohesion and advancing cultural dialogue on the global stage [9,10].
In recent years, the coordination of development among YREB cities has improved steadily, yet most studies have concentrated on economic growth, innovation, ecology, and regional disparities [11,12,13,14,15]. Few studies have explored sociocultural collaboration, and existing work suggests that there are higher levels of coordination in the eastern downstream areas, with Chongqing as a high western performer [16].
The coordinated development theory emphasises the interaction and cooperation between cities within a region. It aims to maximise overall benefits through resource sharing and policy coordination [17]. Innovation-related cooperation between different cities can promote the sharing and optimisation of sociocultural resources, thereby enhancing coordination effects. Synergistic effects play a crucial role in the dynamic evolution of regional development [18]. Haken argued that a system’s capacity for coordination depends on the coordination among its components, measured by an “order parameter” [19]. Some scholars view coordinated development as a gradual rationalisation process driven by government intervention [20]. In the context of the Yangtze River, coordination offers new ideas for resource and policy integration across cities, and existing studies mainly focus on innovation, economic, or ecological subsystems, often overlooking the sociocultural dimension [21,22,23]. Evaluation methods for regional coordination vary and lack standardisation. Common approaches include extended DEA, system dynamics, composite coordination models, Haken’s model, and grey relational analysis [24]. While each method has its strengths, it may fall short in capturing the complex, dynamic relationships prevailing in large-scale regional development.
Socioculturally coordinated development extends beyond the integration of cultural industries, encompassing cross-regional integration and the coordination of public services, such as education and healthcare. From a meta modernist perspective [25], sociocultural collaboration is no longer viewed as the static integration of cultural functions, but as a dynamic, oscillatory process of anchoring shared meanings and collective identities across temporal and spatial scales [26]. In general, current studies on regional coordinated development are predominantly confined to the analysis of individual subsystems or sectors in selected regions, while systematic investigations into sociocultural subsystems and dynamic cross-regional assessments of urban coordination remain insufficient. Accordingly, this study aims to construct a comprehensive indicator system to systematically evaluate the overall level and performance characteristics of coordinated sociocultural development in the Yangtze River Economic Belt. In addition, spatial disparity analysis and autocorrelation methods are employed to reveal the spatial evolution and dynamic patterns of urban coordination across regions. The conclusions and policy recommendations derived from this study not only provide new academic perspectives but also offer important references for decision-making regarding the implementation of coordinated development strategies in the Yangtze River Economic Belt (Figure 1).

2. Materials and Methods

Measuring the level of social and cultural collaboration in the Yangtze River Economic Belt is a complex and multidimensional process involving mutual adaptation, coordination, and cooperation in various aspects and across various dimensions. A scientifically sound measurement method not only helps reveal the current state and evolutionary trends in regional social and cultural coordination development, but also provides data support and a decision-making basis for promoting regional coordinated development. To this end, this study constructs a corresponding indicator system and adopts methods such as the Theil Index, Entropy Weight Method, and spatial autocorrelation analysis to systematically measure the social and cultural coordination level of the Yangtze River Economic Belt.

2.1. Indicator System Construction

Based on the theories of Ma Shijun’s complex ecosystem and Bathelt’s relational economic geography, and drawing on the World Bank’s Urban Competitiveness Index, International Organization for Standardization (ISO) sustainable urban standards, and other frameworks [8,27], this study constructs an evaluation index system for social and cultural collaboration in the Yangtze River Economic Belt. This system comprises 5 factor layers and 13 specific indicators. The factor layers assess the level of coordinated social and cultural development in the Yangtze River Economic Belt from five angles: educational services, healthcare conditions, social security, urban–rural differences, and cultural integration. The indicator layer characterizes the content of each factor layer through specific indicators such as educational expenditure, the number of general higher education institutions, the number of primary and secondary schools, the number of hospitals, the number of practising or assistant physicians, the number of hospital beds, the number of people insured under basic urban employee pension insurance, the number of people insured under unemployment insurance, the urbanisation rate, the urban–rural income gap, the number of people employed in the cultural industry, the number of books in public libraries, and the number of national intangible cultural heritage items (Table 1).
The data for the indicator system primarily come from official statistical publications such as the 2012–2022 China Urban Statistical Yearbook, the statistical yearbooks of relevant provinces, and the National Economic and Social Development Statistical Bulletins of various cities. Data on national intangible cultural heritage items were obtained from the State Council’s official lists of the first to fifth batches of representative national intangible cultural heritage projects.

2.2. Entropy Weight Method (EWM)

The Entropy Weight Method (EWM) is an objective weighting approach widely used in multicriteria decision-making to determine the relative importance of evaluation indicators. The fundamental principle is that the greater the variation in an indicator across samples, the more information it provides, and thus, the higher its weight. Conversely, if an indicator exhibits little variation, it contributes less information and should receive a lower weight.
The computational procedure consists of the following steps:
Step 1: Data Normalisation
To eliminate the influence of different units and scales among the indicators, the raw data were first normalised. For positive indicators, normalisation is performed as follows:
z i j = x i j m i n x j m a x x j m i n x j
For a negative indicator, the formula is as follows:
z i j = m a x x j x i j m a x x j m i n x j
where x i j denotes the original value of the j -th indicator for the i -th observation and z i j is the normalised value.
Step 2: Proportion Calculation
The proportion of the i -th observation under the j -th indicator is computed as follows:
p i j = z i j i = 1 n z i j
If z i j = 0 , the value of p i j is defined as zero. Logarithmic terms involving zero values were appropriately handled in the subsequent entropy calculations.
Step 3: Entropy Value Computation
The entropy of each indicator J is given by the following:
e j = k i = 1 n p i j ln p i j     w h e r e     k = 1 ln n
If p i j = 0 , then p i j ln p i j is defined as zero to avoid computational indeterminacy.
Step 4: Redundancy (Degree of Diversification)
The information redundancy (also referred to as the degree of diversification) for indicator j is calculated as follows:
d j = 1 e j
A higher redundancy value implies greater variability and informational contributions of the indicator.
Step 5: Determination of Indicator Weights
Finally, the weight w j of indicator j is derived as follows:
w j = d j j = 1 m d j
These normalised weights reflect the relative importance of each indicator based on the amount of information conveyed.

2.3. Theil Index

This study used the Theil Index to measure internal disparities in social and cultural coordination development within the Yangtze River Economic Belt. The Theil Index, introduced by Theil in 1967, uses the entropy concept of information theory to calculate income inequality. Larger disparities are indicated as the index increases [28]. The single-parameter Theil entropy system can be expressed as follows:
E c y = 1 c c 1 n i N y 1 μ c 1 , c 0 , 1 ; 1 n i N y i μ l n y 1 μ , c = 1 ; 1 n i N l n y i μ , c = 0 .
where n represents the sample size, y i represents the social and cultural coordination development index of the ith sample, and μ represents the comprehensive social and cultural development level of the sample.

2.4. Spatial Autocorrelation Analysis

Through spatial autocorrelation analysis, based on the results of the Global Moran’s I and Local Moran’s I indices, we analysed the spatial relationships between the social and cultural coordination development capacity in the Yangtze River Economic Belt, including spatial agglomeration effects and spatial heterogeneity. The Global Moran’s I index measures the spatial agglomeration effect. The value of the Global Moran’s I index ranges from −1 to 1. A value close to 1 indicates that similar attributes are clustered together, a value close to −1 indicates that dissimilar attributes are clustered together, and a value close to 0 indicates that the attributes are randomly distributed or that there is no spatial autocorrelation. The calculation formula for the Global Moran’s I index is as follows:
G l o b a l   M o r a n s   I = i = 1 n j = 1 n w i j x i x ¯ x j x ¯ σ 2 i = 1 n j = 1 n w i j , σ 2 = 1 n i = 1 n x i x ¯ 2
where n is the number of cities in the Yangtze River Economic Belt, x i and x j represent the social and cultural coordination development capacities of cities i and j, respectively, and x ¯ is the average social and cultural coordination development capacity. w i j is the spatial weight matrix calculated based on the inverse square of the distances between cities and is calculated as follows:
W i j 1 = 1 / d i j 2 , i j 0 , i = j
where dij represents the geographical distance between cities i and j, calculated based on the latitude and longitude coordinates. In addition, this study conducts robustness checks by employing a geographical contingency-based spatial weight matrix and an economic–geographical nested spatial weight matrix. The specific forms are as follows.
W i j 1 = 1 ,         c i t y   i   a n d   c i t y   j   a r e   a d j a c e n t 0 ,       c i t y   i   a n d   c i t y   j   a r e   n o t   a d j a c e n t
In this formula, if two spatial units share a common border or point, the corresponding element in the spatial weight matrix is assigned a value of one; otherwise, it is assigned a value of zero.
W i j 3 = 1 p g d p i ¯ p g d p j ¯ × d i j , i j 0 , i = j
where p g d p i ¯ p g d p j ¯ is the absolute difference between the average annual per capita GDP of city i and city j.
The Global Moran’s I index can depict the overall spatial autocorrelation of economic variables, but cannot reflect the spatial dependence of specific regions. The Local Moran’s I index analysis provides the spatial relationship between regions and their neighbouring regions, that is, the degree of spatial association between a city and its neighbouring cities, which can compensate for the inability of the Global Moran’s I index to show spatial dependence between cities. Typically, a Moran scatter plot is used to divide the coordination development capacity of cities into four quadrants of clustering patterns, allowing for the clear identification of the spatial relationships between a city and its neighbouring cities.

3. Results

This section presents a concise and precise description of the experimental results, their interpretation, and key experimental conclusions.

3.1. Temporal Evolution Characteristics of Sociocultural Coordination

With improvements in infrastructure, the advancement of public service integration, and deepening of regional cultural exchange in the Yangtze River Economic Belt, inter-city sociocultural connections have grown increasingly close, showing the existence of a dynamic pattern of sociocultural coordination. Analysing this evolution from three perspectives—overall development trends, internal regional disparities, and inter-city coordination potential—helps provide a more comprehensive understanding of the temporal changes in sociocultural coordination across the region.

3.1.1. Overall Improvement in the Level of Sociocultural Coordination

The level of sociocultural coordination in the Yangtze River Economic Belt has shown an upward trend, albeit with certain challenges. From 2011 to 2019, the sociocultural coordination capacity of cities in the region fluctuated yet generally increased, with the score rising from 15.66 to 17.75 (Table 2). Meanwhile, the Theil Index for the coordination level steadily declined from 0.1148 in 2011 to 0.0987 in 2019 (Table 3). This trend indicates that sociocultural coordination within the Yangtze River Economic Belt has continued to strengthen, regional disparities have gradually narrowed, and sociocultural interactions among cities have become more frequent. Consequently, the overall level of coordinated development steadily improved. During this period, urbanisation progressed steadily, public cultural infrastructure was enhanced, the mobility of education and medical resources increased, social security coverage expanded, and the capacity of cities to provide public services improved significantly, all contributing to more balanced sociocultural development across the region.
However, from 2020 to 2021, the level of sociocultural coordination among cities in the Yangtze River Economic Belt declined, with the score falling from 17.75 in 2019 to 15.63 in 2021 (Table 2). The Theil Index for the coordination level rose slightly from 0.0987 in 2019 to 0.1545 in 2021 (Table 3). These changes can be attributed to the impact of the COVID-19 pandemic and other shifts in the socioeconomic environment. During this period, some cities faced increased pressure in public resource allocation, and the balanced development of social services such as education and healthcare was adversely affected. In addition, asynchronous economic recovery may have contributed to short-term fluctuations in regional sociocultural coordination. Nevertheless, as the economy and society gradually recover, inter-city cooperation and sociocultural exchange are expected to increase. In turn, regional sociocultural integration and synergistic development are likely to be promoted further, and the overall level of sociocultural coordination is expected to continue improving.

3.1.2. Significant Differences in Coordination Levels Across Sociocultural Domains

There are considerable differences in coordination levels across various sociocultural domains in the Yangtze River Economic Belt (Table 2 and Table 3). Among these, the “urban–rural disparity” domain has the highest coordination development score and the lowest Theil Index. In 2021, the average coordination development score in this domain was 37.49, indicating a relatively high, balanced level of regional coordination. In recent years, the promotion of urban–rural coordinated development policies has led to significant progress in infrastructure construction and the equalisation of public services, further enhancing the integration of urban and rural sociocultures. The coordination development scores for the “educational resources” and “medical conditions” domains were also relatively high, with scores of 13.09 and 13.60 in 2021, respectively, reflecting a generally good coordination level in these two domains. Although the Theil Index values for these domains were low, they exhibited certain fluctuations, with some years witnessing an increase. This indicates that the development gap between cities in these two domains within the Yangtze River Economic Belt has not been entirely closed, and some cities still face challenges in terms of access to educational and medical resources.
By contrast, the “cultural integration” domain recorded a lower coordination development score and a higher Theil Index, indicating a relatively weak overall level of coordination and persistent regional disparities. Although some cities have made progress in developing cultural industries, building public cultural service systems, and promoting cultural exchange and cooperation, differences in resource endowments and levels of policy support have limited the overall coordination effect in this domain. The “social security” domain had the lowest coordination development score and highest Theil Index, revealing the greatest disparities among cities and the weakest overall coordination effect. In recent years, China’s social security system has continued to improve, expanding coverage in areas such as basic pensions and medical insurance. However, there are significant gaps in the quality and level of social security services across cities. In particular, economically underdeveloped areas tend to have relatively underdeveloped welfare systems, making the balanced development of social security services a major ongoing challenge.

3.1.3. Cities Show Considerable Potential for Enhancing Synergistic Development Capacity

Based on a comprehensive calculation of the Social and Cultural Synergistic Development Capacity Index for cities along the Yangtze River Economic Belt, the results from 2021 reveal significant disparities in the levels of social and cultural coordination among cities (see Table 4). The top ten cities in the ranking are Shanghai, Hangzhou, Nanjing, Chengdu, Wuhan, Chongqing, Suzhou, Ningbo, Hefei, and Wuxi. Shanghai ranks first, owing to its outstanding educational and healthcare resources, well-developed cultural industry, and comprehensive social security system. The city plays a leading role in this region. These top-performing cities possess strong synergistic advantages in areas such as cultural exchange, social inclusiveness, and equitable public service provision. Their progress has served as the driving force for the overall social and cultural integration of the Yangtze River Economic Belt.
The social and cultural coordination capacities of cities along the Yangtze River Economic Belt approximately follow Zipf’s rank-size distribution. After excluding extreme values, the log of the coordination scores and their corresponding ranks yielded a goodness of fit of 92.13% (Figure 2). The top 10 and bottom 10 cities deviated slightly from the overall rank-size distribution curve, particularly those in the top 10, suggesting some decentralisation in social and cultural coordination across cities. This indicates the existence of a hierarchical pattern in the rank distribution of the coordination capacity, highlighting the need for further enhancement. The objectives of narrowing the gaps between cities and promoting balanced development are essential for improving regional social and cultural coordination.
  • Note: To visualize distribution of urban composite scores, score–rank diagram was constructed. Rank is derived directly from sorted score values, and diagram serves primarily as comparative tool.

3.2. Spatial Differentiation and Inter-City Linkages of Social and Cultural Coordination

The development of social and cultural coordination in the Yangtze River Economic Belt is reflected in its temporal evolution and spatial characteristics. Inter-city social and cultural linkages are shaped by factors such as economic development, population mobility, and industrial interaction, resulting in different levels of coordination patterns. Moreover, social cooperation and cultural exchange among cities do not occur in isolation; rather, they are embedded within regional networks that facilitate resource sharing and interactive development. Therefore, examining spatial differentiation and inter-city relationships contributes to a deeper understanding of the developmental dynamics of social and cultural coordination in the Yangtze River Economic Belt.

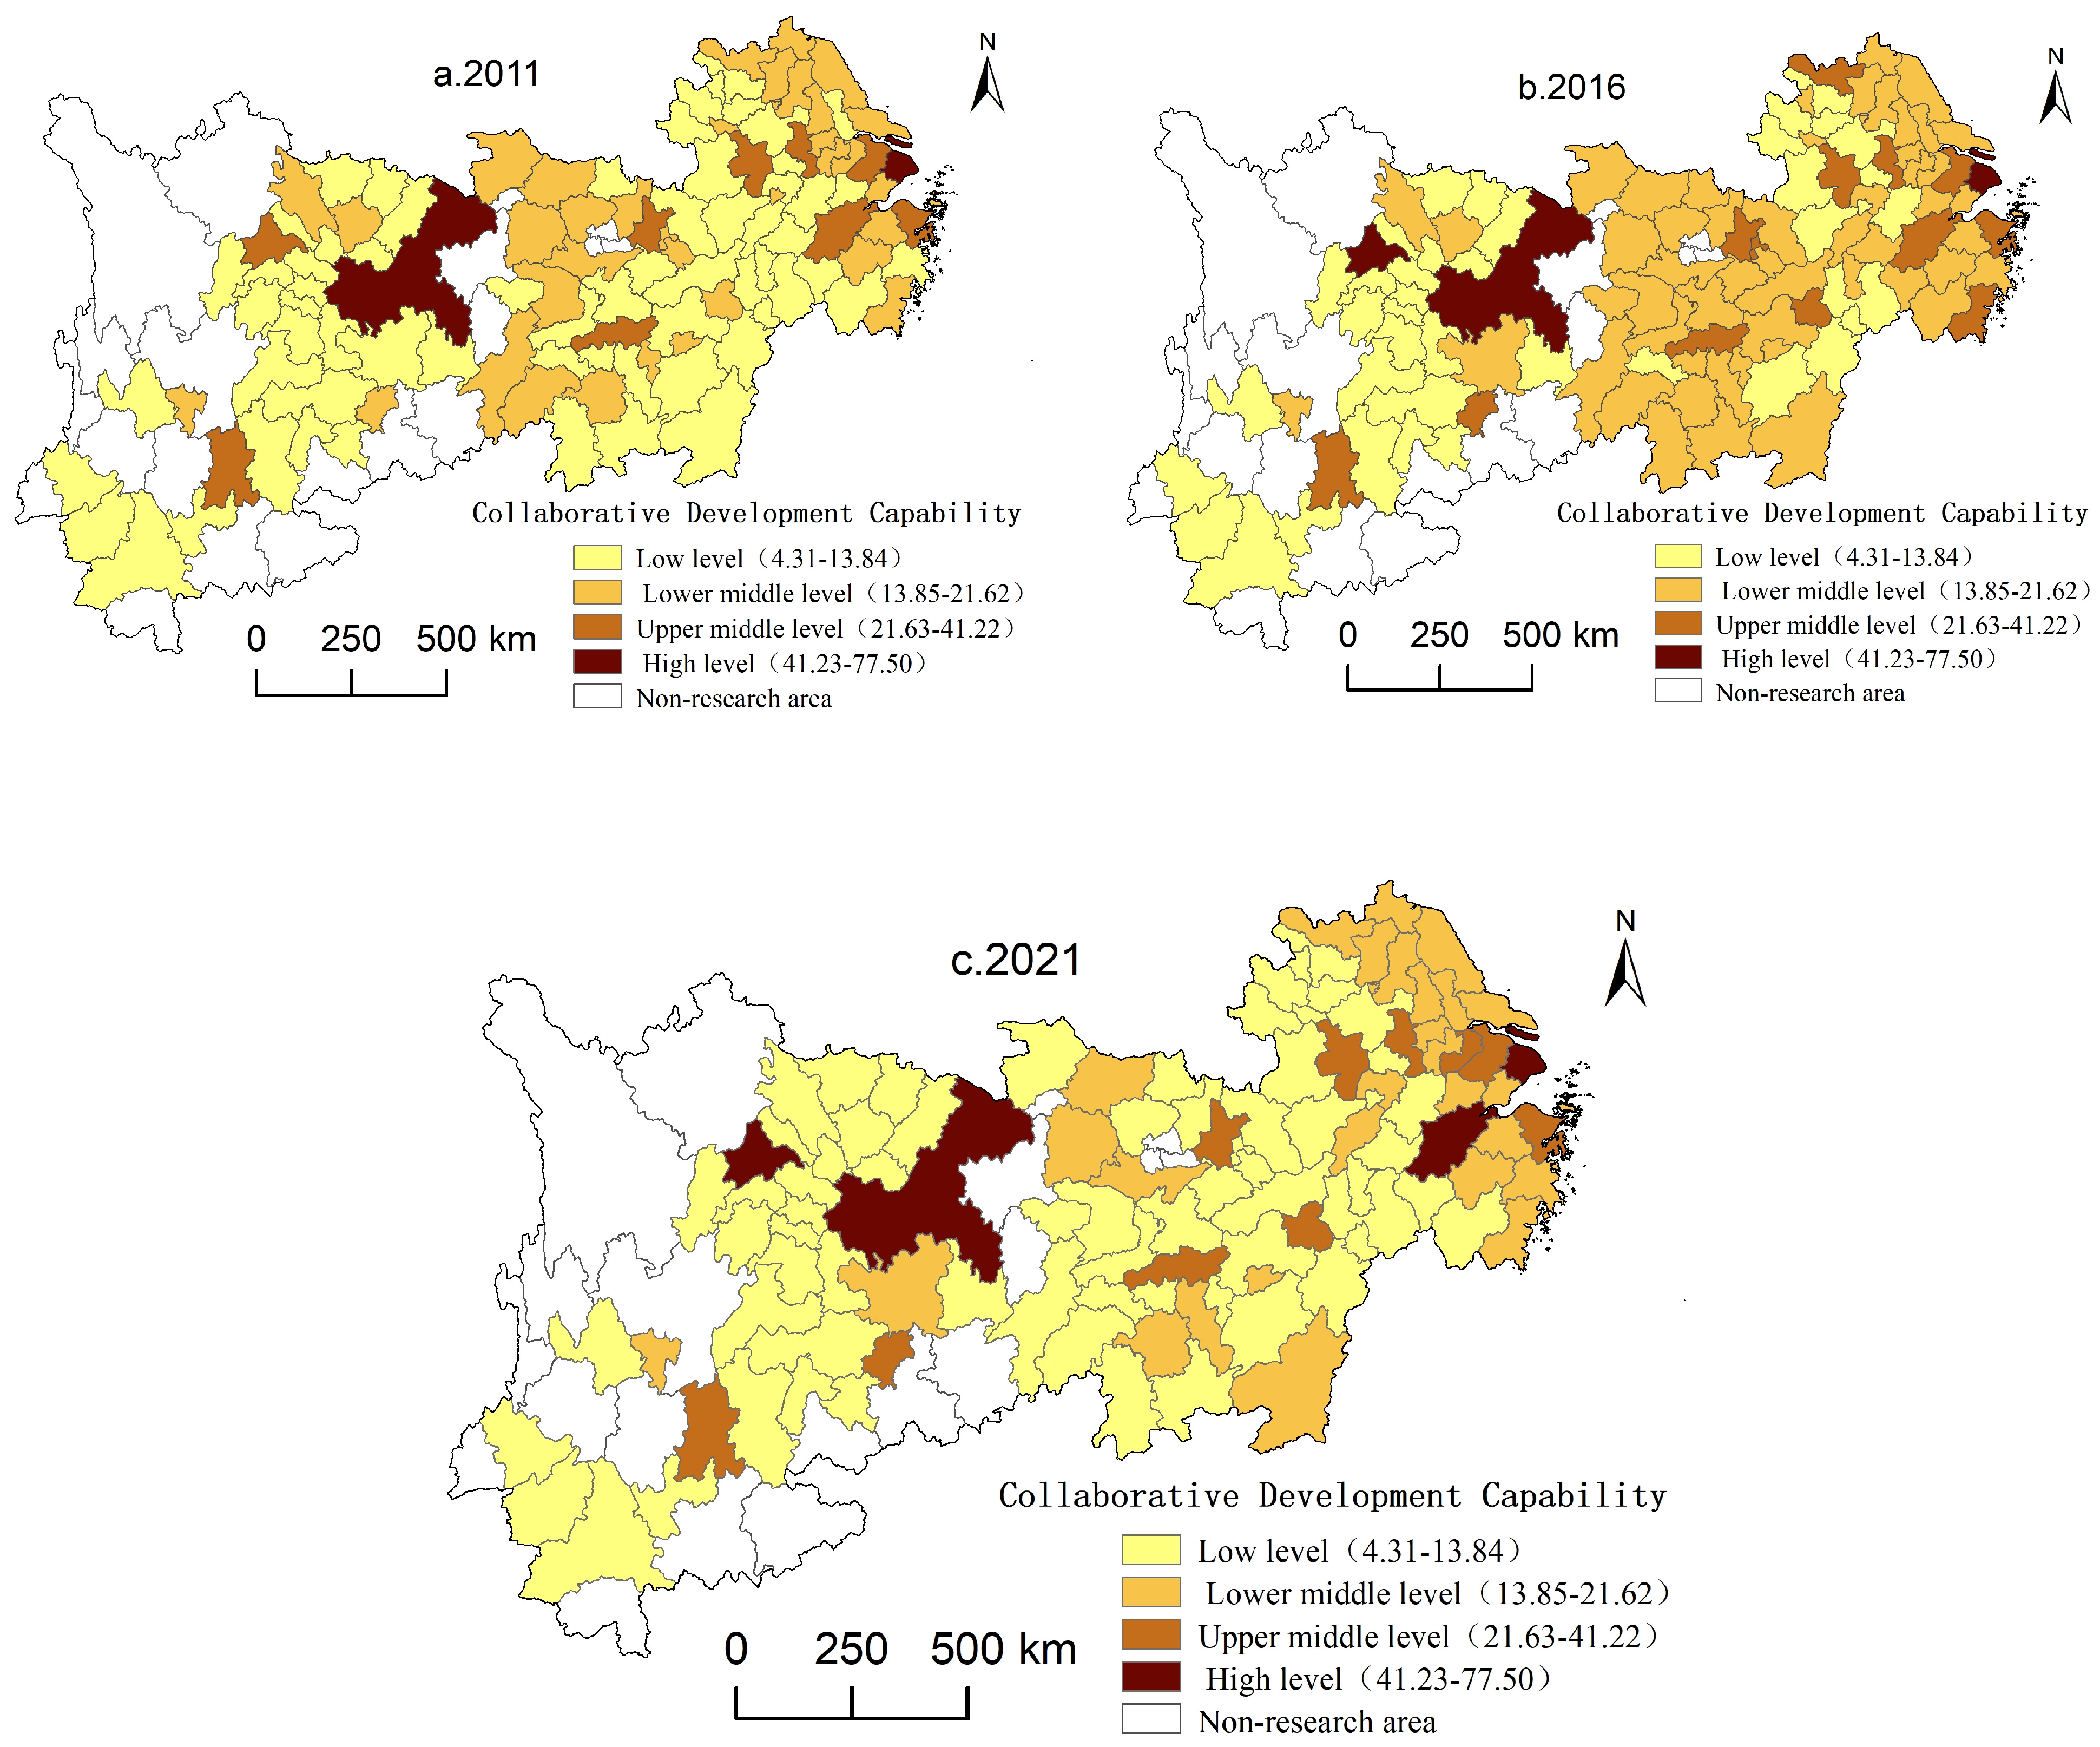
3.2.1. The Overall Pattern of Urban Coordination Shows High in the East, Low in the West, with a Core–Periphery Distribution

The analysis of social and cultural coordination among cities in the Yangtze River Economic Belt shows that the eastern region is more developed than the western region, with a core–periphery distribution in certain areas. From 2011 to 2021, the gap between regions widened, especially between the upper and lower reaches of the Yangtze River. The lower reaches, covering three provinces and one municipality, continued to lead by a large margin compared to the entire region, presenting a stepped stratification relative to the middle and upper reaches (Figure 3). In 2021, among the top 50 cities, 26 were from the lower reaches, accounting for 63.41% of all lower-reach cities; 18 were from the middle reaches, accounting for 42.85% of all middle-reach cities; and 6 were from the upper reaches, accounting for 22.22% of all upper-reach cities. Social and cultural coordination in the lower reaches of the Yangtze River continues to maintain a significant advantage, whereas the upper reaches are slightly weaker than the middle reaches in terms of coordination. From a provincial perspective, in 2021, aside from Shanghai and Chongqing, the cities in the top 50 for social and cultural coordination were mainly distributed in the lower reaches of Jiangsu and Zhejiang and the middle reaches of Hunan.
The social and cultural coordination capabilities of cities in the Yangtze River Economic Belt also exhibited a zonal and core–periphery combined spatial distribution pattern. The region, relying on the Yangtze River as a natural link, forms an economic and cultural corridor stretching from Shanghai in the east to Chongqing in the west. Cities in this region interact closely in terms of social and cultural resources and economic development, resulting in strong coordination capabilities and showing a zonal distribution. However, there was a multipolar distribution with a core–periphery structure. In the downstream region, Shanghai and Hangzhou serve as the core, with a developed cultural market and abundant educational and healthcare resources, forming a powerful social and cultural coordination hub. In the middle reaches, Wuhan and Changsha serve as the core and are rich in traditional and red cultural resources. Chongqing and Chengdu serve as the core, characterised by historical and ethnic cultures, with cultural industries and cultural tourism economies radiating to the upstream regions. The peripheral cities are mostly small and medium-sized, with smaller cultural tourism industry scales and weaker social service functions.

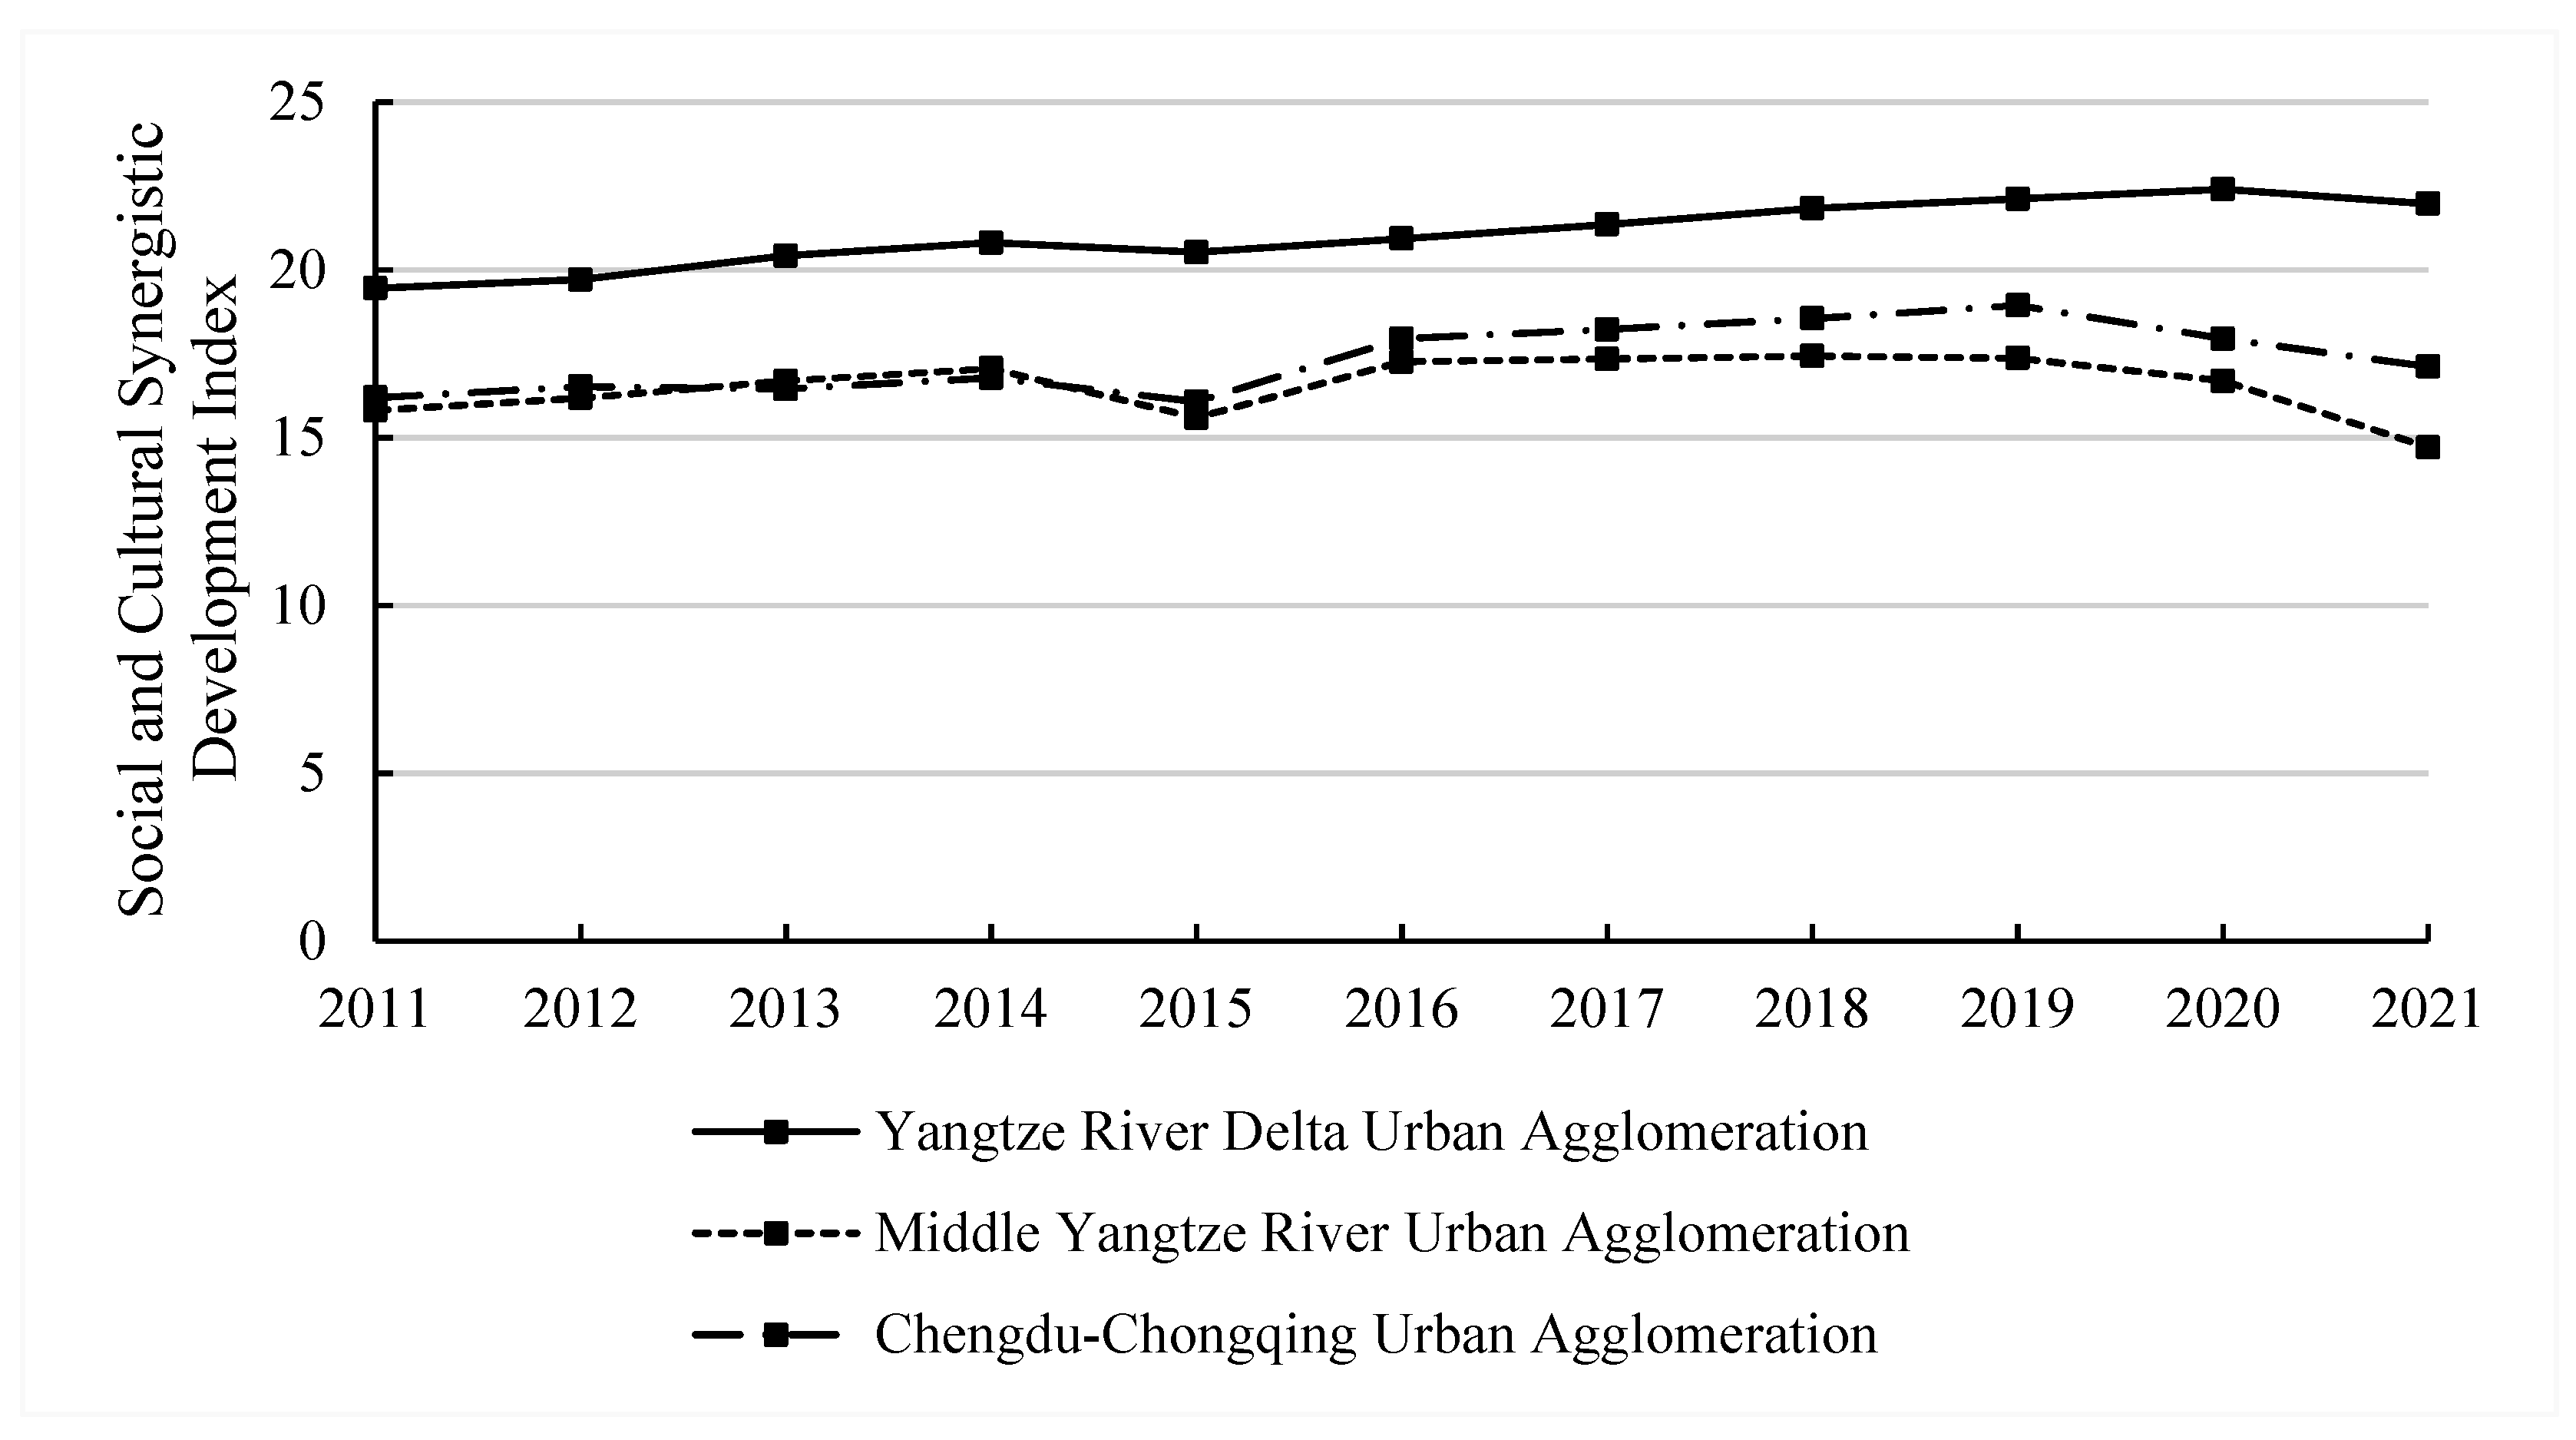
3.2.2. Disparities in Coordinated Development Levels of City Clusters in the Yangtze River Economic Belt

The coordinated development of city clusters within the Yangtze River Economic Belt is an important component of the region’s overall coordinated development. Based on urban flows, the strength of mutual connections between cities, and the “Yangtze River Economic Belt Development Plan Outline”—approved by the Political Bureau of the Central Committee in March 2016 and issued in September 2016—the 110 cities in the Yangtze River Economic Belt are roughly divided into three clusters: the Chengdu–Chongqing cluster in the upstream region, the Central Yangtze River cluster, and the Yangtze River Delta cluster. Through overall calculations and the Theil Index, we measured the social and cultural collaboration levels among these clusters and the internal disparities within each to further understand the spatial differentiation of social and cultural coordination levels in the Yangtze River Economic Belt (Figure 4 and Figure 5).
The Yangtze River Delta cluster plays a leading role in the social and cultural coordination development of the Yangtze River Economic Belt. From 2011 to 2021, its social and cultural collaboration score increased from 19.45 to 21.97, representing the highest level of collaboration among the clusters. The Theil Index for this cluster has always been below 0.07, indicating relatively small disparities in social and cultural coordination development among its cities. As a cultural intersection of internationalisation and modernisation, the developed economy and infrastructure of the Yangtze River Delta have further driven close ties and the coordinated development of social and cultural resources across cities in the region.
The Central Yangtze River city cluster plays an important role in the coordination development of social and cultural resources in the Yangtze River Economic Belt. From 2011 to 2021, the Central Yangtze River city cluster demonstrated a high level of social and cultural collaboration, with the lowest Theil Index among the three city clusters. The collaboration within this cluster was relatively balanced. As the birthplace of China’s revolution and historical culture, the Central Yangtze River city cluster has driven the optimisation of urban social and cultural construction through cultural resource sharing and regional coordination.
The Chengdu–Chongqing city cluster lagged behind in terms of social and cultural coordination development. From 2011 to 2021, although the Chengdu–Chongqing city cluster maintained a relatively high level of coordinated development, its Theil Index was high. The Theil Index increased from 0.1861 in 2011 to 0.2790 in 2021, indicating significant disparities in the coordinated development capabilities between cities in the region. These disparities stem from marked differences in social and cultural infrastructure, cultural industry development, and educational resource distribution between core and peripheral cities. This has led to uneven social and cultural coordination within the region.

3.2.3. Significant Spatial Agglomeration Effect

The Global Moran’s I test results indicate that from 2011 to 2021, the social and cultural coordination development capability of the Yangtze River Economic Belt gradually became more agglomerated, with integration becoming increasingly apparent. Specifically, in 2011 and 2016, the p-values for social and cultural coordination development capabilities were 0.1617 and 0.2656, respectively (Table 5). Although there was a positive spatial correlation, it was not statistically significant, indicating that the spatial agglomeration of social and cultural coordination development in the Yangtze River Economic Belt was not noticeable in 2011 or 2016. However, in 2021, the Global Moran’s I index for social and cultural coordination development capability was 0.0280, with a p-value of 0.0064. This indicates the existence of significant positive spatial correlation, reflecting enhanced diffusion effects of coordination capacity in neighbouring cities, leading to a more agglomerated spatial distribution.
Regarding specific performance in various fields, the spatial agglomeration effect was most significant in the areas of social security and urban–rural differences. The urban–rural disparity domain showed a clear spatial agglomeration effect, with the coordination development ability of different cities gradually becoming more consistent, and the trend of spatial agglomeration strengthening. The social security domain demonstrated strong spatial autocorrelation, especially between core and surrounding cities, where the coordination development ability gradually aligned, displaying a distinct agglomeration phenomenon. The cultural integration domain exhibited significant spatial agglomeration effects, indicating the clear similarity in the level of cultural integration among different cities. In contrast, the spatial agglomeration of coordination ability in the areas of educational resources and medical conditions was weaker, although it showed some improvement in 2021, with an overall low spatial autocorrelation.

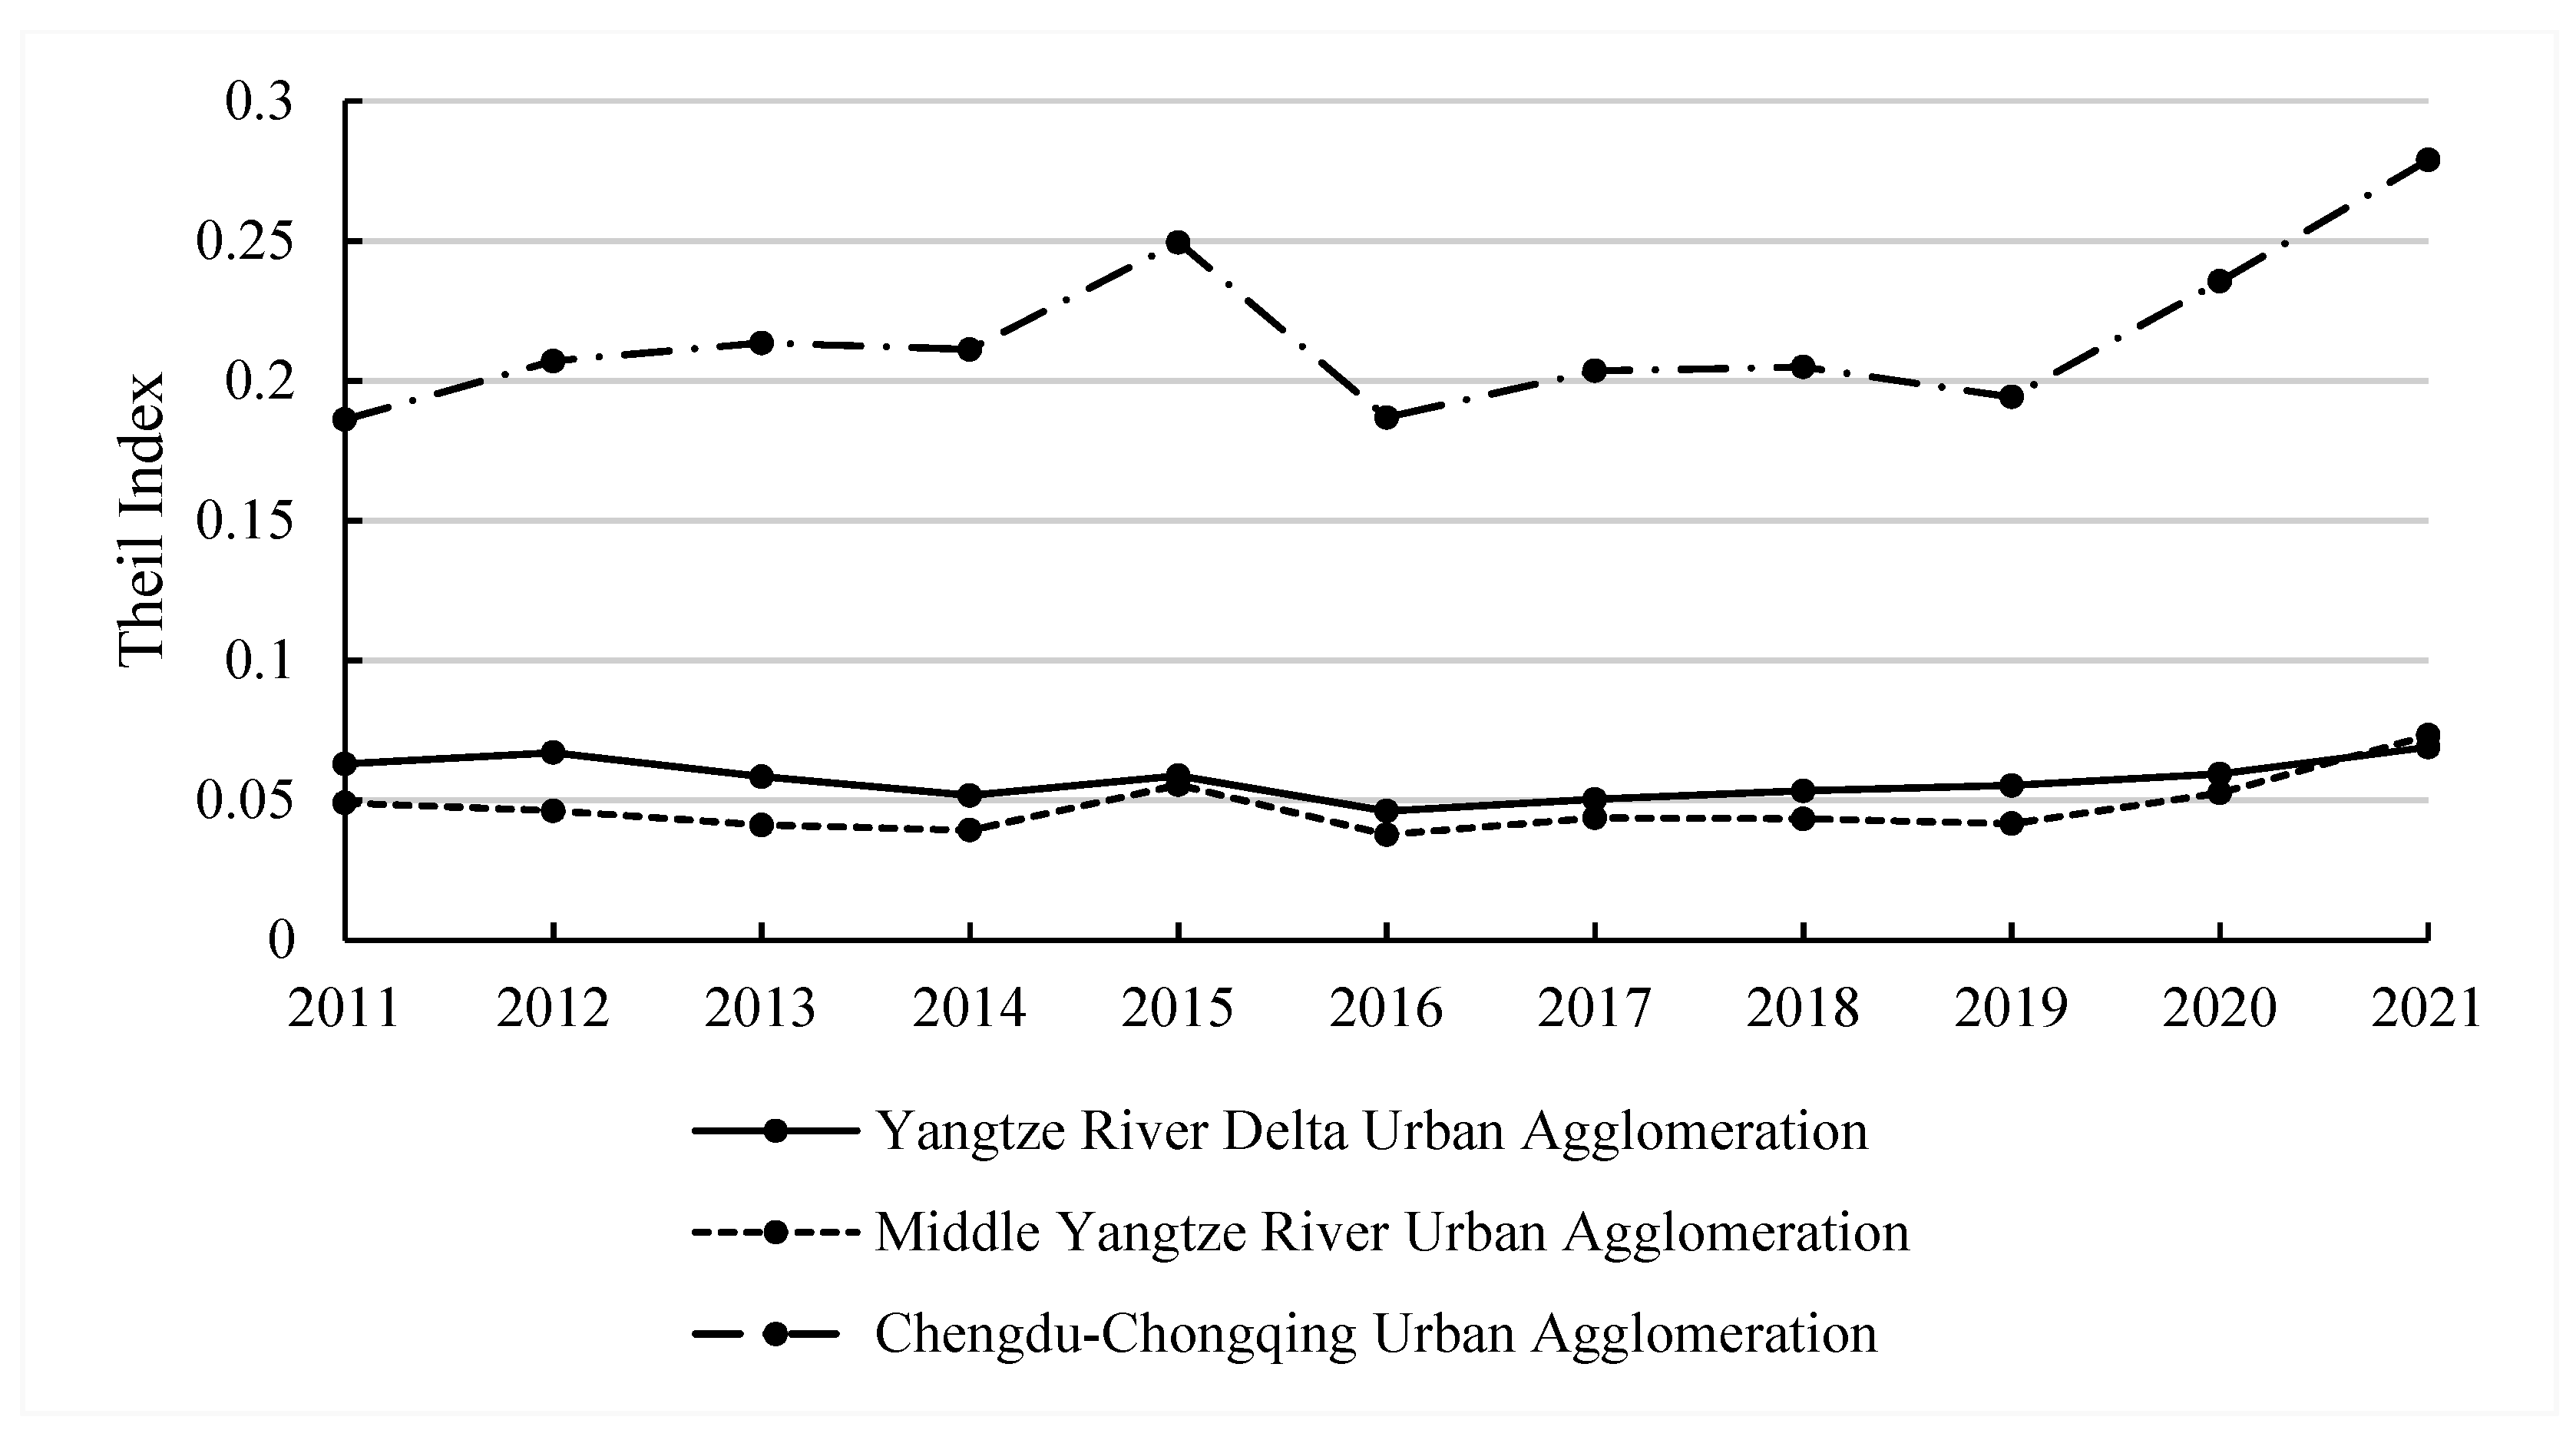
3.2.4. Spatial Heterogeneity and Regional Differences

There is significant spatial heterogeneity in the social and cultural coordination capacities of the cities along the Yangtze River Economic Belt. The eastern Yangtze River Delta region is characterised by a “high–high” clustering trend, while capital cities and surrounding areas in the central and western regions exhibit a “high–low” polarisation trend. Other regions show a “low–low” clustering pattern. According to the Local Moran’s I scatter plots from 2011, 2016, and 2021, different numbers of cities appear in the four quadrants, indicating the coexistence of the four types of city clustering categories in terms of social and cultural coordination capacity. Moreover, the positions of most cities in these quadrants remain relatively unchanged between 2011 and 2021.
From 2011 to 2021, the cities in Quadrant I are mostly concentrated in the Yangtze River Delta region, such as Shanghai, Hangzhou, Nanjing, Suzhou, Wuxi, and Ningbo, representing the “high–high” combination. These cities rank high in terms of social and cultural coordination capacity, and play a key role in promoting coordinated development along the Yangtze River Economic Belt. The cities in Quadrant IV, such as Wuhan, Changsha, Chengdu, Chongqing, Guiyang, and Kunming, form the “high–low” combination. Although these cities have strong social and cultural coordination capacities, those of the surrounding cities are relatively weak. These cities need to adjust their development strategies and promote coordinated development with the surrounding cities. Cities in Quadrant III, such as Bazhong, Liupanshui, Lincang, Zhaotong, Leshan, and Zigong, represent the “low–low” combination. These cities and their surrounding areas have weak social and cultural coordination capacities, and are considered bottlenecks for coordinated development in the Yangtze River Economic Belt. Cities in Quadrant II, such as Chuzhou and Ziyang, form the “low–high” combination. These cities are surrounded by areas with strong social and cultural coordination capacities but are at a lower development level, being located in the mid–lower range.

4. Conclusions

4.1. Discussion

Based on a comprehensive evaluation and spatial analysis of the social and cultural coordination development in the Yangtze River Economic Belt from 2011 to 2021, three key conclusions were drawn. First, there was an overall increase in social and cultural coordination, but insufficient internal balance. During the study period, the social and cultural gaps among cities in the Yangtze River Economic Belt narrowed during the research period, and the level of social and cultural coordination continuously improved, making significant contributions to the high-quality development of the region. However, there were still notable imbalances in the coordination capabilities. By 2021, only 15 cities, accounting for 13.63% of the total cities in the region, had a coordination capacity score above 20. the deeper structural factors embedded within the social fabric. The key factors include variations in institutional implementation capacity, uneven stages of urbanisation, differences in resource allocation capabilities stemming from varying degrees of fiscal decentralisation, and locally differentiated practices in cultural governance and public service delivery. Collectively, these factors shape the efficiency of social resource integration, as well as the coverage and equity of public cultural services, thereby influencing the performance of cities and their capacity to promote coordinated social and cultural development. Field investigations further revealed that significant gaps exist among cities at different administrative levels in terms of fiscal capacity and policy enforcement. These disparities result in uneven investments in cultural infrastructure, the inconsistent development of social security systems, and varied degrees of maturity in cross-regional coordination mechanisms, ultimately exacerbating the imbalance in coordinated development across the Yangtze River Economic Belt. Second, although differences in the levels of coordinated social and cultural development still exist among the three major urban clusters in the upper, middle, and lower reaches of the Yangtze River, they have already demonstrated leading and supporting roles. The social and cultural coordination development in the Yangtze River Economic Belt shows a distinct east–west spatial distribution pattern, with overall spatial clustering characteristics of “high–high” and “low–low”. The Yangtze River Delta urban cluster had the highest coordination capacity, significantly ahead of the Central Yangtze River and the Chengdu–Chongqing urban clusters. The social and cultural coordination capacity of the Yangtze River Delta, Central Yangtze River, and Chengdu–Chongqing urban clusters has continuously improved, strengthening their supporting role in regional development. The leading role of core cities such as Shanghai and Hangzhou in the Yangtze River Delta urban cluster in cultural integration, education, healthcare resource sharing, and social security integration has been increasingly enhanced. Core cities, such as Wuhan and Changsha, in the Central Yangtze River urban cluster play a key role in promoting regional social and cultural coordination, with cultural interaction and social integration within the cluster continuously deepening and coordination levels steadily improving. However, the disparity in coordination capacity among cities within the Chengdu–Chongqing urban cluster remains more pronounced compared to the other clusters, indicating a lack of balanced internal development. Moving forward, efforts should focus on strengthening the social and cultural coordination capacity of Chongqing and Chengdu as core cities while further enhancing their dual-engine radiation and driving effects across the region.
Third, insufficient social security coordination remains the primary constraint to regional integration. According to the data analysis in this study, compared to the other dimensions, the overall level of coordinated development in social security within the region remains low, constituting a major bottleneck hindering the progress of cross-regional integration. Currently, there are significant disparities among cities in the YREB regarding the construction of social security systems. These manifest as weak institutional linkages, inconsistent coverage scope, and considerable differences in the level of protection provided. Particularly, areas such as household registration systems, pension schemes, medical insurance, and minimum livelihood protection lack unified cross-regional coordination mechanisms. Moreover, resource-sharing systems remain underdeveloped, with delays in information exchange, platform co-construction, and policy coordination, all of which hinder the optimal allocation and efficient flow of social security resources. This issue is particularly pronounced in cities with weak economic foundations. Due to their limited fiscal capacity, these cities are unable to provide social welfare services at a level comparable to more developed cities, resulting in insufficient investment and inadequate service delivery. Consequently, the development gap between less-developed and more-developed areas continues to widen, further weakening the overall capacity for regional coordination. Meanwhile, from 2020 to 2021, the COVID-19 pandemic and other socioeconomic disruptions will further exacerbate the situation. Restrictions on cross-regional population mobility and increased pressure on public services and local finances have intensified existing challenges to coordinated development. Against this backdrop, the level of social and cultural coordination in the region has shown short-term fluctuations and temporary setbacks, revealing the limited resilience and adaptability of the current social security system.
Taken together, these findings highlight both the progress and persistent challenges in promoting integrated and balanced social and cultural development in the Yangtze River Economic Belt. It is imperative to provide solid and balanced support for the coordinated social and cultural development of the Yangtze River Economic Belt through policy guidance and innovation mechanisms.

4.2. Implications and Recommendations

The development of high-quality social and cultural coordination in the Yangtze River Economic Belt requires multidimensional cooperation. Under mechanisms that accommodate diversity, uncertainty, and intersubjective anchoring [26], it is essential to continuously enhance the integration and sharing of social and cultural resources within a region, ultimately achieving coordinated socioeconomic development.

4.2.1. Deepen Cultural Infrastructure and Identity Construction

Fully learn from the experiences and achievements of Shanghai’s “One River, One River” governance and development, accelerate the construction of the Yangtze River National Cultural Park, and use tourism to drive high-quality social and cultural coordination development throughout the region. The cities and provinces of the Yangtze River Delta should take the lead in establishing a common cross-regional cultural industry market, effective competition, and cooperative mechanisms. The integrated development of the cultural industry in the Yangtze River Delta should guide the coordinated innovation of the cultural industry in the Yangtze River Economic Belt, promote the implementation of the Yangtze River Economic Belt Cultural Industry Fund projects, and form a financing system for cultural industry construction in the Yangtze River Economic Belt, with government funds as guides and broad social funds as support. The rich red tourism resources in the region should be fully explored while also optimising competitive and cooperative relations across the upper, middle, and lower reaches of the Yangtze River Economic Belt and consolidating the leading role of the Yangtze River Delta. The functional roles of regional central cities, such as Shanghai, Nanjing, Hangzhou, Hefei, Wuhan, Changsha, Nanchang, Chongqing, Chengdu, Guiyang, and Kunming, should be strengthened to enable differentiated development while coordinating high-quality development in the metropolitan areas and urban clusters of the Yangtze River Economic Belt.

4.2.2. Cultivate Cultural Industry Clusters and Cross-Regional Linkages

Cultural industry clusters, as new organizational forms used to effectively allocateregional innovation resources, play a key role in promoting cultural industry coordination in the Yangtze River Economic Belt. It is essential to guide and actively construct a new map of cultural industry clusters across the 11 provinces and cities. Strengthening technical support from the Yangtze River Delta to the upstream and midstream regions and fully releasing the radiation effect of the Yangtze River Delta will promote gradient development, industrial transfer, and the differentiated development of cultural industries along the Yangtze River Economic Belt, forming a combination of points and areas, complementary advantages, and coordinated sharing. For example, in Jiangsu Province, accelerating the development of cultural industry clusters with national and international influences, such as the National Cultural and Technological Innovation Center, Literature Capital (Nanjing), Global Cultural and Creative Design Capital (Suzhou), National Digital Content Creative Base (Zhenjiang), and International Copyright Industry Demonstration Area (Nantong), will fully leverage the positive promotional effect of Jiangsu’s cultural industry on regional innovation.

4.2.3. Advance Cross-Industry Integration to Expand Cultural Support Functions

This new round of technological innovation and industrial transformation has accelerated the development of the digital cultural economy. The Yangtze River Delta should take the lead in exploring the fission and cross-industry integration of cultural industries, which will further enhance the high-quality development support role of the Yangtze River Cultural Industry Belt. The deep integration of culture, technology, finance, services, and manufacturing should be promoted. It is suggested that provinces and cities with strong cultural resources and capabilities along the Yangtze River Economic Belt take the lead in the integration of cultural industries and emerging industry layouts, focusing on creating new industrial forms through diverse integration modes such as penetrative, reorganizational, and extension-type integration. This will accelerate the “efficiency fission” of the cultural industry. Additionally, priority should be given to strengthening the integration of digital and cultural industries with tourism, sports, health, and other consumer services in the Yangtze River region.

4.2.4. Leverage Scientific and Educational Resources to Drive Innovation Diffusion

Many cities along the Yangtze River Economic Belt host numerous high-quality higher education institutions and research institutions. Efforts should be made to build technological innovation hubs and cultivate outstanding talent for the coordinated social and cultural development in the region. Scientific innovation should be fully utilised to enhance the diffusion of cultural and technological achievements. Major cultural and technological projects should be implemented in stages in the upstream, midstream, and downstream regions, and key core technologies should be tackled collaboratively. Joint efforts should be undertaken to implement scientific and technological achievements that benefit the public. The innovation-driven role should be maximised to drive the high-quality development of the cultural industry, establish a modernised, internationalised technology innovation community for the cultural industry in the Yangtze River Economic Belt, shape new international competitive cooperation advantages, and cultivate new growth poles in the region.

4.2.5. Stimulate Cultural Consumption and Strengthen Public Service Systems

We explore the cultural consumption potential of cities along the Yangtze River Economic Belt and push for the construction and improvement of public cultural services to achieve unified social and economic benefits. New cultural consumption business forms and models should be cultivated based on the economic development levels and stages of different regions to create new consumption hotspots. New consumption models based on digital platforms should be developed to stimulate the cultural consumption potential of residents. Activities such as digital cultural consumption seasons should be explored to encourage tourism attractions, museums, theme parks, and others to increase digital and experiential consumption projects, thus fostering new cultural consumption models. Simultaneously, it is essential to guide social forces to deeply participate in the construction and governance of public services. Therefore, a sound mechanism for participation in social forces, including entry and exit, should be established. Social resources for public services should be integrated, and the standardisation, equalisation, socialisation, and digitisation of public services should be actively promoted. This facilitated the transformation of public services into high-quality development models.
By systematically advancing these five strategic pathways, the Yangtze River Economic Belt is expected to build a resilient, highly coordinated, and innovation-driven sociocultural development community, which will not only strongly promote regional prosperity but also make a significant contribution to the broader goal of China’s high-quality modernisation.

Author Contributions

Conceptualization, Z.Y. and L.Q.; methodology, Z.Y.; software, L.Q.; validation, X.C., Z.Y. and L.Q.; formal analysis, X.C., Z.Y. and L.Q.; resources, Z.Y.; data curation, Z.Y.; writing—original draft preparation, Z.Y.; writing—review and editing, X.C., Z.Y. and L.Q.; visualization, Z.Y.; supervision, X.C.; project administration, Z.Y.; funding acquisition, Z.Y. All authors have read and agreed to the published version of the manuscript.

Funding

This research was funded by Shanghai Philosophy and Social Science Planning Project, grant number 2023BSH005.

Data Availability Statement

The original contributions presented in the study are included in the article; further inquiries can be directed to the corresponding author.

Conflicts of Interest

The authors declare no conflicts of interest.

References

  1. Xinhua News Agency. Xi Jinping Presided over a Symposium on Comprehensively Promoting the Development of the Yangtze River Economic Belt and Delivered an Important Speech [EB/OL]. Available online: https://www.gov.cn/xinwen/2020-11/15/content_5561711.htm?eqid=d6119ca80000e15d0000000664756bd0 (accessed on 15 January 2024).
  2. Zhou, S. From Yellow River Culture to Yangtze River Culture: Thoughts on the Shift of Chinese Cultural Focus and Its Contemporary Shift[EB/OL]. Available online: http://philosophychina.cssn.cn/fzxk/whzx/201507/t20150714_2730888.shtml (accessed on 11 February 2024).
  3. Zhang, Y. A Deep Understanding of the Connotation of Yangtze River Culture [N]. Study Times, 8 February 2021; A5 Edition. [Google Scholar]
  4. Si, H. A discussion on Yangtze River culture and its research. Soc. Sci. 1991, 5, 63–65. [Google Scholar]
  5. Xiao, J.; Shang, Z.; Zhang, Z.; Xiao, S.; Jia, X. A preliminary study on the mechanism of the Liangzhu culture’s migration across the Yangtze river. Front. Earth Sci. 2023, 11, 1121469. [Google Scholar] [CrossRef]
  6. Lin, Y.; Wang, X. Regional characteristics and cultural effects of Yangtze River culture in Qing Dynasty. Yangtze River Cult. 2001, 10, 34–37. [Google Scholar]
  7. Du, Y. Research on the protection of intangible cultural heritage with hidden economic value in the Yangtze River Economic Belt. J. Qinghai Normal Univ. 2019, 41, 69–76. [Google Scholar]
  8. Nie, Z.; Dong, T.; Pan, W. Spatial differentiation and geographical similarity of traditional villages—Take the Yellow River Basin and the Yangtze River Basin as examples. PLoS ONE 2024, 19, e0295854. [Google Scholar] [CrossRef]
  9. Xiong, Y.; Shi, P.; Li, X. Dynamic study on the construction level of “Beautiful China” in the Yangtze River economic belt. East China Econ. Manag. 2017, 9, 5–13. [Google Scholar]
  10. Zeng, G.; Cao, X.; Zhu, Y. Coordinated development pattern and prospects of cities in the Yangtze River economic belt. Resour. Environ. Yangtze River Basin 2022, 31, 1685–1693. [Google Scholar]
  11. Paasi, A. Bounded spaces in the mobile world: Deconstructing ‘regional identity’. Tijdschr. Voor Econ. En Sociale Geografie 2002, 93, 137–148. [Google Scholar] [CrossRef]
  12. Yin, J.; Zheng, X. Safety assessment and safety pattern of tourism industry ecosystem in the Yangtze River Economic Belt. East Chin. Econ. Manag. 2017, 4, 60–65. [Google Scholar]
  13. Ma, N.; Yao, Y.; Shen, T. Differentiated path of economic synergistic development among cities in the Yangtze River Economic Belt. Econ. Geogr. 2023, 43, 79–90. [Google Scholar]
  14. Huang, H.; Wang, R.; Xiao, Y. Synergistic evolution and influencing factors of scientific and technological innovation and ecological efficiency in the Yangtze River economic belt. Resour. Environ. Yangtze River Basin 2024, 33, 671–686. [Google Scholar]
  15. Liu, Z.; Chen, C.; Ye, M. Promoting the high-quality development of the Yangtze River economic belt by regional synergy and integration. Contemp. Financ. Econ. 2024, 2, 3–10. [Google Scholar]
  16. Yu, Z.; Zhao, Q. Research on the coordinated governance mechanism of cross-regional and cross-basin ecological compensation in the Yangtze River Delta. Int. J. Environ. Res. Public Health 2022, 19, 9881. [Google Scholar] [CrossRef]
  17. Qiao, W.; Guan, W.; Huang, X. Assessing the potential impact of land use on carbon storage driven by economic growth: A case study in Yangtze River Delta urban agglomeration. Int. J. Environ. Res. Public Health 2021, 18, 11924. [Google Scholar] [CrossRef]
  18. Haken, H. Synergetik: Eine Einführung. Nichtgleichgewichts-Phasenübergänge und Selbstorganisation in Physik, Chemie und Biologie; Springer: Berlin/Heidelberg, Germany, 2013. [Google Scholar]
  19. Haken, H. Synergetics: An Introduction Nonequilibrium Phase Transitions and Self-Organization in Physics, Chemistry and Biology; Springer: Berlin/Heidelberger, Germany, 1977; pp. 186–194. [Google Scholar]
  20. Zhang, K.; Cai, Z. The history review, limiting factors and future direction of the collaborative development of the Beijing-Tianjin-Hebei region development. Hebei Acad. J. 2014, 34, 101–105. [Google Scholar]
  21. Ma, H. Evolutionary networks of interurban technological collaboration across Chinese city-regions. Reg. Stud. Reg. Sci. 2022, 9, 457–460. [Google Scholar] [CrossRef]
  22. Hong, W.; Li, Y.; Yang, X.; Guo, R.; Liang, M.; Li, X. Identification of intercity ecological synergy regions and measurement of the corresponding policy network structure: A network analysis perspective. Landscape Urban Plan. 2024, 245, 105008. [Google Scholar] [CrossRef]
  23. Xu, S.; Liu, Q.; Sun, H. Economic coordination development from the perspective of cross-regional urban agglomerations in China. Reg. Sci. Policy Pract. 2022, 14, 36–59. [Google Scholar] [CrossRef]
  24. Zhou, W.; Dong, H.; An, S. Mechanism and spatial differentiation characteristics of coordinated development in the Beijing-Tianjin-Hebei urban agglomeration: Calculation and evaluation based on DEA model. China Soft Sci. 2023, 8, 73–85. [Google Scholar]
  25. Storm, J.A.J. Metamodernism. In The Future of Theory; The University of Chicago Press: Chicago, IL, USA, 2021; 328p, ISBN 978-0-226-78665-0. [Google Scholar]
  26. Matlovič, R.; Matlovičová, K. The Metamodern Shift in Geographical Thought: Oscillatory Ontology and Epistemology, Post-disciplinary and Post-paradigmatic Perspectives. Folia Geogr. 2025, 67, 22–69. [Google Scholar]
  27. Tang, T.; Lin, X.; Lu, M. Analysis of the dynamic mechanism of trans-boundary pollution collaborative control in the Yangtze River Economic Belt. Environ. Res. 2024, 257, 119327. [Google Scholar] [CrossRef] [PubMed]
  28. Zhao, C.; Liu, Z. Spatial distribution characteristics of digital economy enterprises in urban agglomerations. Econ. Geogr. 2024, 44, 126–133. [Google Scholar]
Figure 1. Technical roadmap diagram of study.
Land 14 01226 g001
Figure 2. Rank-size distribution of social and cultural coordination sores of Cities in Yangtze River Economic Belt in 2021.
Land 14 01226 g002
Figure 3. Rank-size distribution of social and cultural coordination scores of cities in Yangtze River Economic Belt.
Land 14 01226 g003
Figure 4. Changes in social and cultural coordination development capacity of three major city Clusters in Yangtze River Economic Belt from 2011 to 2021.
Land 14 01226 g004
Figure 5. Theil Index of social and cultural coordination development of three major city clusters in Yangtze River Economic Belt from 2011 to 2021.
Land 14 01226 g005
Table 1. Evaluation indicator system for the social and cultural coordination index of the Yangtze River Economic Belt.
Goal LayerFactor LayerIndicator LayerUnitDirection
Social and Cultural Coordination Development of the Yangtze River Economic BeltEducational ResourcesEducational Expenditure10,000 RMB+
Number of General Higher Education InstitutionsInstitution+
Number of Primary and Secondary SchoolsInstitution+
Healthcare ConditionsNumber of HospitalsInstitution+
Number of Practicing or Assistant PhysiciansPerson+
Number of Hospital BedsBeds+
Social SecurityNumber of Urban Employee Pension Insurance ParticipantsTen Thousand People+
Number of Unemployment Insurance ParticipantsTen Thousand People+
Urban–Rural DifferencesUrbanization Rate%+
Urban–Rural Income GapYuan
Cultural IntegrationNumber of People Employed in the Cultural IndustryTen Thousand People+
Number of Books in Public LibrariesThousand Books+
Number of National Intangible Cultural Heritage ItemsItem+
Note: In the table, “+” indicates a positive indicator, meaning that the larger the value, the greater the promoting effect on the level of urban socio-cultural coordinated development; “−” indicates a negative indicator, meaning that the larger the value, the greater the adverse impact on coordinated development.
Table 2. Sociocultural coordination development capacity index of cities in the Yangtze River Economic Belt from 2011 to 2021.
YearSocioculturalEducation ResourcesMedical ConditionsSocial SecurityUrban–Rural DifferencesCultural Integration
201115.6612.2114.175.3338.578.00
201215.9912.6514.75.0239.198.37
201316.5612.7913.425.2843.028.28
201416.8713.0613.535.5844.197.99
201515.6513.3013.515.3237.738.39
201617.2513.0313.714.6846.947.88
201717.4613.2913.664.7947.767.81
201817.6113.1713.445.0648.427.97
201917.7512.9813.545.1749.038.02
202017.0313.5713.645.4444.338.19
202115.6313.0913.605.9237.498.04
Note: The values represent the scores of socio-cultural coordination capacity of cities in the YREB.
Table 3. Theil Index of sociocultural coordination development in the Yangtze River Economic Belt from 2011 to 2021.
YearSocioculturalEducation ResourcesMedical ConditionsSocial SecurityUrban–Rural DifferencesCultural Integration
20110.11480.19690.30971.01640.03190.5999
20120.11540.19370.30421.11130.03230.6030
20130.10290.19920.34101.06940.02470.6392
20140.10100.1970.32951.02180.02500.5997
20150.12550.19140.32341.10960.02940.6011
20160.09260.18500.33261.15560.01860.5800
20170.09750.18130.42021.15370.01730.5878
20180.09950.19200.42221.12740.01700.5899
20190.09870.19550.40451.11560.01610.6028
20200.11790.18730.39051.12480.02710.5846
20210.15450.21640.41231.12710.03900.5757
Note: The values represent the Theil Index of coordinated sociocultural development level.
Table 4. Calculated results of social and cultural synergistic development capacity of cities in the Yangtze River Economic Belt in 2021.
RankCityScoreRankCityScoreRankCityScore
1Shanghai75.8838Lianyungang14.1375Shangrao11.47
2Chongqing58.6439Zhuzhou14.0476Yibin11.44
3Chengdu56.9840Ganzhou13.9977Fuzhou11.43
4Hangzhou44.3741Zunyi13.8478Luzhou11.38
5Wuhan40.4842Jingzhou13.8279Xianning11.35
6Nanjing35.0543Dazhou13.880Anqing11.22
7Changsha31.3644Yueyang13.7281Huaibei11.18
8Suzhou31.3545Shaoyang13.3782Xuancheng10.95
9Hefei27.9346Suizhou13.3783Huainan10.92
10Ningbo26.5547Ezhou13.3684Leshan10.85
11Kunming25.7648Changde13.385Ya’an10.75
12Wuxi23.5349Xiangtan13.2286Meishan10.55
13Nanchang21.9650Mianyang12.9587Bengbu10.53
14Guiyang21.8851Jiujiang12.9588Bijie10.48
15Wenzhou20.852Huangshan12.8889Fuyang10.43
16Xuzhou19.9553Nanchong12.8490Jingdezhen10.37
17Changzhou18.854Lishui12.7691Loudi9.91
18Nantong18.5855Ma’anshan12.7292Jian9.78
19Suqian18.4756Jingmen12.793Neijiang9.71
20Shaoxing18.0957Shiyan12.6394Lu’an9.37
21Chizhou18.0358Chenzhou12.5495Guang’an9.3
22Jinhua17.6759Yiyang12.4996Suzhou9.18
23Yangzhou17.4960Xiaogan12.4597Guangyuan9.17
24Yancheng17.2261Deyang12.4398Qujing8.66
25Zhoushan17.1862Pingxiang12.4199Tongren8.56
26Jiaxing17.1663Zigong12.15100Liupanshui8.47
27Yichang16.9764Yongzhou12.09101Yuxi8.45
28Zhenjiang16.5665Huangshi12.05102Ziyang8.21
29Xinyu16.4166Tongling12.02103Anshun8.12
30Wuhu15.8467Suining11.96104Bazhong8.09
31Panzhihua15.5268Chuzhou11.91105Zhaotong7.7
32Taizhou (Jiangsu)14.5569Huaihua11.87106Bozhou7.52
33Hengyang14.570Huanggang11.82107Lijiang6.76
34Huzhou14.4271Yingtan11.77108Pu’er6.68
35Taizhou (Zhejiang)14.472Quzhou11.76109Lincang5.63
36Huai’an14.2673Zhangjiajie11.71110Baoshan4.31
37Xiangyang14.2174Yichun11.62
Table 5. Global Moran’s I of Urban Socio-Cultural Coordinated Development Capacity in the Yangtze River Economic Belt from 2011 to 2021.
201120162021
Coordinated Development LevelGlobal Moran’s Ip-ValueGlobal Moran’s Ip-ValueGlobal Moran’s Ip-Value
Overall Level0.00960.16170.00600.26560.01280.0511
Educational Resources0.00530.3119−0.00200.61920.01670.0747
Medical Conditions−0.00550.7868−0.00920.9981−0.00790.9259
Social Security0.02200.00950.02570.00280.01510.0655
Urban–Rural Disparities0.08240.00000.10990.00000.11440.0000
Cultural Integration0.03440.00060.02550.00830.02420.0104
Disclaimer/Publisher’s Note: The statements, opinions and data contained in all publications are solely those of the individual author(s) and contributor(s) and not of MDPI and/or the editor(s). MDPI and/or the editor(s) disclaim responsibility for any injury to people or property resulting from any ideas, methods, instructions or products referred to in the content.

