

The Evolution of the Interaction Between Urban Rail Transit and Land Use: A CiteSpace-Based Knowledge Mapping Approach


Abstract
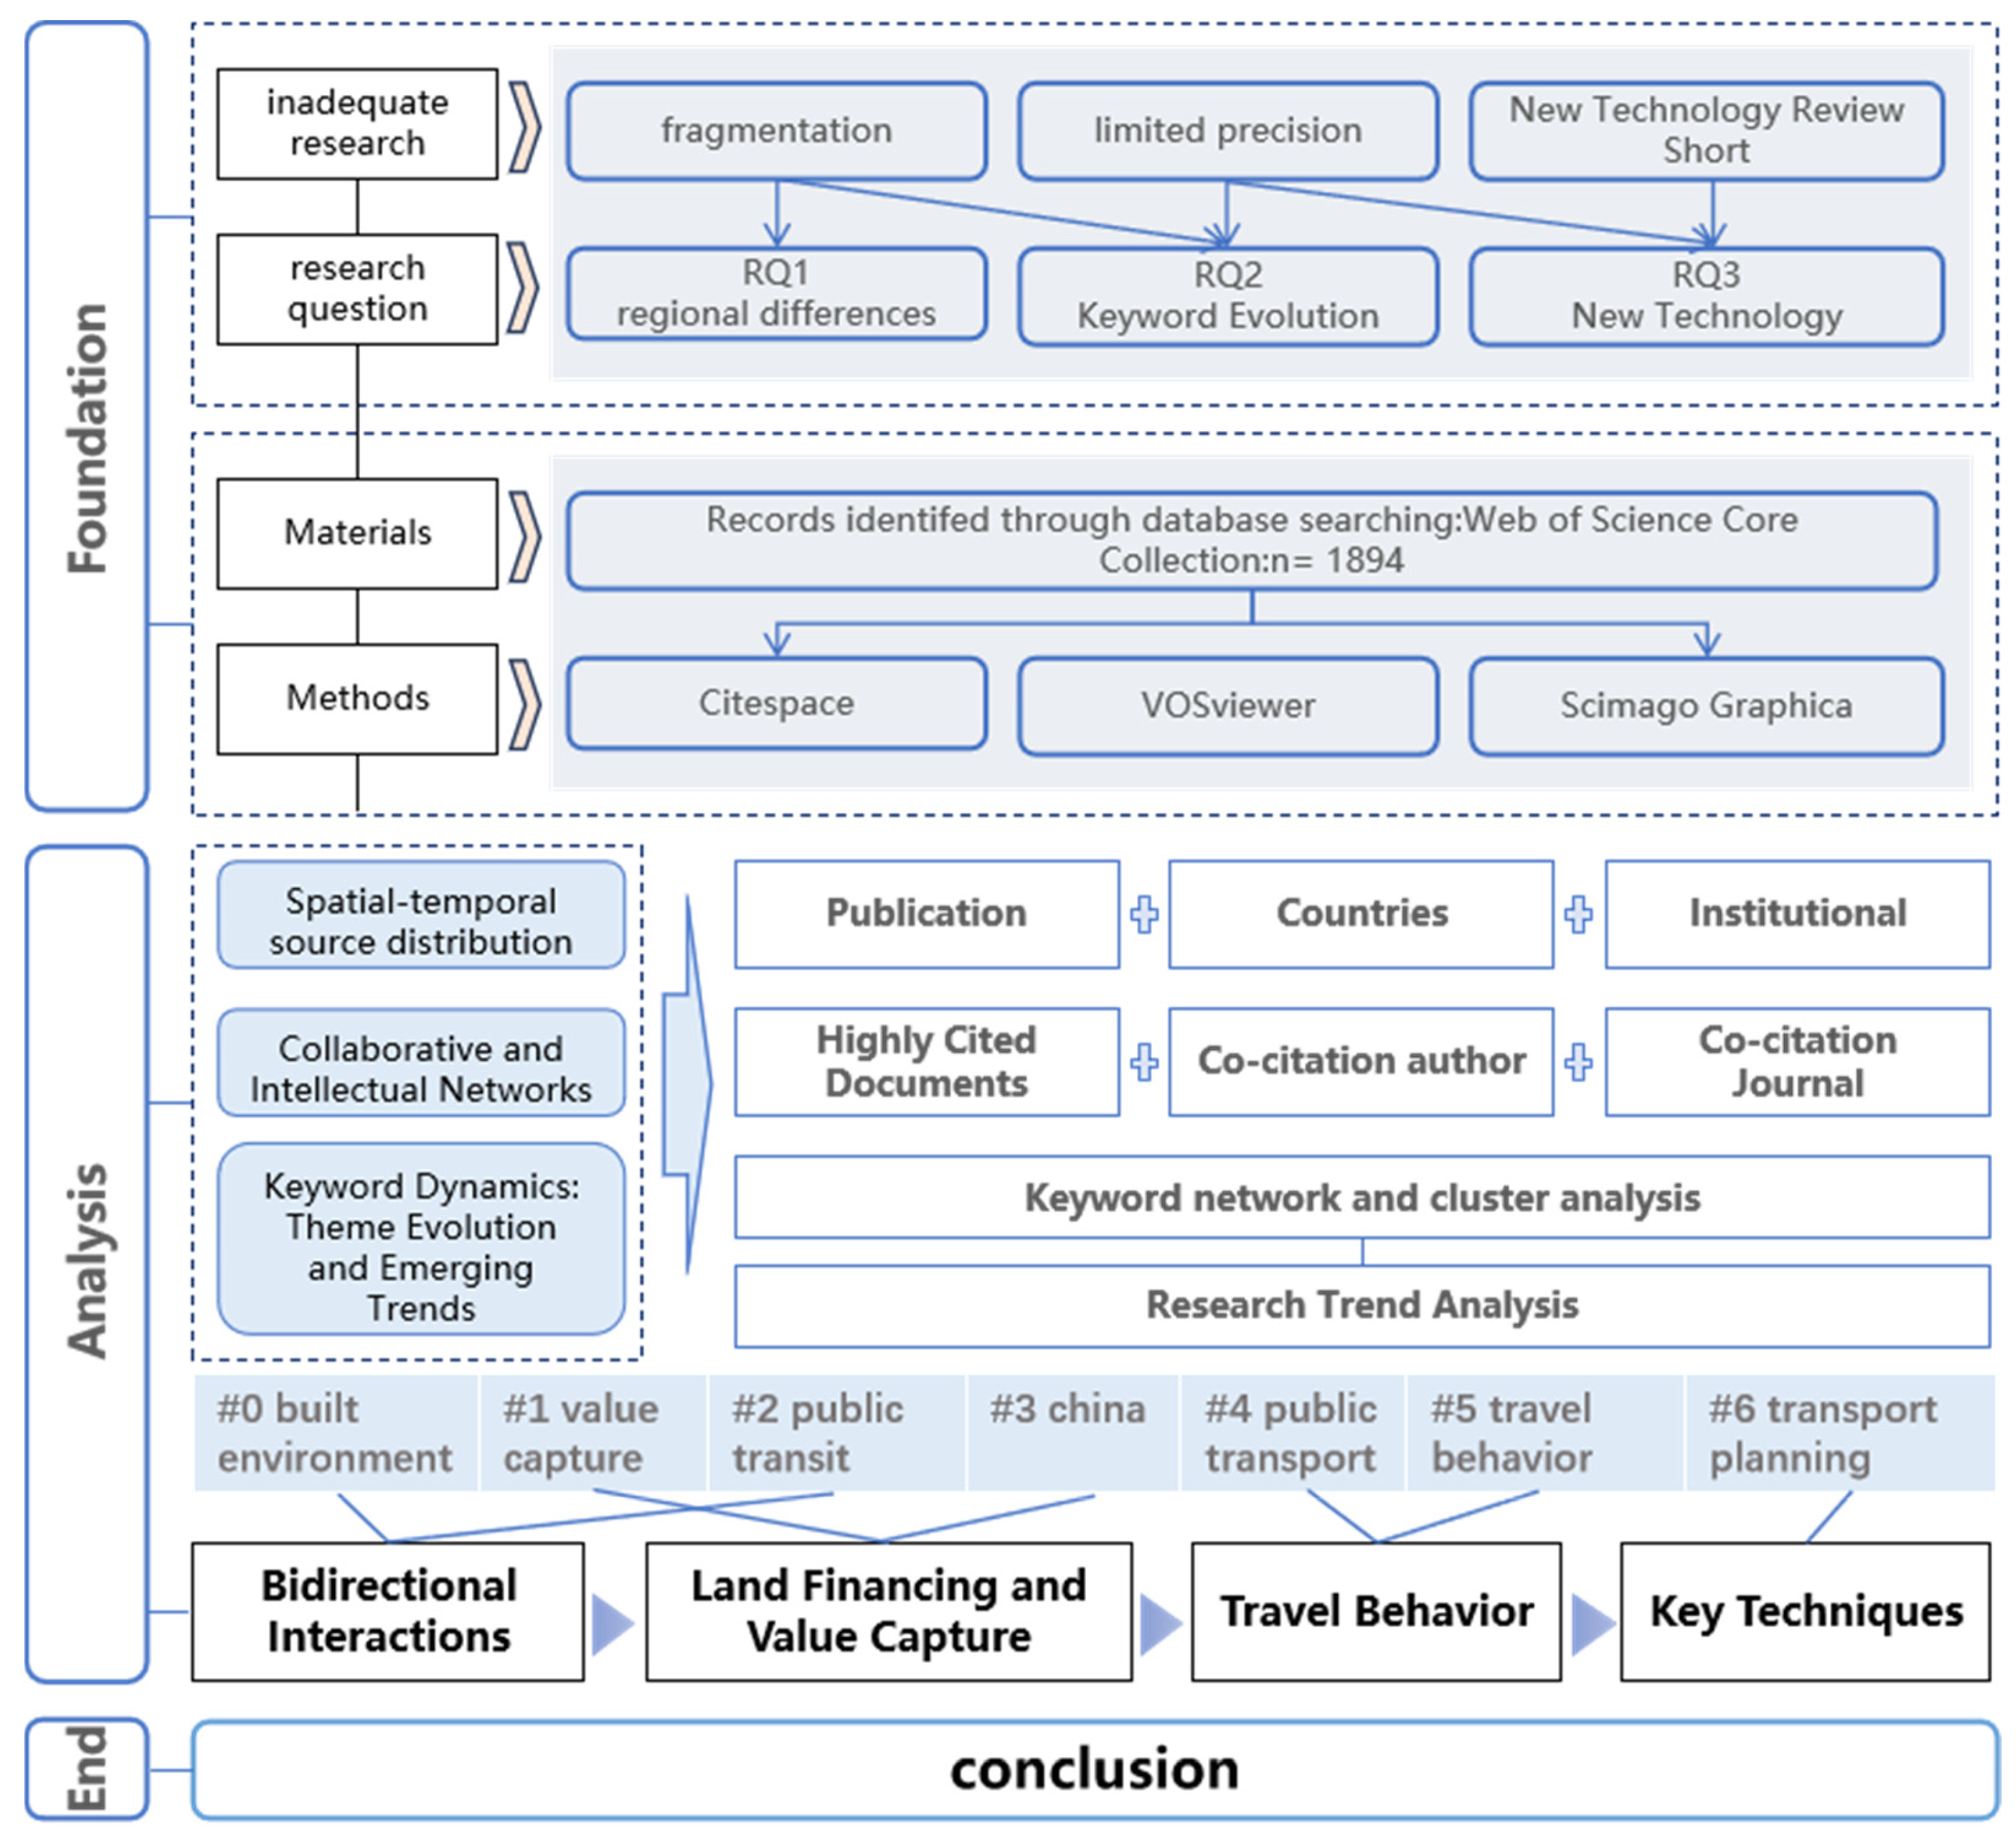
1. Introduction
- RQ1: What are the global research trends in this field?
- RQ2: How have key research themes evolved over time?
- RQ3: How are emerging technologies changing research methods in this field?
2. Materials and Methods
2.1. Data Collection
2.2. Bibliometric Methods
3. Performance Analysis
3.1. Spatial-Temporal and Source Distribution Characteristics
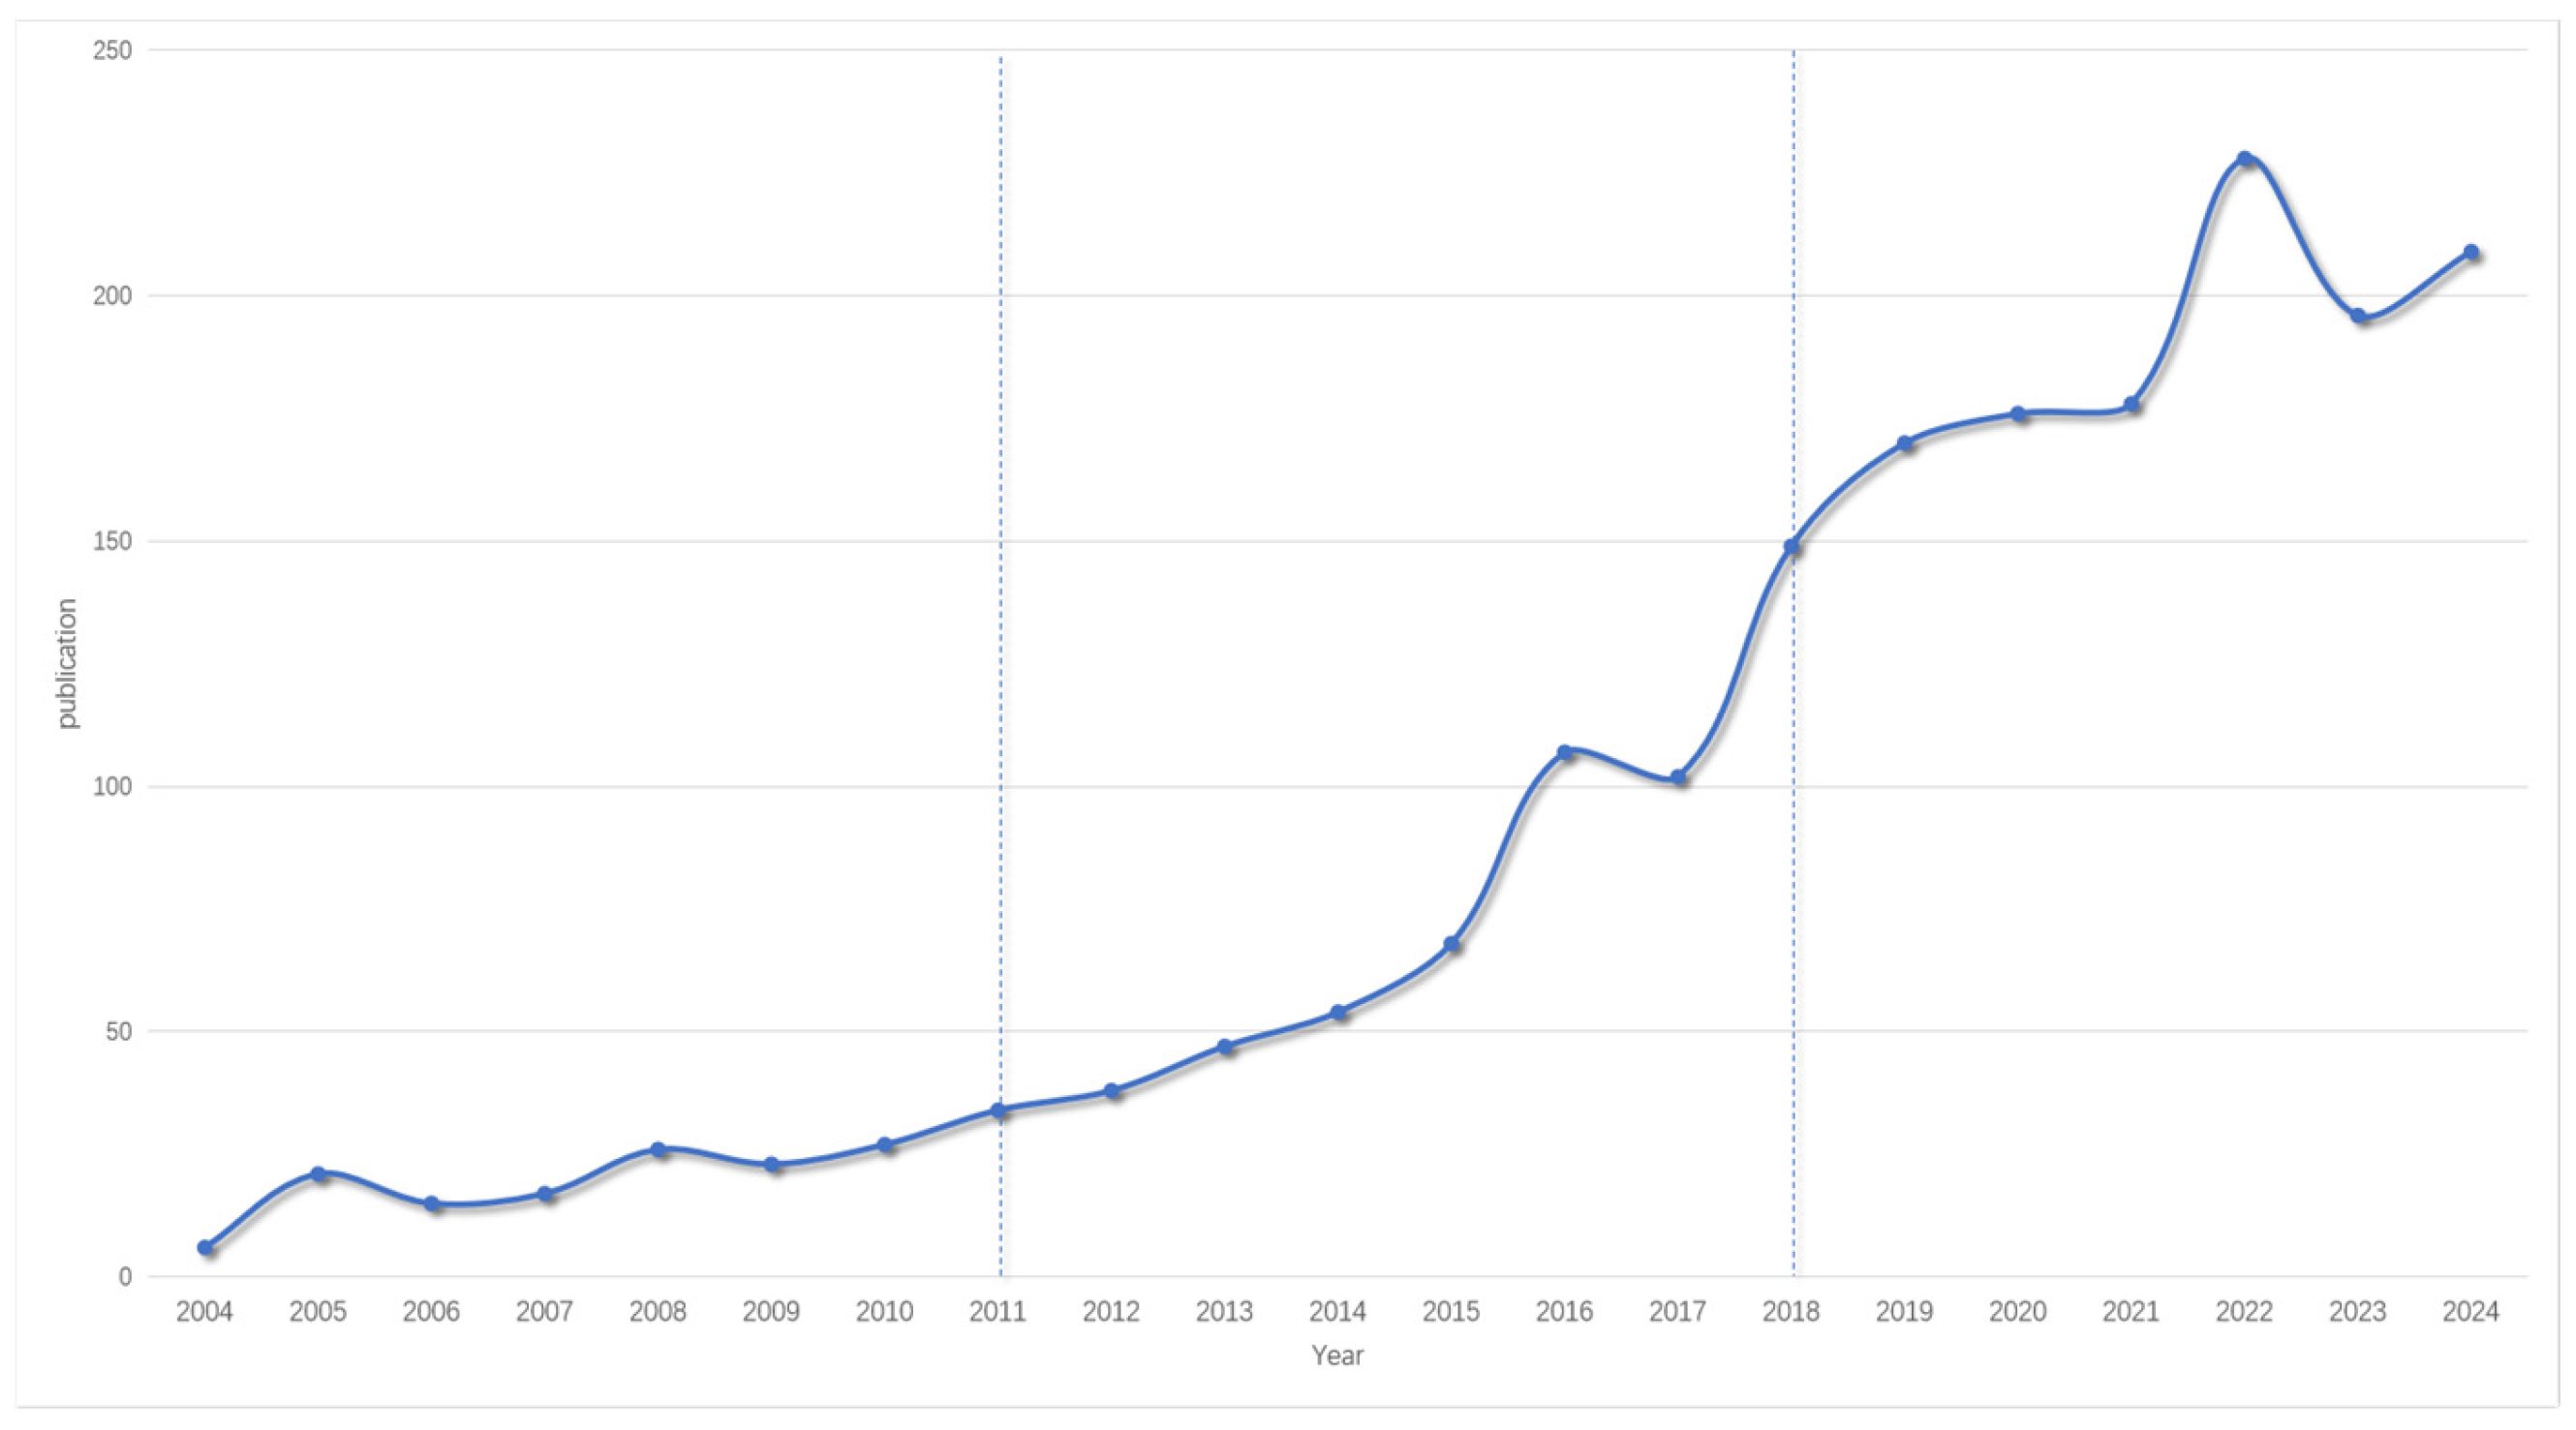
3.1.1. Publication Trends
3.1.2. Analysis of Countries
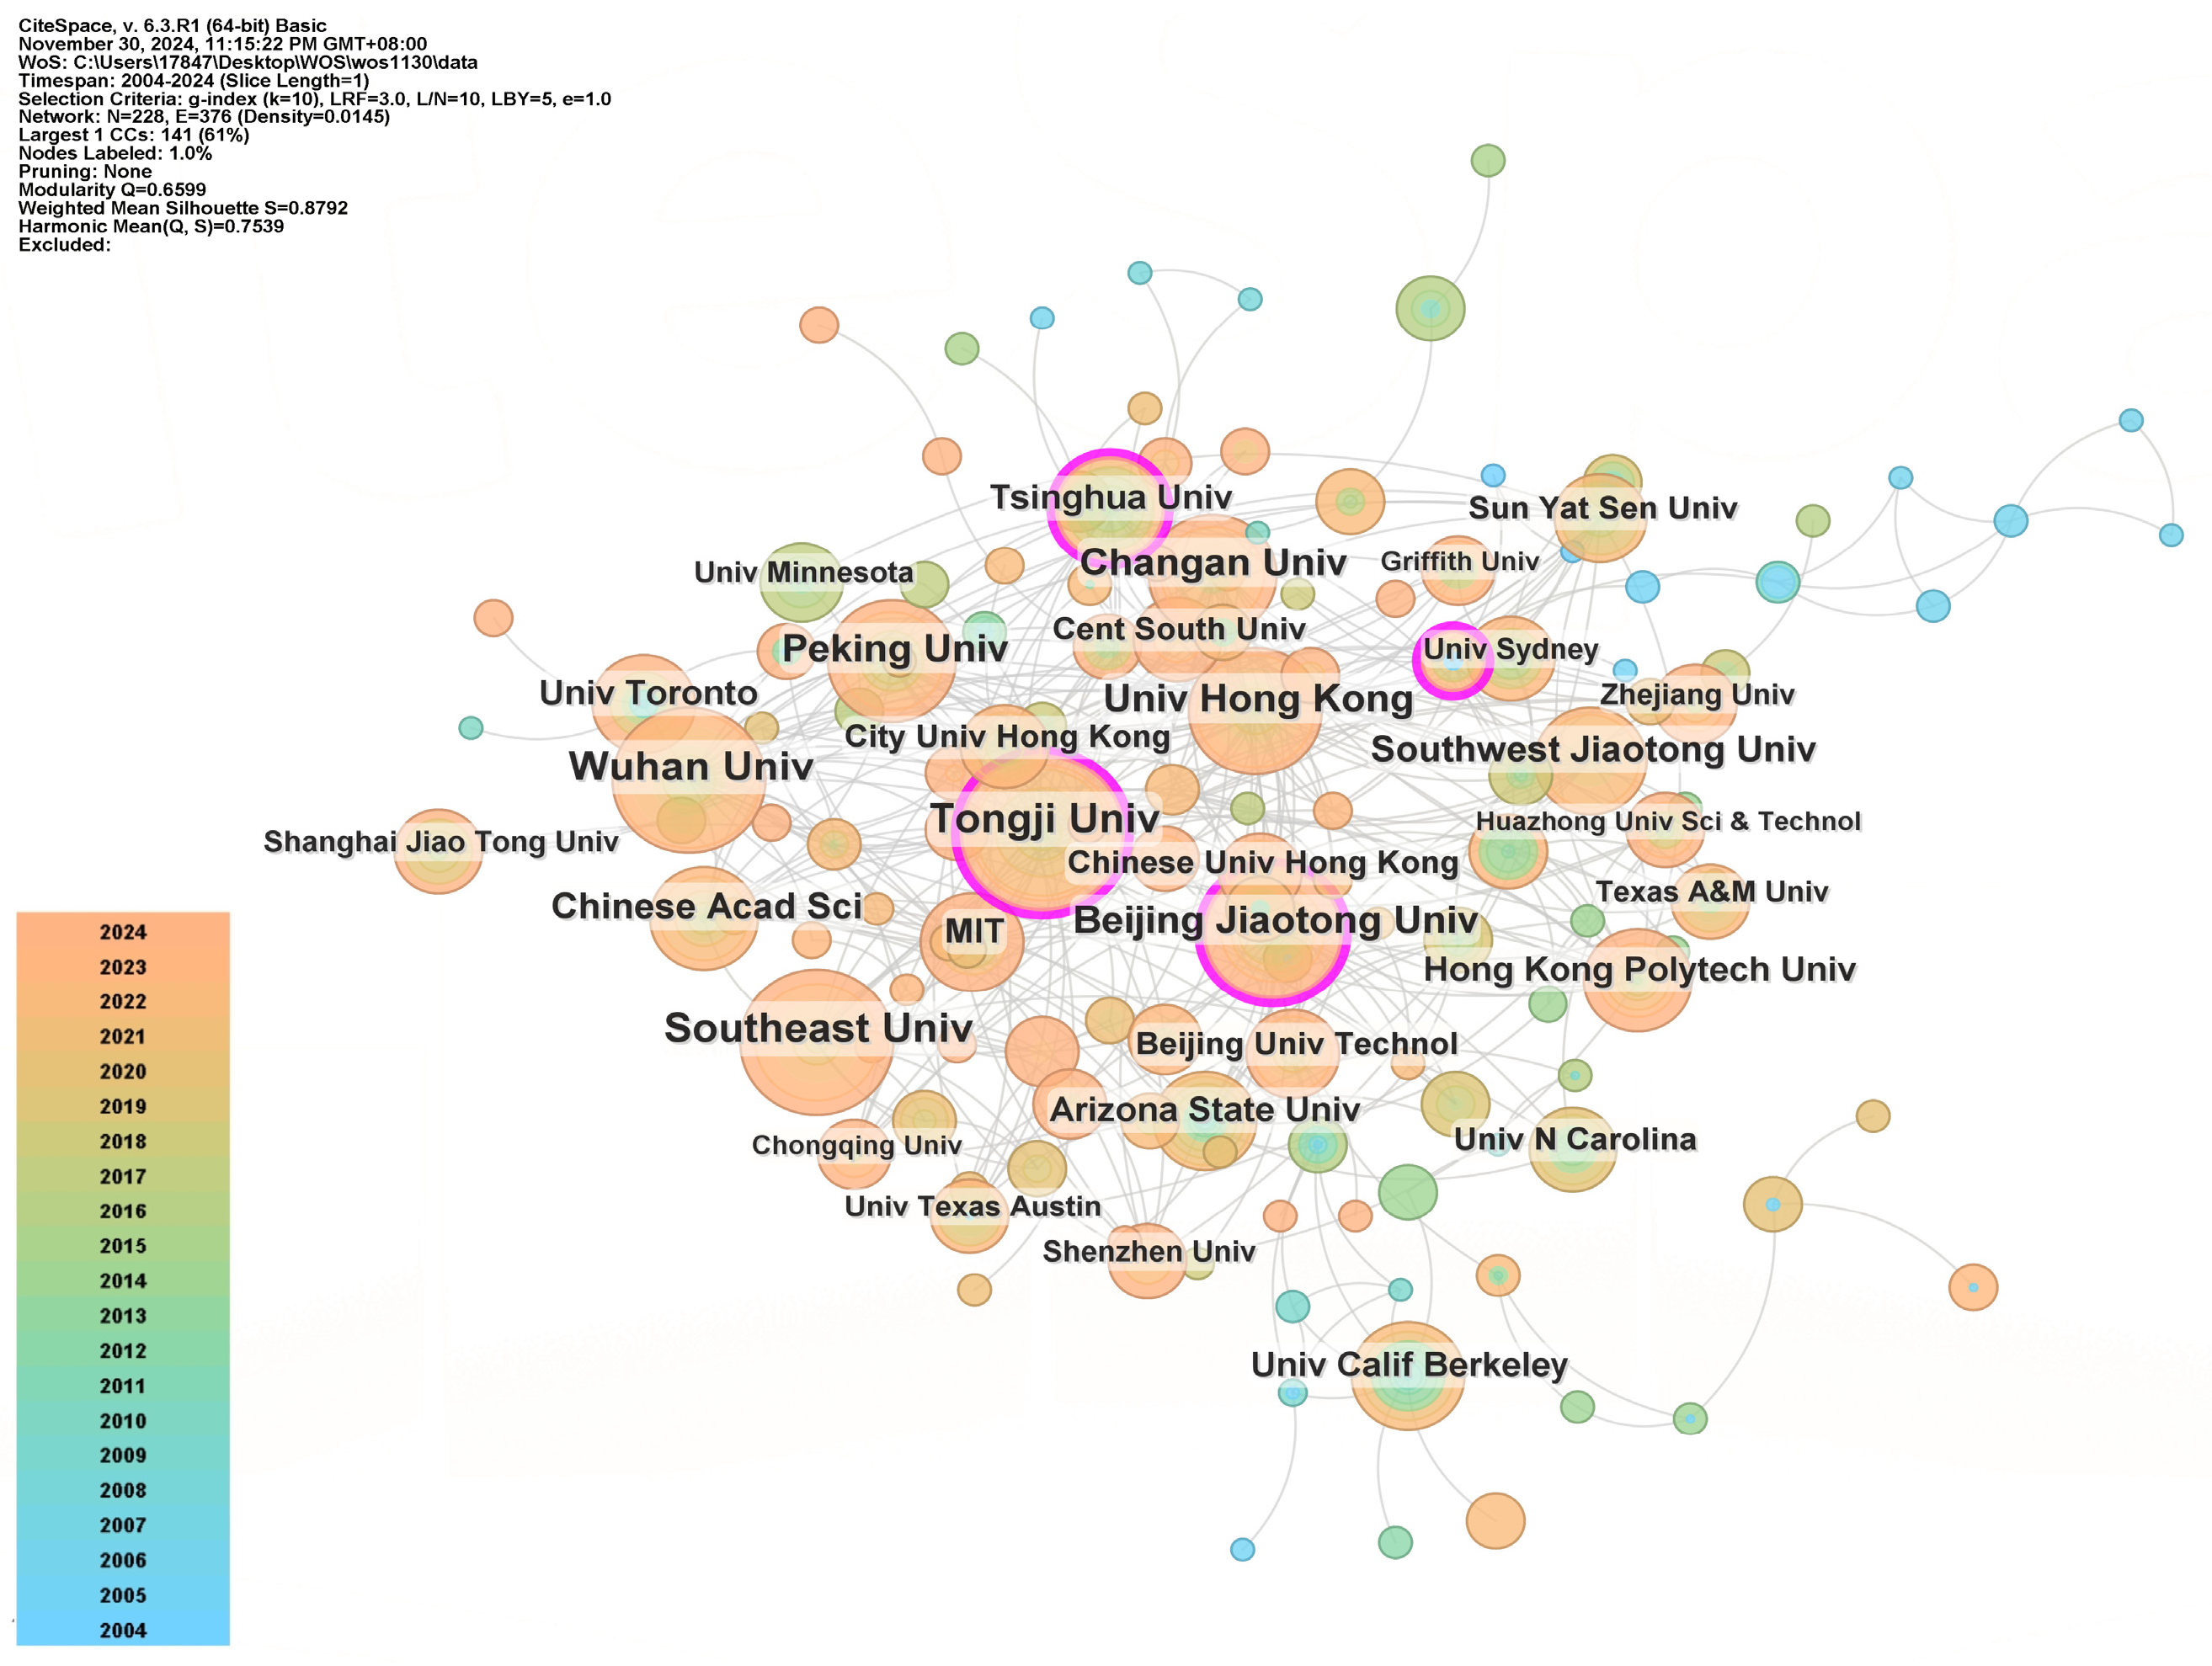
3.1.3. Institutional Analysis
3.2. Collaborative and Intellectual Networks
3.2.1. Analysis of Co-Cited Documents
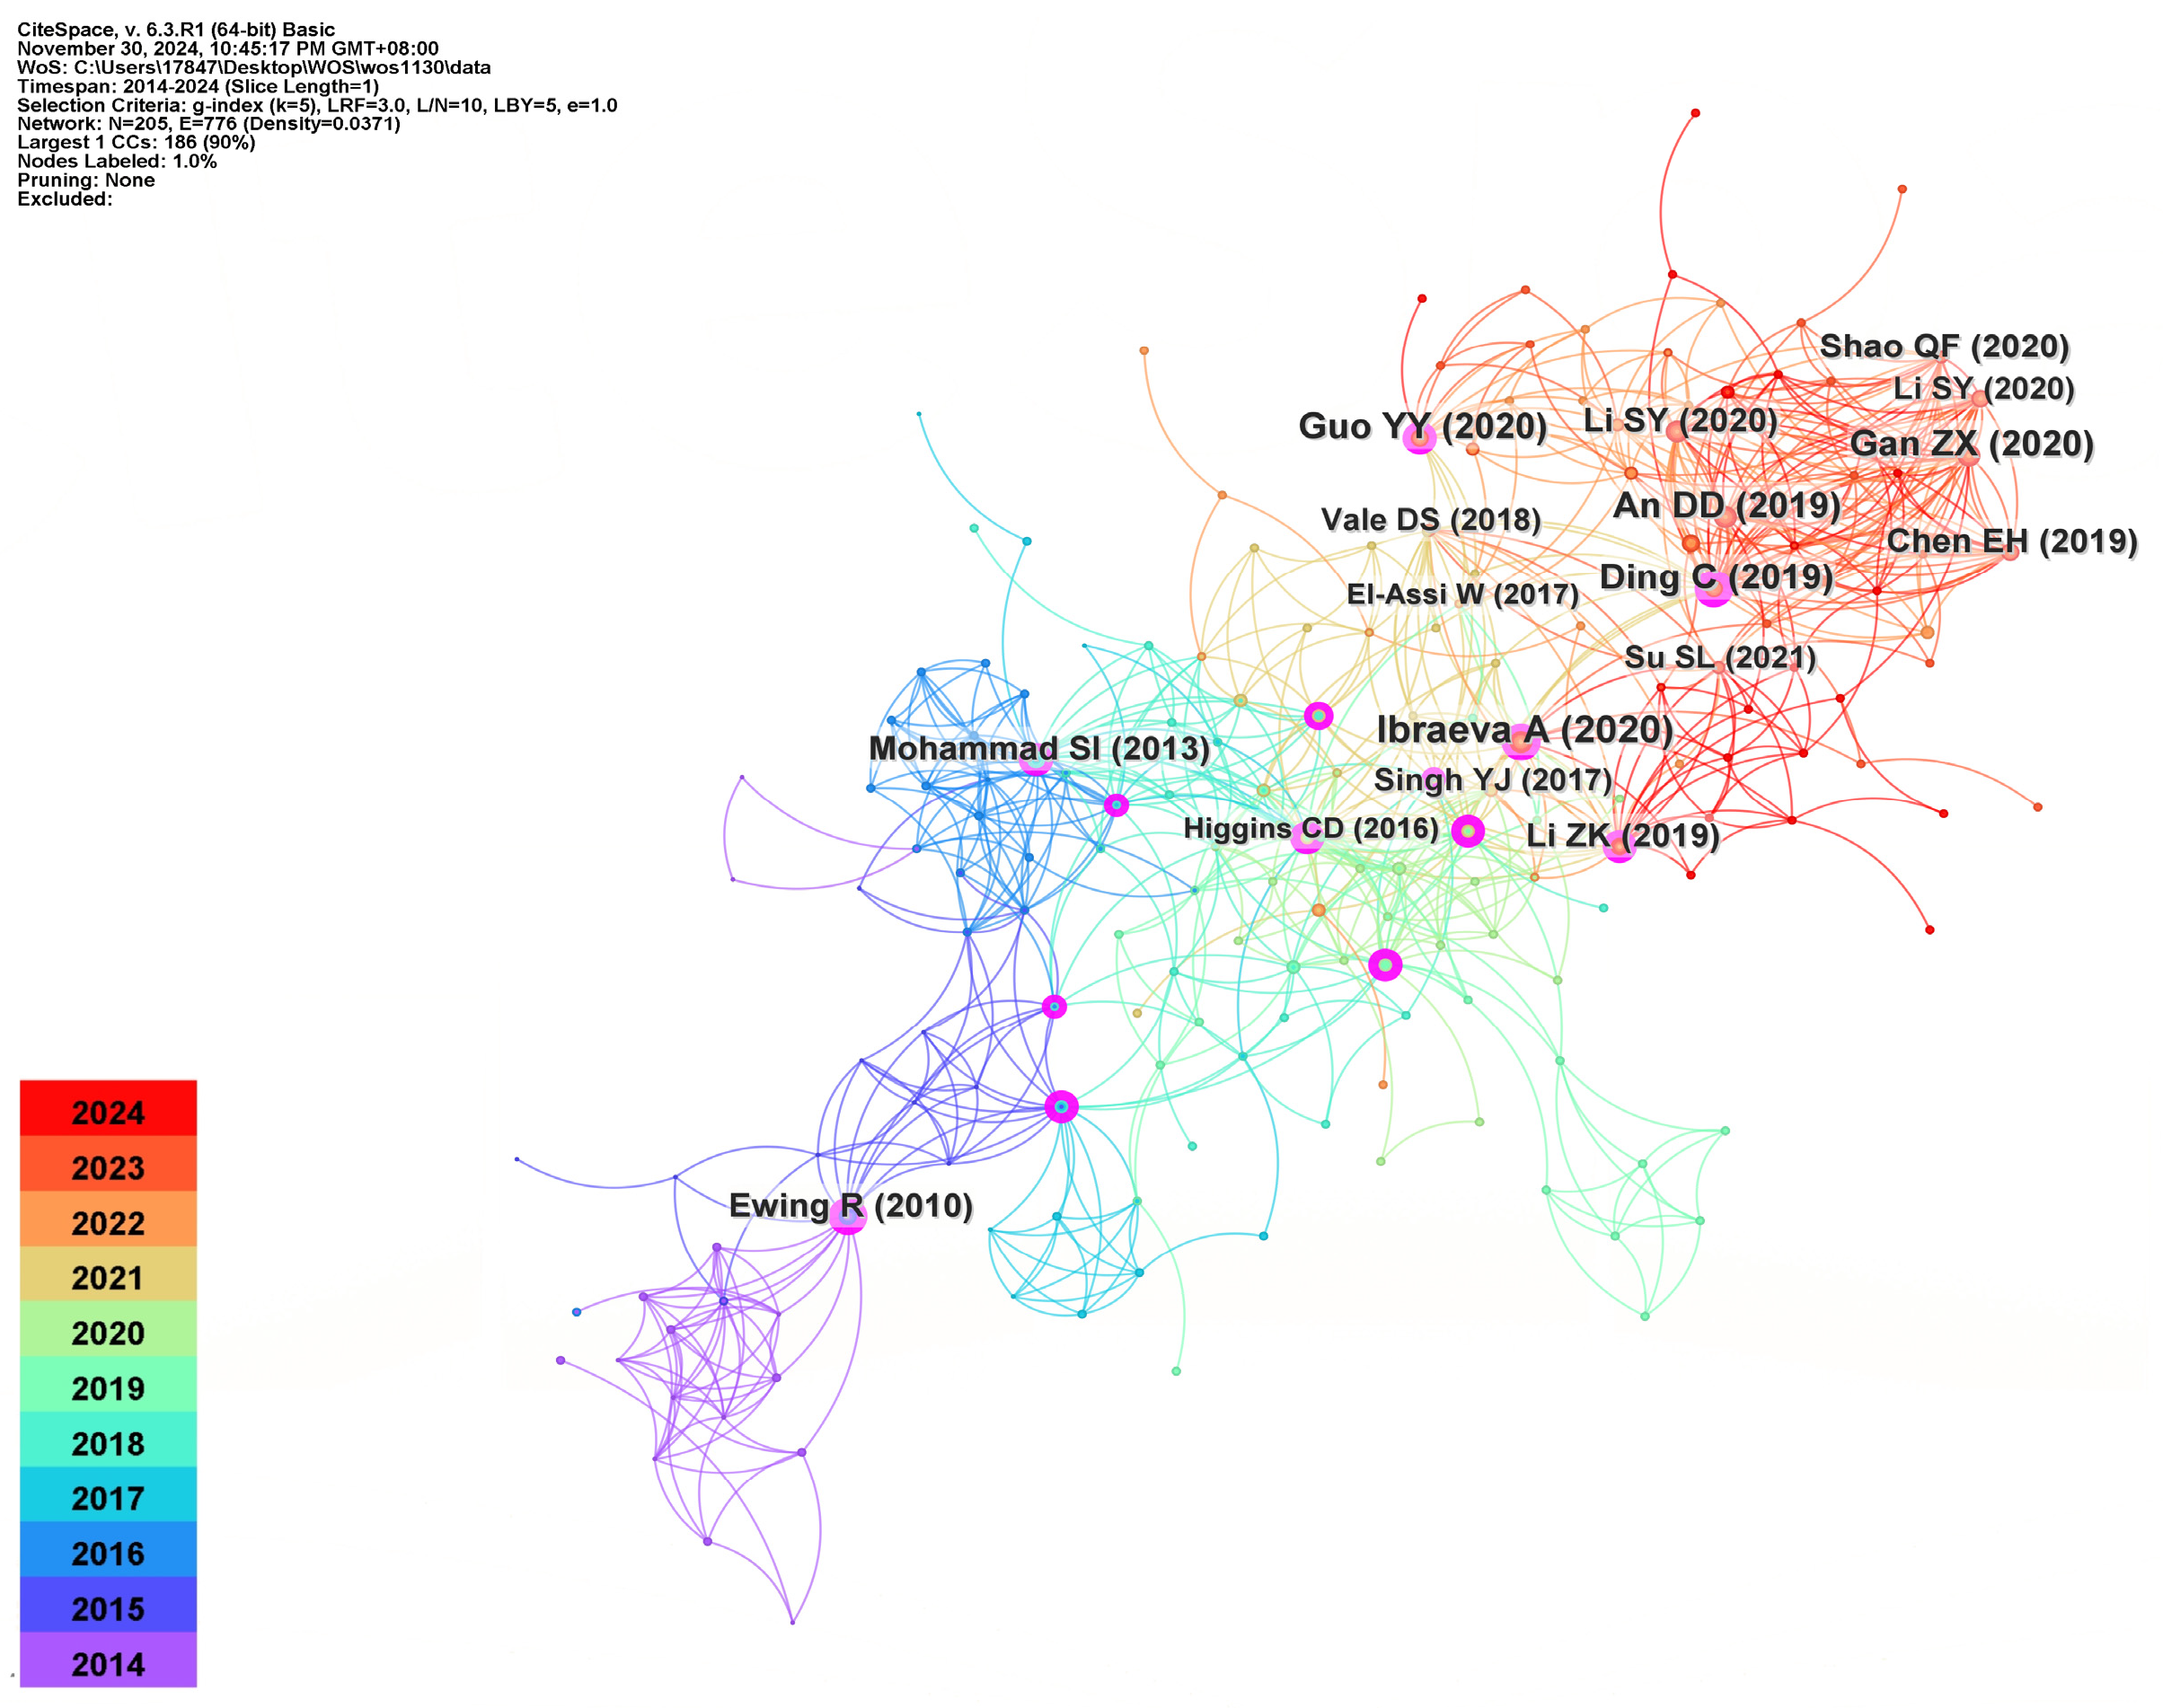
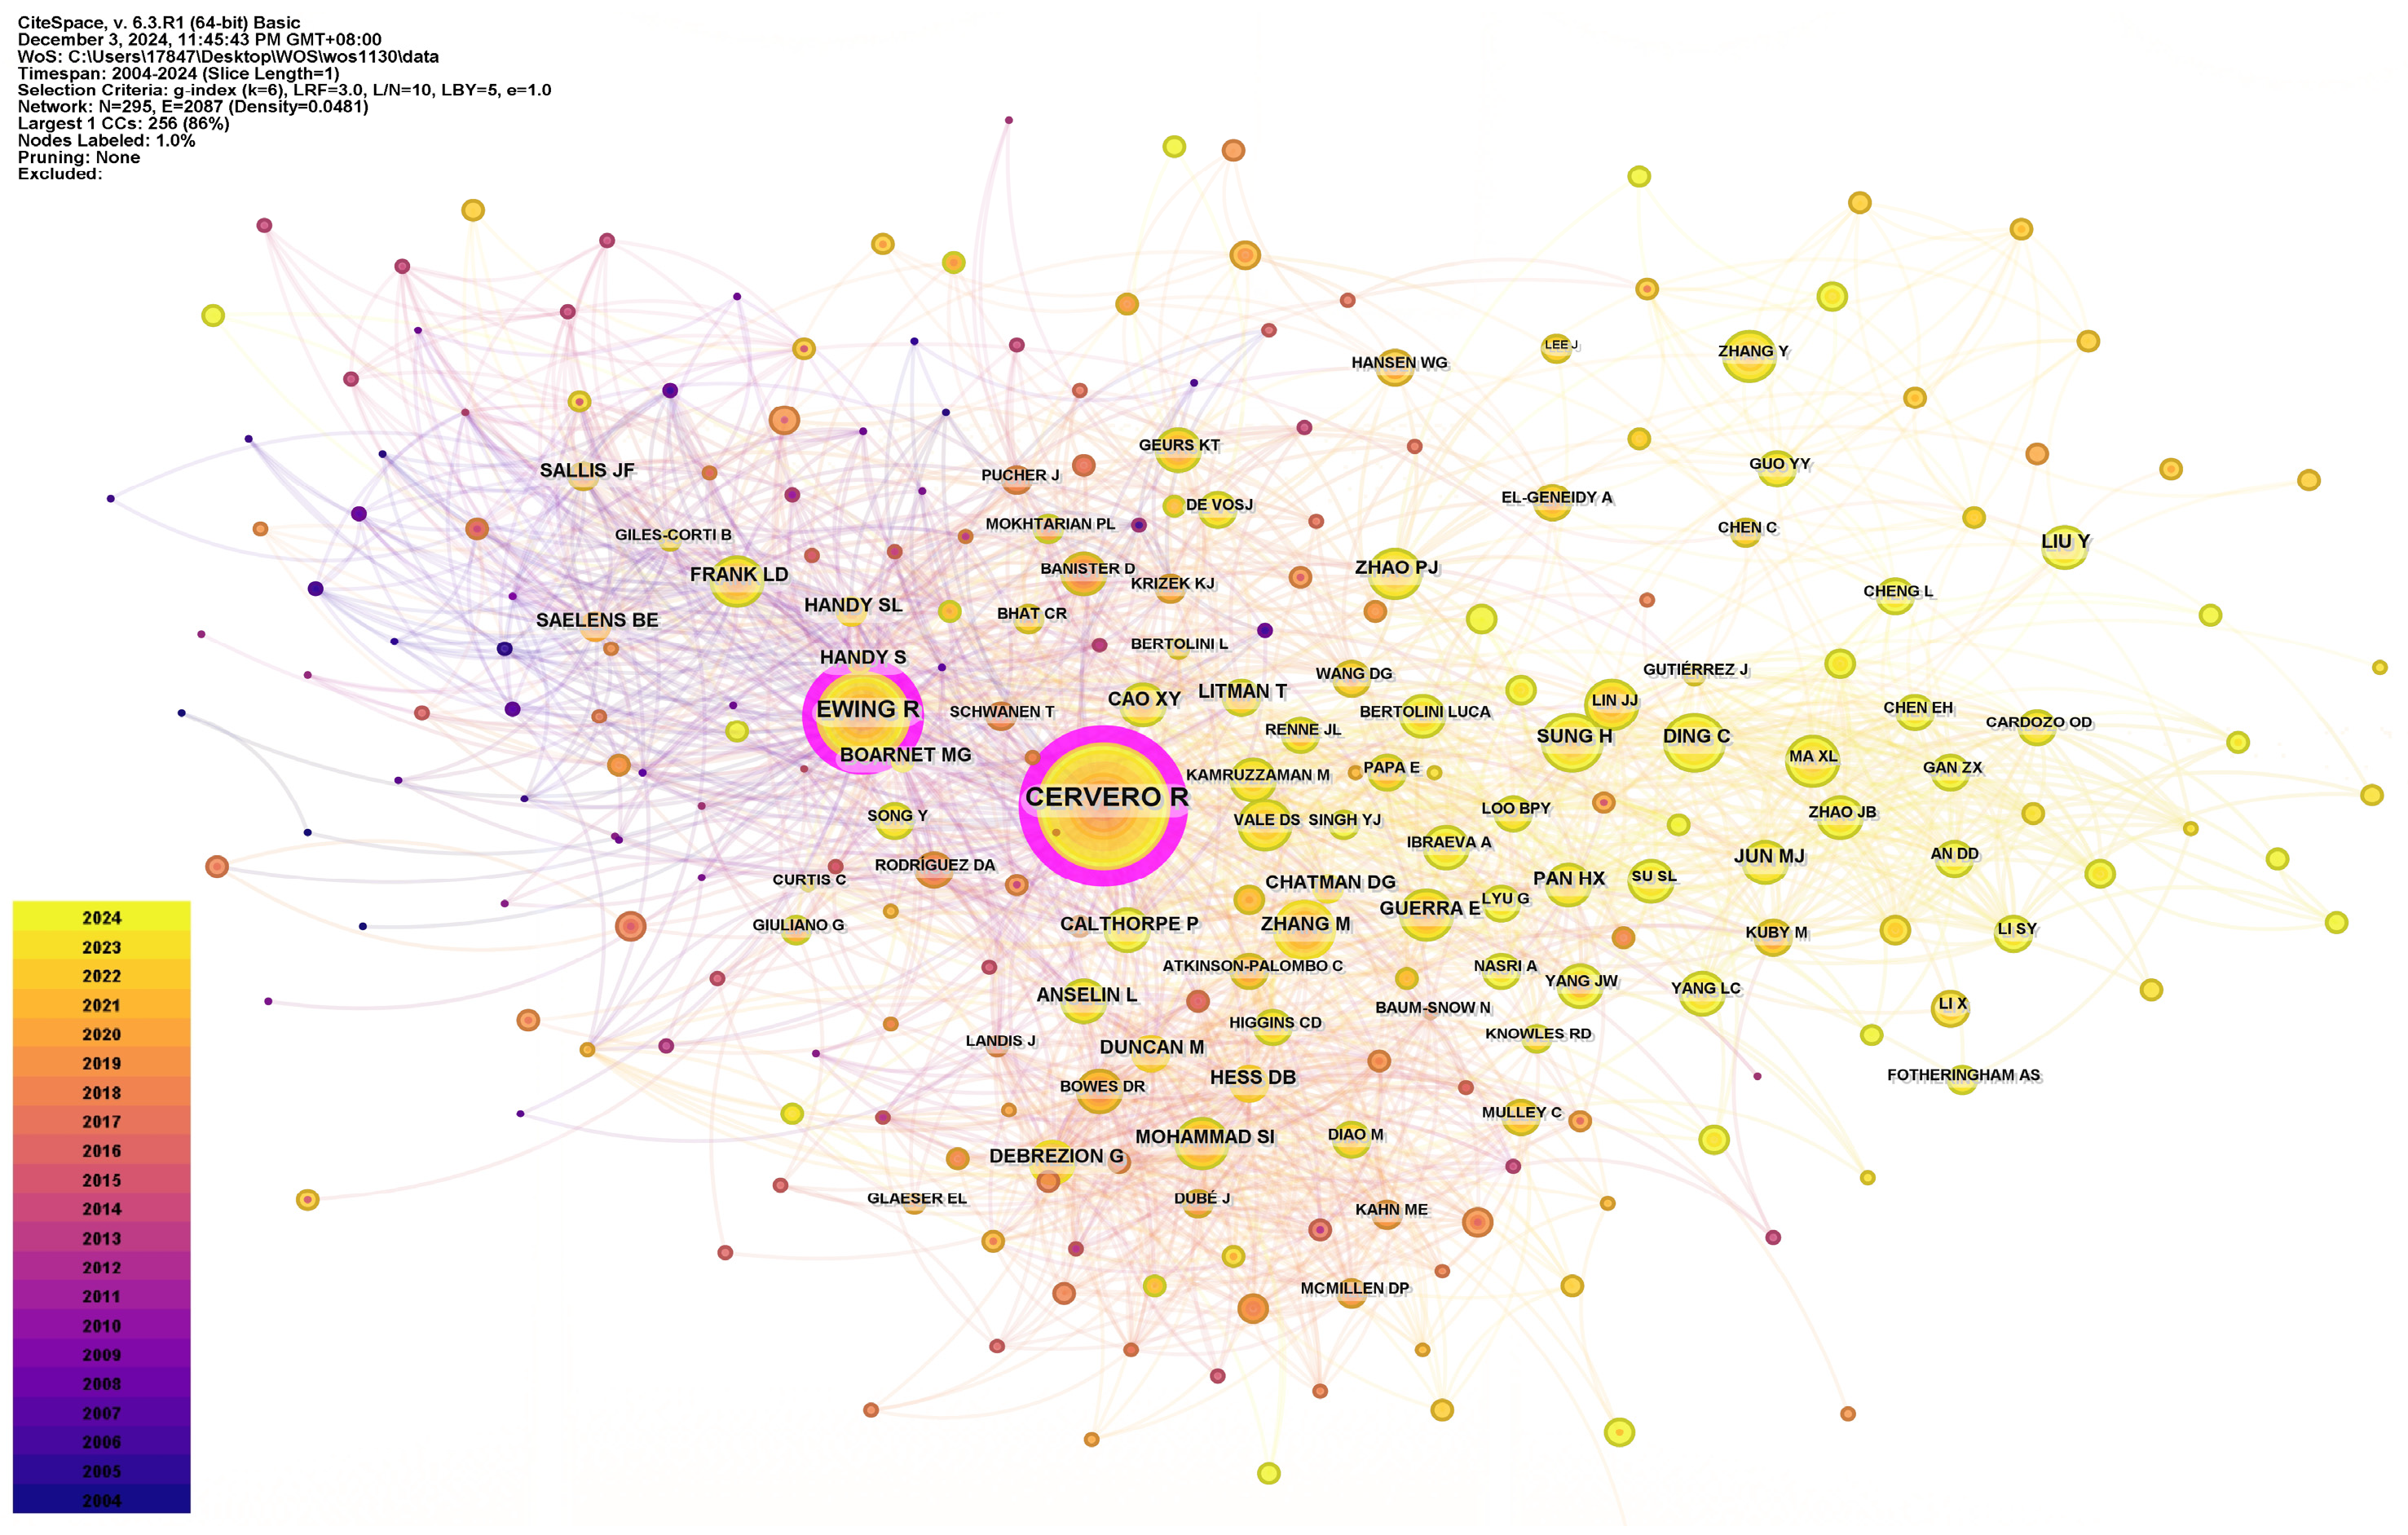
3.2.2. Analysis of Co-Citation Author Network
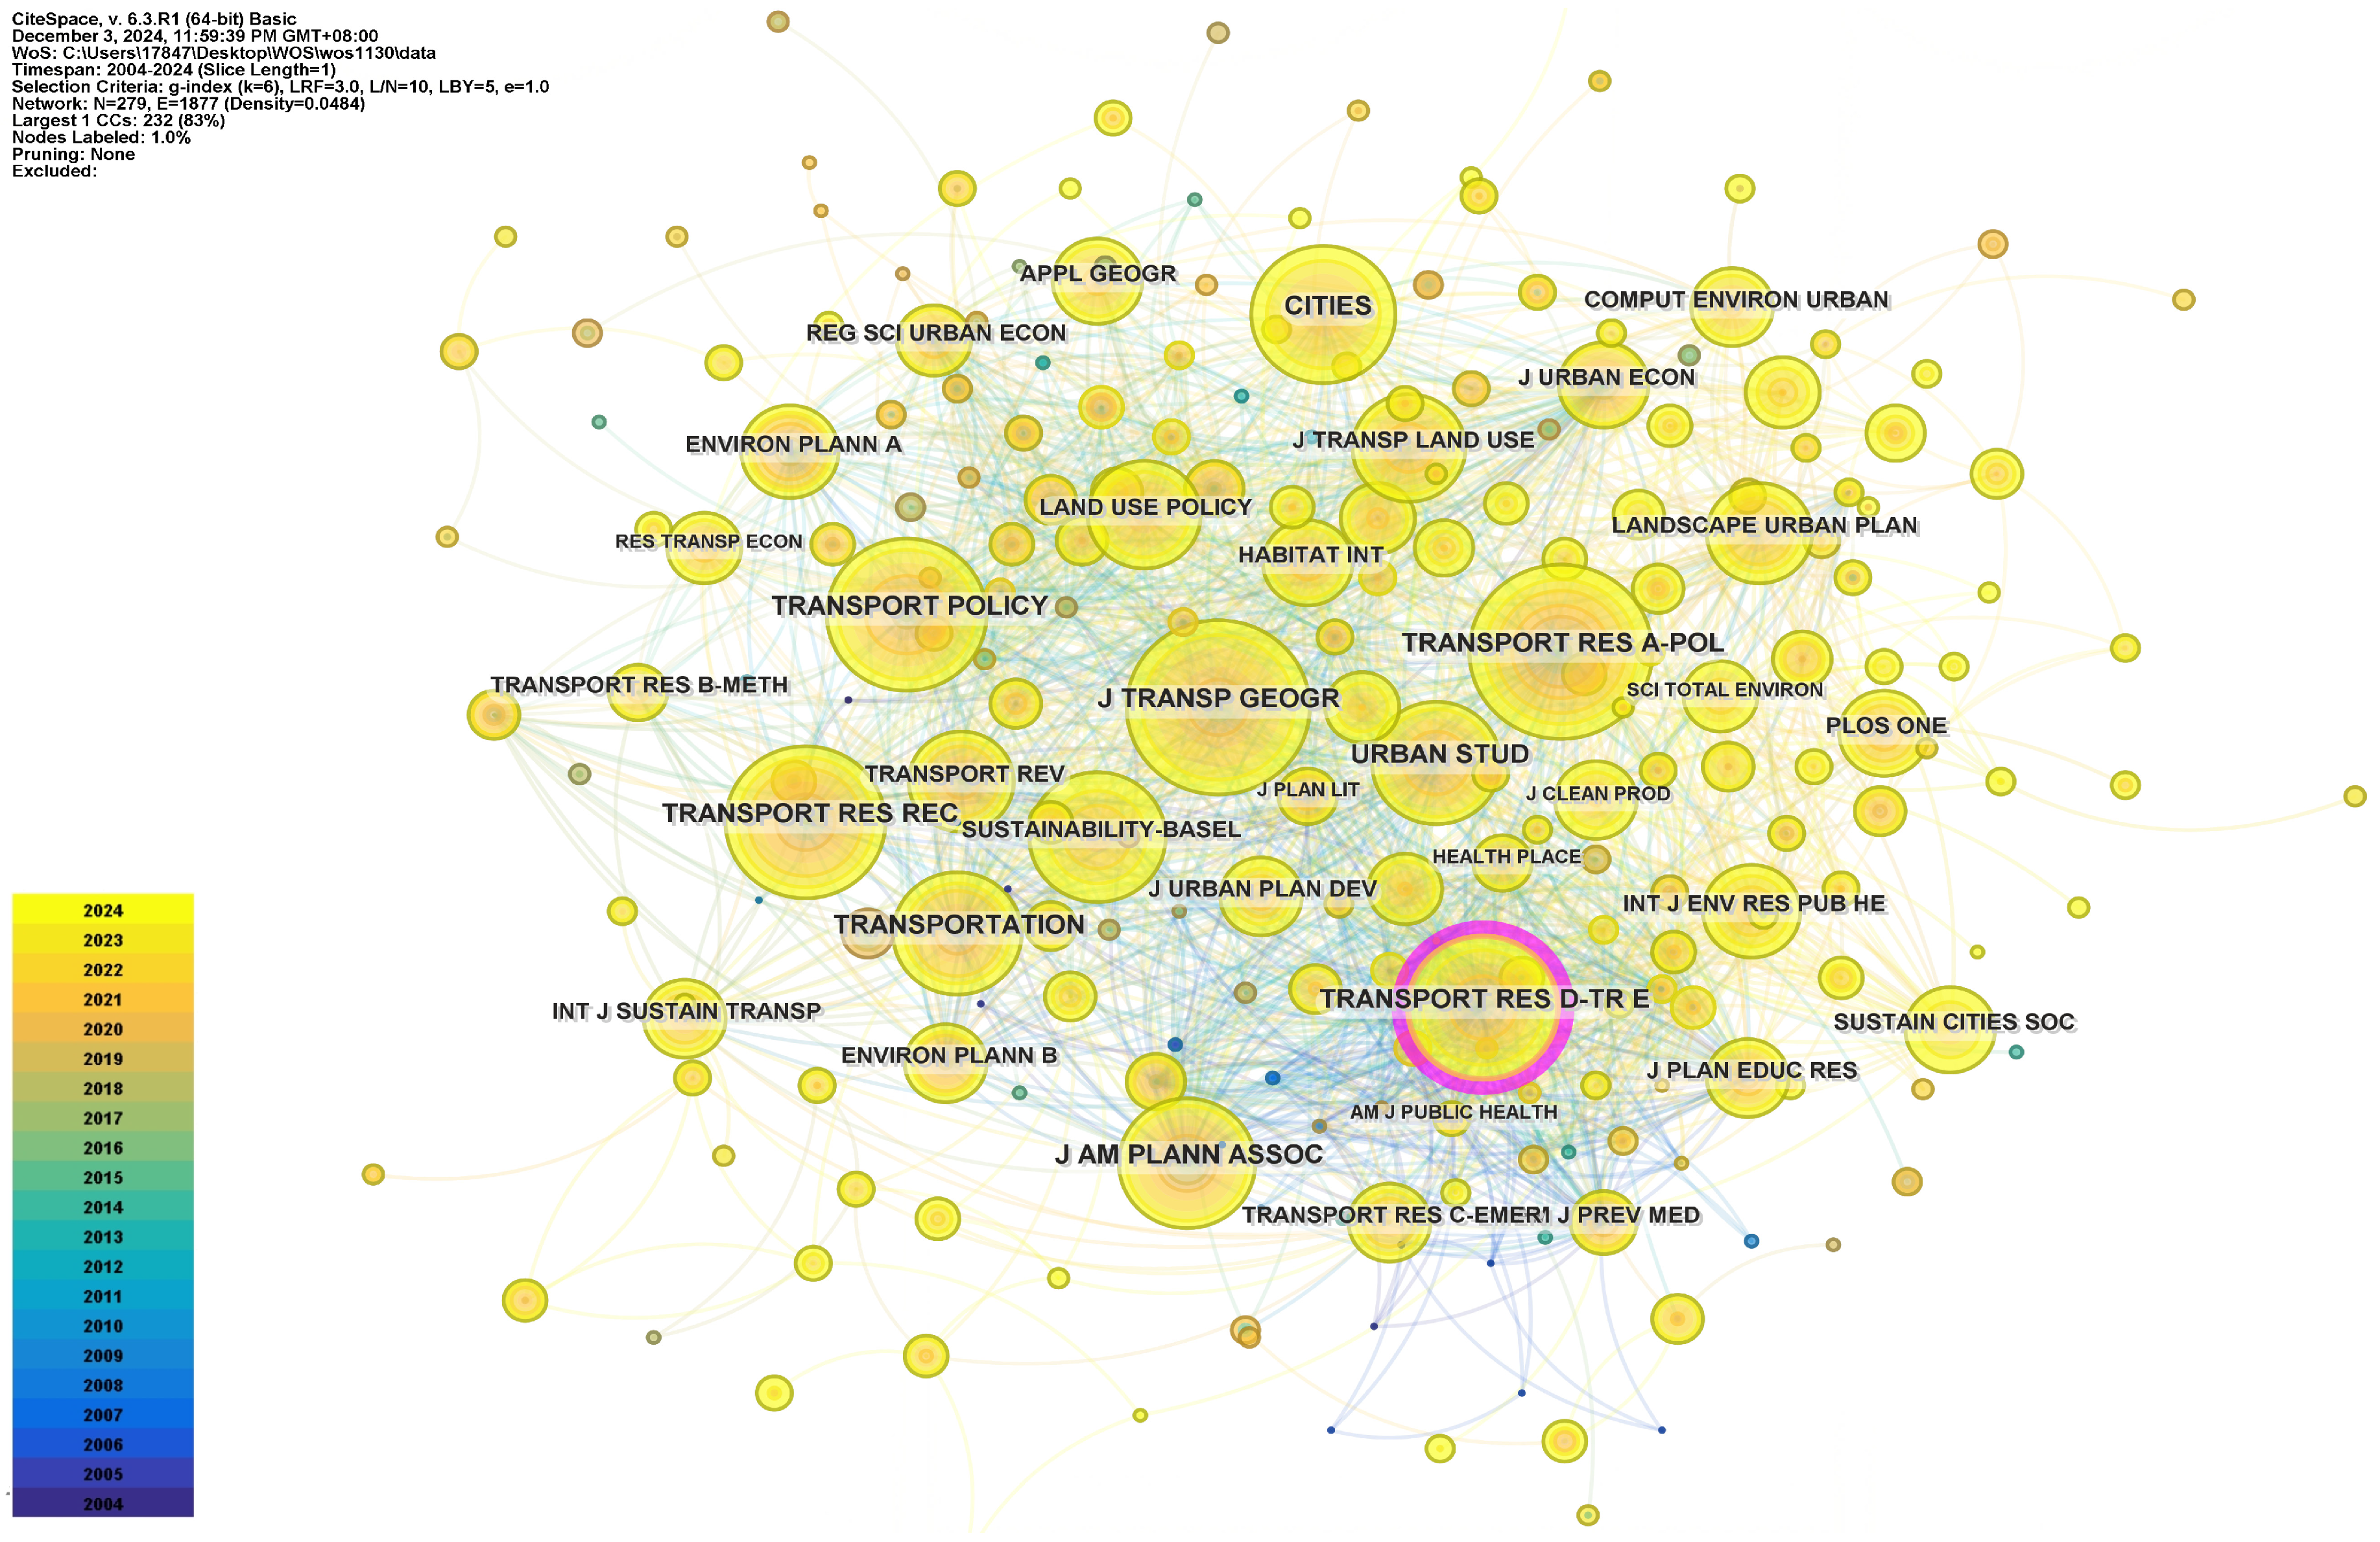
3.2.3. Analysis of the Co-Cited Journal
3.3. Keyword Dynamics: Theme Evolution and Emerging Trends
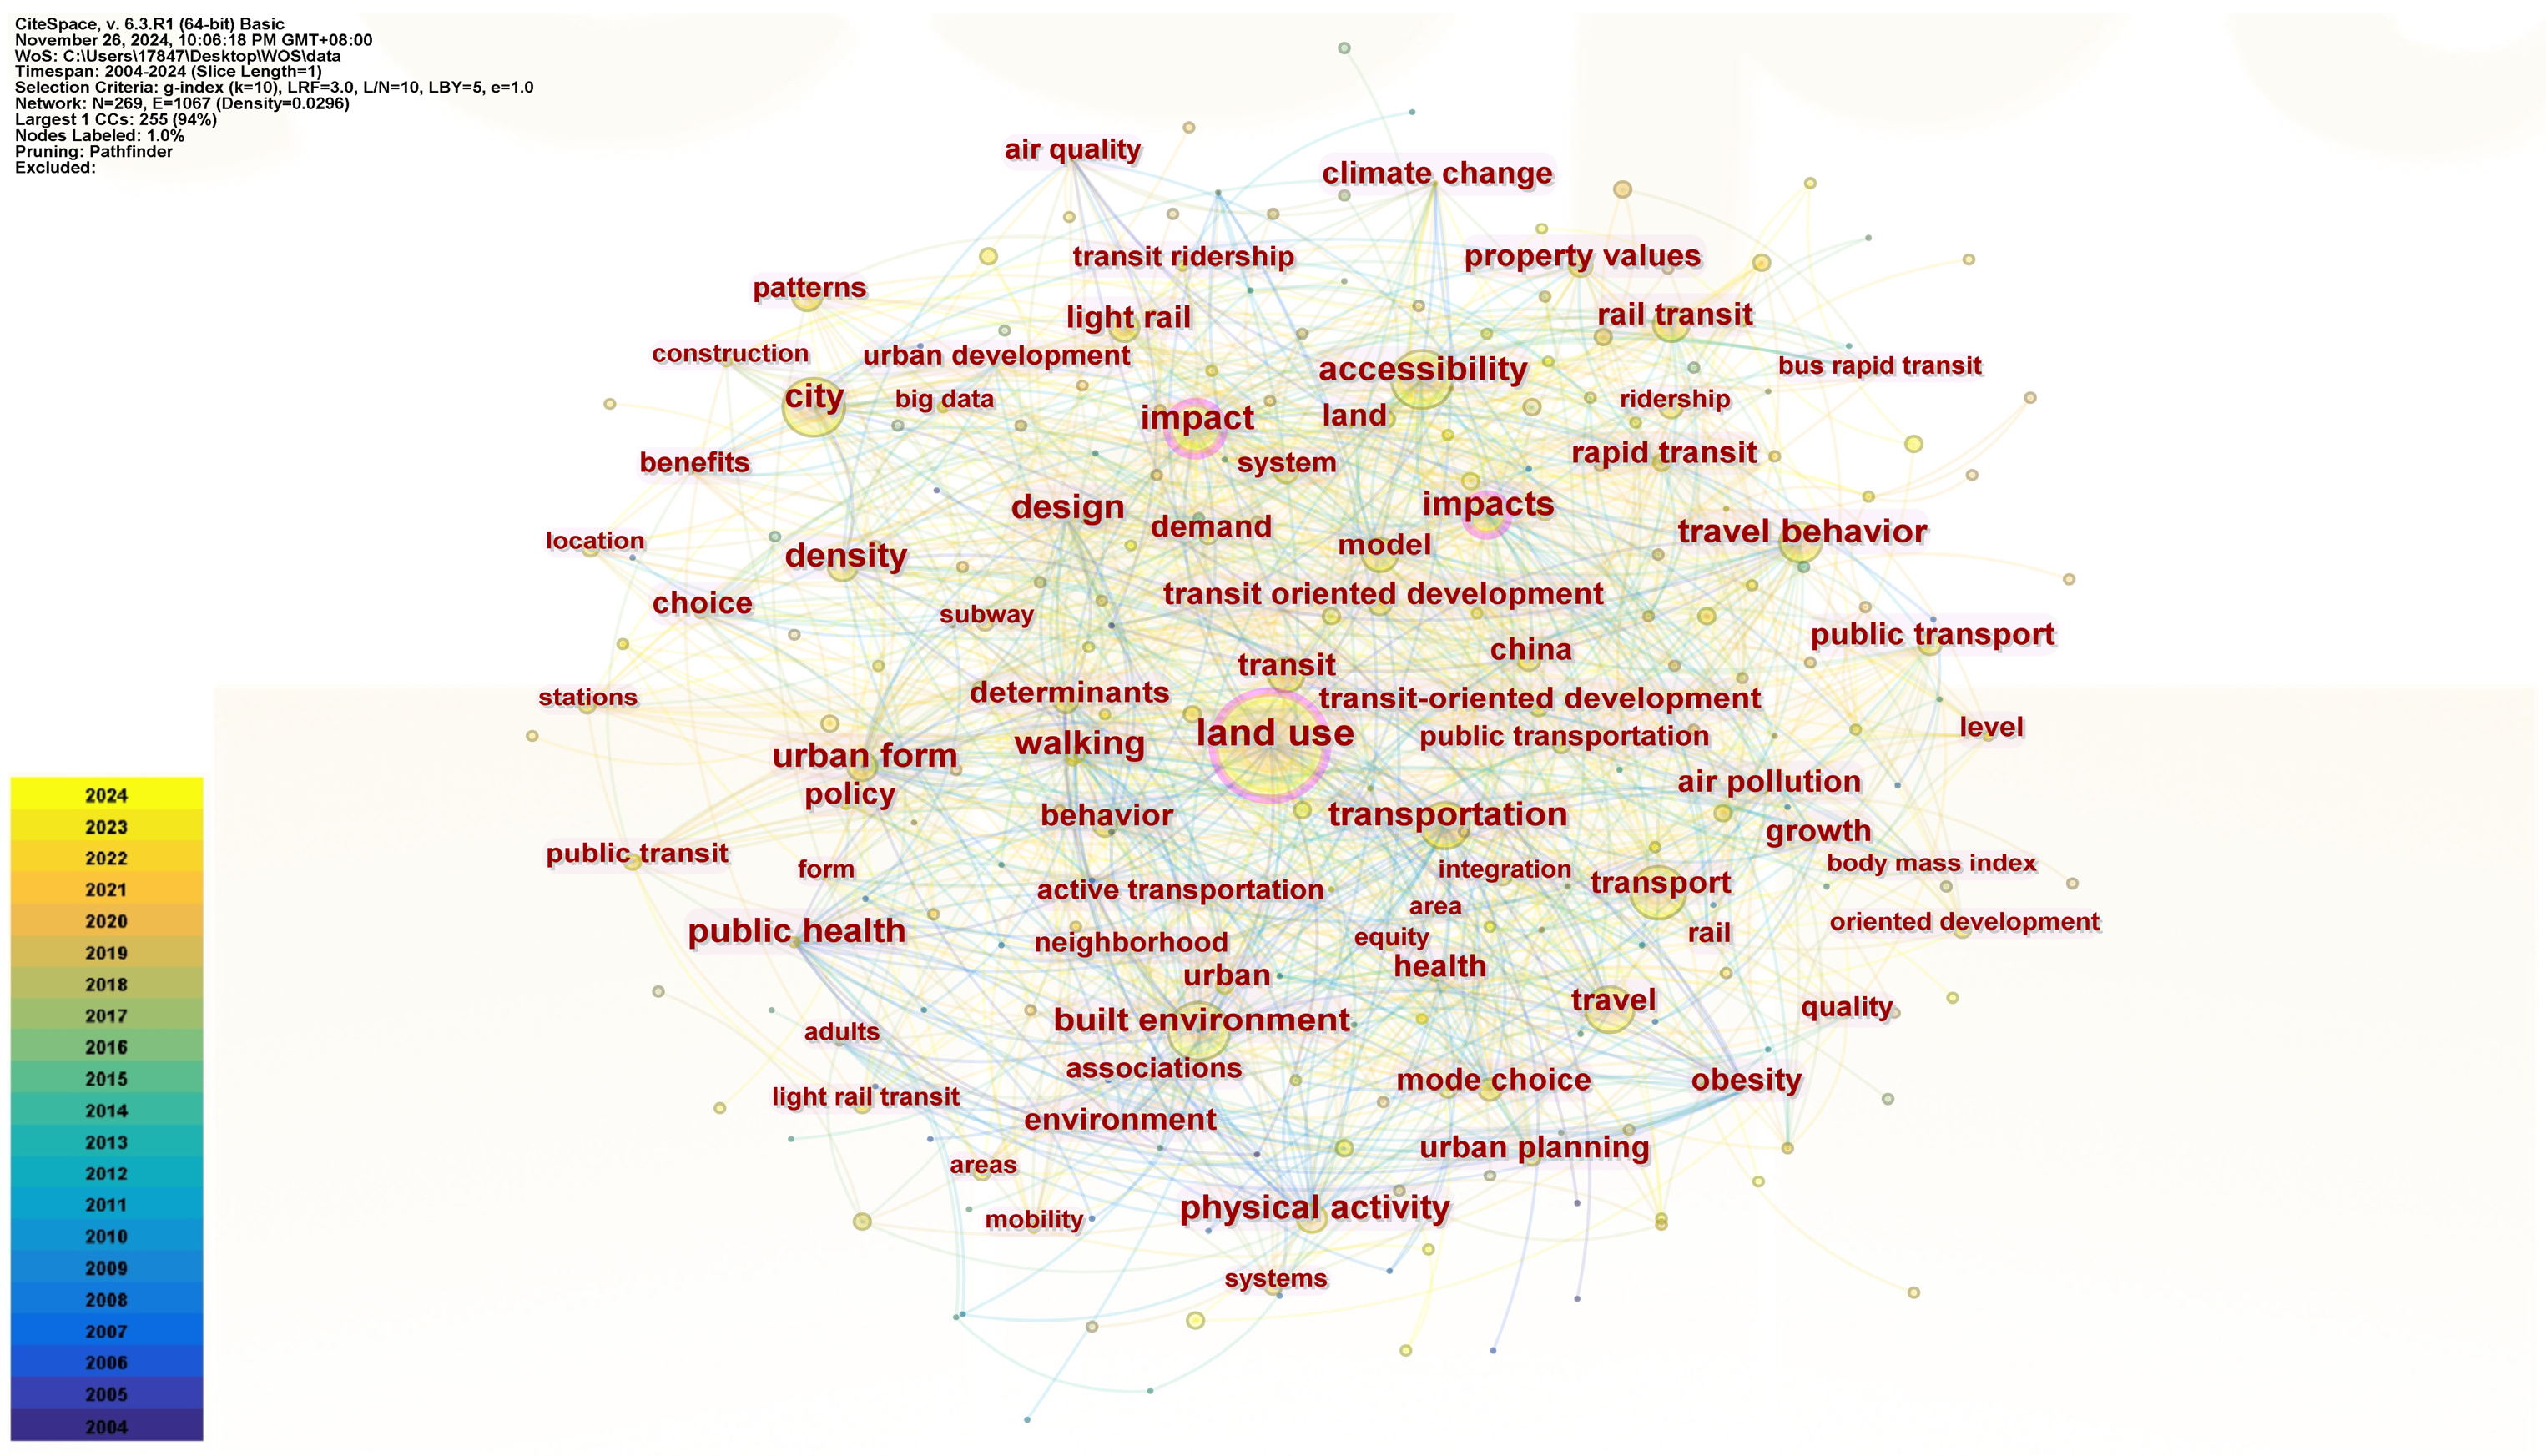
3.3.1. Keyword Network and Cluster Analysis
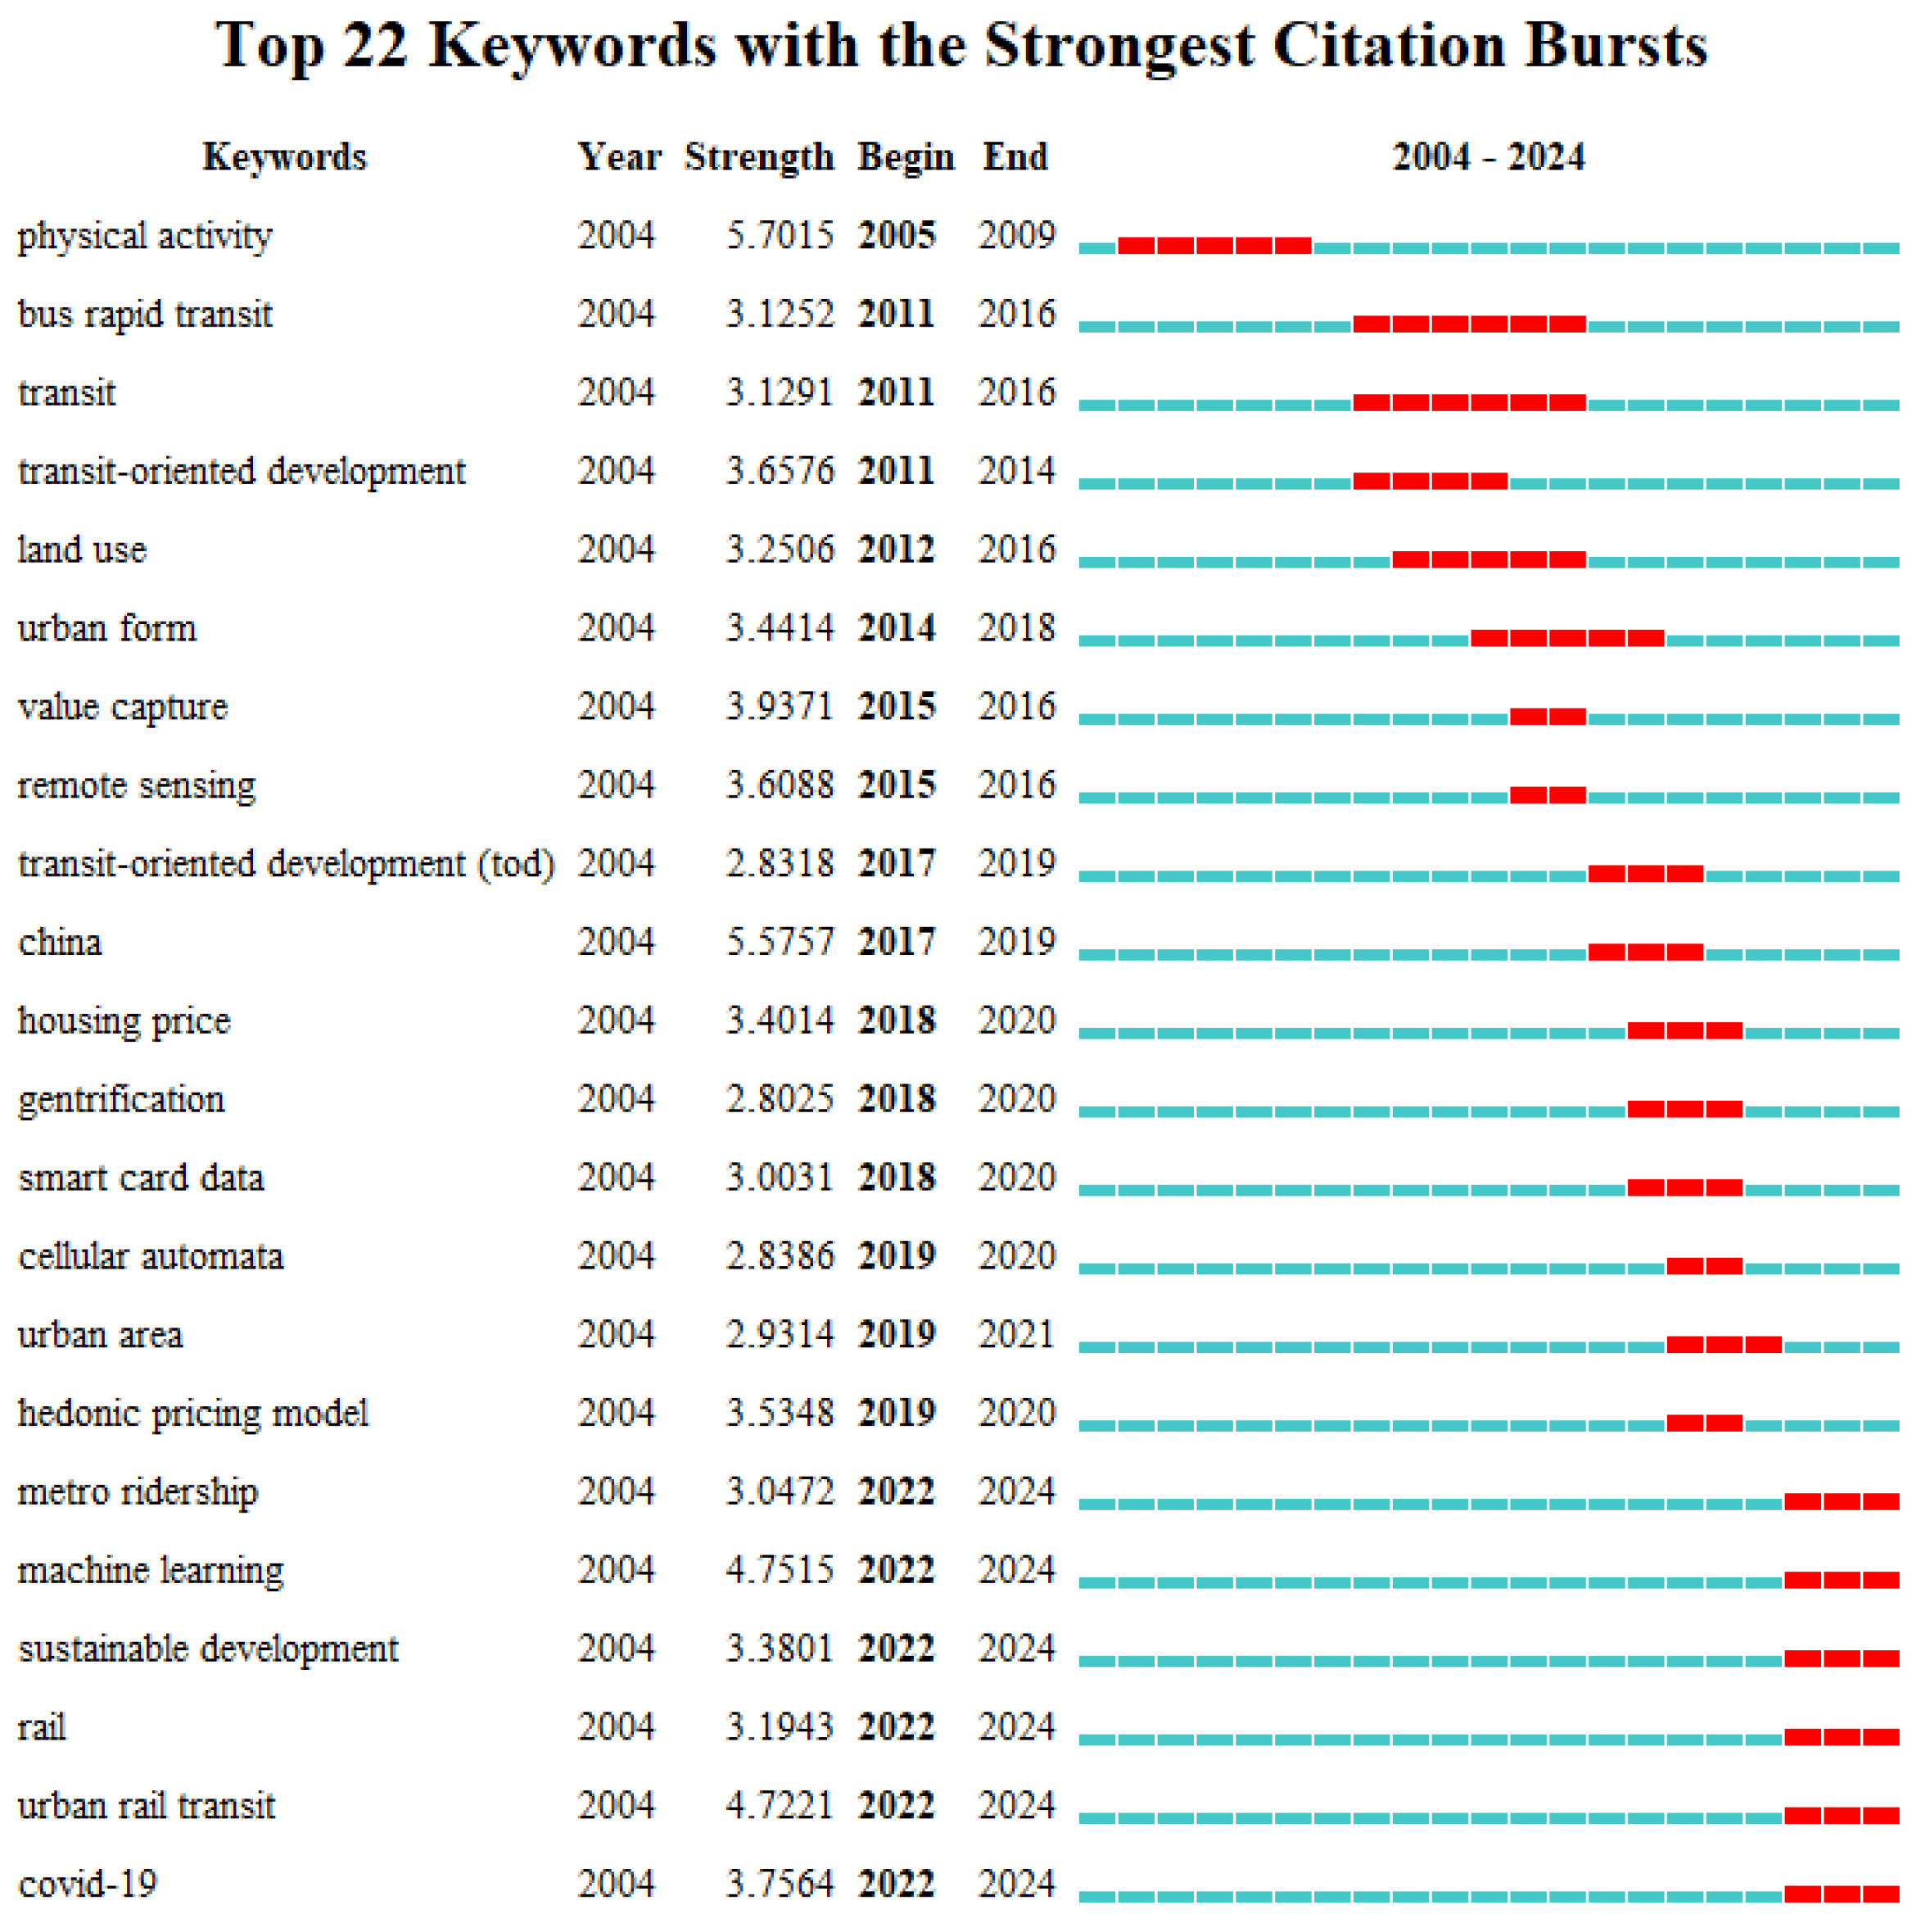
3.3.2. Research Trend Analysis
4. Discussion
4.1. Bidirectional Interactions Between Urban Rail Transit and Land Use
4.1.1. Theoretical Foundations of Urban Rail Transit and Land Use
4.1.2. Dynamic Interactions Between Urban Rail Transit Development and Land Use
4.1.3. Strategies for Enhancing Sustainable Rail Transit-Land Use Synergy
4.2. Mechanisms of Land Financing and Value Capture
4.2.1. Value Capture
4.2.2. Mechanism Anatomy of Land Financing
4.2.3. Key Conflicts: Government–Market–Public Game in Value Distribution
4.3. The Impact of the Built Environment on Travel Behavior
4.3.1. The Role of the Built Environment in Mobility Choices
4.3.2. Travel Decisions and Commuter Mode Choices
4.3.3. Technological Innovations in Mobility Planning
4.4. Key Techniques: Categories, Applications, and Limitations
4.4.1. History of Technological Development
4.4.2. Key New Technologies
5. Conclusions and Future Prospects
5.1. Research Progress and Existing Challenges
5.2. Future Research Directions and Implementation Paths
- (1)
- Technology integration: Researchers should develop a decision support platform that integrates artificial intelligence and urban systems engineering. By integrating multi-source and heterogeneous data streams such as Internet of Things infrastructure data and social media behavior trajectories, an intelligent model with a dynamic feedback mechanism can be constructed. The focus is on breaking through the limitations of traditional machine learning methods in representing spatial heterogeneity and achieving a transition from static correlation analysis to dynamic analysis.
- (2)
- Data governance: Establish a data collection framework for two-way calibration of “macro policies-micro behaviors”. At the macro level, strengthen the standardized processing of new types of geospatial data such as satellite remote sensing and mobile phone signaling. At the micro level, the creation of a dynamic database, including behaviors such as commuting preferences and land transaction decisions, enables the secure integration of cross-domain data while ensuring that data security and privacy are effectively protected.
- (3)
- Institutional innovation: Promote the formation of a collaborative research mechanism across disciplines and sectors, and establish a multi-actor participation mechanism covering government, businesses, and communities to find solutions to the challenges of spatial rights and interest allocation.
Author Contributions
Funding
Data Availability Statement
Conflicts of Interest
References
- Bertolini, L. Nodes and Places: Complexities of Railway Station Redevelopment. Eur. Plan. Stud. 1996, 4, 331–345. [Google Scholar] [CrossRef]
- Cervero, R. The Transit Metropolis: A Global Inquiry; Island Press: Washington, DC, USA, 1998. [Google Scholar]
- Bertolini, L. Spatial Development Patterns and Public Transport: The Application of an Analytical Model in the Netherlands. Plan. Pract. Res. 1999, 14, 199–210. [Google Scholar] [CrossRef]
- Peng, B.; Wang, T.; Zhang, Y.; Li, C.; Lu, C. Spatially Varying Effect Mechanism of Intermodal Connection on Metro Ridership: Evidence from a Polycentric Megacity with Multilevel Ring Roads. ISPRS Int. J. Geo-Inf. 2024, 13, 353. [Google Scholar] [CrossRef]
- Sharifiasl, S.; Kharel, S.; Pan, Q.; Li, J. Assessing the Impact of Transit Accessibility on Employment Density: A Spatial Analysis of Gravity-Based Accessibility Incorporating Job Matching, Transit Service Types, and First/Last Mile Modes. J. Transp. Geogr. 2024, 121, 104053. [Google Scholar] [CrossRef]
- Hu, N.; Legara, E.F.; Lee, K.K.; Hung, G.G.; Monterola, C. Impacts of Land Use and Amenities on Public Transport Use, Urban Planning and Design. Land Use Policy 2016, 57, 356–367. [Google Scholar] [CrossRef]
- Abdi, M.H.; Lamiquiz-Dauden, P.J. Transit-Oriented Development in Developing Countries: A Qualitative Meta-Synthesis of Its Policy, Planning and Implementation Challenges. Int. J. Sustain. Transp. 2022, 16, 195–221. [Google Scholar] [CrossRef]
- Jamme, H.-T.; Rodriguez, J.; Bahl, D.; Banerjee, T. A Twenty-Five-Year Biography of the TOD Concept: From Design to Policy, Planning, and Implementation. J. Plan. Educ. Res. 2019, 39, 409–428. [Google Scholar] [CrossRef]
- Ewing, R.; Cervero, R. Travel and the Built Environment: A Synthesis. Transp. Res. Rec. J. Transp. Res. Board 2001, 1780, 87–114. [Google Scholar] [CrossRef]
- Ewing, R.; Cervero, R. Travel and the Built Environment: A Meta-Analysis. J. Am. Plan. Assoc. 2010, 76, 265–294. [Google Scholar] [CrossRef]
- Tian, G.; Danton, B.; Ewing, R.; Li, B. Varying Influences of the Built Environment on Household Travel in the United States—An Update with 36 Diverse Regions and Machine Learning. Cities 2024, 155, 105490. [Google Scholar] [CrossRef]
- Luo, J.; Liu, P.; Xu, W.; Zhao, T.; Biljecki, F. A Perception-Powered Urban Digital Twin to Support Human-Centered Urban Planning and Sustainable City Development. Cities 2025, 156, 105473. [Google Scholar] [CrossRef]
- Hess, D.B.; Lombardi, P.A. Policy Support for and Barriers to Transit-Oriented Development in the Inner City: Literature Review. Transp. Res. Rec. J. Transp. Res. Board 2004, 1887, 26–33. [Google Scholar] [CrossRef]
- Acheampong, R.A.; Silva, E.A. Land Use–Transport Interaction Modeling: A Review of the Literature and Future Research Directions. J. Transp. Land Use 2015, 8, 11–38. [Google Scholar] [CrossRef]
- Yigitcanlar, T.; Kamruzzaman, M. Investigating the Interplay between Transport, Land Use and the Environment: A Review of the Literature. Int. J. Environ. Sci. Technol. 2014, 11, 2121–2132. [Google Scholar] [CrossRef]
- Xia, J.; Zhang, Y. Where Are Potential Areas for Transit-Oriented Development (TOD)-Exploring the Demands for Built Environment for TOD Planning. Sustainability 2022, 14, 8364. [Google Scholar] [CrossRef]
- Rocco Di Torrepadula, F.; Napolitano, E.V.; Di Martino, S.; Mazzocca, N. Machine Learning for Public Transportation Demand Prediction: A Systematic Literature Review. Eng. Appl. Artif. Intell. 2024, 137, 109166. [Google Scholar] [CrossRef]
- Geurs, K.T.; van Wee, B. Accessibility Evaluation of Land-Use and Transport Strategies: Review and Research Directions. J. Transp. Geogr. 2004, 12, 127–140. [Google Scholar] [CrossRef]
- Yao, M.; Yao, B.; Cenci, J.; Liao, C.; Zhang, J. Visualisation of High-Density City Research Evolution, Trends, and Outlook in the 21st Century. Land 2023, 12, 485. [Google Scholar] [CrossRef]
- Fang, Q.; Inoue, T.; Li, D.; Liu, Q.; Ma, J. Transit-Oriented Development and Sustainable Cities: A Visual Analysis of the Literature Based on CiteSpace and VOSviewer. Sustainability 2023, 15, 8223. [Google Scholar] [CrossRef]
- He, Y.; Liu, B.; Xu, C.; Wu, D. Literature Review on Public Transport and Land Use: Based on CiteSpace Statistical Analysis. Land 2025, 14, 1096. [Google Scholar] [CrossRef]
- Batty, M. The Size, Scale, and Shape of Cities. Science 2008, 319, 769–771. [Google Scholar] [CrossRef] [PubMed]
- Tong, Z.; Zhang, Z.; An, R.; Liu, Y.; Chen, H.; Xu, J.; Fu, S. Detecting Anomalous Commuting Patterns: Mismatch between Urban Land Attractiveness and Commuting Activities. J. Transp. Geogr. 2024, 116, 103867. [Google Scholar] [CrossRef]
- Li, Z.; Chen, B.; Wu, S.; Su, M.; Chen, J.M.; Xu, B. Deep Learning for Urban Land Use Category Classification: A Review and Experimental Assessment. Remote Sens. Environ. 2024, 311, 114290. [Google Scholar] [CrossRef]
- Drici, H.; Carpio-Pinedo, J. Urban Land Use Mix and AI: A Systematic Review. Cities 2025, 165, 106102. [Google Scholar] [CrossRef]
- Ibraeva, A.; de Almeida Correia, G.H.; Silva, C.; Antunes, A.P. Transit-Oriented Development: A Review of Research Achievements and Challenges. Transp. Res. Part A Policy Pract. 2020, 132, 110–130. [Google Scholar] [CrossRef]
- An, D.; Tong, X.; Liu, K.; Chan, E.H.W. Understanding the Impact of Built Environment on Metro Ridership Using Open Source in Shanghai. Cities 2019, 93, 177–187. [Google Scholar] [CrossRef]
- Guo, Y.; He, S.Y. Built Environment Effects on the Integration of Dockless Bike-Sharing and the Metro. Transp. Res. Part D Transp. Environ. 2020, 83, 102335. [Google Scholar] [CrossRef]
- Gan, Z.; Yang, M.; Feng, T.; Timmermans, H.J.P. Examining the Relationship between Built Environment and Metro Ridership at Station-to-Station Level. Transport. Res. Part D Transport. Environ. 2020, 82, 102332. [Google Scholar] [CrossRef]
- Ding, C.; Cao, X.; Liu, C. How Does the Station-Area Built Environment Influence Metrorail Ridership? Using Gradient Boosting Decision Trees to Identify Non-Linear Thresholds. J. Transp. Geogr. 2019, 77, 70–78. [Google Scholar] [CrossRef]
- Li, S.; Lyu, D.; Huang, G.; Zhang, X.; Gao, F.; Chen, Y.; Liu, X. Spatially Varying Impacts of Built Environment Factors on Rail Transit Ridership at Station Level: A Case Study in Guangzhou, China. J. Transp. Geogr. 2020, 82, 102631. [Google Scholar] [CrossRef]
- Li, Z.; Han, Z.; Xin, J.; Luo, X.; Su, S.; Weng, M. Transit Oriented Development among Metro Station Areas in Shanghai, China: Variations, Typology, Optimization and Implications for Land Use Planning. Land Use Policy 2019, 82, 269–282. [Google Scholar] [CrossRef]
- Chen, E.; Ye, Z.; Wang, C.; Zhang, W. Discovering the Spatio-Temporal Impacts of Built Environment on Metro Ridership Using Smart Card Data. Cities 2019, 95, 102359. [Google Scholar] [CrossRef]
- Higgins, C.D.; Kanaroglou, P.S. A Latent Class Method for Classifying and Evaluating the Performance of Station Area Transit-Oriented Development in the Toronto Region. J. Transp. Geogr. 2016, 52, 61–72. [Google Scholar] [CrossRef]
- Yang, L.; Chau, K.W.; Szeto, W.Y.; Cui, X.; Wang, X. Accessibility to Transit, by Transit, and Property Prices: Spatially Varying Relationships. Transp. Res. Part D: Transp. Environ. 2020, 85, 102387. [Google Scholar] [CrossRef]
- El-Assi, W.; Salah Mahmoud, M.; Nurul Habib, K. Effects of Built Environment and Weather on Bike Sharing Demand: A Station Level Analysis of Commercial Bike Sharing in Toronto. Transportation 2017, 44, 589–613. [Google Scholar] [CrossRef]
- Higgins, C.D.; Kanaroglou, P.S. Forty Years of Modelling Rapid Transit’s Land Value Uplift in North America: Moving beyond the Tip of the Iceberg. Transp. Rev. 2016, 36, 610–634. [Google Scholar] [CrossRef]
- Singh, Y.J.; Lukman, A.; Flacke, J.; Zuidgeest, M.; Van Maarseveen, M.F.A.M. Measuring TOD around Transit Nodes—Towards TOD Policy. Transp. Policy 2017, 56, 96–111. [Google Scholar] [CrossRef]
- Vale, D.S.; Viana, C.M.; Pereira, M. The Extended Node-Place Model at the Local Scale: Evaluating the Integration of Land Use and Transport for Lisbon’s Subway Network. J. Transp. Geogr. 2018, 69, 282–293. [Google Scholar] [CrossRef]
- Li, S.; Lyu, D.; Liu, X.; Tan, Z.; Gao, F.; Huang, G.; Wu, Z. The Varying Patterns of Rail Transit Ridership and Their Relationships with Fine-Scale Built Environment Factors: Big Data Analytics from Guangzhou. Cities 2020, 99, 102580. [Google Scholar] [CrossRef]
- Shao, Q.; Zhang, W.; Cao, X.; Yang, J.; Yin, J. Threshold and Moderating Effects of Land Use on Metro Ridership in Shenzhen: Implications for TOD Planning. J. Transp. Geogr. 2020, 89, 102878. [Google Scholar] [CrossRef]
- Lu, K.; Zhang, L.; Li, S.; Huang, Y.; Ding, X.; Hao, J.; Huang, S.; Li, X.; Lu, F.; Zhang, H. Urban Rail Transit in China: Progress Report and Analysis (2015–2023). Urban Rail Transit 2025, 11, 1–27. [Google Scholar] [CrossRef]
- Wang, Z.; Guo, R.; Zou, L.; Li, T.; Yao, X. Impact Evaluation of COVID-19 on Transit Ridership: A Case Study of the Beijing Subway. Urban Rail Transit 2024, 10, 297–316. [Google Scholar] [CrossRef]
- Alonso, W. Location and Land Use: Toward a General Theory of Land Rent; Harvard University Press: Cambridge, MA, USA, 1964; ISBN 978-0-674-73085-4. [Google Scholar]
- Hansen, W.G. How Accessibility Shapes Land Use. J. Am. Inst. Plan. 1959, 25, 73–76. [Google Scholar] [CrossRef]
- Calthorpe, P. The Next American Metropolis—Ecology, Community, and the American Dream; Princeton Architectural Press: New York, NY, USA; Abingdon, UK, 1993; Volume 60. [Google Scholar]
- Smolka, M.O. A New Look at Value Capture in Latin America. Available online: https://www.lincolninst.edu/app/uploads/2024/04/2099_1420_New_Look_at_Value_Capture_Latin_America_0712LL.pdf (accessed on 12 March 2025).
- Nel, D.; Du Plessis, C.; Landman, K. Planning for Dynamic Cities: Introducing a Framework to Understand Urban Change from a Complex Adaptive Systems Approach. Int. Plan. Stud. 2018, 23, 250–263. [Google Scholar] [CrossRef]
- Rhodes, M.L.; Murray, J. Collaborative Decision Making in Urban Regeneration: A Complex Adaptive Systems Perspective. Int. Public Manag. J. 2007, 10, 79–101. [Google Scholar] [CrossRef]
- Hillier, B. Studying Cities to Learn about Minds: Some Possible Implications of Space Syntax for Spatial Cognition. Environ. Plan. B Plan. Des 2012, 39, 12–32. [Google Scholar] [CrossRef]
- Pezeshkriejad, P.; Monajem, S.; Mozafari, H. Evaluating Sustainability and Land Use Integration of BRT Stations via Extended Node Place Model, an Application on BRT Stations of Tehran. J. Transp. Geogr. 2020, 82, 102626. [Google Scholar] [CrossRef]
- Cervero, R.; Sarmiento, O.L.; Jacoby, E.; Fernando Gomez, L.; Neiman, A. Influences of Built Environments on Walking and Cycling: Lessons from Bogota. Int. J. Sustain. Transp. 2009, 3, 203–226. [Google Scholar] [CrossRef]
- Lavery, T.A.; Kanaroglou, P. Rediscovering Light Rail: Assessing the Potential Impacts of a Light Rail Transit Line on Transit Oriented Development and Transit Ridership. Transp. Lett. 2012, 4, 211–226. [Google Scholar] [CrossRef]
- Grengs, J. Equity and the Social Distribution of Job Accessibility in Detroit. Environ. Plan. B Plan. Des. 2012, 39, 785–800. [Google Scholar] [CrossRef]
- Antanaitis, A. Developing Up and Not Out: Understanding the Barriers to and Opportunities for Reurbanization along Waterloo’s Central Transit Corridor. Master’s Thesis, University of Waterloo, Waterloo, ON, Canada, 2015. [Google Scholar]
- Cervero, R.; Kockelman, K. Travel Demand and the 3Ds: Density, Diversity, and Design. Transport. Res. Part D Transport. Environ. 1997, 2, 199–219. [Google Scholar] [CrossRef]
- MartÍn, J.C.; Gutiérrez, J.; Román, C. Data Envelopment Analysis (DEA) Index to Measure the Accessibility Impacts of New Infrastructure Investments: The Case of the High-Speed Train Corridor Madrid-Barcelona-French Border. Reg. Stud. 2004, 38, 697–712. [Google Scholar] [CrossRef]
- Paulsson, A. The City That the Metro System Built: Urban Transformations and Modalities of Integrated Planning in Stockholm. Urban Stud. 2020, 57, 2936–2955. [Google Scholar] [CrossRef]
- Tian, L.; Li, Y.; Yan, Y.; Wang, B. Measuring Urban Sprawl and Exploring the Role Planning Plays: A Shanghai Case Study. Land Use Policy 2017, 67, 426–435. [Google Scholar] [CrossRef]
- Sani Roychansyah, M.; Ishizaka, K.; Omi, T. Considerations of Regional Characteristics for Delivering City Compactness: Case of Studies of Cities in the Greater Tokyo Area and Tohoku Region, Japan. J. Asian Archit. Build. Eng. 2005, 4, 339–346. [Google Scholar] [CrossRef]
- Cats, O.; Gkioulou, Z. Modeling the Impacts of Public Transport Reliability and Travel Information on Passengers’ Waiting-Time Uncertainty. EURO J. Transp. Logist. 2017, 6, 247–270. [Google Scholar] [CrossRef]
- Vuchic, V.R. Urban Transit Systems and Technology; Wiley: Hoboken, NJ, USA, 2007. [Google Scholar]
- Chai, S.; Liang, Q.; Zhong, S. Design of Urban Rail Transit Network Constrained by Urban Road Network, Trips and Land-Use Characteristics. Sustainability 2019, 11, 6128. [Google Scholar] [CrossRef]
- Langford, M.; Fry, R.; Higgs, G. Measuring Transit System Accessibility Using a Modified Two-Step Floating Catchment Technique. Int. J. Geogr. Inf. Sci. 2012, 26, 193–214. [Google Scholar] [CrossRef]
- Borole, N.; Rout, D.; Goel, N.; Vedagiri, P.; Mathew, T.V. Multimodal Public Transit Trip Planner with Real-Time Transit Data. Procedia-Soc. Behav. Sci. 2013, 104, 775–784. [Google Scholar] [CrossRef]
- Debrezion, G.; Pels, E.; Rietveld, P. The Impact of Railway Stations on Residential and Commercial Property Value. J. Real Estate Finance Econ. 2007, 35, 161–180. [Google Scholar] [CrossRef]
- Wu, F. Planning for Growth: Urban and Regional Planning in China; Routledge: New York, NY, USA, 2015. [Google Scholar]
- Du, H.; Mulley, C. The Short-Term Land Value Impacts of Urban Rail Transit: Quantitative Evidence from Sunderland, UK. Land Use Policy 2007, 24, 223–233. [Google Scholar] [CrossRef]
- Zhu, X.; Liu, S. Analysis of the Impact of the MRT System on Accessibility in Singapore Using an Integrated GIS Tool. J. Transp. Geogr. 2004, 12, 89–101. [Google Scholar] [CrossRef]
- Saxe, S.; Miller, E.J. Transit and Land Value Uplift: An Introduction. 2016. Available online: https://uttri.utoronto.ca/wp-content/uploads/sites/19/2017/10/16-02-04-02-Transit-and-Land-Value-Uplift-An-Introduction.pdf (accessed on 12 March 2025).
- Efthymiou, D.; Antoniou, C. How Do Transport Infrastructure and Policies Affect House Prices and Rents? Evidence from Athens, Greece. Transp. Res. Part A Policy Pract. 2013, 52, 1–22. [Google Scholar] [CrossRef]
- Lin, D.; Broere, W.; Cui, J. Metro Systems and Urban Development: Impacts and Implications. Tunn. Undergr. Space Technol. 2022, 125, 104509. [Google Scholar] [CrossRef]
- Schuetz, J.; Giuliano, G.; Shin, E.J. Does Zoning Help or Hinder Transit-Oriented (Re)Development? Urban Stud. 2018, 55, 1672–1689. [Google Scholar] [CrossRef]
- Li, J.; Huang, H. Effects of Transit-Oriented Development (TOD) on Housing Prices: A Case Study in Wuhan, China. Res. Transp. Econ. 2020, 80, 100813. [Google Scholar] [CrossRef]
- Wen, S.; Shi, J.; Zhang, W. Impact of Urban Rail Transit Network on Residential and Commercial Land Values in China: A Complex Network Perspective. Complexity 2021, 2021, 8849066. [Google Scholar] [CrossRef]
- Colavitti, A.M.; Serra, S. The Transfer of Development Rights as a Tool for the Urban Growth Containment: A Comparison between the United States and Italy. Pap. Reg. Sci. 2018, 97, 1247–1266. [Google Scholar] [CrossRef]
- St Lewis, J. Revitalizing Private Intercity Rail in the U.S. A Case Study of Brightline’s Use of Development-Based Land Value Capture. Master’s Thesis, Lund University, Lund, Sweden, 2024. Available online: https://lup.lub.lu.se/student-papers/search/publication/9171362 (accessed on 12 March 2025).
- Weber, R.; Goddeeris, L. Tax Increment Financing: A Property-Based Tool for Local Regeneration? J. Urban Regen. Renew. 2007, 1, 55–68. [Google Scholar] [CrossRef]
- Newman, G.; Lee, J.; Berke, P. Using the Land Transformation Model to Forecast Vacant Land. J. Land Use Sci. 2016, 11, 450–475. [Google Scholar] [CrossRef]
- Chang, Z.; Phang, S.-Y. Urban Rail Transit PPPs: Lessons from East Asian Cities. Transp. Res. Part A Policy Pract. 2017, 105, 106–122. [Google Scholar] [CrossRef]
- Aydın, E. Financing an Urban Express Railway Line via Real Estate Development: Hızray (Istanbul) Case. 2023. Available online: https://polen.itu.edu.tr/items/6850e32e-55f7-4166-bcb1-b79a1cebb960 (accessed on 12 March 2025).
- Wu, F. Land Financialisation and the Financing of Urban Development in China. Land Use Policy 2022, 112, 104412. [Google Scholar] [CrossRef]
- Tsui, K.Y. China’s Infrastructure Investment Boom and Local Debt Crisis. Eurasian Geogr. Econ. 2011, 52, 686–711. [Google Scholar] [CrossRef]
- El-Nagdy, M.; El-borombaly, H.; Khodeir, L. Threats and Root Causes of Using Publicly-Owned Lands as Assets for Urban Infrastructure Financing. Alex. Eng. J. 2018, 57, 3907–3919. [Google Scholar] [CrossRef]
- Nzau, B.; Trillo, C. Harnessing the Real Estate Market for Equitable Affordable Housing Provision through Land Value Capture: Insights from San Francisco City, California. Sustainability 2019, 11, 3649. [Google Scholar] [CrossRef]
- Huang, X.; He, D.; Tang, S.; Li, X. Compensation, Housing Situation and Residents’ Satisfaction with the Outcome of Forced Relocation: Evidence from Urban China. Cities 2020, 96, 102436. [Google Scholar] [CrossRef]
- Zhang, M. The Role of Land Use in Travel Mode Choice: Evidence from Boston and Hong Kong. J. Am. Plan. Assoc. 2004, 70, 344–360. [Google Scholar] [CrossRef]
- Hanson, S.; Pratt, G. Reconceptualizing the Links between Home and Work in Urban Geography. Econ. Geogr. 1988, 64, 299–321. [Google Scholar] [CrossRef]
- Sohn, J. Are Commuting Patterns a Good Indicator of Urban Spatial Structure? J. Transp. Geogr. 2005, 13, 306–317. [Google Scholar] [CrossRef]
- Celbiş, M.G.; Bouzouina, L. To What Extent Walking and Biking Are Substitutes or Complements to Public Transport? Interpretable Machine Learning Findings from the University of Lyon, France. J. Transp. Geogr. 2025, 123, 104071. [Google Scholar] [CrossRef]
- Bartshe, M.; Coughenour, C.; Pharr, J. Perceived Walkability, Social Capital, and Self-Reported Physical Activity in Las Vegas College Students. Sustainability 2018, 10, 3023. [Google Scholar] [CrossRef]
- Mackenbach, J.D.; Randal, E.; Zhao, P.; Howden-Chapman, P. The Influence of Urban Land-Use and Public Transport Facilities on Active Commuting in Wellington, New Zealand: Active Transport Forecasting Using the WILUTE Model. Sustainability 2016, 8, 242. [Google Scholar] [CrossRef]
- Fan, A.; Chen, X.; Wan, T. How Have Travelers Changed Mode Choices for First/Last Mile Trips after the Introduction of Bicycle-Sharing Systems: An Empirical Study in Beijing, China. J. Adv. Transp. 2019, 2019, 5426080. [Google Scholar] [CrossRef]
- Li, C.-X.; Yoon, C.-J. Analysis of Urban Rail Public Transport Space Congestion Using Graph Fourier Transform Theory: A Focus on Seoul. Sustainability 2025, 17, 598. [Google Scholar] [CrossRef]
- Cheng, L.; Bi, X.; Chen, X.; Li, L. Travel Behavior of the Urban Low-Income in China: Case Study of Huzhou City. In Proceedings of the Intelligent and Integrated Sustainable Multimodal Transportation Systems Proceedings from the 13th Cota International Conference of Transportation Professionals (Cictp2013); Zhang, L., Wei, H., Li, Z., Zhang, Y., Li, M., Eds.; Elsevier Science B.V.: Amsterdam, The Netherlands, 2013; Volume 96, pp. 231–242. [Google Scholar]
- Guajardo Ortega, M.F.; Link, H. Mode Choice Inertia and Shock: Three Months of Almost Fare-Free Public Transport in Germany. Econ. Transp. 2025, 41, 100382. [Google Scholar] [CrossRef]
- Barnes, M. Transit Systems and Ridership under Extreme Weather and Climate Change Stress: An Urban Transportation Agenda for Hazards Geography. Geogr. Compass 2015, 9, 604–616. [Google Scholar] [CrossRef]
- Lukic Vujadinovic, V.; Damnjanovic, A.; Cakic, A.; Petkovic, D.R.; Prelevic, M.; Pantovic, V.; Stojanovic, M.; Vidojevic, D.; Vranjes, D.; Bodolo, I. AI-Driven Approach for Enhancing Sustainability in Urban Public Transportation. Sustainability 2024, 16, 7763. [Google Scholar] [CrossRef]
- Zou, L.; Wang, Z.; Guo, R. Real-Time Prediction of Transit Origin–Destination Flows during Underground Incidents. Transp. Res. Part C Emerg. Technol. 2024, 163, 104622. [Google Scholar] [CrossRef]
- Rodriguez Baquero, L.M.; Quiroga, J.S.; Angulo, M.G.; Gómez Caicedo, M.I.; Costa, L.V.; Ballesteros, V.; Alarcon Villamil, N.O. Bibliometric Analysis on the Application of Artificial Intelligence, Big Data and the Internet of Things in Traffic Management Systems in Latin America: Advances, Challenges and Opportunities. Preprints 2024. [Google Scholar]
- Bellini, P.; Collini, E.; Fanfani, M.; Palesi, L.A.I.; Nesi, P. Smart City Digital Twin Platform Architecture for Mobility and Transport Decision Support Systems. In Proceedings of the 2024 IEEE International Conference on Big Data (BigData), Washington, DC, USA, 15–18 December 2024; pp. 5486–5495. [Google Scholar]
- Ng, V.; Kim, H.M. Autonomous Vehicles and Smart Cities: A Case Study of Singapore. In Smart Cities for Technological and Social Innovation; Kim, H.M., Sabri, S., Kent, A., Eds.; Academic Press: Cambridge, MA, USA, 2021; pp. 265–287. [Google Scholar]
- Fagnant, D.J.; Kockelman, K. Preparing a Nation for Autonomous Vehicles: Opportunities, Barriers and Policy Recommendations. Transp. Res. Part A Policy Pract. 2015, 77, 167–181. [Google Scholar] [CrossRef]
- Zhang, L.; Cui, X.; Wang, M.; Hu, Q.; Yu, Y. The Development and Status of 3S Technology in China. In Proceedings of the 2010 2nd International Conference on Advanced Computer Control, Shenyang, China, 27–29 March 2010; IEEE: Piscataway, NJ, USA, 2010; pp. 214–217. [Google Scholar]
- Wu, W. Digital Urban Planning Based on “3S” Technology. J. Anhui Agric. Sci. 2007, 35, 8035–8037. [Google Scholar]
- Lemenkova, P. Urban-Rural Environmental Gradient in a Developing City: Testing ENVI GIS Functionality. arXiv 2018, arXiv:1812.10378. [Google Scholar]
- Das, S.; Angadi, D.P. Land Use Land Cover Change Detection and Monitoring of Urban Growth Using Remote Sensing and GIS Techniques: A Micro-Level Study. GeoJournal 2022, 87, 2101–2123. [Google Scholar] [CrossRef]
- Alkhazraji, H. Predicting Traffic Speed and Recommending Optimal Routes Using GPS Data: A Smart Navigation System for Commuters. Available online: https://pure.northampton.ac.uk/en/studentTheses/predicting-traffic-speed-and-recommending-optimal-routes-using-gp#:~:text=This%20thesis%20introduces%20a%20novel%20framework%20designed%20to,hour%20ahead%20and%20recommend%20optimal%20routes%20for%20commuters (accessed on 12 March 2025).
- Baghestani, A.; Najafabadi, S.; Salem, A.; Jiang, Z.; Tayarani, M.; Gao, O. An Application of the Node–Place Model to Explore the Land Use–Transport Development Dynamics of the I-287 Corridor. Urban Sci. 2023, 7, 21. [Google Scholar] [CrossRef]
- Cao, Z.; Asakura, Y.; Tan, Z. Coordination between Node, Place, and Ridership: Comparing Three Transit Operators in Tokyo. Transp. Res. Part D Transp. Environ. 2020, 87, 102518. [Google Scholar] [CrossRef]
- Li, Z.; Tang, J.; Feng, T.; Liu, B.; Cao, J.; Yu, T.; Ji, Y. Investigating Urban Mobility through Multi-Source Public Transportation Data: A Multiplex Network Perspective. Appl. Geogr. 2024, 169, 103337. [Google Scholar] [CrossRef]
- Zeng, W.; Fu, C.-W.; Arisona, S.M.; Erath, A.; Qu, H. Visualizing Mobility of Public Transportation System. IEEE Trans. Vis. Comput. Graph. 2014, 20, 1833–1842. [Google Scholar] [CrossRef]
- Guzman, L.A.; Escobar, F.; Peña, J.; Cardona, R. A Cellular Automata-Based Land-Use Model as an Integrated Spatial Decision Support System for Urban Planning in Developing Cities: The Case of the Bogotá Region. Land Use Policy 2020, 92, 104445. [Google Scholar] [CrossRef]
- Mazzetto, S. A Review of Urban Digital Twins Integration, Challenges, and Future Directions in Smart City Development. Sustainability 2024, 16, 8337. [Google Scholar] [CrossRef]
- Bibri, S.E.; Huang, J.; Jagatheesaperumal, S.K.; Krogstie, J. The Synergistic Interplay of Artificial Intelligence and Digital Twin in Environmentally Planning Sustainable Smart Cities: A Comprehensive Systematic Review. Environ. Sci. Ecotechnology 2024, 20, 100433. [Google Scholar] [CrossRef]
- Lehtola, V.V.; Koeva, M.; Elberink, S.O.; Raposo, P.; Virtanen, J.-P.; Vahdatikhaki, F.; Borsci, S. Digital Twin of a City: Review of Technology Serving City Needs. Int. J. Appl. Earth Obs. Geoinf. 2022, 114, 102915. [Google Scholar] [CrossRef]
- Allam, Z.; Dhunny, Z.A. On Big Data, Artificial Intelligence and Smart Cities. Cities 2019, 89, 80–91. [Google Scholar] [CrossRef]
- Deng, T.; Zhang, K.; Shen, Z.-J. (Max) A Systematic Review of a Digital Twin City: A New Pattern of Urban Governance toward Smart Cities. J. Manag. Sci. Eng. 2021, 6, 125–134. [Google Scholar]
- Mirzakhani, N.; Ali Madad Soltani, A.; Hedayatifard, M. Application of Machine Learning in Understanding Urban Neighborhood Gentrification: A Meta-Synthesis Review. Cities 2025, 162, 105973. [Google Scholar] [CrossRef]
- Peng, C.; Yang, S.; Zhang, P.; Hu, S. Exploring Nonlinear and Interaction Effects of TOD on Housing Rents Using XGBoost. Cities 2025, 158, 105728. [Google Scholar] [CrossRef]
- Wang, J.; Biljecki, F. Unsupervised Machine Learning in Urban Studies: A Systematic Review of Applications. Cities 2022, 129, 103925. [Google Scholar] [CrossRef]
- Xu, L.; Luo, S.; O’Hern, S.; Delbosc, A.; Chen, Z.; Fu, X. Do Protected Cycle Lanes Make Cities More Bike-Friendly? Integrating Street View Images with Deep Learning Techniques. Cities 2025, 161, 105890. [Google Scholar] [CrossRef]
- Yu, B.; Lee, Y.; Sohn, K. Forecasting Road Traffic Speeds by Considering Area-Wide Spatio-Temporal Dependencies Based on a Graph Convolutional Neural Network (GCN). Transp. Res. Part C Emerg. Technol. 2020, 114, 189–204. [Google Scholar] [CrossRef]
- Shanthappa, N.K.; Mulangi, R.H.; Manjunath, H.M. Origin-Destination Demand Prediction of Public Transit Using Graph Convolutional Neural Network. Case Stud. Transp. Policy 2024, 17, 101230. [Google Scholar] [CrossRef]
- Porta, J.; Parapar, J.; Doallo, R.; Rivera, F.F.; Santé, I.; Crecente, R. High Performance Genetic Algorithm for Land Use Planning. Comput. Environ. Urban Syst. 2013, 37, 45–58. [Google Scholar] [CrossRef]
- Masoumi, Z.; van Genderen, J. Artificial Intelligence for Sustainable Development of Smart Cities and Urban Land-Use Management. Geo-Spat. Inf. Sci. 2024, 27, 1212–1236. [Google Scholar] [CrossRef]
- Arsanjani, J.J.; Kainz, W.; Mousivand, A.J. Tracking Dynamic Land-Use Change Using Spatially Explicit Markov Chain Based on Cellular Automata: The Case of Tehran. Int. J. Image Data Fusion 2011, 2, 329–345. [Google Scholar] [CrossRef]
- Xia, C.; Zhang, A.; Wang, H.; Zhang, B. Modeling Urban Growth in a Metropolitan Area Based on Bidirectional Flows, an Improved Gravitational Field Model, and Partitioned Cellular Automata. Int. J. Geogr. Inf. Sci. 2019, 33, 877–899. [Google Scholar] [CrossRef]


| First Author | Year | Freq | Title |
|---|---|---|---|
| Ibraeva A. | 2020 | 53 | Transit-oriented development: A review of research achievements and challenges [26] |
| An D.D. | 2019 | 43 | Understanding the impact of built environment on metro ridership using open source in Shanghai [27] |
| Guo Y.Y. | 2020 | 39 | Built environment effects on the integration of dockless bike-sharing and the metro [28] |
| Gan Z.X. | 2020 | 38 | Examining the relationship between built environment and metro ridership at station-to-station level [29] |
| Ding C. | 2019 | 36 | How does the station-area built environment influence Metrorail ridership? Using gradient boosting decision trees to identify non-linear thresholds [30] |
| Ewing R. | 2010 | 35 | Travel and the Built Environment: A Meta-Analysis [10] |
| Li S.Y. | 2020 | 34 | Spatially varying impacts of built environment factors on rail transit ridership at station level: A case study in Guangzhou, China [31] |
| Li Z.K. | 2019 | 33 | Transit oriented development among metro station areas in Shanghai, China: Variations, typology, optimization and implications for land use planning [32] |
| Chen E.H. | 2019 | 32 | Discovering the spatio-temporal impacts of built environment on metro ridership using smart card data [33] |
| Cluster | Size | Top Terms (Log-Lihood, Ratio-Level) |
|---|---|---|
| #0 built environment | 76 | built environment (23.55, 0.0001); physical activity (12.47, 0.001); travel behavior (12.47, 0.001); walking (10.41, 0.005); environment design (8.83, 0.005); |
| #1 value capture | 58 | non-linear effects (11.36, 0.001); spatial heterogeneity (9.7, 0.005); transit-oriented development (9.68, 0.005); urban design (8.52, 0.005); sustainable mobility (8.52, 0.005); |
| #2 public transit | 53 | air pollution (10.3, 0.005); beijing (7.46, 0.01); urban transport (6.86, 0.01); decentralization (6.86, 0.01); urban growth (6.86, 0.01); |
| #3 china | 51 | value capture (12.13, 0.001); difference-in-differences (9.09, 0.005); built environment (8.88, 0.005); housing price (8.24, 0.005); transportation (7.94, 0.005); |
| #4 public transport | 21 | service (11.38, 0.001); equity (6.08, 0.05); gis (6.08, 0.05); urban vitality (5.68, 0.05); multiscale geographically weighted regression (5.68, 0.05); |
| #5 travel behavior | 5 | vulnerability (21.51, 0.0001); resilience (15.36, 0.0001); COVID-19 (15.36, 0.0001); climate change (7.76, 0.01); planning (6.56, 0.05); |
| #6 transport planning | 5 | cellular automata (20.87, 0.0001); urban sustainability (14.11, 0.001); system dynamics (11.9, 0.001); transit value capture (7.04, 0.01); difference-in-difference model (7.04, 0.01); |
| Technology | Key Methods | Applications | Strengths | Limitations |
|---|---|---|---|---|
| Machine Learning | Random Forest, XGBoost, Support Vector Machines, K-means Clustering, Latent Dirichlet Allocation | Land use classification, identifying spatial patterns | High accuracy, scalable automation, effective for classification and clustering tasks | Declines in heterogeneous environments, poor model interpretability |
| Deep Learning | Convolutional Neural Networks (CNNs) Generative Adversarial Networks, Graph Neural Networks (GNNs) | Zoning analysis, simulating urban form evolution, modeling topological relations | Handles complex and high-resolution spatial data, high-precision spatial analysis | Requires large labeled datasets, high computational resource demands |
| Evolutionary and Swarm Intelligence | Genetic Algorithms (GA), Particle Swarm Optimization (PSO), MOEA/D, NSGA-II | Land use configuration optimization, transit-oriented development layout planning | Good at solving multi-objective optimization, effective in exploring planning scenarios | Cannot dynamically respond to real-time changes in land markets, travel demand, and zoning regulations |
| Simulation Models | Cellular Automata Markov Chain Models | Urban expansion projection, land use–transport interaction simulation | Improved accuracy when considering spatial interaction | Lack of responsiveness to real-time fluctuations |
Disclaimer/Publisher’s Note: The statements, opinions and data contained in all publications are solely those of the individual author(s) and contributor(s) and not of MDPI and/or the editor(s). MDPI and/or the editor(s) disclaim responsibility for any injury to people or property resulting from any ideas, methods, instructions or products referred to in the content. |
© 2025 by the authors. Licensee MDPI, Basel, Switzerland. This article is an open access article distributed under the terms and conditions of the Creative Commons Attribution (CC BY) license (https://creativecommons.org/licenses/by/4.0/).
Share and Cite
Yang, H.; Cui, N.; Xia, H. The Evolution of the Interaction Between Urban Rail Transit and Land Use: A CiteSpace-Based Knowledge Mapping Approach. Land 2025, 14, 1386. https://doi.org/10.3390/land14071386
Yang H, Cui N, Xia H. The Evolution of the Interaction Between Urban Rail Transit and Land Use: A CiteSpace-Based Knowledge Mapping Approach. Land. 2025; 14(7):1386. https://doi.org/10.3390/land14071386
Chicago/Turabian StyleYang, Haochen, Nana Cui, and Haishan Xia. 2025. "The Evolution of the Interaction Between Urban Rail Transit and Land Use: A CiteSpace-Based Knowledge Mapping Approach" Land 14, no. 7: 1386. https://doi.org/10.3390/land14071386
APA StyleYang, H., Cui, N., & Xia, H. (2025). The Evolution of the Interaction Between Urban Rail Transit and Land Use: A CiteSpace-Based Knowledge Mapping Approach. Land, 14(7), 1386. https://doi.org/10.3390/land14071386