
The Impact of High-Speed Rail on High-Quality Economic Development: Evidence from China

Abstract
1. Introduction
2. Literature Review
3. Research Method
3.1. Variable Selection and Explanation
3.2. Data
3.3. Construction of the Continuous Difference-in-Differences Model
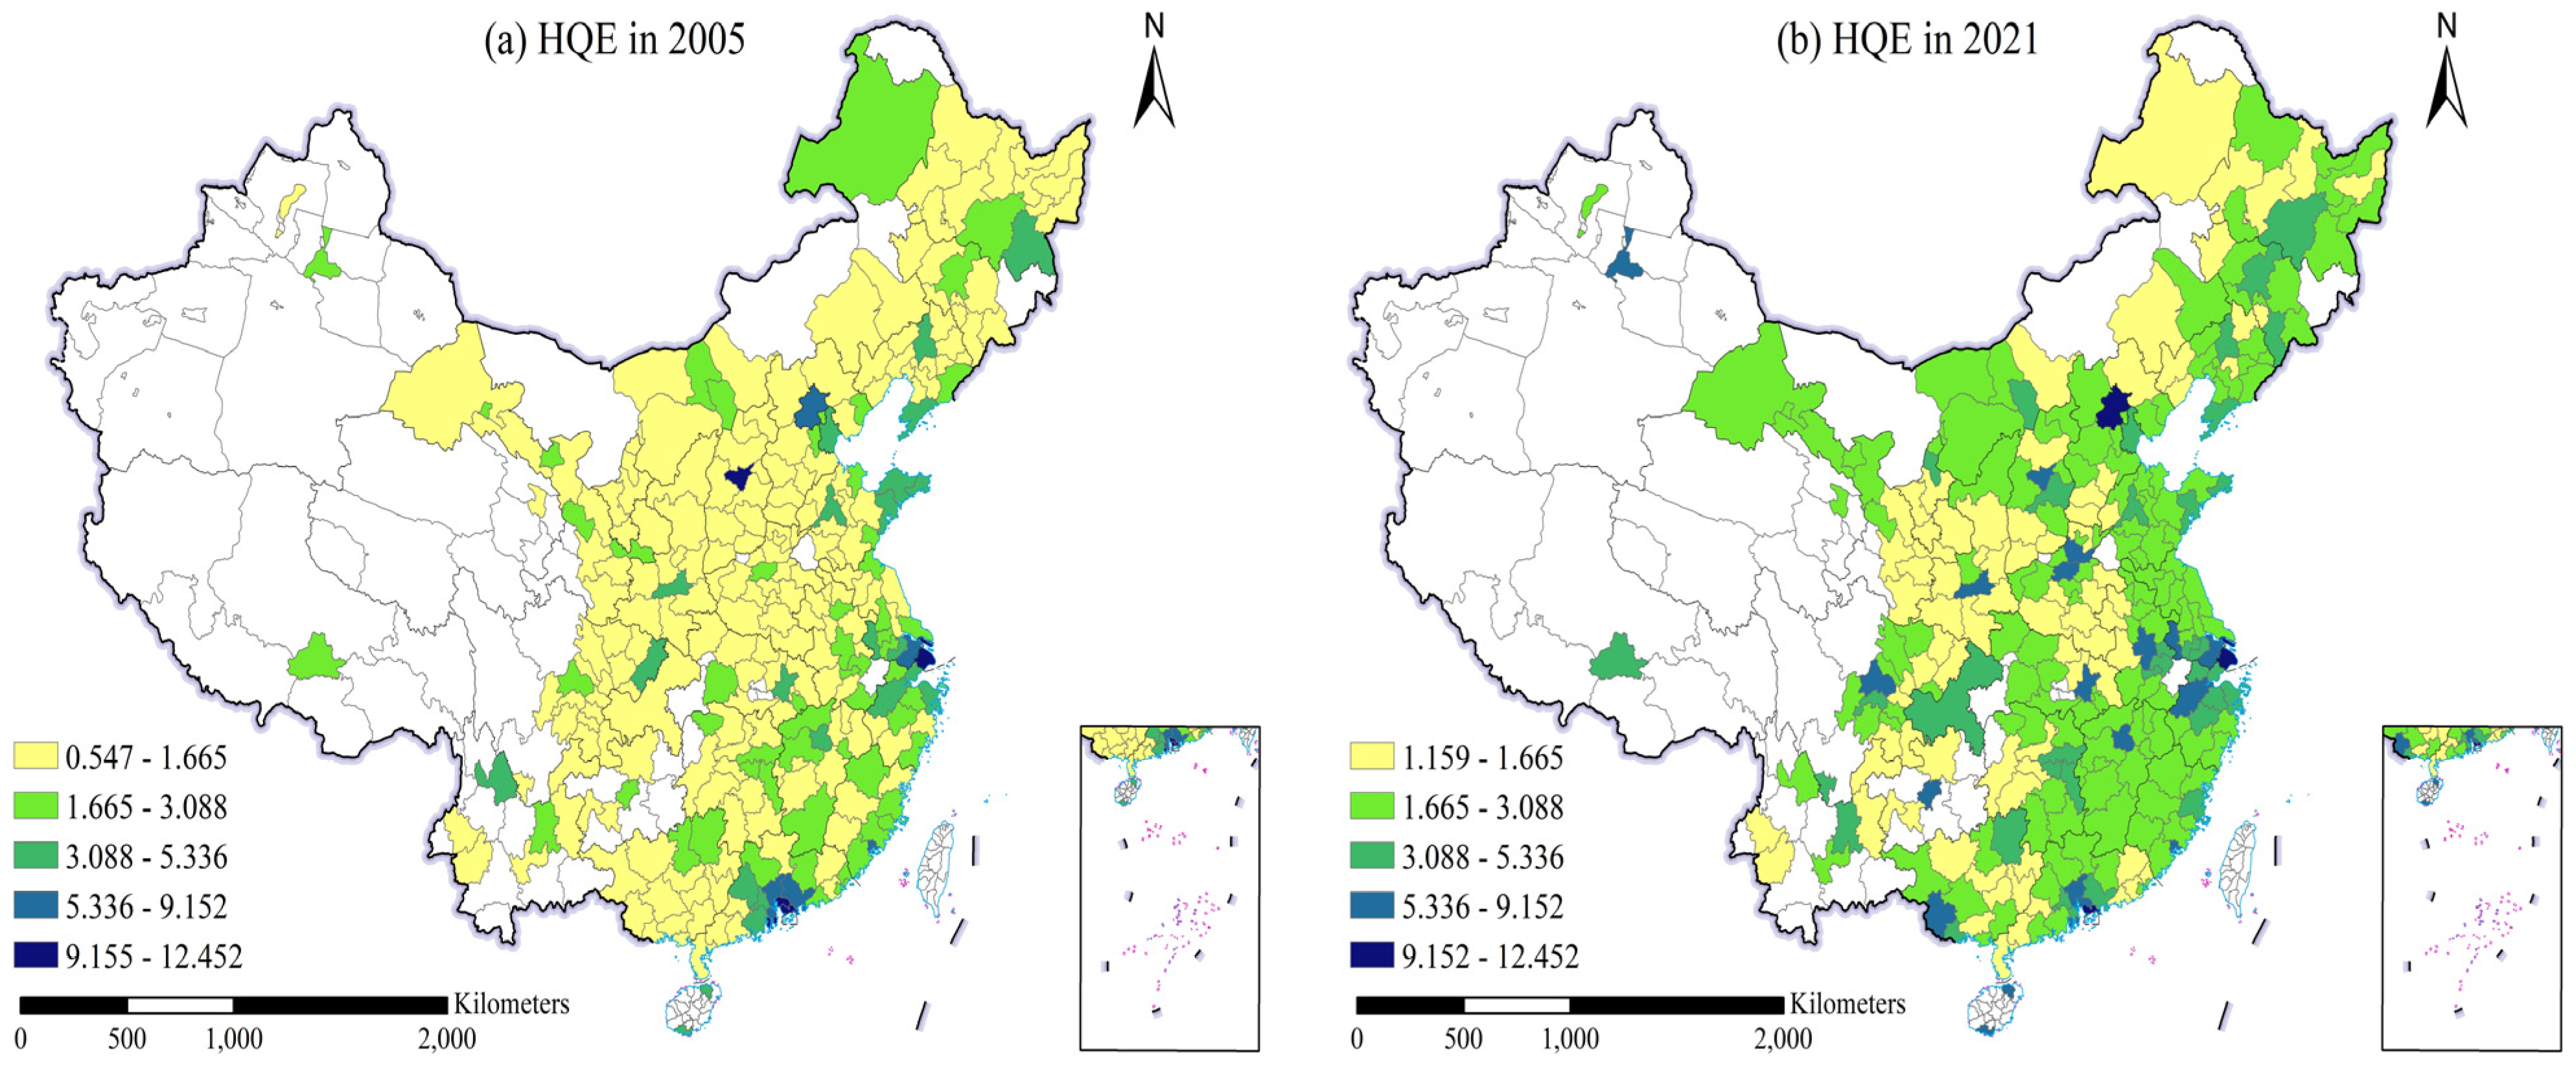
3.4. Spatial Evolution Characteristics of High-Quality Economic Development
4. Results
4.1. Baseline Regression
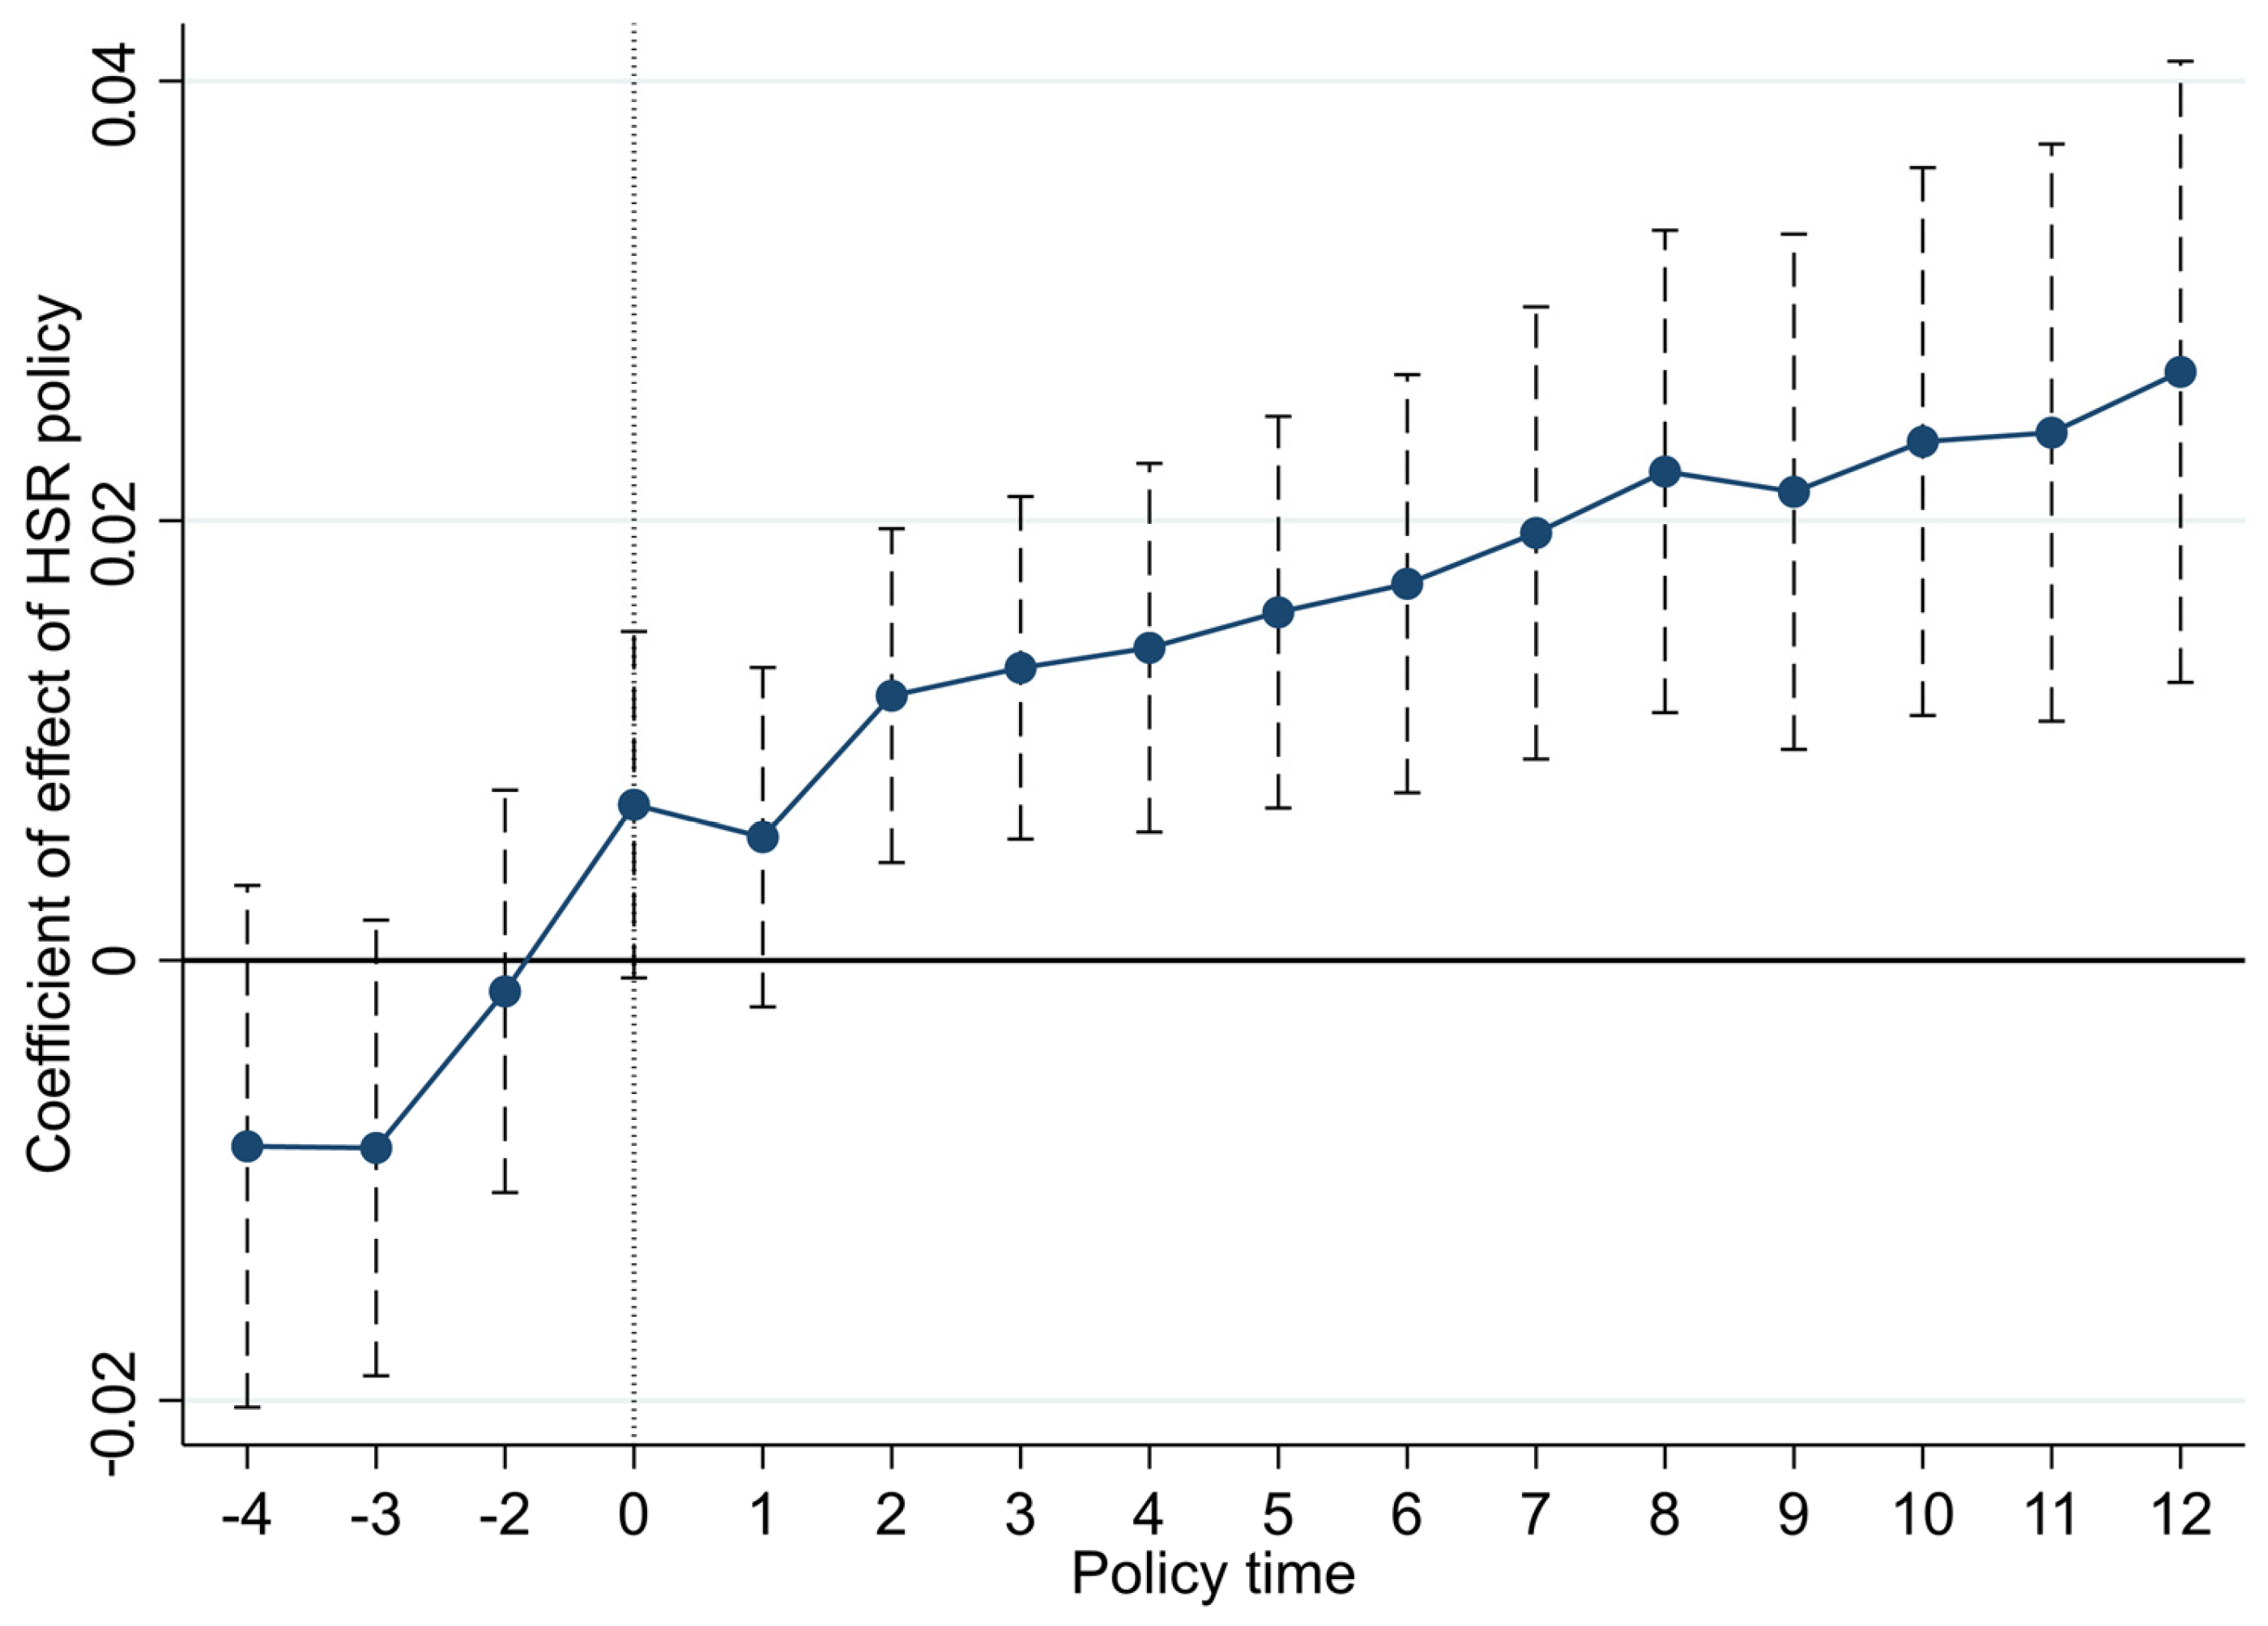
4.2. Parallel Trend Test for High-Speed Rail
4.3. Robustness Checks
4.4. Mechanism Analysis

| (1) | (2) | (3) | (4) | (5) | |
|---|---|---|---|---|---|
| Asset Liquidity | Labor Mobility | Industrial Structure Upgrading | Industrial Chain Resilience | Green Innovation | |
| HSR | 0.3442 *** | 0.4716 *** | 0.0230 *** | 0.0084 *** | 0.0702 *** |
| (0.0157) | (0.0671) | (0.0050) | (0.0006) | (0.0141) | |
| Control variables | YES | YES | YES | YES | YES |
| Constant | −19.2800 *** | −0.9734 | 9.0130 *** | 0.4505 *** | −7.1813 *** |
| (1.2327) | (5.2587) | (0.3950) | (0.0489) | (1.1079) | |
| id | YES | YES | YES | YES | YES |
| Year | YES | YES | YES | YES | YES |
| N | 4794 | 4794 | 4794 | 4794 | 4794 |
| r2 | 0.6273 | 0.2018 | 0.5764 | 0.4242 | 0.7019 |
4.5. Heterogeneity Analysis
4.6. Analysis of Spatial Spillover Effects
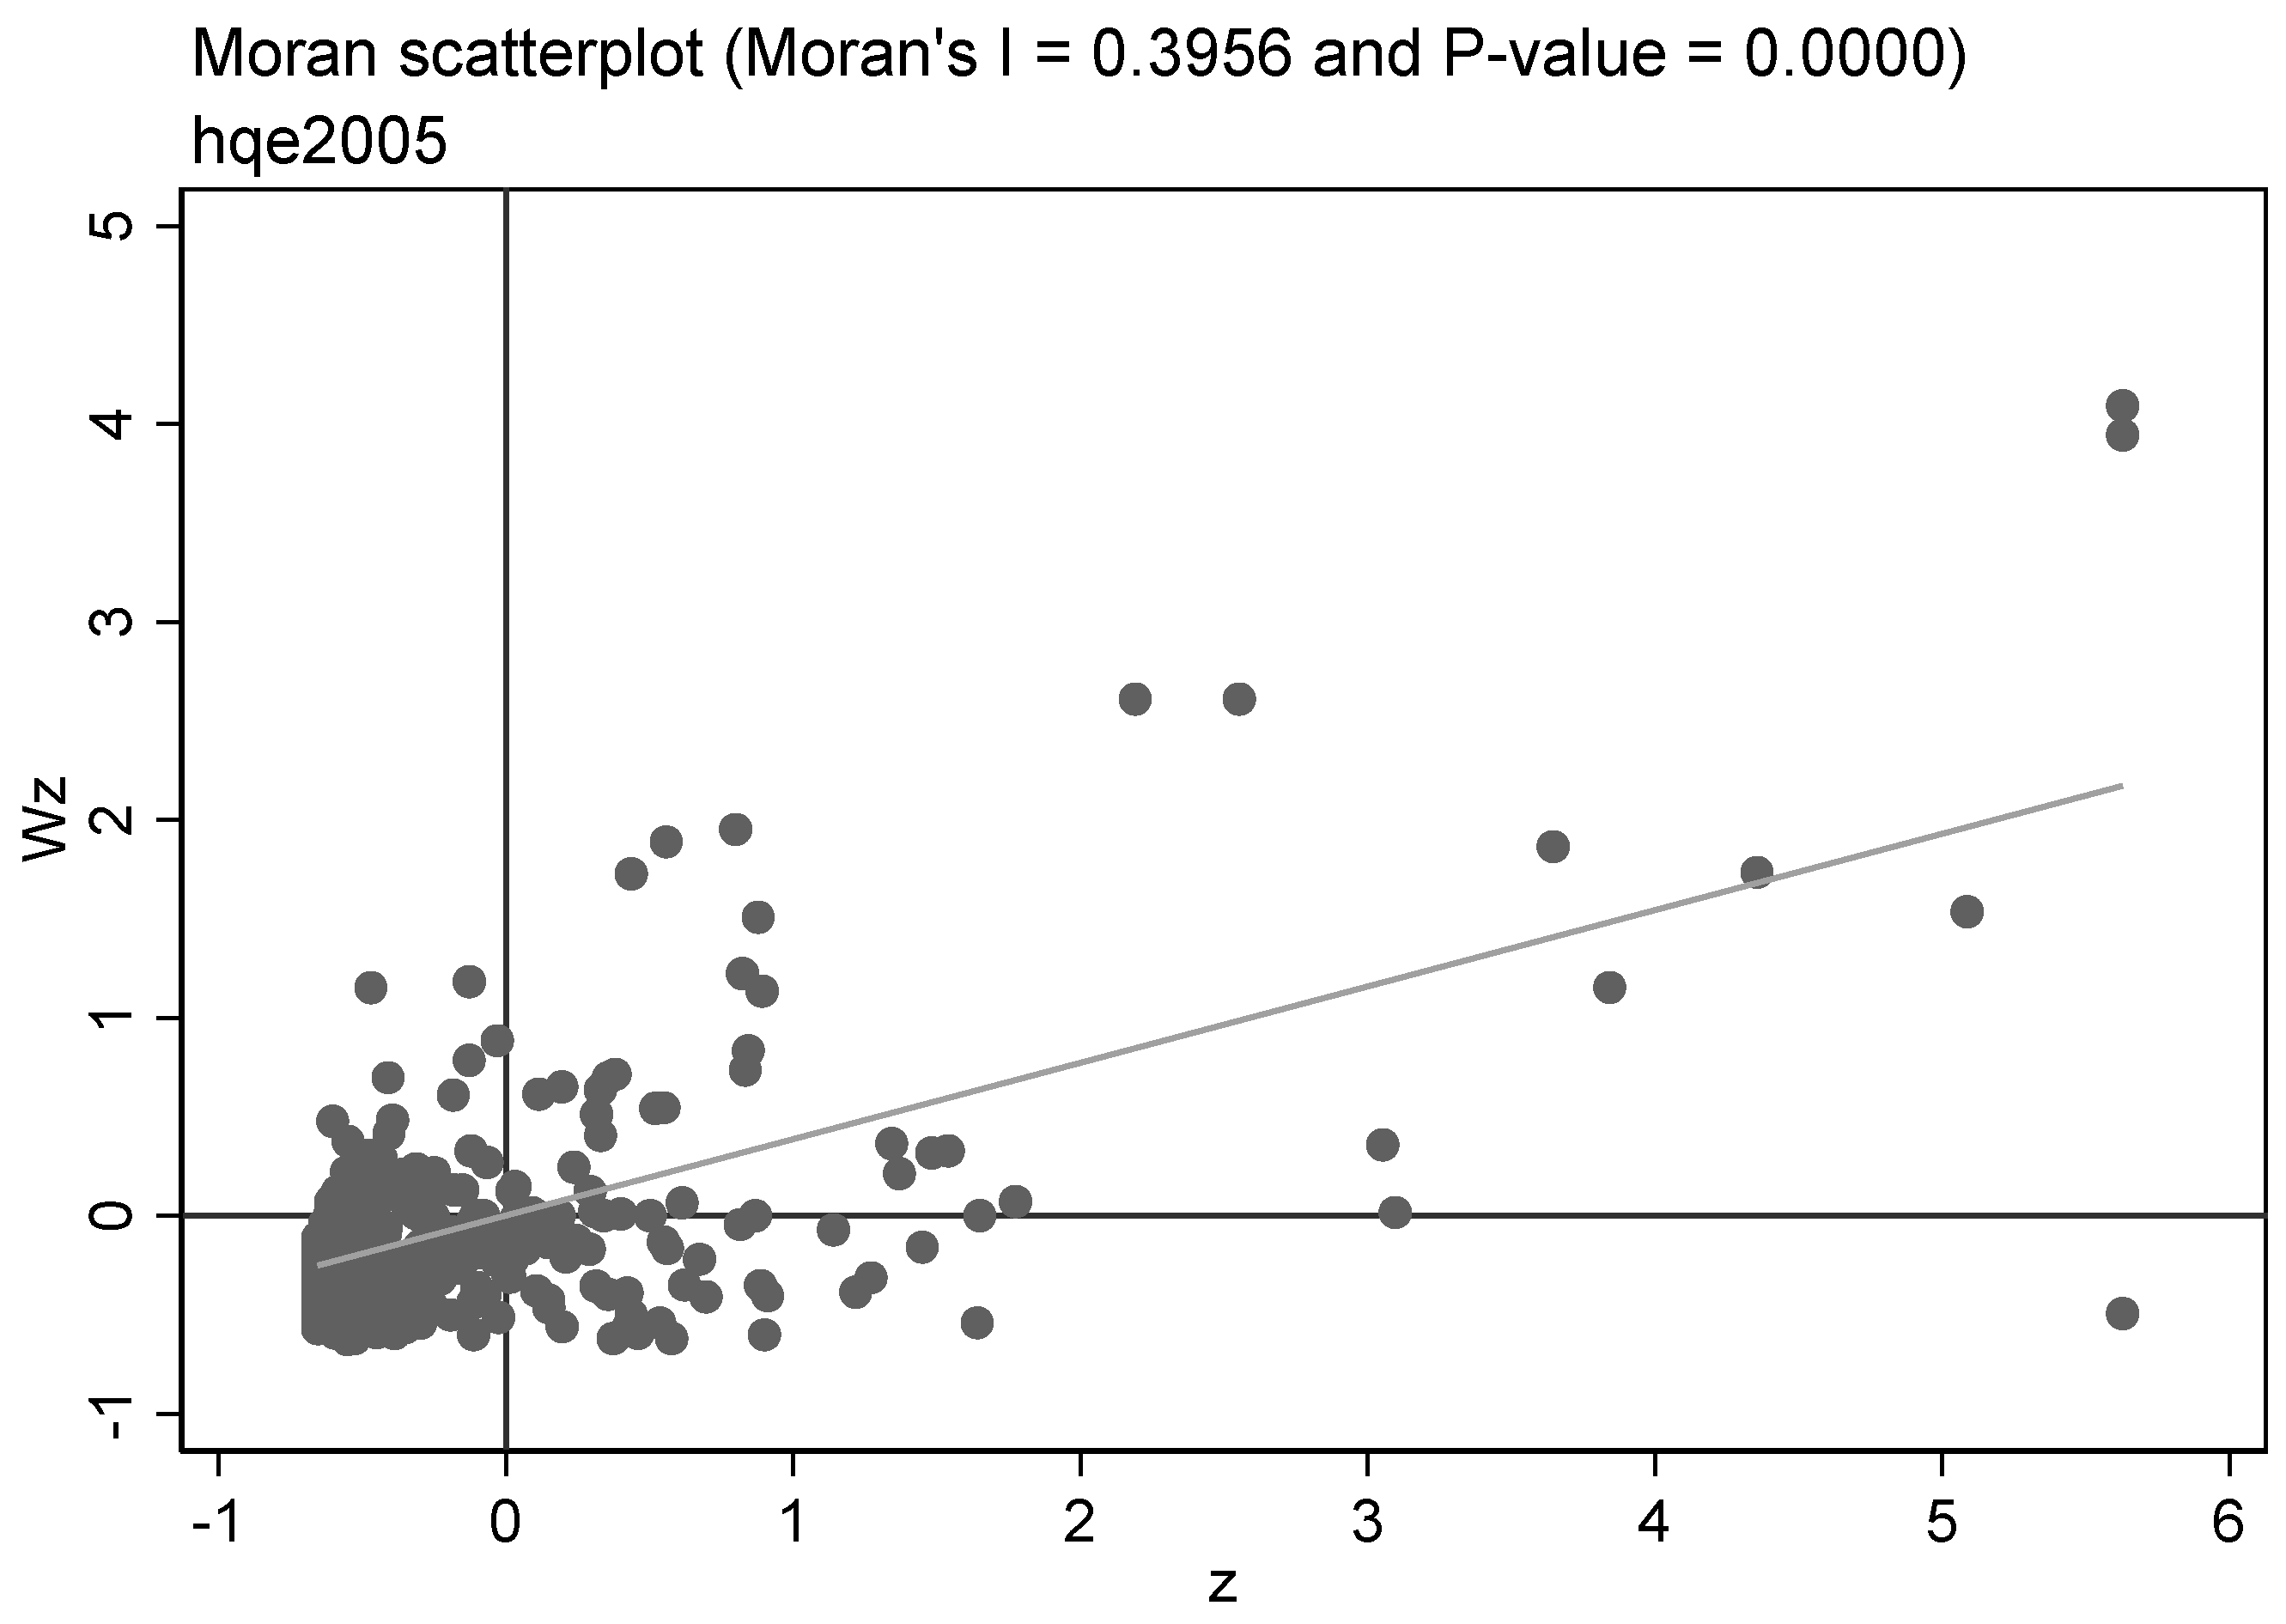
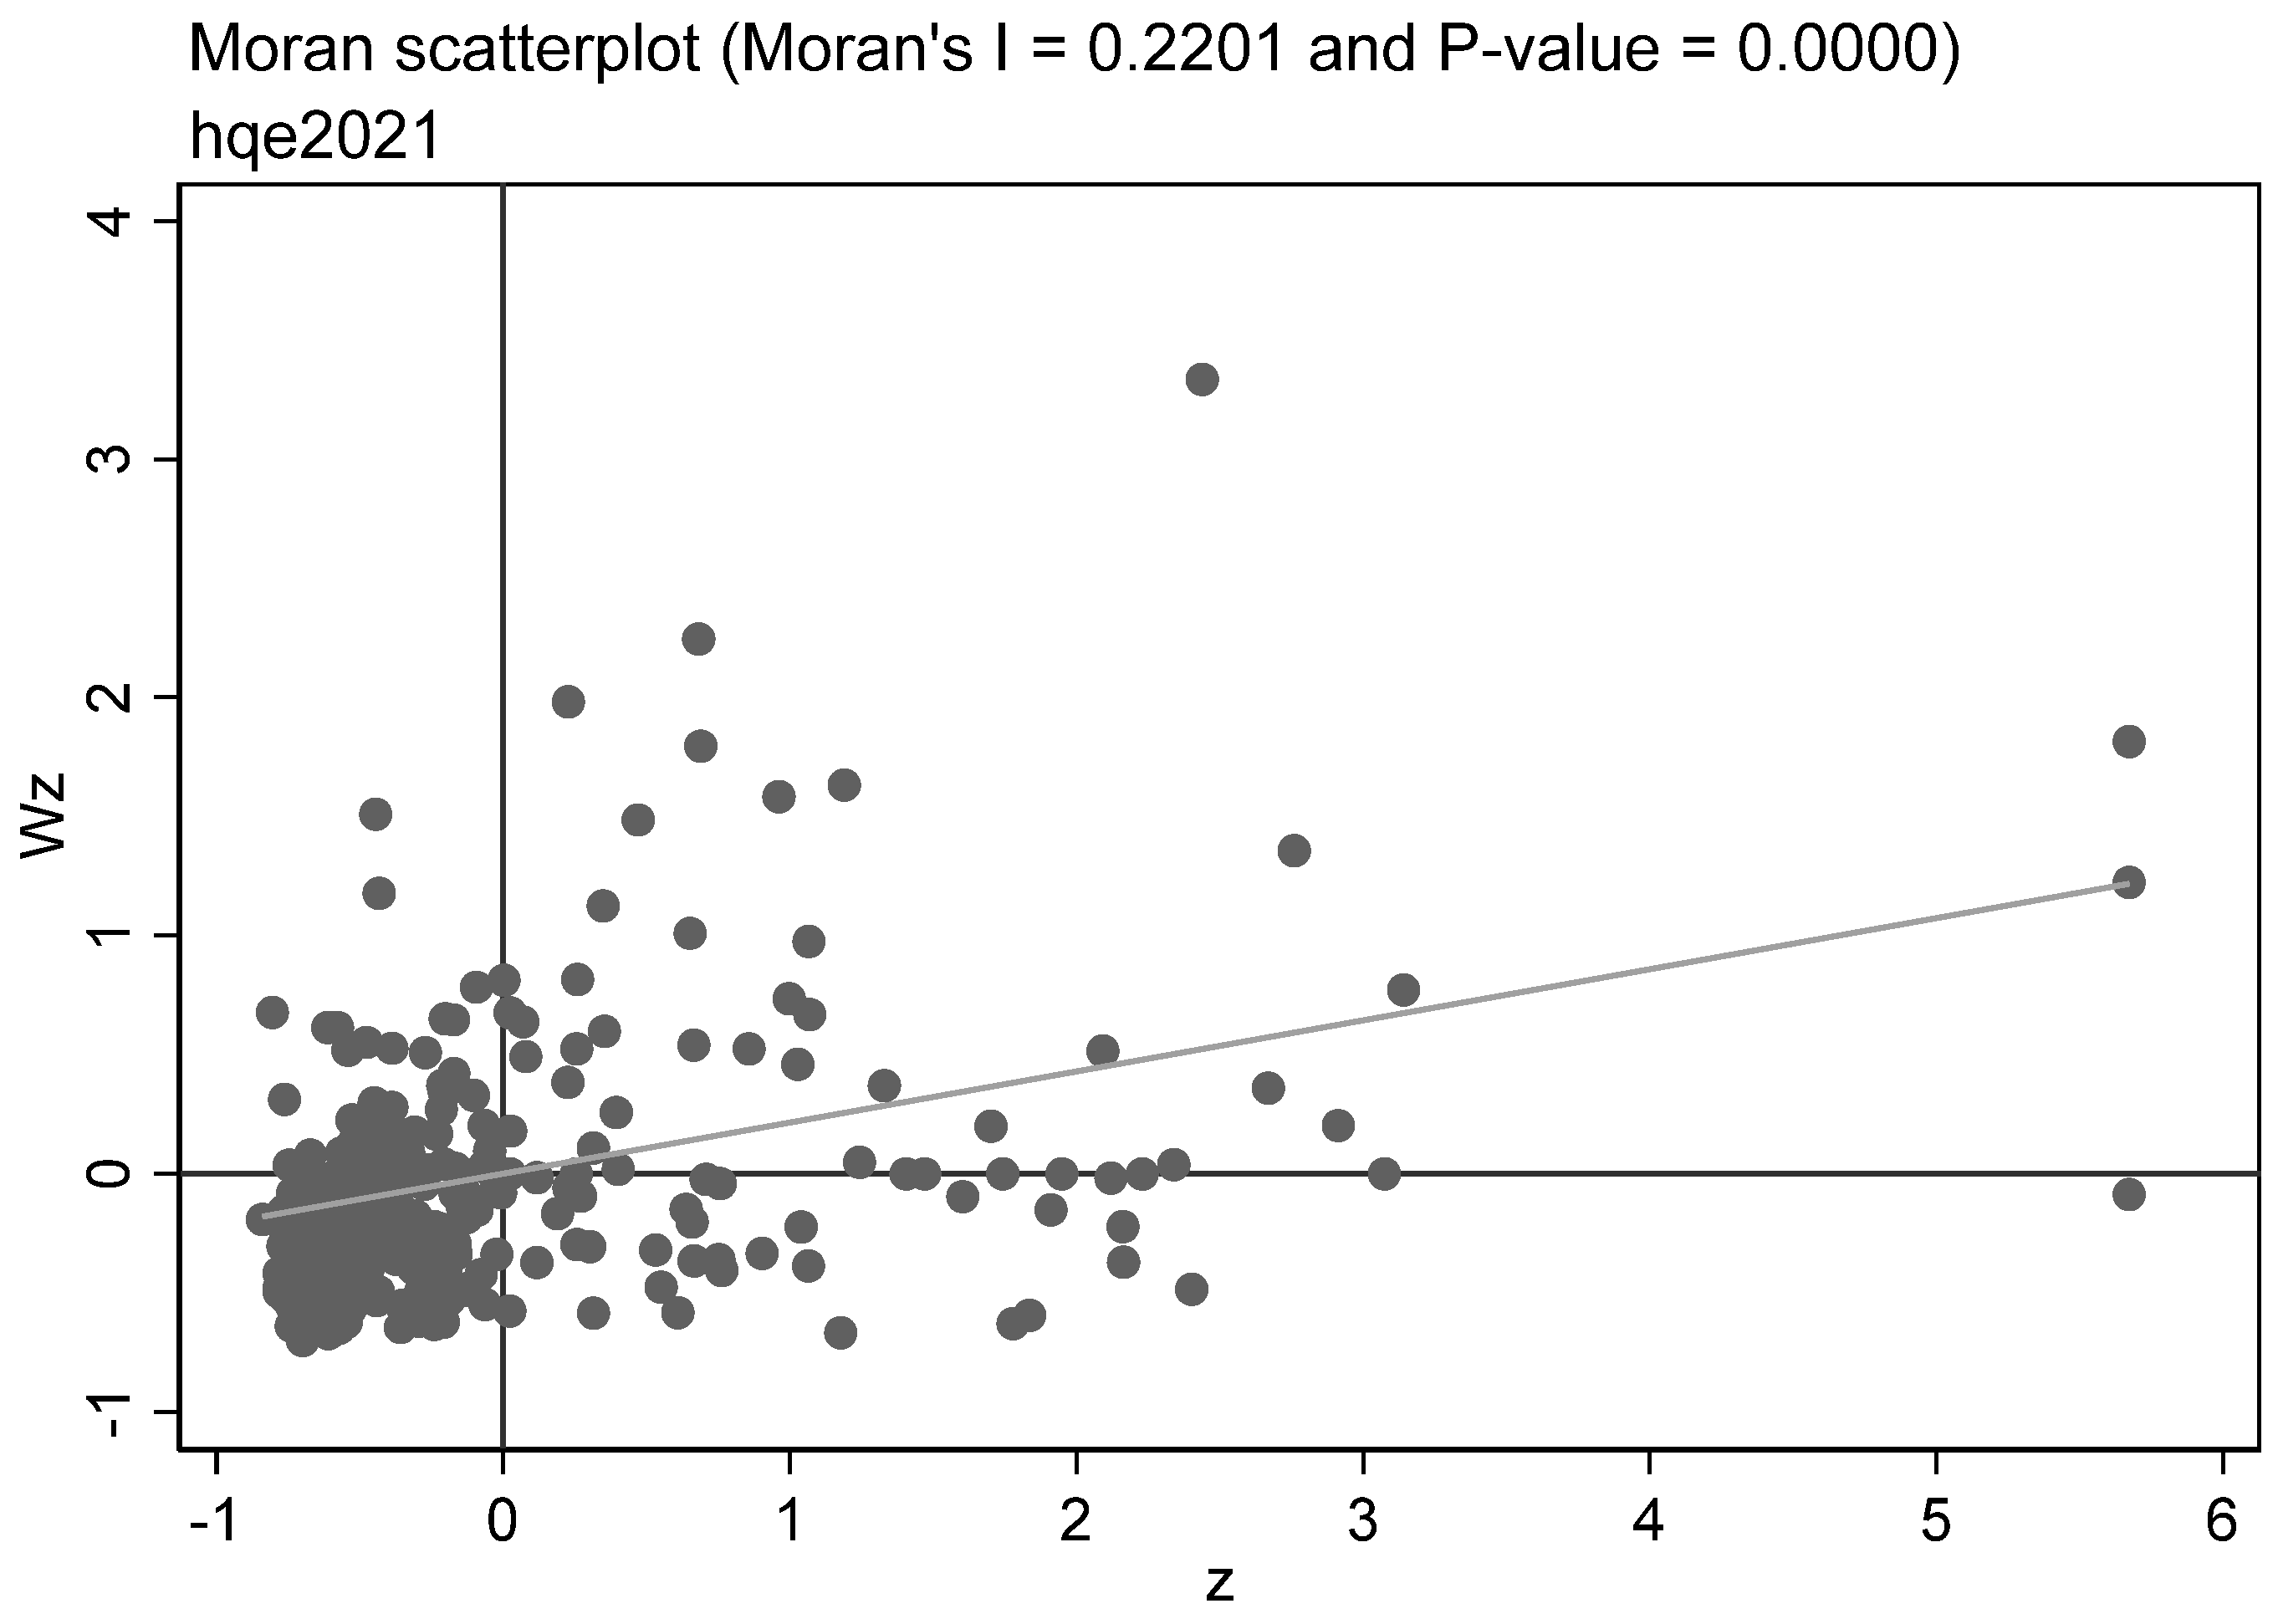
4.7. Spatial Correlation Test
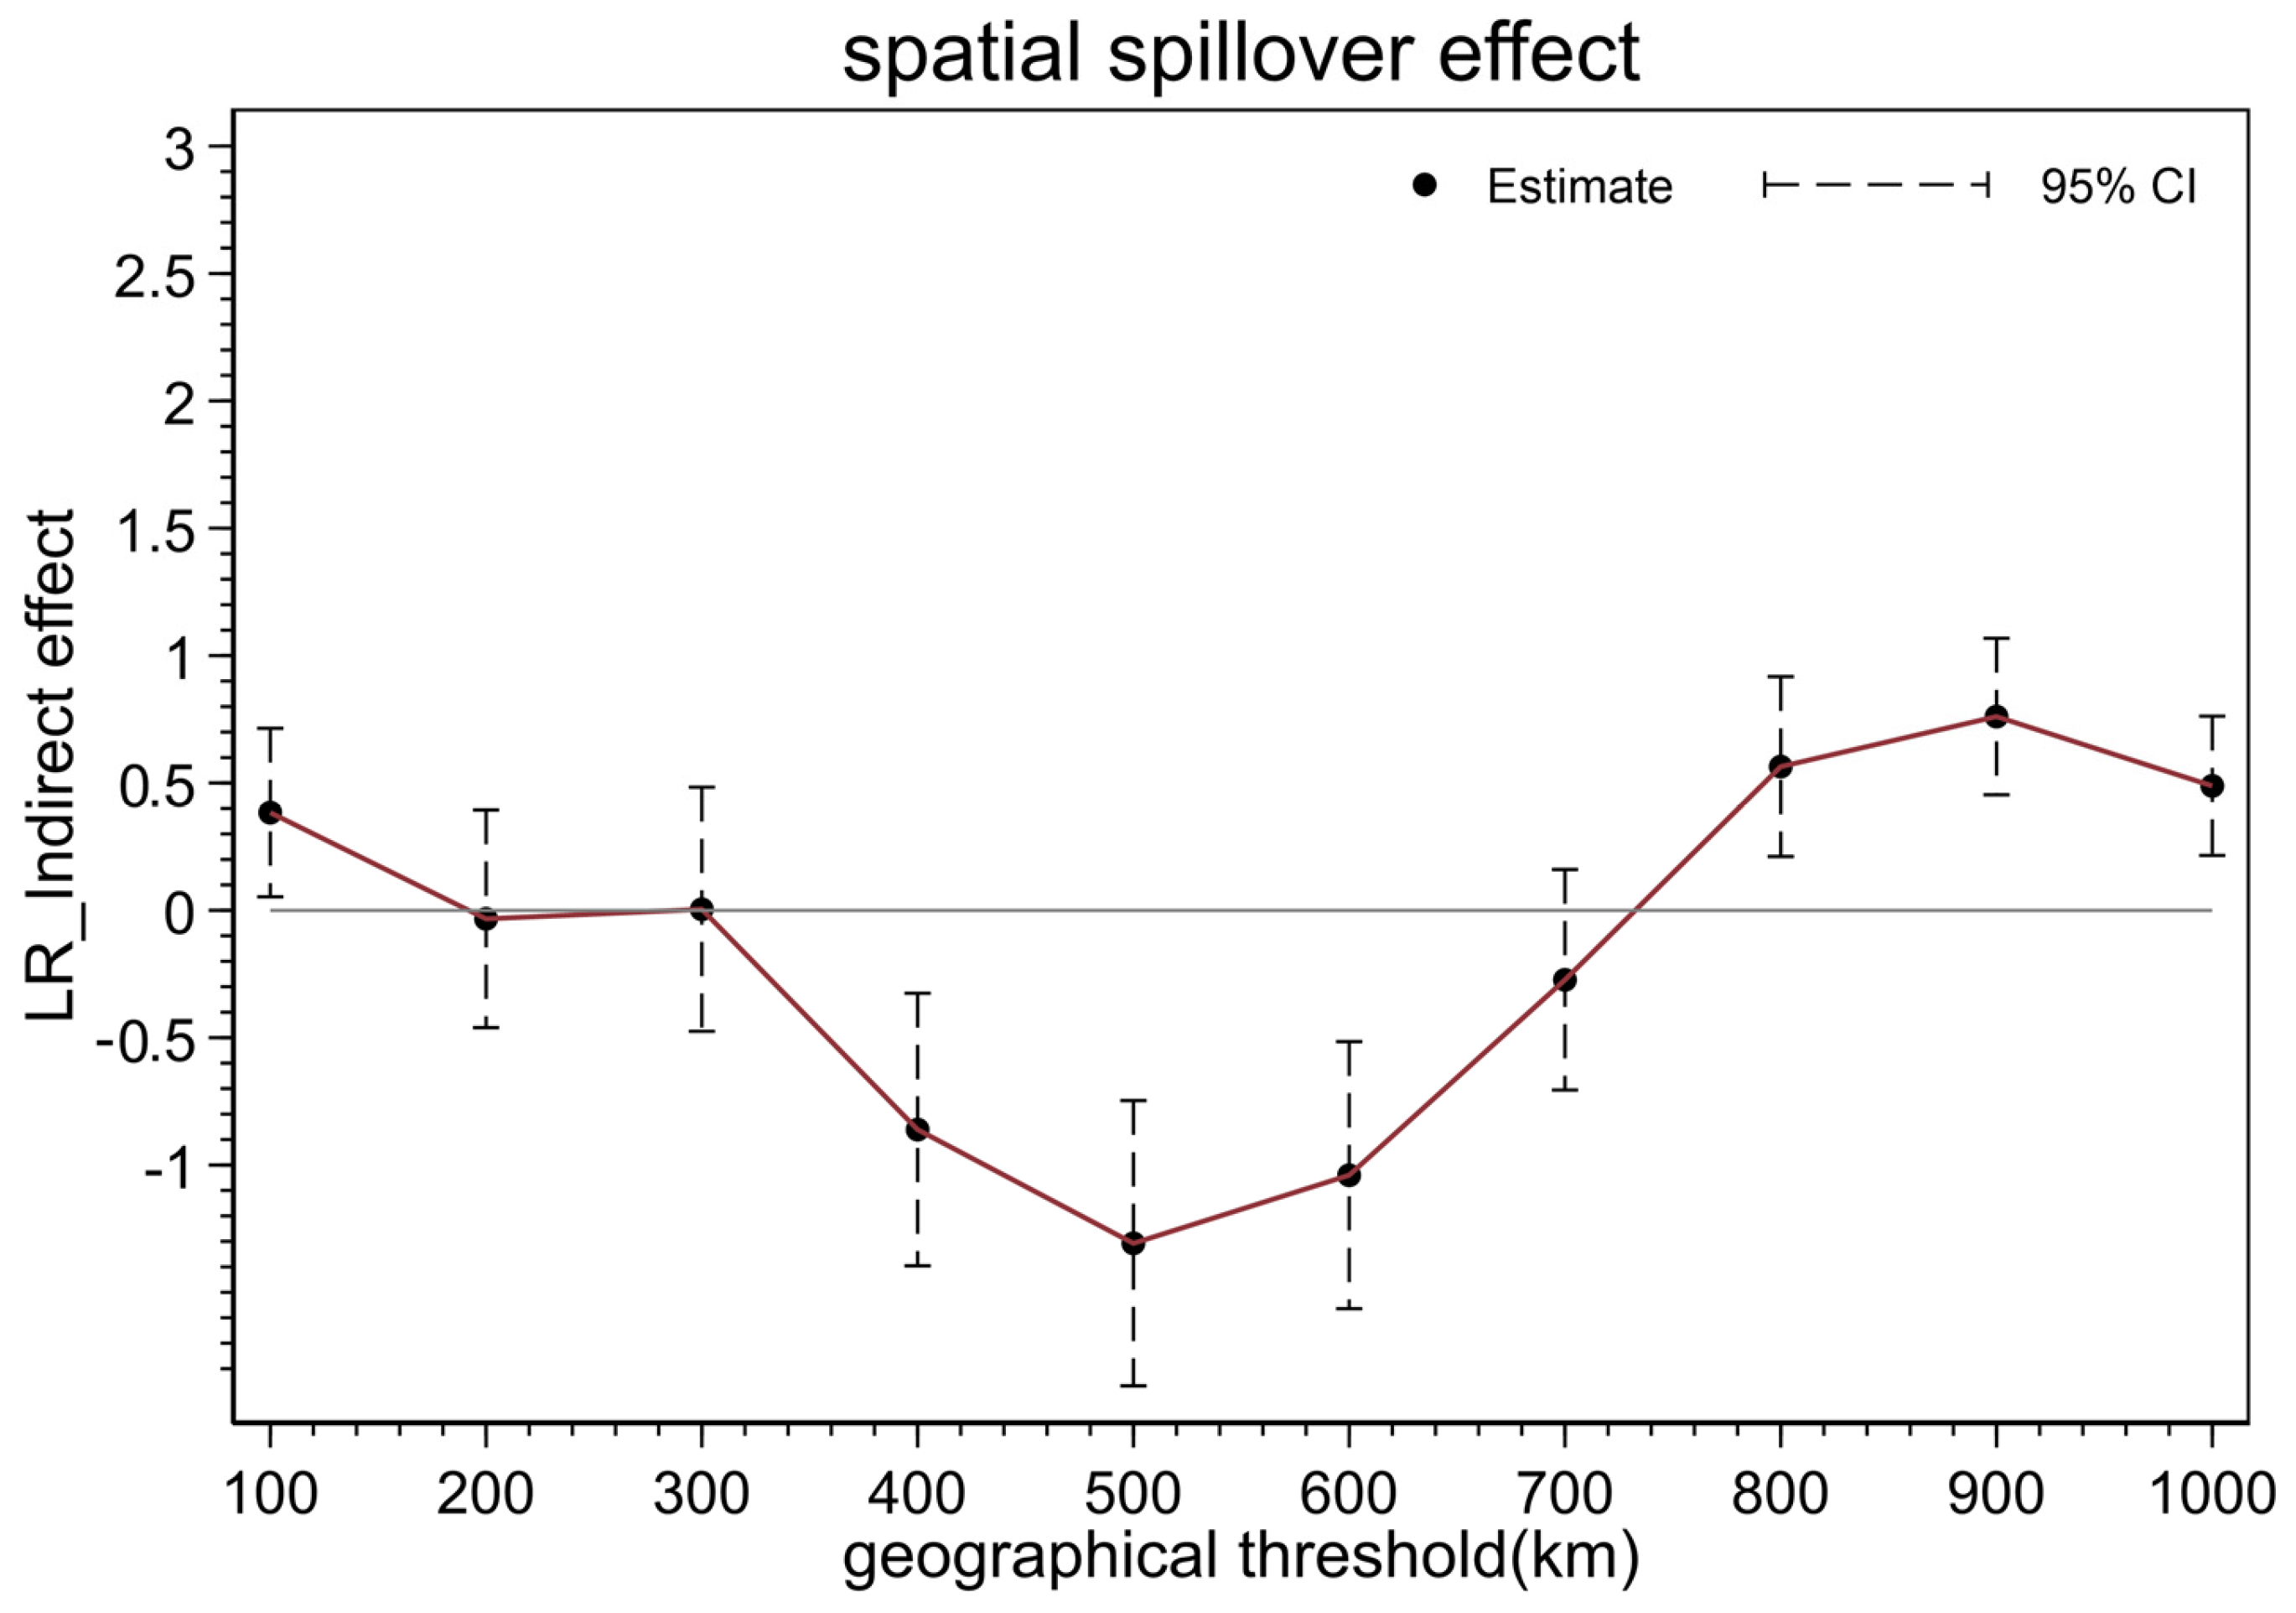
4.8. Spatial Distance Decay Effect
5. Discussion
6. Conclusions
Author Contributions
Funding
Data Availability Statement
Conflicts of Interest
References
- Wang, Y.; Miao, Z.; Lu, Y.; Zhu, Y. The impact of economic development on urban livability: Evidence from 40 large and medium-sized cities of China. J. Geogr. Sci. 2023, 33, 1123–1139. [Google Scholar] [CrossRef]
- Rodrik, D. The past, present, and future of economic growth. Challenge 2014, 57, 5–39. [Google Scholar] [CrossRef]
- Ren, X.; Tong, Z.; Sun, X.; Yan, C. Dynamic impacts of energy consumption on economic growth in China: Evidence from a non-parametric panel data model. Energy Econ. 2022, 107, 105855. [Google Scholar] [CrossRef]
- Long, F.; Zheng, L.; Song, Z. High-speed rail and urban expansion: An empirical study using a time series of nighttime light satellite data in China. J. Transp. Geogr. 2018, 72, 106–118. [Google Scholar] [CrossRef]
- Zheng, S.; Kahn, M.E. China’s bullet trains facilitate market integration and mitigate the cost of megacity growth. Proc. Natl. Acad. Sci. USA 2013, 110, E1248–E1253. [Google Scholar] [CrossRef]
- Qin, Y. ‘No county left behind?’ The distributional impact of high-speed rail upgrades in China. J. Econ. Geogr. 2017, 17, 489–520. [Google Scholar] [CrossRef]
- Ke, X.; Chen, H.; Hong, Y.; Hsiao, C. Do China’s high-speed-rail projects promote local economy?—New evidence from a panel data approach. China Econ. Rev. 2017, 44, 203–226. [Google Scholar] [CrossRef]
- Lin, Y. Travel costs and urban specialization patterns: Evidence from China’s high speed railway system. J. Urban Econ. 2017, 98, 98–123. [Google Scholar] [CrossRef]
- Vickerman, R. Can high-speed rail have a transformative effect on the economy? Transp. Policy 2017, 62, 31–37. [Google Scholar] [CrossRef]
- Tang, Z.; Wang, L.; Wu, W. The impact of high-speed rail on urban carbon emissions: Evidence from the Yangtze River Delta. J. Transp. Geogr. 2023, 110, 103641. [Google Scholar] [CrossRef]
- Sun, Y.; Razzaq, A.; Kizys, R.; Bao, Q. High-speed rail and urban green productivity: The mediating role of climatic conditions in China. Technol. Forecast. Soc. Change 2022, 185, 122055. [Google Scholar] [CrossRef]
- Chen, Z.; Haynes, K.E. Impact of high-speed rail on regional economic disparity in China. J. Transp. Geogr. 2017, 65, 80–91. [Google Scholar] [CrossRef]
- Saleem, H.; Shahzad, M.; Khan, M.B.; Khilji, B.A. Innovation, total factor productivity and economic growth in Pakistan: A policy perspective. J. Econ. Struct. 2019, 8, 7. [Google Scholar] [CrossRef]
- Amp, Z.J.; Amp, W.G.; Jipeng, Z. The Estimation of China’s provincial capital stock: 1952–2000. Econ. Res. J. 2004, 10, 35–44. [Google Scholar]
- Hu, Z.; Wu, G.; Han, Y.; Niu, Y. Unraveling the dynamic changes of high-speed rail network with urban development: Evidence from China. Socio-Econ. Plan. Sci. 2023, 85, 101380. [Google Scholar] [CrossRef]
- Lu, Y.; Zeng, L. How do high-speed railways facilitate high-quality urban development: Evidence from China. Land 2022, 11, 1596. [Google Scholar] [CrossRef]
- An, J. High-Speed Rail Network, Entrepreneurial Activity and High-Quality Development: Empirical Data from Chinese Cities. Theor. Econ. Lett. 2024, 14, 2382–2406. [Google Scholar] [CrossRef]
- Kong, Q.; Li, R.; Jiang, X.; Sun, P.; Peng, D. Has transportation infrastructure development improved the quality of economic growth in China’s cities? A quasi-natural experiment based on the introduction of high-speed rail. Res. Int. Bus. Financ. 2022, 62, 101726. [Google Scholar] [CrossRef]
- Qi, J. Fiscal expenditure incentives, spatial correlation and quality of economic growth: Evidence from a Chinese province. Int. J. Bus. Manag. 2016, 11, 191–201. [Google Scholar] [CrossRef]
- Kong, Q.; Peng, D.; Ni, Y.; Jiang, X.; Wang, Z. Trade openness and economic growth quality of China: Empirical analysis using ARDL model. Financ. Res. Lett. 2021, 38, 101488. [Google Scholar] [CrossRef]
- Feng, Q.; Chen, Z.; Cheng, C.; Chang, H. Impact of high-speed rail on high-skilled labor mobility in China. Transp. Policy 2023, 133, 64–74. [Google Scholar] [CrossRef]
- Kang, S.K.; DeCelles, K.A.; Tilcsik, A.; Jun, S. Whitened Resumes: Race and Self-Presentation in the Labor Market. Adm. Sci. Q. 2016, 61, 469–502. [Google Scholar] [CrossRef]
- Li, B.; Zhao, Q.; Shahab, Y.; Kumar, S. High-speed rail construction and labor investment efficiency: Evidence from an emerging market. Res. Int. Bus. Financ. 2022, 64, 101848. [Google Scholar] [CrossRef]
- Baum-Snow, N.; Brandt, L.; Henderson, J.V.; Turner, M.A.; Zhang, Q. Roads, railroads, and decentralization of Chinese cities. Rev. Econ. Stat. 2017, 99, 435–448. [Google Scholar] [CrossRef]
- Zhang, A.; Wan, Y.; Yang, H. Impacts of high-speed rail on airlines, airports and regional economies: A survey of recent research. Transp. Policy 2019, 81, A1–A19. [Google Scholar] [CrossRef]
- Yan, L.; Tu, M.; Chagas, A.L.S.; Tai, L. The impact of high-speed railway on labor spatial misallocation: Based on spatial difference-in-differences analysis. Transp. Res. Part A Policy Pract. 2022, 164, 82–97. [Google Scholar] [CrossRef]
- Shi, Y.; Guan, C.; Chang, J.-W.; Liu, H. High-Speed Rail: A Fast Lane for Information Delivery of China’s IPOs. Emerg. Mark. Financ. Trade 2025, 61, 273–288. [Google Scholar] [CrossRef]
- Wang, Y.; Guo, J.; Zhang, S. Market Access, Population Mobility and Labor Force Structure: Evidence from China’s High-Speed Railway. SAGE Open 2024, 14, 21582440241285750. [Google Scholar] [CrossRef]
- Wang, F.; Wei, X.; Liu, J.; He, L.; Gao, M. Impact of high-speed rail on population mobility and urbanisation: A case study on Yangtze River Delta urban agglomeration, China. Transp. Res. Part A Policy Pract. 2019, 127, 99–114. [Google Scholar] [CrossRef]
- Guo, Y.; Xie, W.; Yang, Y. Dual green innovation capability, environmental regulation intensity, and high-quality economic development in China: Can green and growth go together? Financ. Res. Lett. 2024, 63, 105275. [Google Scholar] [CrossRef]
- Clements, K.; Pawlowski, J.; Manouselis, N. Open educational resources repositories literature review—Towards a comprehensive quality approaches framework. Comput. Hum. Behav. 2015, 51, 1098–1106. [Google Scholar] [CrossRef]
- Guirao, B.; Lara-Galera, A.; Campa, J.L. High Speed Rail commuting impacts on labour migration: The case of the concentration of metropolis in the Madrid functional area. Land Use Policy 2017, 66, 131–140. [Google Scholar] [CrossRef]
- Zhang, F.; Wang, F.; Yao, S. Does government-driven infrastructure boost green innovation? Evidence of new infrastructure plan in China. J. Asian Econ. 2024, 95, 101828. [Google Scholar] [CrossRef]
- Wu, Y.; Lee, C.C.; Lee, C.C.; Peng, D. Geographic proximity and corporate investment efficiency: Evidence from high-speed rail construction in China. J. Bank. Financ. 2022, 140, 106510. [Google Scholar] [CrossRef]
- Zhang, F.; Yao, S.; Wang, F. The role of high-speed rail on green total factor productivity: Evidence from Chinese cities. Environ. Sci. Pollut. Res. 2023, 30, 23314–23327. [Google Scholar] [CrossRef]
- Li, S.; Liu, Q.; Shao, Z. Connect to green: High-speed rail network and firms’ environmental performance. Transp. Policy 2024, 159, 297–313. [Google Scholar] [CrossRef]
- Zhou, Y.; Xu, X.; Tao, L. The impact mechanism of high-speed railway on regional green innovation spillover under multi-dimensional paths. Environ. Impact Assess. Rev. 2022, 95, 106795. [Google Scholar] [CrossRef]
- Chen, X.; Di, Q.; Jia, W.; Hou, Z. Spatial correlation network of pollution and carbon emission reductions coupled with high-quality economic development in three Chinese urban agglomerations. Sustain. Cities Soc. 2023, 94, 104552. [Google Scholar] [CrossRef]
- Chen, Z.; Xue, J.; Rose, A.Z.; Haynes, K.E. The impact of high-speed rail investment on economic and environmental change in China: A dynamic CGE analysis. Transp. Res. Part A Policy Pract. 2016, 92, 232–245. [Google Scholar] [CrossRef]
- Shao, S.; Tian, Z.; Yang, L. High-speed rail and urban service industry agglomeration: Evidence from China’s Yangtze River Delta region. J. Transp. Geogr. 2017, 64, 102–112. [Google Scholar] [CrossRef]
- Acemoglu, D.; Johnson, S.; Robinson, J.A. Institutions as a fundamental cause of long-run growth. Handb. Econ. Growth 2005, 1, 385–472. [Google Scholar]
- Donaldson, D. Railroads of the Raj: Estimating the impact of transportation infrastructure. Am. Econ. Rev. 2018, 108, 899–934. [Google Scholar] [CrossRef]
- Alfaro, L.; Kalemli-Ozcan, S.; Volosovych, V. Why doesn’t capital flow from rich to poor countries? An empirical investigation. Rev. Econ. Stat. 2008, 90, 347–362. [Google Scholar] [CrossRef]
- Dong, X.; Zheng, S.; Kahn, M.E. The role of transportation speed in facilitating high-skilled teamwork across cities. J. Urban Econ. 2020, 115, 103212. [Google Scholar] [CrossRef]
- Li, L.; Lu, L.; Xu, Y.; Sun, X. Influence of high-speed rail on tourist flow network in typical tourist cities: An empirical study based on the Hefei–Fuzhou high-speed rail in China. Asia Pacific J. Tour. Res. 2020, 25, 1215–1231. [Google Scholar] [CrossRef]
- Wang, D.; Niu, Y.; Qian, J. Evolution and optimization of China’s urban tourism spatial structure: A high-speed rail perspective. Tour. Manag. 2018, 64, 218–232. [Google Scholar] [CrossRef]
- Lin, J.J.; Xie, Z.X. The associations of newly launched high-speed rail stations with industrial gentrification. J. Transp. Geogr. 2020, 83, 102662. [Google Scholar] [CrossRef]
- Chen, Z.; Haynes, K.E. Impact of high-speed rail on housing values: An observation from the Beijing–Shanghai line. J. Transp. Geogr. 2015, 43, 91–100. [Google Scholar] [CrossRef]
- Dong, X. High-speed railway and urban sectoral employment in China. Transp. Res. Part A Policy Pract. 2018, 116, 603–621. [Google Scholar] [CrossRef]
- Meng, X.; Qu, Y.; Xu, X. The Sustainable Impact of High-Speed Rail Connection on the Local and Neighboring Regions’ Employment: Evidence from China. Sustainability 2024, 16, 16178. [Google Scholar] [CrossRef]
- Gao, Y.; Su, W.; Wang, K. Does high-speed rail boost tourism growth? New evidence from China. Tour. Manag. 2019, 72, 220–231. [Google Scholar] [CrossRef]
- Xu, W.A.; Zhou, J.; Yang, L.; Li, L. The implications of high-speed rail for Chinese cities: Connectivity and accessibility. Transp. Res. Part A Policy Pract. 2018, 116, 308–326. [Google Scholar] [CrossRef]
- Jiao, J.; Wang, J.; Zhang, F.; Jin, F.; Liu, W. Roles of accessibility, connectivity and spatial interdependence in realizing the economic impact of high-speed rail: Evidence from China. Transp. Policy 2020, 91, 1–15. [Google Scholar] [CrossRef]
- Ren, X.; Zeng, G.; Dong, K.; Wang, K. How does high-speed rail affect tourism development? The case of the Sichuan-Chongqing Economic Circle. Transp. Res. Part A Policy Pract. 2023, 169, 103588. [Google Scholar] [CrossRef]
- Bhatt, A.; Kato, H.; Hayashi, Y. High-speed rails and knowledge productivity: A global perspective. Transp. Policy 2021, 101, 174–186. [Google Scholar] [CrossRef]
| Primary Indicators | Second-Class Indicators | Third-Class Indicators | Basic Indicators | Unit | Type of Indicator |
|---|---|---|---|---|---|
| Innovation | Innovation input | Innovation input | R&D expenditure/GDP | % | + |
| Science and technology expenditure/local general public budget expenditure | % | + | |||
| Innovation output | Innovation output | Urban Innovation Index | - | + | |
| Patent applications granted per 10,000 persons | Number of patents granted/population of the region | + | |||
| Innovative foundations | Scale of education | The count of students attending general higher education programs | Tens of thousands | + | |
| Investment in education | Share of education expenditure in general budget expenditure of local finance | % | + | ||
| Innovation efficiency | Labor productivity | GDP/average annual number of employees | % | + | |
| Capital productivity | GDP/total investment in fixed assets | % | + | ||
| Coordination | Industrial structure | Rationalization of industrial structure | Percentage of tertiary sector output | % | + |
| Advanced industrial structure | Tertiary sector output/secondary sector output | % | + | ||
| Urban and rural coordination | The ratio of disposable income per capita for urban and rural residents | Urban disposable income per capita/rural disposable income per capita | % | - | |
| Urbanization rate | Permanent urban population/(permanent urban population + permanent rural population) | % | + | ||
| Financial structure | Financial risk | Balance of deposits and loans/GDP | % | - | |
| Greenness | Energy consumption | Electricity consumption per unit of output | Industrial Electricity Consumption/GDP | Kilowatt-hours/billion dollars | - |
| Wastewater discharge per unit of output | Industrial wastewater discharge/GDP | Tons/billion dollars | - | ||
| Exhaust emissions per unit of output | Smoke emissions per unit of output | Tons/billion dollars | - | ||
| Emissions of smoke and dust per unit of output | Industrial soot and dust discharges/GDP | Tons/billion dollars | - | ||
| Pollution emission | Haze pollution | Annual average PM2.5 concentration | μg/m3 | - | |
| Openness | Level of foreign trade | Degree of openness | Total Trade Imports and Exports/GDP | - | + |
| Introduction of foreign capital | Effectiveness of openness | Total utilized foreign capital/GDP | - | + | |
| Tourism openness | International tourism revenue/GDP | - | + | ||
| Tourism openness | International tourism revenue/GDP | Domestic tourism revenue/GDP | - | + | |
| Domestic tourism revenue/GDP | The number of inbound tourists received | 10,000 people | + | ||
| Sharing | Income distribution | Per capita income | Real GDP per capita | - | + |
| Remuneration for labor | Average wages of employees | Yuan | + | ||
| Consumption level | Share of consumption | Social Retail Consumption/GDP | % | + | |
| Urban–rural sharing | Engel coefficient of urban households | Household food expenditure accounts for the proportion of urban consumption expenditure | % | - | |
| Engel coefficient of rural households | Household food expenditure accounts for the proportion of rural consumption expenditure | % | - | ||
| Public services | Per capita expenditure on education | Education expenditures/total population | % | + | |
| Cultural resources | Public library collection per capita | Number of books/million people | + | ||
| Health resources | Hospital bed count per 10,000 individuals | Number | + | ||
| Employment effect | Registered urban unemployment rate | % | - | ||
| Data sharing | Internet penetration | The number of internet broadband access users among 100 people | % | + |
| Variable Types | Variable Symbol | Variable Name | Description and Measurement Method |
|---|---|---|---|
| Dependent variable | HQE | High-quality economic development | Comprehensive index calculation |
| Explanatory variable | HSR | High-speed rail | Number of HSR lines opened |
| Control variables | HCI | Level of human capital | Logarithm of the number of employees at year end |
| UED | Urban economic density | Logarithm of total fixed asset investment | |
| PTK | Passenger turnover | Logarithm of the sum of road passenger traffic, water passenger traffic, and civil aviation passenger traffic | |
| Road | Level of transportation infrastructure | Logarithm of highway mileage | |
| Economy | Level of economic development | Logarithm of regional gross domestic product | |
| Mediating variables | Labor | Labor mobility | Logarithm of the number of employees at year end |
| Capital | Capital mobility | Logarithm of total fixed asset investment | |
| Industrial structure | Industrial structure upgrading | Ratio of the added value of the tertiary industry to the added value of the secondary industry | |
| Resilience | Industrial chain resilience | Composite index of industrial chain resilience | |
| Green innovation | Green innovation | Logarithm of the number of green invention patents |
| N | Mean | Standard Deviation | Minimum | Maximum | |
|---|---|---|---|---|---|
| HQE | 4794 | 2.1865 | 1.8612 | 0.5477 | 12.4517 |
| HSR | 4794 | 0.7795 | 1.2323 | 0 | 9 |
| HCI | 4794 | 0.0201 | 0.0264 | 0 | 0.1238 |
| UED | 4794 | 0.2445 | 0.4190 | 0.004 | 2.7076 |
| PTK | 4794 | 12.897 | 1.8406 | 8.3087 | 17.8353 |
| Road | 4794 | 6.0009 | 0.5870 | 4.4886 | 7.1892 |
| Economy | 4794 | 16.2875 | 1.0383 | 13.9946 | 19.0017 |
| (1) | (2) | (3) | (4) | |
|---|---|---|---|---|
| HQE | HQE | HQE | HQE | |
| HSR | 0.0422 *** | 0.0779 *** | 0.0748 *** | 0.0742 *** |
| (0.0123) | (0.0135) | (0.0135) | (0.0135) | |
| HCI | 2.3578 ** | 2.1194 * | 1.9819 * | |
| (1.0903) | (1.0931) | (1.0923) | ||
| UED | −0.4401 *** | −0.4678 *** | −0.4989 *** | |
| (0.0668) | (0.0672) | (0.0677) | ||
| PTK | −0.0742 *** | −0.0771 *** | ||
| (0.0182) | (0.0182) | |||
| Road | 0.0982 | 0.0713 | ||
| (0.1111) | (0.1112) | |||
| Economy | 0.2005 *** | |||
| (0.0556) | ||||
| Constant | 1.7866 *** | 1.7748 *** | 2.0476 *** | −0.8141 |
| (0.0358) | (0.0428) | (0.7011) | (1.0587) | |
| id | YES | YES | YES | YES |
| Year | YES | YES | YES | YES |
| N | 4794 | 4794 | 4794 | 4794 |
| 0.2582 | 0.2659 | 0.2688 | 0.2709 |
| (1) | (2) | (3) | (4) | (5) | |
|---|---|---|---|---|---|
| HQE | HQE | HQE | HQE | GTFP | |
| HSR | 0.0733 *** | 0.0667 *** | 0.0670 *** | 0.0664 *** | 0.0118 *** |
| (0.0155) | (0.0147) | (0.0131) | (0.0139) | (0.0017) | |
| Control variables | YES | YES | YES | YES | YES |
| Constant | −0.6575 | −0.0834 | −1.9733 * | −0.1753 | 0.1399 |
| (1.0615) | (1.1662) | (1.0219) | (1.0902) | (0.1324) | |
| id | YES | YES | YES | YES | YES |
| Year | YES | YES | YES | YES | YES |
| N | 4794 | 4230 | 4726 | 4512 | 4794 |
| 0.2696 | 0.2718 | 0.2881 | 0.2756 | 0.2751 |
| (1) | (2) | (3) | (4) | |
|---|---|---|---|---|
| HQE | HQE | HQE | HQE | |
| HSR | 0.0746 *** | 0.0744 *** | 0.0709 *** | 0.0736 *** |
| (0.0135) | (0.0135) | (0.0135) | (0.0135) | |
| Smart City Pilot | −0.0225 | |||
| (0.0352) | ||||
| Low-Carbon City Policy | −0.0080 | |||
| (0.0352) | ||||
| Broadband China Pilot Program | 0.1112 *** | |||
| (0.0365) | ||||
| New Energy Demonstration City | 0.0482 | |||
| (0.0420) | ||||
| Control variables | YES | YES | YES | YES |
| Constant | −0.8472 | −0.8188 | −0.9774 | −0.7406 |
| (1.0601) | (1.0591) | (1.0591) | (1.0606) | |
| id | YES | YES | YES | YES |
| Year | YES | YES | YES | YES |
| N | 4794 | 4794 | 4794 | 4794 |
| 0.2709 | 0.2709 | 0.2724 | 0.2711 |
| Description | Alleviate Sample Selection Bias | Instrumental Variable Method | |||
|---|---|---|---|---|---|
| Model | (1) | (2) | (3) | (4) | (5) |
| Variables | HQE | HQE | HQE | HQE | HQE |
| HSR | 0.065 *** (0.016) | 0.036 ** (0.017) | 0.040 ** (0.017) | 0.0787 *** (0.0199) | |
| IV core explanatory variable lag 1 | 0.8432 *** (0.009) | ||||
| Constant term | −10.002 *** (3.246) | −21.282 *** (5.220) | −32.281 *** (6.190) | - | - |
| Terrain × Time | YES | NO | YES | NO | NO |
| Population × Time | NO | YES | YES | NO | NO |
| Control variables | YES | YES | YES | YES | YES |
| id | YES | YES | YES | YES | YES |
| Year | YES | YES | YES | YES | YES |
| F-test | - | - | - | 4132.87 | - |
| R-square | 0.271 | 0.272 | 0.274 | - | 0.275 |
| N | 4794 | 4794 | 4794 | 4512 | 4512 |
| (1) | (2) | (3) | (4) | |
|---|---|---|---|---|
| Eastern Region | Central Region | Western Region | Northeastern Region | |
| HSR | 0.0560 ** | 0.0107 | 0.1053 *** | 0.0628 |
| (0.0243) | (0.0261) | (0.0257) | (0.0505) | |
| (2.5680) | (2.5571) | (1.7817) | (4.0934) | |
| id | YES | YES | YES | YES |
| Year | YES | YES | YES | YES |
| N | 1445 | 1343 | 1428 | 578 |
| 0.2191 | 0.3572 | 0.3341 | 0.2245 |
| (1) | (2) | (3) | (4) | |
|---|---|---|---|---|
| Transportation Hub City | Non-Transportation Hub City | Central City | Peripheral City | |
| HSR | 0.0420 | 0.0679 *** | 0.0412 | 0.0962 *** |
| (0.0576) | (0.0141) | (0.0446) | (0.0145) | |
| Constant | 4.9098 | −2.1140 * | −1.0299 | −1.5988 |
| (4.4179) | (1.1102) | (3.8566) | (1.0852) | |
| id | YES | YES | YES | YES |
| Year | YES | YES | YES | YES |
| N | 323 | 4471 | 612 | 4182 |
| 0.3129 | 0.2872 | 0.1878 | 0.3192 |
| Resource-Based City | ||||||
|---|---|---|---|---|---|---|
| (1) | (2) | (3) | (4) | (5) | (6) | |
| Resource-Based City | Non-Resource-Based City | Growing | Mature | Declining | Rejuvenating | |
| HSR | 0.0659 *** | 0.0770 *** | 0.1875 *** | 0.0744 ** | −0.1341 *** | 0.0433 |
| (0.0254) | (0.0168) | (0.0659) | (0.0368) | (0.0259) | (0.1322) | |
| Control variables | YES | YES | YES | YES | YES | YES |
| Constant | 2.7866 * | −2.7713 * | 6.4608 | 2.4413 | 1.4723 | 25.9972 ** |
| (1.4884) | (1.4809) | (8.6322) | (2.0037) | (2.9810) | (11.0512) | |
| Urban FE | YES | YES | YES | YES | YES | YES |
| Year FE | YES | YES | YES | YES | YES | YES |
| N | 1904 | 2890 | 238 | 1020 | 391 | 255 |
| 0.3388 | 0.2501 | 0.6914 | 0.3427 | 0.6350 | 0.2916 | |
| Economic Geography Weight Matrix | |||||
|---|---|---|---|---|---|
| Year | Moran’ I | p-Value | Year | Moran’ I | p-Value |
| 2005 | 0.2966 | 0.0000 | 2013 | 0.3147 | 0.0000 |
| 2006 | 0.3105 | 0.0000 | 2014 | 0.3035 | 0.0000 |
| 2007 | 0.3391 | 0.0000 | 2015 | 0.3004 | 0.0000 |
| 2008 | 0.3420 | 0.0000 | 2016 | 0.2869 | 0.0000 |
| 2009 | 0.2907 | 0.0000 | 2017 | 0.2931 | 0.0000 |
| 2010 | 0.3419 | 0.0000 | 2018 | 0.2554 | 0.0000 |
| 2011 | 0.3292 | 0.0000 | 2019 | 0.2324 | 0.0000 |
| 2012 | 0.3241 | 0.0000 | 2020 | 0.3021 | 0.0000 |
| 2021 | 0.3305 | 0.0000 | |||
| Variable | Main | Direct | Indirect | Total |
|---|---|---|---|---|
| HSR | 0.0746 *** | 0.0767 *** | 0.0944 ** | 0.1711 *** |
| (0.0131) | (0.0135) | (0.0444) | (0.0475) | |
| rho | 0.1373 *** | |||
| (0.0271) | ||||
| Control variables | YES | YES | YES | YES |
| Urban FE | YES | YES | YES | YES |
| Year FE | YES | YES | YES | YES |
| N | 4794 | 4794 | 4794 | 4794 |
Disclaimer/Publisher’s Note: The statements, opinions and data contained in all publications are solely those of the individual author(s) and contributor(s) and not of MDPI and/or the editor(s). MDPI and/or the editor(s) disclaim responsibility for any injury to people or property resulting from any ideas, methods, instructions or products referred to in the content. |
© 2025 by the authors. Licensee MDPI, Basel, Switzerland. This article is an open access article distributed under the terms and conditions of the Creative Commons Attribution (CC BY) license (https://creativecommons.org/licenses/by/4.0/).
Share and Cite
Feng, X.; Li, J.; Liu, Y.; Li, W. The Impact of High-Speed Rail on High-Quality Economic Development: Evidence from China. Land 2025, 14, 1379. https://doi.org/10.3390/land14071379
Feng X, Li J, Liu Y, Li W. The Impact of High-Speed Rail on High-Quality Economic Development: Evidence from China. Land. 2025; 14(7):1379. https://doi.org/10.3390/land14071379
Chicago/Turabian StyleFeng, Xixi, Jixiao Li, Yadan Liu, and Weidong Li. 2025. "The Impact of High-Speed Rail on High-Quality Economic Development: Evidence from China" Land 14, no. 7: 1379. https://doi.org/10.3390/land14071379
APA StyleFeng, X., Li, J., Liu, Y., & Li, W. (2025). The Impact of High-Speed Rail on High-Quality Economic Development: Evidence from China. Land, 14(7), 1379. https://doi.org/10.3390/land14071379